Article

Electronic Structure Calculation of Cr3+ and Fe3+ in Phosphor Host Materials Based on Relaxed Structures by Molecular Dynamics Simulation

1
Chemistry and Chemical Engineering, Yamagata University, Yamagata 992-8510, Japan
2
Electronics and Materials Science, Shizuoka University, Shizuoka 432-8561, Japan
3
Research Institute of Electronics, Shizuoka University, Shizuoka 432-8011, Japan
4
Institute of Scientific and Industrial Research, Osaka University, Osaka 567-0047, Japan
*
Author to whom correspondence should be addressed.
Submission received: 23 March 2022 / Revised: 18 April 2022 / Accepted: 20 April 2022 / Published: 27 April 2022
(This article belongs to the Special Issue Smart Systems (SmaSys2021))

Abstract

:
The electronic structures of the luminescent center ions Cr3+ and Fe3+ in the deep red phosphors LiAl5O8:Cr3+, α-Al2O3:Cr3+, and γ-LiAlO2:Fe3+ were calculated by the DV-Xα method, in which the local distortion induced by the replacement of Al3+ sites in the host crystals by the luminescent center ions was reproduced by classical molecular dynamics (MD) simulation. The MD simulations based on classical dynamics allowed for the handling of more than 1000 atoms for the lattice relaxation calculations, which was advantageous to simulate situations in which a small number of foreign atoms (ions) were dispersed in the host lattice as in phosphors, even when typical periodic boundary conditions were applied. The relaxed lattices obtained after MD indicated that the coordination polyhedra around Cr3+ and Fe3+ expanded in accordance with the size difference between the luminescent center ions and Al3+ in the host crystals. The overall profiles of the partial density of states (p-DOSs) of the isolated Cr3+ and Fe3+ 3d orbitals were not significantly affected by the lattice relaxation, whereas the widths of the energy splitting of the 3d orbitals were reduced. The electronic structure calculations for Fe–Fe pairs in γ-LiAlO2 showed that the antiferromagnetic interactions with antiparallel electron spins between the Fe3+ ions were preferred, especially when the Fe–Fe pair was on the first-nearest neighboring cation sites.

1. Introduction

Phosphors are materials that emit luminescence, usually in the visible range, when they are stimulated by high-energy radiation such as X-rays or ultraviolet (UV) rays, or by electron beams. Inorganic phosphors have been practically used in fluorescent lamps and cathode-ray tubes, and they are increasingly being applied to lighting applications using white LED lamps. Yttrium aluminum garnet (YAG) doped with Ce3+ is a conventional yellow phosphor excited by blue light emitted from LED chips, and SiAlON and CaAlSiN3 doped with Eu2+ have recently been developed as phosphors that emit orange to red luminescence in white LED lamps [1,2,3,4,5,6,7,8].
Recently, we have focused on the 3d transition metals Cr3+, Mn4+, and Fe3+ as luminescent centers [9,10] since the emission exists in the deep red region, as in Mg2TiO4:Mn4+, α-Al2O3:Cr3+, LiAl5O8:Fe3+, and γ-LiAlO2:Fe3+. Such deep red emission is difficult to achieve with rare earth phosphors, and their relatively sharp emission peaks are advantageous for improving color rendering in lighting applications.
This paper proposes a computational approach that combines classical MD simulations and molecular orbital (MO) calculations using the DV-Xα method in order to effectively investigate the electronic structures of luminescent ions in phosphors. The advantages of this approach are as follows.
(1)
MD reproduces the local lattice distortion induced by substitution of foreign ions (in this case, luminescent center ions) prior to the electronic structure calculations. For example, γ-LiAlO2:Fe3+ is a deep-red phosphor [9,11] in which Fe3+ replaces Al3+ in the host lattice. The ionic radii of Fe3+ and Al3+ in four-hold coordination are 0.49 Å and 0.39 Å, respectively [12], with the larger Fe3+ ion pushing the ligand oxygens away and expanding the coordination polyhedron. Such local distortion affects the electronic structure of the central Fe3+ according to the conventional crystal field theory.
MD can readily give a relaxed arrangement of the constituent atoms, even when two or more foreign ions or vacancies are introduced in a host lattice.
(2)
With the development of computational techniques, ab-initio MDs such as CASTEP [13], VASP [14,15,16,17], and FMO-MD [18] have become available over the decades. In contrast to these ab-initio MDs, classical MDs describe atomic interactions between the constituent atoms by simple two-body potentials, allowing a larger number of atoms to be handled in the simulation with reasonable accuracy. It is suitable for simulating a dilute situation in which luminescent center ions are randomly dispersed in the lattice of the phosphor host crystal. Unexpected periodicity in the arrangement of luminescent center ions in the calculation cell, due to periodic boundary conditions often applied in MD simulations, can be avoided, as it can occur when the cell is constructed with a limited number of atoms.
A similar approach has been reported for glass materials to investigate the electronic structures of glass under strong electric fields [19], in which MD was effectively used to simulate the atomic arrangement, since structural analysis such as the X-ray diffraction technique is not applicable to glass. Quite limited research has attempted to reveal the effects of local distortion using a combination of classical MD and MO techniques in dilute systems such as phosphors. This work is a pioneering study applying this approach to crystalline materials, focusing on LiAl5O8:Cr3+, α-Al2O3:Cr3+, and γ-LiAlO2:Fe3+ deep red phosphors.
Figure S1 shows the crystal structures of the host materials. LiAl5O8 has a spinel-type structure [20], with tetrahedral and octahedral sites for the cations, and Cr3+ is considered to replace Al3+ in the octahedral sites. Corundum-type α-Al2O3 has a crystal structure in which two AlO6 octahedra share one face to form an Al2O9 dimer, providing octahedral sites for Cr3+ [21]. The crystal structure of γ-LiAlO2 contains tetrahedra of AlO4 and LiO4 [22], offering tetrahedral sites for the luminescent center ion Fe3+. Figure S2 shows the emission and excitation spectra of these deep red phosphors. Cr3+ shows sharp line spectra at 716 nm for LiAl5O8 and 694 nm for α-Al2O3, with two excitation bands around 420 nm and 570 nm due to the d-d transitions. Fe3+ in γ-LiAlO2 shows a rather broad emission peak from 640 to 900 nm, with the peak top around 740 nm. The main excitation band of Fe3+ in the UV region around 240 nm is due to the charge transfer transition; the smaller excitation bands at 390 nm and 450 nm are due to the d-d transitions.
The objective of this work is to demonstrate the effectiveness and potential of our combined MD and MO approach to elucidate the effect of lattice relaxation on the electronic structures of the luminescent center ions in the host lattices. This approach will lead to a better understanding of phosphor materials and to help in developing materials with better properties.

2. Methods

2.1. Molecular Dynamics (MD) Simulation

MD simulations were carried out using the MXDORTO code [23]. The interaction between the constituent atoms was described by the Born–Mayer–Huggins type pair potential (Equation (1)).
U i j = Z i Z j e 2 r i j + A i j   e x p ( r i j ρ i j )
In Equation (1), Uij is the potential of a pair of atoms i and j, and zi and zj are the oxidation numbers of ions i and j, respectively. The constituent atoms were assumed to be fully ionized; Al, Cr, and Fe were assumed to be +3, Li +1, and O −2. e is the electron charge, and rij is the atomic distance between ions i and j. The first term represents the electronic interaction between ions i and j, and Aij and ρij in the second term are potential parameters that determine the short-range repulsive interaction. These potential parameters were refined to reproduce the reference crystal structures of α-Al2O3 [21], Li2O [24], α-LiAlO2 [25], γ-LiAlO2 [22], LiAl5O8 [20], Cr2O3 [26], LiCrO2 [27], Fe2O3 [28], and LiFe5O8 [29] with agreement within 2% of the lattice parameters in the NPT ensemble (N: number of atoms, P: pressure, and T: temperature) at 300 K (Table S1). The potential parameters Aij and ρij are listed in Table 1. Table S1 shows the coincidence between the simulated and reference crystal structures with respect to the lattice parameters and the mean square displacement (MSD) of the constituent atoms in MD. The MSD was comparable to the magnitude of typical thermal vibrations. It should be noted that a single set of the potential parameters for each atom pair reproduced the reference crystal structures properly, even though both octahedral and tetrahedral coordination sites exist for Li+, Al3+, and Fe3+ (only octahedral for Cr3+) in the reference crystals.
The initial atomic arrangement of each host crystal was obtained from the crystal structure reported in the literature [20,21,22]. The orthogonal MD cells were constructed by repeating the crystallographic unit cells with x, y, and z axes of 23–26 Å and contained 1512, 1800, and 1600 atoms for LiAl5O8, α-Al2O3, and γ-LiAlO2, respectively. The periodic boundary conditions were applied to the calculations. Cr3+ and Fe3+ ions were introduced in the MD cells by substituting Al3+ sites according to the following conditions.
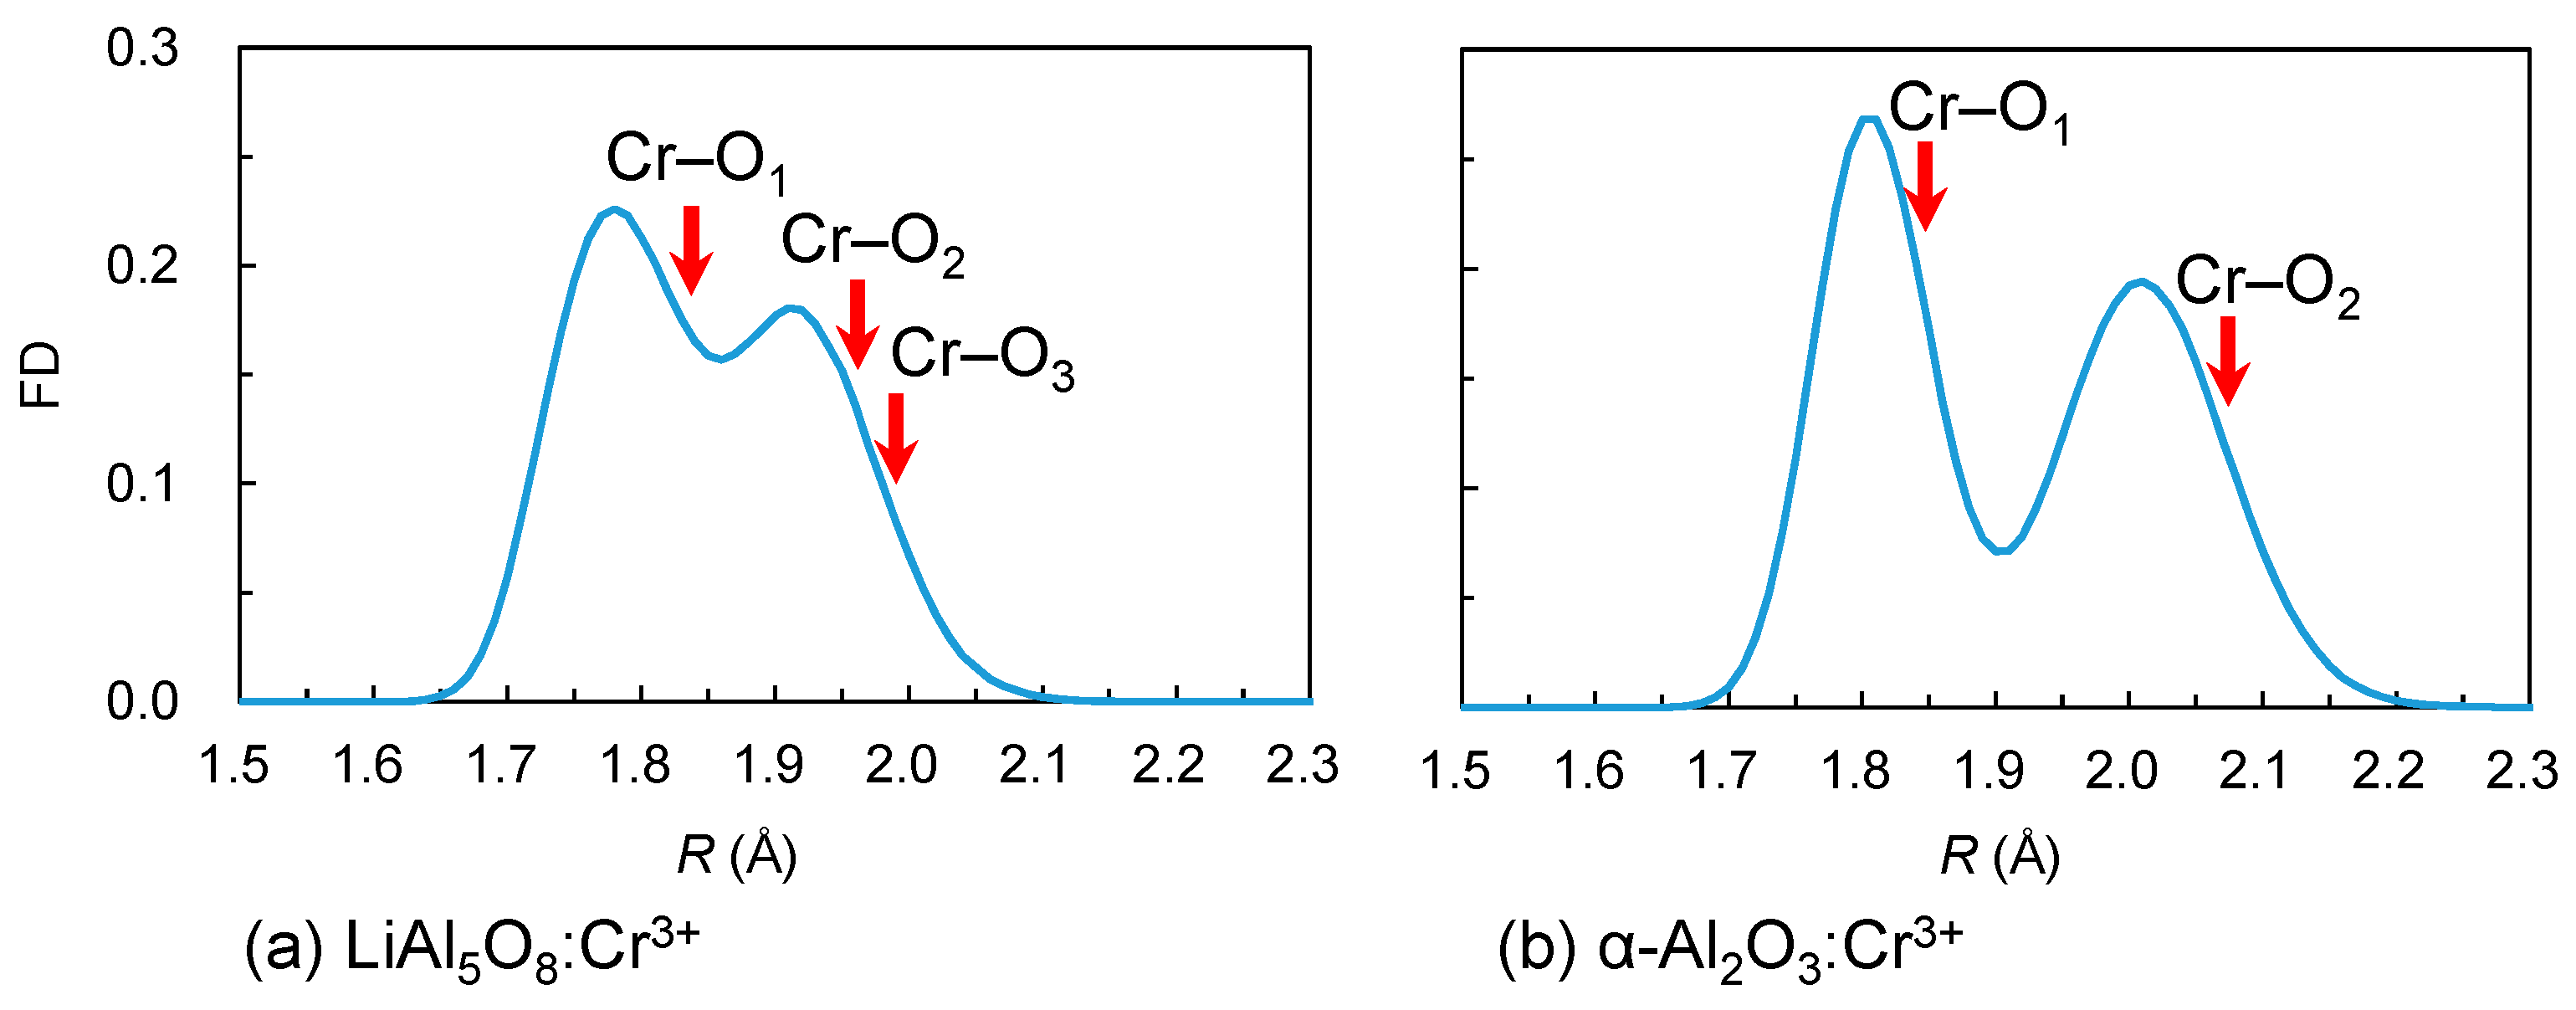
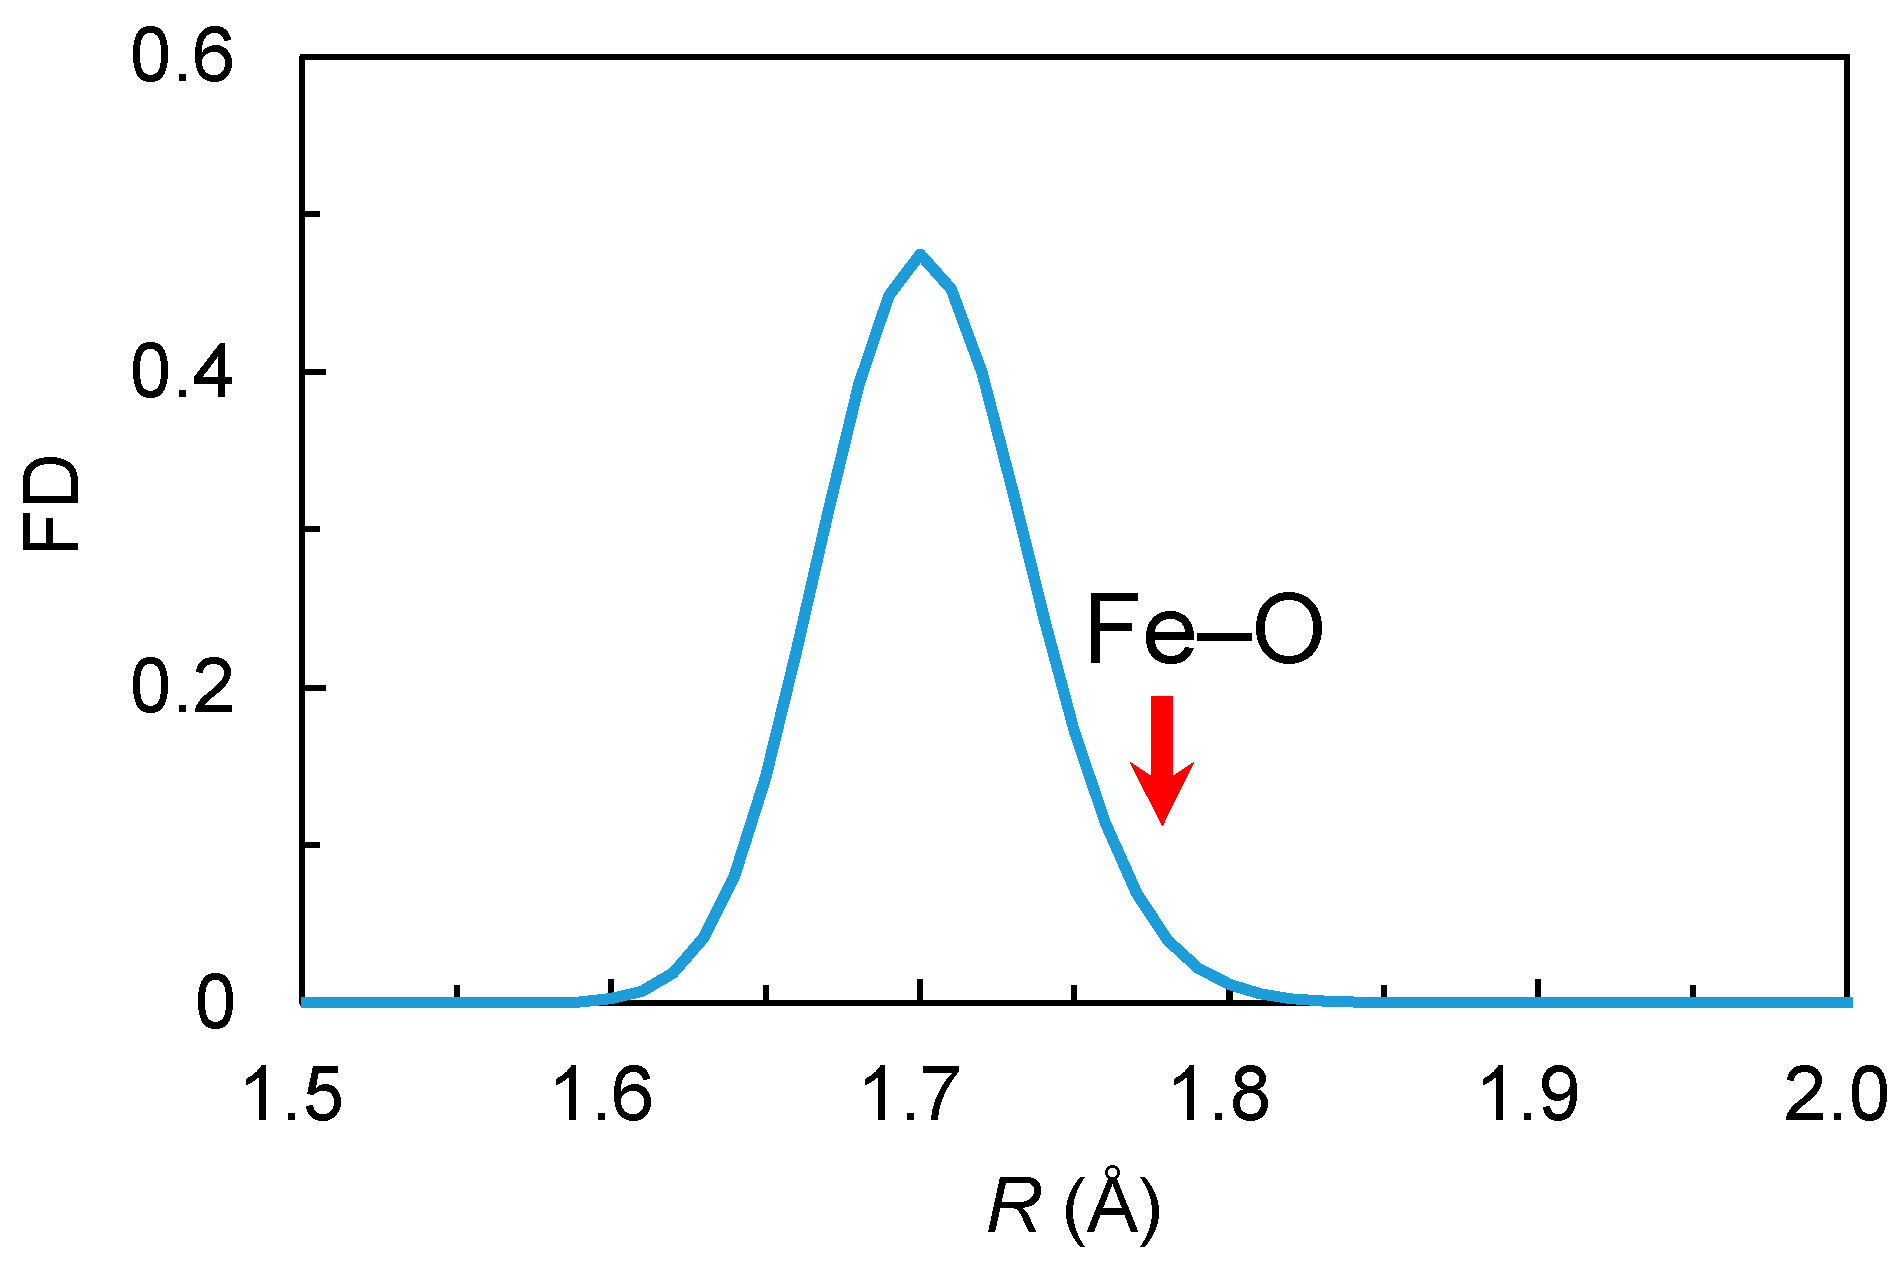
  • To investigate the effect of lattice relaxation for the isolated luminescent center ion, one Cr3+ ion was introduced to replace the Al3+ on the octahedral site in LiAl5O8 and α-Al2O3; in γ-LiAlO2, the Al3+ on the tetrahedral site was replaced by one Fe3+ ion.
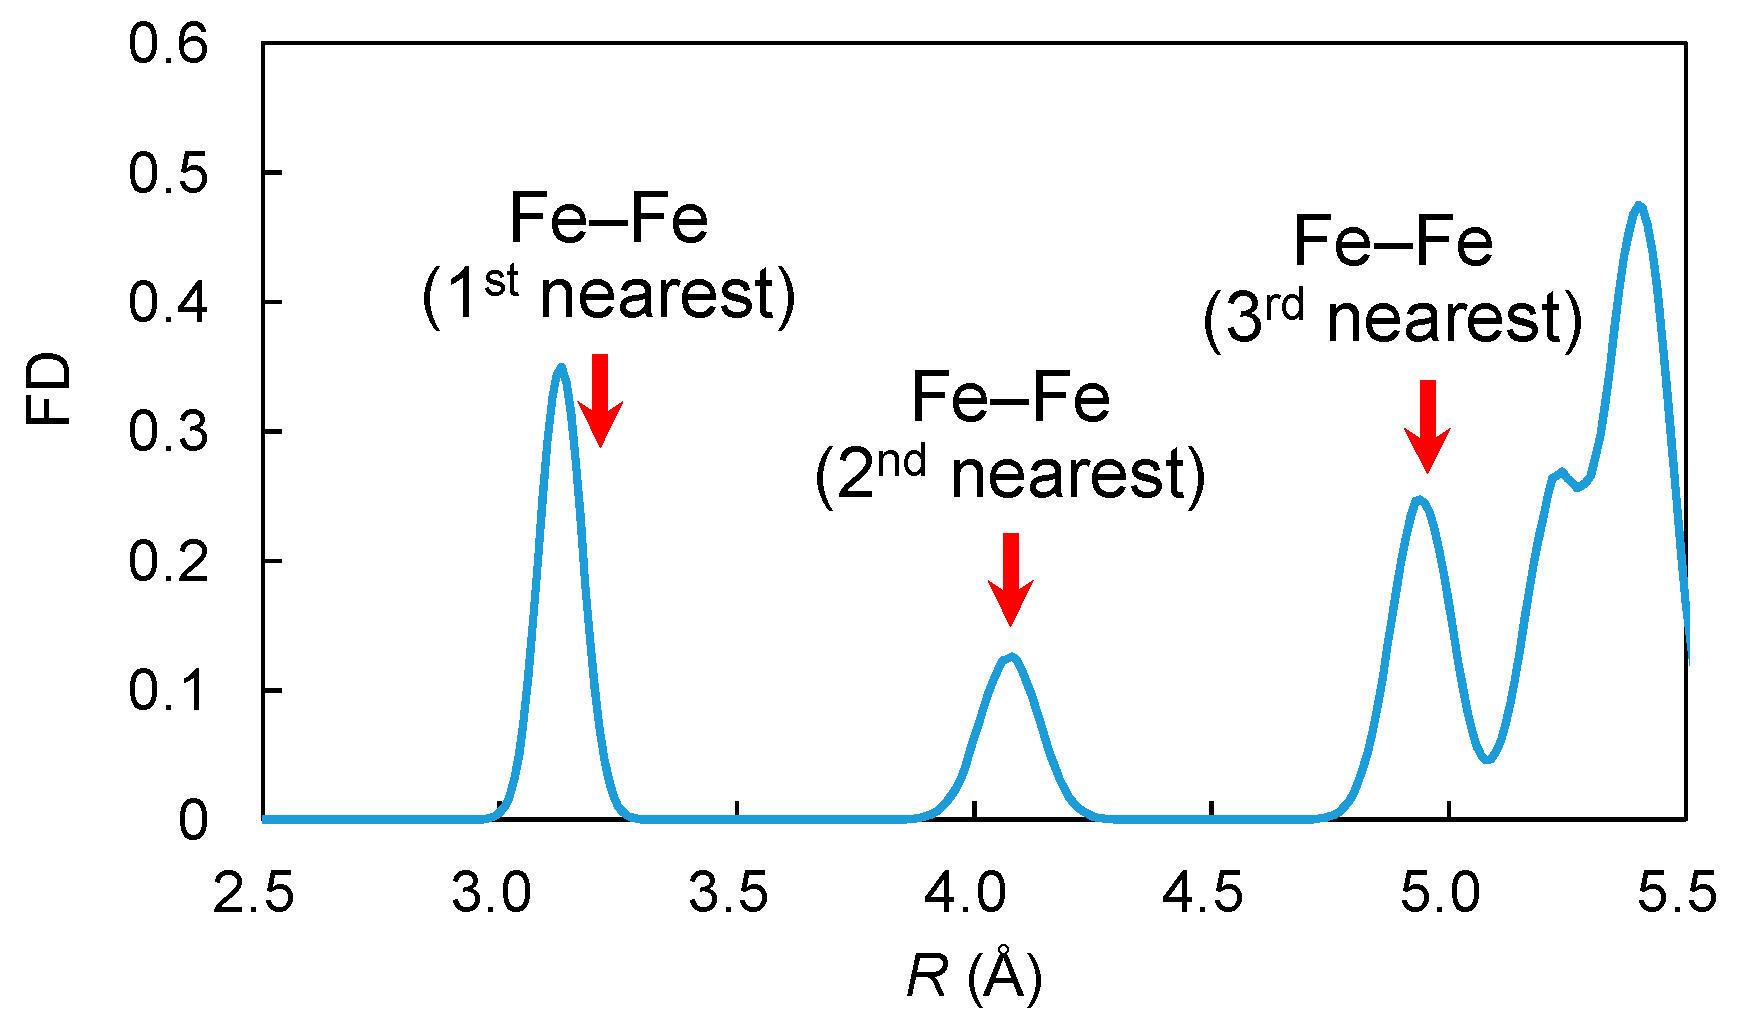
  • To investigate the interaction between Fe–Fe pairs in γ-LiAlO2, two Fe3+ ions were placed at the first-, second-, and third-nearest neighboring Al3+ positions.
The initial structures were relaxed for 1000 steps at 300 K with a time step of 2 fs in the NVT ensemble (V: volume), and for 3000 steps in the NPT ensemble. The temperature of the systems was then increased to 1500 K at a ramp rate of 0.1 K/step in the NPT ensemble and maintained at 1500 K for 100,000 steps. The systems were cooled to 300 K at a ramp rate of −0.1 K/step and relaxed for 31,000 steps at 300 K. The relaxed positions of the constituent atoms were obtained by averaging the atomic coordinates of the last 1000 steps.
The coordination environments around the cations were discussed using the frequency distribution (FD) corresponding to the number of focusing atoms surrounding the central atom in the thin shell at a distance R with a width of ΔR (here 0.01 Å).

2.2. Molecular Orbital (MO) Calculations

The electronic structures of the luminescent center ions of Cr3+ and Fe3+ were calculated by the DV-Xα method using the DVSCAT code [30,31], where the relativistic effects were not taken into account. The calculation clusters for MO were extracted from the relaxed structurers obtained by the MD simulations. The clusters were arranged with Cr3+ or Fe3+ at the centers, with Al and Li octahedra or tetrahedra surrounding the central CrO6 or FeO4. The clusters used in the MO calculations are shown in Table 2 and Figures S3 and S4.
The calculation clusters were embedded in the Madelung potential generated by the Evjen method [32], and atoms outside the clusters were treated as point charges placed at the positions obtained by MD. The spin polarization was taken into account in the MO calculations, and both Cr3+ and Fe3+ were started in the high-spin states.

3. Results and Discussion

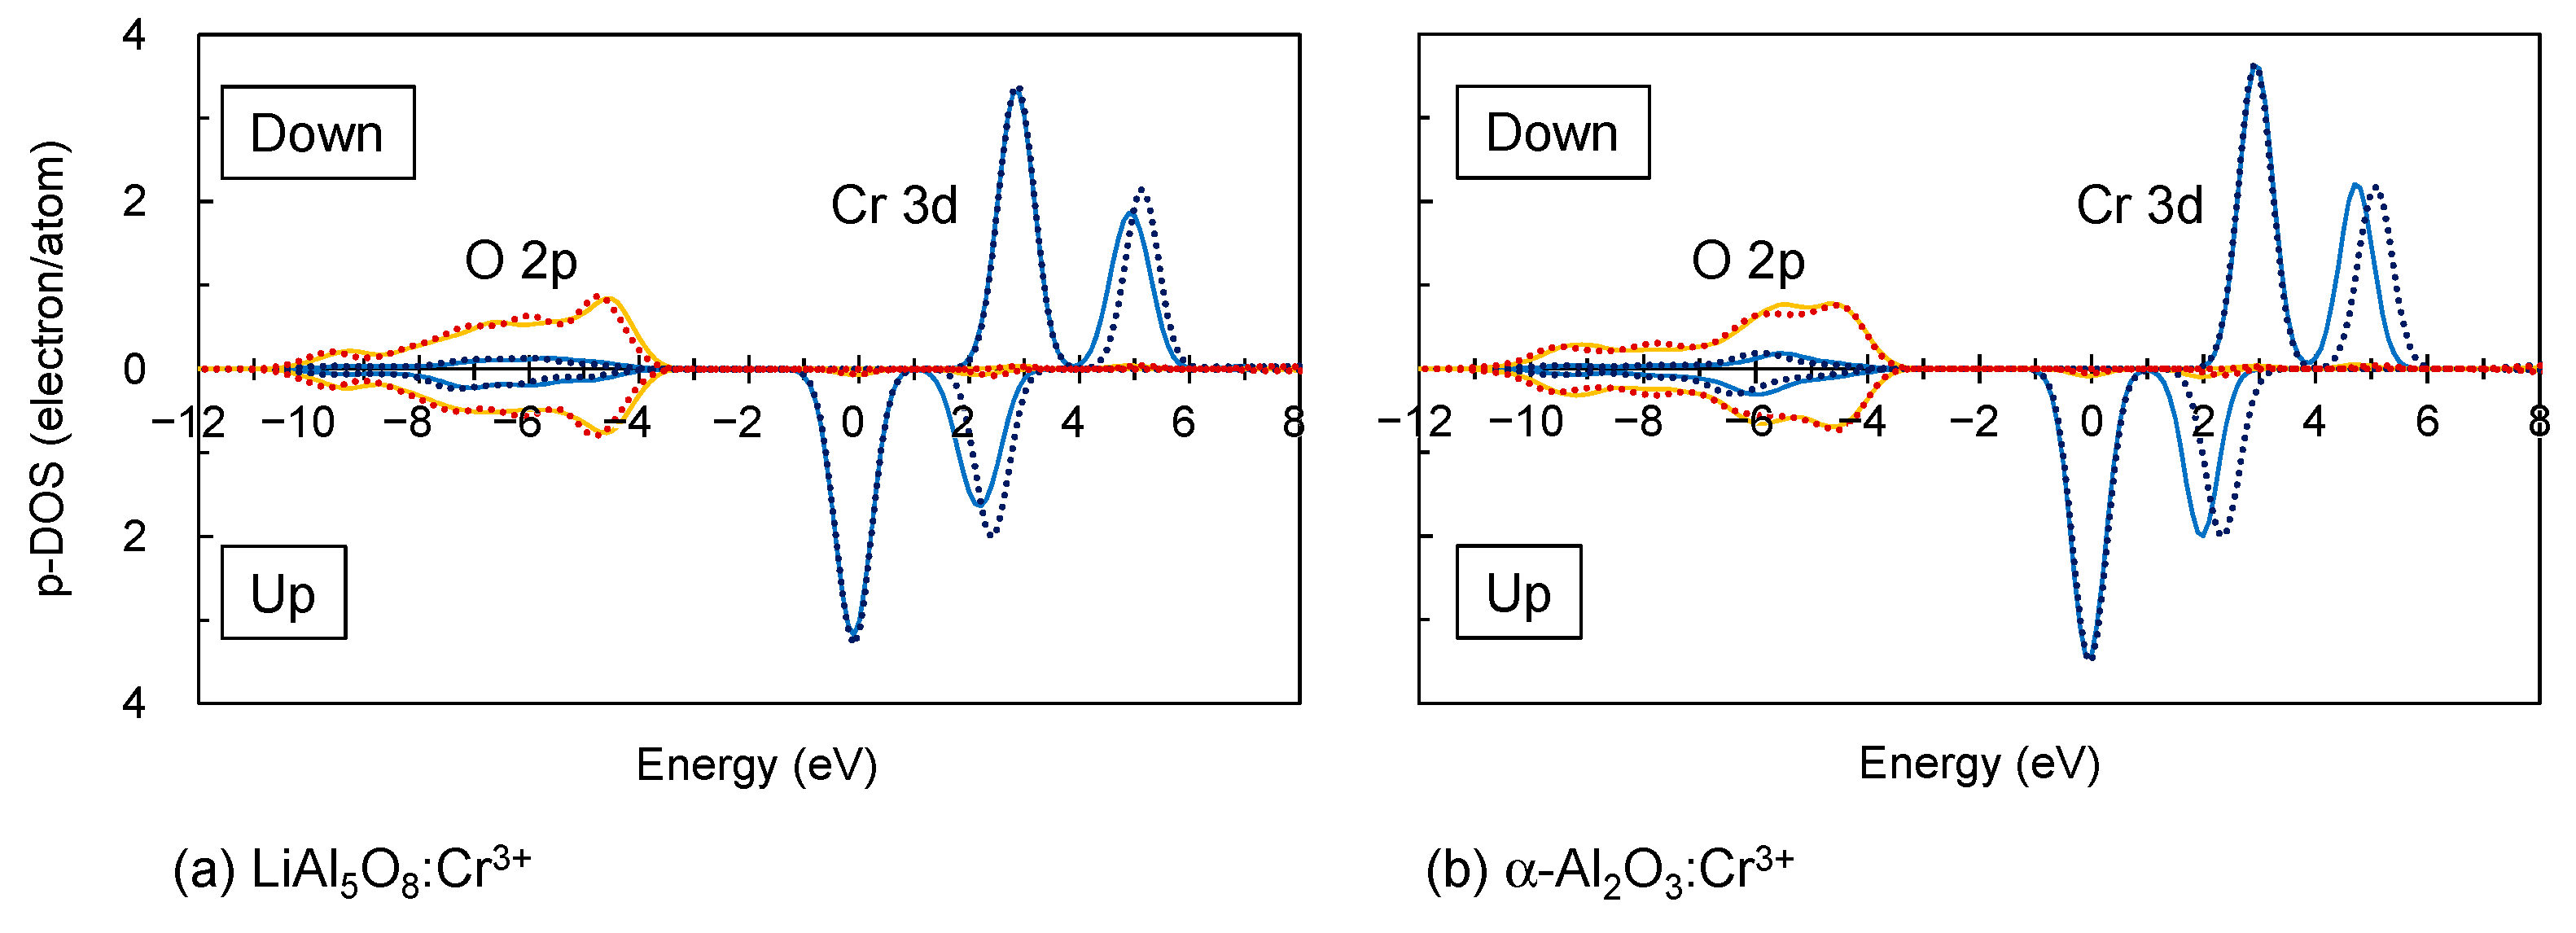
3.1. Electronic Structures of Isolated Cr3+

Figure 1 shows the averaged FDs of O atoms around Al in LiAl5O8:Cr3+ (a) and α-Al2O3:Cr3+ (b). Spinel-type LiAl5O8 contains tetrahedral and octahedral sites for Al3+. The crystallographic data of LiAl5O8 [20] provide 1.779 Å × 3, 1.835 Å × 1 for the A–O distances at the tetrahedral site and 1.856 Å × 2, 1.905 Å × 2, and 1.940 Å × 2 for the octahedral site. The corundum structure of α-Al2O3 consists of AlO6 octahedra forming face-sharing Al2O9 dimers (Figure S1), with Al3+ at the octahedral off-center position and the Al–O distances of 1.857 Å × 3 and 1.970 Å × 3 [21].
The lattice relaxation by MD resulted in bimodal Al–O distribution with peak tops at around 1.78 Å and 1.91 Å for LiAl5O8:Cr3+ (a) and 1.80 Å and 2.00 Å for α-Al2O3:Cr3+ (b), as shown Figure 1. The red arrows in Figure 1 indicate the Cr–O distances obtained by MD: 1.84 Å × 2 (Cr–O1), 1.96 Å × 2 (Cr–O2), and 1.99 Å × 2 (Cr–O3) for LiAl5O8:Cr3+ (a), and 1.85 Å × 3 (Cr–O1) and 2.07 Å × 3 (Cr–O2) for α-Al2O3:Cr3+ (b). The arrows are on the longer sides of the Al–O peaks, indicating that the larger Cr3+ ions expanded the CrO6 octahedron compared to AlO6. The MD results showed that the Cr3+ in the AlCrO9 dimer in α-Al2O3:Cr3+ was displaced by 0.06 Å toward the octahedral void compared to the position of Al3+ in the Al2O9 dimer, which was consistent with ~0.1 Å estimated in the crystal field calculations for α-Al2O3:Cr3+ [33].
Figure 2 shows the partial density of states (p-DOSs) of Cr 3d and O 2p orbitals in LiAl5O8:Cr3+ (a) and α-Al2O3:Cr3+ (b), calculated based on the lattice relaxed by MD (solid line) and the unrelaxed lattice without MD (dotted line), where the HOMO levels are set at 0 eV. Figure 2 shows that the 3d orbitals of Cr3+ were divided into two groups, and that Cr3+ preferred the high-spin state regardless of the host material or lattice relaxation. These basic features were consistent with the considerations based on the conventional crystal field theory for Cr3+ in the octahedral symmetry.
The CrO6 octahedra were not in the ideal octahedral symmetry (Oh) even without relaxation, but for ease of understanding, the conventional notations t2g and eg are used to represent the split d orbitals. The HOMO level is in the t2g orbitals, reflecting the d3 configuration of Cr3+. Hybridization of Cr 3d and O 2p was found to be limited, with the O 2p and Cr 3d contributions observed separately at −10 to −4 eV and −1 to 6 eV, respectively.
The lattice relaxation by MD did not significantly affect the overall profiles of the p-DOSs, but the d-orbital splitting between t2g and eg orbitals of Cr 3d decreased from 2.52 eV to 2.30 eV in LiAl5O8 and from 2.37 eV to 2.01 eV in α-Al2O3 due to the lattice relaxation, reflecting a reduction in the ligand field strength due to the expansion of the coordination polyhedra.

3.2. Electronic Structures of Fe3+

3.2.1. Isolated Fe3+

Figure 3 shows the FD of Al–O in γ-LiAlO2:Fe3+ obtained by MD. The averaged Fe–O distance is on the longer side of the Al–O peak, indicating that the FeO4 tetrahedron expanded due to the size difference between Fe3+ and Al3+.
Figure 4 plots the p-DOSs of Fe 3d and O 2p orbitals for the lattices with MD (solid line) and without MD (dotted line), with the HOMO levels set at 0 eV. Fe3+ in the d5 configuration converged to the high-spin state with two groups of the d orbitals. Although the FeO4 tetrahedron was not in the ideal tetrahedral symmetry (Td), the conventional notations t2 and e are used as discussed for Cr3+ above. The HOMO level is in the t2 orbital. The lattice relaxation by MD did not significantly affect the overall profile of the p-DOS as in the case of Cr3+ (Figure 4), but it did reduce the energy splitting between the t2 and e orbitals from 1.22 eV (dotted line) to 1.17 eV (solid line).
The MO calculations show that the Fe 3d orbitals were highly hybridized with O 2p, which was more pronounced for the up-spin electrons. From −8 to −3 eV, the large contribution of Fe 3d was recognized along with O 2p, while from −2 to 1 eV, the contribution of O 2p was observed along with Fe 3d.

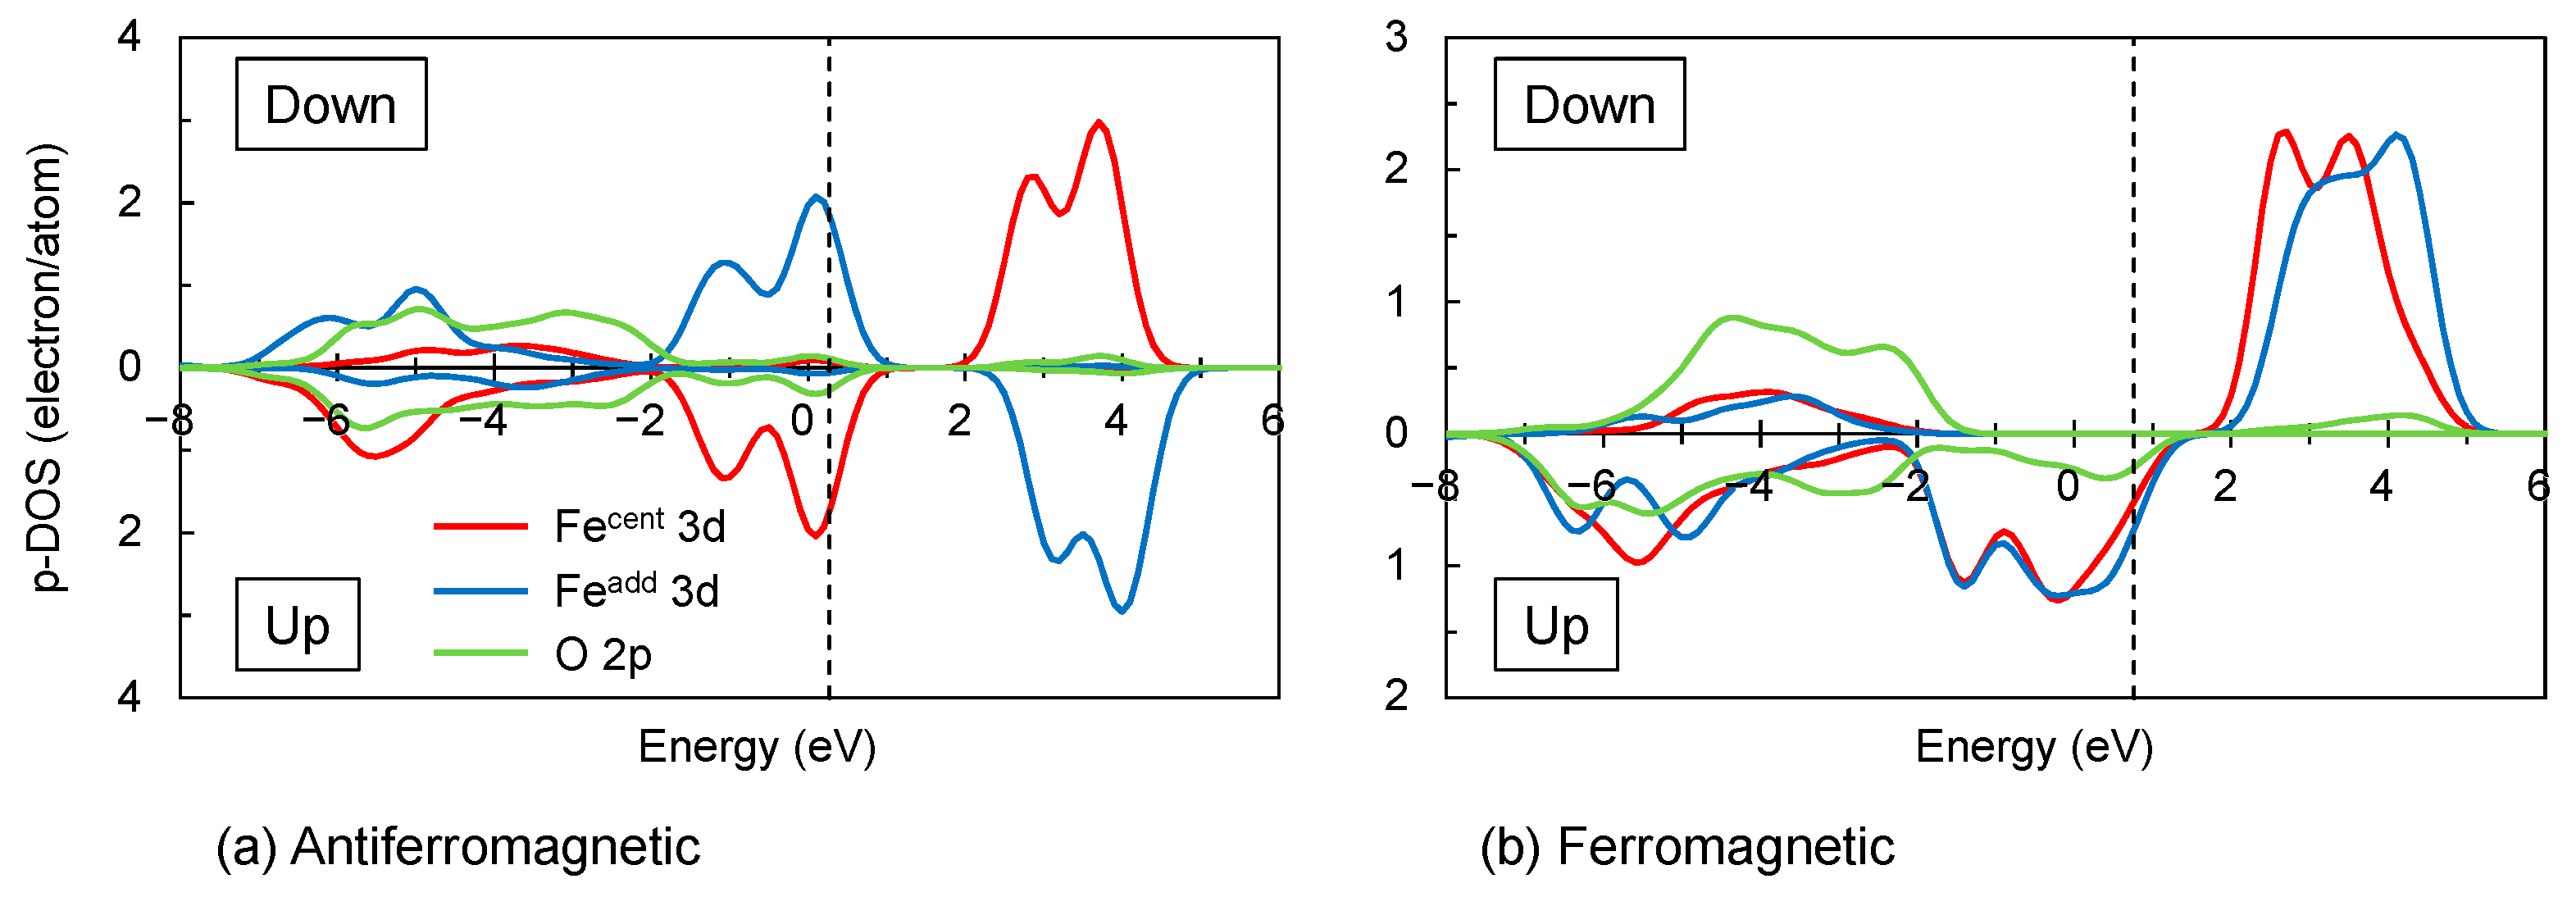
3.2.2. Fe3+–Fe3+ Interaction

To investigate the magnetic interactions between the Fe–Fe pairs, the additional Fe3+ was placed on the first-, second-, and third-nearest neighboring Al3+ sites from the central Fe3+ (Figure S4). Figure S4 shows the clusters for the MO calculations for the Fe–Fe pairs.
Figure 5 shows the FD of Al–Al. The arrows on the figure indicate the distances of Fe–Fe pairs on the first-, second-, and third-nearest neighboring Al3+ sites.
Compared to the Al–Al distances, the distance between the first-nearest Fe–Fe pair was elongated, and the distances between the second- and third-nearest Fe–Fe pairs were almost the same as the corresponding Al–Al distance. It indicated that the effect of the size difference between Al3+ and Fe3+ was probably counteracted by the connection angles between the point-sharing Al(Fe)O4 tetrahedra.
Figure 6 shows the p-DOSs of the Fe 3d and O 2p orbitals for the first-nearest Fe–Fe pair. The second- and third-nearest Fe–Fe pairs yielded the p-DOSs with substantially the same features as in Figure 6. The initial ferromagnetic and antiferromagnetic configurations converged to their respective configurations. To compare the relative stability of the systems with the different magnetic configurations, the HOMO levels of the p-DOSs were not set at 0 eV; the HOMO levels were indicated by the dashed lines. Table 3 compares the HOMO energies obtained for the different magnetic configurations. It should be noted here that the comparison should be limited to within the same calculation cluster, since the calculated energy is also influenced by the cluster type itself. Table 3 shows that the antiferromagnetic interaction was favored by 0.49 eV, 0.02 eV, and 0.05 eV for the Fe–Fe pairs at the first-, second-, and third-nearest neighboring positions, and the stabilizing effect of the antiferromagnetic interaction was particularly pronounced for the first nearest Fe–Fe pair. Such magnetic interaction was considered to be related to the well-known “superexchange interaction” often observed in compounds containing magnetically active cations [34,35,36]. Fe3+–O2−–Fe3+ in Figure S4a was about 130°, intermediate between 90° and 180°. The magnetic interaction between Fe3+ occupying tetrahedral sites have rarely been reported in the literature, whereas for Fe3+ in octahedral sites, the antiferromagnetic interaction have been reported, for example, in spinel-type ZnFe2O4 and colundum-type Fe2O3 with the Neel temperatures of ~10 K and 950 K, respectively.

4. Conclusions

This work demonstrated the MO calculations of the electronic structures of the luminescent center ions Cr3+ and Fe3+ introduced in the host lattices LiAl5O8, α-Al2O3, and γ-LiAlO2. The local distortions induced by replacing the smaller Al sites were reproduced by the MD simulations based on the classical dynamics. For the isolated Cr3+ and Fe3+ in these host crystals, the MD simulations confirmed the expansion of the coordination polyhedra around these cations. The MO calculations showed that these luminescent center ions preferred the high-spin states, and that the lattice relaxation by MD reduced the energy splitting of the d orbitals between t2g and eg for Cr3+ on the octahedral site and t2 and e for Fe3+ on the tetrahedral site. Without the lattice relaxation by MD, the energy splitting was overestimated by about 10% for LiAl5O8:Cr3+, 20% for α-Al2O3:Cr3+, and 4% for γ-LiAlO2:Fe3+. The MD simulations also indicated that the paired Fe3+ ions in γ-LiAlO2:Fe3+ shifted away from each other, which was more pronounced for the first-nearest neighboring pair. The Fe–Fe pairs preferred the antiferromagnetic interactions, and the degree of the stabilization of the antiparallel orientation of the d5 electrons was found to be maximal at about 0.5 eV for the first-neighboring Fe–Fe pair.

Supplementary Materials

The following are available online at https://0-www-mdpi-com.brum.beds.ac.uk/article/10.3390/technologies10030056/s1, Table S1. Comparison of the lattice parameters simulated by MD using the potential parameters (Aij and ρij) in Table 1 with those experimentally determined (Exp.), [37]. Figure S1: Crystal structures of (a) LiAl5O8, (b) α-Al2O3, and (c) γ-LiAlO2, Figure S2: Emission and excitation spectra of (a) LiAl5O8:Cr3+, (b) α-Al2O3:Cr3+, and (c) γ-LiAlO2:Fe3+, Figure S3: Calculation clusters for isolated Cr3+ and Fe3+ in (a) LiAl5O8:Cr3+ [(Li2Al10CrO38)41−], (b) α-Al2O3:Cr3+ [(Al13CrO45)48−], and (c) γ-LiAlO2:Fe3+ [(Li9Al6FeO32)34−], Figure S4: The clusters for the calculation of the electronic interaction in the Fe–Fe pairs on (a) first-, (b) second-, and (c) third-nearest cation sites.

Author Contributions

Conceptualization, Y.M.; methodology, J.I. and Y.M.; software, J.I. and Y.M.; validation, H.K., K.H., M.K. and Y.M.; formal analysis, J.I. and Y.M.; investigation, J.I.; resources, Y.M.; data curation, J.I. and Y.M.; writing—original draft preparation, J.I. and Y.M.; writing—review and editing, H.K., K.H., M.K. and Y.M.; visualization, J.I. and Y.M.; supervision, Y.M.; project administration, Y.M.; funding acquisition, K.H., M.K. and Y.M. All authors have read and agreed to the published version of the manuscript.

Funding

This research was funded by JSPS KAKENHI Grant Number 20K05658. This work was performed under the Cooperative Research Program of “NJRC Mater. & Dev.” (No. 20191143) and the Cooperative Research Project of Research Center for Biomedical Engineering (No. 2012).

Institutional Review Board Statement

Not applicable.

Informed Consent Statement

Not applicable.

Data Availability Statement

Not applicable.

Conflicts of Interest

The authors declare no conflict of interest. The funders had no role in the design of the study; in the collection, analyses, or interpretation of data; in the writing of the manuscript, or in the decision to publish the results.

References

  1. Xie, R.-J.; Mitomo, M.; Uheda, K.; Xu, F.F.; Akimune, Y. Preparation and luminescence spectra of calcium- and rare-earth (R = Eu, Tb, and Pr)-codoped α-SiAlON ceramics. J. Am. Ceram. Soc. 2002, 85, 1229–1234. [Google Scholar] [CrossRef]
  2. van Krevel, J.W.H.; van Rutten, J.W.T.; Mandal, H.; Hintzen, H.T.; Metselaar, R. Luminescence properties of terbium-, cerium-, or europium-doped α-sialon materials. J. Solid State Chem. 2002, 165, 19–24. [Google Scholar] [CrossRef]
  3. Xie, R.-J.; Hirosaki, N.; Sakuma, K.; Yamamoto, Y.; Mitomo, M. Eu2+-doped Ca-α-SiAlON: A yellow phosphor for white light-emitting diodes. Appl. Phys. Lett. 2004, 84, 5404–5406. [Google Scholar] [CrossRef]
  4. Sakuma, K.; Omichi, K.; Kimura, N.; Ohashi, M.; Tanaka, D.; Hirosaki, N.; Yamamoto, Y.; Xie, R.-J.; Suehiro, T. Warm-white light-emitting diode with yellowish orange SiAlON ceramic phosphor. Opt. Lett. 2004, 29, 2001–2003. [Google Scholar] [CrossRef]
  5. Xie, R.-J.; Hirosaki, N.; Mitomo, M.; Yamamoto, Y.; Suehiro, T.; Sakuma, K. Optical properties of Eu2+ in α-SiAlON. J. Phys. Chem. B 2004, 108, 12027–12031. [Google Scholar] [CrossRef]
  6. Uheda, K.; Hirosaki, N.; Yamamoto, H. Host lattice materials in the system Ca3N2–AlN–Si3N4 for white light emitting diode. Phys. Status Solidi A 2006, 203, 2712–2717. [Google Scholar] [CrossRef]
  7. Uheda, K.; Hirosaki, N.; Yamamoto, Y.; Naito, A.; Nakajima, T.; Yamamoto, H. Luminescence properties of a red phosphor, CaAlSiN3: Eu2+, for white light-emitting diodes. Electrochem. Solid-State Lett. 2006, 9, H22–H25. [Google Scholar] [CrossRef]
  8. Watanabe, H.; Wada, H.; Seki, K.; Itou, M.; Kijima, N. Synthetic method and luminescence properties of SrxCa1−xAlSiN3:Eu2+ mixed nitride phosphors. J. Electrochem. Soc. 2008, 155, F31–F36. [Google Scholar] [CrossRef]
  9. Takahashi, H.; Takahashi, H.; Watanabe, K.; Kominami, H.; Hara, K.; Matsushima, Y. Fe3+ red phosphors based on lithium aluminates and an aluminum lithium oxyfluoride prepared from LiF as the Li Source. J. Lumin. 2017, 182, 53–58. [Google Scholar] [CrossRef]
  10. Kobayashi, R.; Tamura, H.; Kamada, Y.; Kakihana, M.; Matsushima, Y. A new host compound of aluminum lithium fluoride oxide for deep red phosphors based on Mn4+, Fe3+, and Cr3+. ECS Trans. 2018, 88, 225–236. [Google Scholar] [CrossRef]
  11. Aoyama, M.; Amano, Y.; Inoue, K.; Honda, S.; Hashimoto, S.; Iwamoto, Y. Synthesis and characterization of lithium aluminate red phosphors. J. Lumin. 2013, 135, 211–215. [Google Scholar] [CrossRef]
  12. Shannon, R.D. Revised effective ionic radii and systematic studies of interatomic distances in halides and chalcogenides. Acta Crystallogr. A 1976, 32, 751–767. [Google Scholar] [CrossRef]
  13. Clark, S.J.; Segall, M.D.; Pickard, C.J.; Hasnip, P.J.; Probert, M.I.J.; Refson, K.; Payne, M.C. First principles methods using CASTEP. Z. Kristallogr. 2005, 220, 567–570. [Google Scholar] [CrossRef] [Green Version]
  14. Kresse, G.; Hafner, J. Ab initio molecular dynamics for liquid metals. Phys. Rev. B 1993, 47, 558–561. [Google Scholar] [CrossRef] [PubMed]
  15. Kresse, G.; Hafner, J. Ab initio molecular-dynamics simulation of the liquid-metal-amorphous-semiconductor transition in germanium. Phys. Rev. B 1994, 49, 14251–14269. [Google Scholar] [CrossRef]
  16. Kresse, G.; Furthmüller, J. Efficiency of ab-initio total energy calculations for metals and semiconductors using a plane-wave basis set. Comput. Mat. Sci. 1996, 6, 15–50. [Google Scholar] [CrossRef]
  17. Kresse, G.; Furthmüller, J. Efficient iterative schemes for ab initio total-energy calculations using a plane-wave basis set. Phys. Rev. B 1996, 54, 11169–11186. [Google Scholar] [CrossRef]
  18. Komeiji, Y.; Mochizuki, Y.; Nakano, T.; Mori, H. Recent advances in fragment molecular orbital-based molecular dynamics (FMO-MD) simulations. In Molecular Dynamics—Theoretical Developments and Applications in Nanotechnology and Energy; Wang, L., Ed.; InTech: London, UK, 2012; Available online: https://www.intechopen.com/chapters/34975 (accessed on 22 April 2022).
  19. Makino, Y.; Tanaka, I.; Kawamura, K.; Adachi, H.; Hirao, K. Electronic structure of silica glass under strong electric field. Prog. Theo. Phys. Suppl. 2000, 138, 239–240. [Google Scholar] [CrossRef]
  20. Famery, R.; Queyroux, F.; Gilles, J.-C.; Herpin, P. Etude structurale de la forme ordonnée de LiAl5O8. J. Solid State Chem. 1979, 30, 257–263. [Google Scholar] [CrossRef]
  21. Ishizawa, N.; Miyata, T.; Minato, I.; Marumo, F.; Iwai, S. A structural investigation of α-Al2O3 at 2170 K. Acta Crystallogr. B 1980, 36, 228–230. [Google Scholar] [CrossRef]
  22. Marezio, M. The crystal structure and anomalous dispersion of γ-LiAlO2. Acta Crystallogr. 1965, 19, 396–400. [Google Scholar] [CrossRef]
  23. Kawamura, K. Environmental Nano-Mechanics Molecular Simulations. Available online: https://kats-labo.jimdofree.com/mxdorto-mxdtricl/ (accessed on 5 March 2022).
  24. Farley, T.W.D.; Hayes, W.; Hull, S.; Hutchings, M.T.; Vrtis, M. Investigation of thermally induced Li+ ion disorder in Li2O using neutron diffraction. J. Phys. Condens. Matter 1991, 3, 4761–4781. [Google Scholar] [CrossRef]
  25. Marezio, M.; Remeika, J.P. High-pressure synthesis and crystal structure of α-LiAlO2. J. Chem. Phys. 1966, 44, 3143–3145. [Google Scholar] [CrossRef]
  26. Finger, L.W.; Hazen, R.M. Crystal structure and isothermal compression of Fe2O3, Cr2O3, and V2O3 to 50 kbars. J. Appl. Phys. 1980, 51, 5362–5367. [Google Scholar] [CrossRef]
  27. Lu, Z.; Dahn, J.R. Structure and electrochemistry of layered Li[CrxLi(1/3−x/3)Mn(2/3−2x/3)]O2. J. Electrochem. Soc. 2002, 149, A1454–A1459. [Google Scholar] [CrossRef]
  28. Maslen, E.N.; Strel’tsov, V.A.; Strel’tsova, N.R.; Ishizawa, N. Synchrotron X-ray study of the electron density in α-Fe2O3. Acta Crystallogr. B 1994, 50, 435–441. [Google Scholar] [CrossRef]
  29. Marin, S.J.; O’Keefe, M.; Partin, D.E. Structures and crystal chemistry of ordered spinels: LiFe5O8, LiZnNbO4, and Zn2TiO4. J. Solid State Chem. 1994, 113, 413–419. [Google Scholar] [CrossRef]
  30. Adachi, H.; Tsukada, M.; Satoko, C. Discrete variational Xα cluster calculations. I. Application to metal clusters. J. Phys. Soc. Jpn. 1978, 45, 875–883. [Google Scholar] [CrossRef]
  31. Ellis, D.E.; Painter, G.S. Discrete variational method for the energy-band problem with general crystal potentials. Phys. Rev. B 1970, 2, 2887–2898. [Google Scholar] [CrossRef]
  32. Evjen, H.M. On the stability of certain heteropolar crystals. Phys. Rev. 1932, 39, 675–687. [Google Scholar] [CrossRef]
  33. McClure, D.S. Optical spectra of transition-metal ions in corundum. J. Chem. Phys. 1962, 36, 2757–2779. [Google Scholar] [CrossRef]
  34. Anderson, P.W. Antiferromagnetism. Theory of superexchange interaction. Phys. Rev. 1950, 79, 350–356. [Google Scholar] [CrossRef]
  35. Kanamori, J. Superexchange interaction and symmetry properties of electron orbitals. J. Phys. Chem. Solids 1959, 10, 87–98. [Google Scholar] [CrossRef]
  36. Yamashita, J.; Kondo, J. Superexchange interaction. Phys. Rev. 1958, 109, 730–741. [Google Scholar] [CrossRef]
  37. Momma, K.; Izumi, F. VESTA 3 for three-dimensional visualization of crystal, volumetric and morphology data. J. Appl. Crystallogr. 2011, 44, 1272–1276. [Google Scholar] [CrossRef]
Figure 1. Frequency distributions of O atoms around Al for (a,b). The arrows indicate the Cr–O distances obtained by MD.
Technologies 10 00056 g001
Figure 2. Partial density of states of Cr 3d and O 2p orbitals in (a,b) with the HOMO levels set at 0 eV. The profiles were drawn with a Gaussian width of 0.3 eV. Solid line: p-DOSs for the relaxed lattice after MD, dotted line: p-DOSs for the unrelaxed lattice without MD.
Technologies 10 00056 g002
Figure 3. Frequency distribution of O atoms around Al in γ-LiAlO2:Fe3+. The red arrow indicates the averaged Fe–O distance observed in the relaxed structure after MD.
Technologies 10 00056 g003
Figure 4. Partial density of states of Fe 3d and O 2p orbitals in γ-LiAlO2:Fe3+ with the HOMO level set at 0 eV. The profiles were drawn with the Gaussian width of 0.3 eV. Solid line: p-DOSs for the relaxed lattice after MD, dotted line: p-DOSs for the unrelaxed lattice without MD.
Technologies 10 00056 g004
Figure 5. Frequency distribution of Al atoms around Al in γ-LiAlO2:Fe3+. The arrows indicate the Fe–Fe distances observed in the relaxed structures after MD.
Technologies 10 00056 g005
Figure 6. Partial density of states of the Fe 3d and O 2p orbitals in γ-LiAlO2:Fe3+. The dashed lines indicate the HOMO energies. The profiles were drawn with the Gaussian width of 0.3 eV. Fecent: Fe atom at the center, Feadd: additional Fe atom.
Technologies 10 00056 g006
Table 1. Potential parameters, Aij and ρij, used in this work. Short-range repulsion was not considered for the cation pairs except Li–Li.
Atom PairAij (eV)ρij (Å)
O–O1997.280.2810
Al–O1716.410.2810
Li–O960.00.2690
Li–Li98.93570.2994
Cr–O1156.680.3131
Fe–O1200.680.3151
Table 2. Clusters for molecular orbital calculations.
Luminescent CenterHost CrystalCalculation Cluster
Cr3+ (octahedral)LiAl5O8(Li2Al10CrO38)41−
α-Al2O3(Al13CrO45)48−
Fe3+ (tetrahedral)γ-LiAlO2(Li9Al6FeO32)34− for isolated Fe3+
(Li9Al5Fe2O32)34− for Fe3+–Fe3+ interaction at the first- and second-nearest neighbors(Li9Al6Fe2O34)35− for Fe3+–Fe3+ interaction at the third-nearest neighbor
Table 3. Difference in the HOMO energies between antiferromagnetic and ferromagnetic configurations in the Fe–Fe pairs.
HOMO Energy (eV)Energy Difference (eV)
AntiferromagneticFerromagneticAnti.−Ferro.
Nearest0.270.76−0.49
Second nearest0.300.32−0.02
Third nearest0.180.23−0.05
Publisher’s Note: MDPI stays neutral with regard to jurisdictional claims in published maps and institutional affiliations.

