Article

Continuous Emotion Recognition for Long-Term Behavior Modeling through Recurrent Neural Networks †

by
Ioannis Kansizoglou
*,
Evangelos Misirlis
,
Konstantinos Tsintotas
and
Antonios Gasteratos
Department of Production and Management Engineering, Democritus University of Thrace, GR-671 32 Xanthi, Greece
*
Author to whom correspondence should be addressed.
This paper is an extended version of our paper published in PETRA 2021, Corfu, Greece, 29 June–2 July 2021.
Submission received: 15 January 2022 / Revised: 31 March 2022 / Accepted: 14 April 2022 / Published: 12 May 2022
(This article belongs to the Collection Selected Papers from the PETRA Conference Series)

Abstract

:
One’s internal state is mainly communicated through nonverbal cues, such as facial expressions, gestures and tone of voice, which in turn shape the corresponding emotional state. Hence, emotions can be effectively used, in the long term, to form an opinion of an individual’s overall personality. The latter can be capitalized on in many human–robot interaction (HRI) scenarios, such as in the case of an assisted-living robotic platform, where a human’s mood may entail the adaptation of a robot’s actions. To that end, we introduce a novel approach that gradually maps and learns the personality of a human, by conceiving and tracking the individual’s emotional variations throughout their interaction. The proposed system extracts the facial landmarks of the subject, which are used to train a suitably designed deep recurrent neural network architecture. The above architecture is responsible for estimating the two continuous coefficients of emotion, i.e., arousal and valence, following the broadly known Russell’s model. Finally, a user-friendly dashboard is created, presenting both the momentary and the long-term fluctuations of a subject’s emotional state. Therefore, we propose a handy tool for HRI scenarios, where robot’s activity adaptation is needed for enhanced interaction performance and safety.

1. Introduction

Nonverbal cues, such as facial expressions, body language and voice tone, play principal roles in humans’ communication, transmitting signals of the individual’s implicit intentions that cannot be expressed through spoken language. The above cues compose the emotional state which can be used to convey one’s internal state throughout an interaction. Therefore, current research is investigating the development of empathetic robots capable of perceiving emotions as an attempt to enhance the overall performance of several human–robot interaction (HRI) scenarios [1,2]. The present study is anticipated to benefit the development of competent social robotic platforms [3,4] and enhance their applications in several recent real-world scenarios [5,6]. All the above render affective computing an emerging research field, which aims to address a wide set of challenges that play key roles in the development of human-like intelligent systems [7].
Based on the existing literature in the fields of psychology and neuroscience, one’s emotional state can be described following two distinct representational approaches, namely the categorical and the dimensional approaches. The first approach, introduced by Ekman, suggests the following six universal basic emotions: happiness, sadness, fear, anger, surprise and disgust [8]. Following Ekman’s model, several alternative works were developed for categorical emotion estimation, either by dropping the emotional classes of surprise and disgust or by introducing some secondary ones, such as hope and neutral state [9]. Since the vast majority of emotion recognition systems have adopted the Ekman’s categorical approach, most works resort to classification schemes [10]. In spite of the promising performances achieved by the aforementioned methods, this approach lacks in representation capacity since the elicited information is displayed in the discrete space. The above fact, coupled with the limited number of emotional classes that can be efficiently estimated, further restricts the capacity of such systems, as also denoted by the corresponding datasets [11]. To that end, the adoption of a continuous representation approach is of the utmost importance. Such an approach is based on the two-dimensional emotion model proposed by Russel and Barrett [12], suggesting arousal and valence as the two distinct coefficients of human emotion. Thus, the estimation of two continuous variables is required, reducing the emotion recognition problem to a regression problem. The two estimated variables of arousal and valence lie within the range of [ 0 , 1 ] .
Inspired by the categorical and the dimensional emotional representations, researchers resort to respective recognition systems with the objective of perceiving the emotional state of humans. This field of affective computing exploits different modalities that transmit information regarding the subject’s internal state. Hence, contemporary recognition systems utilize facial data from RGB images [13]; three-dimensional data [14]; facial landmarks [15,16]; audio features from speech [17]; physiological signals [18], such as electromyography, pulse rate, galvanic skin response and respiration [19]; sentiment analysis from text [20]; and multimodal approaches [21]. Each of the above modalities can be efficiently processed by a wide variety of machine learning techniques to produce the desired recognition rate. To that end, a genetic algorithm is able to choose the optimal subset of the geometric and kinematic features extracted from a Kinect sensor for advanced multimodal emotion recognition [22]. Moreover, particle swarm optimization can achieve competitive performance in several state-of-the-art speech emotion recognition challenges [23]. More specifically, in facial emotion recognition, the utilization of support vector machines has been proven to be particularly beneficial [24].
Taking into consideration recent methods in computer science, the reader can easily notice the considerable advancement of deep neural networks (DNNs) in the field, thanks to their advanced feature learning capabilities [25]. Their ability to learn robust high-level features renders their use preferable over other conventional methods in several tasks [26]. Similarly, their rapid advent is noticeable in the field of emotion recognition for both representation models [27,28]. More specifically, a previous work of ours proposed an online audio–visual emotion classification system which consisted of two convolutional neural network (CNN) architectures and long short-term memory (LSTM) layers [29] that conceive the temporal characteristics of emotion [30]. Focusing on a dimensional emotion estimation scheme, conformable CNN unimodal architectures have been combined with LSTM layers, leading to a particularly efficient solution [10]. Consequently, the development of even more sophisticated neural architectures and the introduction of reinforcement learning in the field further enhanced the recognition capacities of DNN-based systems [31,32].
However, the task of emotion recognition, which is confronted by all the above works, focuses on the estimation of a human’s emotional state during a moment or a very short period of time. A momentary or even a short-term estimation of one’s emotional state is not able to capture the actual state of that person. The above constitutes an open topic in ongoing research into user profiling and authentication, which aims to create a pattern using behavioral biometric techniques [33]. To understand that, the reader can imagine the difference that the state of anger can convey in the case of an introverted and an extroverted person. The above ambiguity inspired us to investigate the development of a behavioral modeling tool based on the experience gained throughout an interaction with a subject. Thus, previous knowledge of emotional variation can be used to normalize the momentary emotional state with a subject-specific behavioral pattern. Such an attempt is followed by a set of difficulties owing to the spontaneous nature of HRI scenarios. Firstly, physiological signals are difficult to exploit in natural HRI scenarios. Moreover, the audio modality cannot be selected since the interaction usually consists of nonverbal parts that also have to be processed by the system. In terms of facial data, the exploitation of facial landmarks is highly desirable as they provide a more robust representation of the human face when the subject moves, a fact that is commonly observed during a natural interaction. In a previous work of ours, we discussed the benefits of understanding the long-term behavior of a subject throughout an interaction and proceeded with a first attempt of providing such an estimation [34]. The introduced system performed the following: (a) extracted the facial landmarks from a subject; (b) used a DNN architecture to predict the values of arousal and valence; (c) built a long-term overview of their behavior according to emotional variations during the interaction; (d) displayed both the momentary and the long-term estimated values on the two-dimensional unit circle through a user-friendly dashboard. The present paper extends the above work, providing the following qualities:
  • Enhanced continuous emotion recognition performance, employing recurrent neural network (RNN) architectures instead of the DNN ones;
  • Competitive recognition results compared with the state-of-the-art approaches in the field, following the more strict and realistic leave-one-speakers-group-out (LOSGO) evaluation protocol [35];
  • Implementation of an efficient and user-friendly human behavior modeling tool based on the experience gained through interaction.
The remainder of the paper comprises the following structure. Section 2 lists the utilized materials and methods of the system, namely the dataset adopted for the experimental studies and the evaluation of the system, as well as the modules that constitute the final total system. In Section 3, we display the ablation and experimental studies conducted to conclude an efficient emotion recognition system and the validation procedure followed to assess its final performance. Section 4 provides an extensive discussion regarding the application of the proposed system and its importance in HRI and assisted living environments, while Section 5 concludes with a summary of the paper, and Section 6 discusses interesting subjects for future work.

2. Materials and Methods

This section describes the database used to train the deep learning models. In addition, we discuss the tools that constitute the overall emotion estimation system.

2.1. Database

During our experimentation, we employed the Remote Collaborative and Affective (RECOLA) database [36], which includes a total of 9.5 h multimodal recordings from 46 French participants. The duration of each recording was five minutes with the subjects attempting to perform a collaboration task in dyads. The annotation of all recordings was performed by 3 female and 3 male French-speaking annotators through the Annotating Emotions (ANNEMO) tool. The database includes many modalities, i.e., audio, video, electro-dermal activity (EDA) and electro-cardiogram (ECG) modalities. The provided labels include the arousal and valence values in the continuous space regarding the spontaneous emotions expressed during the interaction. In our work, we used the 27 subjects provided by the open-source database. We followed the standard evaluation protocol proposed in the Audio/Visual Emotion Challenge and Workshop (AVEC), 2016 [37], splitting the dataset into three parts of nine subjects each, i.e., training, evaluation and testing set.

2.2. Face Detection Tool

Aiming to aid the facial landmarks extractor, it is highly important to crop the input RGB image before, so as to remove the noisy background and pass only the facial image to the extractor. The above step was necessary to avoid several errors in the feature extraction process, such as the one illustrated in Figure 1a, where the noisy background of the video frame leads to wrong keypoint extraction. Such an error can be efficiently removed, by previously detecting and cropping the face of the participant before passing it to the landmark extractor. For this purpose, the well-established feature-based cascade detector [38], employed in our previous work, detects and crops facial images from the captured video frames. The selection of the specific detector was based on both its simple architecture and its ability to sustain the real-time operation. The only difference between the introduced detection tool is a resize performed to each facial image after the extraction, so as to keep constant eyes distance at 55 pixels [30,39].

2.3. Facial Landmark Extraction Tool

The facial images, produced from the output of the tool described in Section 2.2, were fed into a facial landmark extraction tool. Following our previous approach, the tool’s implementation was based on the dlib library, proposed by Kazemi and Sullivan [40]. The algorithm extracts landmarks from the mouth, nose and jaw, as well as the two eyebrows and eyes, as shown in Figure 2. The above procedure led to the extraction of 68 total facial points, each described, as usual, by its 2 spatial coordinates, x and y [41]. However, since the subjects had an attached microphone on the right side of their jaw, as shown in Figure 1b, the landmark detector commonly could not locate the points of the specific region. Thus, the entire facial region of the jaw was excluded from the extraction, while taking into account that the emotional state was not particularly conceived by the specific region. Consequently, the x and y values of the 49 resulting landmarks were kept in two vectors, l x ( t ) and l y ( t ) R 49 , forming the input at time step t to be fed into the emotion recognition tool. The difference of the current tool, compared with the extractor of our previous work, lies in the introduction of a landmarks standardization scheme. To that end, all detected features were forced to present zero mean value and standard deviation equal to 1 in both x and y dimensions. More specifically, we computed the mean ( μ x ( t ) , μ y ( t ) ) and standard deviation ( σ x ( t ) , σ y ( t ) ) values of each vector given a time step t. Then, the standardized values were computed, as follows:
l ^ x i ( t ) = l x i ( t ) μ x ( t ) σ x ( t ) , for i N , i ( 0 , 49 ]
and
l ^ y j ( t ) = l y j ( t ) μ y ( t ) σ y ( t ) , for j N , j ( 0 , 49 ] .
The above is proved to considerably aid the performance of the DNN model. Finally, the vectors l ^ x ( t ) and l ^ y ( t ) are concatenated, forming the following vector:
l ( t ) = [ l ^ x ( t ) ; l ^ y ( t ) ] ,
where l ( t ) R 98 .

2.4. Continuous Emotion Recognition Tool

The final component of our system is the continuous emotion recognition tool (CERT), which is responsible for estimating the valence and arousal values of the subject. Given a time step t, the extracted vector l ( t ) is organized into a sequence along with the l s 1 previous vectors, where l s N * a hyper-parameter of the system to be empirically configured. This procedure was followed for each time step t, producing a final set of sequences with length l s . The above sequences, which constitute the input of CERT, were fed into an RNN architecture R N with N N * as the number of layers. Note that, due to their proven efficacy, we used LSTM cells [29] for our RNN architecture. Each layer can have distinct number of hidden units H n N * with n = [ 1 , 2 , , N ] , a number that also defines the layer’s output dimension. Considering the above, an architecture is denoted as R N { H 1 , H 2 , , H N } . In that way, the output of R N becomes a vector of size H N . Given that there are two values to be estimated, we have H N = 2 , implying an output vector o R 2 . This output was passed through a hyperbolic tangent activation function F = t a n h , producing the final prediction p R 2 :
p = t a n h ( o ) .
The network’s parameters θ R are optimized, trying to minimize the mean squared error (MSE) cost function:
C R ( θ R ) = 1 2 i = 1 2 ( p i p ˜ i ) 2 ,
where p ˜ i the corresponding ground-truth value.
All experiments have been conducted using Python 3.9.7 and Pytorch 1.10.0 on an NVIDIA GeForce 1060 GPU, 6 GB. Each training procedure lasted 150 epochs with a batch size of 256, using a stochastic gradient descent (SGD) optimizer [42]. We used an initial learning rate at 10 3 that decays by an order of magnitude after the 75th epoch.

2.5. Validation Strategy

As already mentioned in Section 1, we employed the LOSGO scheme to validate our models [35]. This is a more strict validation scheme compared with the one followed by our previous approach [34]. Considering this approach, the initial dataset was split based on the number of subjects, leaving one group of subjects only for evaluation and/or one for testing. Following the standard AVEC 2016 protocol, the dataset was divided into three parts of nine subjects each.

3. Results

In this section, we summarize the empirical study and the experimental results of our work. Firstly, by adopting a similar DNN architecture and l s = 1 , we proved that RNN utilization benefits the system’s recognition performance on two different architectures. Simultaneously, we searched for the optimal sequence length l s , evaluated on those two RNN architectures. Subsequently, we studied several versions of recurrent architectures to choose our best model. Finally, by exploiting the selected best model, we updated the framework of continuous emotion estimation and long-term behavior modeling, presented in our previous work. The updated framework was demonstrated in a similar way through a user-friendly dashboard, which visualizes the estimated momentary and long-term values of arousal and valence on Russel’s two-dimensional circle.

3.1. Ablation Study

We begin with the comparisons between the simple DNN architecture used in our previous work against the recurrent one of the introduced approach. Note that, due to the different validation strategies, the obtained MSE values differ from those presented in our previous work. Hence, we replicated the experiments of DNN models to comply with the adopted validation scheme of this paper. The architectures used for the experimentation are depicted in Table 1. For a fair comparison, each L S T M layer was replaced by a fully connected ( F C ) one. We keep the same notation for the investigated DNN models adopting the symbol D . Hence, a DNN architecture is denoted as D { H 1 , H 2 , , H N } , with N R * as the number of layers and H n N * , n = [ 1 , 2 , , N ] as the number of neurons of the nth hidden layer.
Subsequently, in Table 2, we depict the corresponding obtained MSE values for each architecture of Table 1. For each experimentation, we display the last MSE value, that is the value obtained after the last epoch as well as the best one achieved during the training procedure on the validation set of the RECOLA database. The reader can clearly understand the benefit of utilizing an RNN architecture instead of a simple DNN. Paying careful attention, we can observe that the overall performance improved considerably when a DNN was replaced by a corresponding recurrent architecture. All the above prove the constraint capacity of the system proposed by our previous work, while denoting the necessity of updating it with a more efficient one.

3.2. Sequence Length Configuration

Given the superiority of RNNs in the specific application, we proceed with an experimental study that deals with the definition of an optimal value for the sequence length parameter l s . We searched within the range of [ 5 , 50 ] with a step of 5. Similarly to our previous study, we kept both the best and the final MSE values of each training procedure. The obtained results are graphically illustrated in Figure 3. In the horizontal x-axis, we demonstrate the investigated l s values, while the vertical y-axis refers to the obtained MSEs. The blue color represents the final MSE values for each experimentation, whereas the orange represents the corresponding best ones. The above study was conducted both on R 3 { 98 , 128 , 2 } and R 3 { 98 , 256 , 2 } . We can observe that, for both architectures, high values of l s lead to better results. Yet, we have to keep in mind that the higher the l s , the more operating time the system requires. Hence, we search for a value that combines both low processing time and low MSEs. For better comprehension, we display the best MSE values of both architectures in Table 3. According to that, we selected l s = 35 , since it seemed to present close-to-optimal recognition performance in both cases, while sustaining operating time at low levels.

3.3. Architecture Configuration

After the selection of the suitable l s value, we investigated several architectural variations of RNNs, taking into consideration both different number of layers and hidden units. We conducted several experiments using the experimental setup of Section 2.4 and the validation strategy of Section 2.5. After this point, we collected the top seven models, which are presented in Table 4. A quick overview of the table shows that the specific emotion recognition tool is more accurate when architectures with fewer hidden layers are used. Meanwhile, the final performance was not considerably benefited by increasing the number of the hidden units. Overall, we selected R 3 { 98 , 128 , 2 } as our best model. In Figure 4, we can observe, indicatively, the training curves of two of our best models.

3.4. Comparative Results

To place our emotion estimation system within the state of the art, we compare the obtained results of our best architecture against the corresponding ones achieved by proposed works in the field. A quick overview of the related literature shows that such a comparison is realized by employing the concordance correlation coefficient ( C C C ) metric. The above metric calculates the correlation between two sequences x and y , as follows:
C C C = 2 σ x y 2 σ x 2 + σ y 2 + ( μ x μ y ) 2 ,
where μ x , μ y are the mean values, σ x , σ y are the standard deviation values and σ x y = c o v ( x , y ) are the covariance of x and y , respectively. Thus, for a fair comparison, we calculate the C C C values between the predictions of R 3 { 98 , 128 , 2 } and the corresponding ground truth values for both the arousal dimension and the valence dimension. Note that the above estimations were performed on the validation set since this is the most common set used in the existing methods. The obtained results are collected in Table 5 along with the ones achieved by state-of-the-art works in the field. For better comprehension, we also display the features of the respective methods, i.e., geometric, appearance and raw RGB image.
The obtained results reveal the competitive recognition performance of the introduced architecture both in terms of arousal and valence values. Paying more careful attention, the reader can observe that the methods that exploit geometrical features for the recognition of the emotional state reach a better estimation of the valence dimension compared with the arousal ones. Similarly, the proposed system appears to better conceive the valence values of the emotional state.

3.5. Continuous Speaker Estimation

Having defined the final architecture of CERT, we evaluate its performance in the testing speakers group of RECOLA. Given a speaker of this set, we exploit our best model to estimate the arousal and valence values during the interaction. The extracted values are organized in two separate one-dimensional signals through time and compared against the corresponding ground truth ones. For illustration purposes, in Figure 5, we display an indicative example of the comparison, where we can recognize the ability of the system to follow the ground-truth values. Considering the above, we can conclude that the adopted RNN architecture improves CERT’s capability of perceiving the long-term variations of emotional state.
The calculated MSE values between the signals are presented in Table 6 for each subject of the validation set. The performance of the system remains at a competitive level for each speaker of the set. Meanwhile, the reader can observe the large difference in MSE values between the valence and the arousal coordinates. This owes to the fact that arousal is a more difficult dimension to be captured by visual data through geometrical features, as already stated in Section 3.4. Hence, audio input is often used to enhance the efficiency of an emotion recognition system [30]. In contrast, valence can be accurately captured through the extracted facial landmarks.

4. Discussion

In this section, we hold a conversation about the proposed system as a whole. More specifically, we demonstrate an updated version of the dashboard introduced in our previous work, focusing on a user-friendly and low-complexity solution. Subsequently, we discuss the beneficiary role of the system in application fields, such as HRI and collaboration tasks, as well as in more specific tasks, such as robots in assisted living environments.
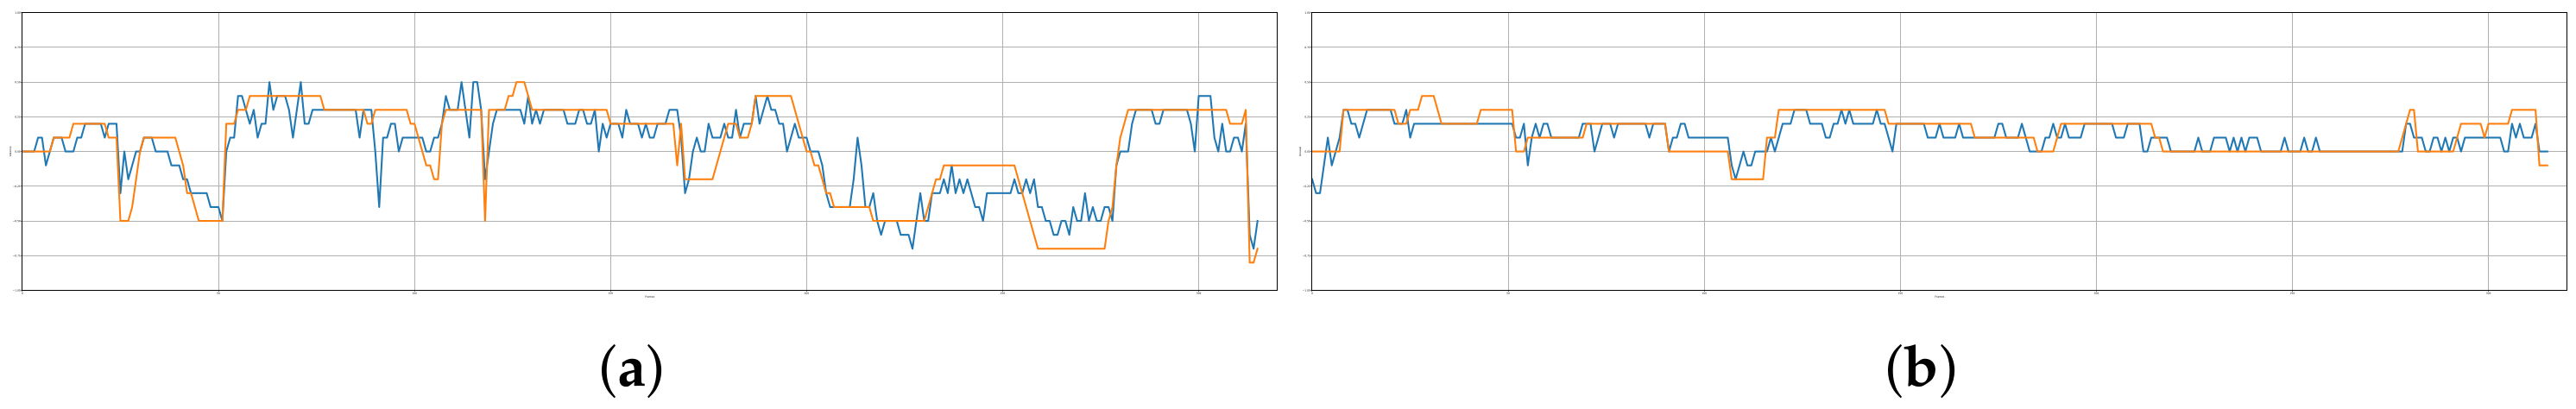
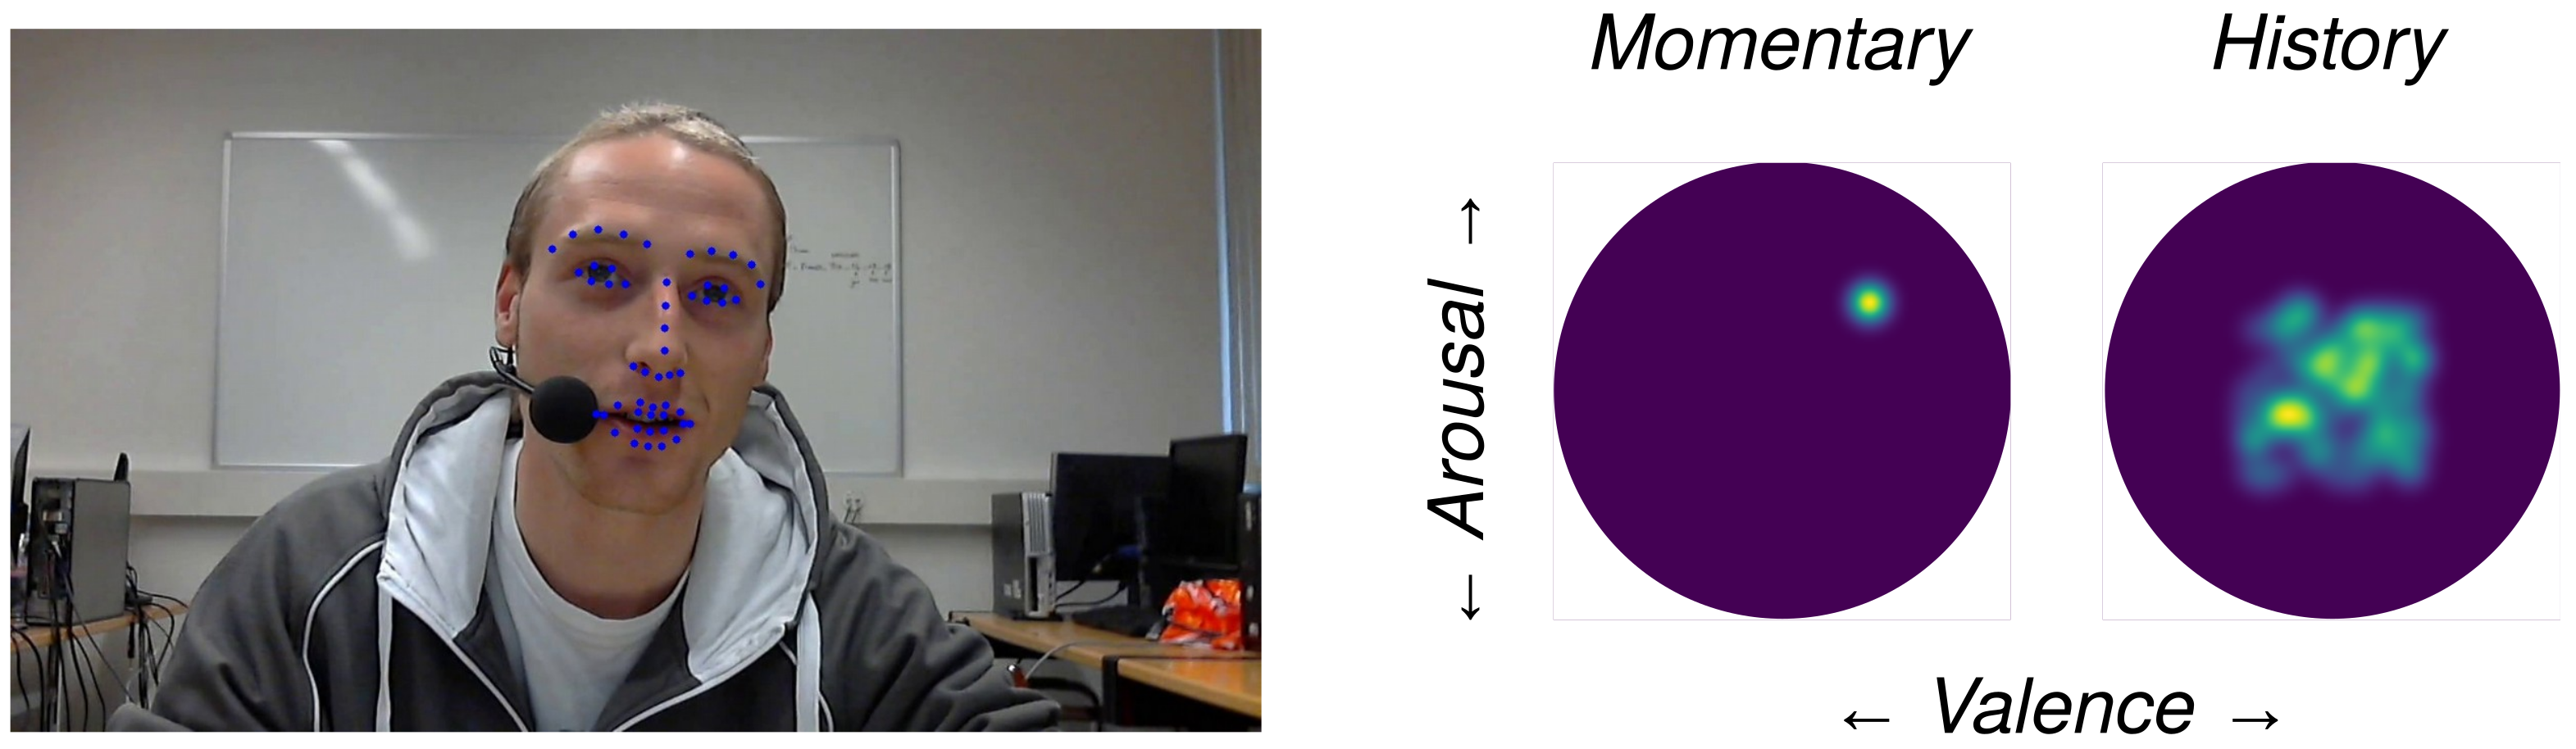
To begin with, in Figure 6, an indicative graphical snapshot of the proposed tool is depicted. The left part of the dashboard provides a demonstration of the current frame of the processing video, where the estimated facial keypoints of the Facial Landmark Extraction Tool are projected on the image plane. We believe that the above part is crucial since on the one hand, it provides the user with a general overview, regarding the development of the processing procedure in the case of video processing, while in cases of real-time execution, the speaker is capable of continuously supervising their position to the camera and accordingly correcting their position and/or orientation, if needed. On the other hand, the projection of the extracted facial landmarks on the illustrated frame is also highly desirable since it provides feedback on the capability of efficiently tracking the interaction. Thus, the user is informed that the environmental conditions, such as illumination and background, as well as their position and point of view, allow the accurate surveillance of the system. At this point, we have to consider that the efficient extraction of the facial keypoints is of the utmost importance for the final performance of the system. Consequently, we deduce that the above part provides the user with a higher level of certainty, knowing that they can observe the general procedure and proceed to corrective actions.
The central part of the dashboard shows the CERT’s momentary estimation of the speaker’s emotional state for the specific frame depicted in the right part of the dashboard. The predicted arousal and valence values of the CERT are projected on the two-dimensional Russel’s unit circle. Valence is represented by the horizontal axis (x-axis) and arousal by the vertical one (y-axis). Hence, the momentary emotional state occupies a particular point within Russel’s circle. At the next time step, the new values of arousal and valence are calculated and projected, in the form of a new point. The result that the user observes is a point that continuously moves within the unit circle.
Concentrating on the main contribution of this work, which constitutes the modeling of a speaker’s long-term behavior during an interaction, the right part of the dashboard provides the pictorial result. A similar two-dimensional unit circle, from now on called a history circle, is utilized to provide the projection space of the estimated behavioral pattern. Valence and arousal are represented by the horizontal and vertical axes, respectively. Thus, at each time step, the point provided by the momentary estimation is incorporated into the history circle. The incorporation is realized by adding the current estimated value to the previous ones stored in the history circle. The stored values are previously multiplied by a discount factor d f = 0.9 , thus fading the older estimations and paying more attention to the recent ones. The obtained illustrative result, shown in Figure 6, is a heatmap within the history circle. The lighter the value of the map, the more frequently the specific emotional state is expressed by the speaker throughout the interaction.
Bringing the presentation of the dashboard to a close, we discuss its benefits along with several fields of application in HRI and assisted living scenarios. With the last term, “robotics in assisted living”, also known as aging in place [47], we refer to the specific field of research that focuses on the design, development and test of efficient robotic platforms, enabling elderly people to live and be served in their own houses [48]. The above entails the amenity of a wide variety of services from the side of the technology providers focusing on safety, health monitoring, supervision and assistance in everyday activities, i.e., cleaning, object movement, cooking, etc. [49,50]. Some technological solutions examined in this field include smart houses, wearable devices, ambient sensors and robotic platforms [51,52]. The main advantage of the robotic solution lies in the mobility that it provides, enabling the continuous supervision of the elderly, as well as its capability of proceeding to several actions when required [53]. However, the relatively low level of comfort that older people feel when they coexist with a robotic agent, that in some way inspects their movements, remains an open unanswered question. Therefore, the development of efficient tools that improve the capacity of the robotic agent to comprehend the state of the subject is highly desired, so as to cultivate a sense of familiarity [54].
Considering the above, the reader can understand our concern regarding the transparent operation of the proposed tool, under the prism of communicating the basic steps of its processing procedure to the interacting person. As far as the main task of the introduced system is concerned, namely the long-term behavior estimation, we envisage it under the aspect of user personality profiling. Considering the deviating personality patterns, the same momentary emotion expressed by two different subjects can imply totally different meanings regarding their internal state. An indicative example can be the different meanings of anger by an introverted and an extroverted person. Thus, the ability of humans to create a behavioral model of other people, gives us the ability to weight the impact of the expressed emotions. The proposed system provides the exact same capability since the creation of the subject’s behavioral history enables the comparison of the contextually perceived momentary emotional state against the subjects behavioral pattern, leading to individualized conclusions regarding its internal state. The above can be used both for comparing momentary estimations against the user’s complete behavior profile or against shorter behavioral patterns, such as daily mood, according to the nature of the interaction.

5. Conclusions

To sum up, the paper at hand proposes an advanced solution for estimating the momentary and long-term emotional state of a speaker during the interaction procedure, utilizing RNN architectures. Using face detection and landmarks extraction techniques, the most informative emotional features are extracted and fed into a suitably designed recurrent architecture. Our empirical study proves that its utilization considerably aids the estimation performance. Subsequently, it benefits the system’s efficiency in creating an accurate behavioral model of the speaker. The above are summarized into an updated version of the graphical tool that communicates the basic steps and results of the process. Then, we discuss the importance of developing transparent and explainable tools that can understand and map the internal state of an interacting person, in order to build a relationship of familiarity and trust between them. The above is highly anticipated to improve the performance rates of the existing robotic platforms in the field of HRI, as well as improving humans’ openness to confidently collaborate with robots. At this point, we particularly focus on elderly people because, on the one hand, they seem to be one of the more skeptical age groups, while on the other hand, the rising need for people to age in their familiar places reinforces the necessity of human–robot coexistence.

6. Future Work

As part of future work, we aim to incorporate the proposed system in a more realistic and complicated HRI scenario, such as a human–machine collaboration task, and evaluate its capacity of improving the performance of the scenario. Taking into consideration the discussion in Section 4, the above system is anticipated to be applied in a use case relative to fall detection for elderly people since it provides the opportunity to model fatigue, among other internal states, in a personalized manner. Moreover, the adoption of cutting-edge techniques, focusing on DNNs’ representation learning capacity, can be tested to further enhance the system’s recognition performance [55,56]. The above examines novel hidden layers and loss functions that improve feature learning capabilities of existing CNNs, providing more robust feature extractors [57,58].
Finally, as already stated in Section 1, the audio modality is not processed by our CERT mainly because we aim for a system capable of estimating human behavior throughout the whole interaction scenario, i.e., including nonverbal parts. As part of future work, a more sophisticated system can be investigated, capable of shifting from a visual to an audio–visual processing tool based on the speech of the person. The above is anticipated to improve recognition performance mainly in the arousal dimension, as proved by novel audio–visual approaches [10,30].

Author Contributions

Conceptualization, all authors; methodology, all authors; software, I.K. and E.M.; validation, I.K. and E.M.; formal analysis, I.K. and K.T.; investigation, I.K. and E.M.; writing—original draft preparation, I.K. and E.M.; writing—review and editing, K.T. and A.G.; visualization, I.K.; supervision, A.G.; project administration, A.G. All authors have read and agreed to the published version of the manuscript.

Funding

We acknowledge support of this work by the project “Study, Design, Development and Implementation of a Holistic System for Upgrading the Quality of Life and Activity of the Elderly” (MIS 5047294), which is implemented under the Action “Support for Regional Excellence”, funded by the Operational Programme “Competitiveness, Entrepreneurship and Innovation” (NSRF 2014-2020) and co-financed by Greece and the European Union (European Regional Development Fund).

Institutional Review Board Statement

Ethical review and approval were waived for this study, due to the fact that this research includes experiments with prerecorded datasets.

Informed Consent Statement

This research includes experiments with prerecorded datasets and we did not conduct any live experiment involving humans.

Data Availability Statement

In this research, we used a prerecorded database to train and evaluate the proposed visual emotion recognition system. The used RECOLA database is available online (https://diuf.unifr.ch/main/diva/recola, accessed on 16 January 2019) [36].

Conflicts of Interest

The authors declare no conflict of interest.

Abbreviations

The following abbreviations are used in this manuscript:
MDPIMultidisciplinary Digital Publishing Institute
DNNdeep neural network
RNNrecurrent neural network
LSTMlong short-term memory
CERTcontinuous emotion recognition tool

References

  1. Breaban, A.; Van de Kuilen, G.; Noussair, C.N. Prudence, Emotional State, Personality, and Cognitive Ability. Front. Psychol. 2016, 7, 1688. [Google Scholar] [CrossRef] [PubMed] [Green Version]
  2. Rossi, S.; Ferland, F.; Tapus, A. User profiling and behavioral adaptation for HRI: A survey. Pattern Recognit. Lett. 2017, 99, 3–12. [Google Scholar] [CrossRef]
  3. Charalampous, K.; Kostavelis, I.; Gasteratos, A. Recent trends in social aware robot navigation: A survey. Robot. Auton. Syst. 2017, 93, 85–104. [Google Scholar] [CrossRef]
  4. Nocentini, O.; Fiorini, L.; Acerbi, G.; Sorrentino, A.; Mancioppi, G.; Cavallo, F. A survey of behavioral models for social robots. Robotics 2019, 8, 54. [Google Scholar] [CrossRef] [Green Version]
  5. Čaić, M.; Avelino, J.; Mahr, D.; Odekerken-Schröder, G.; Bernardino, A. Robotic versus human coaches for active aging: An automated social presence perspective. Int. J. Soc. Robot. 2020, 12, 867–882. [Google Scholar] [CrossRef] [Green Version]
  6. Avelino, J.; Gonçalves, A.; Ventura, R.; Garcia-Marques, L.; Bernardino, A. Collecting social signals in constructive and destructive events during human-robot collaborative tasks. In Proceedings of the Companion of the 2020 ACM/IEEE International Conference on Human-Robot Interaction, Cambridge, UK, 23–26 March 2020; Association for Computing Machinery: New York, NY, USA, 2020; pp. 107–109. [Google Scholar]
  7. Cambria, E.; Das, D.; Bandyopadhyay, S.; Feraco, A. Affective computing and sentiment analysis. In A Practical Guide to Sentiment Analysis; Springer: Cham, Switzerland, 2017; pp. 1–10. [Google Scholar]
  8. Ekman, P.; Friesen, W.V.; O’sullivan, M.; Chan, A.; Diacoyanni-Tarlatzis, I.; Heider, K.; Krause, R.; LeCompte, W.A.; Pitcairn, T.; Ricci-Bitti, P.E.; et al. Universals and cultural differences in the judgments of facial expressions of emotion. J. Personal. Soc. Psychol. 1987, 53, 712. [Google Scholar] [CrossRef]
  9. Jacobs, E.; Broekens, J.; Jonker, C. Emergent dynamics of joy, distress, hope and fear in reinforcement learning agents. In Proceedings of the Adaptive Learning Agents Workshop at AAMAS2014, Paris, France, 5–6 May 2014. [Google Scholar]
  10. Tzirakis, P.; Trigeorgis, G.; Nicolaou, M.A.; Schuller, B.W.; Zafeiriou, S. End-to-end multimodal emotion recognition using deep neural networks. IEEE J. Sel. Top. Signal Process. 2017, 11, 1301–1309. [Google Scholar] [CrossRef] [Green Version]
  11. Mollahosseini, A.; Hasani, B.; Mahoor, M.H. Affectnet: A database for facial expression, valence, and arousal computing in the wild. IEEE Trans. Affect. Comput. 2017, 10, 18–31. [Google Scholar] [CrossRef] [Green Version]
  12. Russell, J.A.; Barrett, L.F. Core affect, prototypical emotional episodes, and other things called emotion: Dissecting the elephant. J. Personal. Soc. Psychol. 1999, 76, 805. [Google Scholar] [CrossRef]
  13. Ko, B.C. A brief review of facial emotion recognition based on visual information. Sensors 2018, 18, 401. [Google Scholar] [CrossRef]
  14. Nonis, F.; Dagnes, N.; Marcolin, F.; Vezzetti, E. 3D Approaches and challenges in facial expression recognition algorithms—A literature review. Appl. Sci. 2019, 9, 3904. [Google Scholar] [CrossRef] [Green Version]
  15. Palestra, G.; Pettinicchio, A.; Coco, M.D.; Carcagnì, P.; Leo, M.; Distante, C. Improved performance in facial expression recognition using 32 geometric features. In International Conference on Image Analysis and Processing; Springer: Cham, Switzerland, 2015; pp. 518–528. [Google Scholar]
  16. Murugappan, M.; Mutawa, A. Facial geometric feature extraction based emotional expression classification using machine learning algorithms. PLoS ONE 2021, 16, e0247131. [Google Scholar]
  17. Akçay, M.B.; Oğuz, K. Speech emotion recognition: Emotional models, databases, features, preprocessing methods, supporting modalities, and classifiers. Speech Commun. 2020, 116, 56–76. [Google Scholar] [CrossRef]
  18. Marín-Morales, J.; Higuera-Trujillo, J.L.; Greco, A.; Guixeres, J.; Llinares, C.; Scilingo, E.P.; Alcañiz, M.; Valenza, G. Affective computing in virtual reality: Emotion recognition from brain and heartbeat dynamics using wearable sensors. Sci. Rep. 2018, 8, 13657. [Google Scholar] [CrossRef]
  19. Picard, R.W.; Vyzas, E.; Healey, J. Toward machine emotional intelligence: Analysis of affective physiological state. IEEE Trans. Pattern Anal. Mach. Intell. 2001, 23, 1175–1191. [Google Scholar] [CrossRef] [Green Version]
  20. Ali, S.; Wang, G.; Riaz, S. Aspect based sentiment analysis of ridesharing platform reviews for kansei engineering. IEEE Access 2020, 8, 173186–173196. [Google Scholar] [CrossRef]
  21. Zhang, J.; Yin, Z.; Chen, P.; Nichele, S. Emotion recognition using multi-modal data and machine learning techniques: A tutorial and review. Inf. Fusion 2020, 59, 103–126. [Google Scholar] [CrossRef]
  22. Ahmed, F.; Sieu, B.; Gavrilova, M.L. Score and rank-level fusion for emotion recognition using genetic algorithm. In Proceedings of the 2018 IEEE 17th International Conference on Cognitive Informatics & Cognitive Computing (ICCI*CC), Berkeley, CA, USA, 16–18 July 2018; pp. 46–53. [Google Scholar]
  23. Daneshfar, F.; Kabudian, S.J. Speech emotion recognition using discriminative dimension reduction by employing a modified quantum-behaved particle swarm optimization algorithm. Multimed. Tools Appl. 2020, 79, 1261–1289. [Google Scholar] [CrossRef]
  24. Tsai, H.H.; Chang, Y.C. Facial expression recognition using a combination of multiple facial features and support vector machine. Soft Comput. 2018, 22, 4389–4405. [Google Scholar] [CrossRef]
  25. Kansizoglou, I.; Bampis, L.; Gasteratos, A. Deep Feature Space: A Geometrical Perspective. IEEE Trans. Pattern Anal. Mach. Intell. 2021. [Google Scholar] [CrossRef]
  26. Tsintotas, K.A.; Bampis, L.; Gasteratos, A. Probabilistic appearance-based place recognition through bag of tracked words. IEEE Robot. Autom. Lett. 2019, 4, 1737–1744. [Google Scholar] [CrossRef]
  27. Allognon, S.O.C.; De S. Britto, A., Jr.; Koerich, A.L. Continuous Emotion Recognition via Deep Convolutional Autoencoder and Support Vector Regressor. In Proceedings of the 2020 International Joint Conference on Neural Networks, Glasgow, UK, 19–24 July 2020; pp. 1–8. [Google Scholar]
  28. Lee, H.S.; Kang, B.Y. Continuous emotion estimation of facial expressions on JAFFE and CK+ datasets for human–robot interaction. Intell. Serv. Robot. 2020, 13, 15–27. [Google Scholar] [CrossRef]
  29. Hochreiter, S.; Schmidhuber, J. Long short-term memory. Neural Comput. 1997, 9, 1735–1780. [Google Scholar] [CrossRef]
  30. Kansizoglou, I.; Bampis, L.; Gasteratos, A. An active learning paradigm for online audio-visual emotion recognition. IEEE Trans. Affect. Comput. 2019. [Google Scholar] [CrossRef]
  31. Zhang, K.; Li, Y.; Wang, J.; Cambria, E.; Li, X. Real-time video emotion recognition based on reinforcement learning and domain knowledge. IEEE Trans. Circuits Syst. Video Technol. 2021, 32, 1034–1047. [Google Scholar] [CrossRef]
  32. Li, W.; Shao, W.; Ji, S.; Cambria, E. BiERU: Bidirectional emotional recurrent unit for conversational sentiment analysis. Neurocomputing 2022, 467, 73–82. [Google Scholar] [CrossRef]
  33. Stylios, I.; Kokolakis, S.; Thanou, O.; Chatzis, S. Behavioral biometrics & continuous user authentication on mobile devices: A survey. Inf. Fusion 2021, 66, 76–99. [Google Scholar]
  34. Kansizoglou, I.; Misirlis, E.; Gasteratos, A. Learning Long-Term Behavior through Continuous Emotion Estimation. In Proceedings of the 14th PErvasive Technologies Related to Assistive Environments Conference, Corfu, Greece, 29 June–2 July 2021; pp. 502–506. [Google Scholar]
  35. Zhalehpour, S.; Onder, O.; Akhtar, Z.; Erdem, C.E. BAUM-1: A spontaneous audio-visual face database of affective and mental states. IEEE Trans. Affect. Comput. 2016, 8, 300–313. [Google Scholar] [CrossRef]
  36. Ringeval, F.; Sonderegger, A.; Sauer, J.; Lalanne, D. Introducing the RECOLA multimodal corpus of remote collaborative and affective interactions. In Proceedings of the 2013 10th IEEE International Conference and Workshops on Automatic Face and Gesture Recognition (FG), Shanghai, China, 22–26 April 2013; pp. 1–8. [Google Scholar]
  37. Valstar, M.; Gratch, J.; Schuller, B.; Ringeval, F.; Lalanne, D.; Torres Torres, M.; Scherer, S.; Stratou, G.; Cowie, R.; Pantic, M. Avec 2016: Depression, mood, and emotion recognition workshop and challenge. In Proceedings of the 6th International Workshop on Audio/Visual Emotion Challenge, Amsterdam, The Netherlands, 16 October 2016; pp. 3–10. [Google Scholar]
  38. Viola, P.; Jones, M. Rapid object detection using a boosted cascade of simple features. In Proceedings of the 2001 IEEE Computer Society Conference on Computer Vision and Pattern Recognition, CVPR 2001, Kauai, HI, USA, 8–14 December 2001; p. I. [Google Scholar]
  39. Zhang, S.; Zhang, S.; Huang, T.; Gao, W.; Tian, Q. Learning affective features with a hybrid deep model for audio–visual emotion recognition. IEEE Trans. Circuits Syst. Video Technol. 2017, 28, 3030–3043. [Google Scholar] [CrossRef]
  40. Kazemi, V.; Sullivan, J. One millisecond face alignment with an ensemble of regression trees. In Proceedings of the IEEE Conference on Computer Vision and Pattern Recognition, Columbus, OH, USA, 23–28 June 2014; pp. 1867–1874. [Google Scholar]
  41. Vonikakis, V.; Winkler, S. Identity-invariant facial landmark frontalization for facial expression analysis. In Proceedings of the 2020 IEEE International Conference on Image Processing (ICIP), Abu Dhabi, United Arab Emirates, 25–28 October 2020; pp. 2281–2285. [Google Scholar]
  42. Bottou, L. Stochastic gradient learning in neural networks. Proc. Neuro-Nımes 1991, 91, 12. [Google Scholar]
  43. Huang, Z.; Stasak, B.; Dang, T.; Wataraka Gamage, K.; Le, P.; Sethu, V.; Epps, J. Staircase regression in OA RVM, data selection and gender dependency in AVEC 2016. In Proceedings of the 6th International Workshop on Audio/Visual Emotion Challenge, Amsterdam, The Netherlands, 16 October 2016; pp. 19–26. [Google Scholar]
  44. Weber, R.; Barrielle, V.; Soladié, C.; Séguier, R. High-level geometry-based features of video modality for emotion prediction. In Proceedings of the 6th International Workshop on Audio/Visual Emotion Challenge, Amsterdam, The Netherlands, 16 October 2016; pp. 51–58. [Google Scholar]
  45. Somandepalli, K.; Gupta, R.; Nasir, M.; Booth, B.M.; Lee, S.; Narayanan, S.S. Online affect tracking with multimodal kalman filters. In Proceedings of the 6th International Workshop on Audio/Visual Emotion Challenge, Amsterdam, The Netherlands, 16 October 2016; pp. 59–66. [Google Scholar]
  46. Brady, K.; Gwon, Y.; Khorrami, P.; Godoy, E.; Campbell, W.; Dagli, C.; Huang, T.S. Multi-modal audio, video and physiological sensor learning for continuous emotion prediction. In Proceedings of the 6th International Workshop on Audio/Visual Emotion Challenge, Amsterdam, The Netherlands, 16 October 2016; pp. 97–104. [Google Scholar]
  47. Wiles, J.L.; Leibing, A.; Guberman, N.; Reeve, J.; Allen, R.E.S. The Meaning of “Aging in Place” to Older People. Gerontologist 2011, 52, 357–366. [Google Scholar] [CrossRef]
  48. Mitchell, J.M.; Kemp, B.J. Quality of life in assisted living homes: A multidimensional analysis. J. Gerontol. Ser. B Psychol. Sci. Soc. Sci. 2000, 55, 117–127. [Google Scholar] [CrossRef] [Green Version]
  49. Payr, S.; Werner, F.; Werner, K. Potential of Robotics for Ambient Assisted Living; FFG Benefit: Vienna, Austria, 2015. [Google Scholar]
  50. Christoforou, E.G.; Panayides, A.S.; Avgousti, S.; Masouras, P.; Pattichis, C.S. An overview of assistive robotics and technologies for elderly care. In Proceedings of the Mediterranean Conference on Medical and Biological Engineering and Computing, Coimbra, Portugal, 26–28 September 2019; pp. 971–976. [Google Scholar]
  51. Rashidi, P.; Mihailidis, A. A survey on ambient-assisted living tools for older adults. IEEE J. Biomed. Health Inf. 2012, 17, 579–590. [Google Scholar] [CrossRef]
  52. ElHady, N.E.; Provost, J. A systematic survey on sensor failure detection and fault-tolerance in ambient assisted living. Sensors 2018, 18, 1991. [Google Scholar] [CrossRef] [Green Version]
  53. Mitzner, T.L.; Chen, T.L.; Kemp, C.C.; Rogers, W.A. Identifying the potential for robotics to assist older adults in different living environments. Int. J. Soc. Robot. 2014, 6, 213–227. [Google Scholar] [CrossRef]
  54. Pirhonen, J.; Tiilikainen, E.; Pekkarinen, S.; Lemivaara, M.; Melkas, H. Can robots tackle late-life loneliness? Scanning of future opportunities and challenges in assisted living facilities. Futures 2020, 124, 102640. [Google Scholar] [CrossRef]
  55. Kansizoglou, I.; Bampis, L.; Gasteratos, A. Do neural network weights account for classes centers? IEEE Trans. Neural Netw. Learn. Syst. 2022. [Google Scholar] [CrossRef]
  56. Tian, J.; Yung, D.; Hsu, Y.C.; Kira, Z. A geometric perspective towards neural calibration via sensitivity decomposition. Adv. Neural Inf. Process. Syst. 2021, 34, 1–12. [Google Scholar]
  57. Deng, J.; Guo, J.; Xue, N.; Zafeiriou, S. Arcface: Additive angular margin loss for deep face recognition. In Proceedings of the IEEE/CVF Conference on Computer Vision and Pattern Recognition, Long Beach, CA, USA, 15–20 June 2019; pp. 4690–4699. [Google Scholar]
  58. Kansizoglou, I.; Santavas, N.; Bampis, L.; Gasteratos, A. HASeparator: Hyperplane-Assisted Softmax. In Proceedings of the 2020 19th IEEE International Conference on Machine Learning and Applications (ICMLA), Miami, FL, USA, 14–17 December 2020; pp. 519–526. [Google Scholar]
Figure 1. Common errors occurred during facial landmarks extraction, due to (a) noisy regions within the input image and (b) the attached microphone.
Technologies 10 00059 g001
Figure 2. The selected 49 facial landmarks extracted from the RGB facial image.
Technologies 10 00059 g002
Figure 3. Best (orange) and final (blue) MSE values for different values of sequence length l s , evaluated on two distinct RNN architectures. (a) R 3 { 98 , 128 , 2 } . (b) R 3 { 98 , 256 , 2 } .
Technologies 10 00059 g003
Figure 4. Training (blue) and validation (orange) curves of R 3 { 98 , 128 , 2 } and R 3 { 98 , 256 , 2 } . (a) R 3 { 98 , 128 , 2 } . (b) R 3 { 98 , 256 , 2 } .
Technologies 10 00059 g004
Figure 5. Estimated (orange) and ground truth (blue) values of valence and arousal for an indicative speaker of the testing set of RECOLA. (a) Valence. (b) Arousal.
Technologies 10 00059 g005
Figure 6. The updated dashboard exploiting the proposed RNN architectures. Firstly, from left to right, we see a frame from the recorded video capturing the speaker, along with the projected facial keypoints predicted from the Facial Landmark Extraction Tool. Then, the estimated momentary values of arousal and valence are projected and illustrated in the Russel’s two-dimensional unit circle. Finally, in a similar way the development of the speaker’s emotional variations are depicted, demonstrating a long-term behavioral pattern during the interaction.
Technologies 10 00059 g006
Table 1. The RNN ( R ) and DNN ( D ) architectures used.
R 3 { 98 , 128 , 2 } R 3 { 98 , 256 , 2 } D 3 { 98 , 128 , 2 } D 3 { 98 , 256 , 2 }
Input [ l s × 98 ] [ l s × 98 ] [ 98 ] [ 98 ]
H 1 L S T M ( 128 ) L S T M ( 256 ) F C ( 128 ) F C ( 256 )
H 2 L S T M ( 2 ) L S T M ( 2 ) F C ( 2 ) F C ( 2 )
F t a n h ( ) t a n h ( ) t a n h ( ) t a n h ( )
Output [ l s × 2 ] [ l s × 2 ] [ 2 ] [ 2 ]
Table 2. Obtained MSE values from the corresponding architectures.
R 3 { 98 , 128 , 2 } R 3 { 98 , 256 , 2 } D 3 { 98 , 128 , 2 } D 3 { 98 , 256 , 2 }
Final MSE 0.0249 0.0251 0.0281 0.0276
Best MSE 0 . 0248 0.0251 0.0281 0.0275
Table 3. Obtained best MSE values for different values of sequence length l s .
l s = 5 l s = 10 l s = 15 l s = 20 l s = 25 l s = 30 l s = 35 l s = 40 l s = 45 l s = 50
R 3 { 98 , 128 , 2 } 0.0287 0.0271 0.0263 0.0260 0.0255 0.0253 0.0248 0.0252 0.0247 0.0254
R 3 { 98 , 256 , 2 } 0.0274 0.0266 0.0268 0.0260 0.0258 0.0254 0.0251 0.0251 0.0250 0.0250
Table 4. Obtained final and best MSE values for different architectures of CERT.
R 3 { 98 , 128 , 2 } R 3 { 98 , 256 , 2 } R 3 { 98 , 512 , 2 } R 4 { 98 , 128 , 128 , 2 } R 4 { 98 , 128 , 256 , 2 } R 4 { 98 , 256 , 256 , 2 } R 5 { 98 , 128 , 128 , 128 , 2 }
Final MSE 0.0249 0.0251 0.0251 0.0272 0.0282 0.0262 0.0280
Best MSE 0.0248 0.0251 0.0250 0.0272 0.0281 0.0262 0.0280
Table 5. RECOLA results in terms of C C C for prediction of arousal and valence values.
MethodFeaturesArousalValence
Baseline [37]Geometric 0.379 0.612
RVM [43]Geometric 0.467 0.571
Weber et al. [44]Geometric 0.476 0.683
Somandepalli et al. [45]Geometric 0.297 0.612
Baseline [37]Appearance 0.483 0.474
RVM [43]Appearance 0.615 0.530
Weber et al [44]Appearance 0.594 0.506
Somandepalli et al. [45]Appearance 0.481 0.474
Brady et al. [46]Appearance 0.346 0.511
Tzirakis et al. [10]Raw image 0.371 0.637
OursGeometric 0.446 0.676
Table 6. Best MSE values of valence and arousal using R 3 { 98 , 128 , 2 } for every speaker of the validation set.
Subject 1Subject 2Subject 3Subject 4Subject 5Subject 6Subject 7Subject 8Subject 9
Valence 0.0096 0.0090 0.0091 0.0044 0.0085 0.0072 0.0088 0.0101 0.0091
Arousal 0.0394 0.0402 0.0401 0.0384 0.0357 0.0402 0.0410 0.0397 0.0410
Publisher’s Note: MDPI stays neutral with regard to jurisdictional claims in published maps and institutional affiliations.

