Article

STAMINA: Bioinformatics Platform for Monitoring and Mitigating Pandemic Outbreaks

by
Nikolaos Bakalos
1,2,*,
Maria Kaselimi
1,
Nikolaos Doulamis
1,2,
Anastasios Doulamis
1,2,
Dimitrios Kalogeras
1,
Mathaios Bimpas
1,
Agapi Davradou
1,
Aggeliki Vlachostergiou
3,
Anaxagoras Fotopoulos
3,
Maria Plakia
3,
Alexandros Karalis
3,
Sofia Tsekeridou
4,
Themistoklis Anagnostopoulos
4,
Angela Maria Despotopoulou
4,
Ilaria Bonavita
5,
Katrina Petersen
5,
Leonidas Pelepes
6,
Lefteris Voumvourakis
6,
Anastasia Anagnostou
7,
Derek Groen
7,
Kate Mintram
7,
Arindam Saha
7,
Simon J. E. Taylor
7,
Charon van der Ham
8,
Patrick Kaleta
9,
Dražen Ignjatović
9 and
Luca Rossi
9
add Show full author list remove Hide full author list
1
Institute of Communication and Computer Systems (ICCS), Patission Str. 42, 10682 Athens, Greece
2
EXUS AI Labs, 1 Estias Str. & 73–75 Mesogion Av, 11526 Athens, Greece
3
Intrasoft International SA (INTRA), Rue Nicolas Bove 2B, 1253 Luxembourg, Luxembourg
4
Trilateral Research Ltd. (TRI), One Knightsbridge Green Office 5.12, 5th Floor, London SW1X 7QA, UK
5
Satways-Proionta Kai Ypiresies Tilematikis Diktyakon Kai Tilepikinoniakon Efarmogon Etairia Periorismenis Efthinis Epe (Satways), 15 Megalou Konstantinou, Attica, 14122 Irakleio, Greece
6
Computer Science Department, College of Engineering, Design & Physical Sciences, Brunel University London (BUL), Kingston Lane, London Borough of Hillingdon UB8 3PH, UK
7
Crisisplan BV (CPLAN), Frambozenweg 123, 2321 KA Leiden, The Netherlands
8
AIT Austrian Institute of Technology GmbH (AIT), Giefinggasse 4, 1210 Wien, Austria
9
Istituto Per L’interscambio Scientifico (I.S.I), Via Chisola 5, 10126 Torino, Italy
*
Author to whom correspondence should be addressed.
Submission received: 15 January 2022 / Revised: 11 April 2022 / Accepted: 29 April 2022 / Published: 17 May 2022
(This article belongs to the Collection Selected Papers from the PETRA Conference Series)

Abstract

:
This paper presents the components and integrated outcome of a system that aims to achieve early detection, monitoring and mitigation of pandemic outbreaks. The architecture of the platform aims at providing a number of pandemic-response-related services, on a modular basis, that allows for the easy customization of the platform to address user’s needs per case. This customization is achieved through its ability to deploy only the necessary, loosely coupled services and tools for each case, and by providing a common authentication, data storage and data exchange infrastructure. This way, the platform can provide the necessary services without the burden of additional services that are not of use in the current deployment (e.g., predictive models for pathogens that are not endemic to the deployment area). All the decisions taken for the communication and integration of the tools that compose the platform adhere to this basic principle. The tools presented here as well as their integration is part of the project STAMINA.

1. Introduction

It is a common case for locally restricted epidemics to be expanded into global pandemics due to globalization and numerous contacts through international business and tourism hubs. Nowadays, it is more and more likely that pathogens and viruses will be imported from locations all around the world. In this context, many countries face an enormous challenge to their healthcare systems and are forced into response measures to counteract the rapid spread of diseases. A pandemic is especially difficult because it runs on for a long time and affects all health services in every part of each country (at national levels). Furthermore, combatting cross-border health threats requires good preparedness and coordinated action before, during and after a crisis (cross-border EU level). The response to the 2009 influenza, or even the lessons learnt from the ongoing impact of the COVID-19 pandemic, are some examples that underline the need for a coordinated response during pandemics. The response consists of preparedness and planning, the surveillance of the pandemic, communication, and vaccination (and other medical countermeasures).
Here, we present the platform of the STAMINA research project, which focusses on adapting existing novel solutions and tools to the needs of the users in charge of pandemic management, addressing the real “pain points” of these users and meeting their expectations in order to facilitate and support them in their working environment. Thus, we aim to improve pandemic preparedness and to provide recommendations, suggestions, and solutions to anticipate and respond to the epidemic/pandemic incidents at national, regional and/or cross-country levels. Under this framework, we have designed, implemented and are currently integrating a toolset that aims at assisting healthcare institutions in all stages of the development of an epidemic and/or pandemic, spanning across planning, strategic and response/operational levels. In this paper, we present individual tools to contribute to the preparedness and response measures of a pandemic, bridging the gaps and “pain points” that users face during a pandemic. At the same time, we describe the platform from a holistic point of view, in order to elaborate on how these individual tools are interconnected and communicate with each other to provide solutions for the gaps in preparedness and response. The envisioned platform is modular in nature. The modularity of the design is essential, as the creation of a single-recipe information system that can effectively predict, manage and mitigate the effects of an infectious disease outbreak is not feasible. Pandemic events are highly affected by geographical and climate characteristics, and while the COVID-19 pandemic taught us that restricted epidemics can rapidly expand into global pandemic events, the fact remains that a lot of pathogens can affect different areas in different ways. For example, zoonotic diseases, such as the West Nile Virus, need the presence of specific animal species to be transmitted to humans and therefore do not significantly affect areas where these species are not endemic. Thus, tools that aim at monitoring the spread of specific pathogens are not always needed in all areas, and may also need different parameterization for each area. Therefore, the envisaged platform should be able to deploy subsets of the available service on an as-needed basis.
The Integration of new tools and data into the system is also facilitated by a common information storage and exchange infrastructure, in order to manage real-time data. This centralized communication allows the output of the tools, or any other “live” information, to be made available in pre-specified topics, while all the tools that use this information as input simply need to ingest this topic and act accordingly. Beyond real-time data, the retrieval of historical data is achieved through the use of a common data management module, with an additional set of API endpoints, which allows for the ingestion of historical information and open datasets. Considerations about user and application authentication are also critical, since we are aiming at a centralized mode of cross-tool communication.

2. Related Work

The vast amount of available sequence and structural data, in combination with new and emerging technologies, has led to the development of many bioinformatics systems able to assist in various medical and healthcare applications, such as the monitoring and mitigating of pandemic situations. More specifically, many tracking, monitoring and visualization tools have been developed, such as the Nextstrain project [1] which is a platform allowing for real-time tracking of pathogen evolution. Nextstrain consists of a database of viral genomes updated daily, a bioinformatics pipeline for phylodynamics analysis and a platform for interactive visualization, combined into a single open-source web application. Another interactive web-application is the Coronapp [2] which enables real-time tracking and monitoring of SARS-CoV-2 mutations worldwide using GISAID [3] data or user-provided viral genomic sequences. The Coronapp is a Shiny-based app which utilizes two distinct files, server.R and ui.R, to manage the server functionalities and the browser visualization processes, respectively. A real-time monitoring and diagnosis system for H1N1 is also proposed in [4], using cloud computing and social network analysis (SNA). The tool consists of four processing components along with a secure cloud storage medical database. The key point of this work is the use of SNA graphs to show the H1N1-flu-infected users’ dependencies and their roles in spreading the outbreak, thus controlling the infection rate. Another tool is Nextflu [5], a web-application that enables real-time tracking of seasonal influenza virus evolution in humans. It consists of a processing pipeline which analyzes virus sequence data and a browser user interface to visualize the processed information. The authors in [6] developed a platform which allows one to perform epidemiological and statistical studies on viral infections and their geographical correlations. The system consists of three layers: the user layer, which is responsible for data collection by external laboratories and data extraction, the back-end layer, which is responsible for data integration from various laboratories and the application of machine learning, and finally the data layer, which uses a relational database to store the data. A prediction market system (PMS) with a matching mechanism of logarithmic market scoring rules (LMSR) is also presented in [7] in order to predict the trends in epidemic diseases and enhance their forecast accuracy. Additionally, Abbasimehr et al. [8], applied a time-series model to forecast the number of infected cases using LSTM, as well as, GRU and CNN. Rauf et al. [9] utilized deep-learning methods, including LSTM, RNN and GRU, for quantifying and intensifying COVID-19 pandemic for the near future in Pacific countries, particularly Pakistan, Afghanistan, India, and Bangladesh. They considered the time variant and non-linearity of the data when they employed their neural networks, and each model has been evaluated to predict the number of COVID-19 cases in the next 10 days. Ayoobi et al. [10] examined the performance of six different deep-learning methods for forecasting the rate of new cases and new deaths in countries such as Australia and Iran. Their bidirectional models performed better than their other models. Bonapati et al. [11] developed a state-of-the-art forecasting model for COVID-19 outbreaks using an LSTM method to predict the number of COVID-19 cases, the number of deaths and the number of people recovered. Ketu et al. [12] proposed a hybrid CNN-LSTM deep-learning model for correctly forecasting the COVID-19 epidemic across India (29 states). This model uses several convolutional layers (CNN) for extracting meaningful information and learning from a time-series dataset, while also using LSTM layers to identify long-term and short-term dependencies.
The system architecture consists of three main parts: the database cluster, which consists of six different datasets for data storage, the market engine, which performs market matching, computation, and ranking calculations, and the web applications, which allow participants to interact with the system through seven view functions. Another web-based application is INSaFLU [13] an influenza-oriented bioinformatics system which uses next-generation sequencing (NGS) data to provide flu surveillance. The proposed architecture comprises six main components: the reading and improvement of quality analysis, the identification of type and sub-type, variant detection and consensus generation, coverage analysis, phylogeny/analysis and finally the intra-host minor variant. A web application which allows for data sharing and visualization of genomic epidemiology and phylogeography is Microreact [14]. It provides an interactive visualization with trees, maps, timelines and tables, by combining clustering, geographical and temporal data. One key feature of the proposed tool is its ability to link data files from cloud servers, as well as the option to share the Microreact visualization via a web link. In order to help in the interpretation of virus genome sequences, GLUE [15] is proposed, which is a data-centric bioinformatics environment for building scalable virus sequence-data resources. All elements of the GLUE project are stored in a standard relational database, and its flexible design supports applicability to various viruses. Finally, GLEaMviz [16] is a publicly available software system that simulates the spread of emerging human-to-human infectious diseases at a global scale. It consists of three main components: the client application, which provides graphical user interfaces for designing and managing the simulations, the proxy middleware, to request the execution of a simulation by the server, and finally, the simulation engine. In this work, a customizable platform is presented, designed for early detection, monitoring and mitigation of pandemic outbreaks, which allows for the deployment of only the necessary, loosely coupled services and tools.

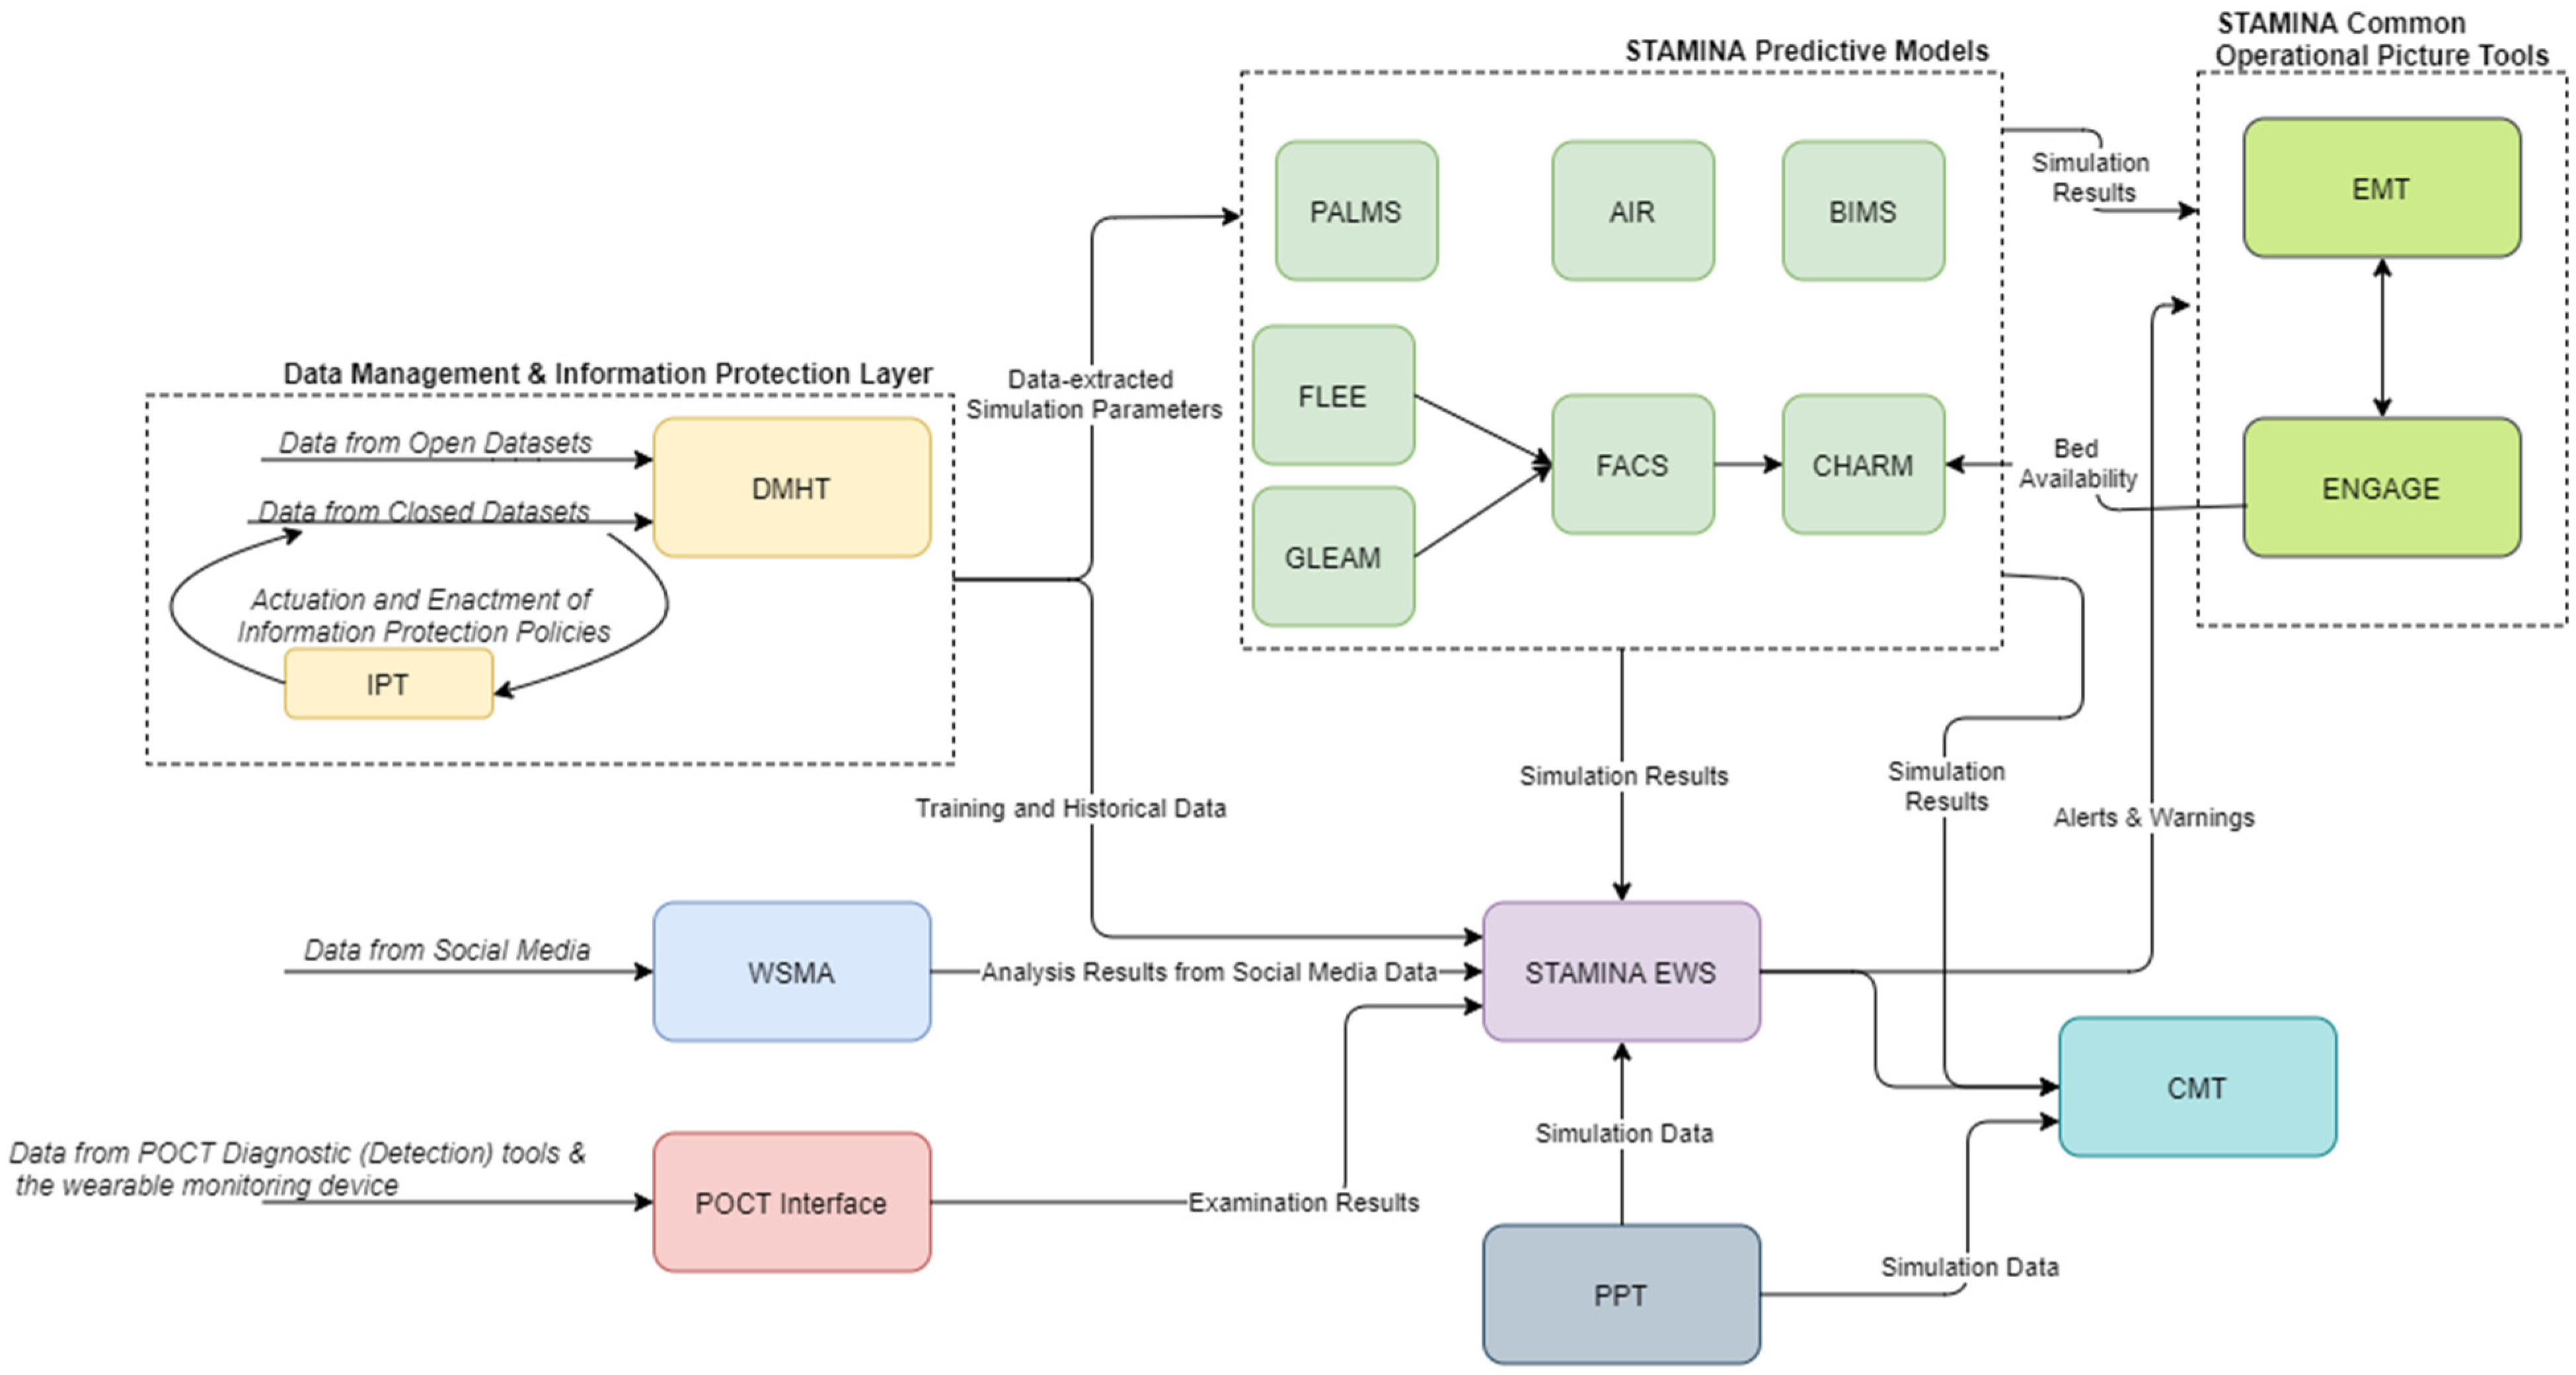
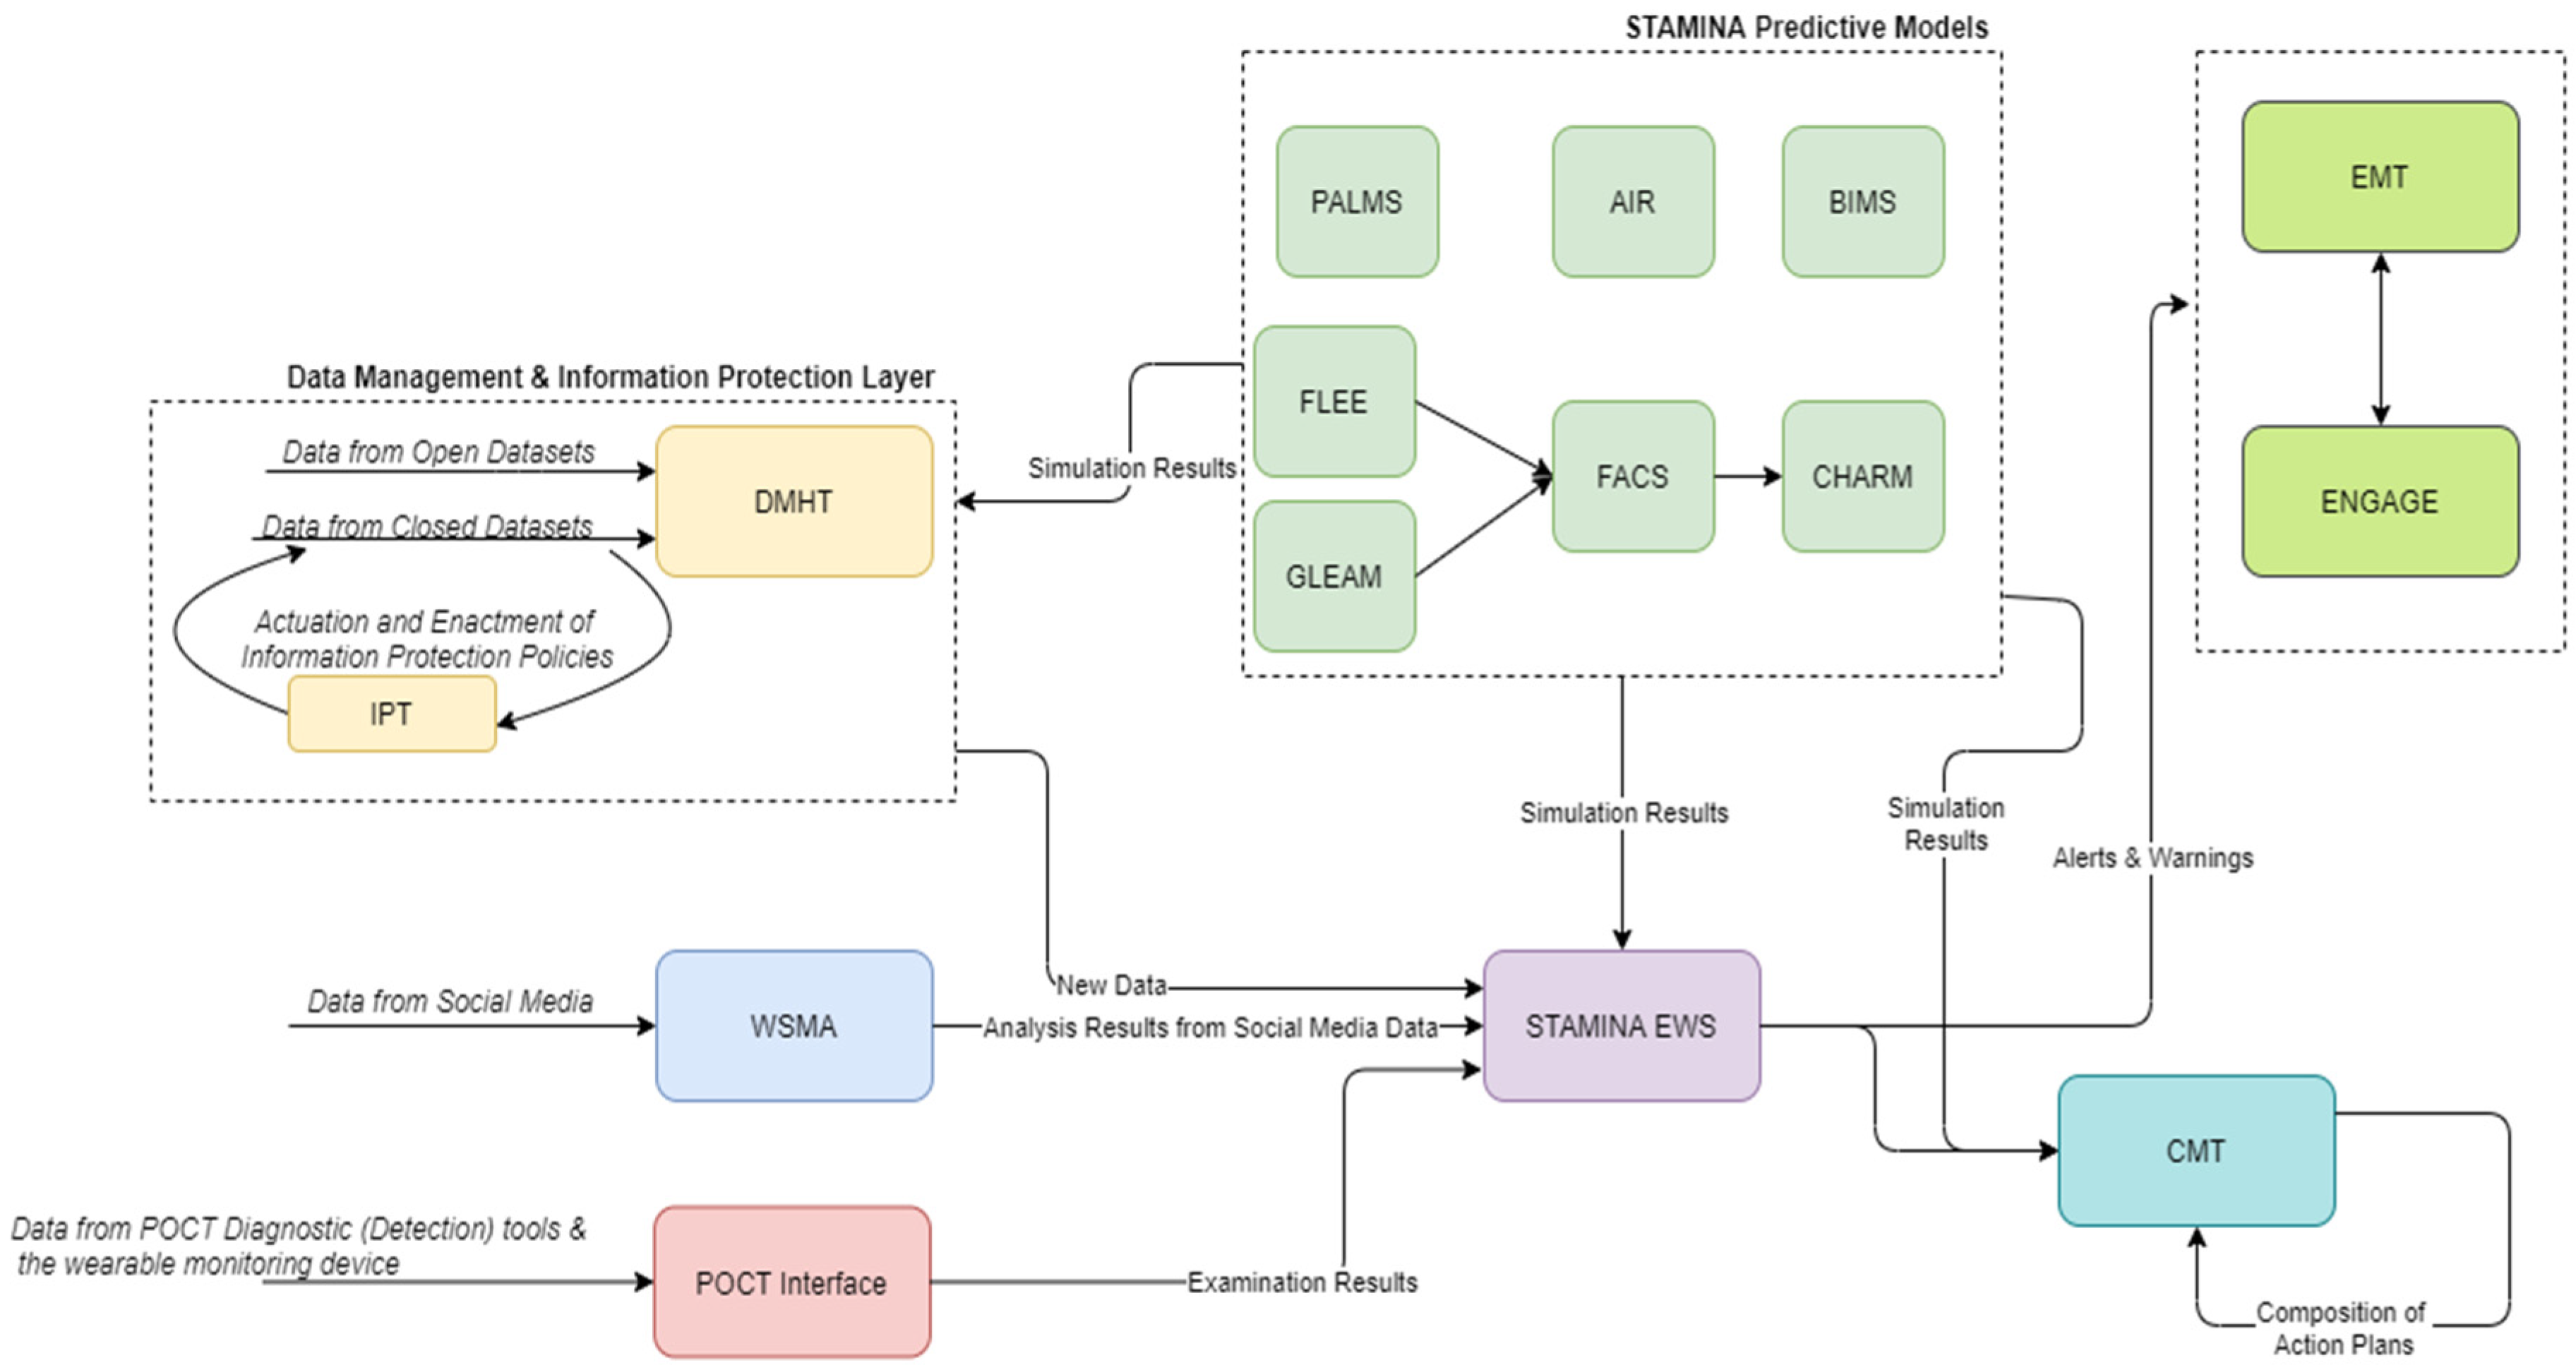
3. Overall System Architecture

The proposed system aims at delivering a holistic situational awareness and decision-support system that allows users from different levels of command to receive data, analyze them and produce useful reports and action plans. The complete conceptual view of the platform architecture can be viewed in Figure 1. The majority of data exchanges between different tools will be realized through a KAFKA Message Broker. Table 1 presents a summary of the tools, with more detailed descriptions presented in Section 4.
Rather than employing a single instance of the platform with a mutli-country scope, the platform is envisioned in such a way that an instance of the platform will provide services in a country-wide area. While communication between different instances of the platform is supported through an Apache Kafka Message Broker, a country-wide instance offers the appropriate degree of granularity for the anticipated services, allowing for the management of sensitive data in a proper way.
Moreover, the platform can be customized for use in three different crisis-management phases, namely the preparedness and prevention phase, the detection and response phase and the recovery phase. Each of the three operational modes will utilize a different set of tools based on the current needs.
The preparedness operational mode of the platform covers the training and update of various tools, and the population of STAMINA with the relevant data, the interconnection with the most relevant data sources, the placement of the point of care tools, the enrichment of the system with the required information, models, emergency plans, standard operating procedures, users/roles, sharing policies, etc., in order to prepare for the operation of the platform during the response phase and a potential outbreak. Here, the machine-learning models, present in the EWS tool, can be retrained based on historical data ingested and catalogued in the DMHT, after the definition of data sharing (information protection) policies by the data owners/providers to data consumers and their enforcement by IPT, while the predictive models can update their simulation parameters (Figure 2).
Moreover, during this phase, the platform can be used to execute training exercises by using the PPT tool. This process is presented in Figure 3.
The detection and response operational mode covers the management of an actual outbreak. Here, the platform users can compose action plans using the CMT and monitor information and alerts coming from the EWS and WSMA Tools. The predictive models also provide updates from their simulations. PPT can be used in this phase to organize a training exercise using simulated data (Figure 4). Data from POCTI are also used in the issuing of alerts, composing of action plans and in all the relevant user interfaces.
Finally, during the recovery phase, the system employs the knowledge extracted from the outbreak to optimize and better prepare for future events (Figure 5).

4. Platform Components

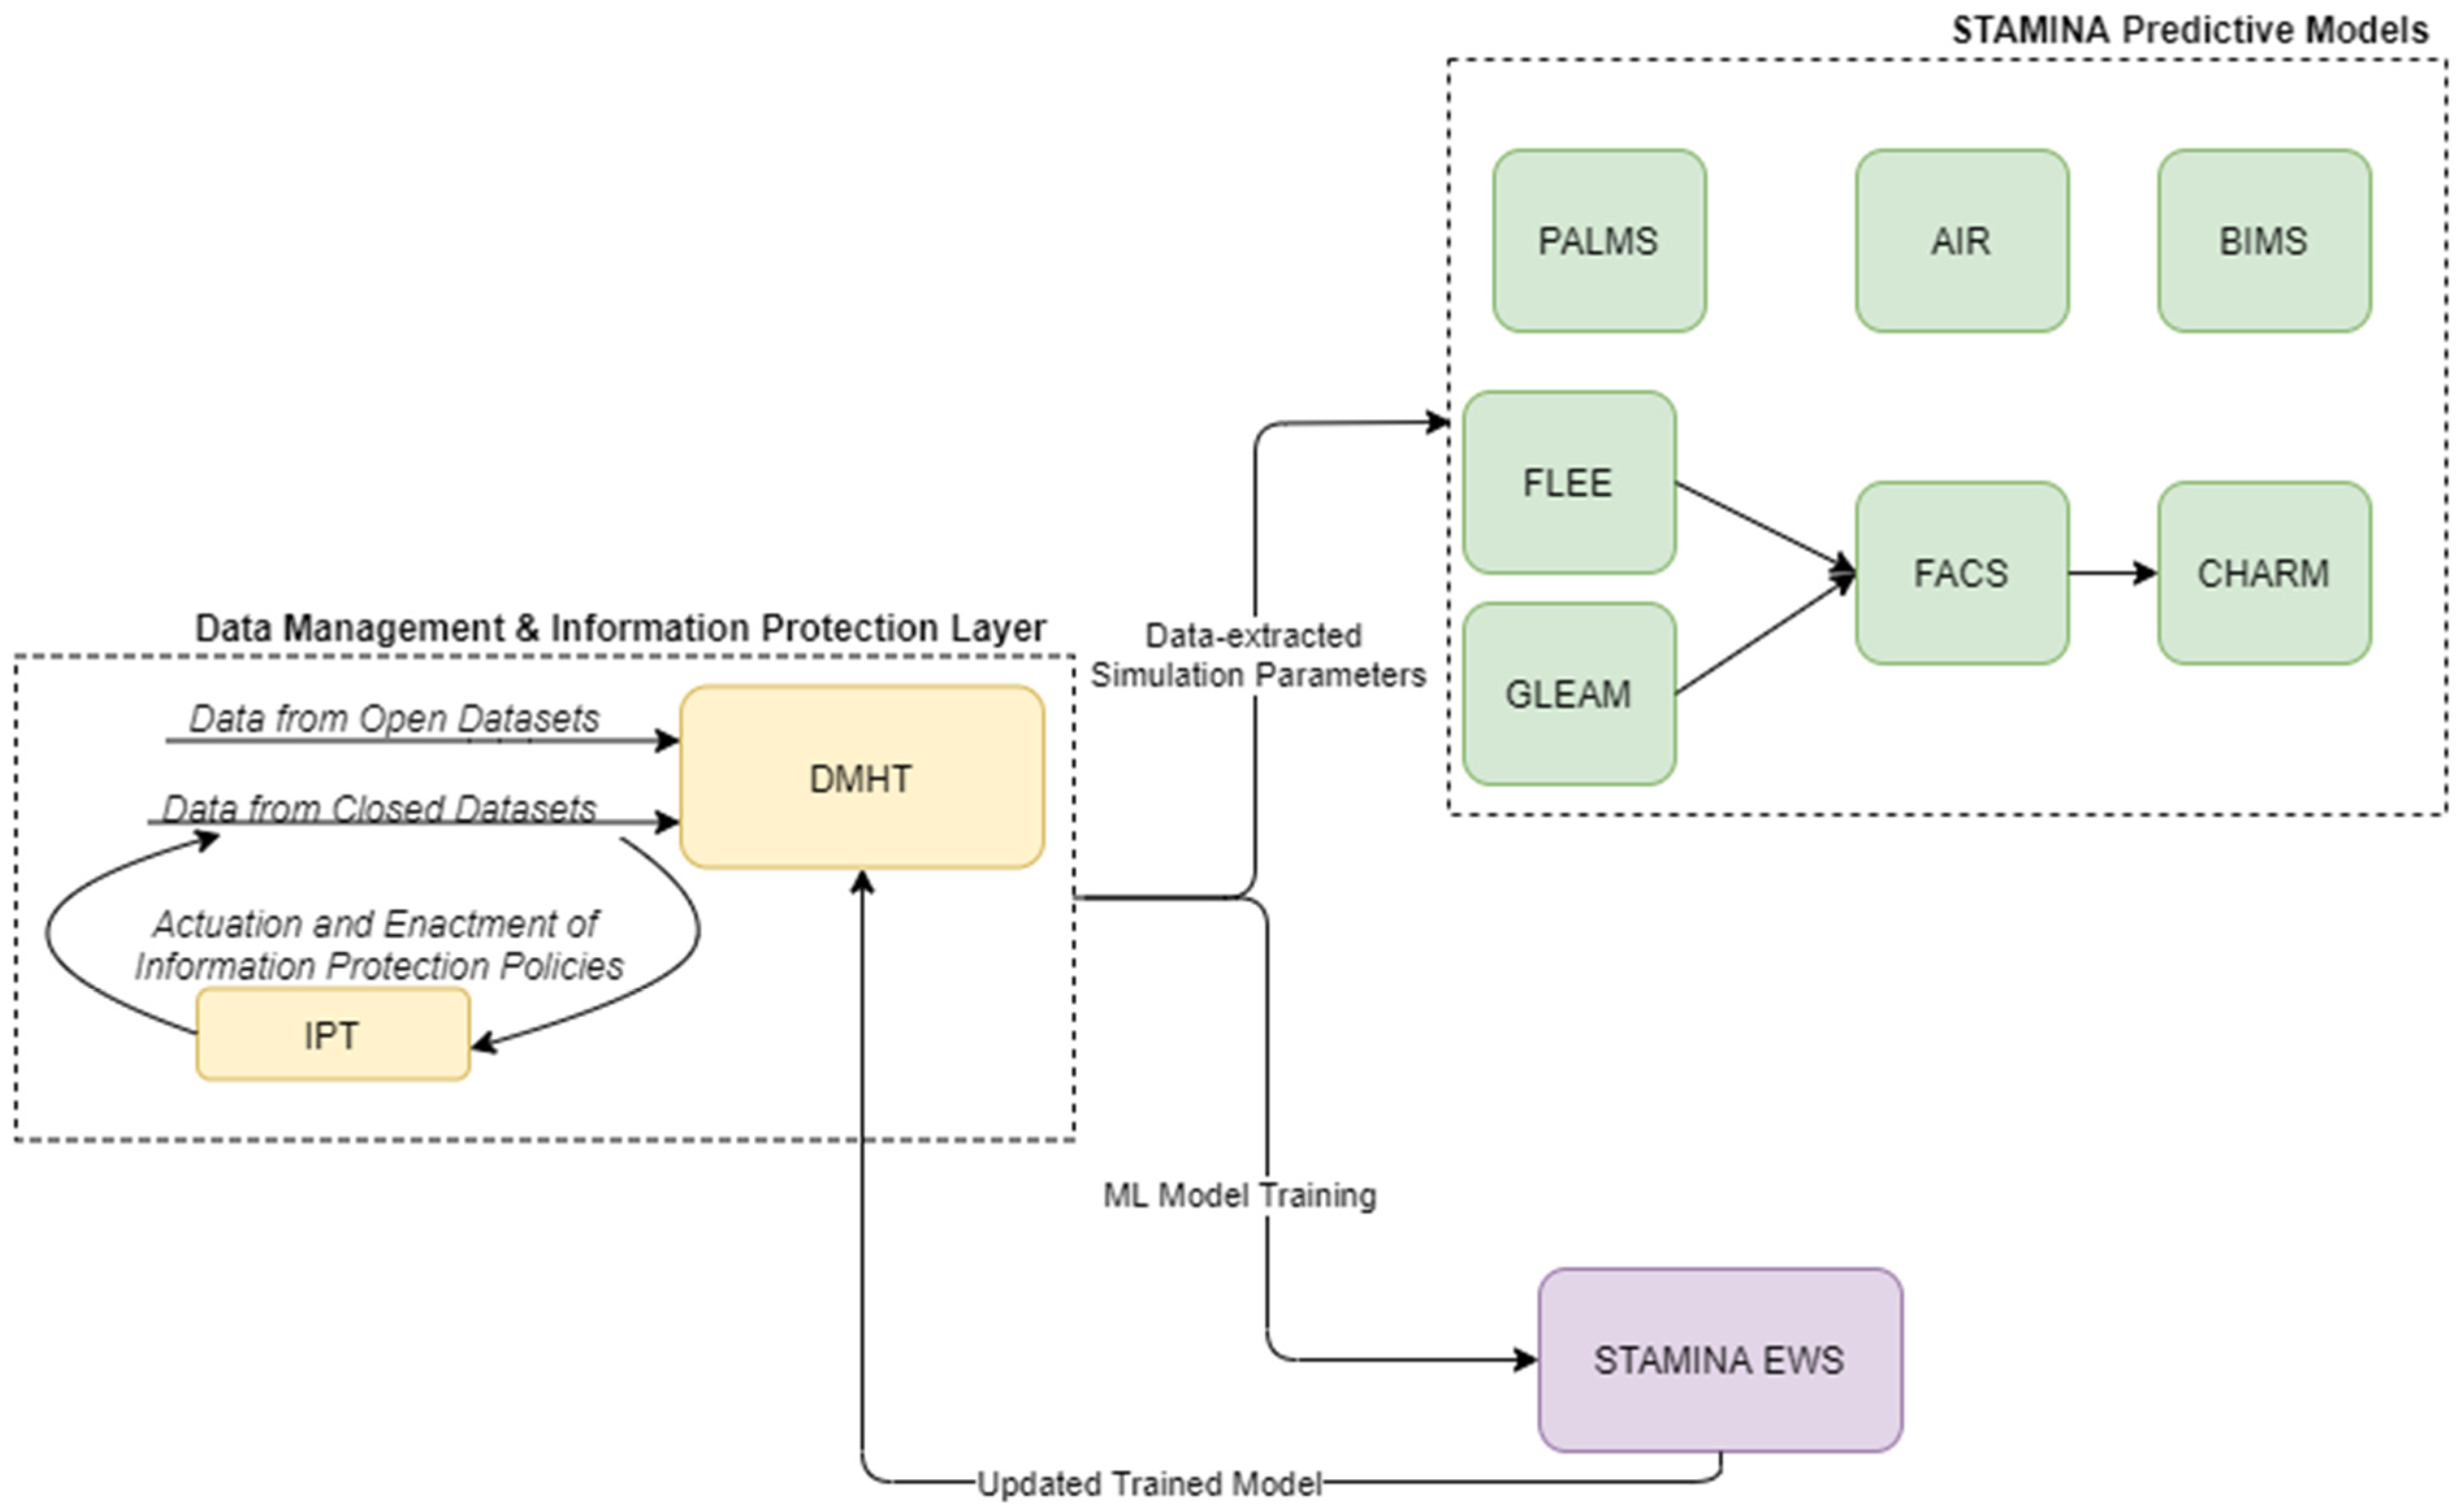
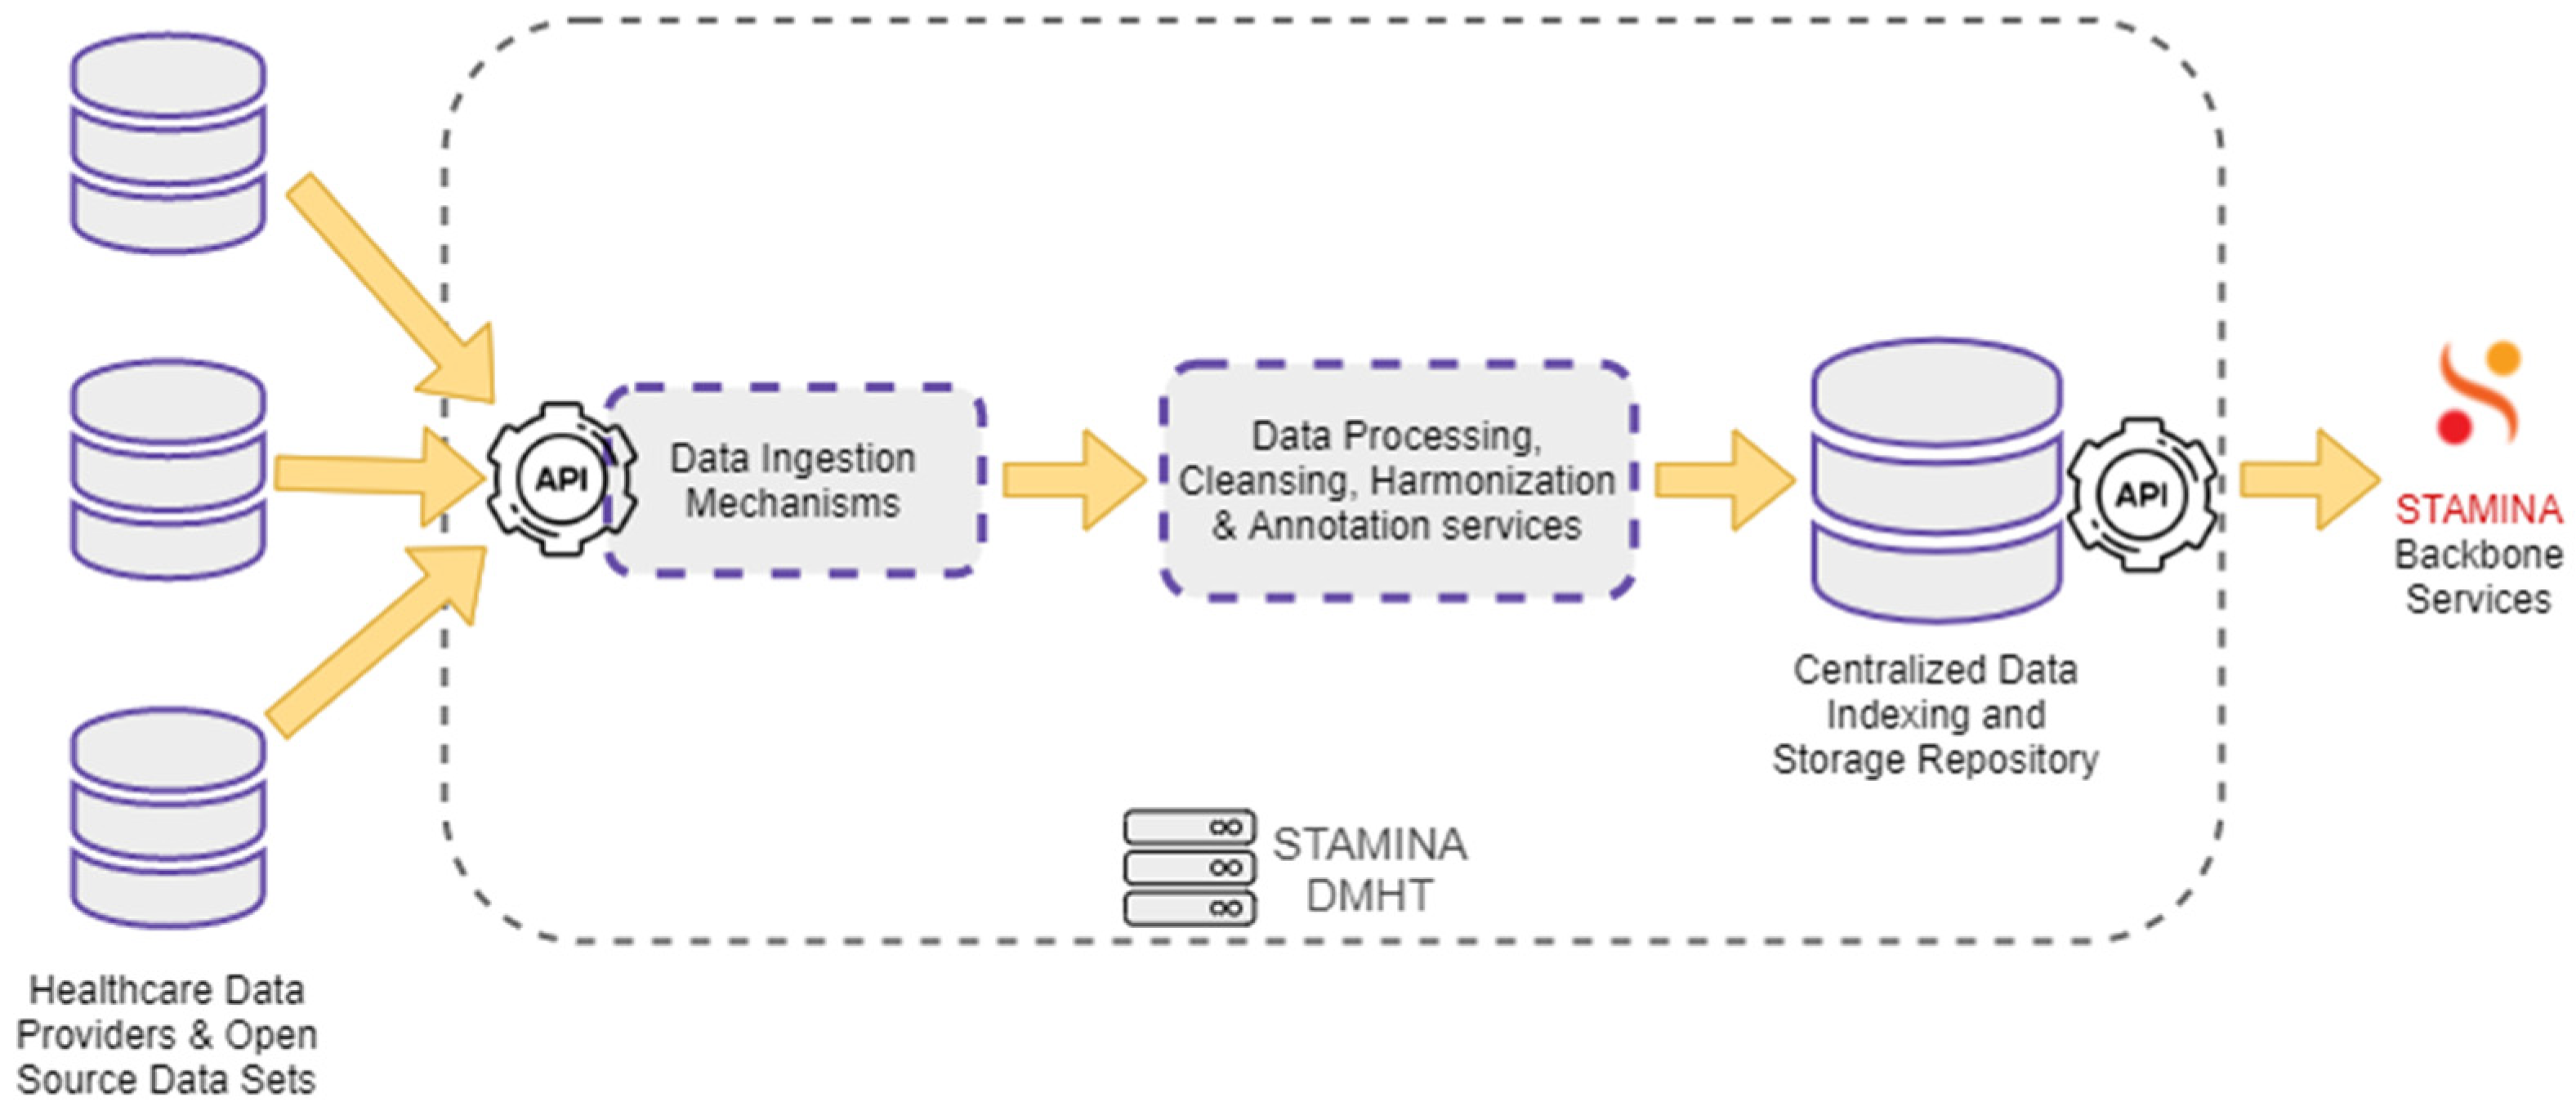
4.1. Data Management

For the envisioned platform to be able to operate, the management of data, and the enacting of the various user scopes upon the stored data, is integral to achieving a seamless operation. To this end, a specialized data-management tool is used in combination with an information-protection tool. The Data Management and Harmonization Tool (DMHT) enables seamless access to a set of healthcare data sources. It offers a combination of different functions that support the ingestion, storage, and maintenance of the collected data and their metadata, while ensuring that they are semantically enriched to comply with a Common Semantic Data Model. The primary role of the DMHT is to bridge the gap between data-oriented technology providers and healthcare stakeholders, providing the first with datasets from the latter. Data either provided by healthcare stakeholders or extracted from open-source data sets are ingested into the DMHT via the data ingestion mechanisms. These mechanisms include RESTful HTTP endpoints, file transfer services, and HTTP polling functions. The DMHT services do not dictate a specific data format, supporting arbitrary formats understood by applications that exchange data, such as JSON, CSV, and raw text. The collected data are processed by the DMHT transformation and harmonization pipelines. These pipelines are responsible for data cleansing, annotation, and harmonization tasks, ensuring that the ingested data are consistent with the defined Common Data Model. The processed and annotated data are redirected to a centralized repository, where they are indexed and stored in a secure and reliable environment. An extended set of RESTful APIs that support complex data queries, filtering, and aggregations, enables the backbone services to search for and retrieve data from the DMHT. Figure 6 depicts the overall data flow through the DMHT services.

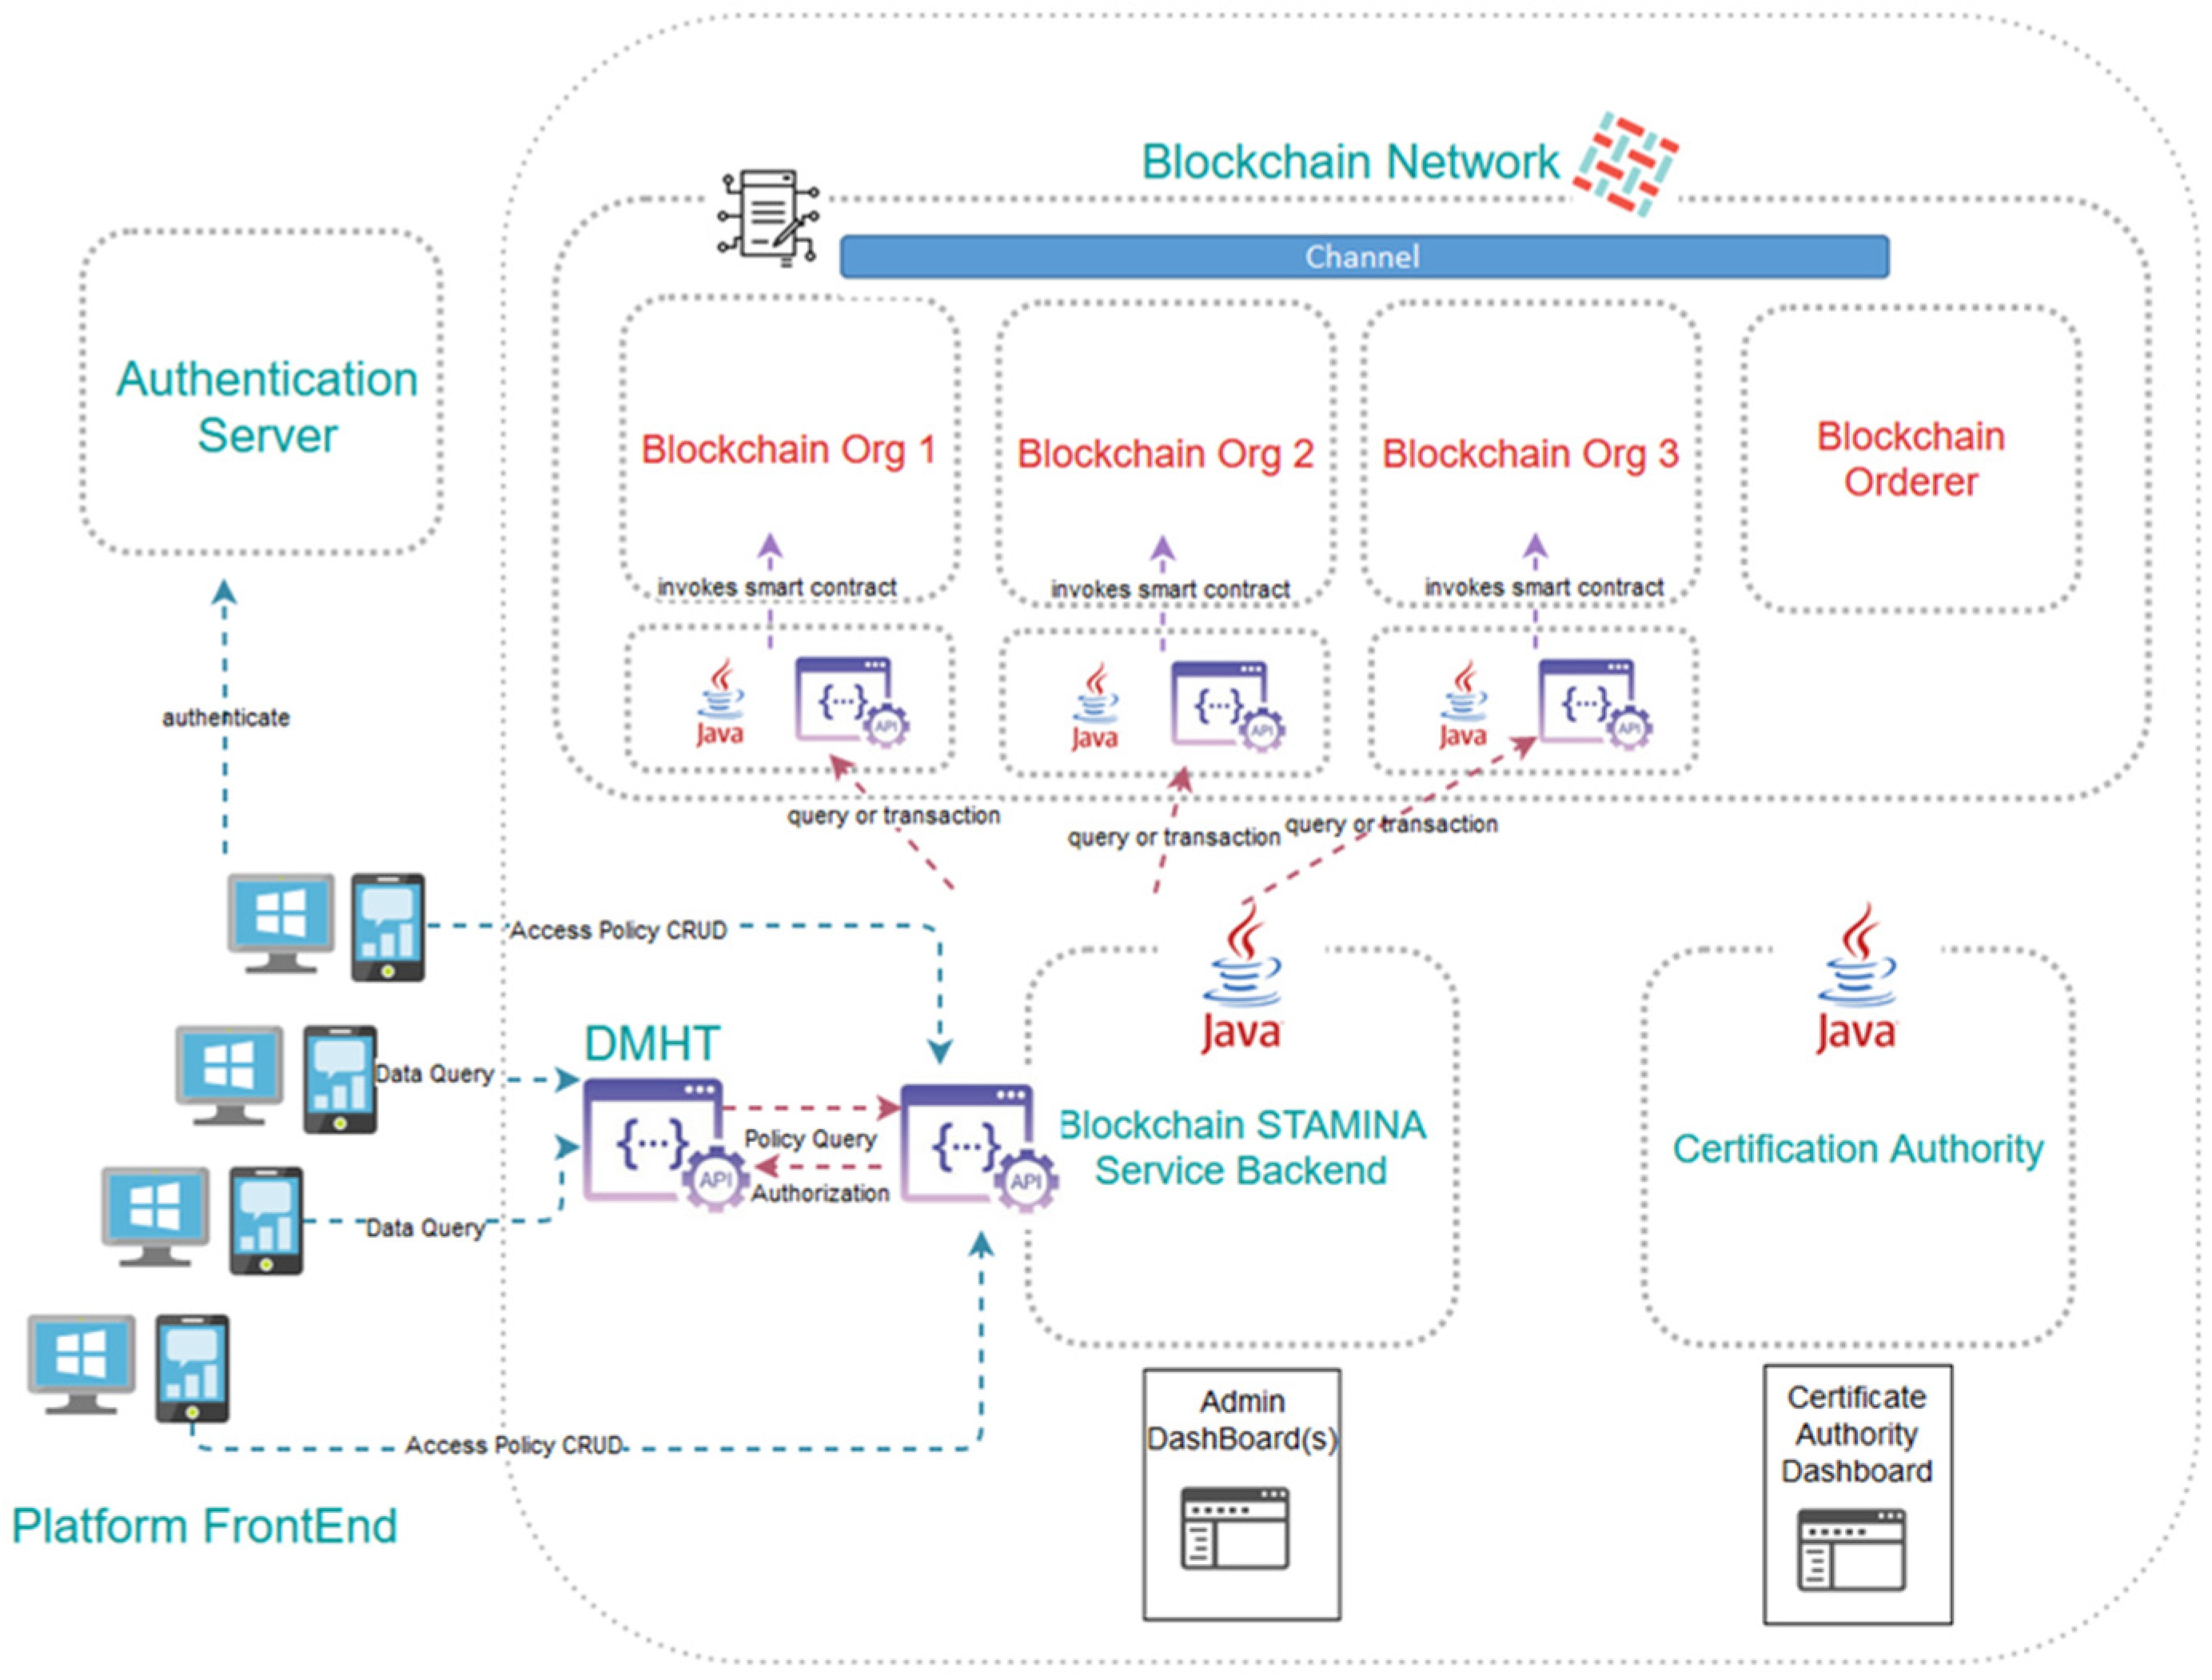
4.2. Information Protection

We facilitate secure and trusted exchange of historical health datasets among collaborating platform users and stakeholders with different data scopes through the Information Protection and Secure Data Sharing tool (IPT). This leverages an open-source permissioned private Blockchain protocol, called Hyperledger Fabric, to facilitate secure and trusted exchange of historical health datasets among collaborating platform users and stakeholders. More specifically, when a new historical dataset is fed to the storage infrastructure provided by the Data Management and Harmonization tool, its provider is able to use the Information Protection tool to determine which organizations or individual users are permitted to have access to and eventually retrieve the dataset.
The Information Protection and Secure Data Sharing Tool exhibits a rather complex architecture, the assemblage of which requires the use of several interconnected machines, each hosting some of its components, thus formulating a private-permissioned Blockchain network. We leverage Blockchain to facilitate secure and trusted exchange of historical health datasets among healthcare institutions and stakeholders using the platform. The tool aspires to build upon and improve existing data governance processes between different organizations, translating the information-sharing policies they already apply in their current operational interactions into electronically imposable rules compiled in smart contracts. Naturally, compliance to regulatory and security requirements and constraints per data provider holds central stage in the design of the aforementioned solution. As many of the data-providing organizations have expressed constraint regarding their healthcare data not being transferred beyond the geographical boundaries of their country, it is perceived that several small-scale Blockchain networks ought to be created, one per country. This leaves the additional possibility at a later stage for metadata to be extracted from the local blockchain networks and led to a pan-European repository. As satellites to the actual Blockchain network, a collection of dashboards and exposed APIs will be deployed to accommodate user-friendly access to the tool’s functionalities. Finally, one organization per country must assume the role of the authority tasked to create access certificates to the network for new platform participants. To facilitate their work, they will be provided with a specialized dashboard as well.
The related Information Protection and Secure Data Sharing tool is a component of the STAMINA platform. This tool aspires to provide a unified and efficient access-control policy management framework. A solution for monitoring the compliance of access-control enforcement to policies and regulation will be proposed and implemented by capitalizing on Blockchain technology.
Communication of the historical dataset providers with the Blockchain network, in order for them to record their access policies, will take place not directly, but via a multi-level back-end application. In between them, a graphical environment will allow said providers to formulate the particular access rules contained in the smart contracts, and will enforce the terms of the business agreement between them and the eventual data recipients. The graphical environment will be part of the Common Operational Picture component of the STAMINA platform and will communicate with the back-end application via a RESTful API.
RESTful APIs will serve the interaction between the Information Protection tool and the Data Management and Harmonization tool. Once DMHT receives a request from an organization to retrieve a dataset (by performing a GET http call to an endpoint), the DMHT will consult the Information Protection tool to verify that the organization has been granted valid access rights by the dataset owner. To do so, the DMHT will issue a new http call to an API exposed by the Information Protection tool bearing the candidate recipients’ identifier and the endpoint in question. The API will have to respond with a positive or negative answer that the DMHT will have to follow and accordingly permit or deny access to the dataset for streaming.
As far as the Blockchain network is concerned, it is expected to create as many instances of the Information Protection tool (separate networks, that is) as the number of the DMHT instances. As this document is being written, this is expected to be one per country, for regulatory purposes. Each participating organization sharing datasets will maintain their own Blockchain node, while this is not required of data recipients. One additional node will be needed by the DMHT tool itself in order to query the network for the stored access policies. Different virtual machines naturally host the various nodes, which are deployed as Docker containers. The smart contracts, channels and databases formulating and supporting the network are also physically separate Docker containers. For the project’s proof-of-work, the Blockchain network relies on Docker Swarm for orchestration and networking functionalities.
The architecture of the Information Protection and Secure Data Sharing Tool, along with the main component interactions, is depicted in Figure 7.

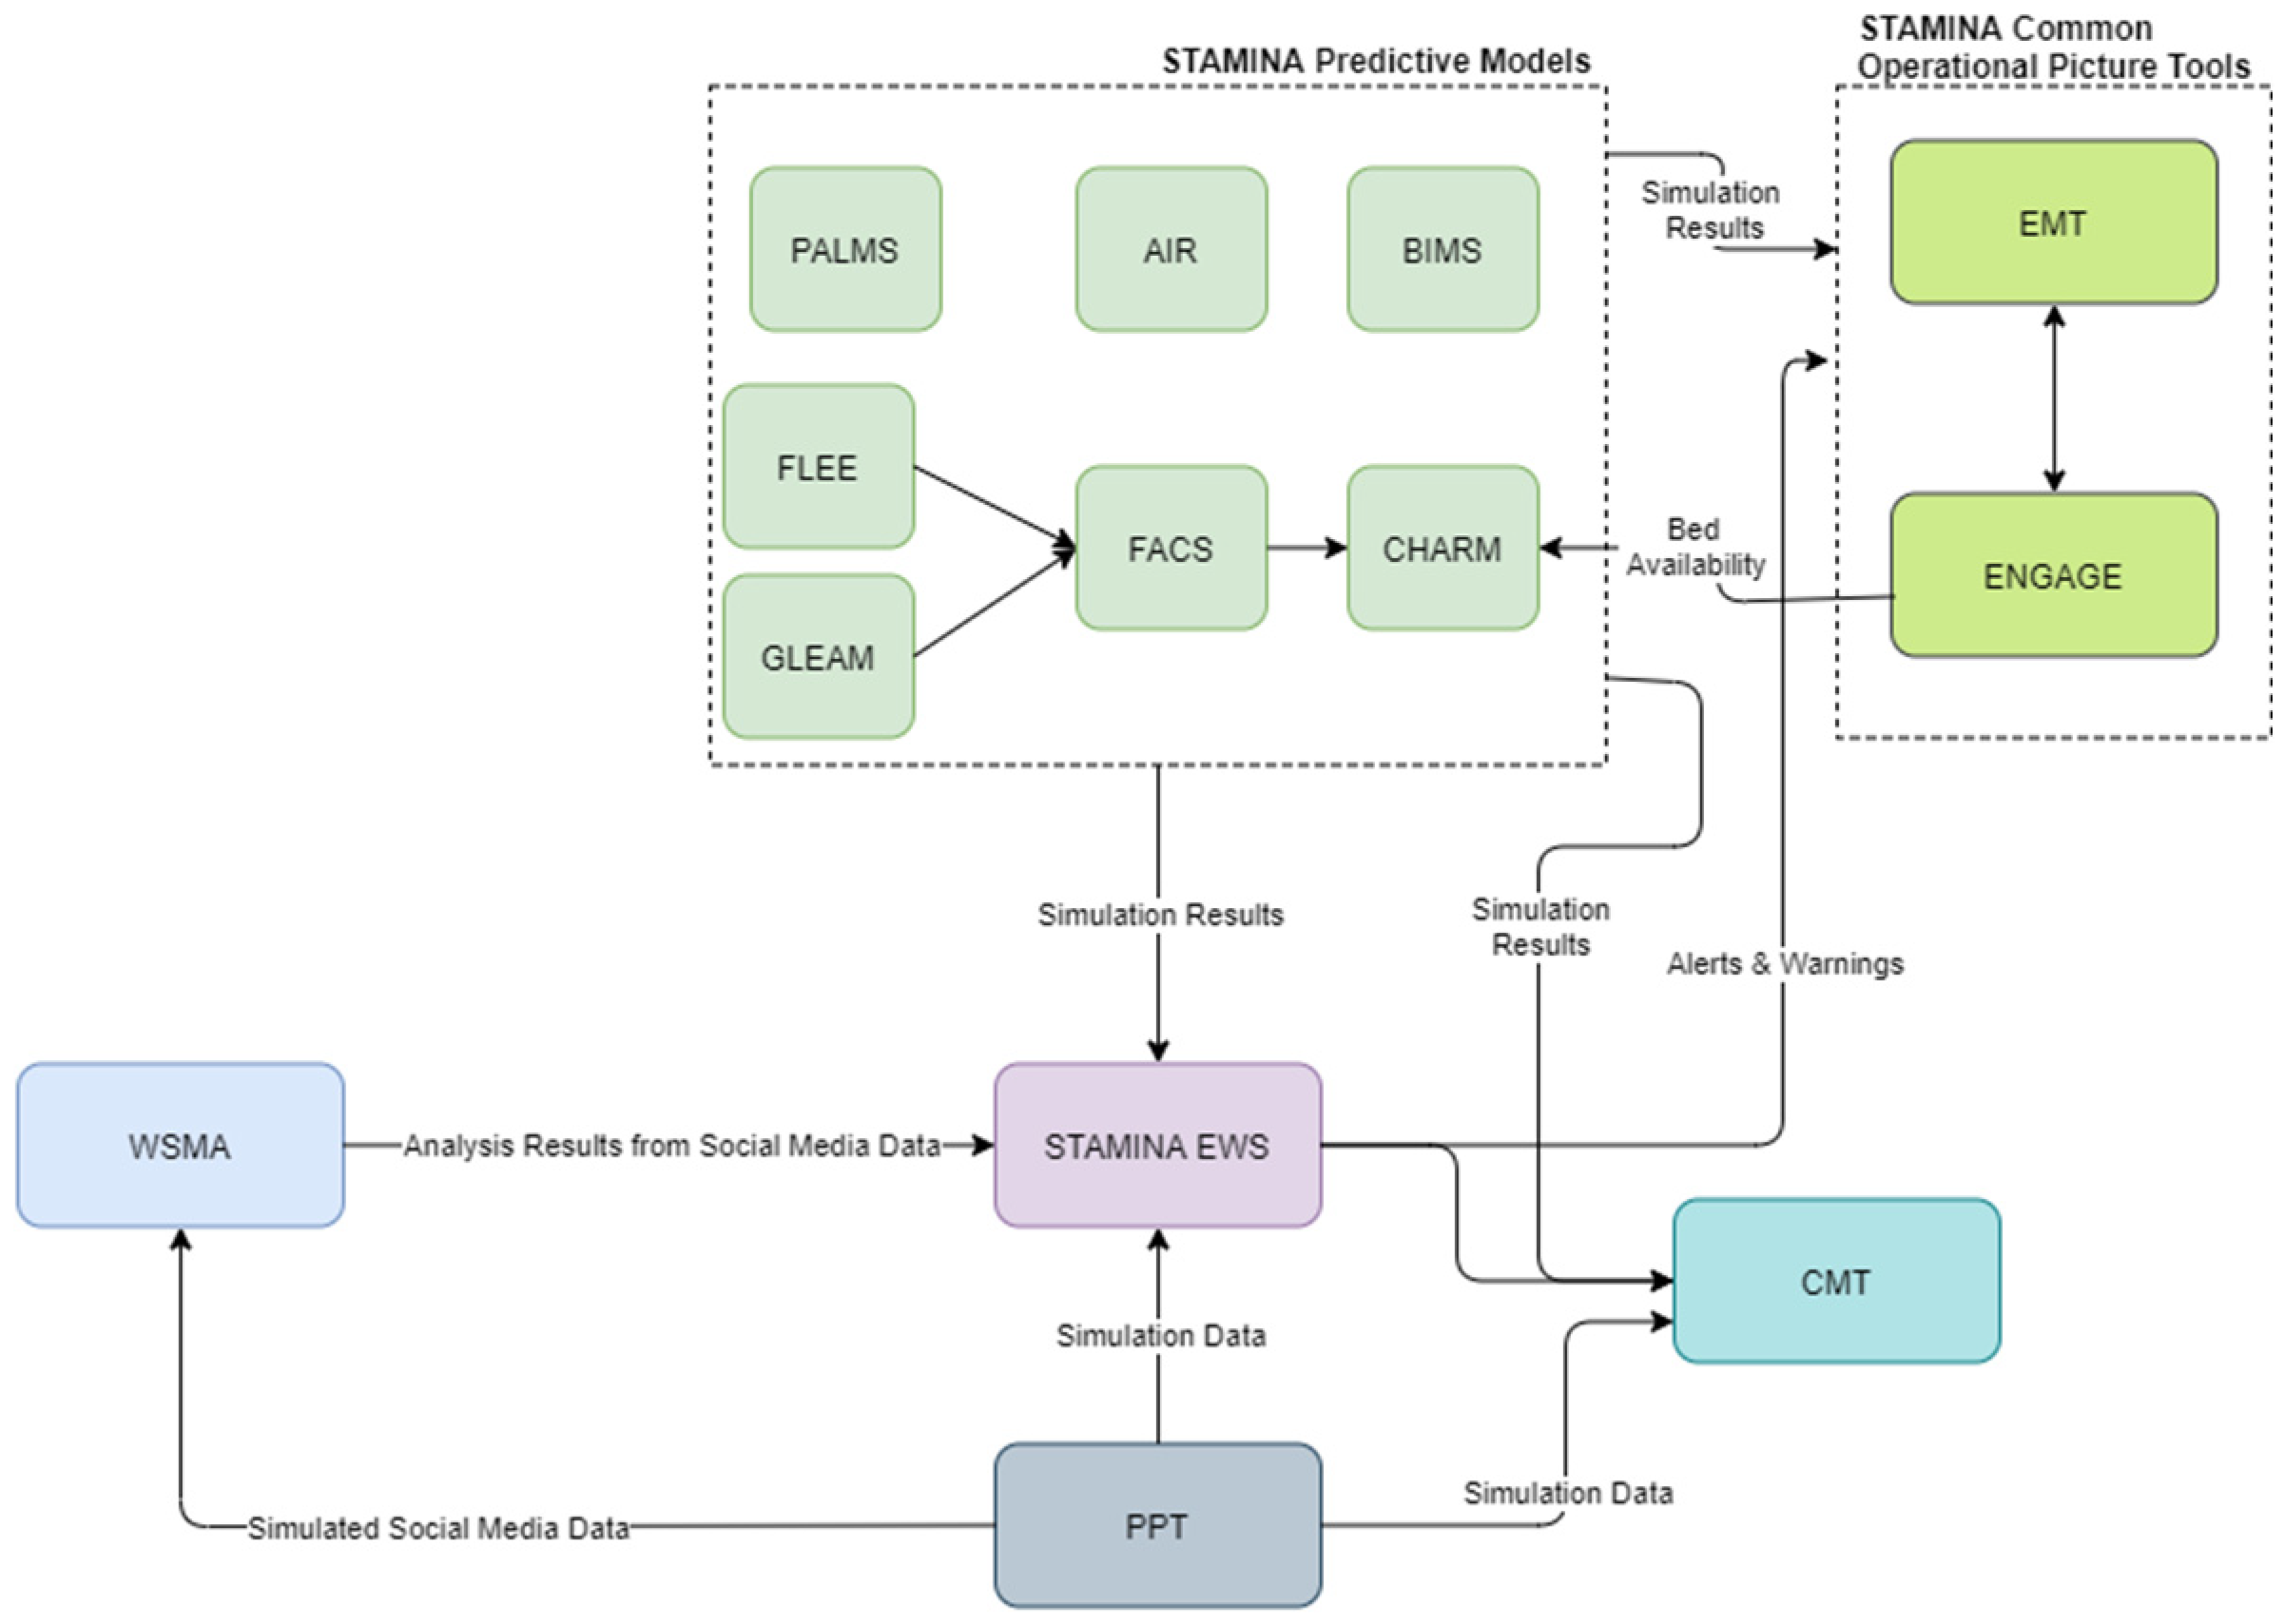
4.3. Platform Intelligence, Prediction and Aleting Services

Beyond data management operations, the platform provides additional intelligence through the use of various predictive models and an early warning system that leverages deep learning in combination with a user-dictated rule-based system. Specifically, seven predictive models are used, namely FACS, FLEE, CHARM, AIR, PALMS, BIMS, and GLEAM. Moreover, additional analyses are executed via web and social media analytics tools that mine information from social media to provide additional insights. These tools are deployed alongside the early warning system, and continuously run simulations to provide additional insights on the various aspects of a pandemic outbreak.

4.3.1. FACS

The Flu and Coronavirus Simulator (FACS) is an Agent-Based Simulation (ABS) that incorporates geospatial data, epidemiological data, disease parameters, population dynamics and demographics of a given region. FACS models the transmission of SARS-CoV-2 (or other viruses as defined in the input) and simulates SARS-CoV-2 outbreaks in a given region using computational disease dynamics at a local (e.g., city or borough) scale. It can be used to forecast the number of infectious cases spread, to identify spatial hot spots across the region, to estimate the number of infected patients arriving at hospitals, to evaluate various lock-down scenarios and counterfactual information, and to generate early warnings for rapid emergency-response management. FACS provides map and graphical visualization of the spread of a disease.

4.3.2. FLEE

FLEE is an agent-based modelling program that is used to predict people’s migration movements and will be modified in STAMINA to include the movement of goods. Flee works with two key components: a location graph and moving agents. The location graph is a data structure where individual settlements and transportation hubs are represented using vertices, and roads, walking routes or other transport connections using edges. The agents, in turn, represent individual people and are placed in source locations, and given a movement ruleset that determines their movement across the location graph. Flee typically increments agent locations once per simulated day, and agents may travel different distances depending on their ruleset and maximum movement speed. It is possible for agents to reside enroute at the end of a time step, and it is also possible for agents to traverse multiple locations within a single time step. Both cases may occur depending on the constraints chosen for the simulation. Key interactions among the involved entities include events that happen at different times during the transport of goods, and carry a risk of disease transmission. Typically, three events are modelled: (i) disease transmission between people and goods in transit; (ii) disease transmission between people and goods during loading/unloading; and (iii) disease transmission between people during enroute breaks.

4.3.3. CHARM

The dynamiC Hospital wARd Management (CHARM) is a discrete-event simulation (DES) that models dynamic reconfiguration of hospital wards for bed capacity planning, facilitating continuation of normal Intensive Care Unit (ICU) operations and outbreaks. Hospital wards in CHARM are divided into ten zones. Each zone is of certain type, i.e., COVID-19 (C) and COVID-19 recovery (CR), emergency (EM) and emergency recovery (EMR), and elective (EL) and elective recovery (ELR). These zones are dynamically recharacterized as different types according to patient admissions and bed occupancy.

4.3.4. AIR

Antimicrobial Resistance Model (AIR) is a Deep Neural Network model that allows for the association of the variables related to antimicrobial resistance with mortality rate. AIR currently focuses on the E.coli microbe along with one of its resistance mechanisms named ESBL. ESBL is the enzyme that creates the microbe and destroys the antibiotic, leading to excess mortality rates. The main scope of this model is:
  • To allow for the examination of the predicted excess mortality due to antimicrobial resistance. The AIR model will extend its design to present x conditions of Multi-Task Learning (MTL) model architectures to predict output estimates (i.e., number of deaths due to prolonged symptoms and mortality rates) for a specified time period.
  • To demonstrate the usefulness of incorporating additional patients’ contextual epidemiological information.
  • To perform an association analysis among the patients’ data so that when joined with the primary task (initial input information) it could perform better and thus provide an improved computationally predictive excess mortality model.
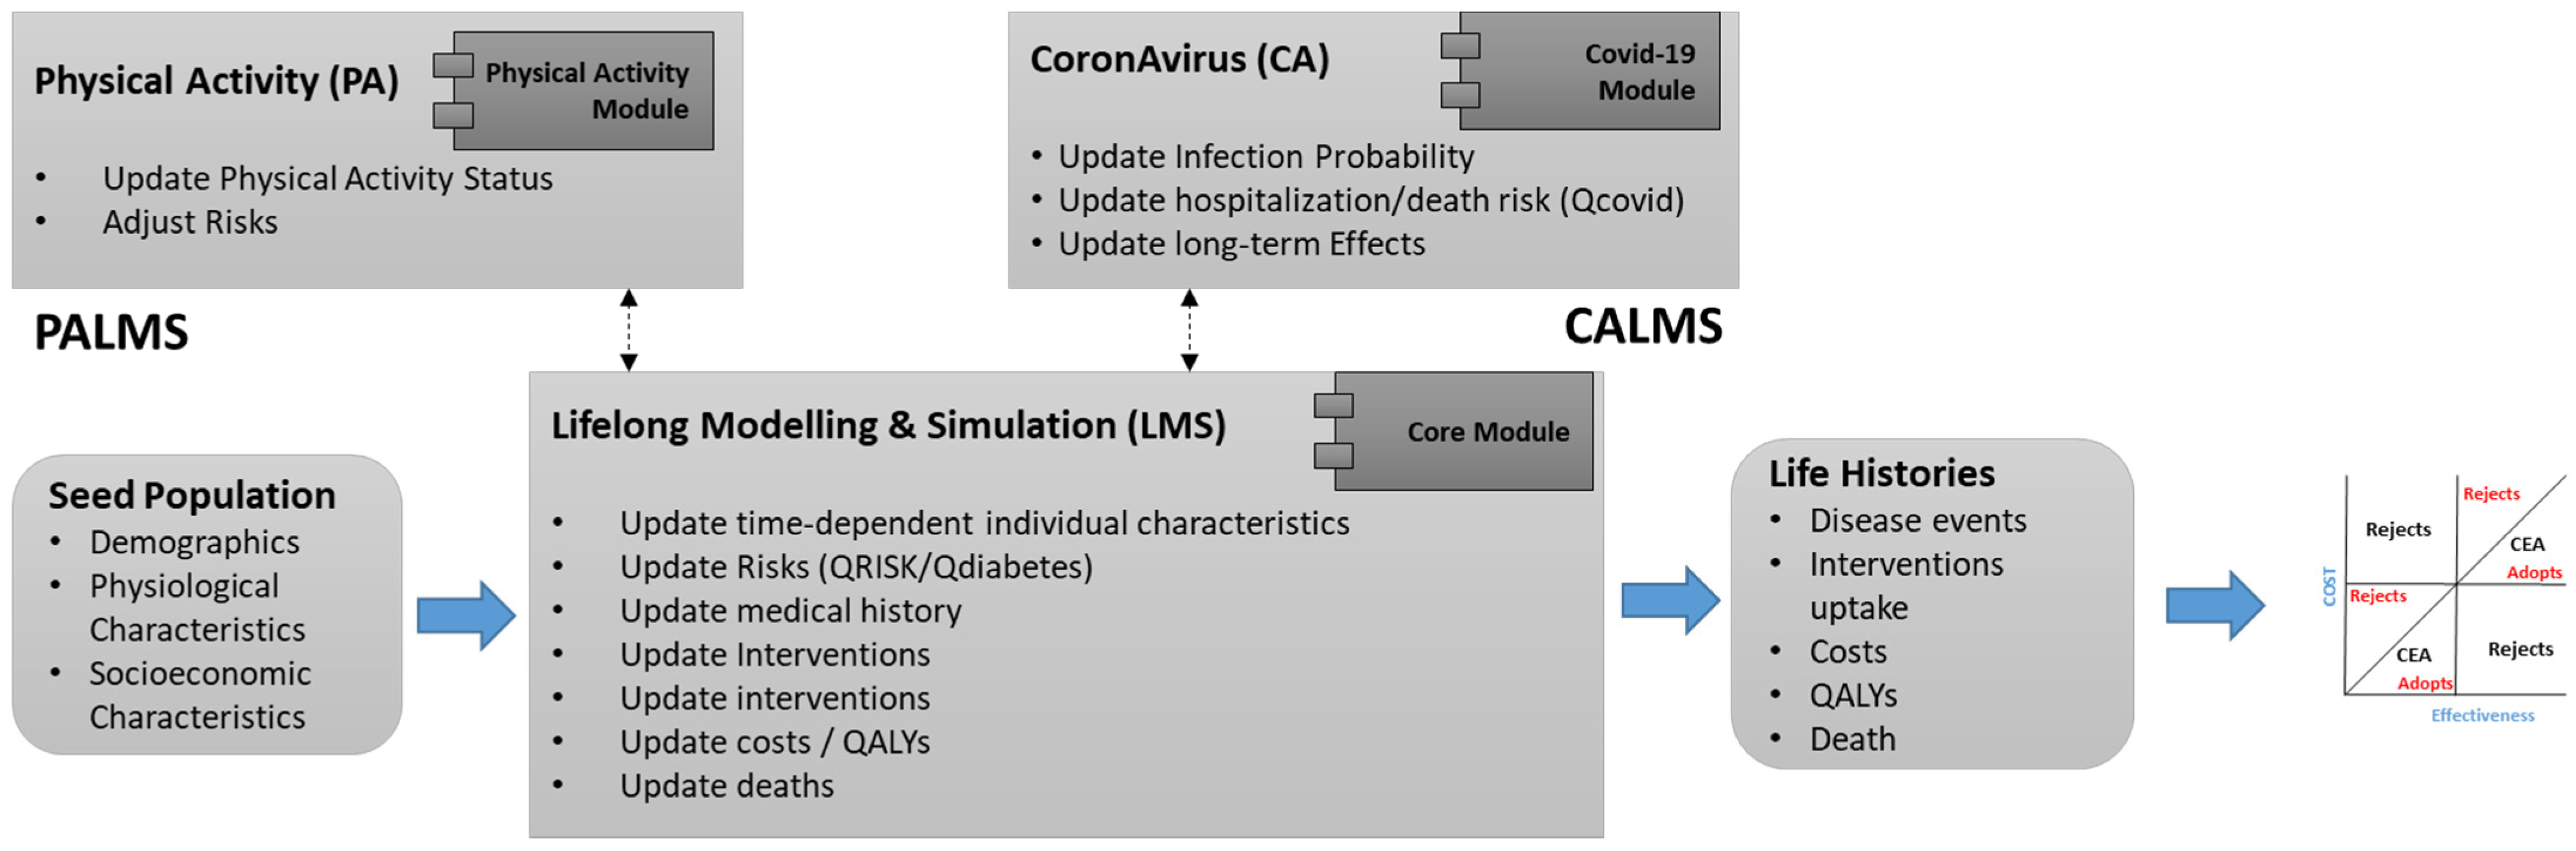
4.3.5. PALMS

PALMS is an agent-based microsimulation that predicts the lifelong physical activity behavior of individuals and its effect on their health-related quality of life. It is designed for economic evaluation of health technologies (interventions). Its core module (Lifelong Modelling and Simulation—LMS) includes baseline risk calculations for non-communicable diseases (i.e., cardiovascular disease, type 2 diabetes, etc.). A Coronavirus (CA) module has been developed (Figure 8), which predicts the risk of COVID-19 considering its comorbidities and long-term impacts on individual health.

4.3.6. BIMS

West Nile Virus (WNV) is a mosquito-borne Flavivirus. It is maintained in the wild through an enzootic cycle involving transmission between birds and mosquitoes (mosquitoes/birds/mosquitoes). Humans and horses are accidental terminal hosts considered a dead end for its replication. The BIMS-WN model is a multi-agent model whose goal is to predict the occurrence of a WN epidemic using climate and bird migration and movement data. The BIMS uses agents to represent environment, mosquitoes, avian hosts and humans. The activities and interactions of these various individual agents are simulated within a specified geographic area. A raster map is used to represent the collection of regions agent, which are linked to agent-specific and environmental data, weather conditions, vegetation cover, and other parameters. Habitat values represent the suitability of specific locations (region agents) for foraging, nesting and migration of birds. The simulation also incorporates data on temperature and humidity for the region. These meteorological parameters influence habitat quality for the mosquito and bird.

4.3.7. GLEAM

The Global Epidemic and Mobility (GLEAM) computational model is part of the Predictive Modelling Tools providing predictions at a global scale. A typical use case of GLEAM is represented by the simulation of the spreading of influenza-like illnesses (ILI) or COVID-19-like pathogens, whose origin may be one of the countries where the trials are defined.
GLEAM is a stochastic metapopulation epidemic-modelling tool that allows us to simulate the spatiotemporal spreading of various infectious diseases at the global level, considering over 3200 subpopulations in about 230 different countries and territories around the world. Each subpopulation corresponds to a geographical unit, called a basin, built by performing a Voronoi tessellation of the Earth’s surface around important transportation hubs. The tool embeds core datasets about worldwide population density and demographic structures, flight networks and passenger distribution, daily commuting flows, and age-structured contact matrices.
In particular, the daily travel of passengers by flight is simulated using origin–destination data from airline transportation databases, while the local commuting flows between neighboring subpopulations are accounted for through the computation of an effective force of infection due to the coupling between those populations. Moreover, the epidemic dynamics within each subpopulation are defined by describing the compartmental structure of a given disease, along with the corresponding transition rates among the various compartments and other relevant parameters. In this respect, infection transmission occurs through interactions of the disease carriers with susceptible individuals.
GLEAM provides results describing the temporal and spatial evolution of the simulated epidemic or pandemic event, which are represented by output statistics corresponding to the median value and 95% confidence interval related to the daily fractions of new and cumulative transitions (e.g., latent, infectious, recovered individuals) aggregated at different geographic levels (basins, countries, continents, world regions), and possibly given for each age group separately. Moreover, invasion tree data can also be generated. This information is currently stored as a HDF5 archive, whose structure is optimized for access convenience and required storage space.

4.3.8. Web and Social Media Analytics

The Web and Social Media Analytics tool (WSMA) is an online monitoring and listening tool that gathers data from social media APIs according to end-user-defined search parameters. The data are then processed to compute statistics and indicators with the aim of increasing end-user situational awareness and supporting their decision making. Tasks carried out by WSMA include the analysis of trends and spikes in the online discussion around a pandemic, the monitoring of public sentiment and trust in institutions and the early identification of outbreaks signals. WSMA provides an ad hoc dashboard with which end users can interact, and crawls data in almost-real-time from sources external to STAMINA (social media APIs). WSMA, via Message Broker, communicates with the other STAMINA tools. Particularly, it informs EWS of potential alert/warnings detected on social media; it receives simulated data from the Preparedness Pandemic Training (PPT) tool to run specific trials; and it sends analytics reports to Common Operational Picture (COP) to visualize some of the analytics in an integrated view. End users of WSMA can be both national planners and first responders.

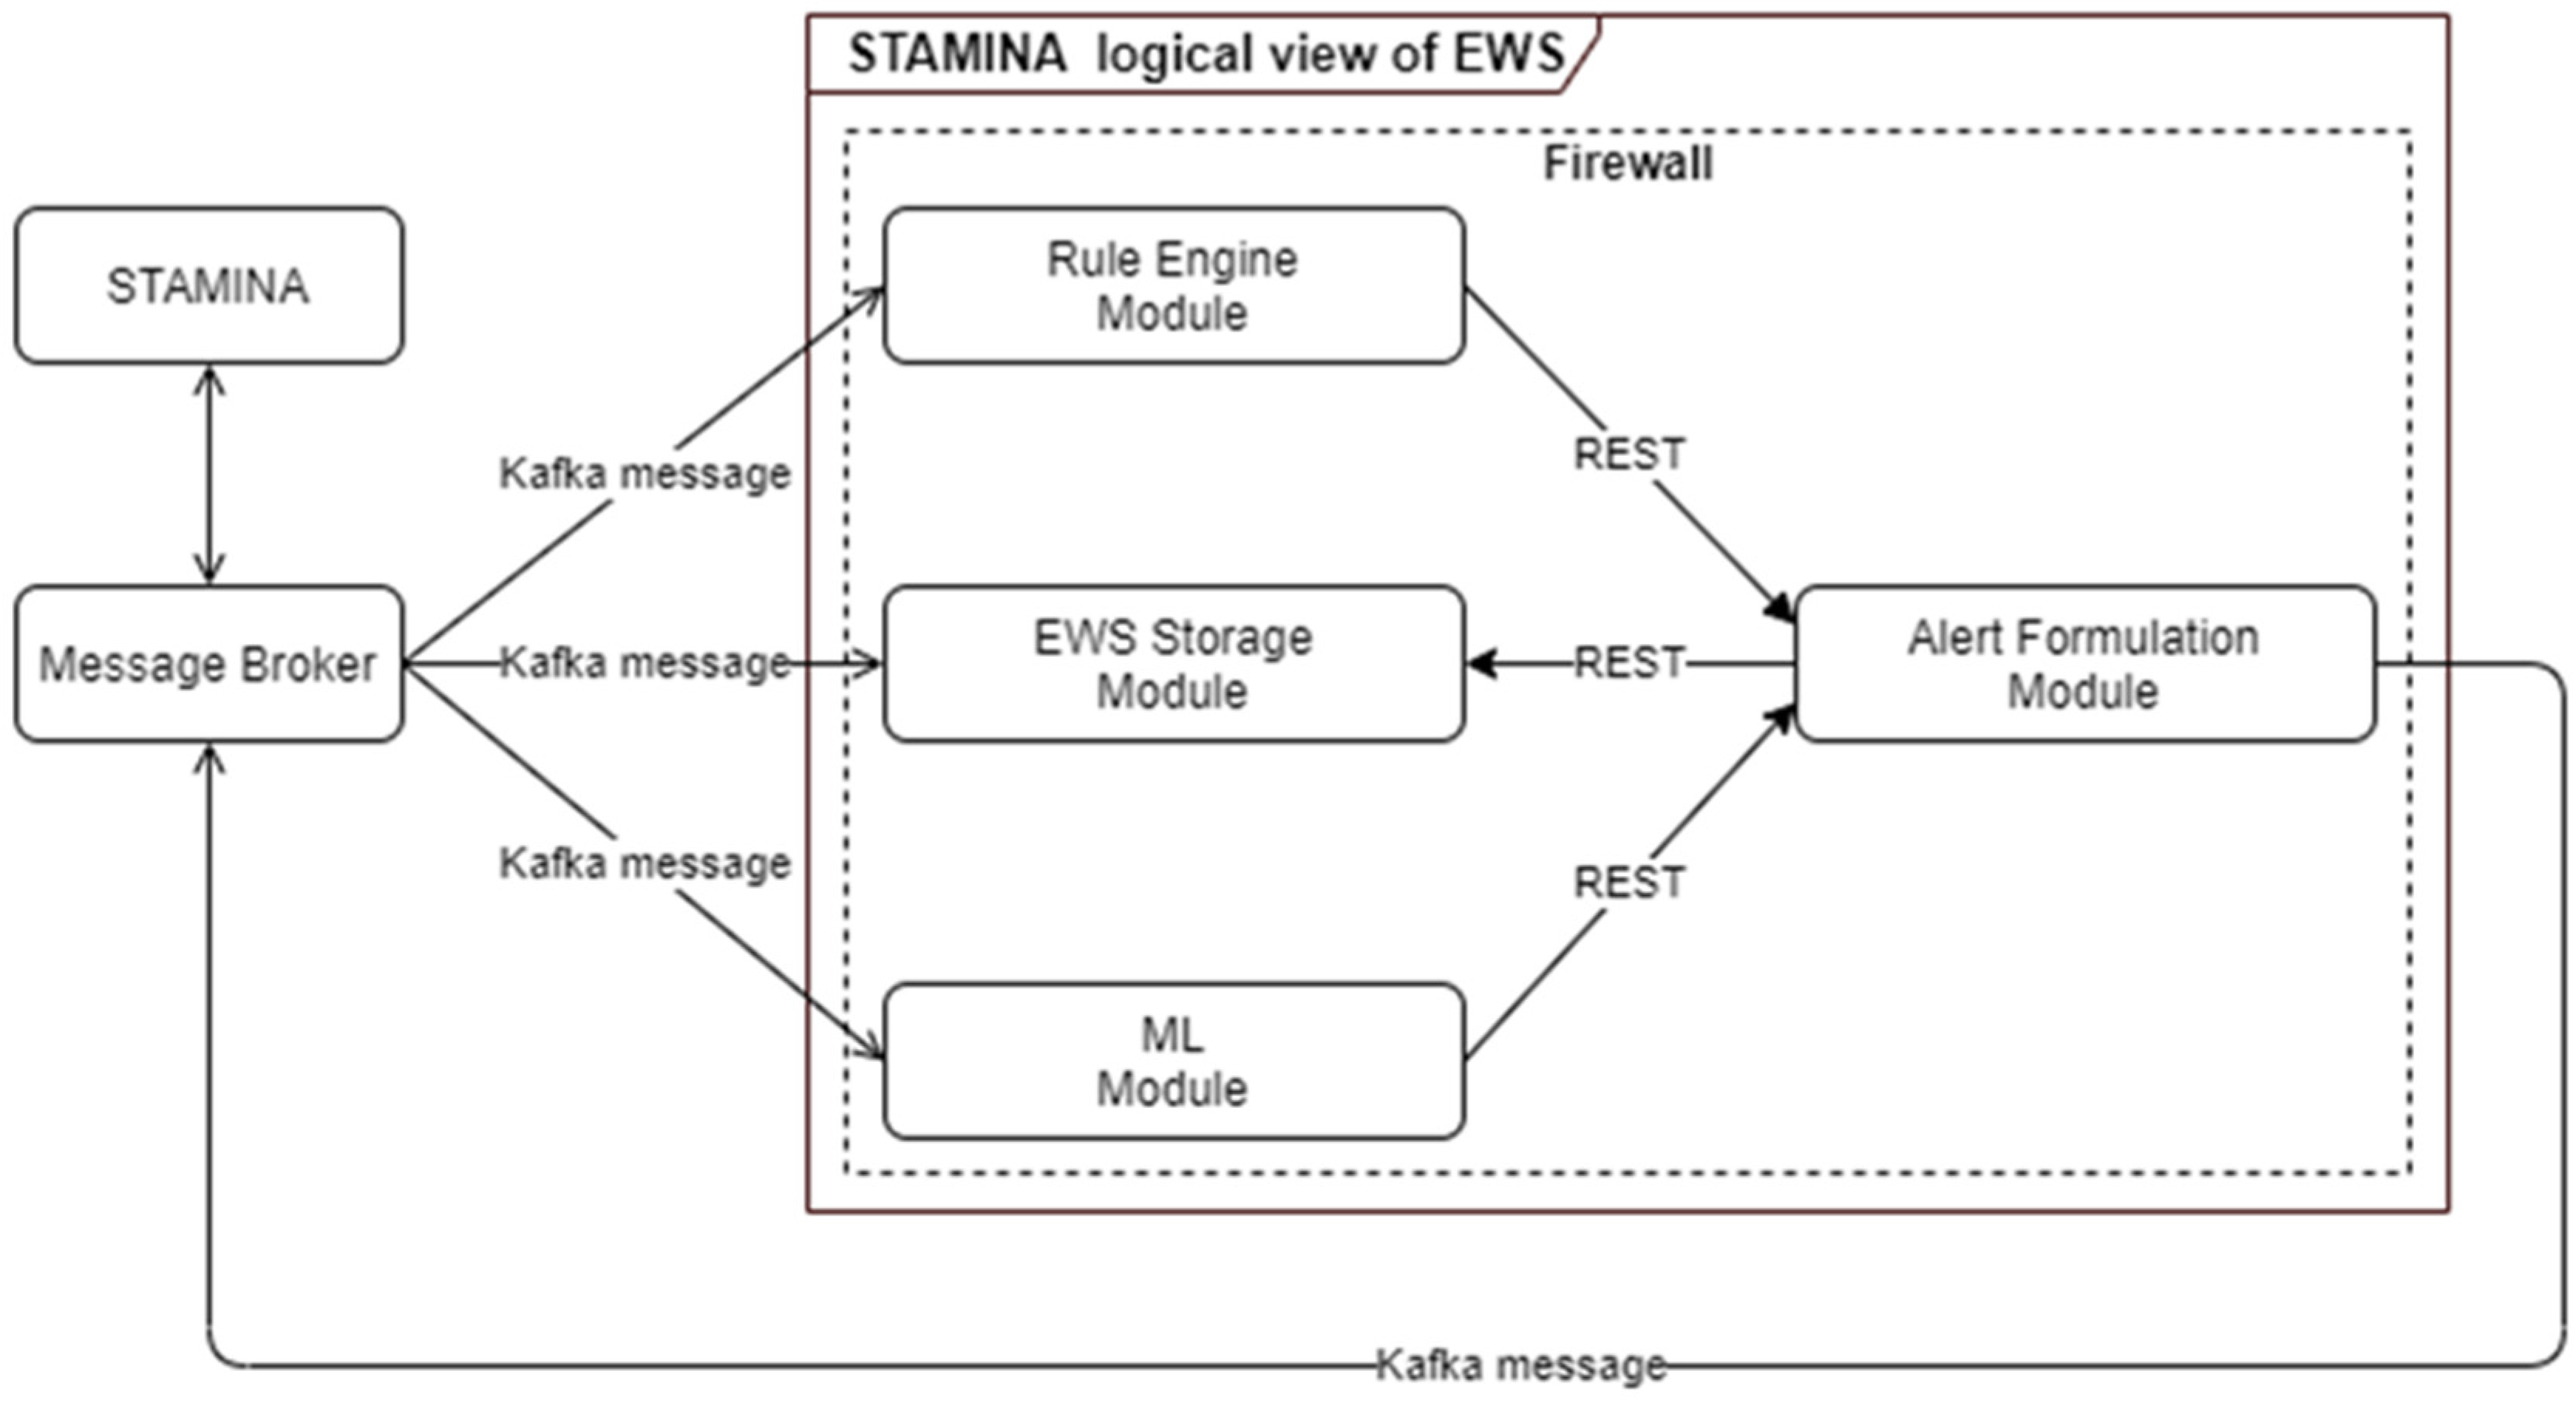
4.3.9. Machine-Learning Early Warning System

The early warning system is responsible for producing alerts and warnings of a critical situation based on received data inputs from multiple tools. Rule Engine and Machine Learning components are the modules responsible for analyzing the received incoming data in order to apply pre-defined rules or identify alerting patterns. These analysis results are forwarded to the alert-formulation component so that alerts and warnings can be transformed to the appropriate format in order to be consumed by other tools and interfaces (Figure 9). The main scope of the ML-based EWS are:
  • To create alerts and warnings so that end users are informed in case of potential outbreaks, taking into consideration certain rules and patterns based on ML models;
  • To identify needs regarding material or human resources;
  • To monitor and assist in the validation of continued effectiveness of policies and measures.
To achieve the aforementioned goals, we exploit deep-machine-learning methods to solve various relevant regression problems. The models predict new cases per million and new deaths per million for the next seven days, as well as intensive care unit (ICU) patients and hospitalized (HOSP) patients for the next seven days. Taking into account the non-linearity and time-sequence of the dataset, we used a 1D Convolutional with Long Short-Term 41 Memory (Conv1D-LSTM) regressor, a Gated Recurrent Units (GRU) regressor, a Long Short-Term 42 Memory (LSTM) regressor and a Recurrent Neural Network (SimpleRNN) regressor. The model has been trained on open datasets in a total of 12 European Union countries over the time period of 1 January 2020 to 15 September 2021. The goal is to be able to predict the new number of cases, hospitalizations and deaths caused by multiple pathogens. Integration with STAMINA interfaces allows end-users to input interventions, and based on the current epidemiological image, the early warning system quantifies these interventions in order to optimally compose action plans.

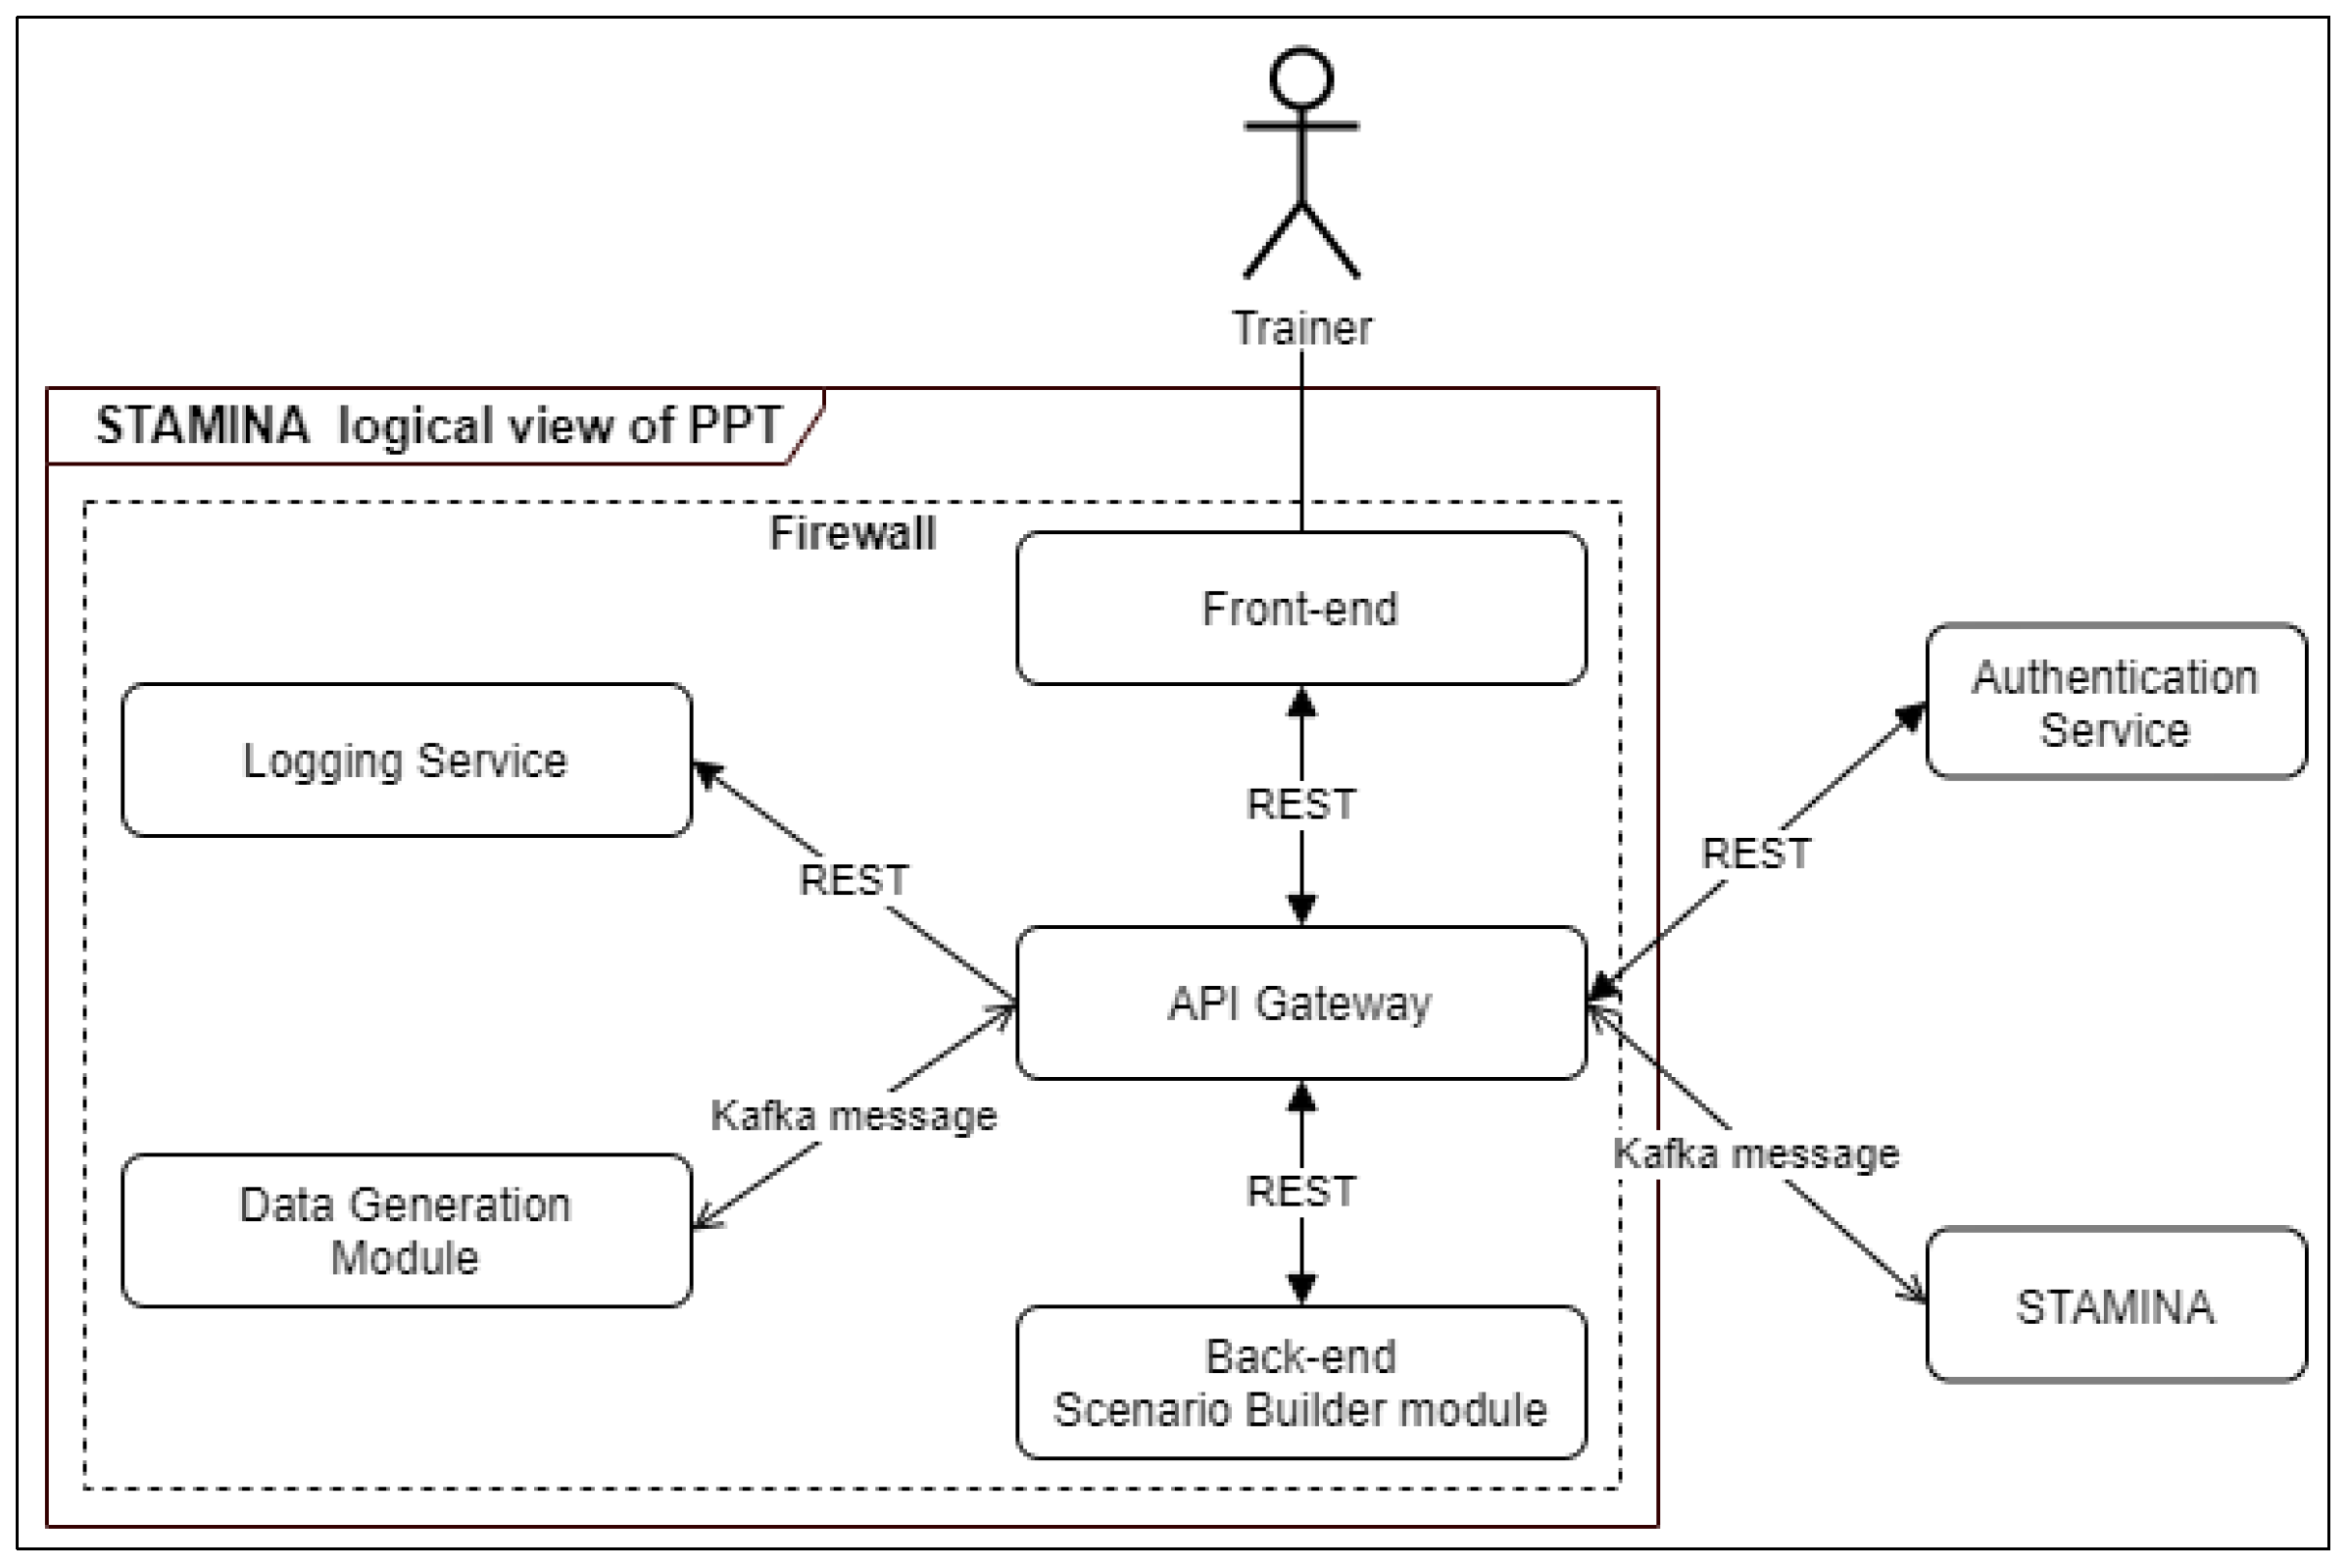
4.4. Execution of Training Exercises

Due to the complexity of organizing and performing preparedness pandemic training exercises, new methodologies and tools should be adapted. Until now, the ways of managing and orchestrating this kind of exercise have been inadequate, and this leads to not using the available resources to their full potential and also to not using the modern technological achievements of our time. The Preparedness Pandemic Training (PPT) tool comes as a powerful solution to the aforementioned drawbacks while fully digitalizing the whole procedure. The PPT tool is a training scenario builder and execution tool which provides, among other functionalities, the ability for exercise planners and participants to collaborate at national and international levels. The trainer, after having been authenticated into the system, is able to create pandemic scenarios and fill their scripts with events, messages and other elements that will provide information and message exchange between the exercise participants. Some of the features of PPT are:
  • User authentication;
  • View of all saved scenarios;
  • Creation of new scenario and/or modification of an existing one;
  • Add-in script;
  • Events that represent real-life situations;
  • Messages that can be exchanged in real-time between participants;
  • Social media posts;
  • Data sources that can trigger a simulation or alert;
  • Multilingual menu capability;
  • Declaration of a scenario as private;
  • Sharing of a scenario with specific user (s) and/or group (s);
  • Map visualization;
  • Scenario visualization as a timeline;
  • Scenario execution.
The PPT tool communicates with other tools of STAMINA. While a scenario is being executed, the tool sends data to other tools. The architecture of the tool is presented in Figure 10. The PPT tool has been designed and developed by applying a microservices architecture. API Gateway is responsible for all communications, internal and external, and acts as a proxy, aggregating and caching data. It manages all microservices and can handle horizontal expansion of the system in case of large resources requirements. Additionally, it acts as a single point of entry for the whole system, restricting the access to any of the internal services to unauthorized entities. Additionally, by being directly connected to the authentication service, it supports the user authentication of the system. Apart from that, it supports the mixing of different communication protocols, which in our case are the REST-based API and the Kafka Message Broker messaging. Every service of the PPT tool except the front-end uses its own database.
The trainer has access to the tool via a webpage using his/her credentials. The credentials are transferred to the Authentication Service via API Gateway, and if the username exists in the database and the password is correct, a token is returned with which the front-end authenticates with the back-end service. The logic and the database for storing scenarios are part of the back-end module. The logging service is responsible for storing every log message of all the modules of the PPT tool and retrieving them upon request. The Data Generator service will be used to create simulated data such as a set of multiple tweets to be sent to WSMA or a number of variables reporting daily numbers of performed PCR tests, number of confirmed cases, or other demographical information (e.g., age, sex, region).

4.5. Additional Information from Point-of-Care Points

The COVID-19 pandemic revealed the need for development of point-of-care tests (POCTs) during an outbreak of an infectious disease. The above represent a pressure point to advance and accelerate the development of detection tools that are portable, compact and robust, dedicated to new pathogens. POCT tools that are currently exploited within this platform include a variety of cutting-edge molecular biology techniques, ranging from qcLAMP assays (Colorimetric, Droplet microfluidics) and classic PCR to the leading-edge CRISPR-Cas-based technologies (SHERLOCK and DETECTR). The above are focused on the following pathogens: Measles, West Nile Virus, Influenza A (H1N1), SARS-CoV-2 and Escherichia coli (ESBL). These POCT devices facilitate fast detection of pathogens outside of clinical or diagnostic laboratories, scaling the current capacity of an early response during outbreaks to detect contaminated individuals or environmental resources.
Moreover, wearable sensors are also integrated into the platform. SmarKo is a customizable, smart, wrist-worn sensor device produced by MCS Datalabs, which is equipped with diverse sensors, supporting various groups of users. It monitors vital data (such as heart rate, oxygen saturation), environmental data (such as air pressure, humidity, room or outdoor temperature) and motion data from a nine-axis inertia measurement unit (IMU). GNSS enables geo-location for distance measurement. The wrist-worn devices by MCS are configurable and customizable, and can meet the defined data and security requirements. Different human interfaces can be included if needed (display and haptic alarm).
In addition, data from third-party devices (as long as these devices are compatible with BLE protocol, such as fitness trackers) can be recorded, and along with the data from the MCS wearable device, will be directly transmitted to the user’s smartphone application (SmarKo app).

4.6. External Interfaces

The platform addresses the needs of multiple healthcare professionals with different responsibilities and levels of command. As such, the use of a single user interface would have been unpractical. However, we aim at delivering a single product, thus we want to minimize as much as possible the presence of different interfaces. After careful consideration of user needs, the following interfaces will be implemented:
  • The EMT will be the main user interface and will provide the common operational picture in a country-wide manner. The focus lies on map visualizations of georeferenced data. However, other types of visualizations such as graphs and tables are available. Moreover, messages can be included as a type of visualization, for which there is multilingual support, allowing for a more robust cooperation. The EMT is built to support decision-making by integrating and displaying the most recent and relevant data from diverse sources, such as sensor data, in a birds-eye view of a situation. Next to that, the overview can be complemented with basic data analysis functionalities for making short-term predictions and monitoring resources for incoming data. This is achieved by the ability to set and configure different threshold limits for parameters of interest. The tool then automatically monitors the said thresholds and raises the alarm once these thresholds are violated.
  • ENGAGE will also provide an interface as it will be part of the common operational picture tool. However, it mainly targets the needs of hospital workers and first responders, and it will provide information in a more geographically narrow aspect. ENGAGE is a software suite that integrates into a single user interface all the functionalities needed by public/private safety agencies to handle their everyday procedures and respond to emergency situations. Due to its modular architecture, ENGAGE is highly configurable and extendable, assuring that it will provide the appropriate subset of functionalities that are required for its intended use.
  • The CMT will provide an interface that supports senior political personnel and decision makers in the strategic tasks of sense-making, decision-making, resource management and coordination. CrisisHub’s purpose is to assist the end-user in translating operational data (such as scarcity of resources) into a strategically relevant situation reporting and strategic decision-making agenda (including advice) that supports the strategic level (e.g., regional or national health authorities) in their decision-making efforts.
  • The WSMA will provide an interface that will allow users to alter the parameters for capturing web data and will provide additional information about the analysis of web resources. This interface will be implemented in order to provide the detailed information of WSMA, while a summary of this analysis will be provided also by EMT. This decision is taken because the incorporation of the diverse information provided by WSMA adversely affects user friendliness and usability.
  • The POCT interface will address the needs of first responders and on-site doctors. It will not be used to visualize data from other tools, but rather to provide the ability to quickly input information about POCT devices and test site diagnosis in the system.

5. Conclusions and Future Steps

In this paper, we present the first version of the STAMINA system design. We present the entire system from a holistic perspective, as well as each individual module and the interconnections between the envisioned modules. Currently, the system is in the phase of integration testing before testing in close-to-real-life environments from field experts in multiple countries.
Twelve different trial demonstrations have been planned. Eleven of them will take place with a regional or national scope in an equal number of different countries covering a wide geographical range, including all European areas (north, south, east, and west) as well as countries from northern Africa (Tynisia) and west Asia (Turkey). Moreover, a cross-border trial will take place that includes the exchange of data and information from multiple countries that will assess the platform’s performance in decision-support actions spanning multiple different jurisdictions, and different legal and administrative structures.
Currently, introducing modern solutions into existing pandemic and crisis management processes often proves to be rather difficult due to time and resource constraints, but also due to the fact that no defined method that would make this task easier is defined across Europe. Within the EU-funded DRIVER+ project, a method has been defined which aims to solve exactly this issue, and it is embodied in the trial guidance methodology (TGM). This methodology further describes a trial as a means to overcome this issue, taking into account time and resource constraints. A trial is an organized and systematic process of searching for innovation in pandemic and crisis management. As part of the STAMINA project, the methodology has been adapted to be applicable in the field of pandemic management and will be used to organize several such trials to validate the applicability of the tools proposed in this paper, to help address gaps in pandemic management faced by practitioners in the field. The trials will include different scenarios, and will focus on the tools from this toolset that are relevant to each scenario to try to fill in the gaps selected, and will validate the tools individually, as well as the connections between the selected tools. The results of all trials will be examined to ultimately determine the extent to which the proposed toolkit provides support in the area of pandemic management.
All the trials are set to be finalized by September 2022. However, some conclusions can be derived even from this design phase. The need for data-driven decisions in pandemic response is evident, however for this to be of use, there is a need for prediction systems in multiple temporal scales, from long-range strategic predictions that can be achieved through intelligent simulation/predictive models to short-term predictions that can assist during the detection/response phase. Moreover, the monolithic approach of simply forecasting the spatiotemporal evolution of an outbreak does not suffice. The field needs additional insights that will facilitate the management of resources, communication and user interfaces that will assist responders in planning and response by enhancing their situational awareness, as well as the analysis of ancillary data sources, such as social media data, that will provide additional qualitative information to help in planning and enacting strategies for pandemic response.

Author Contributions

N.B., M.K., N.D. and A.D. (Anastasios Doulamis) were the main authors of the paper, integrated authors’ contributions and were responsible for procuring the final document. D.K. and M.B. provided quality control on the document writing and contributed with A.D. (Agapi Davradou) to the introduction and previous work sections. N.B. and M.K. also were the main authors of the overall architecture and conclusions sections. A.V., A.F., M.P. and A.K. were responsible for the EWS, AIR and PPT sections, S.T., T.A. and A.M.D. contributed in the DMHT and IPT sections. I.B. and K.P. contributed in the WSMA sections L.P., L.V., P.K. and D.I., C.v.d.H. contributed in the External Interfaces section. Finally. A.A., D.G., K.M., A.S., S.J.E.T. and L.R. contributed in the CHARM, GLEAM, BIMS sections. All authors have read and agreed to the published version of the manuscript.

Funding

The paper presented is based on research undertaken as part of the European Commission-funded project STAMINA (Grant Agreement 883441).

Institutional Review Board Statement

Not applicable.

Informed Consent Statement

Not applicable.

Data Availability Statement

All data driven applications used the our world in data COVID-19 datasets, complimented by proprietary datasets share by the STAMINA consortium.

Conflicts of Interest

The authors declare no conflict of interest.

References

  1. Hadfield, J.; Megill, C.; Bell, S.M.; Huddleston, J.; Potter, B.; Callender, C.; Sagulenko, P.; Bedford, T.; Neher, R.A. Nextstrain: Real-time tracking of pathogen evolution. Bioinformatics 2018, 34, 4121–4123. [Google Scholar] [CrossRef] [PubMed]
  2. Mercatelli, D.; Triboli, L.; Fornasari, E.; Ray, F.; Giorgi, F.M. Coronapp: A web application to annotate and monitor SARS-CoV-2 mutations. J. Med. Virol. 2021, 93, 3238–3245. [Google Scholar] [CrossRef] [PubMed]
  3. Shu, Y.; McCauley, J. GISAID: Global initiative on sharing all influenza data–from vision to reality. Eurosurveillance 2017, 22, 30494. [Google Scholar] [CrossRef] [PubMed] [Green Version]
  4. Sandhu, R.; Gill, H.K.; Sood, S. Smart monitoring and controlling of Pandemic Influenza A (H1N1) using Social Network Analysis and cloud computing. J. Comput. Sci. 2016, 12, 11–22. [Google Scholar] [CrossRef] [PubMed]
  5. Neher, R.; Bedford, T. Nextflu: Real-time tracking of seasonal influenza virus evolution in humans. Bioinformatics 2015, 31, 3546–3548. [Google Scholar] [CrossRef] [PubMed]
  6. Tradigo, G.; Vizza, P.; Gabriele, G.; Mazzitelli, M.; Torti, C.; Prosperi, M.; Guzzi, P.H.; Veltri, P. On the use of clinical based infection data for pandemic case studies. In Proceedings of the 2020 IEEE International Conference on Bioinformatics and Biomedicine (BIBM), Seoul, Korea, 16–19 December 2020. [Google Scholar]
  7. Li, E.Y.; Tung, C.-Y.; Chang, S.-H. The wisdom of crowds in action: Forecasting epidemic diseases with a web-based prediction market system. Int. J. Med. Inform. 2016, 92, 35–43. [Google Scholar] [CrossRef] [PubMed]
  8. Abbasimehr, H.; Paki, R.; Bahrini, A. A novel approach based on combining deep learning models with statistical methods for COVID-19 time series forecasting. Neural Comput. Appl. 2021, 34, 3135–3149. [Google Scholar] [CrossRef] [PubMed]
  9. Rauf, H.T.; Lali, M.I.U.; Khan, M.A.; Kadry, S.; Alolaiyan, H.; Razaq, A.; Irfan, R. Time series forecasting of COVID-19 transmission in Asia Pacific countries using deep neural networks. Pers. Ubiquitous Comput. 2021, 1–18. [Google Scholar] [CrossRef] [PubMed]
  10. Ayoobi, N.; Sharifrazi, D.; Alizadehsani, R.; Shoeibi, A.; Gorriz, J.M.; Moosaei, H.; Khosravi, A.; Nahavandi, S.; Chofreh, A.G.; Goni, F.A.; et al. Time series forecasting of new cases and new deaths rate for COVID-19 using deep learning methods. Results Phys. 2021, 27, 104495. [Google Scholar] [CrossRef] [PubMed]
  11. Bodapati, S.; Bandarupally, H.; Trupthi, M. COVID-19 Time Series Forecasting of Daily Cases, Deaths Caused and Recovered Cases using Long Short Term Memory Networks. In Proceedings of the 2020 IEEE 5th International Conference on Computing Communication and Automation (ICCCA), Greater Noida, India, 30–31 October 2020; pp. 525–530. [Google Scholar] [CrossRef]
  12. Ketu, S.; Mishra, P.K. India perspective: CNN-LSTM hybrid deep learning model-based COVID-19 prediction and current status of medical resource availability. Soft Comput. 2021, 26, 645–664. [Google Scholar] [CrossRef] [PubMed]
  13. Borges, V.; Pinheiro, M.; Pechirra, P.; Guiomar, R.; Gomes, J.P. INSaFLU: An automated open web-based bioinformatics suite “from-reads” for influenza whole-genome-sequencing-based surveillance. Genome Med. 2018, 10, 46. [Google Scholar] [CrossRef] [PubMed] [Green Version]
  14. Argimón, S.; AbuDahab, K.; Goater, R.J.E.; Fedosejev, A.; Bhai, J.; Glasner, C.; Feil, E.J.; Holden, M.T.G.; Yeats, C.A.; Grundmann, H.; et al. Microreact: Visualizing and sharing data for genomic epidemiology and phylogeography. Microb. Genom. 2016, 2, e000093. [Google Scholar] [CrossRef] [PubMed] [Green Version]
  15. Singer, J.B.; Thomson, E.C.; McLauchlan, J.; Hughes, J.; Gifford, R.J. GLUE: A flexible software system for virus sequence data. BMC Bioinform. 2018, 19, 532. [Google Scholar] [CrossRef] [PubMed] [Green Version]
  16. Van den Broeck, W.; Gioannini, C.; Gonçalves, B.; Quaggiotto, M.; Colizza, V.; Vespignani, A. The GLEaMviz computational tool, a publicly available software to explore realistic epidemic spreading scenarios at the global scale. BMC Infect. Dis. 2011, 11, 37. [Google Scholar]
Figure 1. High-Level Architecture.
Technologies 10 00063 g001
Figure 2. STAMINA System Design—Training and Deployment.
Technologies 10 00063 g002
Figure 3. STAMINA preparedness phase and execution of a training exercise.
Technologies 10 00063 g003
Figure 4. STAMINA System Design—Detection/Response Phase.
Technologies 10 00063 g004
Figure 5. STAMINA Platform Recovery Phase.
Technologies 10 00063 g005
Figure 6. Data Management and Harmonization Tool: Data Flow.
Technologies 10 00063 g006
Figure 7. Architecture of the Information Protection and Secure Data Sharing Tool.
Technologies 10 00063 g007
Figure 8. PALMS Modules.
Technologies 10 00063 g008
Figure 9. ML-Based Early Warning System Architecture.
Technologies 10 00063 g009
Figure 10. PPT tool architecture diagram.
Technologies 10 00063 g010
Table 1. STAMINA Platform List of Components.
Component Component Acronym Brief Description
Web and Social Media Analytics tool WSMAIt monitors different types of content shared on social media and produces analytics and insights (Natural Language classification, Sentiment Analysis, descriptive statistics and indicators).
Point-Of-Care Tools InterfacePOCTIEnters results from POCT and SmartKo devices in the system.
Data Management and Harmonization DMHTIt aggregates various data sets, stores them, harmonizes them in a common schema and provides query mechanisms to other components to retrieve them.
Information Protection and Secure Data Sharing tool IPTIt provides a unified and efficient access-control policy management framework.
Preparedness Pandemic Training tool PPTIt provides the capability of creating realistic scenarios to perform exercises of preparedness.
Predictive Modelling Tool—Global Epidemic and Mobility model GLEAMGlobal epidemic and mobility model.
Predictive Model—Antimicrobial Resistance Model AIRIt is a Deep Neural Network (DNN) model used for predicting excess mortality due to antimicrobial resistance. Additionally, it incorporates patient’s contextual epidemiological and infectious information.
Predictive Modelling Tool FLEEIt is an agent-based modelling toolkit used for modelling the movements of refugees and internally displaced persons (IDPs).
Predictive Modelling Tool BIMSThe tool aims to simulate pandemic evolution at the regional level, considering population and car movements.
Predictive Modelling Tool—Physical Activity Lifelong Modelling and Simulation PALMSIt is an agent-based micro-simulation that predicts the lifelong physical activity behavior of individuals of a population and its effect on their quality of life. It is designed to perform policy-relevant cost-effectiveness analysis of cross-sectoral interventions that increase physical activity.
Predictive Modelling Tool—Flu and Coronavirus Simulator FACSIt models the transmission of COVID-19 (or other viruses as defined in the input) and simulates the COVID-19 outbreak in each region using computational disease dynamics at a local (e.g., city or borough) scale.
Predictive Modelling Tool—dynamiC Hospital wARd ManagementCHARMIt is a discrete-event simulation that models dynamic reconfiguration of hospital wards for bed-capacity planning facilitating continuation of normal ICU operations and COVID-19 outbreaks.
Early Warning System EWSEWS (with ML) will be responsible for processing real and simulated data from multiple sources to generate alerts, warnings.
Crisis-Management Tool CMTStrategic information management and decision-making support tool. It supports senior political leaders (and other actors on the strategic level) in pandemic response planning, sense-making, decision-making (agenda setting), task monitoring and resource monitoring. The tool supports collecting and organizing capacity and resource data from distributed providers. Data may be collected manually or via data exchange (API, etc.).
Emergency Map Tool EMTIt offers different visualizations for geo-referenced data.
ENGAGE IMS/CAD ENGAGEIt is an incident management and computer-aided dispatch system. In addition to the typical C2 functionalities, it supports hospital availability and patient-tracking functionalities
Publisher’s Note: MDPI stays neutral with regard to jurisdictional claims in published maps and institutional affiliations.

