Article

Medical Image Processing for Fully Integrated Subject Specific Whole Brain Mesh Generation

1
Department of Bioengineering, University of Illinois at Chicago, 851 S Morgan St Chicago, IL 60607, USA
2
Department of Neurosurgery, University of Illinois at Chicago, 912 S Wood St Chicago, IL 60607, USA
*
Author to whom correspondence should be addressed.
Submission received: 16 April 2015 / Revised: 14 May 2015 / Accepted: 15 May 2015 / Published: 21 May 2015
(This article belongs to the Special Issue Medical Imaging & Image Processing)

Abstract

:
Currently, anatomically consistent segmentation of vascular trees acquired with magnetic resonance imaging requires the use of multiple image processing steps, which, in turn, depend on manual intervention. In effect, segmentation of vascular trees from medical images is time consuming and error prone due to the tortuous geometry and weak signal in small blood vessels. To overcome errors and accelerate the image processing time, we introduce an automatic image processing pipeline for constructing subject specific computational meshes for entire cerebral vasculature, including segmentation of ancillary structures; the grey and white matter, cerebrospinal fluid space, skull, and scalp. To demonstrate the validity of the new pipeline, we segmented the entire intracranial compartment with special attention of the angioarchitecture from magnetic resonance imaging acquired for two healthy volunteers. The raw images were processed through our pipeline for automatic segmentation and mesh generation. Due to partial volume effect and finite resolution, the computational meshes intersect with each other at respective interfaces. To eliminate anatomically inconsistent overlap, we utilized morphological operations to separate the structures with a physiologically sound gap spaces. The resulting meshes exhibit anatomically correct spatial extent and relative positions without intersections. For validation, we computed critical biometrics of the angioarchitecture, the cortical surfaces, ventricular system, and cerebrospinal fluid (CSF) spaces and compared against literature values. Volumina and surface areas of the computational mesh were found to be in physiological ranges. In conclusion, we present an automatic image processing pipeline to automate the segmentation of the main intracranial compartments including a subject-specific vascular trees. These computational meshes can be used in 3D immersive visualization for diagnosis, surgery planning with haptics control in virtual reality. Subject-specific computational meshes are also a prerequisite for computer simulations of cerebral hemodynamics and the effects of traumatic brain injury.

1. Introduction

Medical imaging is widely used for visualizing the interior of the body non-invasively for clinical diagnosis [1,2,3,4]. The two most common imaging techniques are computed tomography (CT) and magnetic resonance imaging (MRI). CT uses ionizing radiation and measures the radiation attenuation which is proportional to the image intensity. Dense structures, such as bones, have high attenuation thus high intensity. Soft structures, such as the brain, have low attenuation and thus low intensity. MRI uses radio frequencies to resonate hydrogen atoms, and detects the difference of signal recovery under influence of designed pulse sequence. It shows contrast between soft tissues. The MR imaging protocol can be customized to adjust image intensity based on desired features, such as flow phenomenon. Both imaging techniques output gray scale intensity maps for distinguishing diseased and normal tissue.
In addition to clinical diagnosis, medical images are also used for constructing meshes for computational modeling in simulation studies, including hemodynamic studies [5,6,7,8], traumatic brain injury [9,10,11], and cerebrospinal fluid flow studies [12,13,14,15,16,17,18]. Simulations with anatomical meshes and computational modeling provide results for experiments that are not easily performed, such as in vivo human experiments. It also provides results within a short amount of time compared to hands on experiments. There also exists mesh-free techniques for simulation [19].
Anatomical meshes are a necessary source for surgical planning with haptics control in virtual reality [20,21,22,23]. By assigning different physical properties to individual mesh structures, one can emulate the impact upon contact to better understand the spatial and physical relationships of the anatomical structures. This allows surgeons to simulate and practice surgeries to better assess and adjust the procedures to reduce the risks involved in invasive surgery.
The meshes also allow better visualization of the anatomy using cutting edge immersive 3D displays [21,22,24]. Current visualization of medical images are confined to 2D display, which shows the image slices sequentially. Segmentation algorithms are used to extract certain features for surface and volumetric rendering. However, the interaction and display is still presented in a planar screen. By combining volume rendering of original medical images with displaying volumetric meshes in an immersive environment, one can explore and interact with the anatomical structures in a global sense to better understand and diagnose the diseased situation, such as intracranial stenosis.
Nevertheless, finite resolution of the medical images lead to uncertainty in identifying the structures for mesh construction. Intensity threshold algorithms may encounter difficulties in identifying voxels around interfaces between structures especially in imaging studies of the brain. Several groups use manual input on top of image processing to better identify the interfaces. Pons proposed Delaunay-based technique for generating watertight surface and volume meshes [25]. The Cerefy atlas [26,27,28] exhibits a detailed whole brain segmentation for one subject using various image processing algorithms with manual modification. Adams [29] uses image processing with manual modification to reconstruct the cerebrospinal fluid (CSF) space. Manual segmentation requires anatomical knowledge with extensive man hours (>20 h) and is highly operator dependent. To date, there exists no fully automatic image segmentation for the whole brain.
In this paper, we propose an automatic image processing pipeline that takes multiple MRI studies and generates computational meshes for major compartments of the brain, composed of grey and white matter, cerebrospinal fluid space, skull and scalp, and arteries and veins. We first describe the imaging protocols that were used to acquire the images. Then, discuss various image processing algorithms that were used to segment the different structures. In results, we demonstrate our proposed pipeline with image data for two volunteers. Finally, we analyze the mesh quality and limitations of the algorithms and discuss possible improvements.

2. Experimental Section

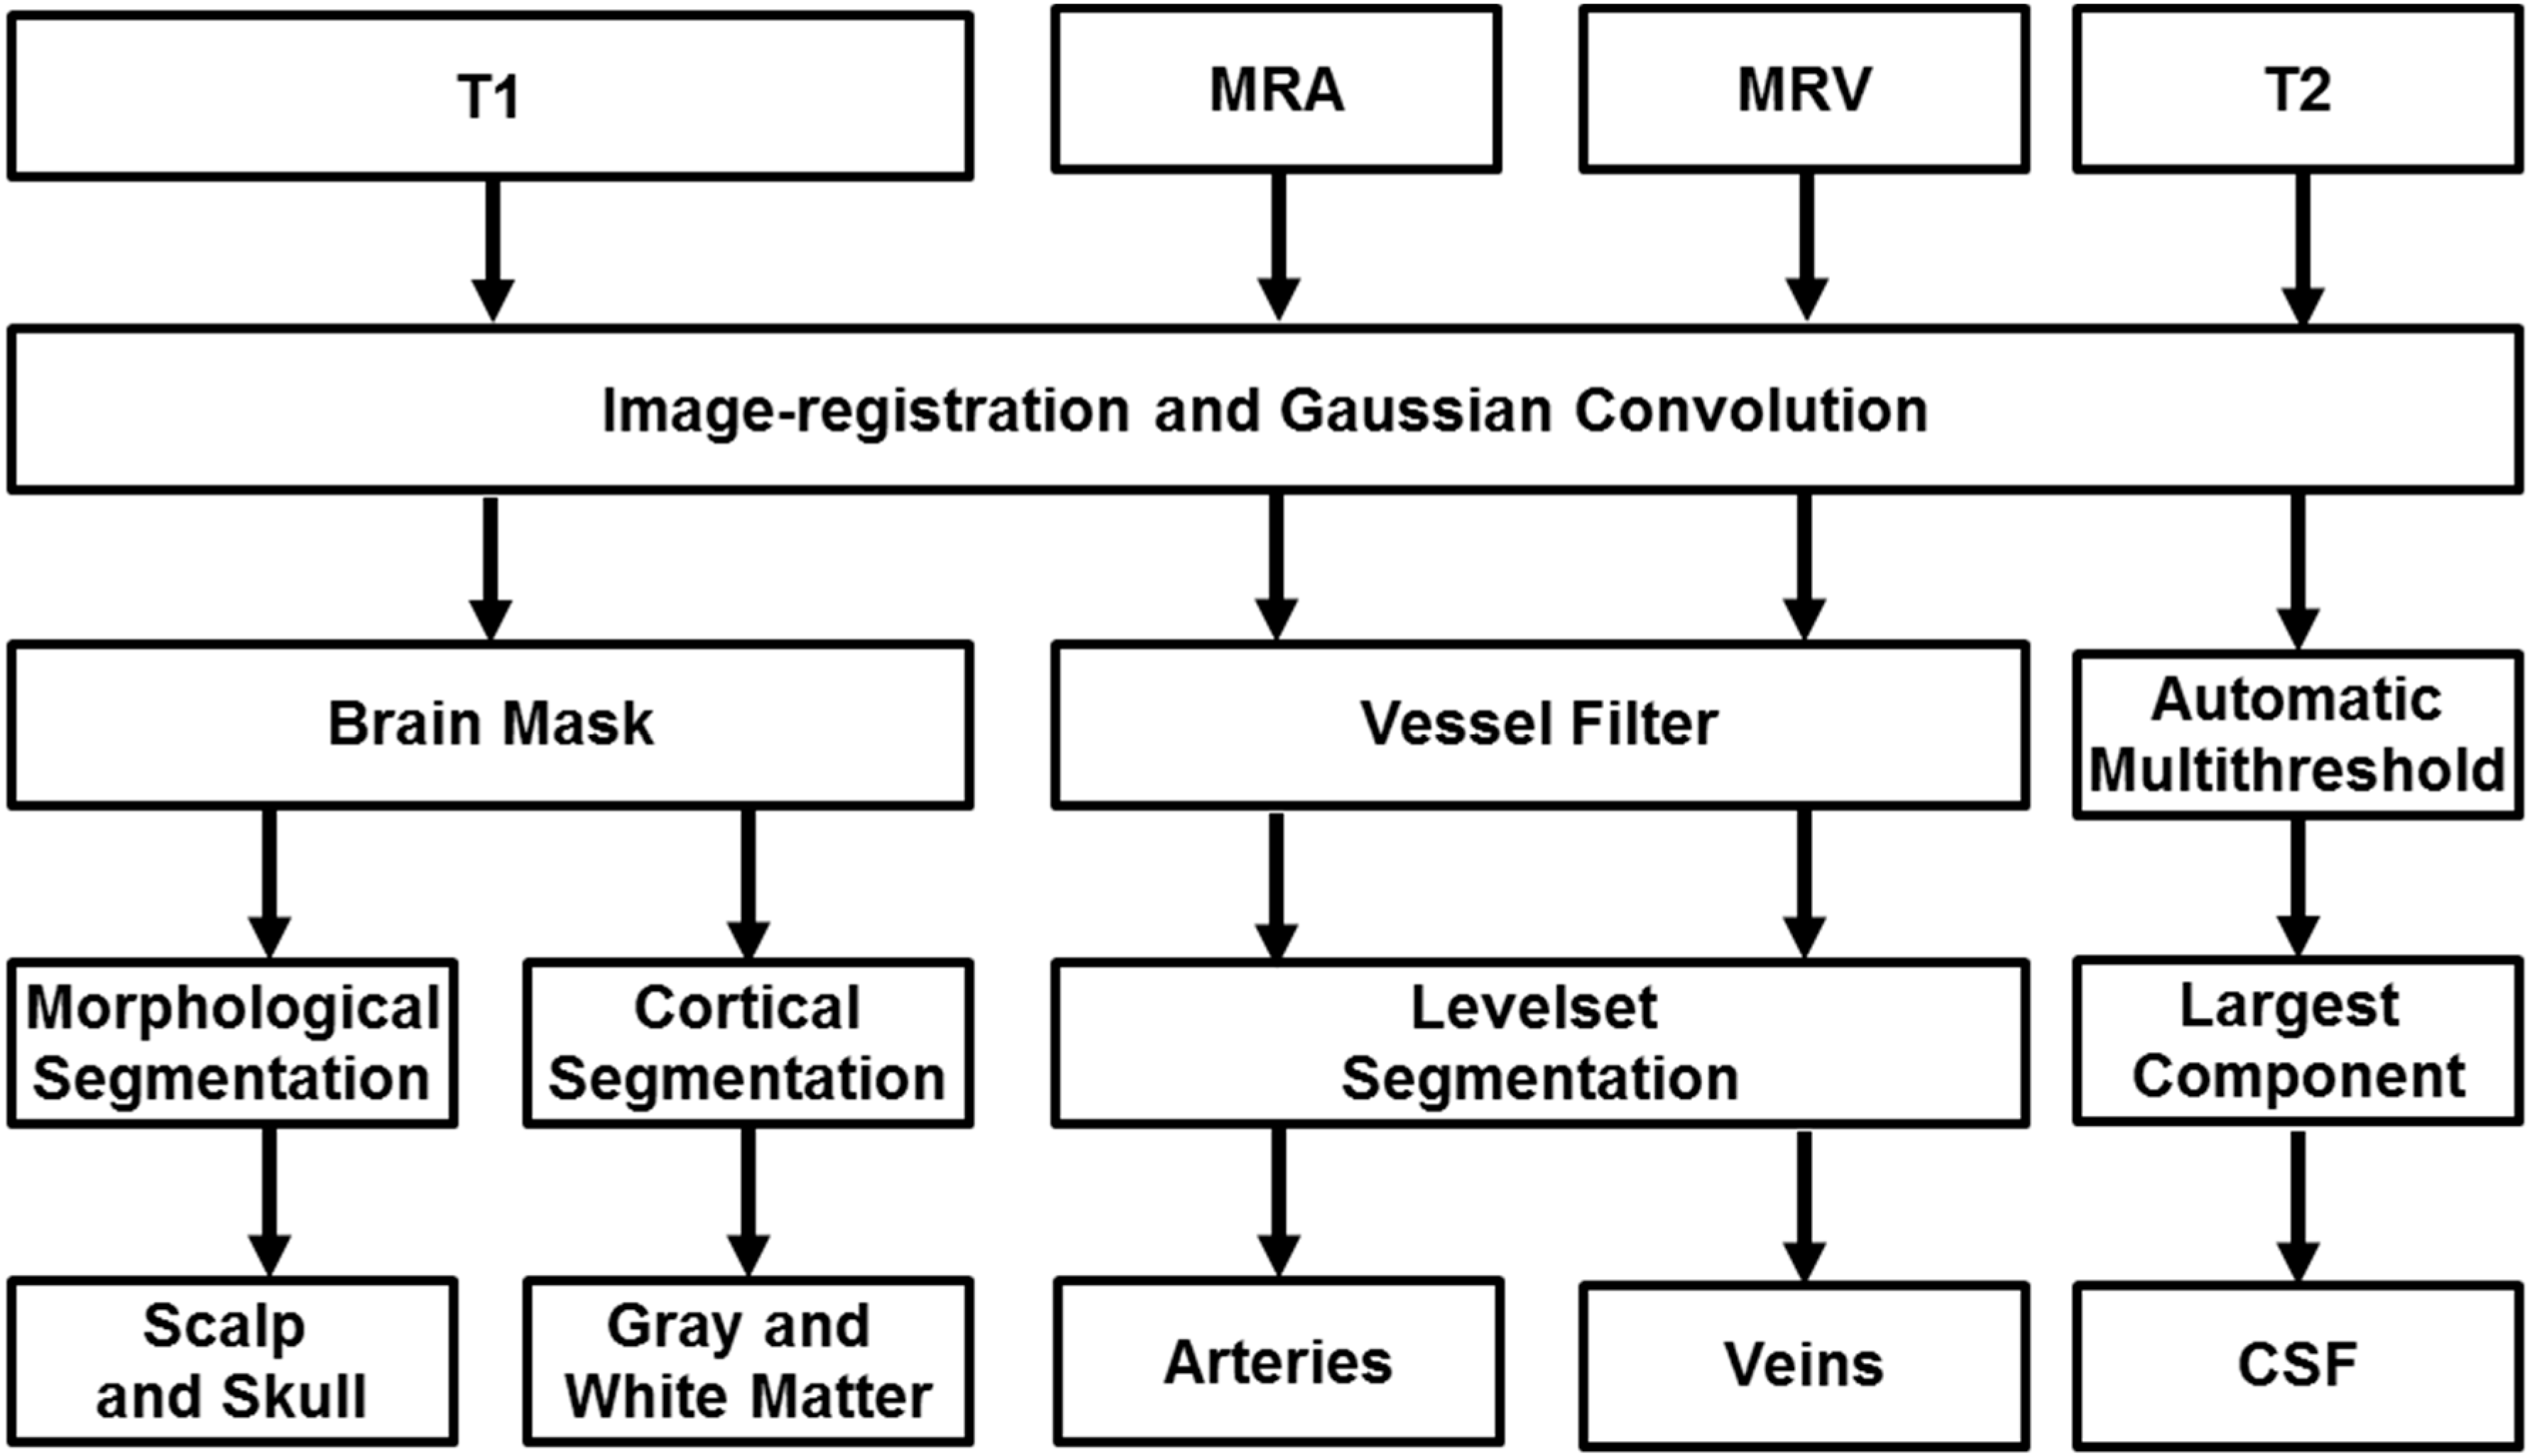
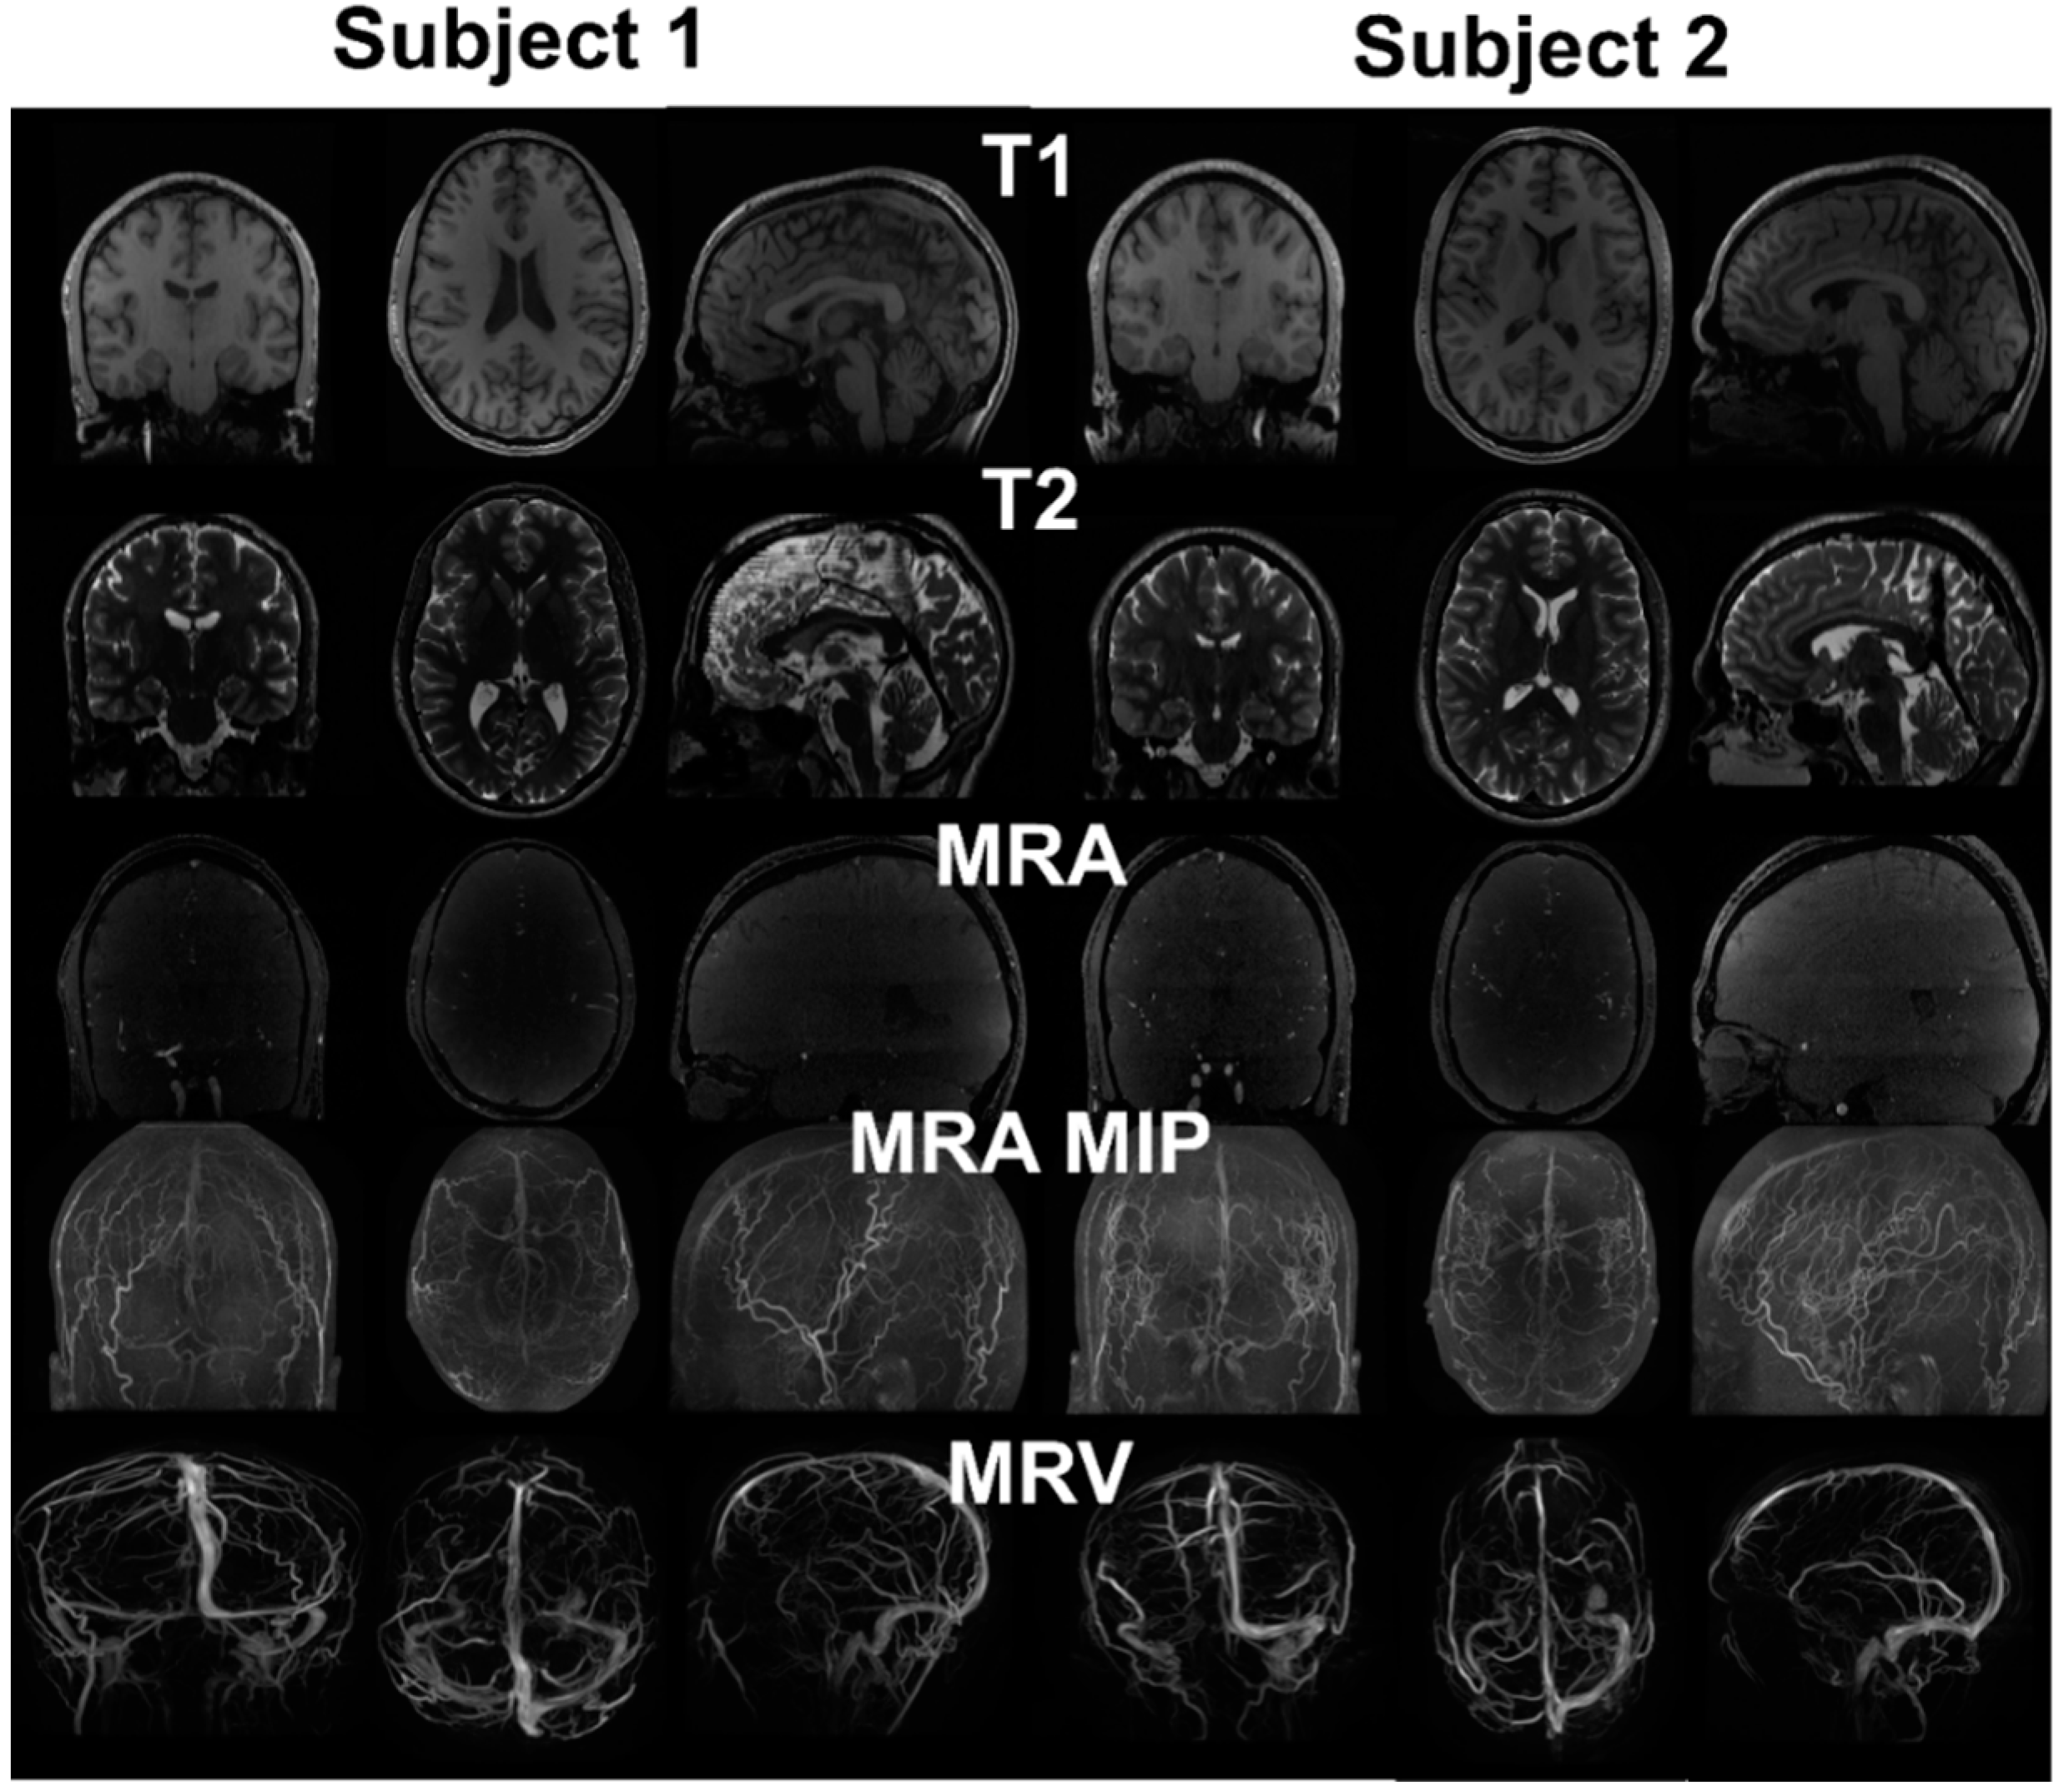
2.1. Image Acquisition

Two healthy human subjects with no known cerebral vascular disease were recruited and underwent MR imaging studies on a General Electric 3T MR750 scanner using a 32 channel phased array coil (Nova Medical, Inc., Wilmington, MA, USA). MR imaging studies were acquired under Institutional Review Board approval. For MR angiography (MRA), a 3D time-of-flight pulse sequence was used with the following parameters: TR = 26 ms, TE = 3.4 ms, NEX = 1, Flip Angle = 18°, acceleration factor = 2, number of slab = 4, magnetization transfer = on, matrix size = 512 × 512 × 408, voxel size = 0.39 × 0.39 × 0.3 mm3. MR venography (MRV) was performed using a 2D INHANCE pulse sequence with the imaging protocol: TR = 18.5 ms, TE = 5.65 ms, NEX = 1, Flip Angle = 8°, matrix size = 512 × 248 × 512, voxel size = 0.47 × 1.6 × 0.47 mm3. T1 was conducted with a 3D Axial SPGR sequence with the following parameters: TR = 13.4 ms, TE = 4.23 ms, NEX = 1, Echo Train Length = 1; Flip Angle = 25°, matrix size = 512 × 512 × 120, voxel size = 0.43 × 0.43 × 1.5 mm3. T2 was conducted with an Axial T2 Propeller sequence with the following parameters: TR = 1176 ms, TE = 100.04 ms, NEX = 2, Echo Train Length = 26; Flip Angle = 142°, matrix size = 512 × 512 × 100, voxel size = 0.43 × 0.43 × 1.5 mm3.
T1 provides contrast for the grey and white matter, skull, and scalp. T2 provided the cerebrospinal fluid space. The MRA and MRV captured major branches of the cerebral arterial and venous systems. This allows us to reconstruct the arterial and venous networks, grey and white matter surface, skull and scalp, and cerebrospinal fluid space for each subject. Automatic rigid coregistration of the MRA, MRV, T1, and T2 using one plus one evolutionary optimizer and Mattes mutual information metrics was performed to compensate for the different resolution settings and motion artifact. The image processing pipeline is illustrated in Figure 1 and discussed in details below.
Figure 1. Proposed image processing pipeline for automatic reconstruction of subject-specific computational meshes. All medical images were convolved with a Gaussian operator for removal of inhomogeneity. Magnetic resonance angiography and venography is filtered for removal of non-vascular tissues and enhancement of vascular tissues. The filtered image is processed with marching cubes algorithm for capturing Cartesian coordinates of the vessel wall and maximal inscribed sphere is used to determine the centerline and diameter of the vascular network. T1 images are inputted into Freesurfer for segmentation of the grey and white matter as binary image matrices along with an image mask of skull and scalp. The image mask is processed with morphological operations to delineate contiguous surfaces of skull and scalp. CSF is identified using automatic thresholding and subtraction of other identified tissues.
Technologies 03 00126 g001

2.2. Surface Segmentation

FreeSurfer was used to extract the brain from the T1 MR image set [30,31,32,33]. The brain extraction process removes the skull, scalp and neck from the dataset using a deformable model that is initialized in the center of the brain and then expands to the surface using a functional that weighs an expansion driving internal force and an image derived external force that slows the front at feature boundaries. The gray and white matter is classified by image thresholding and a priori geometric information.

2.3. Skull and Scalp Segmentation

Skull and scalp segmentation was performed using a procedure described by Dogdas [34]. The algorithm employs a series of morphological operations and masking using the segmented binary brain image and original T1 image in order to produce binary maps of the scalp and the skull. The algorithm segments the scalp first by using the brain mask from the T1 image with autothresholding for initial decision for distinguishing skull and scalp with a binary map. The binary map was then dilated and eroded to close the cavities. The largest connected region was then determined to be the outer border of the scalp. The skull segmentation was performed by first employing an automatic threshold for the skull for a binary map. This binary map was expanded by finding the union with a dilated brain mask. The largest component of the intersection between the expanded mask and the scalp was selected to be the base of the outer skull, which was dilated and eroded for closing the cavity. The inner skull was determined by first intersecting the original image with the outer skull followed by an automatic thresholding for a binary map. This binary map was then united with a dilated brain map for the base of the inner skull. The base was then eroded and dilated for the inner skull.

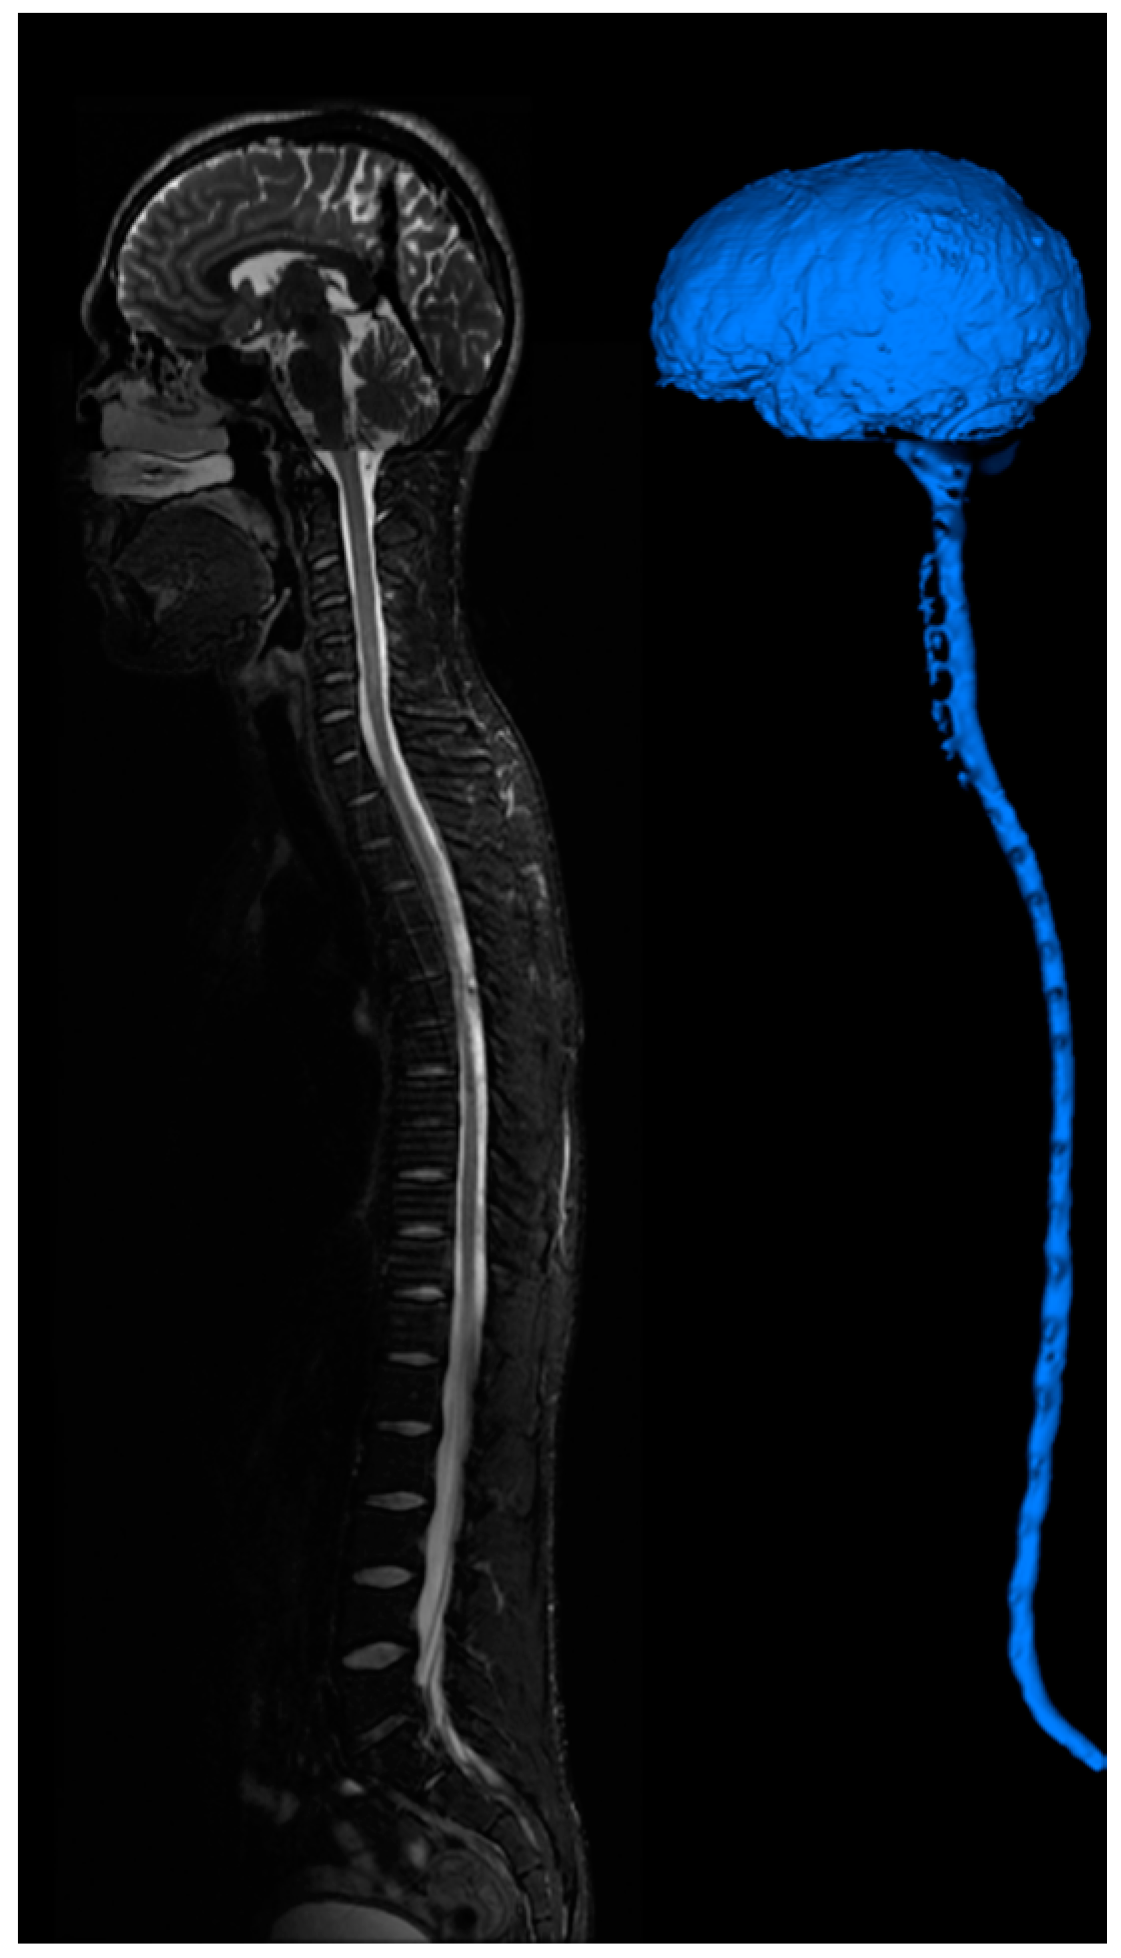
2.4. Cerebrospinal Fluid Space Segmentation

T2 images were used to delineate the cerebrospinal fluid space through the following steps. We use automatic multilevel threshold with Otsu’s method [35,36] to categorize the voxels in four levels. A closing operation was performed to fill holes and maintain connectivity. Finally we isolate the largest connected component as our cerebrospinal fluid space.

2.5. Mesh Generation

The binary images for the cerebrospinal fluid space, grey and white matter, skull and scalp, were processed with the marching cubes algorithm [37,38] to find the Cartesian coordinates of the surfaces. The outputs are triangular surface meshes.

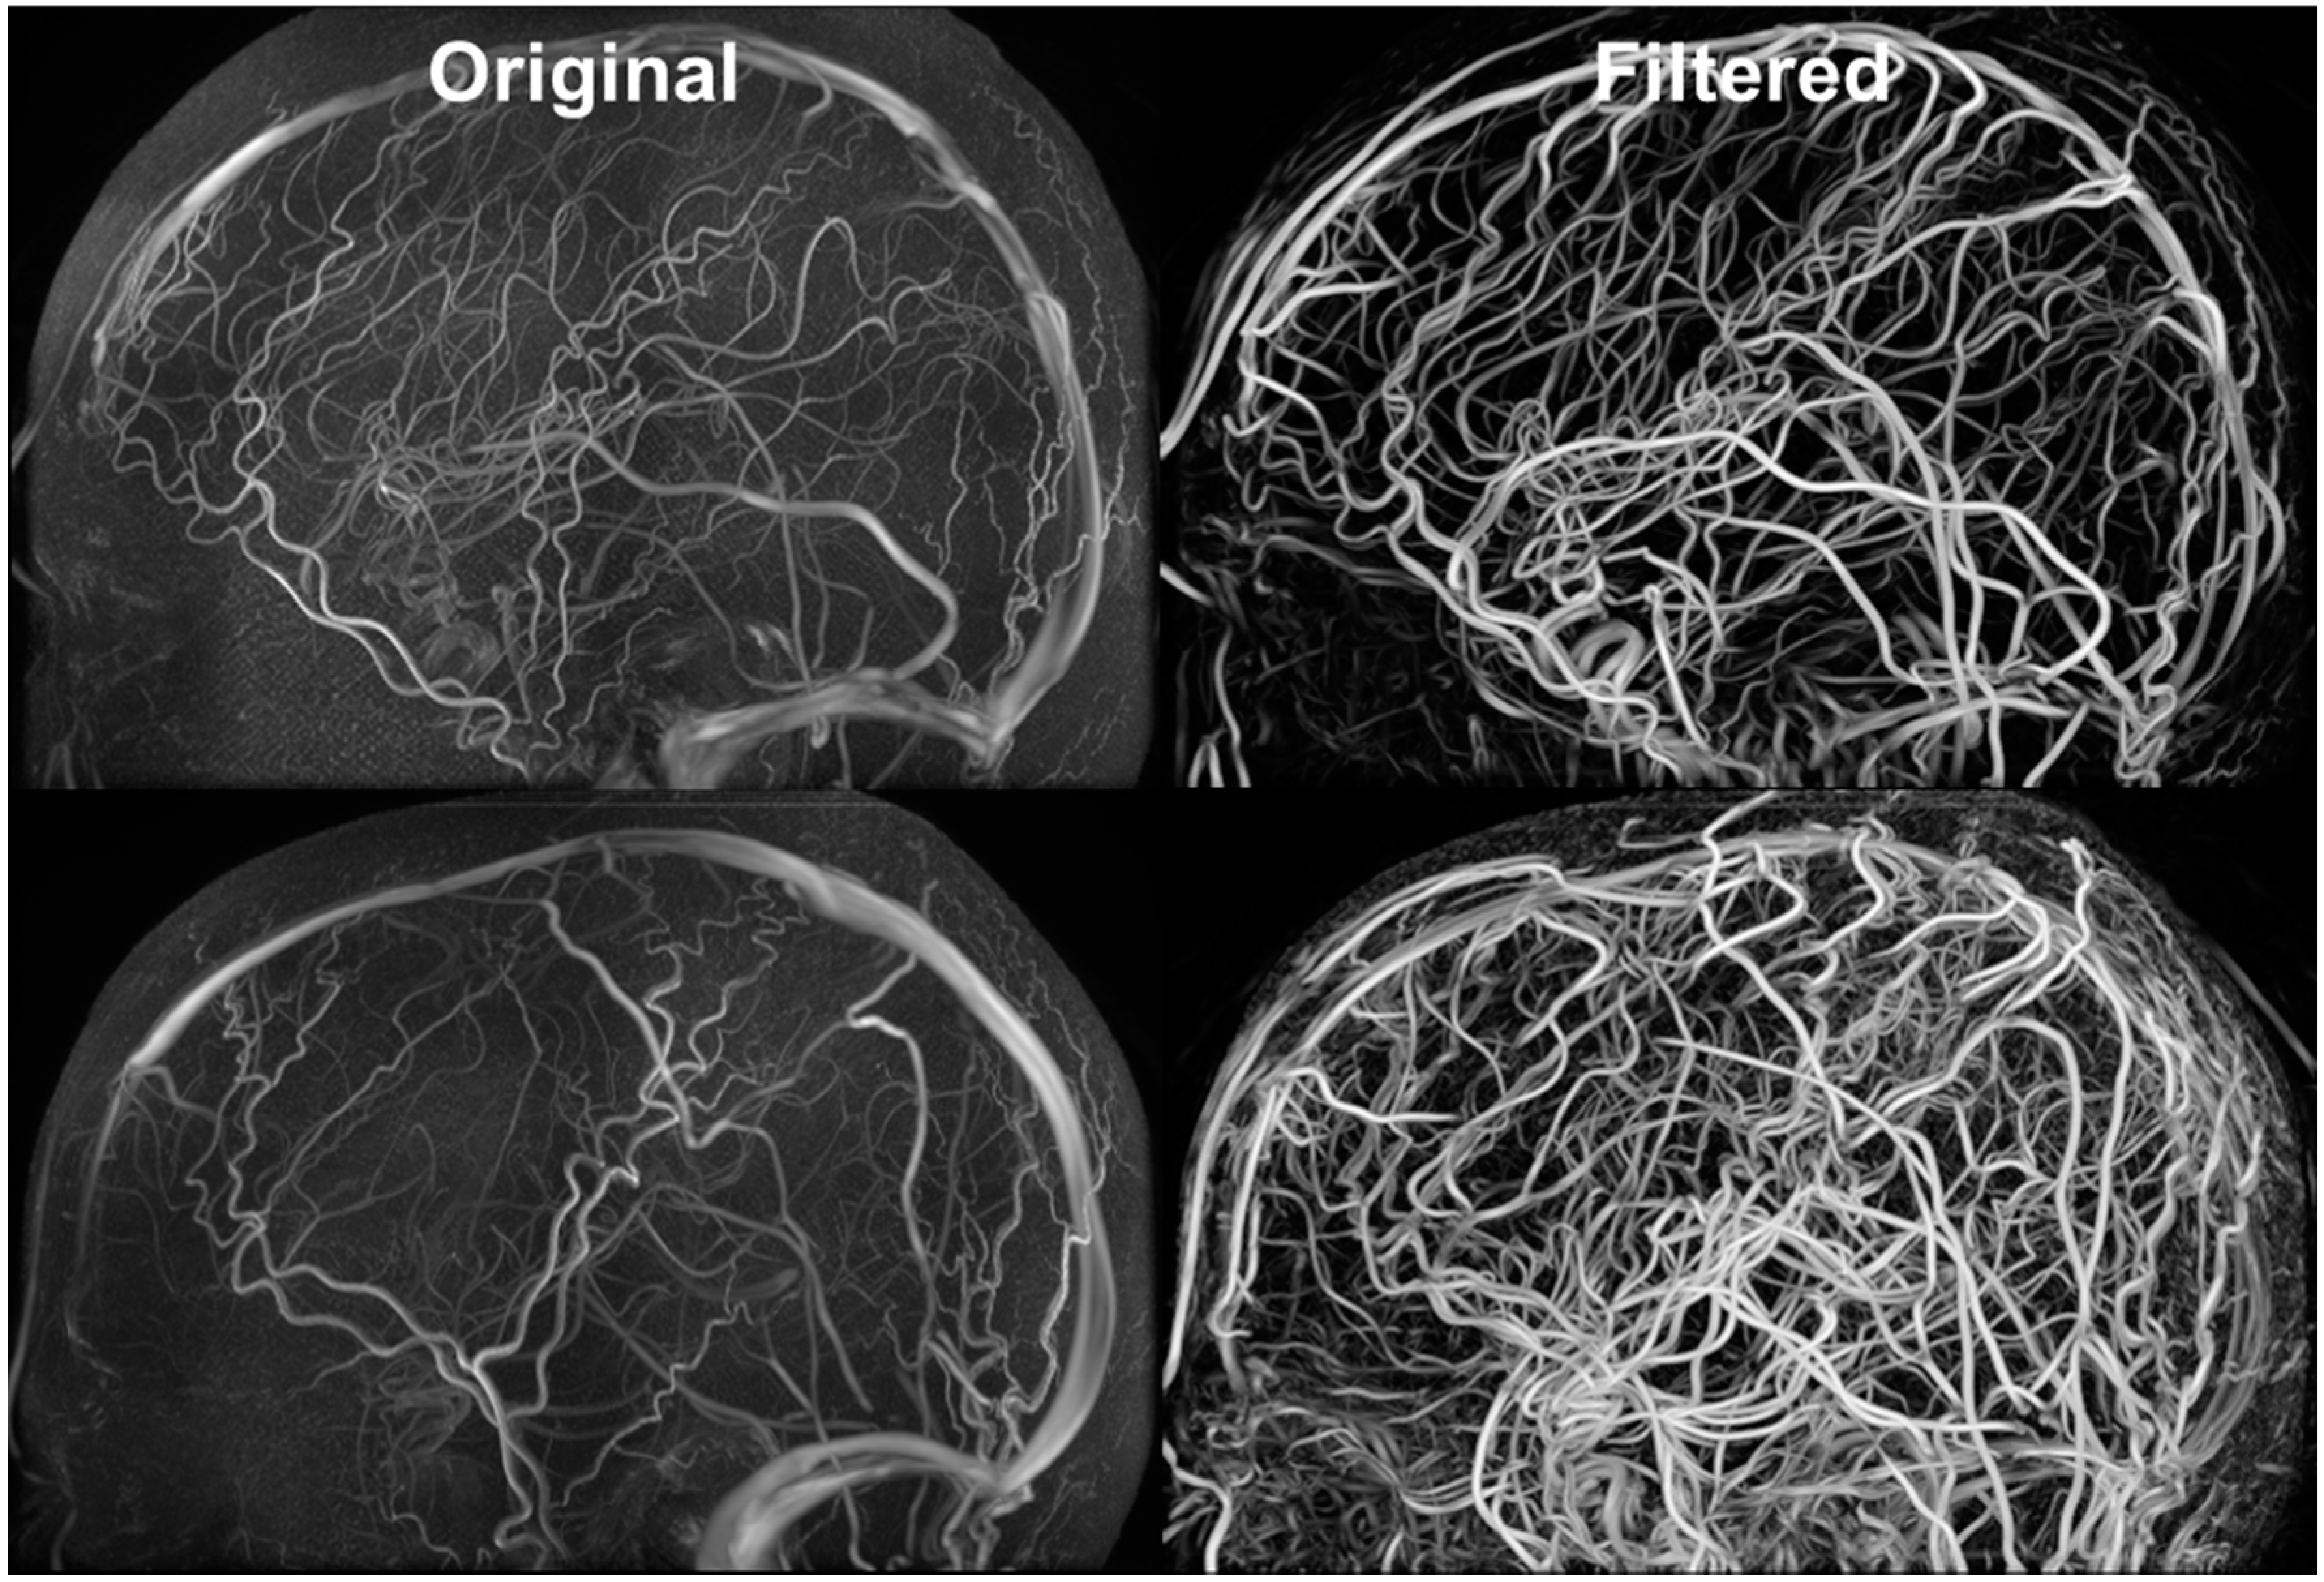
2.6. Cerebral Vasculature Segmentation

To identify and segment the vessels from the soft tissues, we utilized our in-house Hessian-based vessel filter [39,40,41,42]. Our filter outputs an image where each voxel intensity is proportional to the probability it belongs to the vascular network. At the vessel centerline, the image intensity assumes a local maximum. The centerline of the vascular network is the locus to the maxima in the filtered image, which forms a three dimensional space curve. The filtered image is then used for the vessel mesh generation procedure.

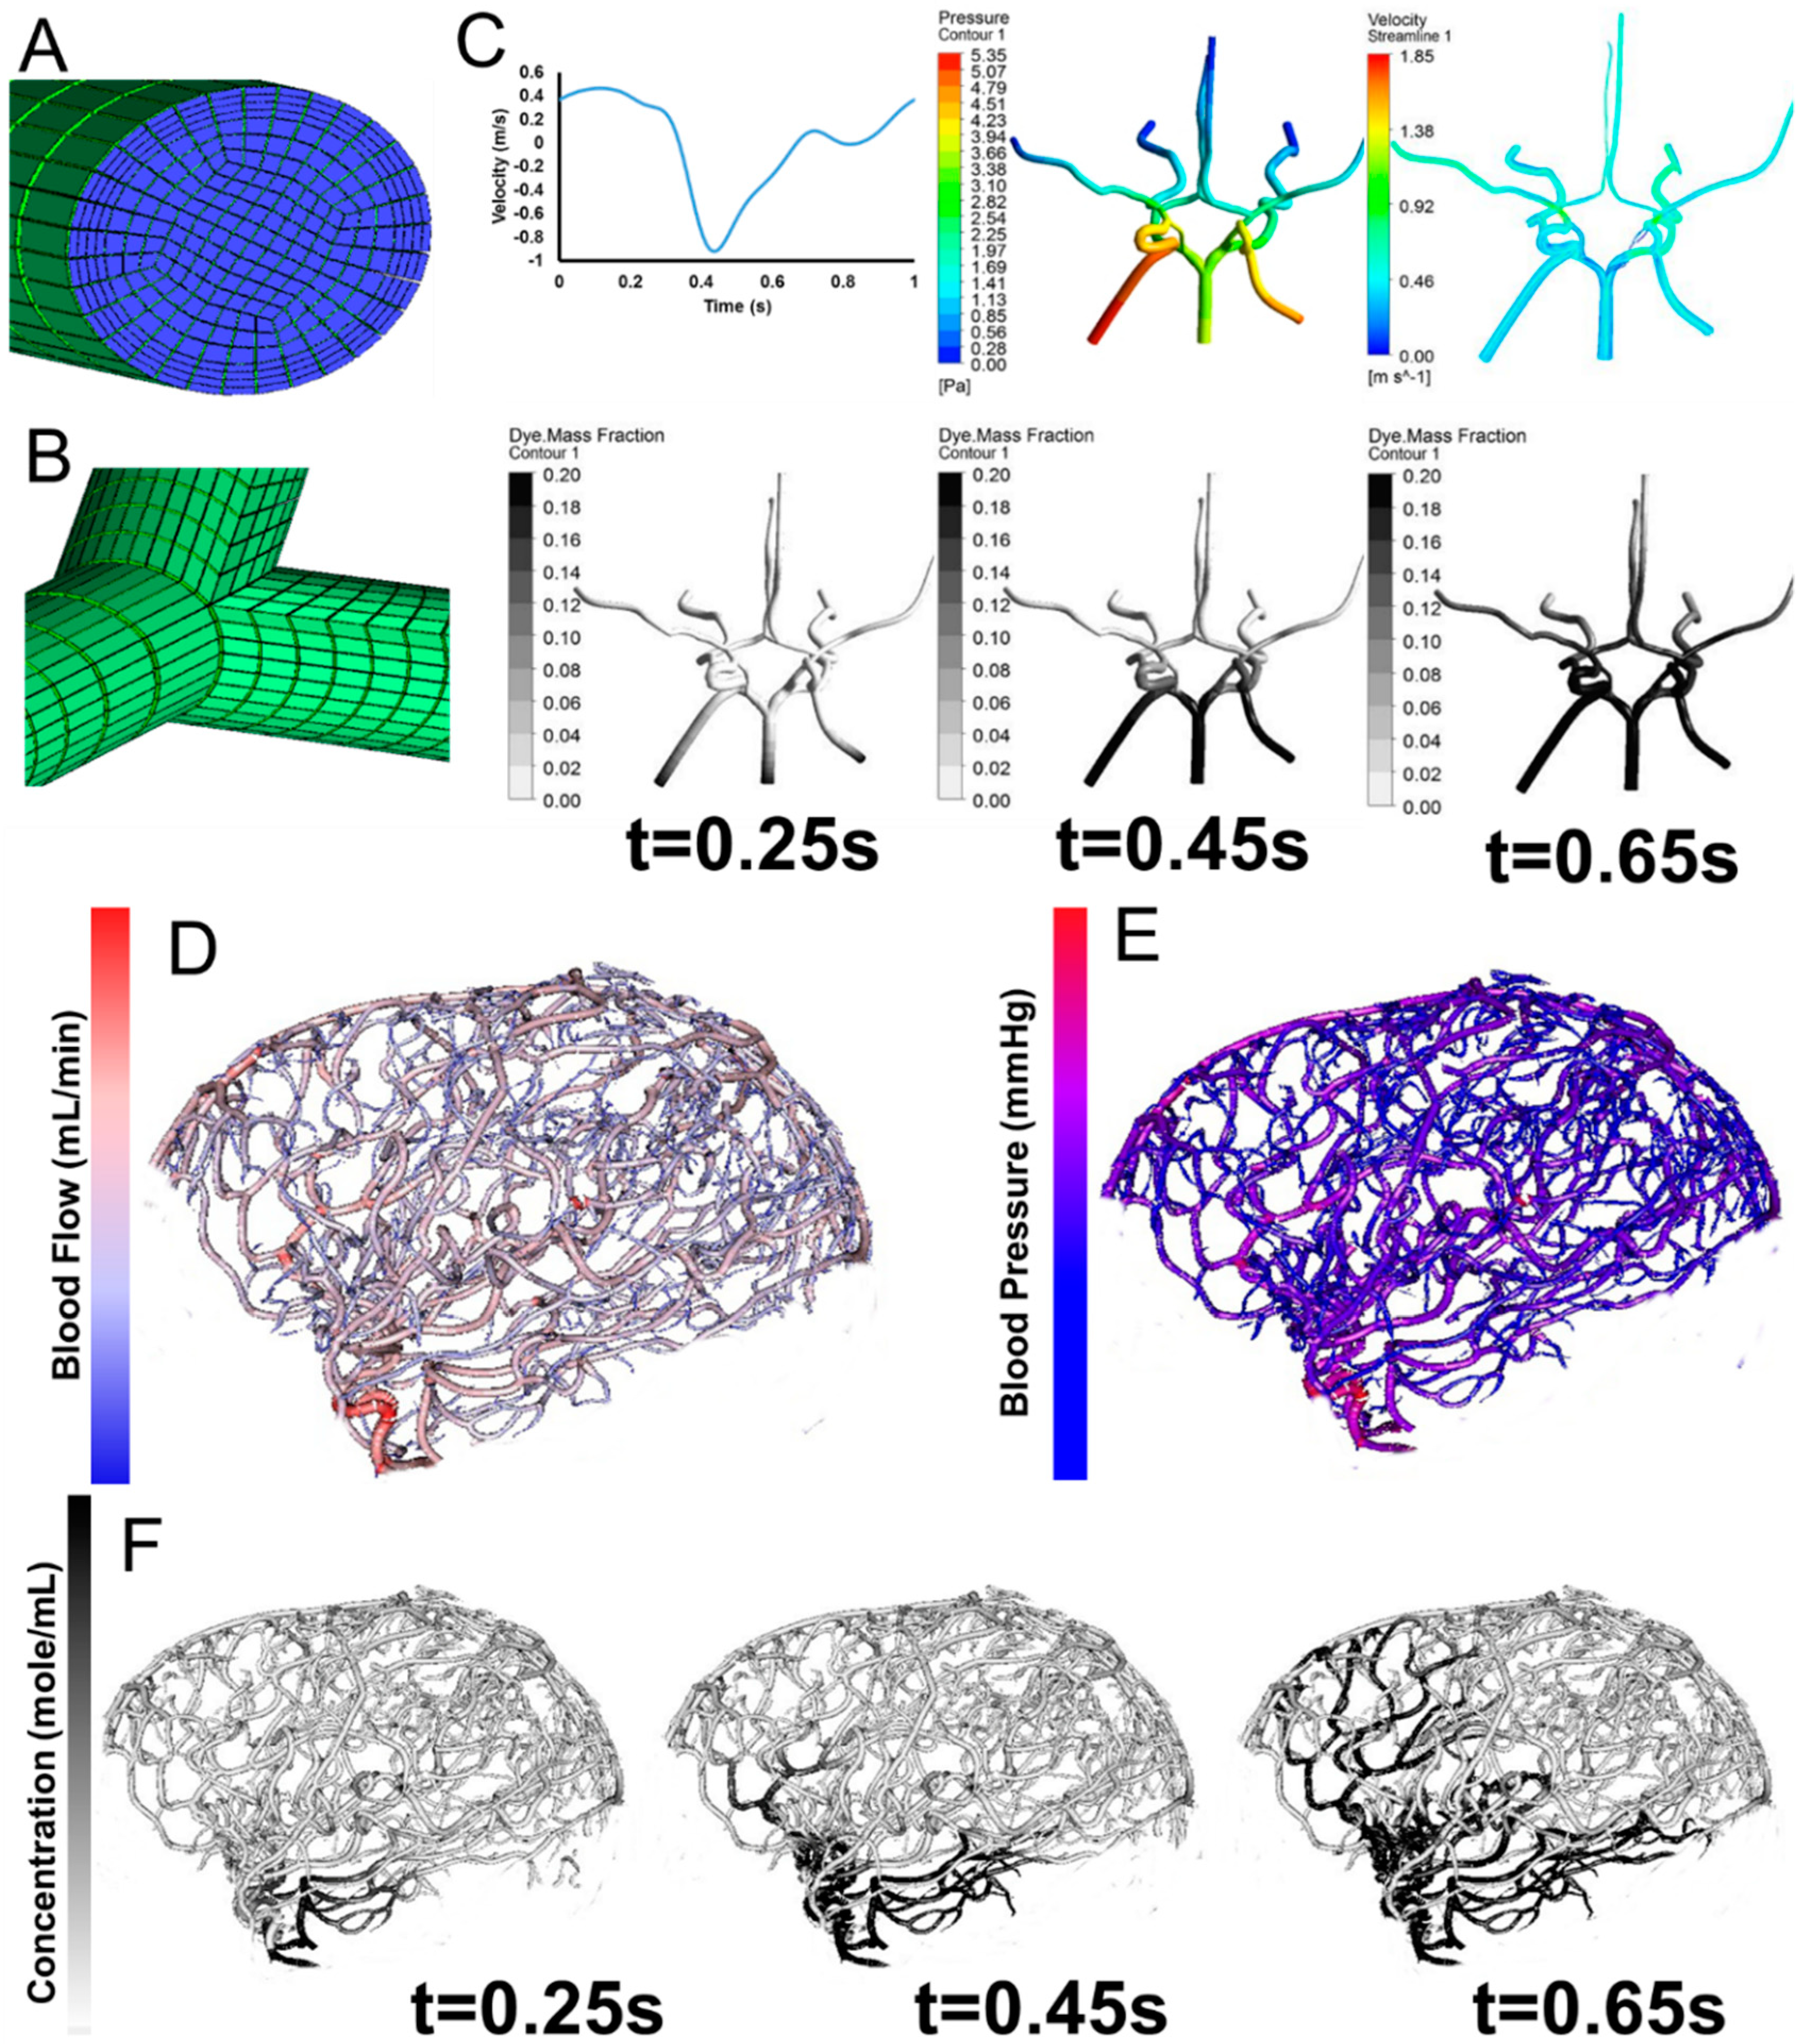
2.7. Vessel Mesh Generation

Due to the natural round shape of the vessels, we segmented the vessels based on centerlines and diameter information. The filtered images were processed to create a distance map between the vessel centerlines and the vessel wall, where a zero level set corresponds to vessel walls. The fast marching algorithm was used to detect the network connectivity by solving the Eikonal equation [43]. The connected domain serves as the initial deformable model for the levelset geodesic active contour to compute the distances of each point to the nearest vessel wall. Then, the marching cubes algorithm is applied to track the physical coordinates of the vessel walls and to construct a connected surface mesh of the vascular network. Using the maximal inscribed spheres method [44], the centerline trajectory and the corresponding vessel radius are precisely tracked. The centerline space curve representation and diameters can be used for generation of unstructured volumetric meshes [6].
Additionally, we developed an automatic parametric meshing algorithm to construct structured parametric volumetric meshes for the cerebral vasculature [45]. Our parametric meshing algorithm uses Bezier splines for approximation and smoothing of the vessel centerline. The control points of the splines are then used to define the geometrical separation planes for creating a continuous and smooth volumetric mesh. The parameterized volumetric mesh allows us to define the vessel lumen and vessel walls of the cerebral vasculature for detailed hemodynamic simulation.

3. Results and Discussion

Figure 2 exhibits the MR imaging studies from both subjects in axial, sagittal and coronal views respectively. The maximum intensity projection is used for the MRA to better delineate the vessels. The imaging protocols inherently brighten grey and white matter in T1, cerebrospinal fluid space in T2, arteries in MRA, and veins in MRV. The scalp exhibits high intensity in both T1 and T2. The skull does not exhibit any signal in all imaging studies. Image registration was performed to compensate for the different resolution and slice settings in each imaging protocol. Figure 3 shows the registered and segmented results with red being arteries, dark blue being veins, dark grey for grey matter, light grey for white matter, light blue for cerebrospinal fluid space, white for skull, and flesh color for scalp. Figure 3 shows that the coregistration successfully aligned the different structures together.
Figure 2. MRI images from two healthy subjects. T1 provides distinction of grey and white matter, skull and scalp. T2 provides cerebrospinal fluid space and contrast between gray and white matter. MRA enhances the intensity of vessels using flow phenomenon. The maximum intensity projection (MIP) provides better distinction of vasculature compared to the raw image. Due to the pulse sequence design, the brain tissue was removed from the MRV, showing only the signals from the vein.
Technologies 03 00126 g002
Figure 3. Image co-registration of the T1, T2, MRA, and MRV. The registered image is used in the pipeline for segmentation of the scalp (flesh color), skull (white), CSF (light blue), arteries (red), grey matter (dark grey), white matter (light grey), and veins (dark blue).
Technologies 03 00126 g003

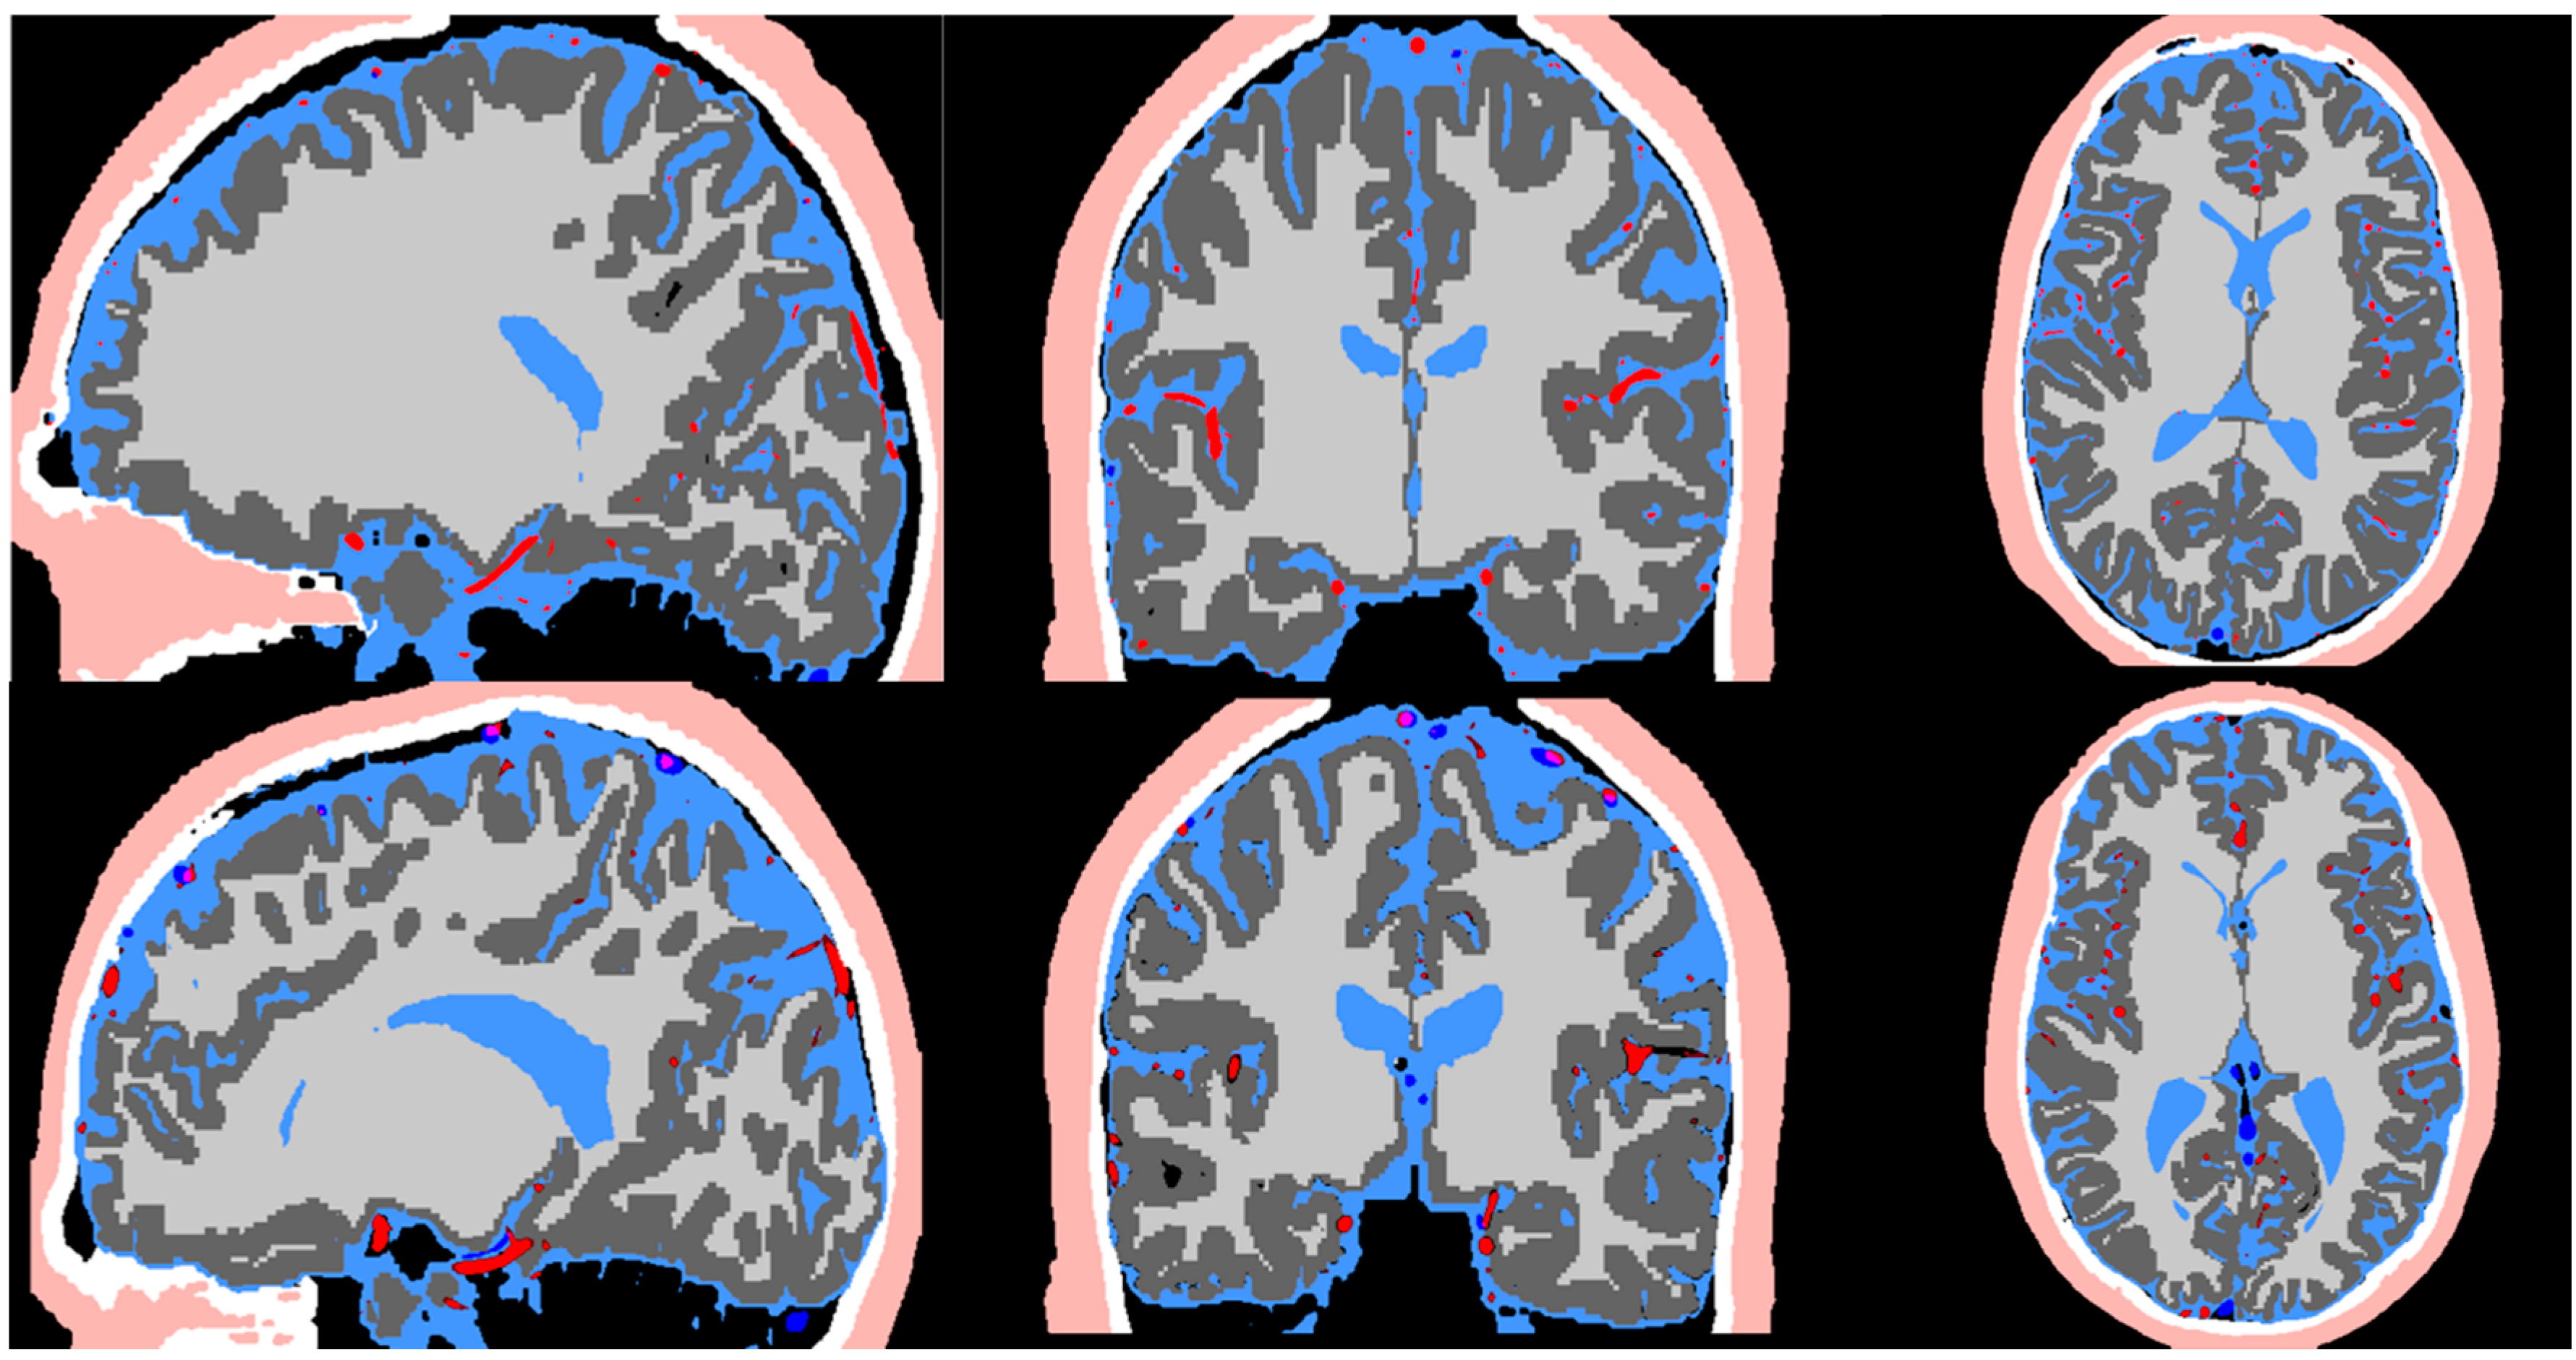
3.1. Cortex Surface Segmentation

The T1 and T2 images in Figure 2 show clear delineation between the grey matter, white matter, and cerebrospinal fluid space. Figure 4 shows the segmented grey and white matter for the two subjects. The mesh vertices and faces are shown in Table 1. The meshes are generated with marching cubes along with binary images depicting the respective soft tissues. These images are used as input for skull and scalp segmentation.
Figure 4. Computational meshes constructed from image segmentation of the two subjects. (A) Scalp from morphological operations of T1; (B) Skull from morphological operations of T1; (C) CSF from auto thresholding of T2; (D) Arteries from vessel filtering and segmentation of MRA; (E) Veins from vessel filtering and segmentation of MRV; (F) Grey matter from surface segmentation; (G) White matter from surface segmentation.
Technologies 03 00126 g004
Table 1. Mesh properties of each individual structures for two subjects.
StructureSubject 1Subject 2Reported Values
Arteries Volume (mL)35.836.445
Veins Volume (mL)36.138.670
CSF Volume (mL)SAS352530
Lateral Ventricles13.221.616.4
Third Ventricle0.80.80.9
Fourth Ventricle1.41.71.8
Spinal CSF-112.6103
Scalp Surface Area (cm2)580590600
Grey Matter Volume (mL)758.6720.4710–980
Grey Matter Surface Area (cm2)2471.42436.92400.0
White Matter Volume (mL)546.7538.6260–600

3.2. Skull and Scalp Segmentation

The brain mask is used to first determine the scalp mesh by removing the brain on the T1 image and thresholding. The skull is determined by removing the scalp and brain on the T1 image and another thresholding. The marching cubes algorithm is utilized to construct the meshes of skull and scalp of the two subjects as shown in Figure 4. The scalp exhibits high intensity outside at the exterior of the head in T1 and T2 images. The skull does not exhibit any signal and is hard to detect in all images. Thus, the morphological operation performed between the brain and scalp is used for approximating the skull. The skull is underestimated due to lack of signal by limitation of the imaging modality. CT can be used to achieve a better recognition of the skull with the tradeoff of exposure to ionizing radiation [46]. As pointed out by Dogdas et al. [34], the morphological operations and automatic thresholding might produce holes and it can be fixed by manually adjusting the threshold value. In our data sets, we did not find holes in our reconstructed meshes.

3.3. Cerebrospinal Fluid Space Segmentation

We compute four thresholds using Otsu’s method using the T2 image. The first threshold separates the background from other signals. The second threshold contains tissues with low intensity such as gray and white matter. All voxels above the second threshold are categorized as candidates for the cerebrospinal fluid space. The eyes also appears bright in T2 due to the aqueous humour in the eye. To exclude the eye, we look for the largest connected component and produced a binary image for mesh generation shown in Figure 4.

3.4. Vessel Segmentation

Figure 5 exhibits the MRA and MRV along with the filtered images. The MRA has high intensity in the large vessels, but the small vessels have similar intensity to the grey matter. After filtering, all vessels appear brighter which facilitates automatic vessel segmentation. The MRV imaging protocol was designed to remove non-vascular tissues inherently but the small veins are still difficult to detect. After filtering, all veins have high intensity and the filtered image is used for segmentation. The MRA imaging protocol was designed to enhance intensity for high flow areas which also includes signals from the superior sagittal sinus. The contamination from the vein was removed by excluding common voxels between MRA and MRV. After applying our vessel filter, it is shown that the non-vascular tissues were suppressed and small vessels are enhanced. The filter images then served as input for the centerline and diameter extraction. The vessel mesh was reconstructed using the diameter and centerline information shown in Figure 4.
Figure 5. Filtered MRA for vessel segmentation. Hessian-based filters were implemented for suppressing signals from non-vascular tissues and enhancing vascular tissues. The vessel enhancement allows all vessels to exhibit high intensity values and facilitates automatic vessel segmentation.
Technologies 03 00126 g005

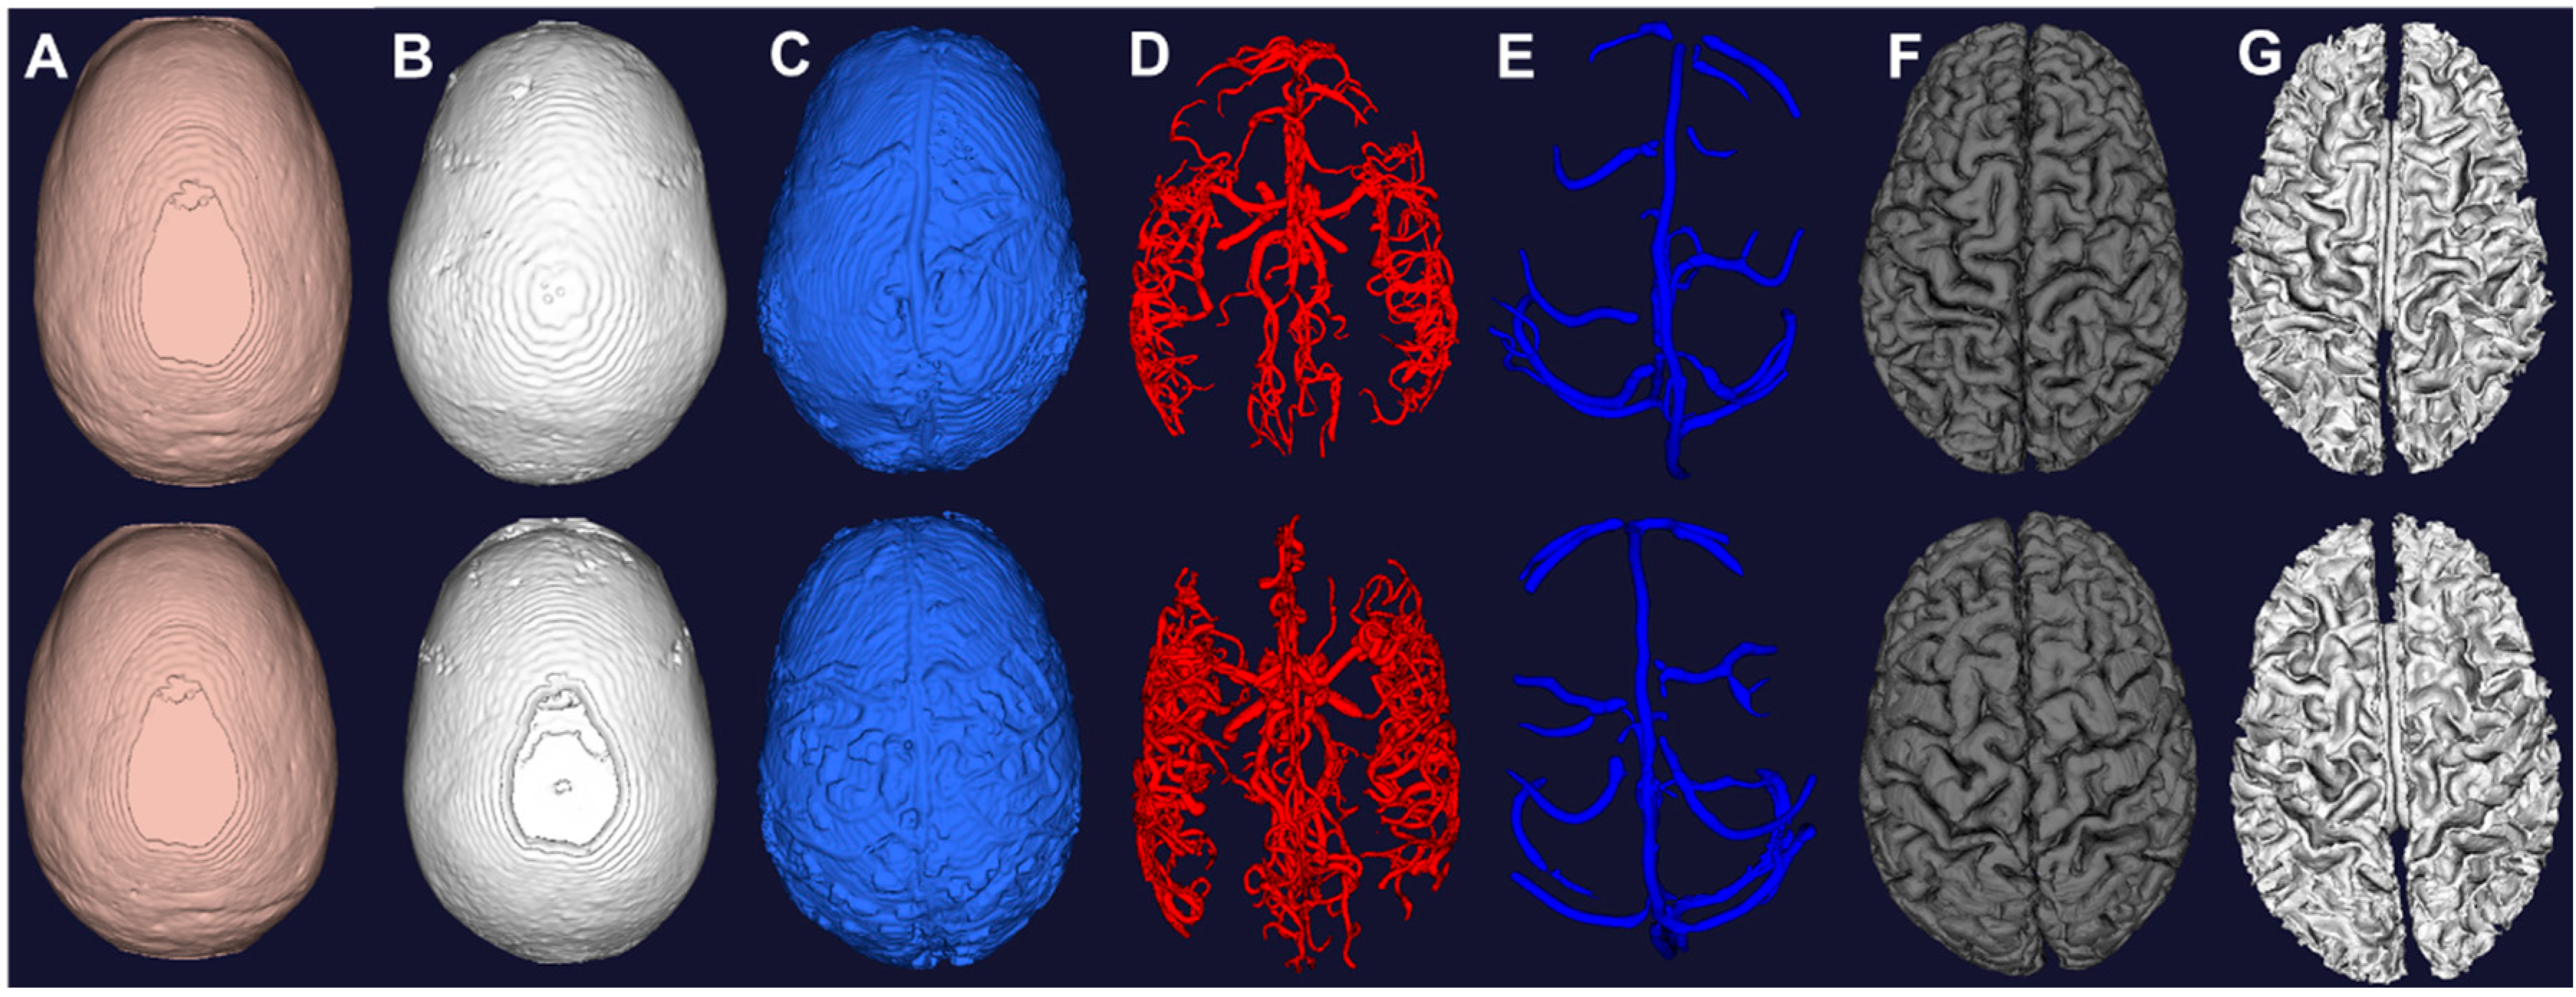
3.5. Whole Brain Mesh Generation

Figure 4 displays the individual meshes reconstructed from the proposed pipeline for the two subjects. Mesh metrics are evaluated in Table 1 and compared with physiological values [47,48,49,50,51,52]. The grey matter volume for both subject falls within the reported range of 710–980 mL. The white matter volume also for both subjects are also within reported values of 260–600 mL. The arterial and venous volume are slightly lower than reported values due to limited image resolution. The CSF volumes for both subjects in the lateral ventricles, third ventricles are fourth ventricles are all comparable to reported values. The scalp surface area for both subjects are approximately 10% higher than the reported value of 600 cm2. It demonstrates the ability of our pipeline to process image signals to reconstruct meshes for display and simulation. However, due to limited resolution and partial volume effect, the meshes intersect with each other at the boundaries which is not anatomically accurate. This inaccuracy appears mostly at the deep gyri, in which the small vessels are embedded with the cerebrospinal fluid. To compensate for the hardware limitations, we used the binary images to detect for intersections and excluded common voxels. One can also pursue Pons’s method to produce watertight meshes [25].

3.6. Parametric Meshing

In addition to constructing cylinder meshes with diameter and centerline information, we also developed an automatic parametric meshing algorithm using cubic Bezier models to generate structured hexahedral meshes as shown in Figure 6. The parametric meshing algorithm takes in the diameter and length information form the vessel segmentation and groups the segments into bifurcation, bifurcation to bifurcation, and bifurcation to terminal. For each group, separation points and planes are computed to define the connection between the different groups. The parametric meshing allows us to control the meshes quality and define regions for vessel wall and vessel lumens for hemodynamic simulations. The surface meshes can be improved be adapting parameterized surfaces such as Bezier surface, B-spline surface, and NURBS [53,54,55,56].

3.7. Cerebral Hemodynamics Simulation

The computational meshes can be used for computational fluid dynamics simulations. Detailed hemodynamic simulation can be achieved by using commercial software solving the 3D Navier-Stokes equation as shown in Figure 6. The meshes are loaded into the software and assigned with boundary conditions. Our 3D simulation demonstrates velocity field, pressure gradient, and dye convection with a pulsatile boundary condition. Figure 6 also shows preliminary hemodynamic simulations for blood flow rate and blood pressure using the cylinder mesh and simplified flow principle equations. The computational time for these simulations are less than one minute. Additionally, we also performed dye convection simulation with time step = 0.1 s for 10 s duration to produce artificial dynamic angiography in Figure 6. The computational time for dye convection is dependent on the step size and in this case it took less than five minutes. The simulation results demonstrate the use of our image processing pipeline for rapid simulation to aid clinical diagnosis. In addition to cerebral hemodynamics, we also acquired images for full body CSF reconstruction along with phase contrast MRI for CSF flow measurements as shown in Figure 7. The CSF model allows us to study full body CSF dynamics [14,17]. Combined with the whole brain model, we can investigate the relationship between cerebral hemodynamics and CSF dynamics.
Figure 6. Parametric meshing of the cerebral vasculature for 3D hemodynamic simulations. (A) Cross section of the parametric meshing of the segmented cerebral vasculature; (B) Parametric mesh at the bifurcations; (C) 3D hemodynamic simulation of the cerebral vasculature with pulsatile boundary conditions showing velocity fields, pressure fields, and dye convection at three time frames, 0.25 s, 0.45 s, 0.65 s; (D) Volumetric blood flow rate for each individual segment; (E) Blood pressure estimation for the entire tree; (F) Dynamic contrast agent distribution for three time frames 0.25 s, 0.45 s, 0.65 s after injection of a contrast agent. Inlet boundary conditions are provided in C for velocity and outlet boundary conditions are static pressure.
Technologies 03 00126 g006
Figure 7. CSF imaging for the entire central nervous system. T2 images are acquired for the brain, cervical-thoracic region, thoracic-lumbar region, lumbar-sacral region. Image stitching algorithms were utilized to construct a contiguous image of the entire CSF space. The image is segmented to provide a continuous computational mesh of the entire CSF space.
Technologies 03 00126 g007

4. Conclusions

In this paper, we combined several image processing algorithms to construct an image processing pipeline for automatic generation of subject specific computational meshes. The imaging protocols used are provided by the hardware company which does not require additional modification or optimization. Currently, commercial software does not provide specific tools for individual structures, but only generic processing algorithms. Generic processing algorithms are inadequate for segmentation of vessels and smooth extraction of the cortex surface. This limits the accuracy of the reconstruction of the meshes since the algorithms are not specifically designed for different signals and characteristics of the structures. It also requires manual intervention and modification which hinders the reconstruction of subject-specific meshes. Our pipeline is designed to automatically segment individual structures based on their geometry and signal characteristics. By introducing the proposed imaging processing procedures, we hope to reduce the difficulty of reconstructing subject specific computational meshes.

Acknowledgments

The authors would like to gratefully partial support of this project by NSF grants CBET-0756154 and CBET-1301198.

Author Contributions

Chih-Yang Hsu and Ben Schneller are responsible for the image processing work in this study under the supervision of Andreas Linninger as a part of Chih-Yang Hsu’s PhD thesis with collaboration with Ali Alaraj. Mahsa Ghaffari is responsible for the meshing and simulation work in this paper as a part of her PhD thesis under the supervision of Andreas Linninger. All authors have read and approved the final manuscript.

Conflicts of Interest

The authors declare no conflict of interest.

References

  1. Doi, K. Computer-aided diagnosis in medical imaging: Historical review, current status and future potential. Comput. Med. Imaging Graph. 2007, 31, 198–211. [Google Scholar] [CrossRef] [PubMed]
  2. Sundgren, P.C.; Dong, Q.; Gómez-Hassan, D.; Mukherji, S.K.; Maly, P.; Welsh, R. Diffusion tensor imaging of the brain: Review of clinical applications. Neuroradiology 2004, 46, 339–350. [Google Scholar] [CrossRef] [PubMed]
  3. Wardlaw, J.M.; Mielke, O. Early Signs of Brain Infarction at CT: Observer Reliability and Outcome after Thrombolytic Treatment—Systematic Review. Radiology 2005, 235, 444–453. [Google Scholar] [CrossRef] [PubMed]
  4. Duncan, J.S.; Ayache, N. Medical image analysis: Progress over two decades and the challenges ahead. IEEE Trans. Pattern Anal. Mach. Intell. 2000, 22, 85–106. [Google Scholar] [CrossRef]
  5. Milner, J.S.; Moore, J.A.; Rutt, B.K.; Steinman, D.A. Hemodynamics of human carotid artery bifurcations: Computational studies with models reconstructed from magnetic resonance imaging of normal subjects. J. Vasc. Surg. 1998, 28, 143–156. [Google Scholar] [CrossRef] [PubMed]
  6. Spiegel, M.; Redel, T.; Zhang, Y.J.; Struffert, T.; Hornegger, J.; Grossman, R.G.; Doerfler, A.; Karmonik, C. Tetrahedral vs. polyhedral mesh size evaluation on flow velocity and wall shear stress for cerebral hemodynamic simulation. Comput. Methods Biomech. Biomed. Engin. 2011, 14, 9–22. [Google Scholar] [CrossRef] [PubMed]
  7. Oshima, M.; Torii, R.; Kobayashi, T.; Taniguchi, N.; Takagi, K. Finite element simulation of blood flow in the cerebral artery. Comput. Methods Appl. Mech. Eng. 2001, 191, 661–671. [Google Scholar] [CrossRef]
  8. Cebral, J.R.; Castro, M.A.; Appanaboyina, S.; Putman, C.M.; Millan, D.; Frangi, A.F. Efficient pipeline for image-based patient-specific analysis of cerebral aneurysm hemodynamics: Technique and sensitivity. IEEE Trans. Med. Imaging 2005, 24, 457–467. [Google Scholar] [CrossRef] [PubMed]
  9. Ho, J.; Kleiven, S. Can sulci protect the brain from traumatic injury? J. Biomech. 2009, 42, 2074–2080. [Google Scholar] [CrossRef] [PubMed]
  10. Ghaffari, M.; Zoghi, M.; Rostami, M.; Abolfathi, N. Fluid Structure Interaction of Traumatic Brain Injury: Effects of Material Properties on SAS Trabeculae. Int. J. Mod. Eng. 2014, 14, 54–62. [Google Scholar]
  11. Takahashi, T.; Kato, K.; Ishikawa, R.; Watanabe, T.; Kubo, M.; Uzuka, T.; Fujii, Y.; Takahashi, H. 3-D finite element analysis and experimental study on brain injury mechanism. In Proceedings of 2007 29th Annual International Conference of the IEEE on Engineering in Medicine and Biology Society (EMBS), Lyon, France, 22–26 Auguest 2007; pp. 3613–3616.
  12. Linninger, A.A.; Tsakiris, C.; Zhu, D.C.; Xenos, M.; Roycewicz, P.; Danziger, Z.; Penn, R. Pulsatile cerebrospinal fluid dynamics in the human brain. IEEE Trans. Biomed. Eng. 2005, 52, 557–565. [Google Scholar] [CrossRef] [PubMed]
  13. Linninger, A.A.; Xenos, M.; Zhu, D.C.; Somayaji, M.R.; Kondapalli, S.; Penn, R.D. Cerebrospinal Fluid Flow in the Normal and Hydrocephalic Human Brain. IEEE Trans. Biomed. Eng. 2007, 54, 291–302. [Google Scholar] [CrossRef] [PubMed]
  14. Linninger, A.A.; Xenos, M.; Sweetman, B.; Ponkshe, S.; Guo, X.; Penn, R. A mathematical model of blood, cerebrospinal fluid and brain dynamics. J. Math. Biol. 2009, 59, 729–759. [Google Scholar] [CrossRef] [PubMed]
  15. Linninger, A.A.; Sweetman, B.; Penn, R. Normal and Hydrocephalic Brain Dynamics: The Role of Reduced Cerebrospinal Fluid Reabsorption in Ventricular Enlargement. Ann. Biomed. Eng. 2009, 37, 1434–1447. [Google Scholar] [CrossRef] [PubMed]
  16. Penn, R.D.; Lee, M.C.; Linninger, A.A.; Miesel, K.; Lu, S.N.; Stylos, L. Pressure gradients in the brain in an experimental model of hydrocephalus. Collections 2009, 116, 1069–1075. [Google Scholar]
  17. Sweetman, B.; Linninger, A.A. Cerebrospinal Fluid Flow Dynamics in the Central Nervous System. Ann. Biomed. Eng. 2010, 39, 484–496. [Google Scholar] [CrossRef] [PubMed]
  18. Zhu, D.C.; Xenos, M.; Linninger, A.A.; Penn, R.D. Dynamics of lateral ventricle and cerebrospinal fluid in normal and hydrocephalic brains. J. Magn. Reson. Imaging 2006, 24, 756–770. [Google Scholar] [CrossRef] [PubMed]
  19. Zhang, J.Y.; Joldes, G.R.; Wittek, A.; Miller, K. Patient-specific computational biomechanics of the brain without segmentation and meshing. Int. J. Numer. Meth. Biomed. Engng. 2013, 29, 293–308. [Google Scholar] [CrossRef]
  20. Alaraj, A.; Luciano, C.J.; Bailey, D.P.; Elsenousi, A.; Roitberg, B.Z.; Bernardo, A.; Banerjee, P.P.; Charbel, F.T. Virtual reality cerebral aneurysm clipping simulation with real-time haptic feedback. Neurosurgery 2015, 11, 52–58. [Google Scholar] [PubMed]
  21. Alaraj, A.; Charbel, F.T.; Birk, D.; Tobin, M.; Luciano, C.; Banerjee, P.P.; Rizzi, S.; Sorenson, J.; Foley, K.; Slavin, K.; et al. Role of Cranial and Spinal Virtual and Augmented Reality Simulation Using Immersive Touch Modules in Neurosurgical Training. Neurosurgery 2013, 72, 115–123. [Google Scholar] [CrossRef] [PubMed]
  22. Alaraj, A.; Lemole, M.G.; Finkle, J.H.; Yudkowsky, R.; Wallace, A.; Luciano, C.; Banerjee, P.P.; Rizzi, S.H.; Charbel, F.T. Virtual reality training in neurosurgery: Review of current status and future applications. Surg. Neurol. Int. 2011, 2. [Google Scholar] [CrossRef]
  23. Yudkowsky, R.; Luciano, C.; Banerjee, P.; Schwartz, A.; Alaraj, A.; Lemole, G.M.; Charbel, F.; Smith, K.; Rizzi, S.; Byrne, R.; et al. Practice on an Augmented Reality/Haptic Simulator and Library of Virtual Brains Improves Residents’ Ability to Perform a Ventriculostomy. Simul. Healthc. J. Soc. Simul. Healthc. 2013, 8, 25–31. [Google Scholar] [CrossRef]
  24. Alaraj, A.; Tobin, M.K.; Birk, D.M.; Charbel, F.T. Simulation in Neurosurgery and Neurosurgical Procedures. In The Comprehensive Textbook of Healthcare Simulation; Levine, A.I., DeMaria, S., Jr., Schwartz, A.D., Sim, A.J., Eds.; Springer: New York, NY, USA, 2013; pp. 415–423. [Google Scholar]
  25. Pons, J.P.; Ségonne, E.; Boissonnat, J.D.; Rineau, L.; Yvinec, M.; Keriven, R. High-quality consistent meshing of multi-label datasets. Inf. Process Med. Imaging 2007, 20, 198–210. [Google Scholar] [PubMed]
  26. Nowinski, W.L.; Belov, D. The Cerefy Neuroradiology Atlas: A Talairach–Tournoux atlas-based tool for analysis of neuroimages available over the internet. NeuroImage 2003, 20, 50–57. [Google Scholar] [CrossRef] [PubMed]
  27. Nowinski, W.L. The cerefy brain atlases. Neuroinformatics 2005, 3, 293–300. [Google Scholar] [CrossRef] [PubMed]
  28. Nowinski, W.L. From research to clinical practice: A Cerefy brain atlas story. Int. Congr. Ser. 2003, 1256, 75–81. [Google Scholar] [CrossRef]
  29. Adams, C.M.; Wilson, T.D. Virtual cerebral ventricular system: An MR-based three-dimensional computer model. Anat. Sci. Educ. 2011, 4, 340–347. [Google Scholar] [CrossRef] [PubMed]
  30. Dale, A.M.; Fischl, B.; Sereno, M.I. Cortical surface-based analysis. I. Segmentation and surface reconstruction. NeuroImage 1999, 9, 179–194. [Google Scholar] [CrossRef] [PubMed]
  31. Fischl, B.; Salat, D.H.; Busa, E.; Albert, M.; Dieterich, M.; Haselgrove, C.; van der Kouwe, A.; Killiany, R.; Kennedy, D.; Klaveness, S.; et al. Whole brain segmentation: Automated labeling of neuroanatomical structures in the human brain. Neuron 2002, 33, 341–355. [Google Scholar] [CrossRef] [PubMed]
  32. Fischl, B.; Liu, A.; Dale, A.M. Automated manifold surgery: Constructing geometrically accurate and topologically correct models of the human cerebral cortex. IEEE Trans. Med. Imaging 2001, 20, 70–80. [Google Scholar] [CrossRef] [PubMed]
  33. Fischl, B.; Salat, D.H.; van der Kouwe, A.J.W.; Makris, N.; Ségonne, F.; Quinn, B.T.; Dale, A.M. Sequence-independent segmentation of magnetic resonance images. NeuroImage 2004, 23, S69–S84. [Google Scholar] [CrossRef] [PubMed]
  34. Dogdas, B.; Shattuck, D.W.; Leahy, R.M. Segmentation of skull and scalp in 3-D human MRI using mathematical morphology. Hum. Brain Mapp. 2005, 26, 273–285. [Google Scholar] [CrossRef] [PubMed]
  35. Liao, P.; Chen, T.; Chung, P. A fast algorithm for multilevel thresholding. J. Inf. Sci. Eng. 2001, 17, 713–727. [Google Scholar]
  36. Otsu, N. A Threshold Selection Method from Gray-Level Histograms. IEEE Trans. Syst. Man Cybern. 1979, 9, 62–66. [Google Scholar] [CrossRef]
  37. Lorensen, W.E.; Cline, H.E. Marching Cubes: A High Resolution 3D Surface Construction Algorithm. In Proceedings of the 14th Annual Conference on Computer Graphics and Interactive Techniques, SIGGRAPH ’87, Anaheim, CA, USA, 27–31 July 1987; ACM: New York, NY, USA, 1987; pp. 163–169. [Google Scholar]
  38. Nielson, G.M.; Hamann, B. The Asymptotic Decider: Resolving the Ambiguity in Marching Cubes. In Proceedings of the 2nd Conference on Visualization ’91 (VIS ’91), San Diego, CA, USA, 22–25 October 1991; IEEE Computer Society Press: Los Alamitos, CA, USA, 1991; pp. 83–91. [Google Scholar]
  39. Frangi, A.F.; Niessen, W.J.; Vincken, K.L.; Viergever, M.A. Multiscale vessel enhancement filtering. In Medical Image Computing and Computer-Assisted Interventation—MICCAI’98; Lecture Notes in Computer Science; Wells, W.M., Colchester, A., Delp, S., Eds.; Springer: Berlin/Heidelberg, Germany, 1998; pp. 130–137. [Google Scholar]
  40. Shikata, H.; Hoffman, E.A.; Sonka, M. Automated segmentation of pulmonary vascular tree from 3D CT images. In Proceedings of the SPIE 5369, Medical Imaging 2004: Physiology, Function, and Structure from Medical Images, San Diego, CA, USA, 30 April 2004; Volume 5369, pp. 107–116.
  41. Erdt, M.; Raspe, M.; Suehling, M. Automatic Hepatic Vessel Segmentation Using Graphics Hardware. In Medical Imaging and Augmented Reality; Lecture Notes in Computer Science; Dohi, T., Sakuma, I., Liao, H., Eds.; Springer: Berlin/Heidelberg, Germany, 2008; pp. 403–412. [Google Scholar]
  42. Sato, Y.; Nakajima, S.; Shiraga, N.; Atsumi, H.; Yoshida, S.; Koller, T.; Gerig, G.; Kikinis, R. Three-dimensional multi-scale line filter for segmentation and visualization of curvilinear structures in medical images. Med. Image Anal. 1998, 2, 143–168. [Google Scholar] [CrossRef] [PubMed]
  43. Sethian, J.A. A fast marching level set method for monotonically advancing fronts. Proc. Natl. Acad. Sci. USA 1996, 93, 1591–1595. [Google Scholar] [CrossRef] [PubMed]
  44. Antiga, L.; Piccinelli, M.; Botti, L.; Ene-Iordache, B.; Remuzzi, A.; Steinman, D.A. An image-based modeling framework for patient-specific computational hemodynamics. Med. Biol. Eng. Comput. 2008, 46, 1097–1112. [Google Scholar] [CrossRef] [PubMed]
  45. Ghaffari, M.; Hsu, C.-Y.; Linninger, A.A. Automatic reconstruction and generation of structured hexahedral mesh for non-planar bifurcations in vascular network. Comput. Aided Chem. Eng. 2015, in press. [Google Scholar]
  46. Nowinski, W.L.; Thaung, T.S.L.; Chua, B.C.; Yi, S.H.W.; Ngai, V.; Yang, Y.; Chrzan, R.; Urbanik, A. Three-dimensional stereotactic atlas of the adult human skull correlated with the brain, cranial nerves, and intracranial vasculature. J. Neurosci. Methods 2015, 246, 65–74. [Google Scholar] [CrossRef] [PubMed]
  47. Ito, H.; Kanno, I.; Iida, H.; Hatazawa, J.; Shimosegawa, E.; Tamura, H.; Okudera, T. Arterial fraction of cerebral blood volume in humans measured by positron emission tomography. Ann. Nucl. Med. 2001, 15, 111–116. [Google Scholar] [CrossRef] [PubMed]
  48. Lauwers, F.; Cassot, F.; Lauwers-Cances, V.; Puwanarajah, P.; Duvernoy, H. Morphometry of the human cerebral cortex microcirculation: General characteristics and space-related profiles. NeuroImage 2008, 39, 936–948. [Google Scholar] [CrossRef] [PubMed]
  49. Risser, L.; Plouraboué, F.; Cloetens, P.; Fonta, C. A 3D-investigation shows that angiogenesis in primate cerebral cortex mainly occurs at capillary level. Int. J. Dev. Neurosci. 2009, 27, 185–196. [Google Scholar] [CrossRef] [PubMed] [Green Version]
  50. Reichold, J.; Stampanoni, M.; Keller, A.L.; Buck, A.; Jenny, P.; Weber, B. Vascular graph model to simulate the cerebral blood flow in realistic vascular networks. J. Cereb. Blood Flow Metab. 2009, 29, 1429–1443. [Google Scholar] [CrossRef] [PubMed] [Green Version]
  51. Lüders, E.; Steinmetz, H.; Jäncke, L. Brain size and grey matter volume in the healthy human brain. Neuroreport 2002, 13, 2371–2374. [Google Scholar] [CrossRef] [PubMed]
  52. Grant, R.; Condon, B.; Lawrence, A.; Hadley, D.M.; Patterson, J.; Bone, I.; Teasdale, G.M. Human cranial CSF volumes measured by MRI: Sex and age influences. Magn. Reson. Imaging 1987, 5, 465–468. [Google Scholar] [CrossRef] [PubMed]
  53. Borouchaki, H.; Laug, P.; George, P.-L. Parametric surface meshing using a combined advancing-front generalized Delaunay approach. Int. J. Numer. Methods Eng. 2000, 49, 233–259. [Google Scholar] [CrossRef]
  54. Meegama, R.G.N.; Rajapakse, J.C. NURBS-Based Segmentation of the Brain in Medical Images. Int. J. Pattern Recognit. Artif. Intell. 2003, 17, 995–1009. [Google Scholar] [CrossRef]
  55. Zhu, D.; Li, K.; Guo, L.; Liu, T. Bezier Control Points image: A novel shape representation approach for medical imaging. In Proceedings of the 2009 Conference Record of the Forty-Third Asilomar Conference on Signals, Systems and Computers, Pacific Grove, CA, USA, 1–4 November 2009; pp. 1094–1098.
  56. Lim, S.P.; Haron, H. Surface reconstruction techniques: A review. Artif. Intell. Rev. 2012, 42, 59–78. [Google Scholar] [CrossRef]

