
Application of an Emergency Alarm System for Physiological Sensors Utilizing Smart Devices

School of Information Technology, Deakin University, Burwood VIC 3125, Australia
*
Author to whom correspondence should be addressed.
Technologies 2017, 5(2), 26; https://0-doi-org.brum.beds.ac.uk/10.3390/technologies5020026
Submission received: 12 April 2017
/
Revised: 13 May 2017
/
Accepted: 22 May 2017
/
Published: 27 May 2017
Abstract
:Since innovative smart devices and body sensors including wearables have become prevalent with health informatics such as in Mobile Health (mHealth), we proposed to infer sensed data in sensor nodes to reduce the battery power consumption and bandwidth usage in wireless body area networks. It is critical to raise an alarm when the user is in an urgent situation, which can be done by analysing the sensed data against the user’s activity status utilizing accelerometer sensors. However, when the activity changes frequently, there may be an increase in false alarms, which increases sensing and transferring of data, resulting in higher resource consumption. To reduce and mitigate the problem, we propose verifying the alarm and sending a user feedback using a smart device or smartwatch application so that a user can respond to whether the alarm is true or false. This paper presents a user-feedback system for use in activity recognition to mitigate and improve possible false alarm situations, which will consequently result in helping sensors to reduce the frequency of transactions and transmissions in wireless body area networks. As a contribution, the alarm determination can not only improve the accuracy of the alarm by utilising mobile app screen and speech recognition but can also reduce possible false alarms. It may also communicate with their physician in real-time who can assess the status with health data provided by the sensors.
1. Introduction
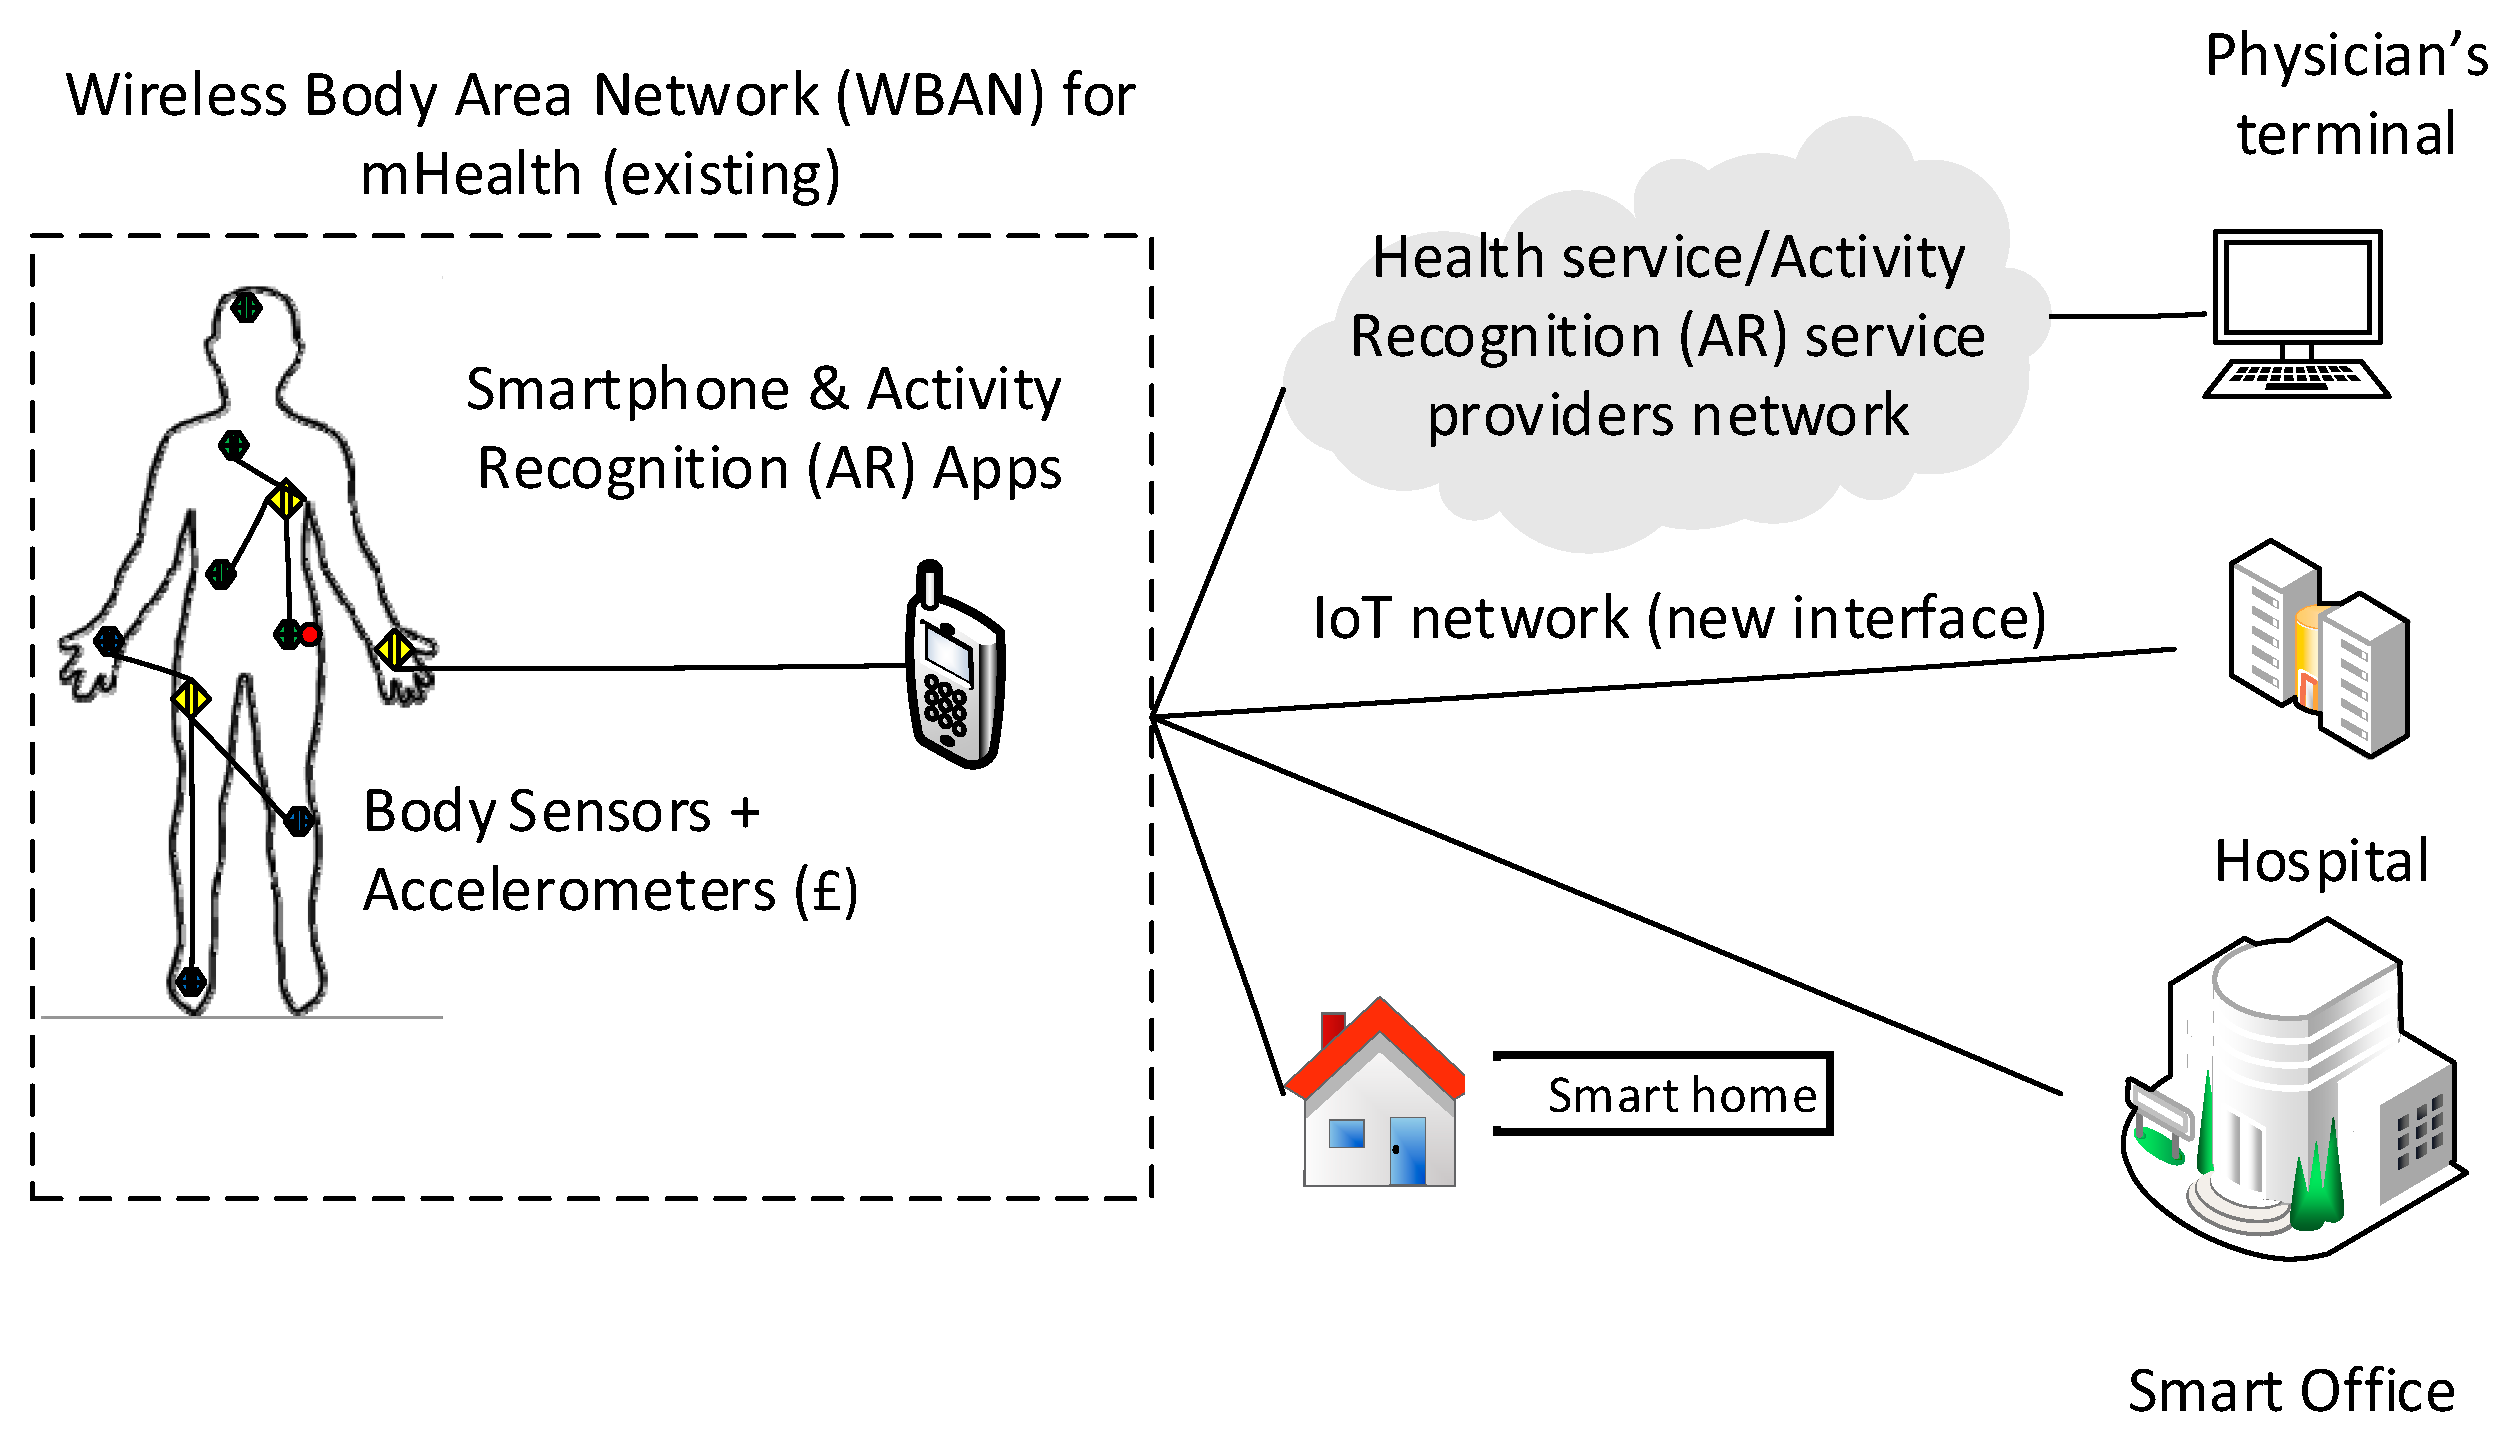
The rapidly increasing prevalence of wearables and body sensors allows additional services such as smart environments to be applied to activity recognition technologies, as seen in Figure 1 [1]. Activity Recognition (AR) has become an emerging research area along with mobile technology and personal real time sensors and monitoring devices, which can use health information to improve AR [2]. Typical AR processes involve sensory data collection, labelling and deploying data to build and train a model for classification [3] on which most AR works have focused with modelling processes.
As applications, knowing body postures and a user’s current activity status can be very useful in a wide range of industries such as in entertainment; social networks; military; sports; people surveillance in childcare, hospitals or prisons; performing arts; and health care and aged care services [4]. Taipa [5] demonstrates how wireless accelerometers can be used for real-time automatic recognition of physical activity type, intensity, and duration as well as an estimation of energy expenditure.
However, current AR technology still provides simple and limited information such as sitting, standing, walking or running without much content. Moreover, there are multiple sensors required to increase the accuracy of the activity determination. Orha et al. [6] used three three-axis accelerometers in different locations of the body to increase the accuracy. They found that sensor placement on the human body is important both in terms of their portability and the information provided. For better recognition of posture and activities they found that at least two sensors are required and that the best results were obtained from sensors situated on the right thigh and on the right hand. However, this is arguable, as Atallah et al. showed that the best results for activity recognition were obtained from the ear [7]. This means that the more sensors they have, the better results they would obtain as Zappi et al. [8] found that classification accuracy greatly increases with additional sensors (50% with one sensor, 80% with three sensors and 98% with 57 sensors). In addition, the location of sensor attachment on a body may affect the AR performance and result in different outcomes.
There have been previous works done in health informatics of an alarm system using smartphones. Othman and Ek [9] propose an alarm notification system for pill dispensers to help users take the right medication at the right time. They use a combination of infrared sensors and an Arduino microcontroller, which controls the medication dose. There is a popup notification on the user’s smartphone when an alarm is triggered. Existing products such as MedTracker (Caldwell NJ United States) can record the time of medicine taken from the box [10] and intelligent pill boxes which have a notification function using the Skype [11]. In terms of alarm notification functions, there have been various technologies such as alarm notification to tower monitoring system from centralized server/gateway in cellular and internet of things (IoT) networks [12]. Dalya and Shedge [13] propose a system which consists of an android-based PC application. The user simply captures the image and uploads the image to the database, which is processed against an algorithm called K-shift algorithm. It infers the wound status of the user before sending it to an expert for examination. Their results show approximately 80% accuracy, and the smart phone system provides promising accuracy for wound image analysis.
In conclusion, there have been no works performed for health devices and sensors providing alarm notification inferred by health data and activity sensors using smart devices so that a user can verify the status of the alarm.
Therefore, there is a possibility of benefits in using AR application together with health data as below:
- The number of AR sensors required may be reduced with additional health information such as heart rate data as it is correlated with human activities with unique traits.
- The activity status can be confirmed by health information.
- Alarm determination can be improved by a user feedback system.
Why Is the Optimization of Alarming So Important?
Personal sensors are required to be equipped so that the additional information can be used in tandem to verify the activity and postures. With these extra data available to analyse the posture (e.g., sitting or walking), it will be possible to provide granulized information and the level of the posture as there may be tendencies of physiological data to be of certain values while performing those activities. As experimented and shown in Figure 2 and Figure 3, body temperature, respiration rate and heart pulse rate tend to rise with increased exercise or activity as compared to during rest or sleep mode. This kind of information is important to mobile health services, and can be used to determine whether an alarm should be triggered or not depending on the activity of a patient. For instance, a heart rate of 170 beats per minute (BPM) would be considered normal during exercise, however, it would be a critical value if it was obtained while the user was sleeping and may signify a medical emergency such as a heart problem. Thus, the significance of utilizing AR is crucial as it provides the knowledge of an activity before raising an alarm in providing health services by body sensors.
In our experiments, results show that using physiological sensor data along with the existing three-axis accelerometers can verify and improve the accuracy of AR by experimenting with the unique physiological data related with each activity on an individual basis.
The burden of bandwidth and battery consumption of sensor devices are expected to increase due to a rising demand and usage of the Internet of Things (IoT) [14], which is forecasted to connect up to 25 billion things by 2020 [15]. In order to reduce the number of transactions and the frequency of data transmission in wireless body area networks (WBAN), we propose to implement an inference system on personal sensor devices (PSD). When implemented on sensor nodes, it is able to raise an alarm by analysing sensed physiological data along with activity recognition (AR) sensors such as three-axis accelerometers. This is done by verifying two points of information: (1) a pre-defined threshold table, which shows the estimated activity based on multiple sensor data, e.g., heart rate (HR), respiration rate (RR) and body temperature (BT); and (2) the activity data obtained by AR sensors. The threshold table as shown in Table 1 is personally prescribed by the user’s medical practitioner as the range of health data and its traits varies across individuals according to their unique factors such as age or health conditions.
The alarm notification compares the sensed data against the activity of the user to determine whether an alarm should be raised or not as the sensed data may be normal or abnormal depending on the activity of the user at the time. For instance, a heart rate of 170 BPM may be within the normal range when a user is exercising however it is abnormal if it is observed during sleep. Thus, it is crucial for the inference system to learn the activity of the user. An inference system may raise multiple alarms when a user’s activity varies frequently within a short timeframe, and this may cause a problem. For example, a user may be determined to be conducting multiple postures in an order such as running, sitting, standing, dancing, running and sitting over the period of a short interval, e.g., every 10 s during an art performance, and there may be multiple alarms raised by the sensor device during this time which may be deemed to be “false”. This will increase the number of transactions and traffic volume as this will automatically turn on the frequency of sensing to maximum in order to sense and transmit at a high priority. This may overload the sensor and potentially prohibit other priority transactions such as data requests from caretaker terminal (CT) devices of health service networks. To minimize the instance of a false alarm notification, we propose to use a user-based verification method through a smart device application (app), which provides an option to confirm whether the situation is cause for alarm or not by responding (or not responding) to a popup screen from the app. This will contribute to increase the alarming function of the inference system via a twofold verification of the alarm thereby providing: (1) true alarm notification; and (2) false alarm reduction.
Speech Recognition for Mobile Phones are implemented over GSM and 3G networks based on TCP/IP and UDP/IP protocols [16]. It provides plug-in ready solutions for the deployment of distributed speech recognition (DSR) systems on conventional mobile devices using existing network infrastructures. For portable devices, voice user interface (voice UI) plays an important role to enhance the usability of small portable devices, such as mobile phones. Voice UIs are widely deployed and accepted in commercial applications. A core technology enabler of voice UIs is automatic speech recognition (ASR). Applications in mobile phones already provide name dialling, phone book search, command-and-control and, more recently, large vocabulary dictation [17] and industry standards such as ETSI (European Telecommunications Standards Institute) have been in place for a long period of time [18].
This paper makes the following contributions.
- We propose a new idea of inferring sensor devices to learn and notify of an alarm situation by comparing data with pre-defined threshold measurements prescribed by clinicians for individuals.
- We propose a verification method by interacting with users through the demonstration of a smart device application so that the user can respond with the correct activity and situation.
- We evaluate our framework by analysing actual data captured during an exercise utilizing heart rate BPMs for each activity suggesting an idea of an individualized threshold table for each user. This can be prescribed by physicians or medical scientists after considering a user’s unique health history and conditions.
The rest of the paper is organized as follows: we discuss the system design presenting app design and interaction flow and app screen examples with algorithms in Section 2; in Section 3, we present the results with experimentation; Section 4 contains the discussion; and Section 5 has the conclusion.
2. System Design
Physiological data can be obtained by many kinds of body sensors and monitoring devices and health applications that may require health data. The data may include blood pressure, electrocardiography (ECG), heart pulse rate, electromyography (EMG), respiration, electroencephalogram (EEG), glucose monitoring, motion detection, thermometer, cochlear implant, blood oxygen—pulse oximeter (SpO2), artificial retina, weight scaling, sleep monitor and many others [19]. Whilst more sensors and data may be useful to determine an activity, vital signs are discussed. Only three vital signs (Heart rate, Body temperature and Respiration rate) are used for the experiments with body sensors as the fourth, blood pressure, cannot be measured practically during the undertaking of activities.
Vital signs are:
- Blood pressure (BP)—it is discussed but not used for experiments;
- Heart rate (HR);
- Body temperature (BT); and
- Respiration rate (RR).
Health data have unique traits as opposed to other sensor network data, and therefore they need to be treated and processed differently.
- There are inherent lower and upper limits imposed on the data. For instance, the human body temperature naturally falls within 35.5 °C (96 °F)–38.33 °C (101 °F) with a normal temperature of 37 °C (98.6 °F) [20], and critical deviations from these values would result in death.
- The normal values of sensed data vary depending on a user’s characteristics such as age and sex.
- The same data could be regarded as normal or abnormal depending on the situation. For example, a heart rate of 150 beats/min is regarded as normal during running but is a cause for alarm during sleep.
- They are related with one another, e.g., a linear relationship between temperature and pulse rate with an average increase in heart rate of 4.4 beats/min for each 1 °C (2.44 beats/min for each 1 °F) rise in temperature over the range of temperatures examined (35.5 °C to 38.2 °C) [20].
- They are in the form of numeric numbers.
2.1. Activity Determination
Whilst current AR provides the real-time status of an activity, this information can be used for the inference system to determine a situation of the user and to infer whether to raise an alarm or not. By combining various data sources, it is possible to determine a situation or activity as physiological data are related to each other. When a user is running, for instance, the heart rate increases, body temperature goes up [21] and respiration rate also rises, and this information can be read together.
When sensors capture data, the actual value to be used is calculated to produce the health status value. Table 2 shows an example of how it can be calculated and weighed to find critical values by allocating different weightings for each sensor. Attributes can be each of the sensed data such as blood pressure (e.g., 140/90 mmHg) with systolic/diastolic, pulse (e.g., 97 BPM and Body Mass Index (BMI) (e.g., 24 = 170 cm/70 kg). Inferred values can be obtained by applying thresholds such as low, high, normal, abnormal. This can also include data such as male/female, age, related diseases, body weight, exercise tolerance and overall health condition [22]. They are used along with the weighting of the attribute which is the portion of which it affects health status. This is because not all attributes are equally affected by an activity or situation of a human who could be young or old, male or female or any other such variable. The outcome of the inferring process is to calculate a personalized range of normal thresholds for each attribute and to compare it with generic information. For example, comparing the personal blood pressure range (85/55–110/70 mmHg) to the generic range (90/60–120/80 Hg) of the specific group the user belongs to. Table 1 shows another example of how the weighted value can be used to calculate a situation activity when there is an “ambiguity of the situation” based on each application. Thus, the outcome in this case will be a determination of the user being in a “running” activity state. In the case of AR, the weighting is 100 which results in 100R (Running) activity. HR has a weighting of 20, which results in 20W (Walking). Therefore, the result shows 100R + 50R = 150R and 20W + 30W = 50W. Thus, the inference outcome (150 > 50) is one of running based on these weightings. These weightings are given arbitrarily, however, they should be defined by physicians or scientists.
Whilst the AR sensors indicate the status of activity motion, they do not show the level of activity such as the degree of tiredness from the accelerometer. Furthermore, the accuracy of the activity relies on the sensor location which can be unreliable if placed in the wrong location. To enhance the quality of the content, a combination of physiological and AR sensor data can be used to assess the situation.
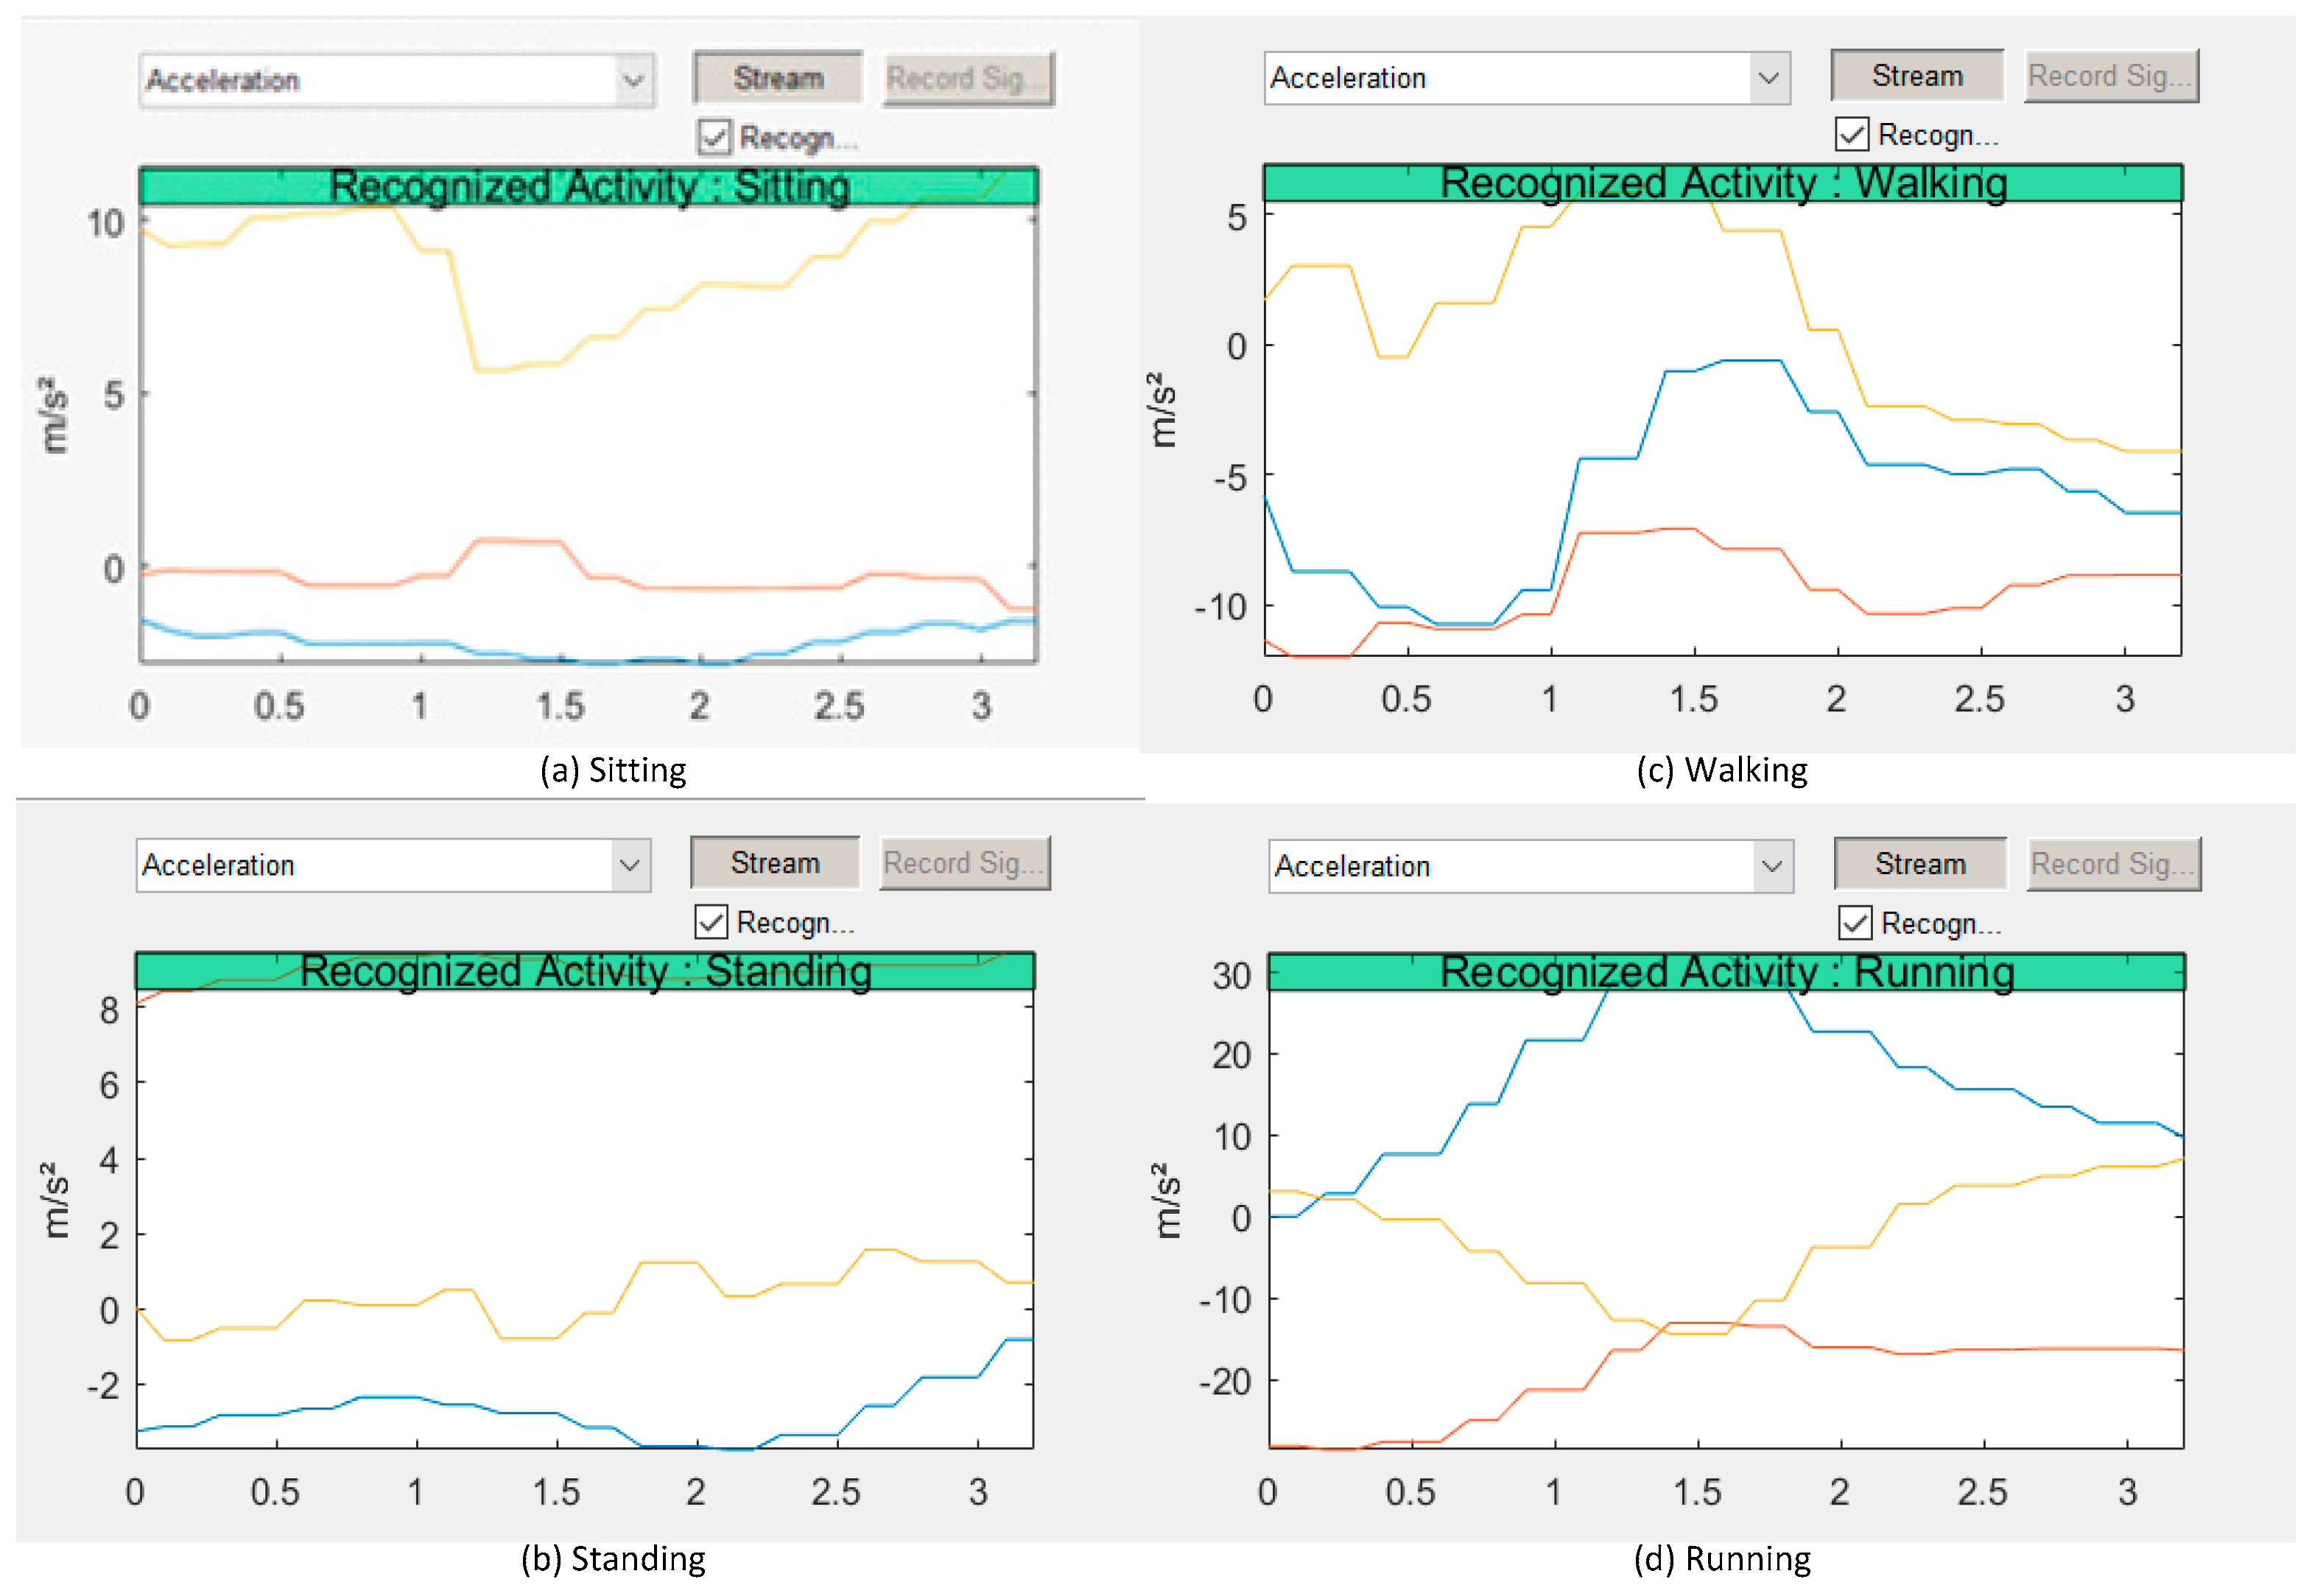
Figure 2 shows an example of AR demonstrated using Matlab (9.0 R2016a) and an app installed on an Android smartphone. These data can be used along with physiological data processed by an algorithm [23] in order to determine and verify the activity situation. The objective of situation determination is to infer whether the sensed data is in the range of the alarm threshold. Thus, when the result of sensed data does not fall into the appropriate field of the threshold, an alarm notification process is engaged.
2.2. Algorithm Creation
There are traits in human activity and the reaction of physiological data to the activities. As the outcome of the experiment, some knowledge are obtained as the following:
- When an activity changes from a less active to a more active state, physiological data values of HR, BT and RR tend to increase as shown in Figure 3.
- When an activity or movement suddenly changes, it takes time for the corresponding physiological data to change accordingly.
- Physiological data cannot represent or reflect instant movement changes, such as stopping for a few seconds during running.
- AR data alone cannot tell the degree or detailed content of activity.
- The exercise intensity is an indicator of kinetic strength, and the Target HR is calculated by the Karvonen Formula [24] and Heart Rate Karvonen Formula [25] as defined by:where . Using Equation (1), the Android app calculates the training heart rate as below for our tester who wants to train for the intensity level of 50% to 70%, for example.
- Max HR: 220 − 16 = 204
- 204 − 67 (resting HR) = 137
- 137 × 0.50% + 67 = 136 BPM (minimum training HR)
- 137× 0.70% + 67 = 163 BPM (maximum training HR)
Based on these operations, they are compared to the actual averaged HR measurements in our experiment as in Table 4, Table 5 and Figure 9, which shows the values during walking (138 BPM) and running (155 BPM). This information is used to create an individualized threshold data for situation determination, which can be used together with other data such as Respiration and Body temperature to verify the AR data obtained by accelerometers. There may be a case of tricky results when combining the physiological sensor data after inference of their values. As shown in Table 1, the activity could result in a 50% Walk and 50% Run status after considering the weighting. In this case, the activity of AR data cannot be verified by the physiological data unless the weight has been reallocated to avoid this kind of situation. If this situation occurs, it remains as a dilemma and should be manually reviewed by a physician who can alter the weight or decide which inference to take. However, this is a rare situation and data from before and after that point in time can also be taken into account for determining the likely activity.
When there are multiple sensors and data obtained for the same attribute, e.g., heart rate, the inferred value is used to represent how the attribute locates the overall status of the individual’s health. In this case, it may not give many options to discern due to discrepancies.
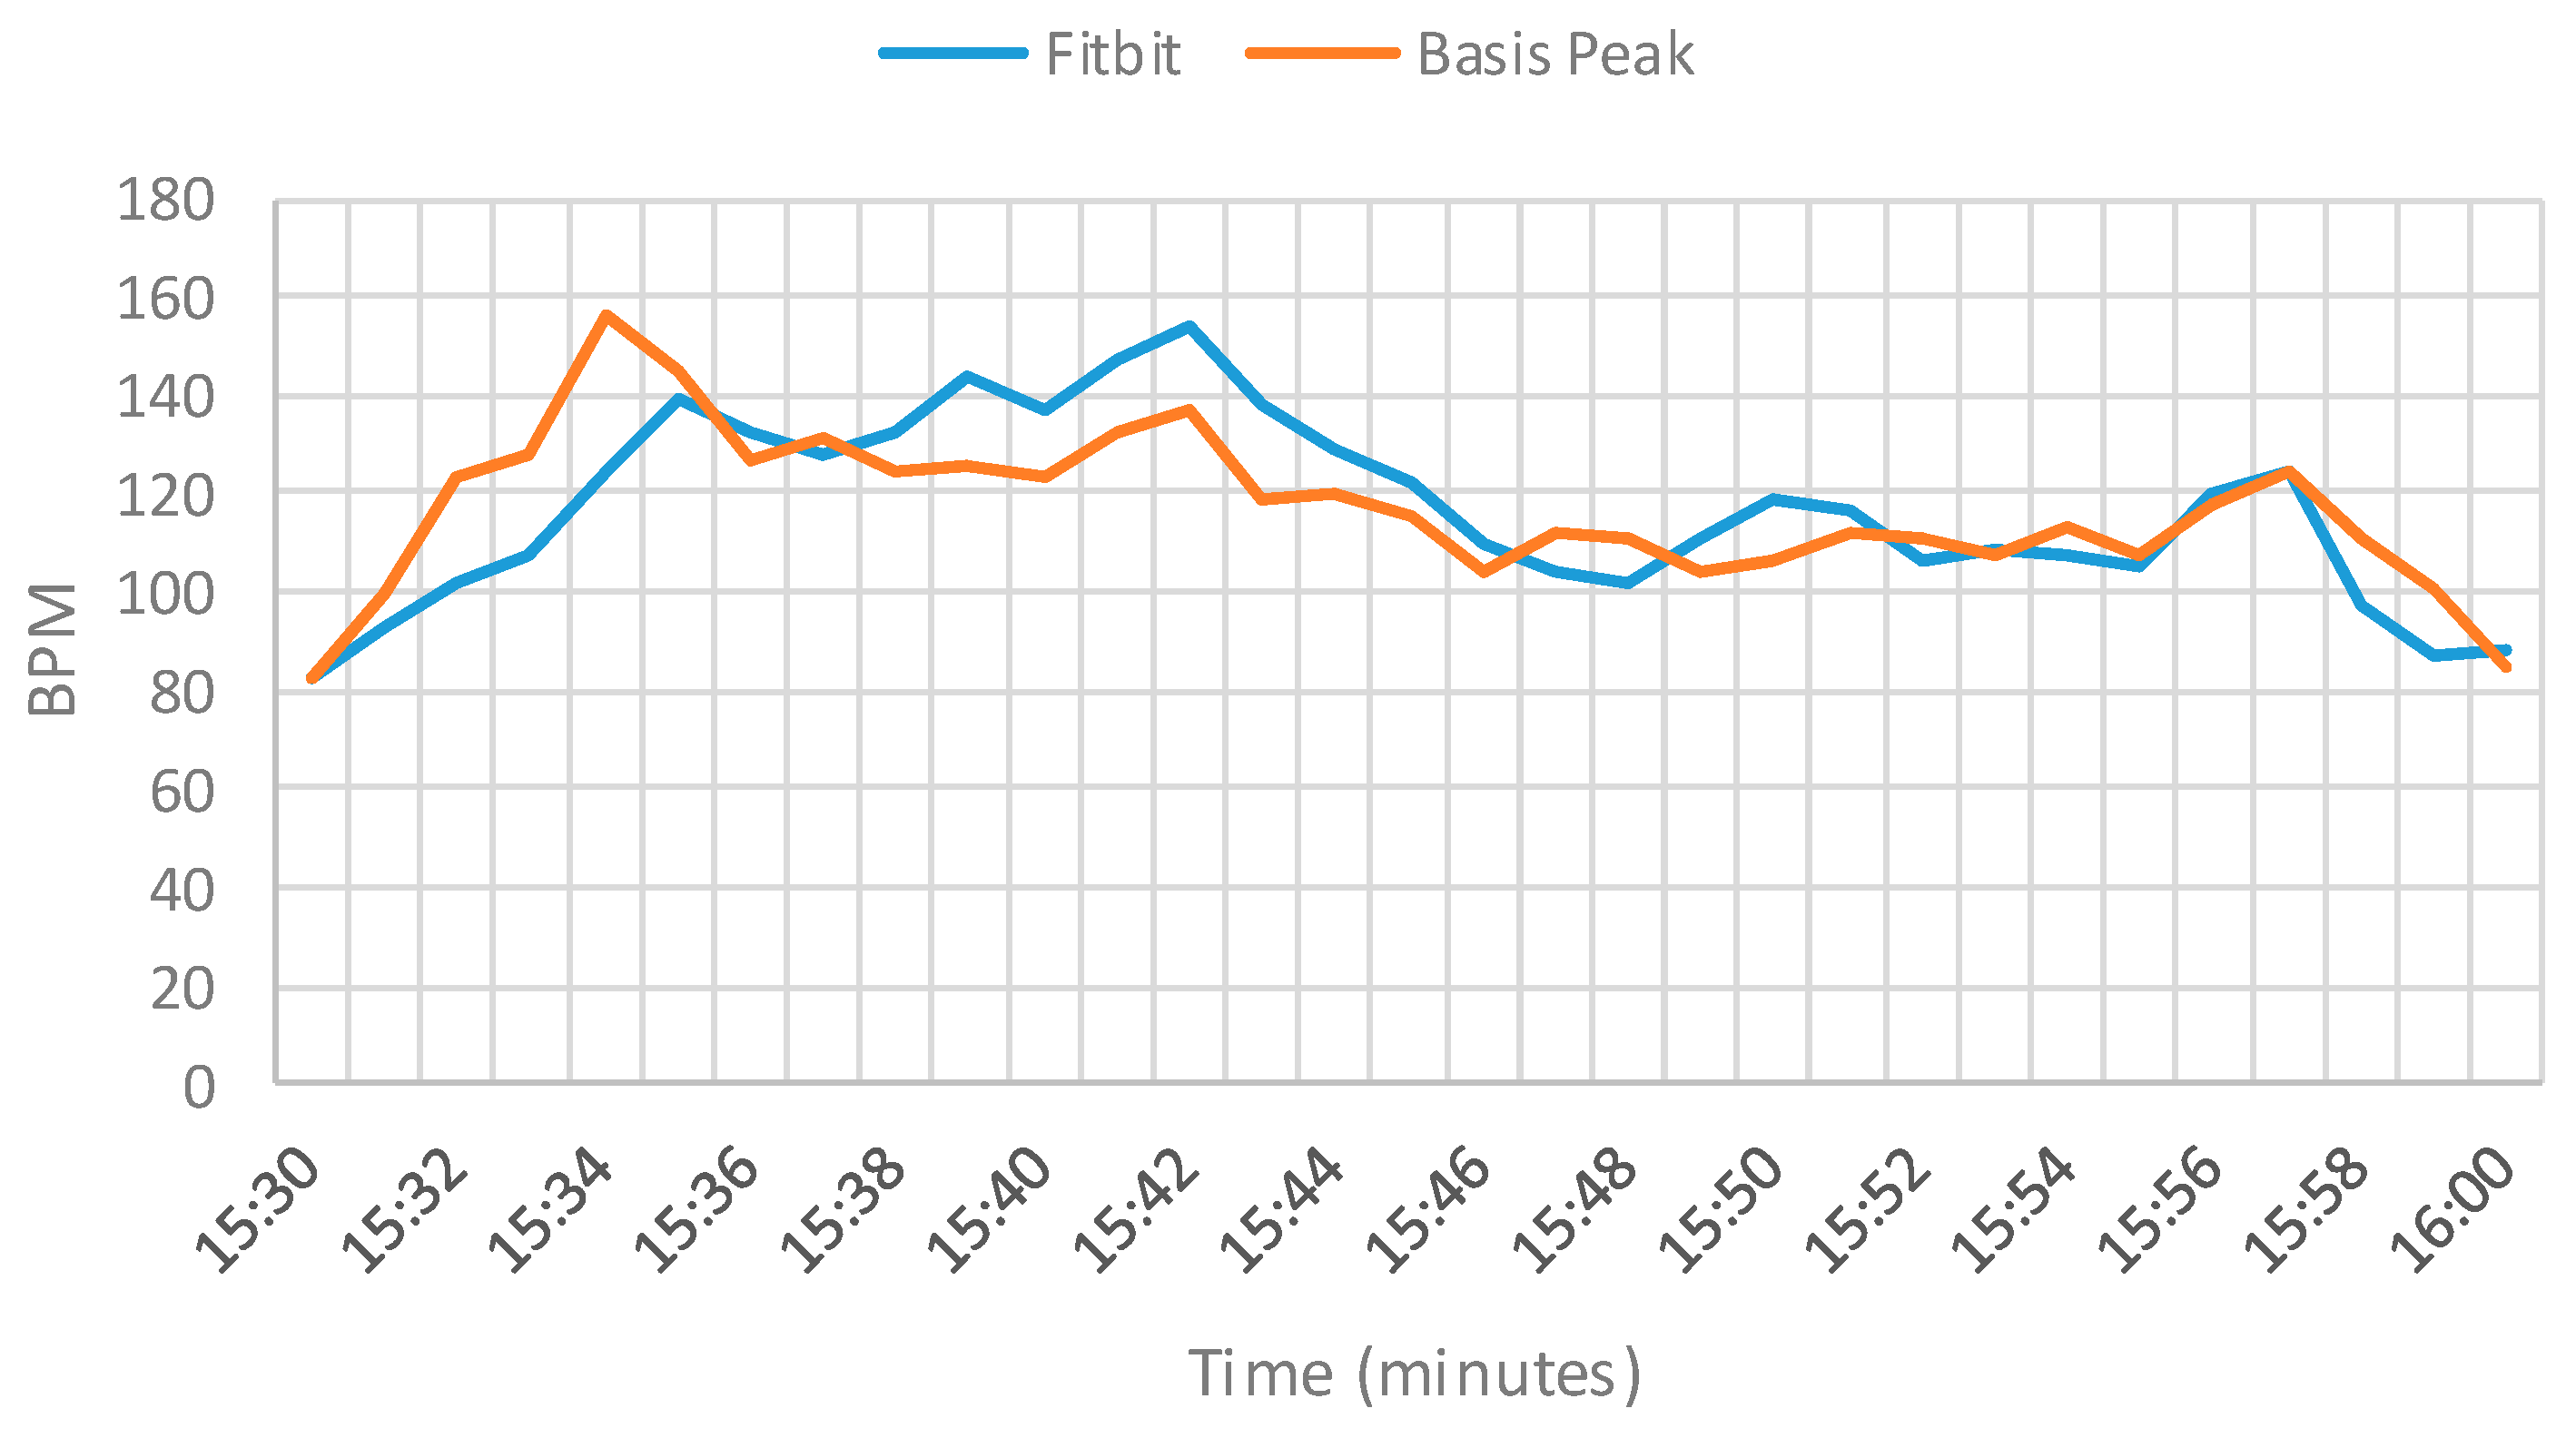
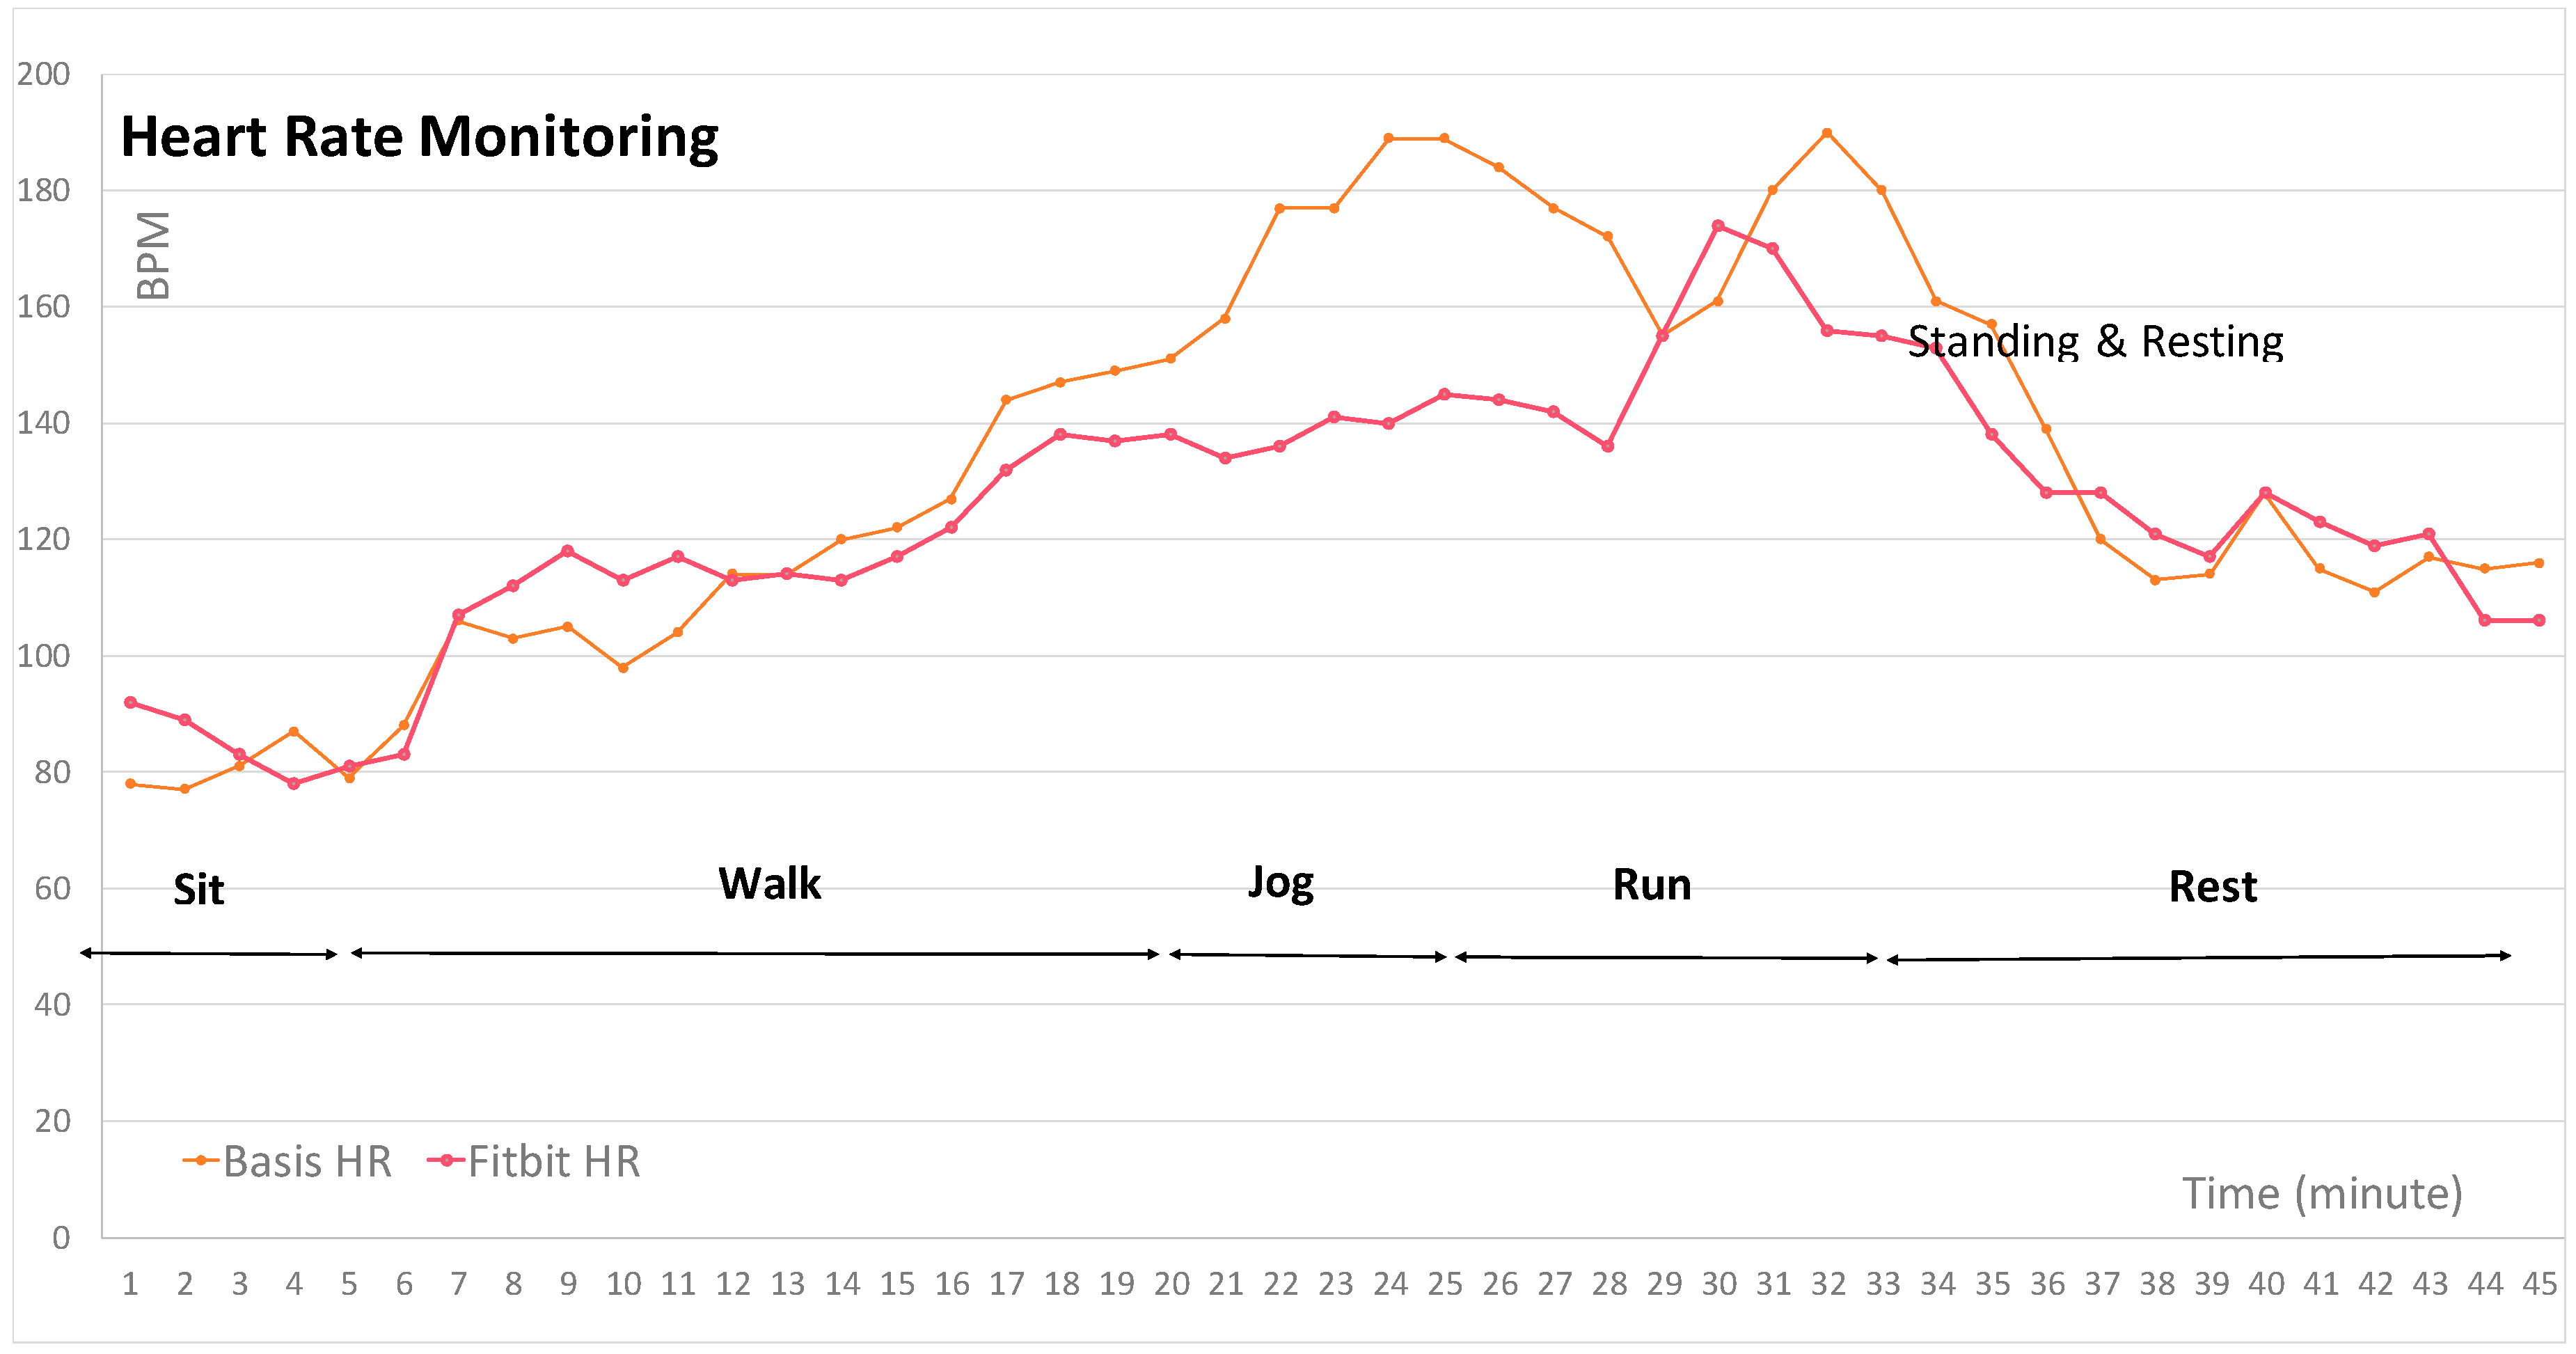
As shown in Figure 4, it shows the gaps of two different data, which were taken from 30 min of walking while wearing two devices on the same wrist. This gap could be accounted for by averaging the values from the two data sources. When the number of sensors increases to more than two devices, it becomes more difficult to determine how to handle the data. When sensed data from various sensors are different and some of them are not consistent with the rest of the data, it needs to be an inferred point to decide on whether the specific data should be ignored or used.
2.3. Alarm Notification Utilizing AR and Smart Device Application
In the age of smart devices, there are several possibilities to where user feedback can be sent. The two most pervasive are smart devices and smartwatches, where a user can receive a popup notification, and either ignore it or respond to it. Given the need for user simplicity, the system is designed so that notifications disappear automatically if no response is received, and any required feedback is in the form of single-tap buttons. When the smart device receives the alarm notification from the WBAN, it opens the app screen notifying of the alarm and allows the user to respond by selecting from a menu of options. If there is no response within a certain period of time, e.g., 60 s, this is deemed to be a “time out” and the app sends a confirmation message to the sensor node. If conditions persist to the thresholds of the sensor node, then the sensor node will take further action of raising the alarm to the next level, e.g., asking the user if they require help, and possibly notifying physicians or requesting emergency services as pre-programmed.
The app is capable of receiving any query from any sensor node, with answers received by all sensor nodes. As these are intended to be infrequent events and most often only during an initial training period, their effect on sensor node battery life is presumed to be negligible.
In the second stage of decision-making, a sensor node runs through the following logic:
- The user feedback is received and averaged with existing user feedback.
- If the user’s data is to be outside tolerance ranges, further action is taken.
- If user feedback is inappropriate for the current reading levels, further action is taken.
When further action is warranted, a further prompt is sent to the user. From the app screen the user can select one of the options below as an example:
- ‘No, it should not be an alarm (I am OK)’.
- ‘Yes, I need help but not urgently (I am not OK)’.
- ‘Yes, it is urgent and I need help ASAP (I am dying, please save me)’.
For option #1, the smart device notifies the sensor of a “false” alarm, and the sensor discards the alarm and cancels the notification. For option #2, the smart device notifies the sensor of a “true” alarm and the sensor continues with raising the alarm. The smart device app notifies the alarm to pre-defined parties. For option #3, the smart device notifies the sensor of a “true” and “urgent” alarm and the sensor increases the alarm level to maximum urgency. The smart device app notifies the alarm to pre-defined parties whilst emitting siren noises. CT or physicians may actuate the sensor device for further action if necessary.
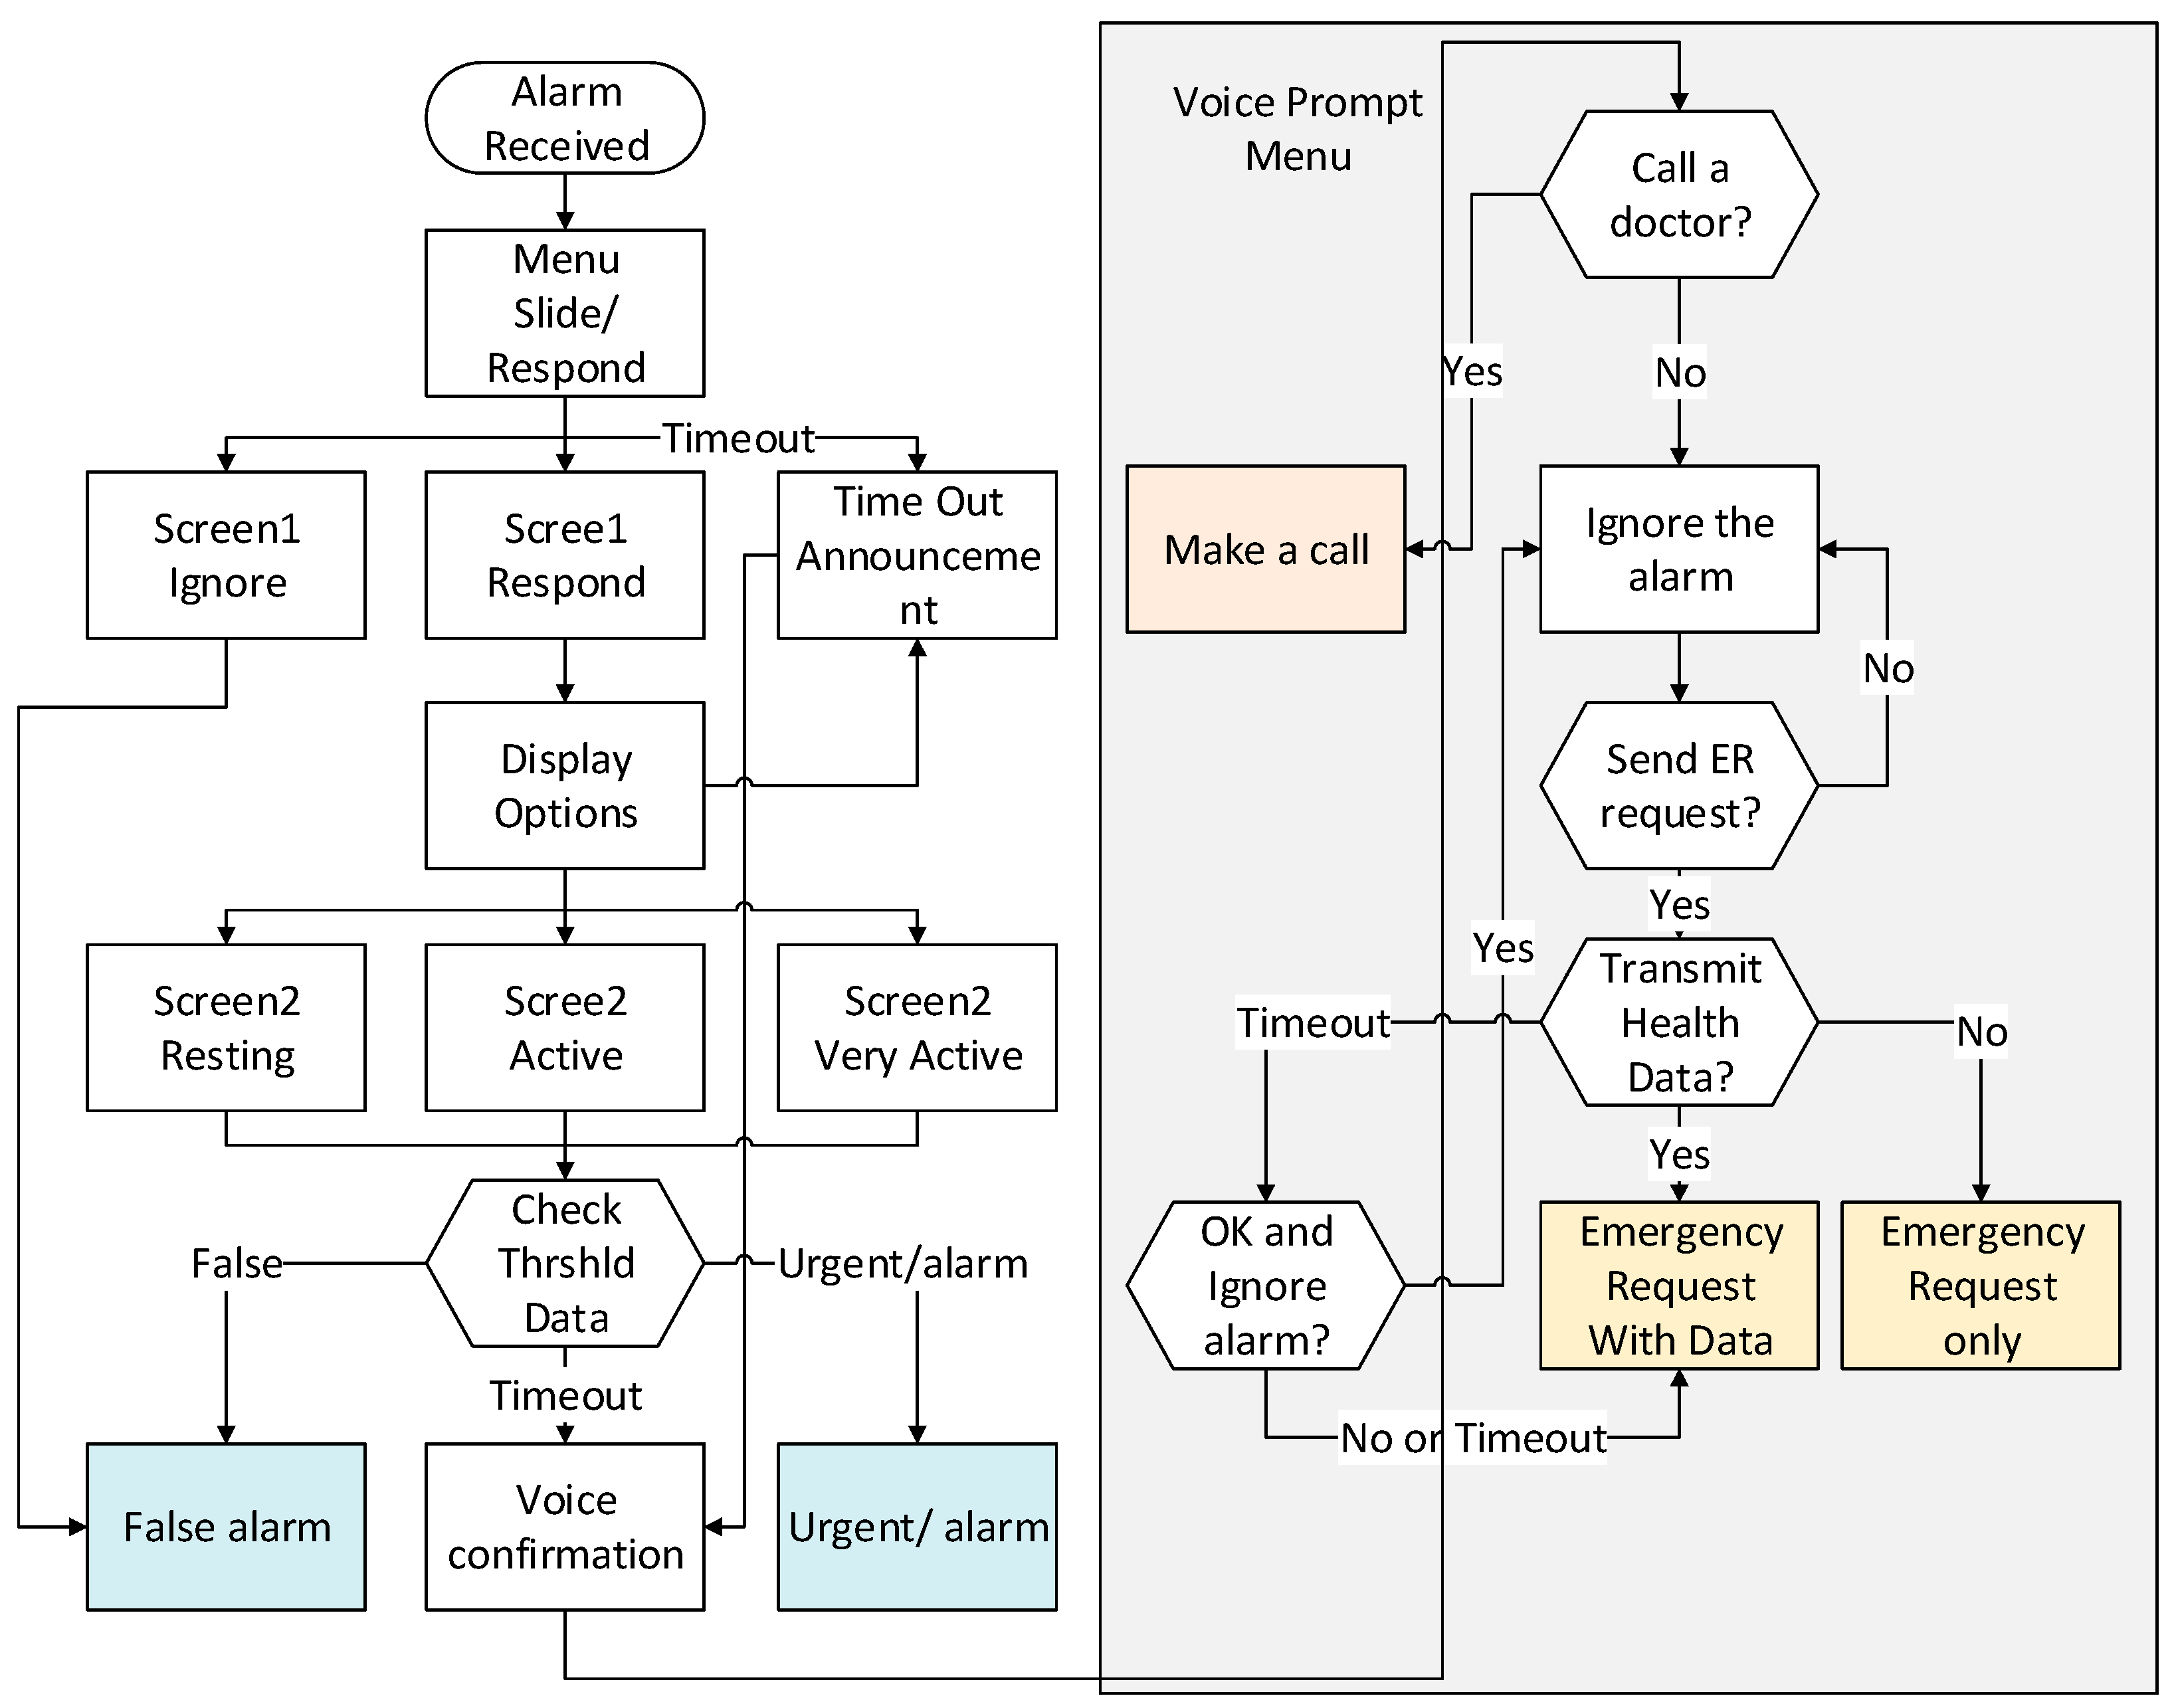
When the smart device is triggered for alarm by the sensor, it opens the app and requests the user to verify the validity of the alarm situation. If the user cannot confirm to the pop up screen by whatever reasons, the screen remains until the set timer expires. In this case, the app regards the lack of response as being received as an “emergency”, and the smart device triggers the voice confirmation functionality with the pre-defined questions. These voice prompts are configurable by the app to allow each user to customise the questionnaire based on their individual situation. For example, when the user does not respond to the voice prompt, the smart device may ignore the alarm as a default action instead of automatically sending an alarm. Refer to Figure 6 for overall procedures of the information flow, and the following shows an example of the voice prompts which is also displayed on the app screen:
- Should I call your doctor so that you can speak to him/her? (Yes or No is answered). If Yes, it calls the pre-programmed number. If No, it ignores the alarm. If no answer is received or failed to call, it moves to the next step.
- Should I send an emergency to your doctor? (Yes or No is answered). If Yes, it moves to the next step. If No, it ignores the alarm. If no answer is received, it moves to the next step.
- Should I transmit your health information to your doctor? If Yes, it transmits the user’s health information along with the alarm message. If No, it just sends the alarm message. If no answer is received, it moves to the next step.
- Are you OK and should I ignore the alarm? (Yes or No is answered). If Yes, it ignores the alarm. If No or no answer is received, it finally transmits the alarm message.
2.3.1. App Design
The smart device app has multiple screens to display the alarm notification and examples are:
Screen 1: Notification
- Alarm is raised at “14:22:00 21 July 2016”
- Slide to “ignore” (“false alarm” is inputted, and a confirmation message pops up) or “respond” (options screen is displayed with details of the alarm). A timeout event triggers the default alarm.
Screen 2: Details of the alarm
- User ID (name/nick name);
- Date and Time (incidence time stamp, current time);
- Location (with GPS turned on the location may be displayed);
- Sensed data which triggered the alarm, e.g., BPM 170;
- Sensed activity, e.g., sitting;
- Selection of 1 (false), 2 (default alarm), 3 (urgent alarm) or timeout, followed by a confirmation of the selection; and
- Screenshot options and information flow are shown below.
When the user responds with details of the activity such as “resting”, “active” or “very active”, the information is sent to the sensor, which will discern the normality of the alarm and take appropriate actions such as to ignore, raise the default alarm or initiate urgent alarming. Figure 5 depicts the process of user actions, and Figure 6 shows an example of an app screen displayed on the smart device for the user to respond and input to.
2.3.2. Sensor to App Communication
The app receives JavaScript Object Notation (JSON) data from the system or sensor nodes as requested by, e.g., UDP/IP, using WBAN interface and protocols such as Wi-Fi, Bluetooth, BT-LE, ZigBee, etc. [21]. The app looks at the “JSON key:value” pairs and simply displays each line. If a key ends in a question mark, then it is presented as an input, with an array of options provided for the user. The user can ignore these questions. The app will take no action if no user input is received. It will simply refresh the screen with any new sensor information or request when it is next received. Thus, the protocol is simple and lightweight, which is appropriate for its low-power energy requirements in WBAN. Upon reception of the user input, it is sent back to the same source IP address.
2.3.3. Feedback-Enabled Activity Recognition
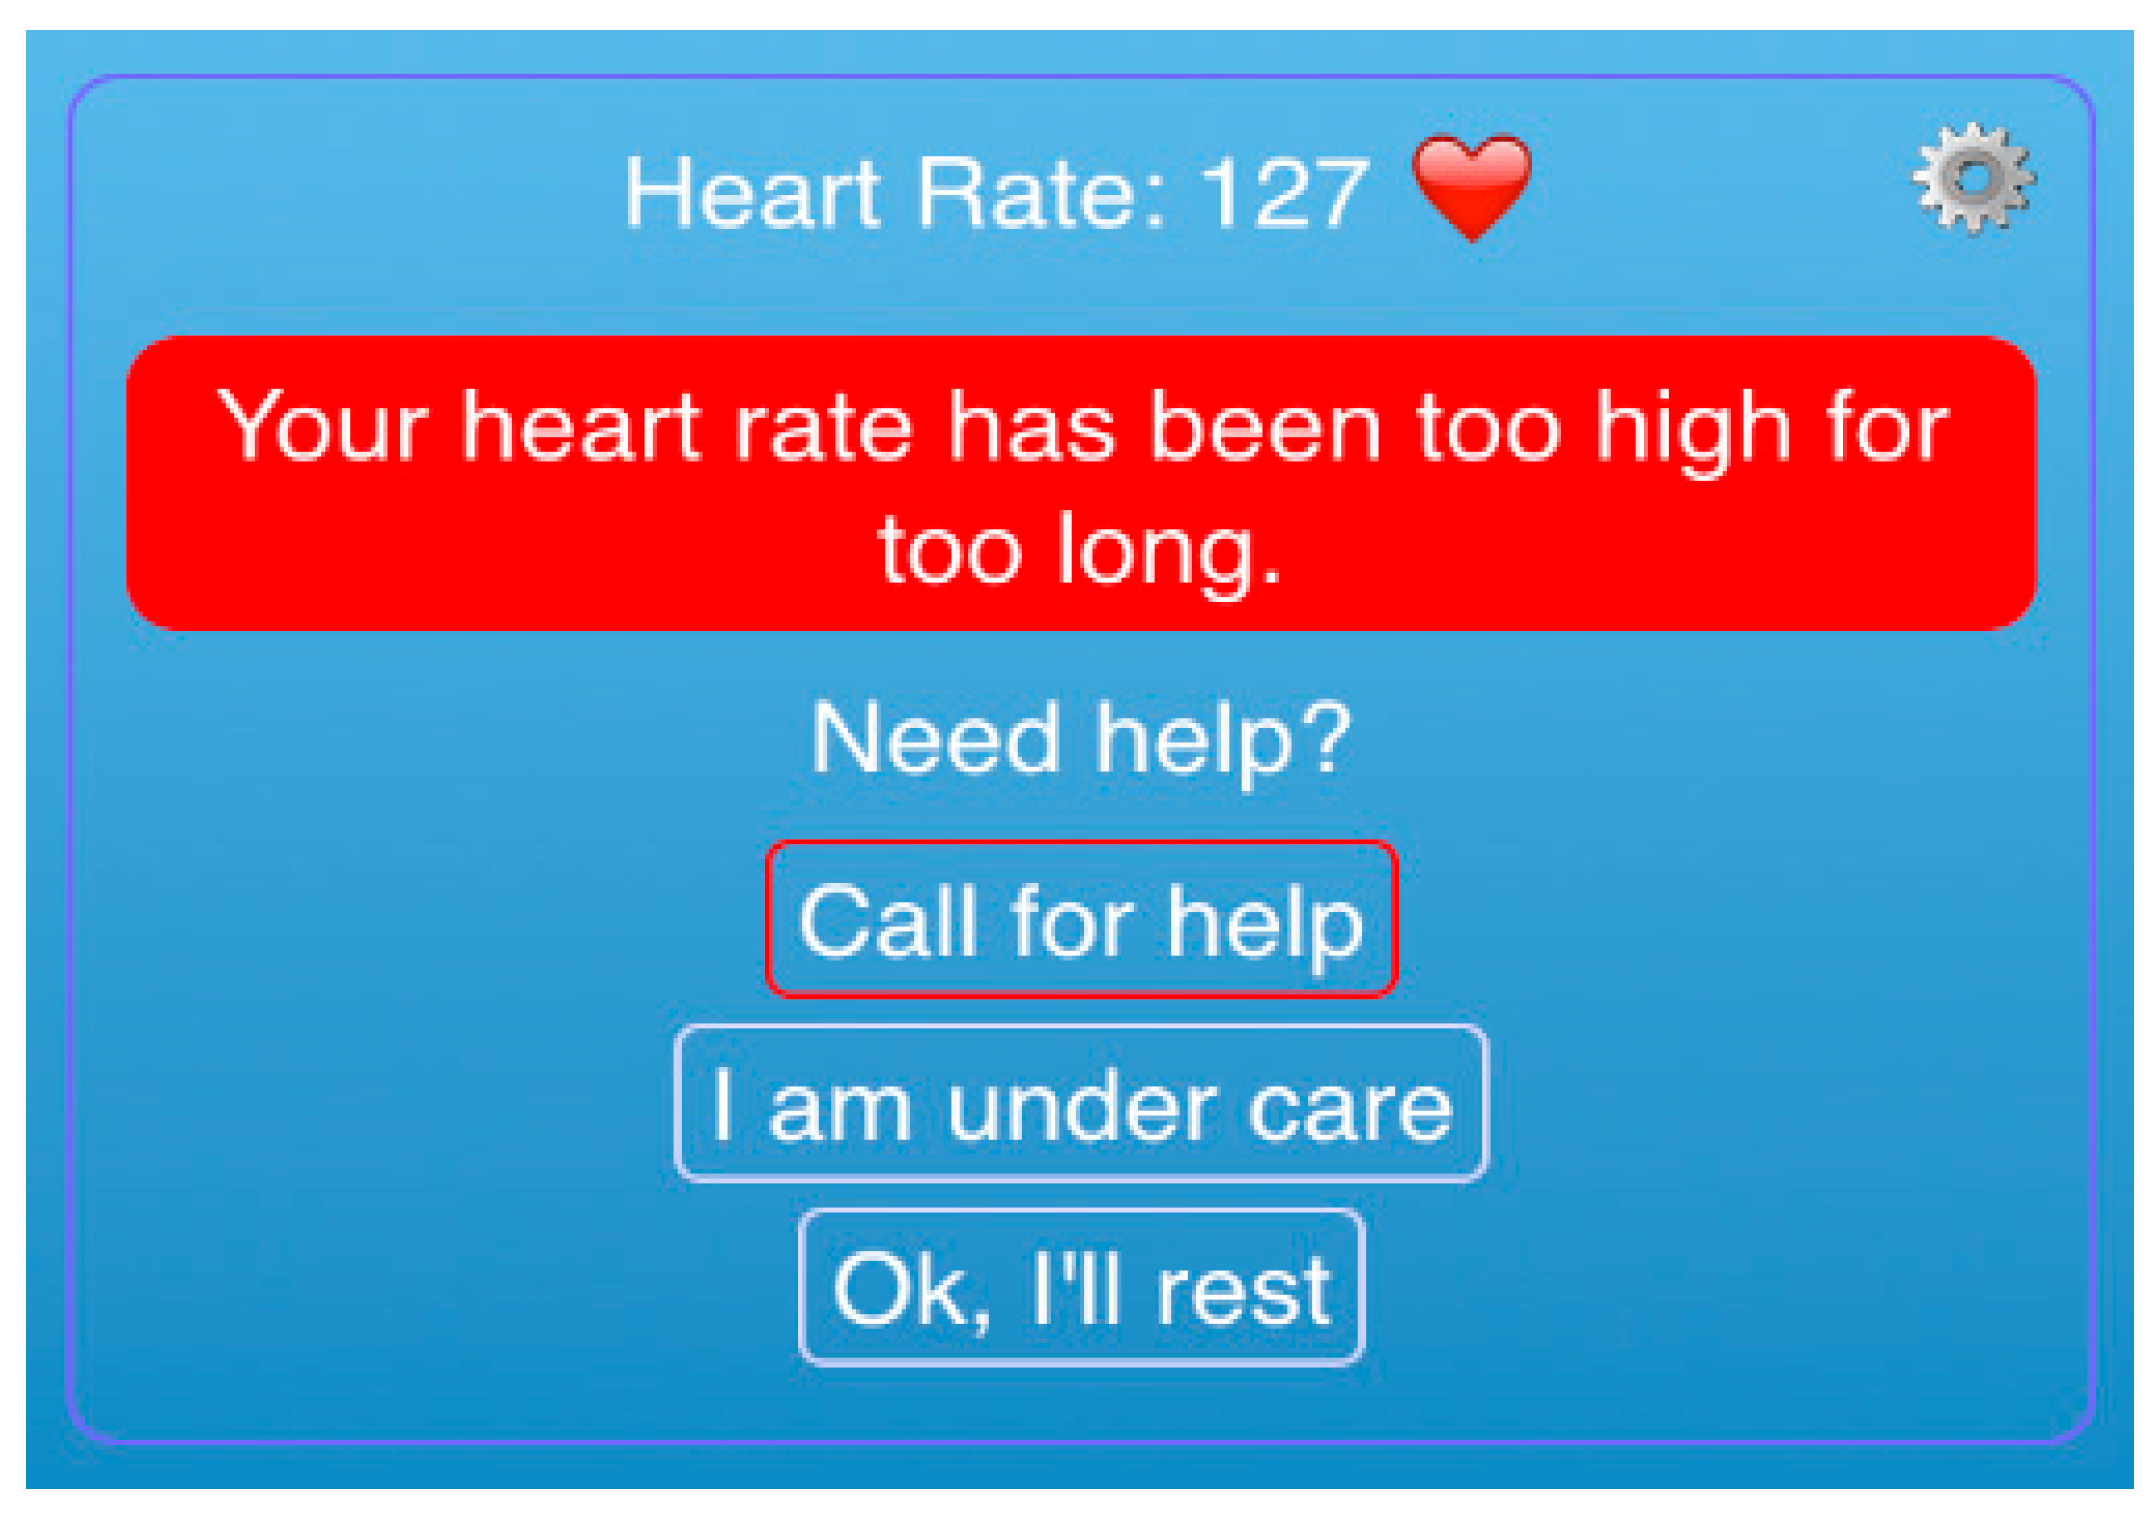
User feedback system allows any AR system to benchmark initial parameters unique to each user. Whilst Table 3 shows the resting heart rates (BPM) for men as a general guide [26], an individually prescribed threshold for activity can be prescribed by clinicians for each user as subject-specific training data are also required [27], as shown in Table 2. As an average man will have a different range of resting BPMs when compared to an athlete, as shown in Table 3, this cannot be applied to every male. Therefore, it is essential to create an individualized threshold table. Likewise, an AR system can also have a customized data set from learning and mining activity data using generic information obtained by big data as well as user inputs. A notification message can be individually customized such as the one shown in Figure 7. For example, the slow walking activity of an athlete may be a running activity of a child, and this difference can be accounted for by verifying with the child’s physiological data as a way to confirm their AR determined running state. In other words, the heart rate of 127 BPM is not necessarily considered to be “high” for other users as they may have a different range of thresholds.
The feedback system records a simple table per sensor node including the sensed information, the duration of sensed feedback, time, and user feedback. The application can further provide details of the activity as the heart rate, for example, will fluctuate during the “elevated” or “lowered” time. Therefore, the “start” and “end” times of the “activity” (or anomaly event), and the average during that period can also be included. This may require a separate table of the times and responses of each user feedback, linking to the ID of one “activity” period as there may be multiple responses if the activity lasts for a prolonged duration. This feature however is up to the application requirements.
3. Experimental Results
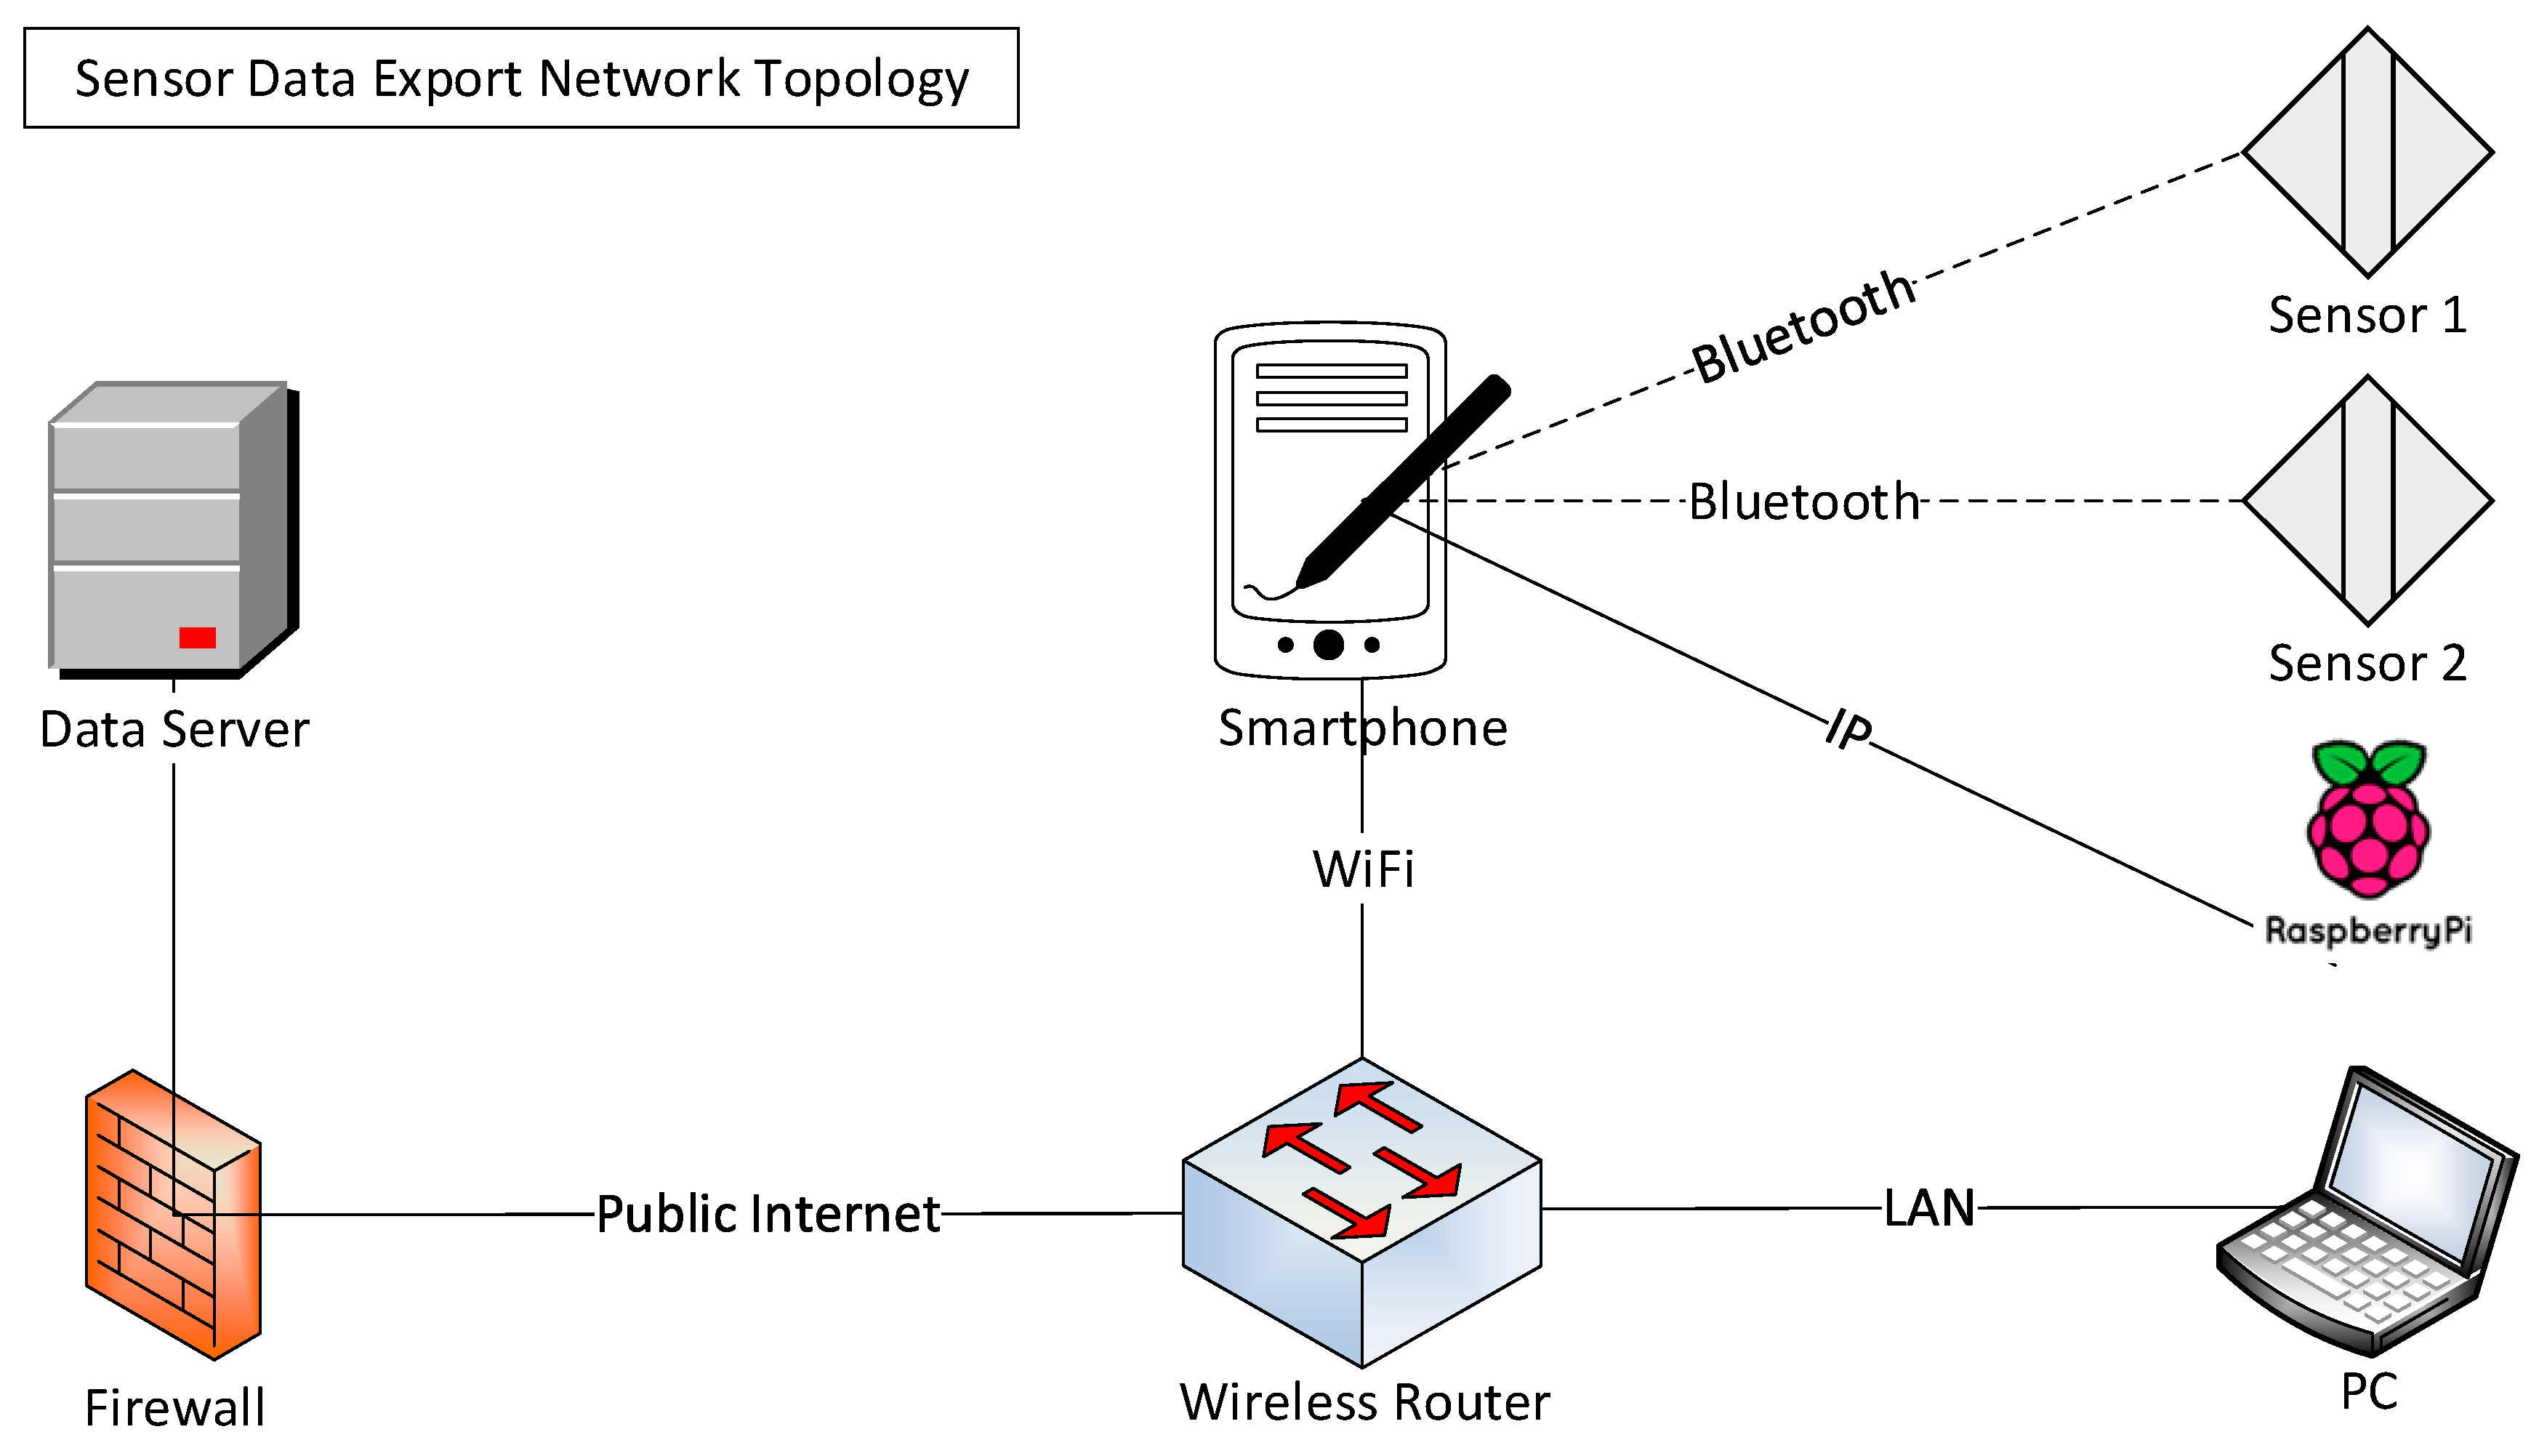
A network topology is designed and configured as shown in Figure 8 to execute the testing. Sensed data flow from the sensors to the data server for initial data processing, and are then sent to the smartphone app to display the data to users. The data server from which to retrieve sensed data sent by sensors devices is a production system of Fitbit (San Francisco, CA, USA), which sends a summary only of the data. During the process, therefore, it is required to program Application Programming Interface (API) commands to retrieve all data from the data server based on a sampling frequency and the desired period of time to export. The sensing time interval was every 5 s for normal mode, and every 1 s for exercise mode. Sensor devices used were Fitbit Charge HR for heart rate, and Intel Basis Peak for heart rate and skin temperature monitoring, which were attached on the subject’s body. Sensed data were transferred to the smartphone, which then transmitted them to the Data server for processing.
Since actual sensors devices used for testing cannot be modified for data transmission testing, a Raspberry Pi3 (Model B) is used to simulate data transfer from a sensor to smartphone to measure bandwidth and battery power consumption. To measure the relationship between the data transmission and battery consumption, Raspberry Pi3 records the size of transferred data and frequency of the transmission to smartphone.
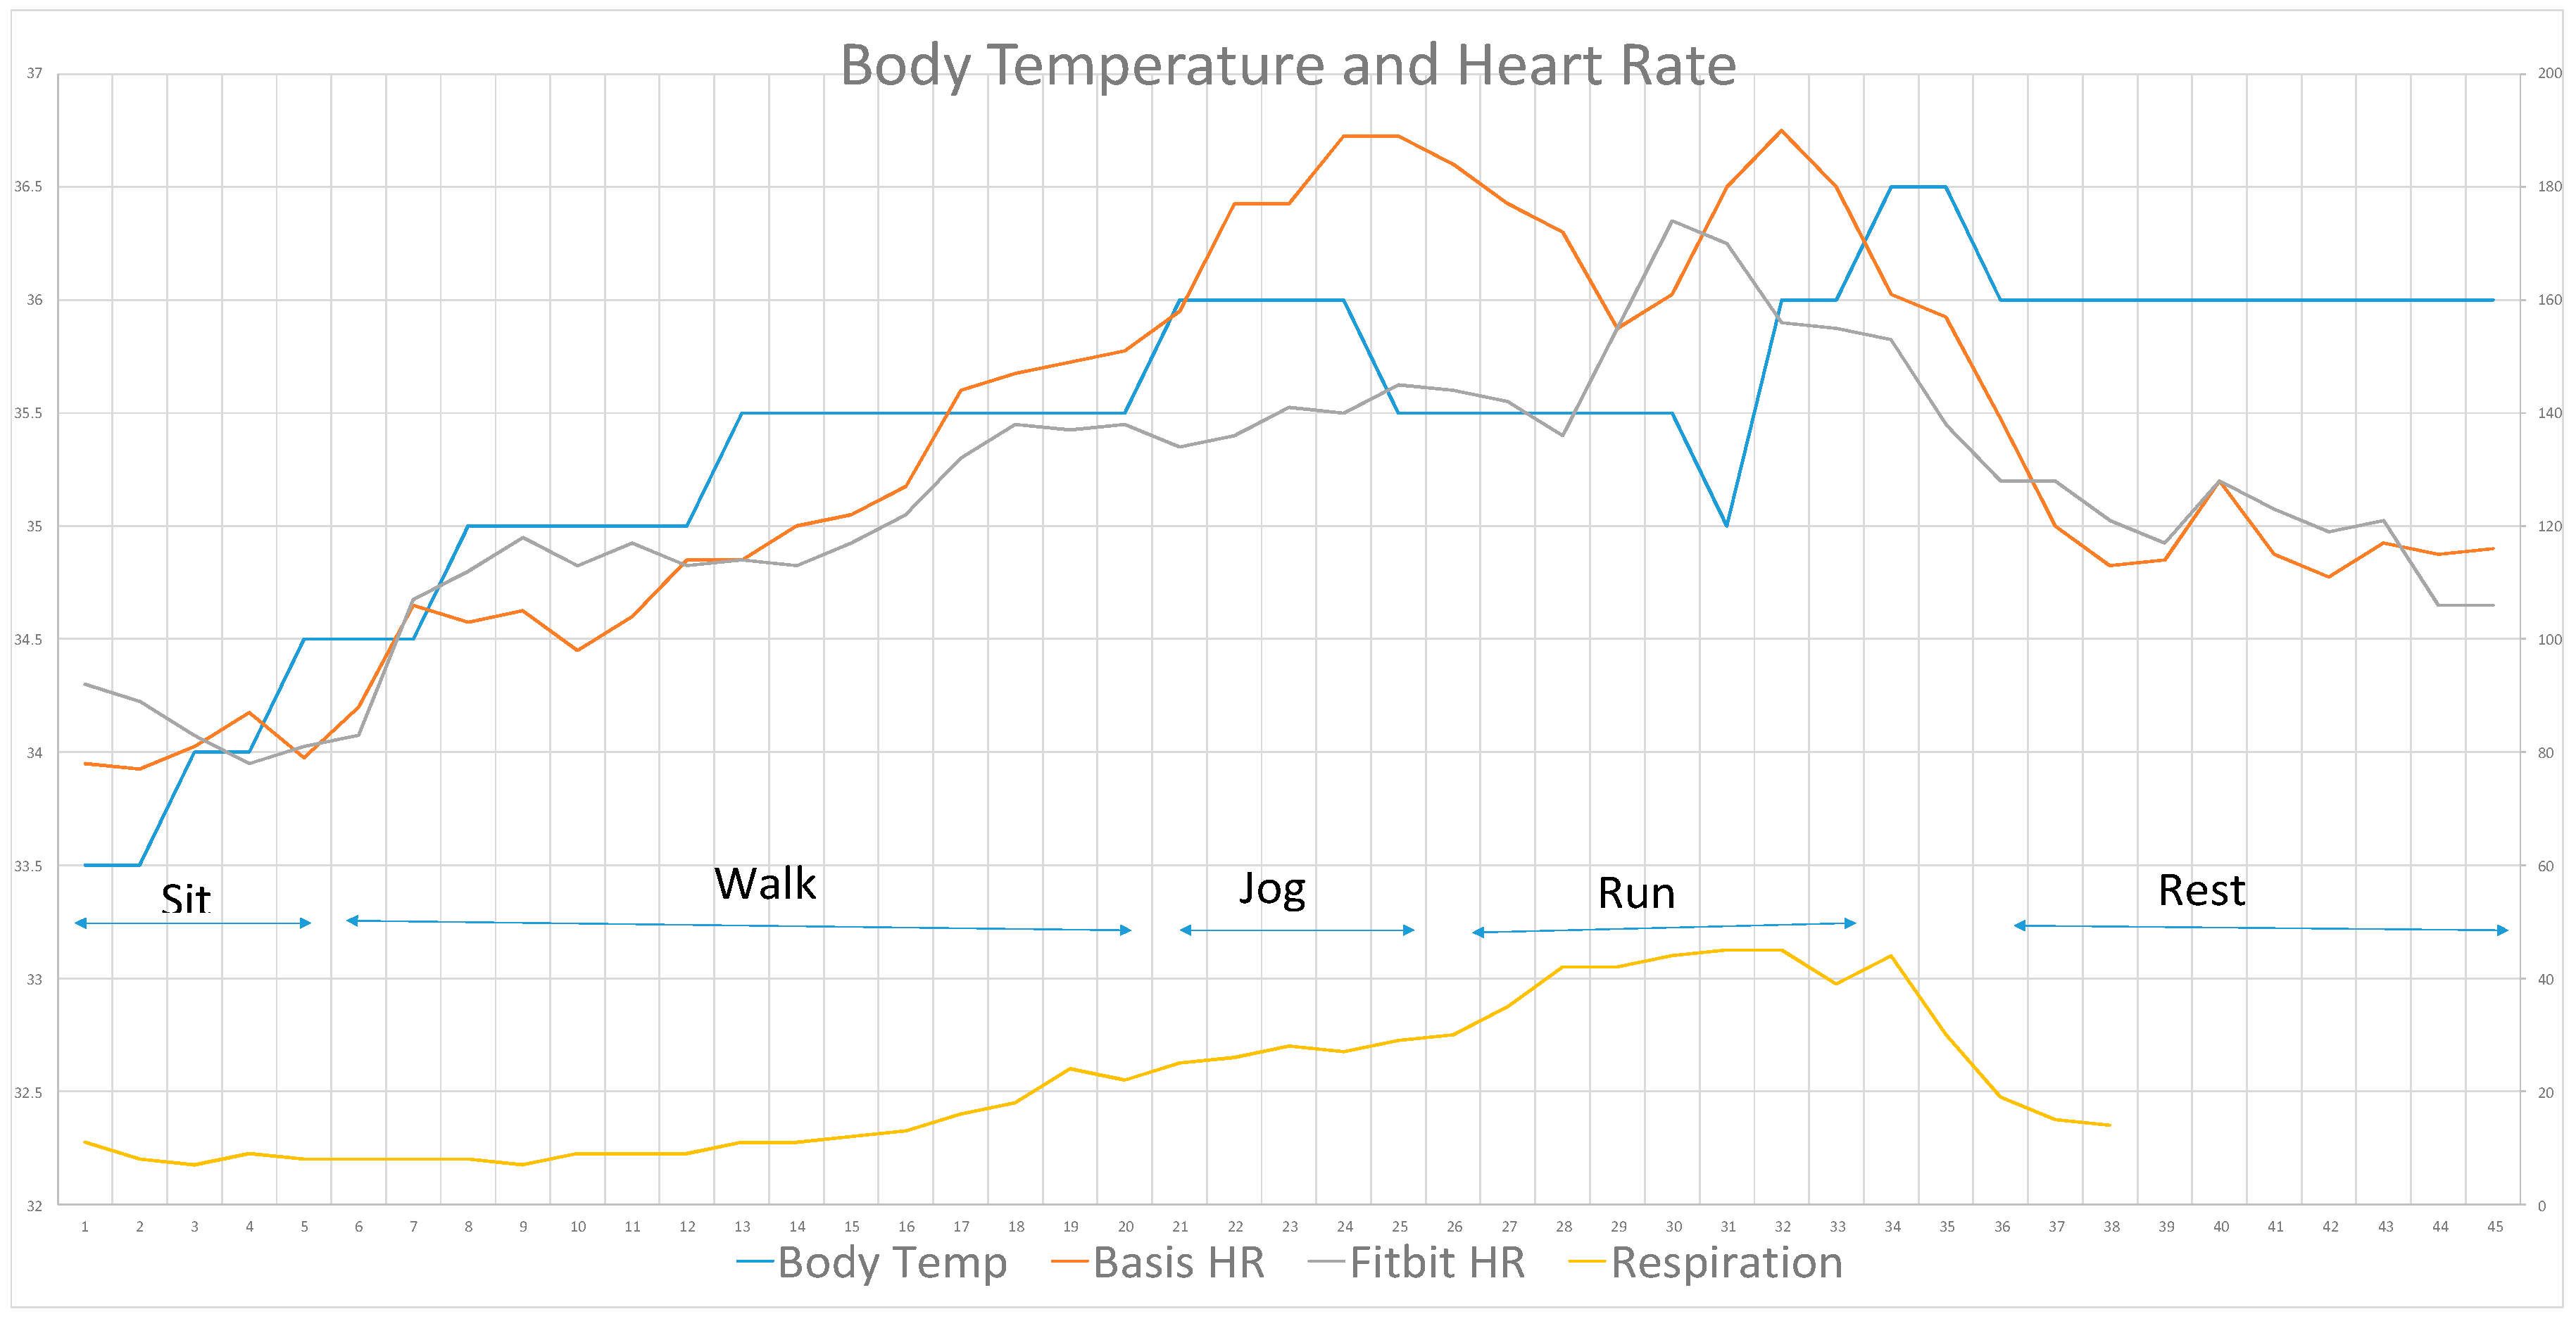
The experiment was conducted with a subject who is a female (16 years old, 162 cm height, 52 kg weight, Resting (67 BPM) in the morning and max (205 BPM) HR). The subject wore three sensors (Fitbit and Intel Basis Peak devices for heart rate monitoring, and a Basis Peak for skin temperature monitoring) including two sensors for the heart rate and one sensor for the skin temperature. She undertook different postures and activities over the course of 45 min including sitting, walking, fast-walking, jogging, running and resting (Figure 9). To obtain a stable data, the subject repeated the same sequence for three days to check the consistency of the devices and the result was obtained on the third day, which was similar to the previous days.
Results show that physiological data change according to the activities as below.
- Body (skin) temperature follows heart rate, whilst respiration rate takes time to increase and decrease
- Respiration rate changes slowly during walking
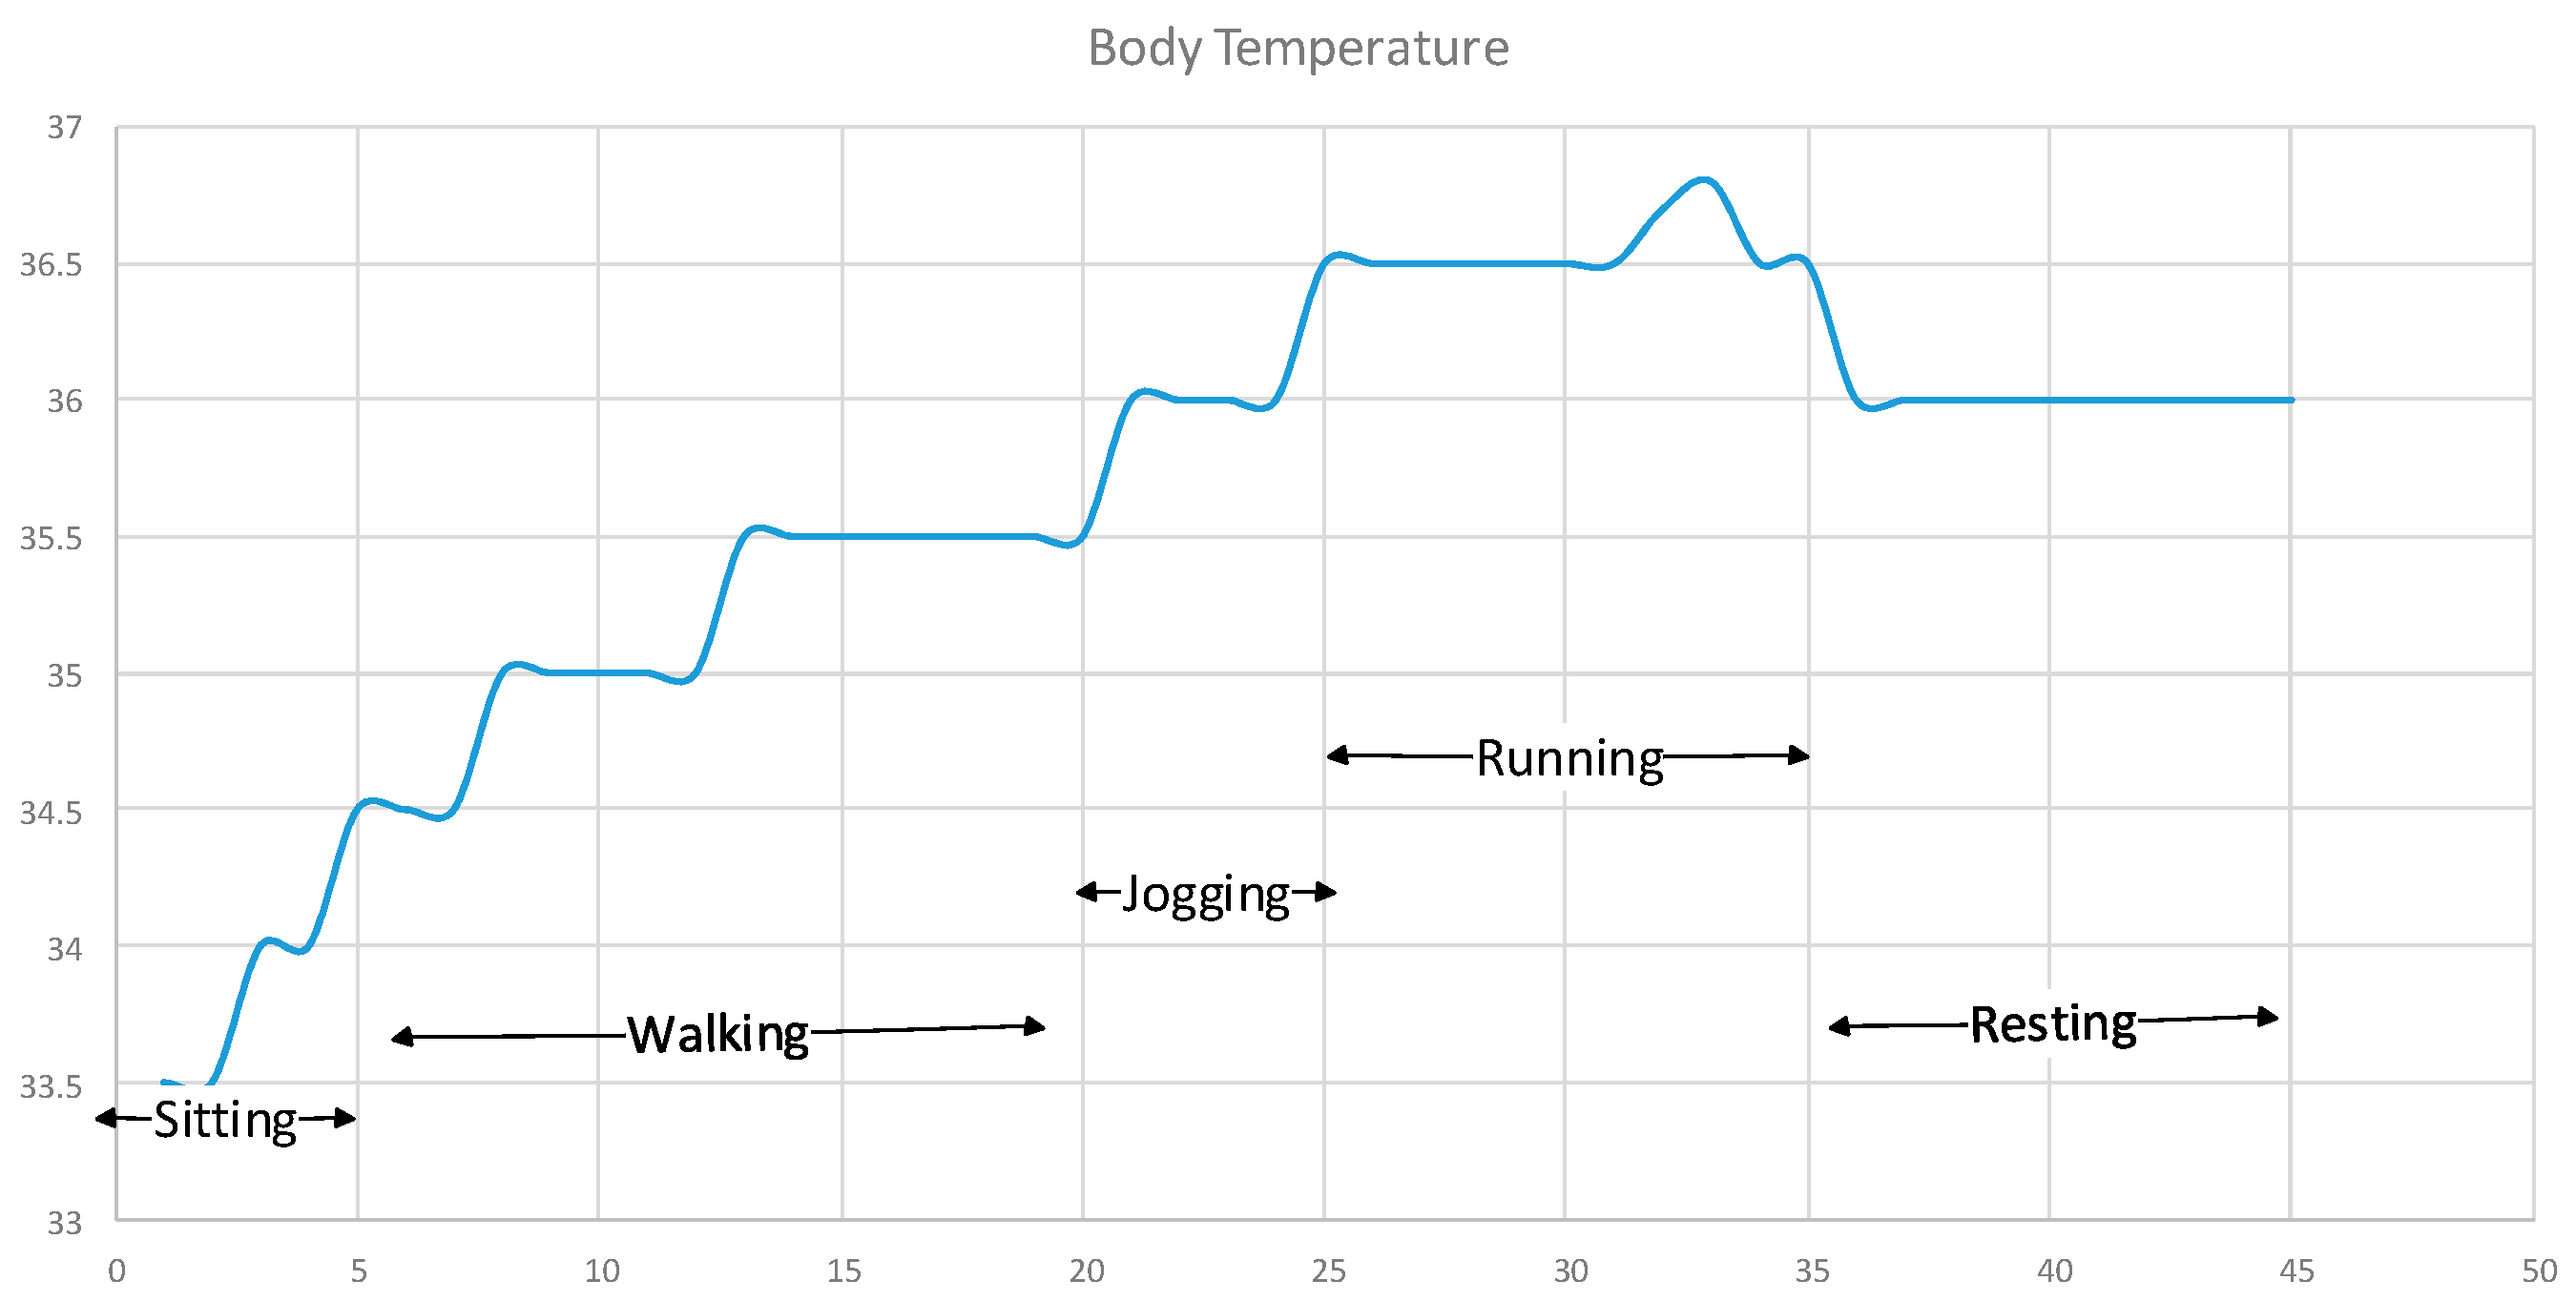
Body temperature is the “skin” (not the core) temperature which will be the case in most body sensors that are worn outside of the human body, and therefore it is quite lower than the normal (36.5 °C) temperature at the beginning. Table 4 shows a detailed measurement condition in sequence with the duration conducted for each activity including activities of sitting, walking, running and resting. In order to obtain data simultaneously for each activity, Sensor device 1 was worn on the left wrist to measure heart rate, and Sensor device 2 was located under the left armpit to measure heart rate and body temperature at the same time. Figure 10 depicts the heart rate result measured and retrieved on a “second” basis for each activity.
Respiration Rate was captured every minute for breaths manually, and the results are shown in Figure 11, whilst Figure 12 shows the result of the body temperature. These figures show that there are traits and ranges of data between activities and each data type of HR, RR and BT. This information requires analysis and prescription by the individual user’s physician to define the range criteria for each activity.
Sampled Test Data Statistics
The statistics for the sampled data collection are shown below. For example, Sample Set 1 shows 3995 data points, and Sample Set 2 shows 628 data points used for the experiments. Sample Set 1 is collected on a second basis, and Sample Set 2 is collected on a minute basis for heart pulse rate monitoring.
- Name: API Track Heart Rate 1 (Sample Set 1)
- Duration: 11:56:50
- Duration in seconds: 43,010
- Total Records: 3995
- Minimum Sample Interval in seconds: 5
- Maximum Sample Interval in seconds: 4125
- Average Sample Interval in seconds: 10.77
- Average BPM: 80.33
- Name: API Track Heart Rate 2 (Sample Set 2)
- Duration: 11:56:00
- Duration in seconds: 42,960
- Total Records: 628
- Minimum Sample Interval in seconds: 60
- Maximum Sample Interval in seconds: 5400
- Average Sample Interval in seconds: 68.41
- Average BPM: 77.62
In addition to the above for heart pulse rate, two groups of 45 sample data have been carefully selected for analysis after multiple experiments were conducted for body temperature and respiration rate.
4. Discussion
As shown in Figure 9, the values of vital signs increase when the activity moves faster or longer for exercising, and each sensor datum shows its own trait for each activity. When comparing body temperature in Figure 12 and respiration rate in Figure 11, the former drops very slowly whilst the latter decreases significantly instantly after running has stopped for the resting period. At the same time, the heart rate gradually decreases with an approximate slope of 45 degrees. This implies that the activity of the user is “standing” while resting after exercising based on this additional information provided from the three sensors.
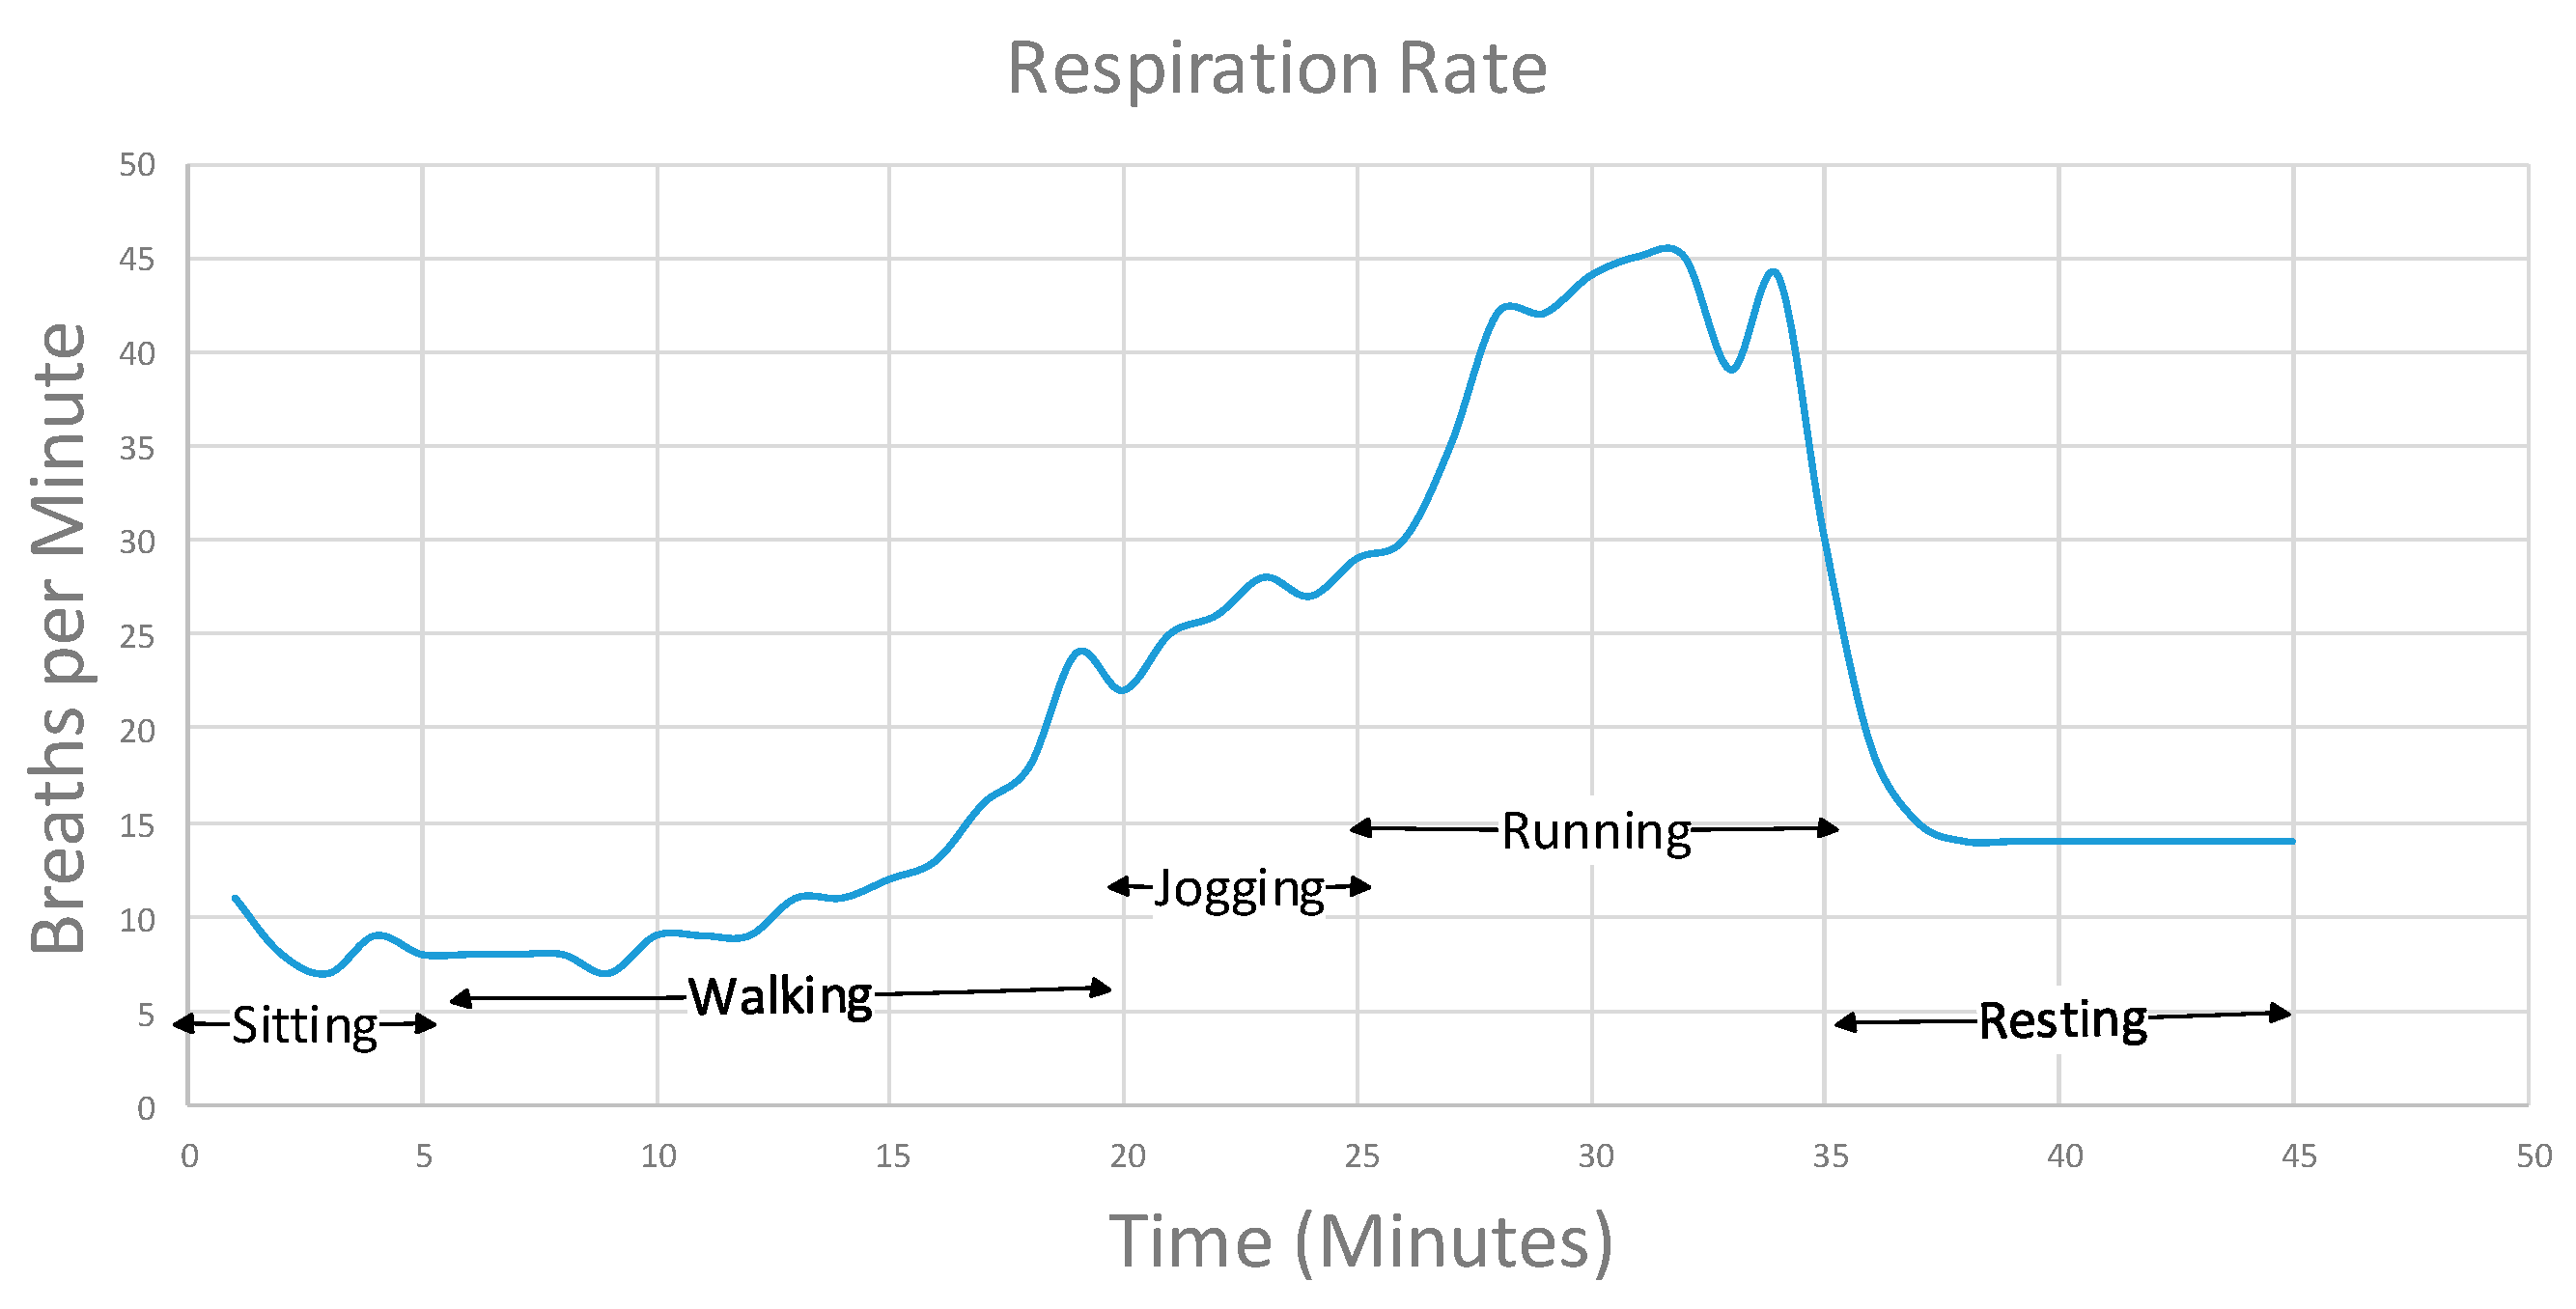
The respiration rate graph depicts a continuous and steadily increasing slope during the exercise until peaking at the top of 46 bpm while running. This means that the data can be useful as an indicator of each activity with a reasonably good threshold range as shown in Table 5. Heart rate also shows a reasonably good distribution of data for each activity.
By using AR and physiological data together it is now possible to see the content of the walking activity as opposed to the posture only for instance. Based on the plotting such as Table 2 which is individually customized and prepared, and Figure 3 which shows the overall data patterns for each activity, we can pin point the level of exercise on the graph using both the information from the AR as well as physiological data. This means that we can now see more in-depth information in addition to the accelerometer data and that new valuable information can be produced for service providers. For example, AR data can add a human activity status as well as its content, e.g., “slow and fast running for 15 min” instead of just a simple “running” status, and it confirms the user is in the “cardio” range heading for the “peak” HR range for exercise. If the heart rate drops during the running session (indicated by the three-sensor data) and the AR data shows the posture is of a sitting or prone position, it may be possible that the user has had a heart attack. This is very significant information to the service provider, and will not be achieved when only the AR data is provided without the additional physiological data.
Presently, AR has used data collected from accelerometer sensors only, and they now need to collect and process additional physiological data to build activity models. This will cause issues on the capacity of data volume as well as context aware domains such as security and privacy since the data are personal and confidential. These aspects may affect the nature of the AR related applications and services, and therefore service providers may need to carefully assess the potential impacts of using health data of individuals.
To determine a situation (activity), multiple data types are used for discernment. For example, with a HR of 160 BPM, BT of 37 °C and RR of 40 breaths per minute (bpm) the inference system will assume that the user is in an exercise mode. When this exercise status is confirmed by the AR data as the user being in a walking or running posture, these data are regarded as “normal”.
However, if some data indicate a different activity (e.g., sleeping) against other data types (e.g., walking), it then requires an algorithm to make a decision. If the outcome is not consistent with the AR data, it will raise an alarm due to the discrepancy in physiological values with the determined activity. For the purposes of testing, HR data are used for different activities taken by the user, and sensors may use other types of data for inference purposes. The actual HR data are classified to determine the activity as below:
- Resting: 100 BPM or less
- Active: 101–149 BPM
- Very Active: 150 BPM or more
An observation of heart rate BPM is shown with details for Basis Peak in Table 6. An averaged result with Fitbit is shown in Table 7. Figure 13 depicts HR BPMs of both Basis Peak and Fitbit along with each activity.
As Table 7 shows, the average resting HR figure is higher than the sitting HR average, and this is because the resting was observed right after the exercise. Whilst the user may be sitting or standing for the duration of the rest, the AR sensor may not convey the real status of the user such as the moments immediately “before” or “after” the exercise, which can affect the alarm determination. For example, the data point (DP) at the 35th DP of 157 BPM in Table 6 shows a much higher BPM than the 7th DP of 106 BPM. Whilst both BPMs indicate a walking status by AR sensor and are within the normal ranges for alarm, the user’s response may be different in each situation, e.g., Active and Very Active. This can be very useful as it provides more detailed information to the sensor for inferring as well as the AR application, which can now understand two statuses of content, i.e., standing (active) and standing (very active) instead of a single status only (e.g., standing only).
DP ID (10) in Table 6 shows a BPM of 98 which appears unusual when compared to adjacent DPs as it suddenly drops during walking. This kind of inconsistent data can be verified by comparing with other datasets as shown in Figure 13 which shows the Fitbit BPM (10th DP) also dropping.
4.1. Threshold Table Optimization
After having received the user feedback in response to alarm verification requests, the thresholds are optimized and adjusted as shown in Table 8.
The sensor device determines the situation as “unusual” as per its situation determination calculation based on the AR data. Therefore, it sends a notification for verification to the user, who then responds with the correct activity. As the result, the thresholds are modified as below. Based on these adjusted BPMs, the sensor will determine the alarm thresholds to calculate with AR data to notify alarm verification for future alarm notifications. By repeating this process, the threshold data become increasingly optimized and more accurate for the user as the below figures, which can be continuously modified with subsequent user feedbacks.
- Resting: 120 BPM or less
- Active: 121–160 BPM
- Very Active: 161 BPM or more
4.2. Bandwidth and Battery Power Analysis
Whilst the purpose of this paper is to propose an application of emergency alarm system, the ultimate goal of the system is to reduce the battery power and bandwidth by inferring sensor devices and sensed data [23]. Thus, it is appropriate to discuss battery consumption and bandwidth savings, which directly affect the quality of wireless body area networks (WBAN).
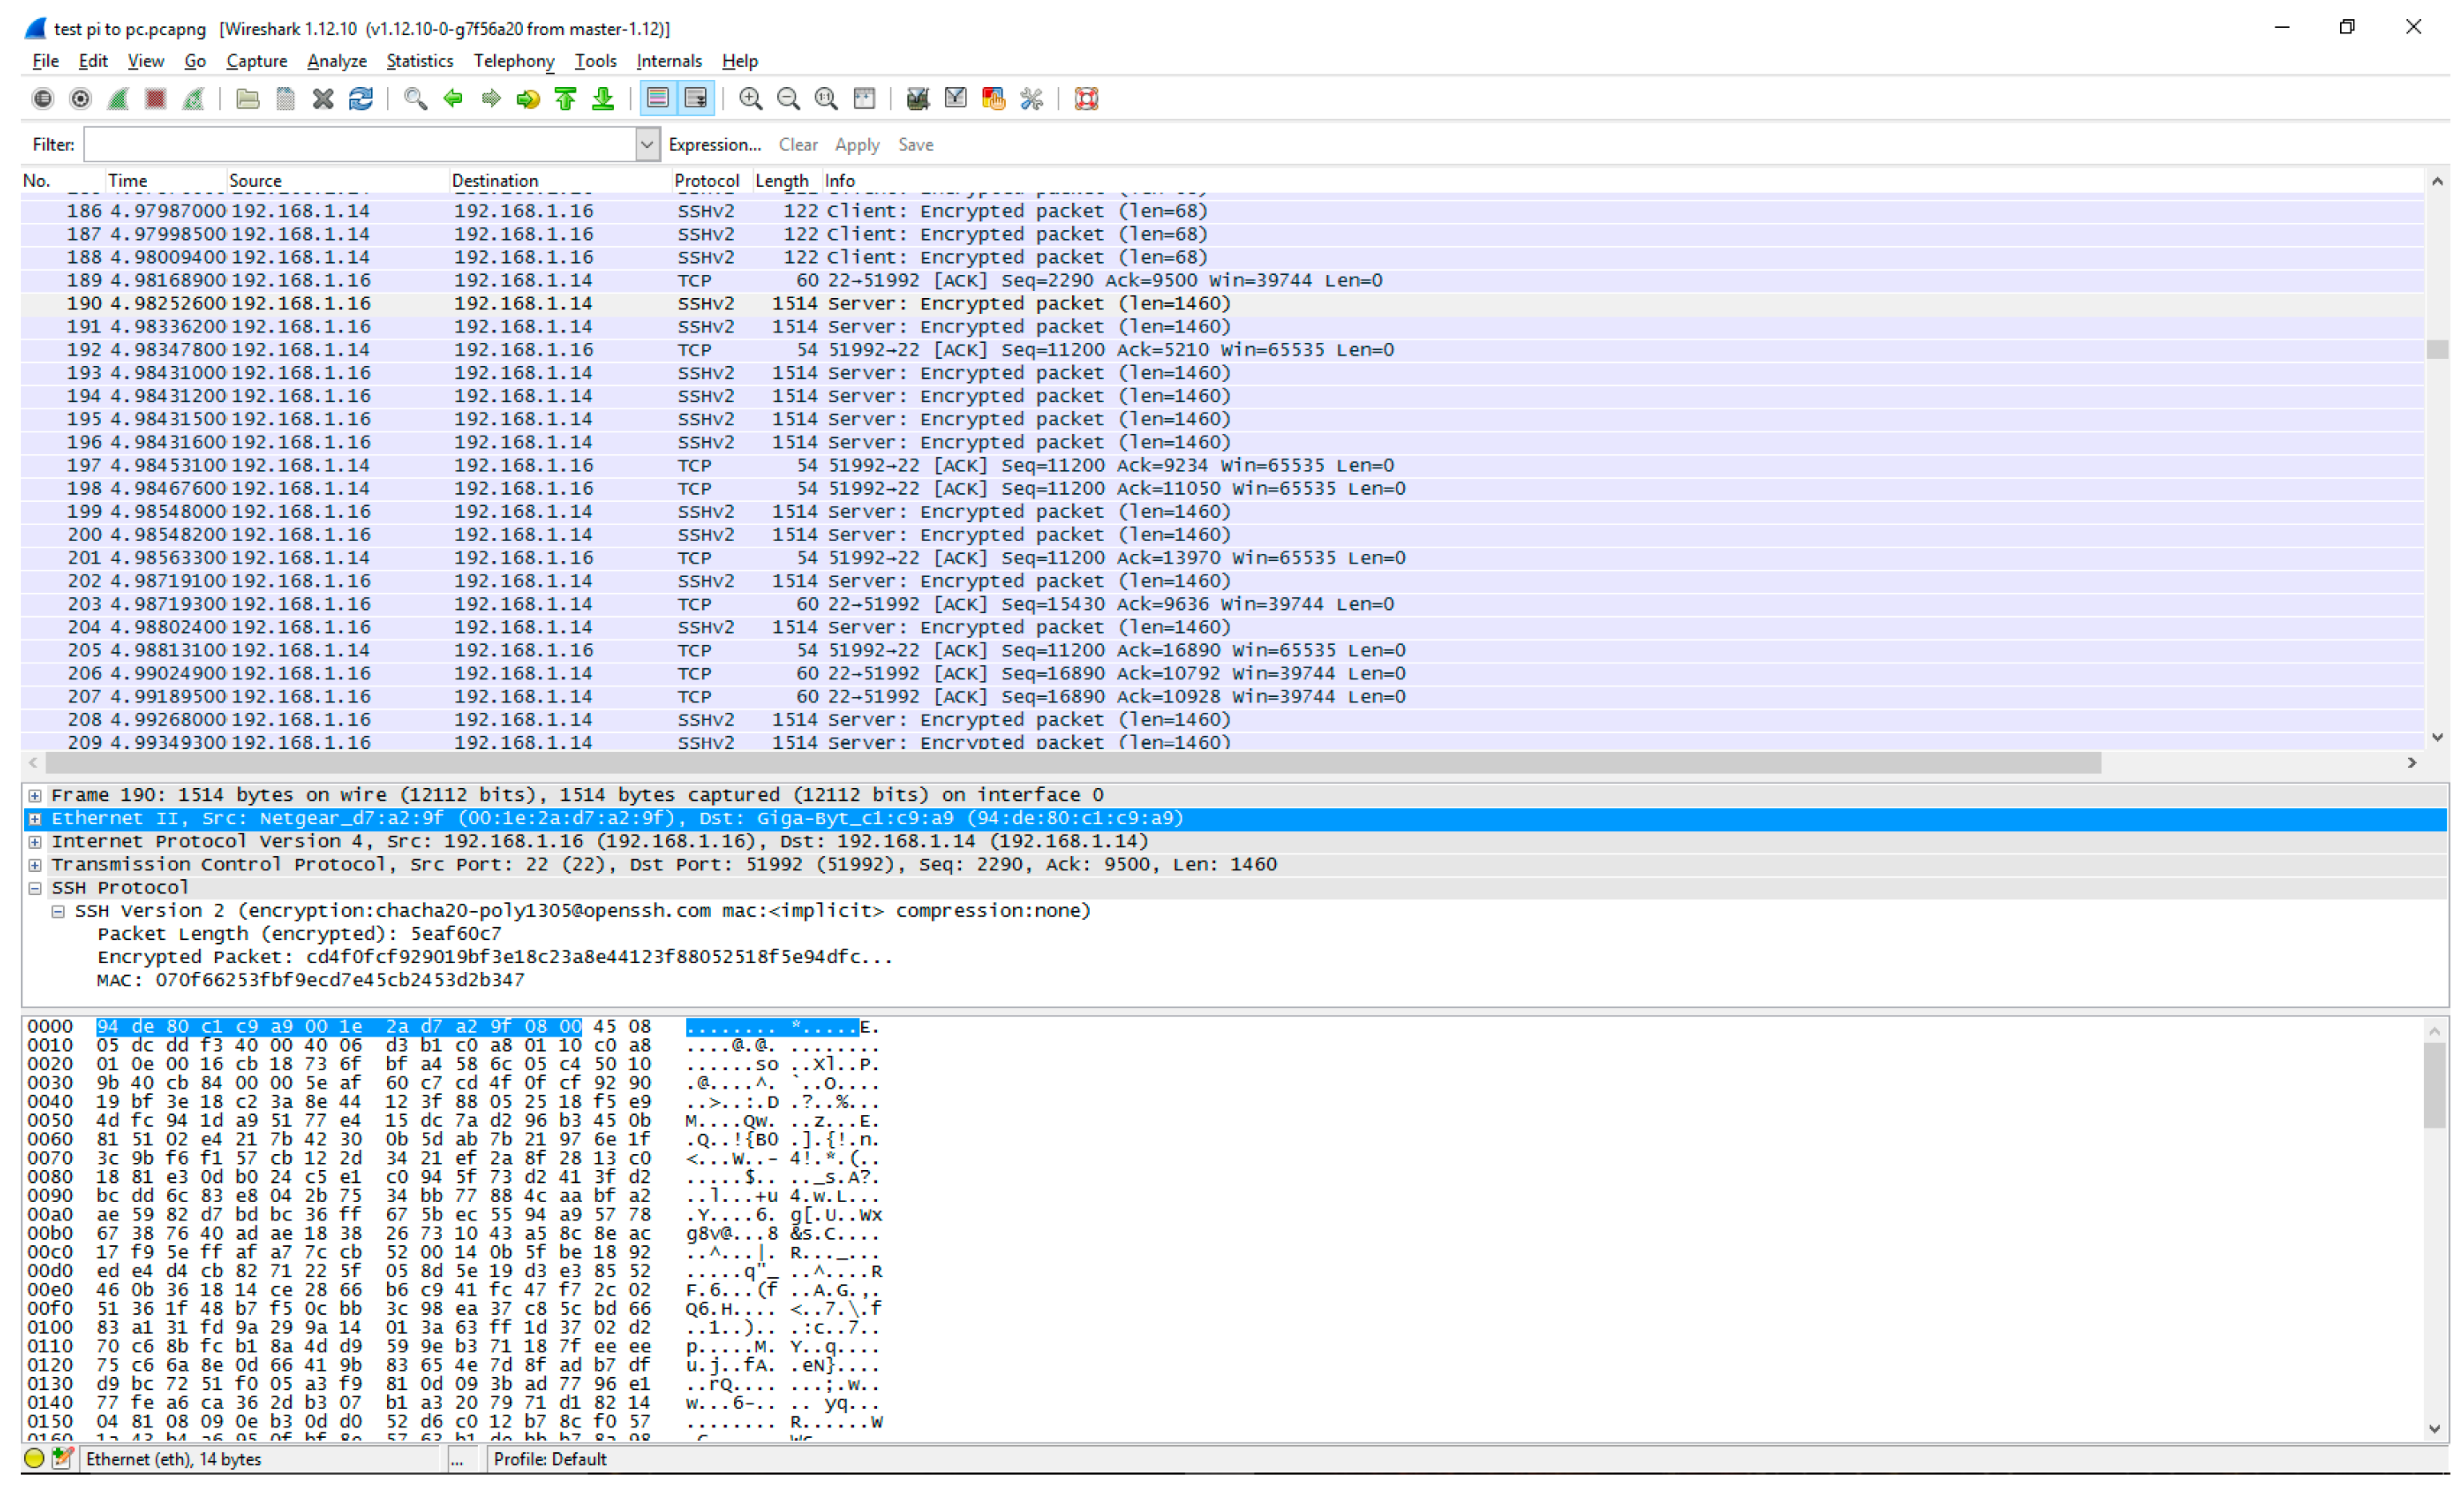
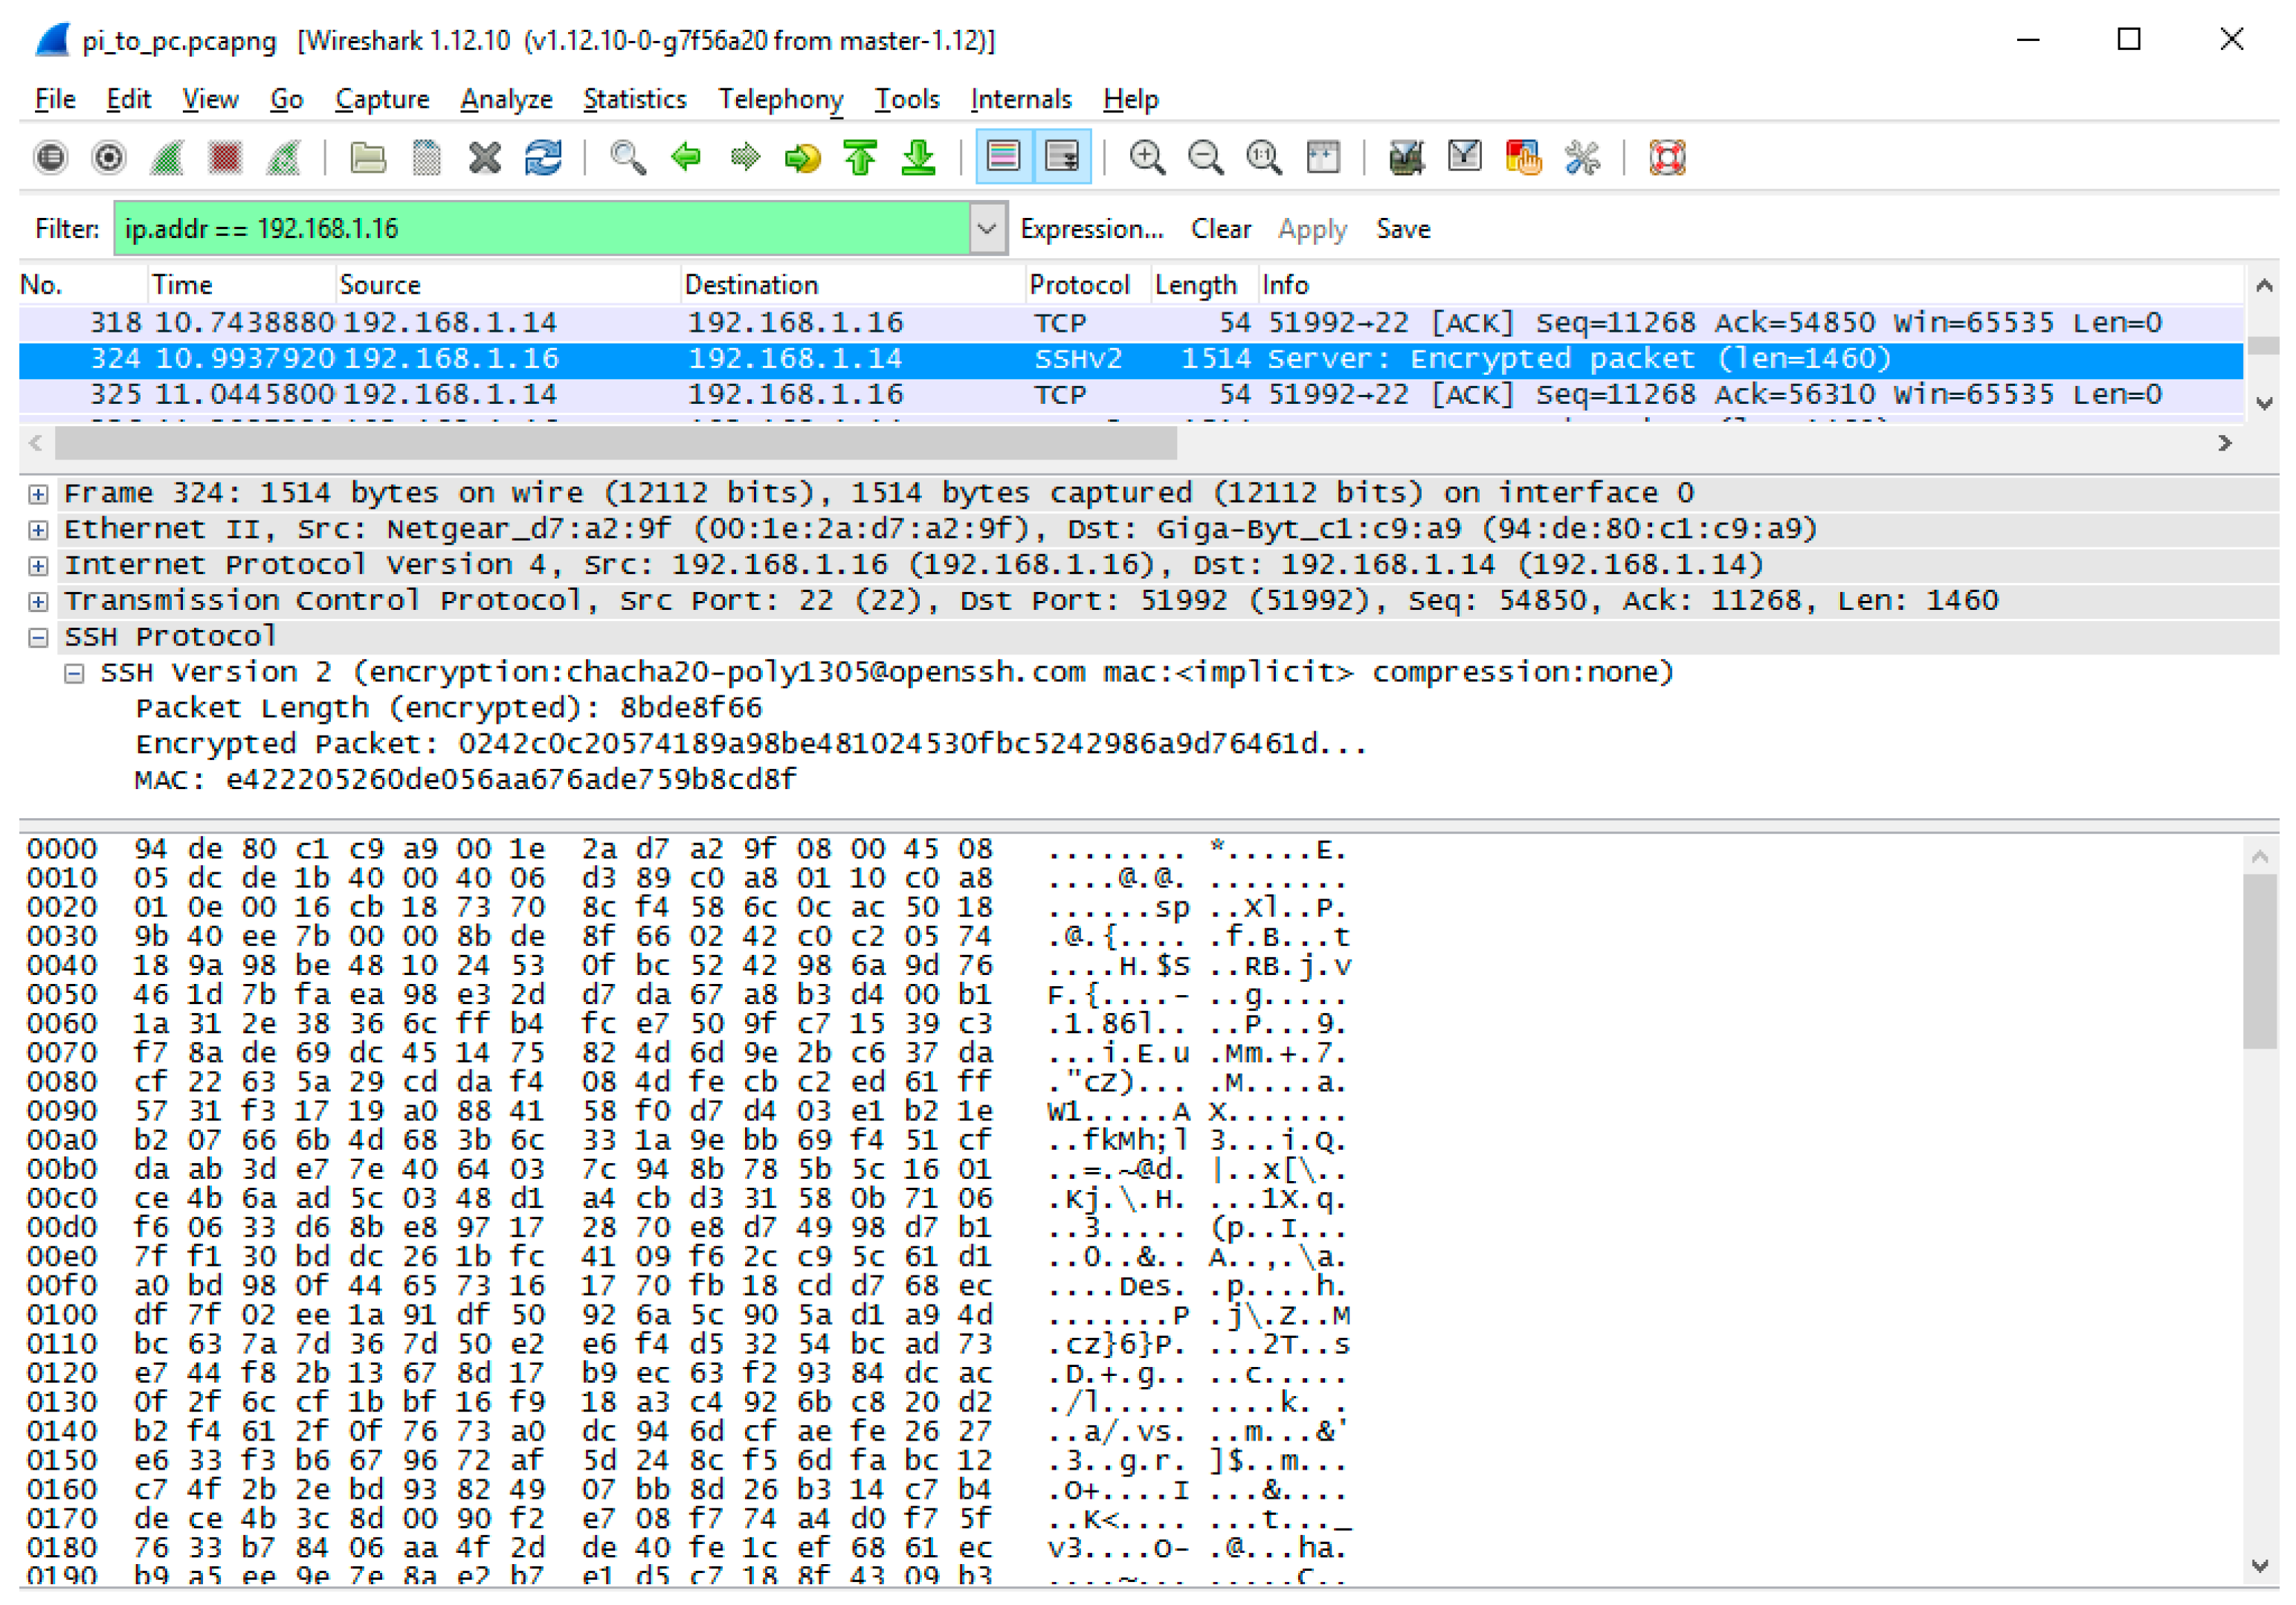
Extending battery power and saving bandwidth are a goal to answer the research questions of how to enhance WBAN performance [28]. There are two ways to transmit sensed data from sensors to requestor networks, i.e., Store and forward, or Cut-through [29]. Figure 14 captured by Wireshark (1.12.10) protocol analyser shows the result of transferring heart rate data and how sensed data are transmitted from sensors by Store and forward. In this case, the data is fragmented into 1460 bytes (payload) to be formed into a frame including headers (1514 bytes) since the data (2800 KB before compression) is larger than the maximum frame size. There are in total 448 packets directly (there are other extra packets exchanged between the sensor and smartphone if there are internodes such as a wireless router for Dynamic Host Configuration Protocol (DHCP) function for instance; in this test, there are 665 packets total for Address Resolution Protocol (ARP), Key exchange, etc.) exchanged between the sensor and the PC (which simulates a PT for testing purposes). Among these, 180 packets have been transmitted from the sensor to PC, and 268 packets have been received (mainly for acknowledgement) at the sensor. Data are compressed before transmission as shown in Figure 15.
Battery consumes more power during radio transmission than in receiving or standby mode. For simulation purposes, the figures below are used for discussion [30].
Knowledge assumption:
- 1 microampere is required for standby
- 10 milliampere are required for data receiving
- 25 milliampere are required for transmission
To transmit 2800 KB data in a simulation by a Store and Forward method, it requires 3130 mA (2680 mA for receiving + 4500 mA for transmission). This directly affects the power consumption (e.g., P = VI). Each type of battery may have different voltage types, however, they are still affected by the size of ampere required to transmit data. When sensed data are transmitted in real-time without storing, the number of transmissions directly affects the power consumption. Therefore, the power consumed is significantly affected if the frequency of transmission is decreased.
To compare transmitted data between the sensor (emulated by Raspberry Pi3) and the PC for emulation of transmitting various data sizes, Table 10 shows statistics of packets and power consumption. The sensor also receives data from the requestor’s network to transmit sensor data for acknowledgement, encryption signal, ARP etc. There are many packets exchanged to establish a communication before and after the transmission to transmit even a single data point. It shows a possible power savings when sensor data have been inferred and reduced for the transmission accordingly. For example, in the case of zinc-carbon or alkaline types of batteries, they produce around 1.5 volts per cell. In this case, 3.14 Watts (i.e., 2090 mA × 1.5 V) of power can be saved when the transmission of a single HR data point is reduced by the inference system.
5. Conclusions and Future Works
To determine an alarm status, AR is used for situation and activity recognition. Current AR mainly shows the current activity only without including content of the activity level, e.g., how long the activity has lasted. By using physiological data along with accelerometer sensors, it is possible to determine whether the sensed data are normal or abnormal for alarming. It is proposed to use an inference system in sensor devices to reduce the frequency of data transmission and transactions to save power consumption and bandwidth in WBAN. To determine an alarm situation, it is required to know the activity of the user to determine whether the sensed data are normal or abnormal. The inference system compares the sensed data with accelerometer data against the threshold table customized for each individual by physicians and learned data from user inputs. This alarm notification process by sensors can be improved through reducing possible false alarms by verifying the situation with the user using a smart device application. When multiple physiological data attributes are used in conjunction with one another, the accuracy of situation determination can be improved. We presented a system design and demonstrated it with a smart device application so that the user can respond to feedback and input the correct situation and activity. The threshold data can be individually prepared by clinicians. For future study, security is one of the key aspects to consider, as the proposed verification process requires interaction between sensors and smart device users. In other words, the inference system in sensor nodes will make a decision based on the response from the smart device. This will significantly increase security risks as independent decision making within the sensors are now been exposed to input from smart devices.
Artificial Intelligence (AI) is an emerging technology field and is rapidly evolving in mobile applications. It is expected that collecting and providing health data is becoming an essential requirement to AI applications which expands the area to a smart environment such as smart vehicles, smart buildings, smart homes and smart grids. Eventually, humans are at the centre of those services as the source of data to obtain, as well as being the benefactors as the user of the services, e.g., prediction of life expectancy for individual [31]. This compels us to consider the issue of privacy and information security against these services. For example, how much information do we allow the body sensors to transmit the health data and/or personal information to IoT devices over mHealth service providers? Do IoT devices actually require personal information? Another area for further study is the integration of health application with IoT services. For example, the user feedback system may be applied to IoT devices which provide intelligent personal assistance services for confirmation of decision making where the AI is unable to make a clear black or white decision.
Author Contributions
James Kang conceived, designed and performed the experiments; James analyzed the data; contributed reagents/materials/analysis tools; wrote the paper. Henry Larkin designed and tested the smartphone app for the user feedback system.
Conflicts of Interest
The authors declare no conflict of interest.
References
- Kang, J.J.; Luan, T.H.; Larkin, H. Inference System of Body Sensors for Health and Internet of Things Networks. In Proceedings of the 14th International Conference on Advances in Mobile Computing and Multi Media, Singapore, 28–30 November 2016; ACM: Singapore, 2016; pp. 94–98. [Google Scholar]
- Kang, J.J.; Luan, T.; Larkin, H. Data Processing of Physiological Sensor Data and Alarm Determination Utilising Activity Recognition. Int. J. Inf. Commun. Technol. Appl. 2016, 2, 24. [Google Scholar]
- Abdallah, Z.S.; Gaber, M.M.; Srinivasan, B.; Krishnaswamy, S. StreamAR: Incremental and Active Learning with Evolving Sensory Data for Activity Recognition. In Proceedings of the 2012 IEEE 24th International Conference on Tools with Artificial Intelligence, Athens, Greece, 7–9 November 2012; pp. 1163–1170. [Google Scholar]
- Kang, J.J.; Luan, T.H.; Larkin, H. Alarm Notification of Body Sensors Utilising Activity Recognition and Smart Device Application. In Proceedings of the 14th International Conference on Advances in Mobile Computing and Multi Media, Singapore, 28–30 November 2016; ACM: Singapore, 2016; pp. 105–109. [Google Scholar]
- Munguia Tapia, E. Using Machine Learning for Real-Time Activity Recognition and Estimation of Energy Expenditure; Massachusetts Institute of Technology: Cambridge, MA, USA, 2008. [Google Scholar]
- Orha, I.; Oniga, S. Study regarding the optimal sensors placement on the body for human activity recognition. In Proceedings of the 2014 IEEE 20th International Symposium for Design and Technology in Electronic Packaging (SIITME), Bucharest, Romania, 23–26 October 2014; pp. 203–206. [Google Scholar]
- Atallah, L.; Lo, B.; King, R.; Yang, G.Z. Sensor Positioning for Activity Recognition Using Wearable Accelerometers. IEEE Trans. Biomed. Circuits Syst. 2011, 5, 320–329. [Google Scholar] [CrossRef] [PubMed]
- Zappi, P.; Stiefmeier, T.; Farella, E.; Roggen, D.; Benini, L.; Troster, G. Activity recognition from on-body sensors by classifier fusion: Sensor scalability and robustness. In Proceedings of the 2007 3rd International Conference on Intelligent Sensors, Sensor Networks and Information, Melbourne, Australia, 3–6 December 2007; pp. 281–286. [Google Scholar]
- Othman, N.B.; Ek, O.P. Pill dispenser with alarm via smart phone notification. In Proceedings of the 2016 IEEE 5th Global Conference on Consumer Electronics, Kyoto, Japan, 11–14 October 2016; pp. 1–2. [Google Scholar]
- Hayes, T.L.; Hunt, J.M.; Adami, A.; Kaye, J.A. An Electronic Pillbox for Continuous Monitoring of Medication Adherence. In Proceedings of the 2006 International Conference of the IEEE Engineering in Medicine and Biology Society, New York, NY, USA, 30 August–3 September 2006; pp. 6400–6403. [Google Scholar]
- Huang, S.C.; Chang, H.Y.; Jhu, Y.C.; Chen, G.Y. The intelligent pill box—Design and implementation. In Proceedings of the 2014 IEEE International Conference on Consumer Electronics—Taiwan, Taipei, Taiwan, 26–28 May 2014; pp. 235–236. [Google Scholar]
- Dalela, P.K.; Yadav, A.; Sachdev, S.; Yadav, A.; Basu, S.; Tyagi, V. Alarm notification to tower monitoring system in oneM2M based IoT networks. In Proceedings of the 2016 International Conference on Advances in Computing, Communications and Informatics (ICACCI), Jaipur, India, 21–24 September 2016; pp. 2405–2409. [Google Scholar]
- Dalya, V.; Shedge, D.K. Design of smartphone-based wound assessment system. In Proceedings of the 2016 International Conference on Automatic Control and Dynamic Optimization Techniques (ICACDOT), Pune, India, 9–10 September 2016; pp. 709–712. [Google Scholar]
- Kang, J.J.; Larkin, H. Inference of Personal Sensors in the Internet of Things. Int. J. Inf. Commun. Technol. Appl. 2016, 2, 1–23. [Google Scholar] [CrossRef]
- Gartner.com Gartner Says 4.9 Billion Connected. Available online: http://www.gartner.com/newsroom/id/2905717 (accessed on 20 May 2015).
- Zaykovskiy, D.; Minker, W. Speech Recognition for Mobile Phones; Springer: New York, NY, USA, 2012. [Google Scholar]
- Varga, I.; Kiss, I. Speech recognition in mobile phones. In Automatic Speech Recognition on Mobile Devices and over Communication Networks; Springer: New York, NY, USA, 2008; pp. 301–325. [Google Scholar]
- Pearce, D. Enabling new speech driven services for mobile devices: An overview of the ETSI standards activities for distributed speech recognition front-ends. In Proceedings of the AVIOS 2000: The Speech Applications Conference, San Jose, CA, USA, 22–24 May 2000; pp. 261–264. [Google Scholar]
- Pantelopoulos, A.; Bourbakis, N.G. A Survey on Wearable Sensor-Based Systems for Health Monitoring and Prognosis. IEEE Trans. Syst. Man Cybern. Part C Appl. Rev. 2010, 40, 1–12. [Google Scholar] [CrossRef]
- Mackowiak, P.A. Temperature regulation and the pathogenesis of fever. Princ. Pract. Infect. Dis. 2000, 6, 703–718. [Google Scholar]
- Kang, J.J.; Adibi, S. A Review of Security Protocols in mHealth Wireless Body Area Networks (WBAN). In International Conference on Future Network Systems and Security 2015, Paris, France; Zhou, W., Doss, R., Eds.; Springer International Publishing: Paris, France, 2015; pp. 61–83. [Google Scholar]
- Vorvick, L.J. Vital Signs; U.S. National Library of Medicine: Bethesda, MD, USA, 2015.
- Kang, J. An Inference System Framework for Personal Sensor Devices in Mobile Health and Internet of Things Networks; Deakin University: Burwood, Victoria, Australia, 2017. [Google Scholar]
- Karvonen, M.J.; Kentala, E.; Mustala, O. The effects of training on heart rate: A longitudinal study. JPAH 2010, 4, 307. [Google Scholar]
- Wood, R. Heart Rate Karvonen Formula. Available online: http://www.topendsports.com/fitness/karvonen-formula.htm (accessed on 13 October 2016).
- Wood, R. Resting Heart Rate Chart. Available online: http://www.topendsports.com/testing/heart-rate-resting-chart.htm (accessed on 8 October 2016).
- Bao, L.; Intille, S.S. Activity recognition from user-annotated acceleration data. In International Conference on Pervasive Computing; Springer: New York, NY, USA, 2004; pp. 1–17. [Google Scholar]
- Kang, J.J.; Larkin, H.; Luan, T.H. Enhancement of Sensor Data Transmission by Inference and Efficient Data Processing. In Applications and Techniques in Information Security, Batten, L., Li, G., Eds.; Springer: Singapore, 2016; pp. 81–92. [Google Scholar]
- Bass, B.M.; Henderson, D.R.; Ku, E.H.-C.; Lemke, S.J.; Rash, J.M.; Reiss, L.B.; Ryle, T.E. Simultaneous Cut through and Store-and-Forward Frame Support in a Network Device. Google Patents US6144668 A, 7 November 2000. [Google Scholar]
- Brain, M. A Typical Mote—How Motes Work. Available online: http://computer.howstuffworks.com/mote4.htm (accessed on 15 June 2016).
- Kang, J.J.; Adibi, S.; Larkin, H.; Luan, T. Predictive data mining for Converged Internet of Things: A Mobile Health perspective. In Proceedings of the 2015 International Telecommunication Networks and Applications Conference (ITNAC), Sydney, NSW, Australia, 18–20 November 2015; pp. 5–10. [Google Scholar]
Figure 1.
Overall Network Architecture for AR and Health service provider networks. WBAN connects to IoT network (as a new interface such as machine to machine (M2M) in addition to the existing interface to mHealth network through cellular and/or Internet
Figure 1.
Overall Network Architecture for AR and Health service provider networks. WBAN connects to IoT network (as a new interface such as machine to machine (M2M) in addition to the existing interface to mHealth network through cellular and/or Internet

Figure 2.
AR demonstration using smartphone app and Matlab 9.0 codes. Three-axis accelerometer sensors in an Android phone are used as shown in different colours.
Figure 2.
AR demonstration using smartphone app and Matlab 9.0 codes. Three-axis accelerometer sensors in an Android phone are used as shown in different colours.

Figure 3.
Physiological data variance for activities. BT, HR and RR gradually increase during exercise.
Figure 3.
Physiological data variance for activities. BT, HR and RR gradually increase during exercise.

Figure 4.
Multiple sensor data show the gap between two devices.

Figure 5.
Smart device app screen menu selection flow. Voice prompt menu is kicked in when no feedback is received by the user.
Figure 5.
Smart device app screen menu selection flow. Voice prompt menu is kicked in when no feedback is received by the user.

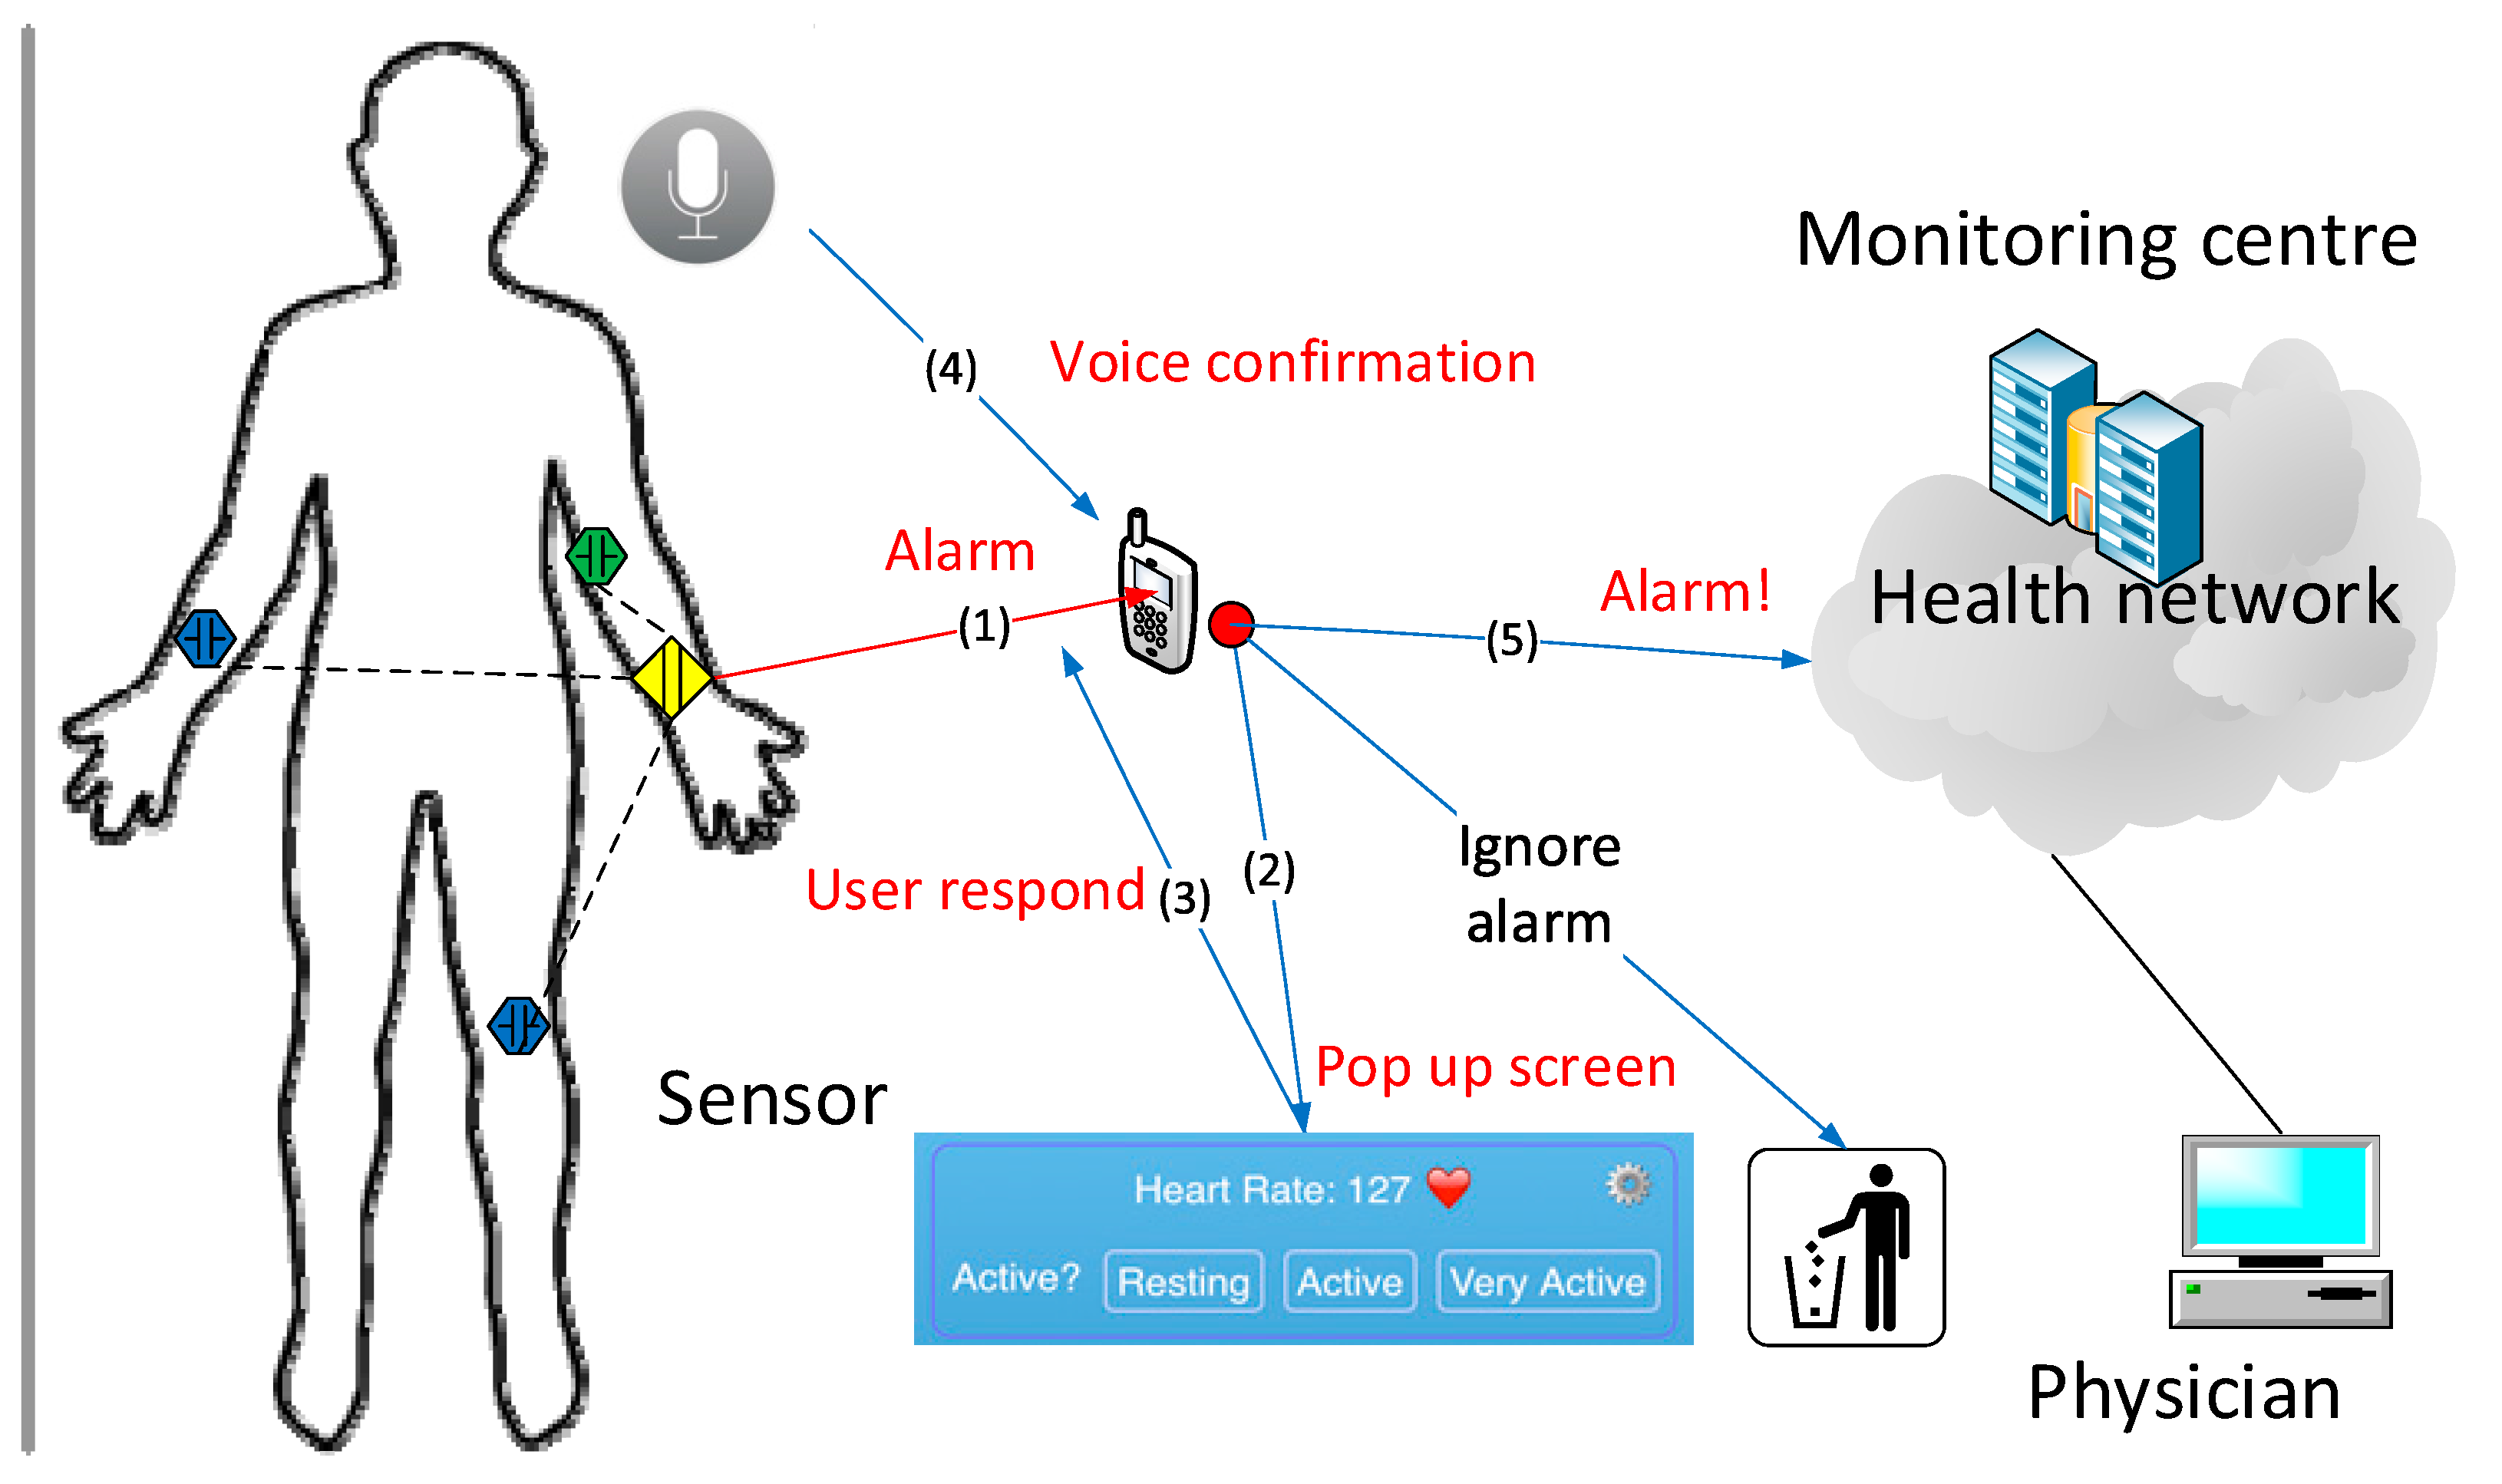
Figure 6.
General Query from sensors to smart device app. When an alarm is triggered (1) and displayed (2), the user respond on the app screen (3) or voice confirmation (4) to determine raising an alarm (5) to the physician or drops it.
Figure 6.
General Query from sensors to smart device app. When an alarm is triggered (1) and displayed (2), the user respond on the app screen (3) or voice confirmation (4) to determine raising an alarm (5) to the physician or drops it.

Figure 7.
User Response. The heart rate of 127 BPM could be normal or abnormal based on the activity of the user.
Figure 7.
User Response. The heart rate of 127 BPM could be normal or abnormal based on the activity of the user.

Figure 8.
Sensor Data Export Network Topology. A production data server of Fitbit is used to retrieve data for analysis.
Figure 8.
Sensor Data Export Network Topology. A production data server of Fitbit is used to retrieve data for analysis.

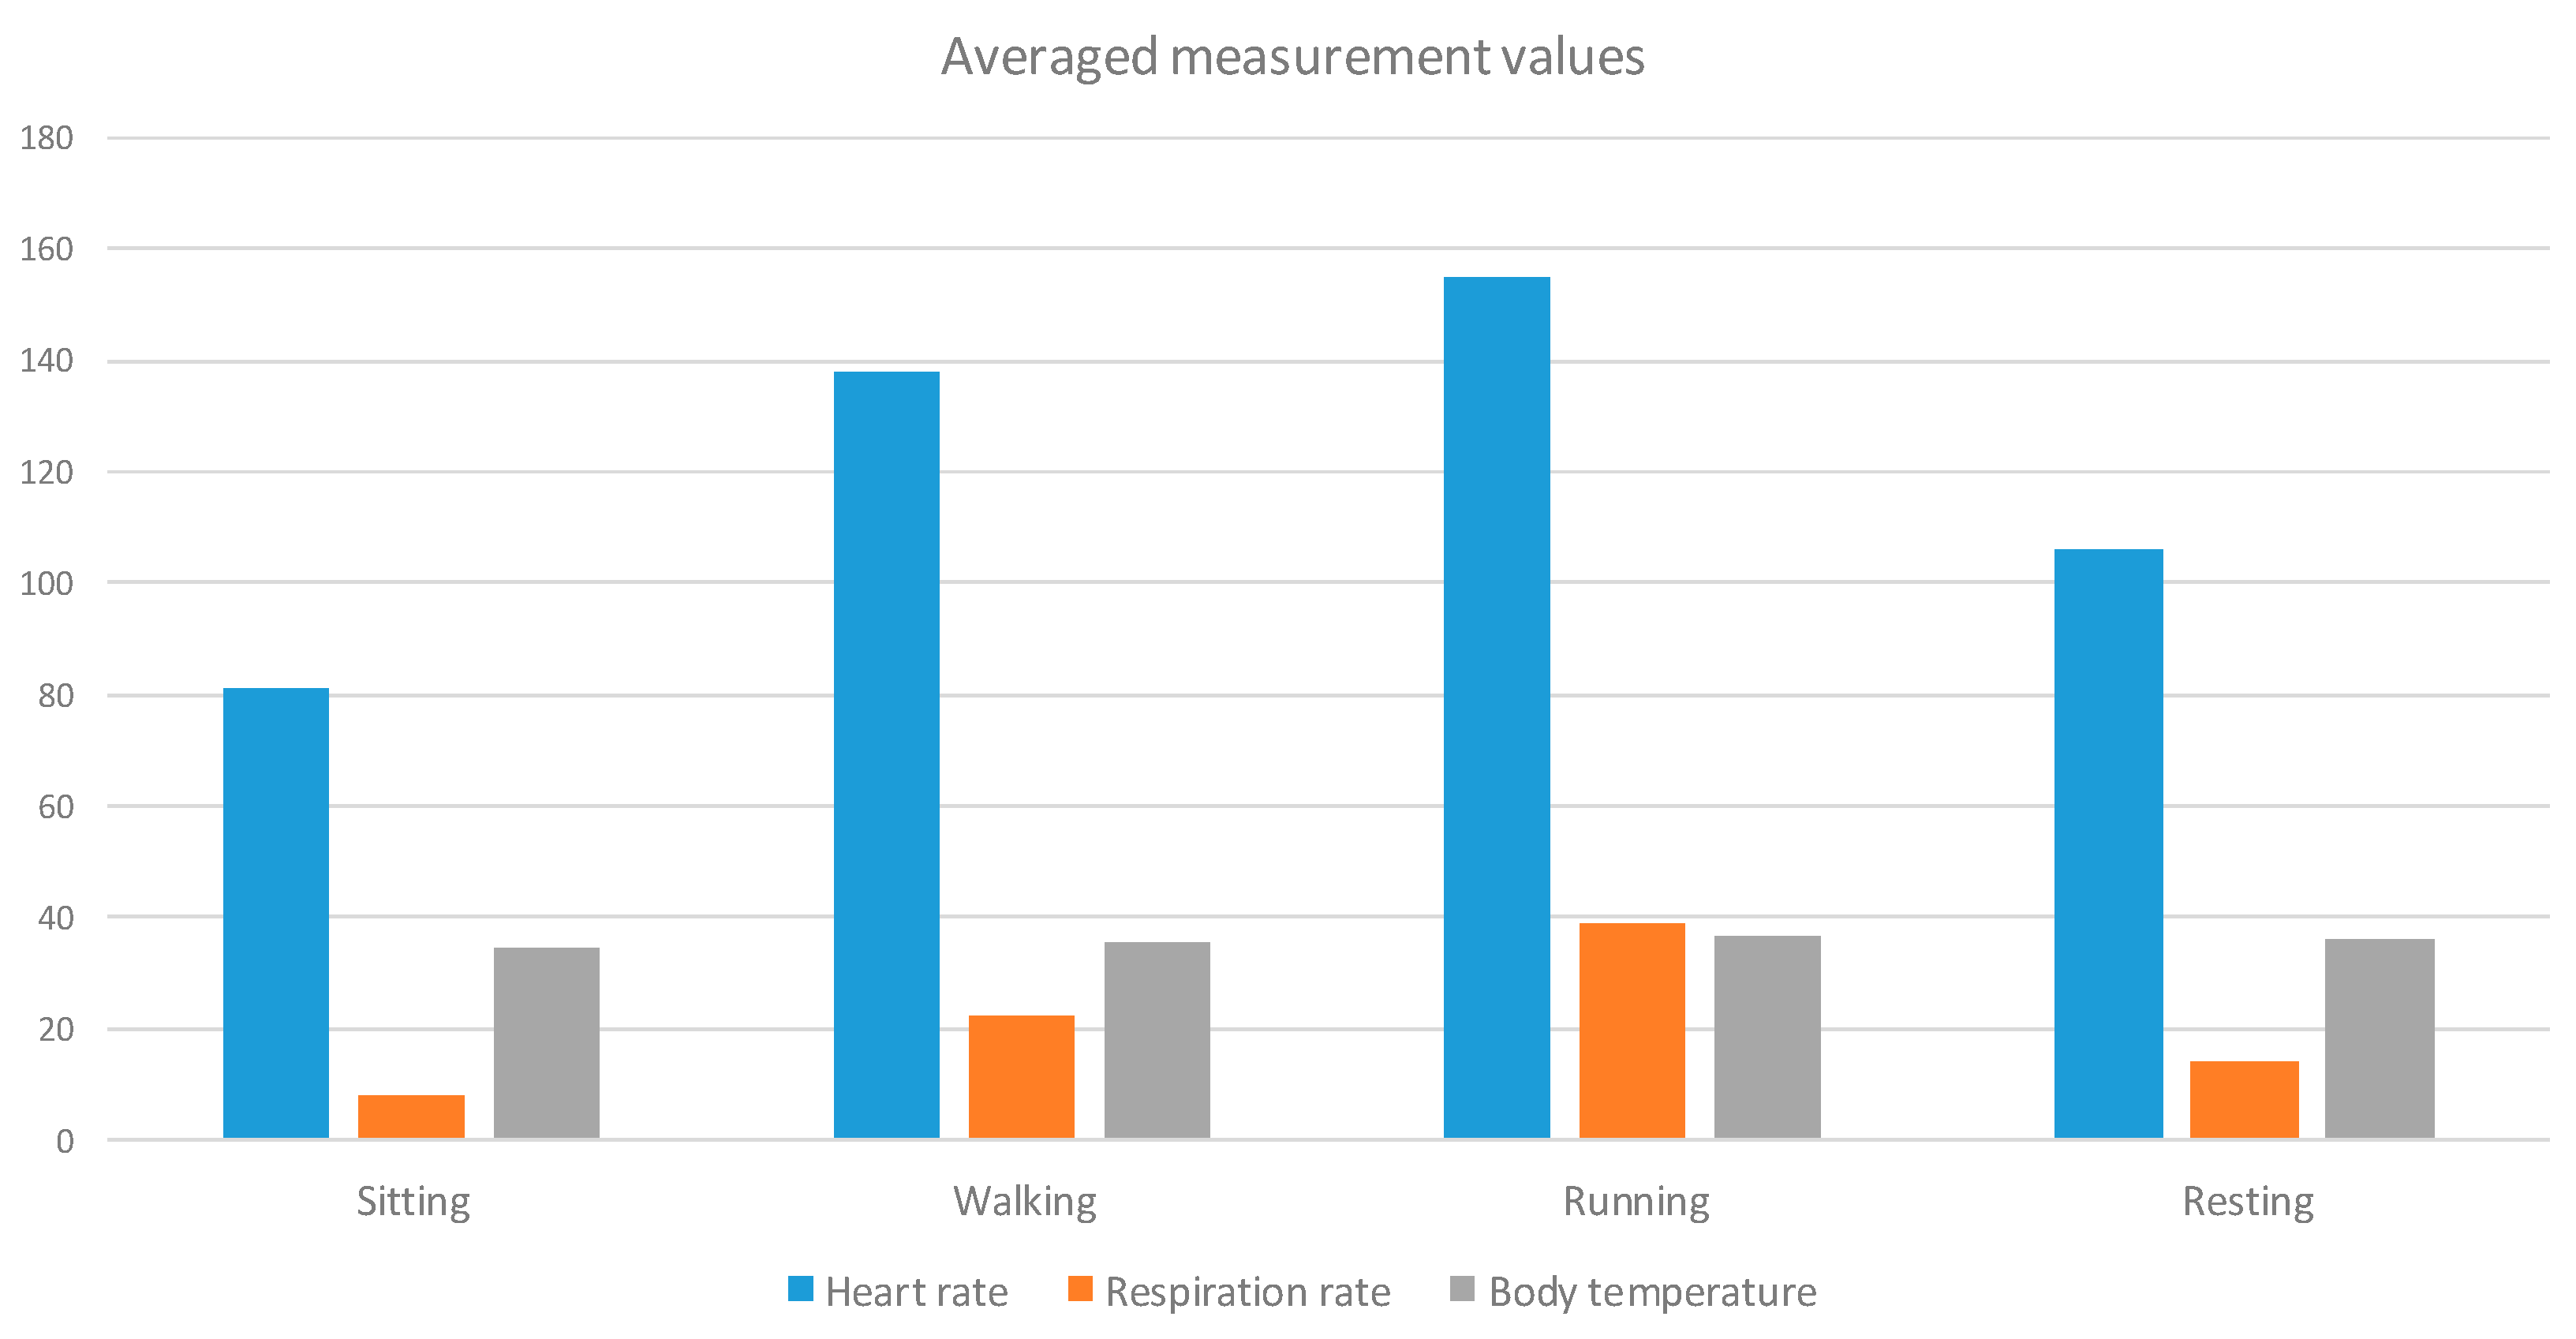
Figure 9.
Averaged measurement values for activities. These data are used to create personally prescribed threshold table by the user’s physician.
Figure 9.
Averaged measurement values for activities. These data are used to create personally prescribed threshold table by the user’s physician.

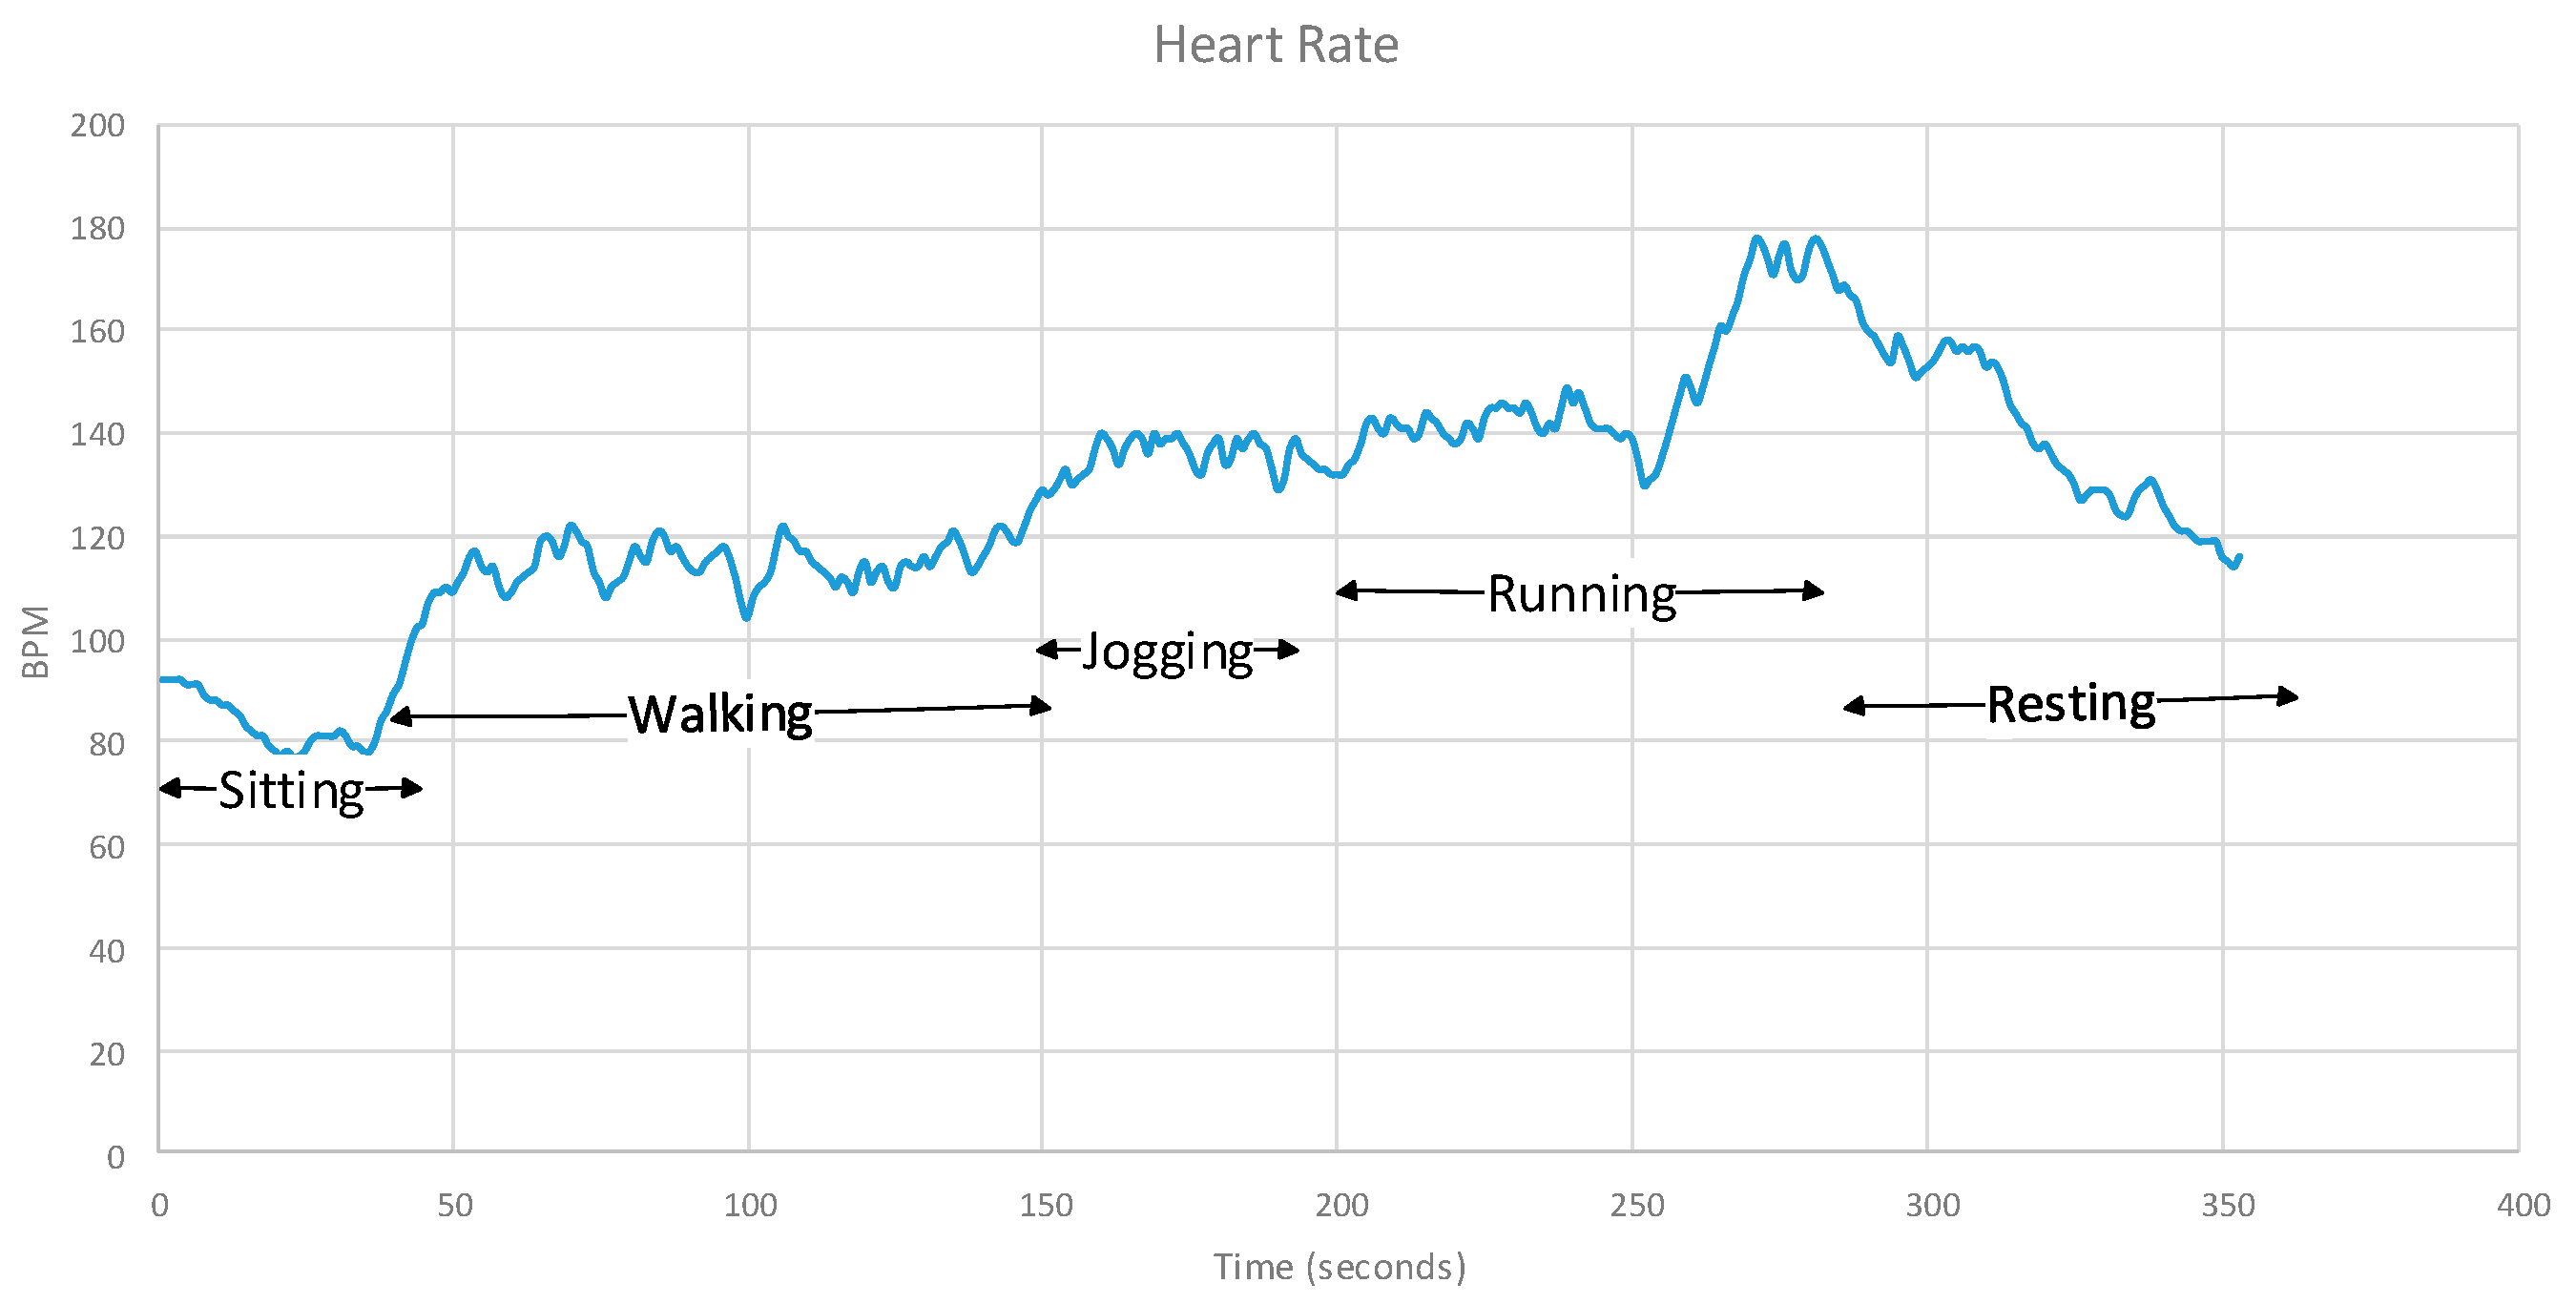
Figure 10.
Heart rate data sensed per second.

Figure 11.
Respiration rate.

Figure 12.
Body temperature.

Figure 13.
Heart rate BPM results for each activity.

Figure 14.
Data transfer from sensors (Wireshark capturing).

Figure 15.
Compressed data for transmission from sensor to smartphone. When data are compressed and encrypted, they require more bandwidth as the size increases.
Figure 15.
Compressed data for transmission from sensor to smartphone. When data are compressed and encrypted, they require more bandwidth as the size increases.


Table 1.
Example of Activity Inference. Physiological data are used along with AR to determine the activity with different weightings allocated for each sensor.
Table 1.
Example of Activity Inference. Physiological data are used along with AR to determine the activity with different weightings allocated for each sensor.
| Attributes | Data Measurement and Calculation | |||
|---|---|---|---|---|
| Sensed Data | Inferred Value | Weighting | Result | |
| AR | Running | Running | 100 | 100R |
| HR | 135 | Walking | 20 | 20W |
| BT | 37 | Running | 50 | 50R |
| RR | 20 | Walking | 30 | 30W |
Table 2.
Situation determination to define the threshold of the activity from each type of data defined by a clinician. “bpm” denotes breaths per minute.
Table 2.
Situation determination to define the threshold of the activity from each type of data defined by a clinician. “bpm” denotes breaths per minute.
| Data Type | Sleeping | Resting | Walking | Running |
|---|---|---|---|---|
| HR (BPM) | <60 | 60–100 | 101–149 | >150 |
| BT (°C) | 33 | 33.4 | 35.5 | 36.9 |
| RR (bpm) | <12 | 13–18 | 19–30 | >30 |
Table 3.
Resting Heart Rate for Men (Adapted from [26]).
Table 3.
Resting Heart Rate for Men (Adapted from [26]).
| Age | 18–25 | 26–35 | 36–45 | 46–55 | 56–65 | 65+ |
|---|---|---|---|---|---|---|
| Athlete | 49–55 | 49–54 | 50–56 | 50–57 | 51–56 | 50–55 |
| Excellent | 56–61 | 55–61 | 57–62 | 58–63 | 57–61 | 56–61 |
| Good | 62–65 | 62–65 | 63–66 | 64–67 | 62–67 | 62–65 |
| Above Avg | 66–69 | 66–70 | 67–70 | 68–71 | 68–71 | 66–69 |
| Average | 70–73 | 71–74 | 71–75 | 72–76 | 72–75 | 70–73 |
| Below Avg | 74–81 | 75–81 | 76–82 | 77–83 | 76–81 | 74–79 |
| Poor | 82+ | 82+ | 83+ | 84+ | 82+ | 80+ |
Table 4.
Measurement Condition.
| Sequence | Posture | Activity | Duration (Second) |
|---|---|---|---|
| 1 | Sitting | Sitting | 300 |
| 2 | Walking | Slow Walking (3 km/h) | 300 |
| 3 | Fast Walking (5 km/h) | 600 | |
| 4 | Running | Slow Running (7 km/h) | 300 |
| 5 | Fast Running (9 km/h) | 600 | |
| 6 | Standing | Stand Resting | 600 |
Table 5.
Averaged measurement value.
| Data Type | Sitting | Walking | Running | Resting |
|---|---|---|---|---|
| HR | 81 | 138 | 155 | 106 |
| BT | 34.5 | 35.5 | 36.8 | 36 |
| RR | 8 | 22 | 39 | 14 |
Table 6.
Test results of Basis HR BPM threshold ranges.
| Time | DP ID | HR BPM | Activity | Results |
|---|---|---|---|---|
| 24 March 2016 22:43Z | 1 | 78 | Sitting | Resting |
| 24 March 2016 22:44Z | 2 | 77 | Sitting | Resting |
| 24 March 2016 22:45Z | 3 | 81 | Sitting | Resting |
| 24 March 2016 22:46Z | 4 | 87 | Sitting | Resting |
| 24 March 2016 22:47Z | 5 | 79 | Sitting | Resting |
| 24 March 2016 22:48Z | 6 | 88 | Walking | Resting |
| 24 March 2016 22:49Z | 7 | 106 | Walking | Active |
| 24 March 2016 22:50Z | 8 | 103 | Walking | Active |
| 24 March 2016 22:51Z | 9 | 105 | Walking | Active |
| 24 March 2016 22:52Z | 10 | 98 | Walking | Active |
| 24 March 2016 22:53Z | 11 | 104 | Walking | Active |
| 24 March 2016 22:54Z | 12 | 114 | Walking | Active |
| 24 March 2016 22:55Z | 13 | 114 | Walking | Active |
| 24 March 2016 22:56Z | 14 | 120 | Walking | Active |
| 24 March 2016 22:57Z | 15 | 122 | Walking | Active |
| 24 March 2016 22:58Z | 16 | 127 | Walking | Active |
| 24 March 2016 22:59Z | 17 | 144 | Walking | Active |
| 24 March 2016 23:00Z | 18 | 147 | Walking | Active |
| 24 March 2016 23:01Z | 19 | 149 | Walking | Active |
| 24 March 2016 23:02Z | 20 | 151 | Walking | Very Active |
| 24 March 2016 23:03Z | 21 | 158 | Jogging | Very Active |
| 24 March 2016 23:04Z | 22 | 177 | Jogging | Very Active |
| 24 March 2016 23:05Z | 23 | 177 | Jogging | Very Active |
| 24 March 2016 23:06Z | 24 | 189 | Jogging | Very Active |
| 24 March 2016 23:07Z | 25 | 189 | Jogging | Very Active |
| 24 March 2016 23:08Z | 26 | 184 | Running | Very Active |
| 24 March 2016 23:09Z | 27 | 177 | Running | Very Active |
| 24 March 2016 23:10Z | 28 | 172 | Running | Very Active |
| 24 March 2016 23:11Z | 29 | 155 | Running | Very Active |
| 24 March 2016 23:12Z | 30 | 161 | Running | Very Active |
| 24 March 2016 23:13Z | 31 | 180 | Running | Very Active |
| 24 March 2016 23:14Z | 32 | 190 | Running | Very Active |
| 24 March 2016 23:15Z | 33 | 180 | Running | Very Active |
| 24 March 2016 23:16Z | 34 | 161 | Walking | Very Active |
| 24 March 2016 23:17Z | 35 | 157 | Walking | Very Active |
| 24 March 2016 23:18Z | 36 | 139 | Standing | Active |
| 24 March 2016 23:19Z | 37 | 120 | Standing | Active |
| 24 March 2016 23:20Z | 38 | 113 | Standing | Active |
| 24 March 2016 23:21Z | 39 | 114 | Standing | Active |
Table 7.
Average Fitbit HR BPM for activity.
| HR | Sitting | Walking | Running | Resting |
|---|---|---|---|---|
| Average HR (BPM) | 81 | 138 | 155 | 106 |
Table 8.
Trained AR from user feedback for alarm verification requests.
| Time | BPM | Sensed AR Triggered Alarm | User Feedback |
|---|---|---|---|
| 24 March 2016 22:48 | 88 | Sitting | Resting |
| 24 March 2016 22:56 | 120 | Walking | Resting |
| 24 March 2016 22:57 | 122 | Sitting | Active |
| 24 March 2016 22:58 | 127 | Running | Active |
| 24 March 2016 23:03 | 158 | Jogging | Active |
| 24 March 2016 23:04 | 177 | Jogging | Very Active |
| 24 March 2016 23:11 | 155 | Walking | Active |
| 24 March 2016 23:12 | 161 | Sitting | Very Active |
| 24 March 2016 23:16 | 161 | Walking | Very Active |
| 24 March 2016 23:17 | 157 | Walking | Very Active |
Table 9.
Adjusted average measurements.
| HR | Resting | Active | Very Active |
|---|---|---|---|
| Average HR (BPM) | 89 | 148 | 170 |
Table 10.
Data transmission bandwidth and power consumption comparison for data exchange to transmit sensed data from sensors.
Table 10.
Data transmission bandwidth and power consumption comparison for data exchange to transmit sensed data from sensors.
| Transferred Data Files of Sensed Data | Size to Transfer | No of Packets from Sensor/Power Consumed | No of Packets to Sensor/Power Consumed | Total Packets Exchanged /Power Consumed 1 | |||
|---|---|---|---|---|---|---|---|
| HR 628 DP | 120 KB | 122 | 3050 mA | 193 | 1930 mA | 377 | 4980 mA |
| BT 45 DP | 14 KB | 38 | 950 mA | 145 | 1450 mA | 201 | 2400 mA |
| RR 36 DP | 6 KB | 29 | 725 mA | 139 | 1390 mA | 181 | 2115 mA |
| HR 1 DP | 1 KB | 28 | 700 mA | 139 | 1390 mA | 170 | 2090 mA |
| Combined 647 DP | 537 KB | 396 | 9900 mA | 340 | 3400 mA | 740 | 13,300 mA |
1 Power is calculated by Ampere × Voltage. P(W) = I(A) × V(V).
© 2017 by the authors. Licensee MDPI, Basel, Switzerland. This article is an open access article distributed under the terms and conditions of the Creative Commons Attribution (CC BY) license (http://creativecommons.org/licenses/by/4.0/).
Share and Cite
MDPI and ACS Style
Kang, J.; Larkin, H. Application of an Emergency Alarm System for Physiological Sensors Utilizing Smart Devices. Technologies 2017, 5, 26. https://0-doi-org.brum.beds.ac.uk/10.3390/technologies5020026
AMA Style
Kang J, Larkin H. Application of an Emergency Alarm System for Physiological Sensors Utilizing Smart Devices. Technologies. 2017; 5(2):26. https://0-doi-org.brum.beds.ac.uk/10.3390/technologies5020026
Chicago/Turabian StyleKang, James, and Henry Larkin. 2017. "Application of an Emergency Alarm System for Physiological Sensors Utilizing Smart Devices" Technologies 5, no. 2: 26. https://0-doi-org.brum.beds.ac.uk/10.3390/technologies5020026
Note that from the first issue of 2016, this journal uses article numbers instead of page numbers. See further details here.