1. Introduction
Content creation for virtual experiences is a critical but necessary task within various application areas. The recreation of real or planned environments for virtual experiences is necessary especially for architectural and real estate virtual reality (VR) applications. Architects and companies present planned houses or apartments usually by creating renderings or by generating 3D visualizations together with 2D floor plans. Exploring an apartment from the inside in a 3D environment could be beneficial. By using a head-mounted display together with a state-of-the-art tracking system, people could freely explore and interact with the architectural environments in VR, which are still in the planning stage. The critical part for providing such an experience, however, is the creation of a proper 3D structure, a realistic visualization and appropriate navigation and interaction techniques within VR. In order to provide such a feature for the mass-market, it is necessary to speed up or even fully automate the content generation process for VR, which is the key target of our approach.
The work at hand has to solve various challenges beginning with the (1) interpretation of the floor plan, (2) generating the 3D mesh for the model and (3) providing an appropriate VR experience.
The first part of the work concentrates on analyzing floor plan drawings to extract architectural elements with correct scale while dealing with content, which is not relevant for the task. This so-called clutter (such as text, detailed wall structures, etc.) is due to the construction of the here presented detection process automatically ignored. Since we concentrate on visual correctness, but not architectural correctness, components which cannot be accessed or seen should also be ignored such as pipes or units. This allows us to use a different approach than in [
1] for example, since not every inner detail has to be covered. Therefore, we first concentrate on openings to then detect wall segments. Furthermore, the big diversity of architectural object representations, such as doors or windows, represents another challenge in this work. One and the same object can be drawn differently in a floor plan. To solve this problem, we analyzed many floor plan drawings to construct a ruleset to be able to automatically detect these objects.
In the second part, responsible for the 3D model generation the main challenges are the automatized preparation of the surfaces for texturing. Thereby defining each wall individual and preparing a correct scale for surface texturing. To appropriately texture surfaces the room type has to be estimated, since this information is not always available.
The main challenge of the final part of the implementation dealing with preparing the VR experiences is the creation of an automated approach of positioning light sources, automated texturing and preparing the model for interaction possibilities. All steps presented in this work have a high degree of automation and almost no interactions of a user are required. The individual research areas covered by the work at hand are already discussed by many researchers [
2,
3,
4]. Nevertheless, to our best knowledge, no work has been released with a similar complete workflow and a similar degree of automation. They are also not flexible enough to deliver all information needed to create a realistic and interactive 3D representation and are usually not meant for end customers.
The main research hypothesis of this work claims that an automatically generated virtual experience by our methods significantly helps customers in the decision-making process of buying or renting a real estate object. To study this hypothesis an elaborate user study was conducted comparing a traditional 2D representation including 3D renderings, a virtual walkthrough and an advanced VR walkthrough with the possibility of interacting with the environment (furniture, textures, etc.) with a custom designed VR interaction technique.
This work starts with the description of an important scientific contribution and the limitations of the presented approach. After comparing the here presented concepts with similar approaches the main core components are described. The Floor Plan Interpreter is responsible for reading and analyzing 2D vectorized floor plans (
DWG or
DFX) of one or multiple apartments.
Section 3.2 VR Apartment Generation then describes the further processing of the found architectural components such as wall or openings. It contains the 3D model generation and the room type estimation. Finally, the
Section 3.3 module describes the visual refurbishment and the interaction metaphor for the user. The work closes with a technical evaluation of the model generation process and an extensive user study utilizing a head-mounted display with two controllers (Oculus Rift CV) to explore the VR environment. The studies showed that people looking for an apartment were satisfied with the realistic appearance in VR. Furthermore, people agreed to use such a virtual tour more often, since it helps in making a decision about buying or renting a property. Results also indicate that the interaction is flexible and easy to understand for exploration and interaction with furniture.
Contribution and Limitations
The work at hand was inspired by the real-world problem of the shortage of available apartments. For that reason, many people have to make a decision about buying or renting an apartment before the construction of such even has begun. Our approach should help the provider to create an appropriate and cost-effective VR experience within a short amount of time. In that way customers have another source of information in order to come to a decision whether to buy a specific apartment or not. Our method can also be applied to other application areas such as building construction, indoor navigation, automatic 3D model generation, interior design and much more. While others (see
Section 2) are mostly focusing on individual problems, this work shows an implementation with a fully functional automatized workflow starting from an input file describing a floor plan to an application for exploring a virtual apartment.
For the present approach, a chain of modules was developed. The contribution of the presented modules can be described in different areas: The main contribution of the first module is defined by the way of recognizing structurally relevant objects in a 2D CAD (computer-aided design) floor plan drawing in an automated way. CAD files usually contain layers and meta-information describing the presented content. Within this work, many floor plans were examined which showed that this information cannot be relied on. Because of that and in order to be prepared for various import file structures this source of information is ignored in the whole process. The work at hand also targets floor plans with different levels of details as architectural drawings can have different purposes.
By using a recursive inside-out approach of connected components in the drawing it was possible to ignore components in the drawing that are irrelevant for constructing a 3D model. This enables the system to take floor plans as input, which can be cluttered with information such as furniture, building details or text elements without much disturbing the algorithm. In order to open up for a broader application possibility, we decided to make use of open standards as used in building information modeling (BIM). As output of the detection process a well-defined file format based on the Industry Foundation Classes (IFC) is created, thereby increasing the reusability of the system.
Since the target of the paper is an interactive explorable environment the defined requirements for a VR application were considered when constructing a 3D model, such as low polygon count or lighting condition. In favor of an automated system also 3D objects of doors and windows were placed according to position and scale. A statistical approach was implemented to estimate a plausible room type configuration of an apartment. Other than that, the automated approach was able to process a big number of vectorized floor plans. The resulting 3D model is automatically prepared for and equipped with textures, light sources and the possibility of interaction. A user study which forms the final research contribution of this paper shows how people react to the 3D environment and how they would accept such a system in real life when searching for a real estate property.
For the approach at hand certain limitations were defined in order to realize a fully automated workflow. As an input file only vectorized 2D floor plans of one ore multiple apartments are accepted as
DWG or
DFX file formats. We are currently not processing rasterized representations. At this point it has to be mentioned that this work is targeting floor plans, which do not already have all necessary meta information in order to construct a 3D model. We are targeting drawings which could in an extreme case for example be scanned and vectorized by non-professionals. Small drawing errors in the floor plan are corrected in the process. The plan may contain design elements and measuring details (to a certain extent). Objects representing pipes or similar technical details are handled as clutter and are not further processed. To detect openings, they have to be composed of one connected component. Openings fulfilling the structural constraints mentioned in
Section 3.1.2 can be automatically detected. Other more complex ones such as foldable doors can be added by the user with the “OneClick” approach. The algorithm can handle outer areas such a balconies and terraces, but vertical openings such as staircases or elevator shafts are not part of this work, but the user can define vertical openings manually. The 3D reconstruction currently does not support tilted walls due to roof slopes. Furthermore, the room type estimation was developed as an auxiliary tool since the many of surveyed floor plans contained no textual description, using abbreviations, and different languages.
2. Related Work
The 3D model generation algorithms in the area of buildings or apartments are often intended for architects and professionals to visualize the overall concept. Creating a model for a customer being able to explore and interact with a virtual apartment has different requirements. In the literature, there are not many approaches describing a whole automated workflow starting with a floor plan and presenting a visually realistic representation of such. This section discusses related approaches in the area of analyzing 2D floor plans, using CAD and BIM data for realistic 3D visualization and automatic floor plan generation.
Technical drawings for apartments are usually the base material for the generation of 3D models since they contain all necessary structural information. Yin et al. [
5] evaluated multiple algorithms by comparing aspects such as image parsing, 3D extrusion, and the overall performance. They showed that the pipeline for a complete solution is very similar over most approaches. It usually starts with a scanned or already vectorized image, which is cleaned up and forwarded to a detection algorithm for architectural components. The triangulation usually finalizes the concepts. According to Yin et al., the algorithms are partly automatized but still rely on layer information, manual outline definition, manual cleanup or geometric constraints.
One of the first approaches to use 2D drawings for creating 3D structures were published by Clifford So et al. [
3] and Dosch et al. [
6]. Their common goal was to mainly reduce the time needed to create a 3D model of a building. Clifford So et al. reviewed the manual process and concentrated on creating a semi-automated procedure for wall extrusion, object mapping and ceiling and floor reconstruction. Dosch et al. on the other hand mainly concentrated on matching multiple floors on top of each other in an automated way.
An important step towards 3D model generation is the detection process for architectural symbols. Many publications concentrated on symbol detection in rasterized or vectorized floor plans, whereas the majority is converting rasterized images into a vectorized representation in the first step, just like Luqman et al. [
7]. They use a statistical classification method in order to detect well-known symbols within a drawing. A multidimensional feature vector is created for every new symbol. Thereby it is possible to detect symbols of similar size and shape. A training procedure is used to create a Bayesian network for the detection step. Others such as Yan et al. [
4] are focusing on creating a spanning tree representation of the available data structure. Every new symbol is described through geometric constraints and converted into a connected tree structure. With this approach, they are reaching good results in finding these well-known symbols. Guo et al. [
1] goes a step further and includes text components into the definition of symbols, which allows a better and faster localization of these within the technical drawing.
In contrast to these approaches, the work at hand presents a more general solution in which for the most common symbols a general ruleset is defined. By this it is possible to avoid the initialization step of defining each type of symbol for each floor plan.
Another concept that is used in publications such as [
8,
9] rely on having layers available and a correct layer assignment in order to segment specific architectural components (openings, walls). This, on the one hand, reduces the complexity but on the one hand, could lead to problems if some elements are wrongly assigned. Detecting wall segments in technical drawings are also treated either via layer assignment alone [
9] or of taking advantage of the parallelism of wall segments [
8,
10].
We on the other hand, do not rely on parallel line segments since walls could divergence or consist of multiple parallel line segments, representing wall and façade separately. Zhu et al. [
10] is using the symbol detection algorithm from Guo et al. [
1] and subtracts the found elements from the floor plan. In their example, the resulting plan only consists of line segments of the type wall. Like others [
8,
11,
12] they try first to detect parallel line-segment pairs which are analyzed with respect to intersections of different shapes (L, T, X, I). This helps to eliminate false positives and to create a so-called Shape-Opening Graph [
10], wherein each case an edge-set is added to the graph structure.
This leads to an overhead in classifying intersections and could also lead to problems with more complex wall shapes. The proposed method in the paper at hand is based on a different strategy where each wall segment (a single line) is detected based on the prior knowledge of the symbol recognition step, which is mostly independent of the wall structure.
Several publications in the area of 3D modeling do not analyze floor plans but integrate IFC as an interface for BIM in order to get access to the individual components. Some approaches also rely on VRML (Virtual Reality Modelling Language) for visualization [
13]. Hakkarainen et al. are exporting structural information from a commercial CAD drawing application converting it to a VRML standard. For the visualization step, they used Open Scene Graph, a 3D rendering environment. Using data directly from applications supporting the BIM standard has the advantage of having access to various meta information about each architectural component. This allows also to process some steps manually in order to achieve a better visual quality. Ahamed et al. [
14] for example is describing a workflow starting with the Autodesk Revit BIM model, which is exported to a 3D DWG file describing the structure of the model. In the last step with Autodesk 3D MAX textures and lighting are added before exporting it to VRML. Using their 3D models is especially interesting in Virtual and Augmented Reality applications not only for a static model but also for visualizing the construction process. In [
15,
16] for example, the authors make use of VRML which can be linked to a file describing the building process. Thereby, a 4D visualization can be produced showing the 3D model in different construction stages at different times.
Not only in construction but also in the area of game development realistic 3D models and a fast creation are of importance. Yan et al. describe in [
17] the integration of a BIM-Game based system for architectural design. The relation to our work is especially within the realistic visualization and the possibility of interacting with the environment. In their work, they describe a high-level framework and rely solely on the BIM model. From the point of view of real estate customers, the visualization style from the BIM format is not that interesting, and since no mesh splitting is performed many surfaces use textures with the same material and appearance. The process they describe is partly automated and partly manual since augmented information has to be done in a separate application. However, for integration into a BIM system, this tool seems to be very valuable.
Interactivity in a virtual environment is a core component of various game engines. With the problem of integrating architectural models into game engines, Uddin et al. [
18] presented a short workflow to realize an integration of universal formats such as DXF and DWG. They faced two main problems which they were able to solve: compatibility and accuracy. Unfortunately, their models did not contain textured surfaces.
Semantic detection besides architectural components such as openings have been addressed sparsely. Ahmed et al. have published another work in this area [
19] handing a semantic analysis for detecting rooms labels. In contrast to the work at hand where room labels are assigned by a statistical approach. Ahmed et al. try to extract text information from inside of the room boundaries.
To complete the section of related work the area of automatic floor plan generation has to be mentioned since this area approaches a similar problem of room labeling. Like [
20,
21] the aim is to generate living environments according to a specific set of requirements such as the number and type of rooms. With the algorithm of Marson et al. [
20], they were able to procedurally generate floor plans and also concentrate on the overall structure of the apartment. This is especially interesting for the work at hand since the here presented apartment segmentation and room type estimation is based on similar dependencies (accessibility of rooms, room types, size, etc.).
The high number of related works shows that many researchers have been working on one or the other aspect. Most approaches are designed for architectural applications or construction purposes. In contrast to these we have to concentrate on visual correctness, but not architectural correctness. This means for example that not every wall element has to be in the 3D model only those that can be seen. The inside of a ventilation shaft or a technical shaft should be ignored. This opens up other paths and challenges in the symbol detection step as well as in the 3D model generation step.
3. Proposed System
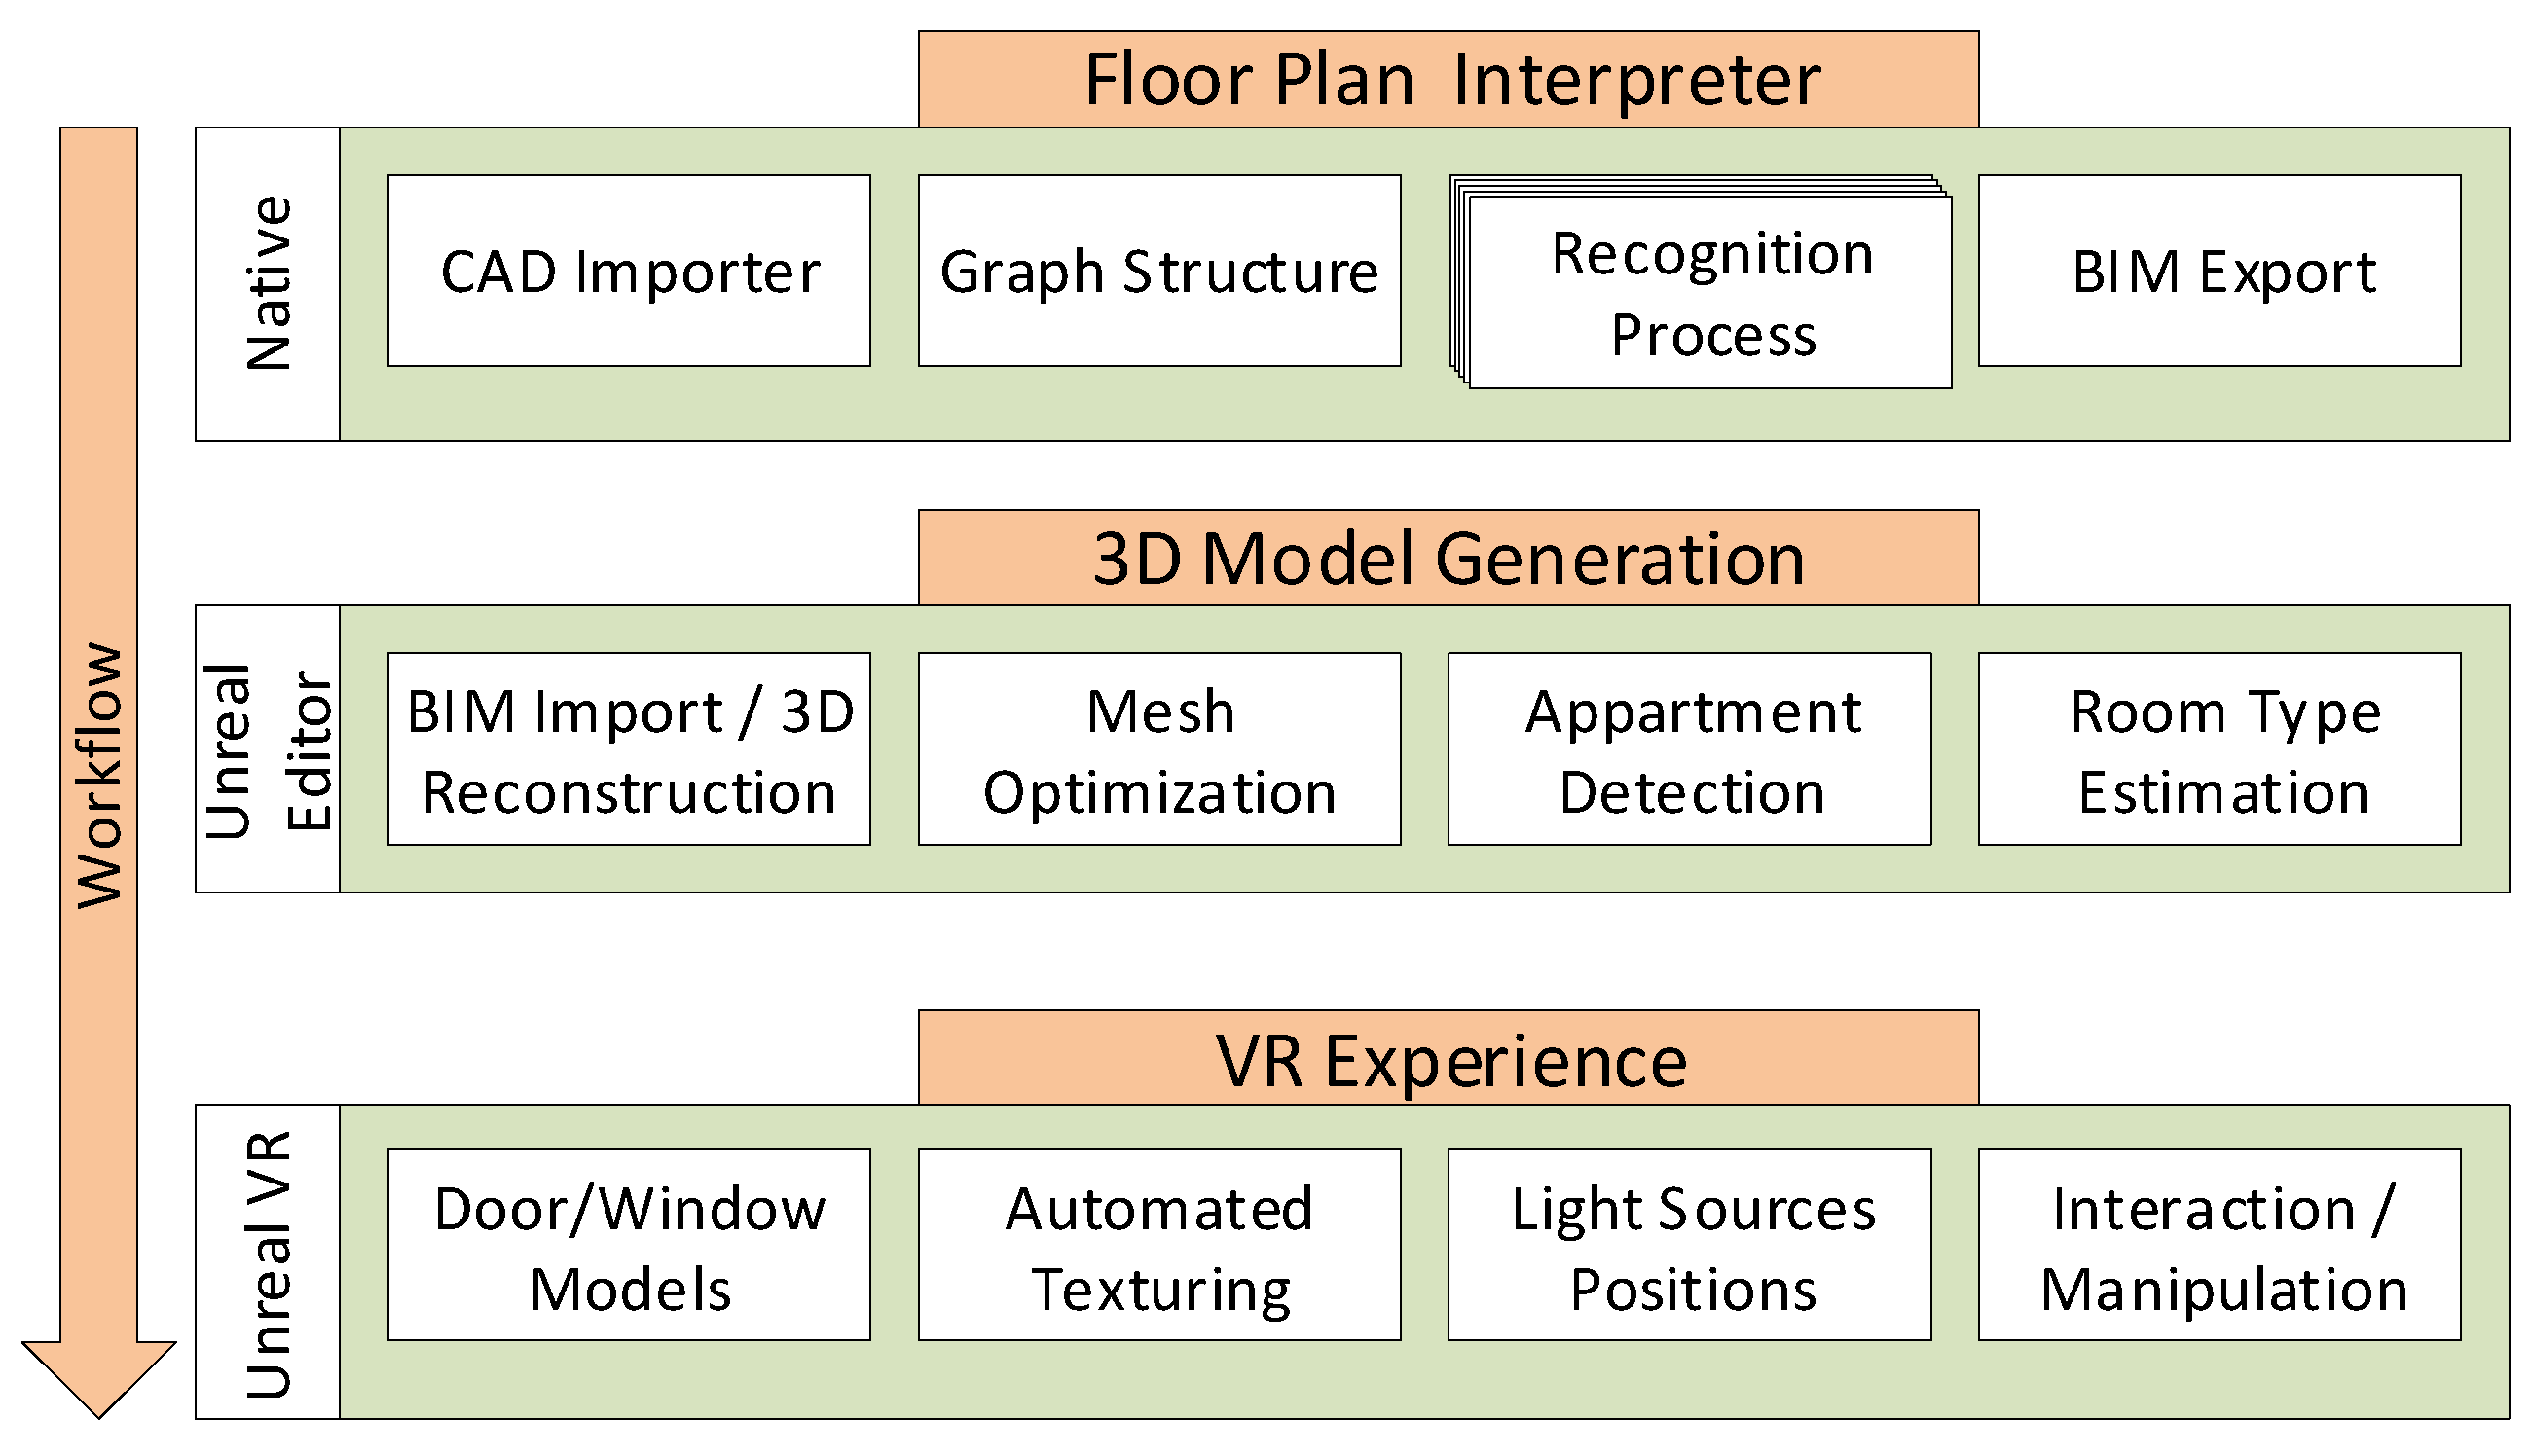
The proposed system “Floor Plan 2 Virtual Exploration” (FP2VE) can be subdivided into three main modules (see
Figure 1) responsible for floor plan interpretation, 3D model generation and the creation of an interactive VR environment. Module one is written in C++ as a standalone application. At a first step, it is responsible for reading the lines of the vectorized input floor plan thereby analyzing the content and correcting drawing errors. In a next step, the information of the input file is converted to a graph structure and passed forward to the recognition process, where a searching method is responsible for finding relevant elements. A graphical user interface makes it possible to monitor the process and to adjust certain parameters. For the object recognition process, two methods were implemented. An automated process for finding openings is designed to detect a high number of doors and windows with different appearances. As a fallback option, it is possible to add unusual representations with the “One-Click” (as described in
Section 3.1.2 approach for a separate detection step. After converting all relevant objects into the standard IFC format the result is handed to the 3D Model Generation process.
The 3D Model Generator is implemented and integrated into the Unreal Game Engine 4 (Unreal Engine:
https://www.unrealengine.com/). A custom plug-in with the help of the IFC Engine library was created to be able to take the IFC file from the Floor Plan Interpreter module. All implemented algorithms in this module are running within the Unreal editor mode, which enables the possibility to use the editor for manual design changes such as adding furniture. The same Unreal project is used to build the environment as a VR executable application. The main task of this generation module is to create meshes considering openings and to optimize them for VR, including light leaking removal and individual surface texturing. Also, the surface subdivision is performed in this step. Since floor plans usually contain multiple living units within this module the apartment segmentation algorithm searches for possible subdivisions. This is necessary since the room type estimation algorithm can only work in a closed apartment structure.
Finally, the VR Experience module, also implemented in Unreal Game Engine 4, prepares the model for a VR experience. 3D models for openings are selected, adjusted and placed automatically. Furthermore, the texturing of walls, ceilings, floors, and facades is done according to the previously detected room type. Also, a reasonable position of lights within the rooms is estimated. Finally, a database with various 3D models of furniture was generated, adapted in size and prepared for interaction such as adding bounding boxes for collision detection.
For exploring the finally designed model an interaction metaphor was implemented enabling the user to manipulate the surrounding by placing furniture, changing the appearance of surfaces such as walls and enabling a teleporting locomotion possibility through the environment. This module concludes the overview of the implemented system.
3.1. Floor Plan Interpreter
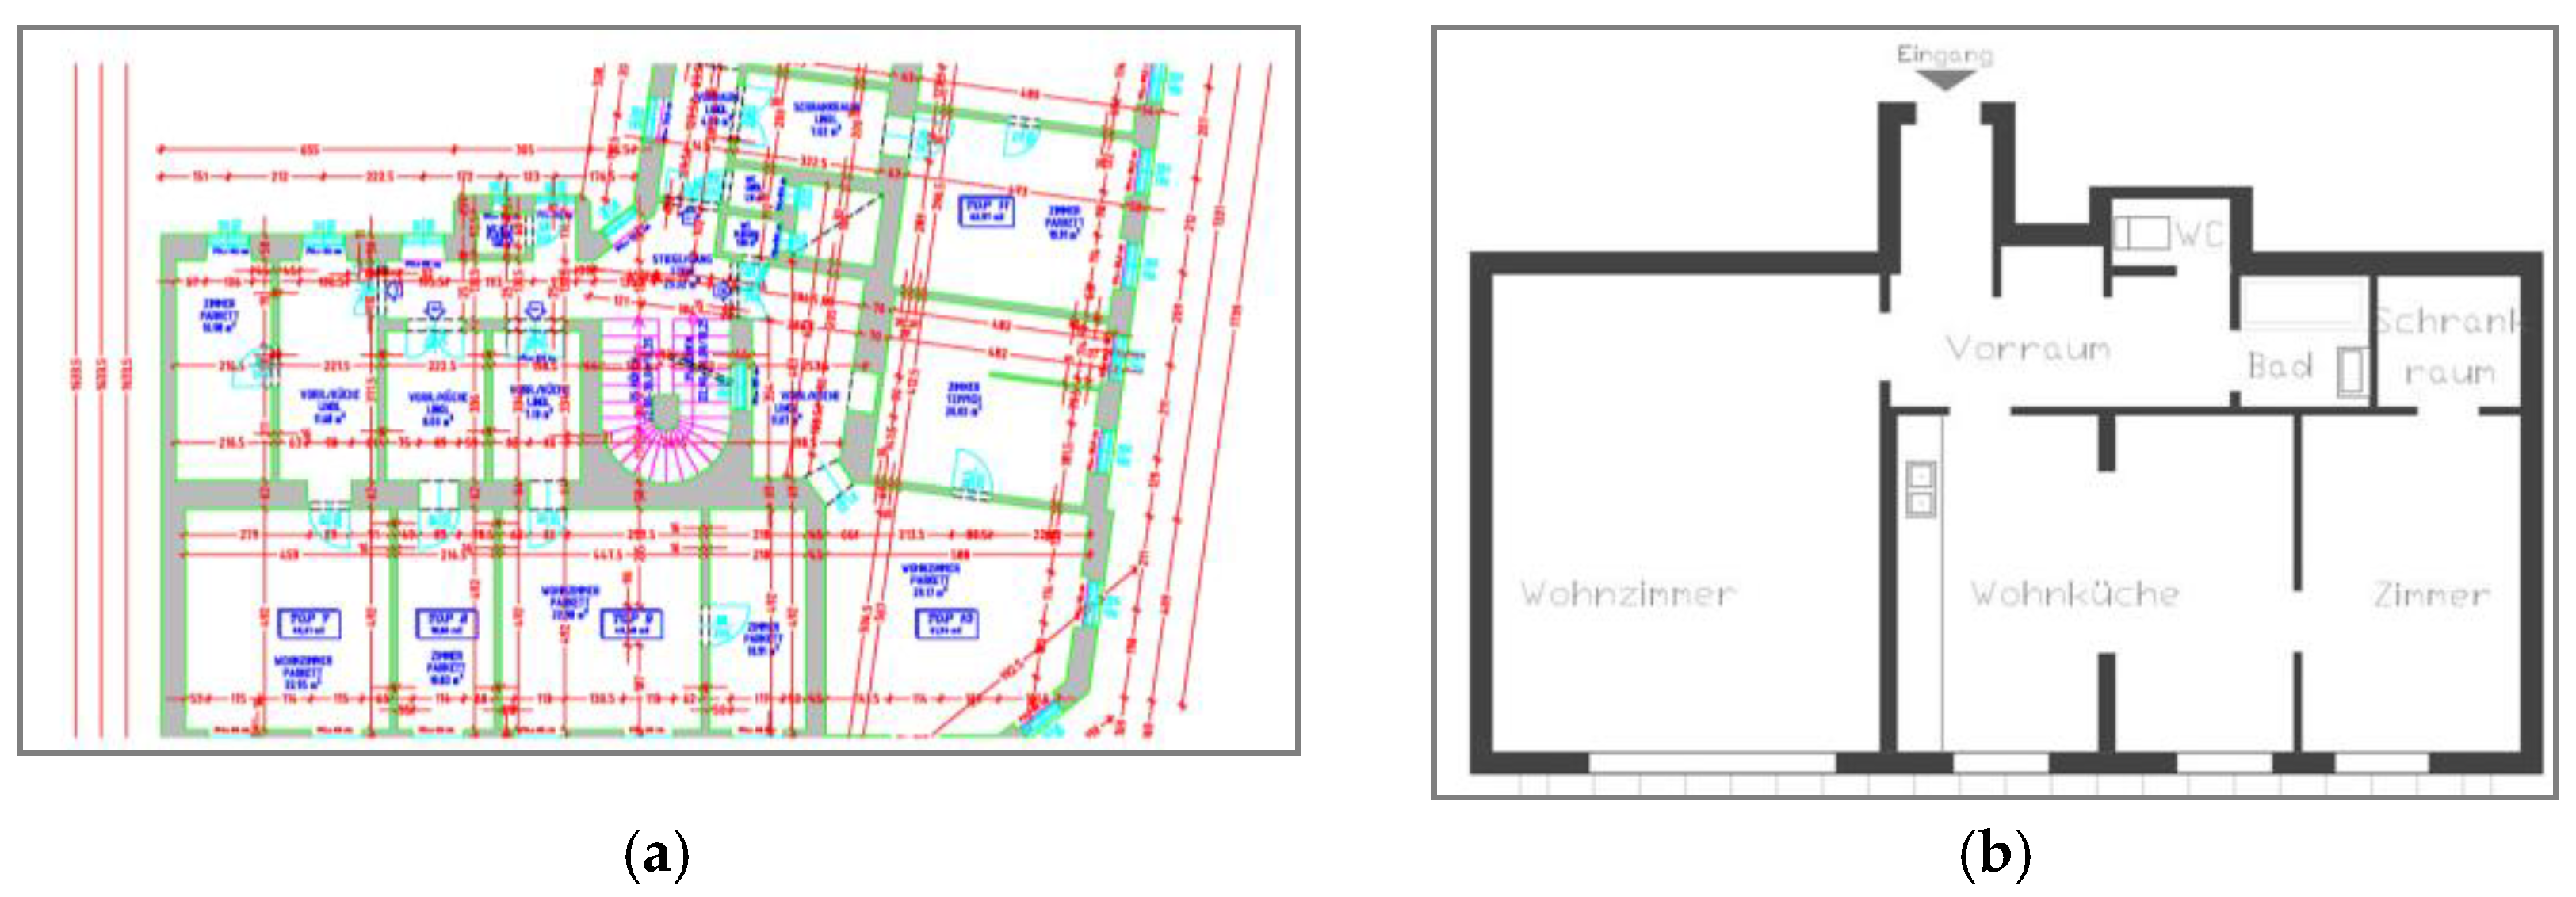
As a first step, numerous floor plans were studied from different sources and formats, in order to understand the complexity of the problem. During this pre-study two main challenges were defined for the automated analyzing tool. Floor plans exist in different styles depending on the purpose. Drawings for construction differ from those used for approval or just for presenting to a customer. Different stages of information results in more or less information included in the file.
Figure 2 illustrates different styles which can be used as an input to the proposed approach.
As already pointed out we are interested in the elements which define the building shell. All other components described in a drawing are treated as visual clutter. In many drawings, especially in vectorized formats such as CAD drawings, layers are used to group the content of the same category (walls, windows, furniture, etc.). To our experience, especially in complex drawings, it is not possible to fully rely on the correct naming or the correct assignment to these layers. Changing the appearance or correcting the layer assignment manually is time-consuming. For that reason, the algorithm must be able to process different kinds of representations. Furthermore, it is important to design the approach in a way that this clutter is automatically ignored.
In addition to that, the main modeling programs available for architects were analyzed concerning the graphical representation of different components. When extracting different models out of these applications we identified the same challenge as mentioned in several other publications. The variety of available symbols for one and the same object is structured differently. To our best knowledge, there is no database available with a collection of architectural components with different representations which makes it very hard to create a generalized detection algorithm.
For constructing a realistic 3D representation, we defined the following components as important to be extracted (see
Table 1). Some attributes of an object can be directly extracted from the 2D representation, others such as the height of objects have to be predefined by the system or the user.
Architectural drawings represent usually a cut of the represented object at a height of one meter. Therefore, not all parameters can be extracted from a floor plan especially if text elements are not analyzed during the detection process. Elements which are located at another height are often entered in another way or in a separate drawing. Attributes such as height or the lower edge of a window cannot be extracted from the line set alone. Within this work, these parameters are set to usual values but can be adapted in the interface manually. While parsing the data from the floor plan line width and line color are ignored, since there is no universal standard for using these patterns.
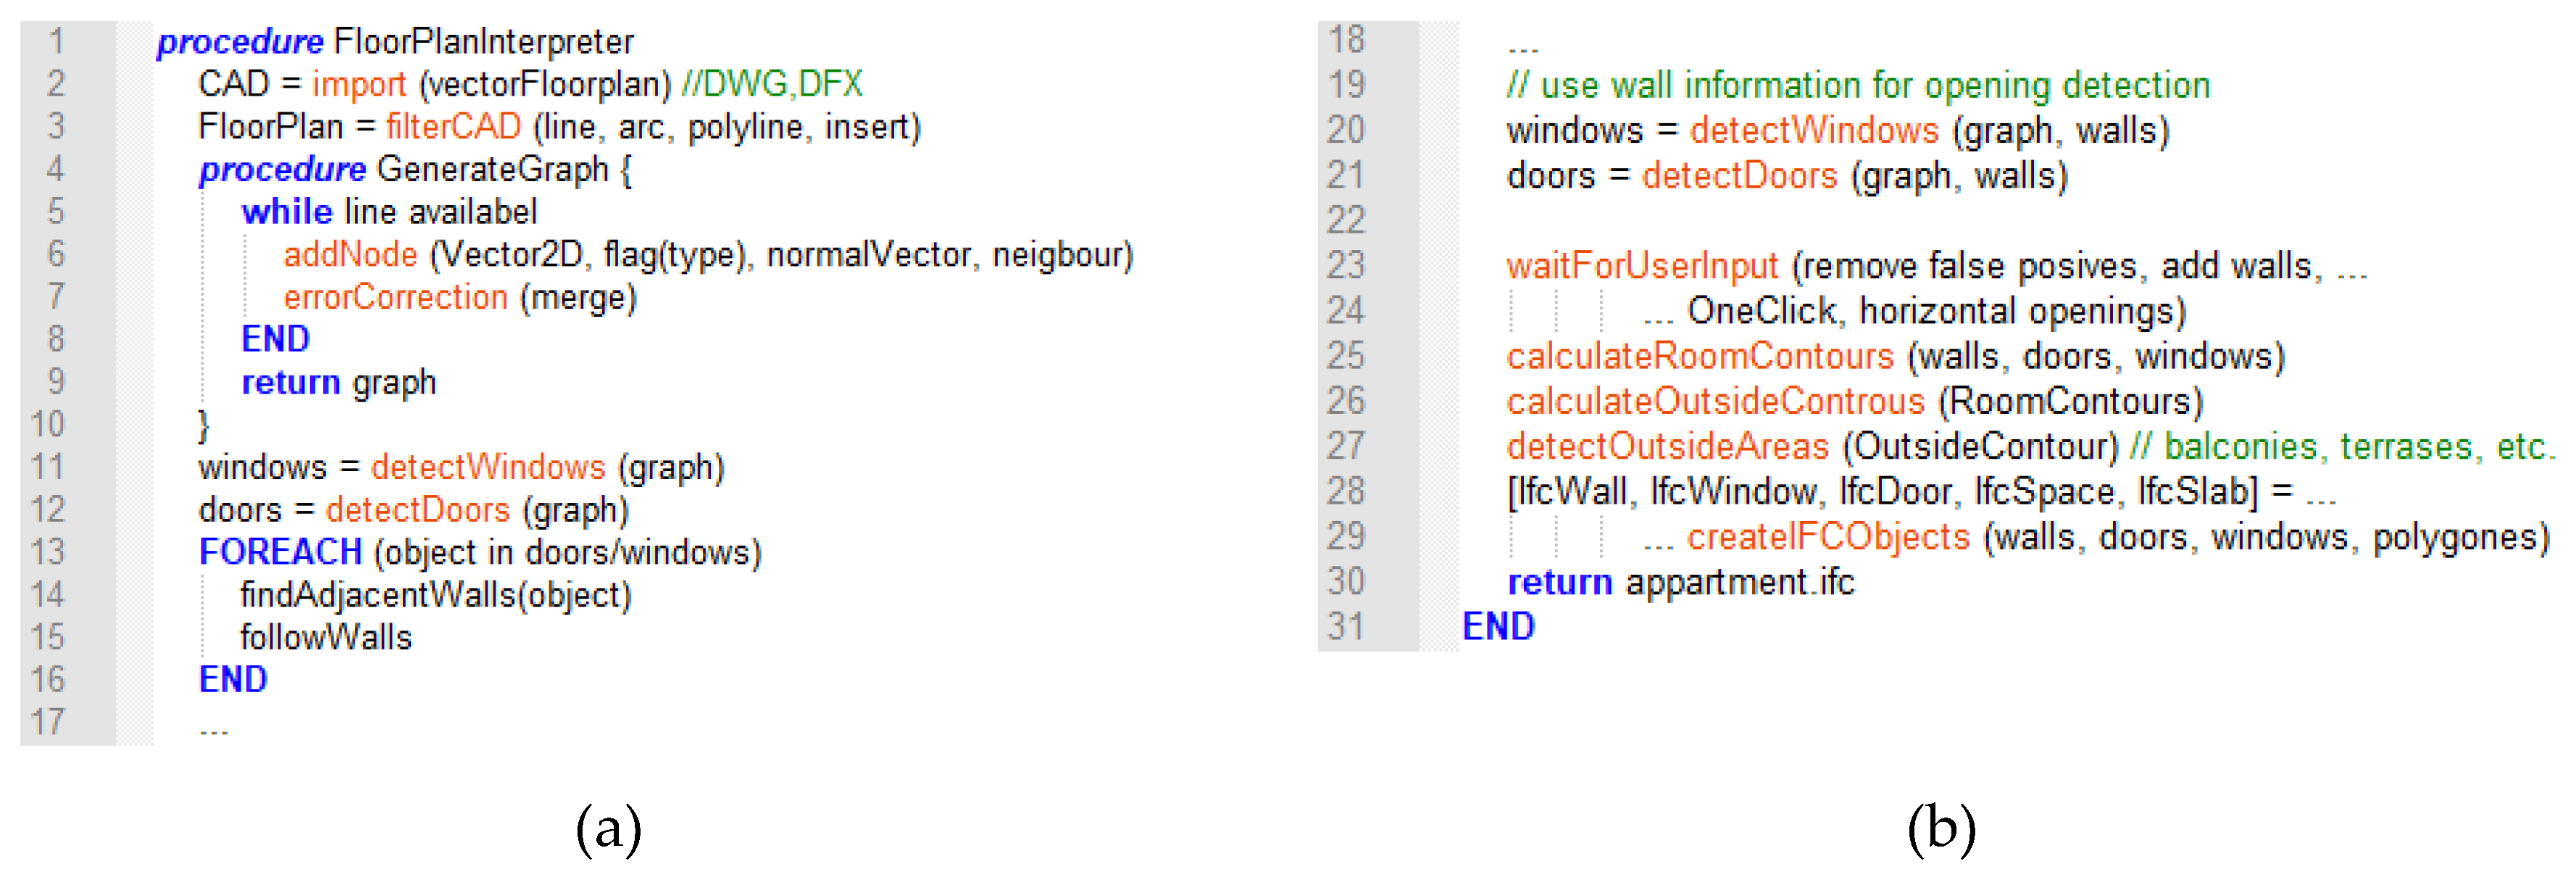
The proposed detection process is based on a structural approach, where a group of elements is generalized as much as possible in order to detect a high number of elements. Our work is not taking advantage of neural networks for this approach since for training purposes a high number of examples would be necessary. On the contrary, the proposed approach can also be seen as a first step to collect various data for creating a database, since every found object is kept within the application and can be used for further research. In comparison to other structural approaches in this area, the here described detection process is starting from the most complex structures such as windows and doors.
Figure 3 shows the overall concept of retrieving components from an input file. At the beginning a
DWG or
DFX floor plan is loaded into the system and only relevant components are extracted. As a next step a custom graph structure (see next
Section 3.1.1) is created thereby correcting small drawing errors. The automated opening detection process (see
Section 4) is searching for windows and doors. After that, wall segments are extracted. With the knowledge of wall elements, the restrictions of the opening detection process are now softened up and the graph is again used to find the remaining openings. At this step the user has the chance to influence the result (see
Section 3.1.5 Interface) by removing false positives, adding walls or using the “OneClick” approach to add remaining openings. In the final steps room contours, the outside contour and outside areas such as balconies or terraces are detected. All relevant information about objects and dimensions are structured in order to create a standardized object oriented IFC file (
Figure 4 shows an excerpt of an IFC formatted file), which is the output of this step before creating a 3D model for VR.
3.1.1. Graph Structure
As a first step of the process, the libdxfrw Version 0.5.12 (
https://github.com/rvt/libdxfrw) library is used within the Qt development framework in order to be able to read DXF and DWG files, which are widely used for exchanging architectural drawings. As mentioned before not all information of these vectorized CAD files are used in this project. The following
DWG/DFX object types are seen as relevant: line (defined by two points), arc (defined by a radius and two angles), polyline (polyline in 2D and 3D) and insert (reference block). This subset of the input file is processed and converted to a custom graph structure for further processing.
The detection process is based on the graph structure of the architectural drawing and has to fulfill special requirements, due to the search procedure. For that reason, it differs from representations usually used in other approaches [
8,
10]. Those representations concentrate on line segments within nodes of a spanning tree which allows for fast saving and finding parallel and orthogonal lines. In addition to that usually, a set of parallel lines is treated as one segment. In contrast to that, the work at hand concentrates on a more complex representation, where every line is treated individually since walls and openings can vary in all dimensions. Furthermore, for the here presented approach it is important to be able to easily find and follow a path of lines. This can be achieved by building a graph where every node can hold one 2D vector, which represents the end of a line segment of the CAD drawing. When adding data to the graph the local representation of a point of the input file is converted to a new global coordinate system. In addition to that, every node is connected to another point, thereby representing a valid line segment. In this stage also, a field is prepared for adding the type of object the line belongs to. In case of an arc properties such as center point, radius and start/end angle are saved. Another feature of this structure is that angles between two edges can be calculated without additional search within the graph structure. This advantage allows the search function to define certain angle limits especially when matching with a defined structure.
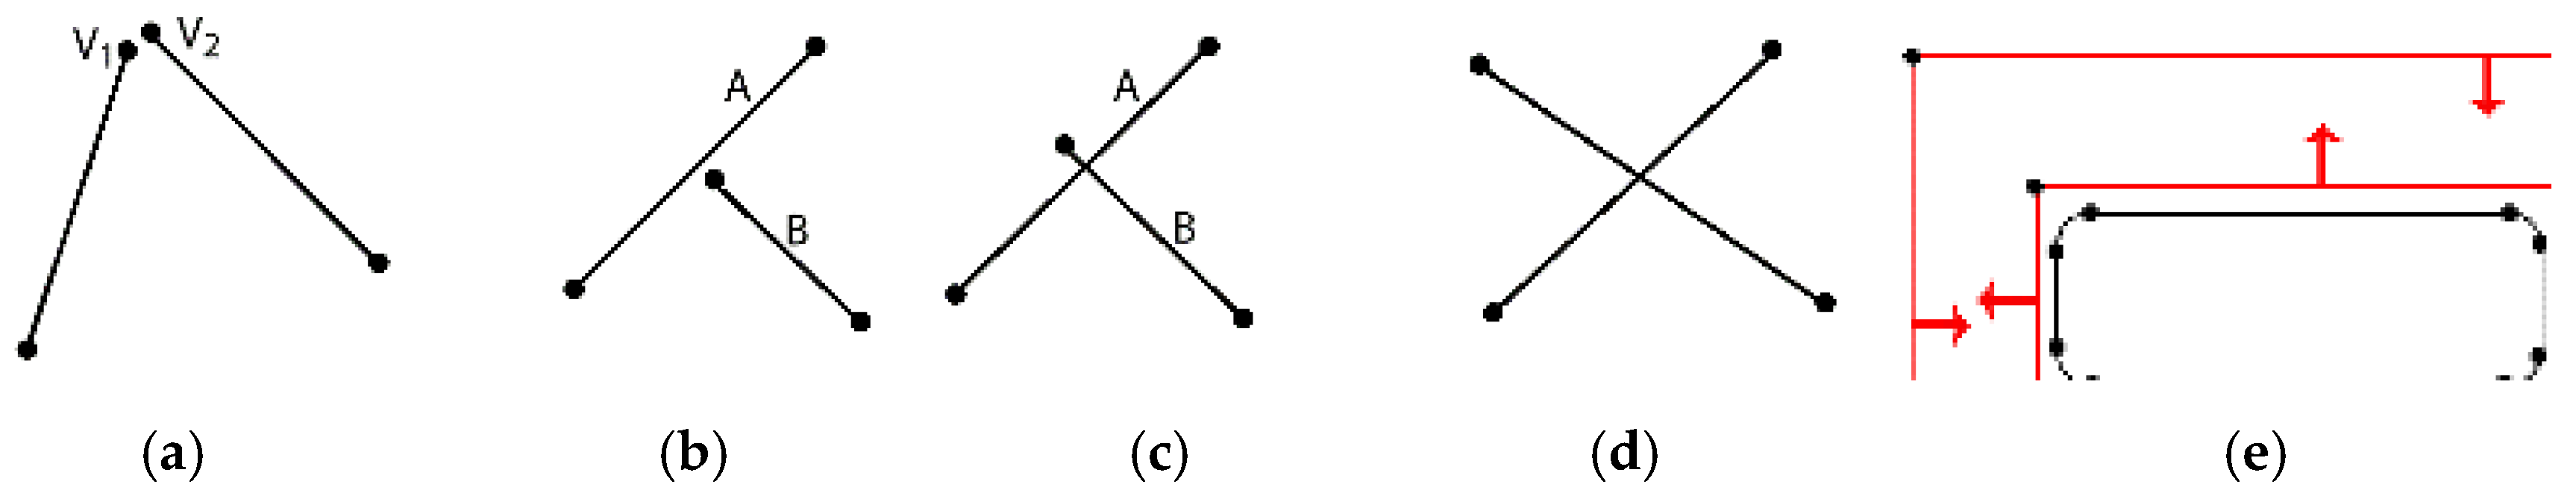
The creation process of the graph is finalized with an optimization and error correction stage. Identical edges are reduced and nodes with very similar points (see
Figure 5a) are merged in case of numerical imprecisions. Furthermore, edges are only split if another edge ends close to them (see
Figure 5b,c). In this case, the split, as well as the non-split edges, will be kept in the graph to be able to detect or ignore clutter such as furniture placed next to a wall. Crossings such as in
Figure 5d are not separating lines since every reference line would influence the process. For the detection process, every node is able to hold multiple membership information such as the types: wall, balcony, etc. In addition to that edges of a certain type are able to hold a directional vector (red arrows in
Figure 5e). This vector describes a normal vector of an edge pointing for example towards the inside of a wall segment, which is used when following edges. In special cases when walls consist of multiple line segments this vector also helps to identify the most outer lines.
3.1.2. Detection of Openings
The most important step in the detection process is the identification of openings since the rest of the detection process is directly dependent on it. This is also the reason, why this first step is designed to keep the precision high by avoiding false positive results. The detection of false windows would have a negative effect on all other parts of the detection pipeline. The here presented approach is distinguishing two openings: doors and windows. There is no finer categorization of these elements, whereas the set of rules differs between them. All wall openings can be located in the inner or the outer wall of the structure. Besides detecting an opening, also the connecting parts to the nearby wall segment have to be identified. These hints are then used in the subsequent steps to detect walls. The detection processes are designed to be invariant against rotation, realistic scaling, and position. In case some symbols cannot be found with the automated process, because of not fulfilling structural constraints of the automated approach a “One Click” detection process of openings is proposed.
Automatic Detection of Openings
The detection process of doors differs slightly from detection of windows. Especially doors have a large number of possible representations. The two-stage door detection starts with a rule set to detect candidates. In the second stage, these symbols are further analyzed concerning their surroundings. Door openings are detected depending on the following conditions.
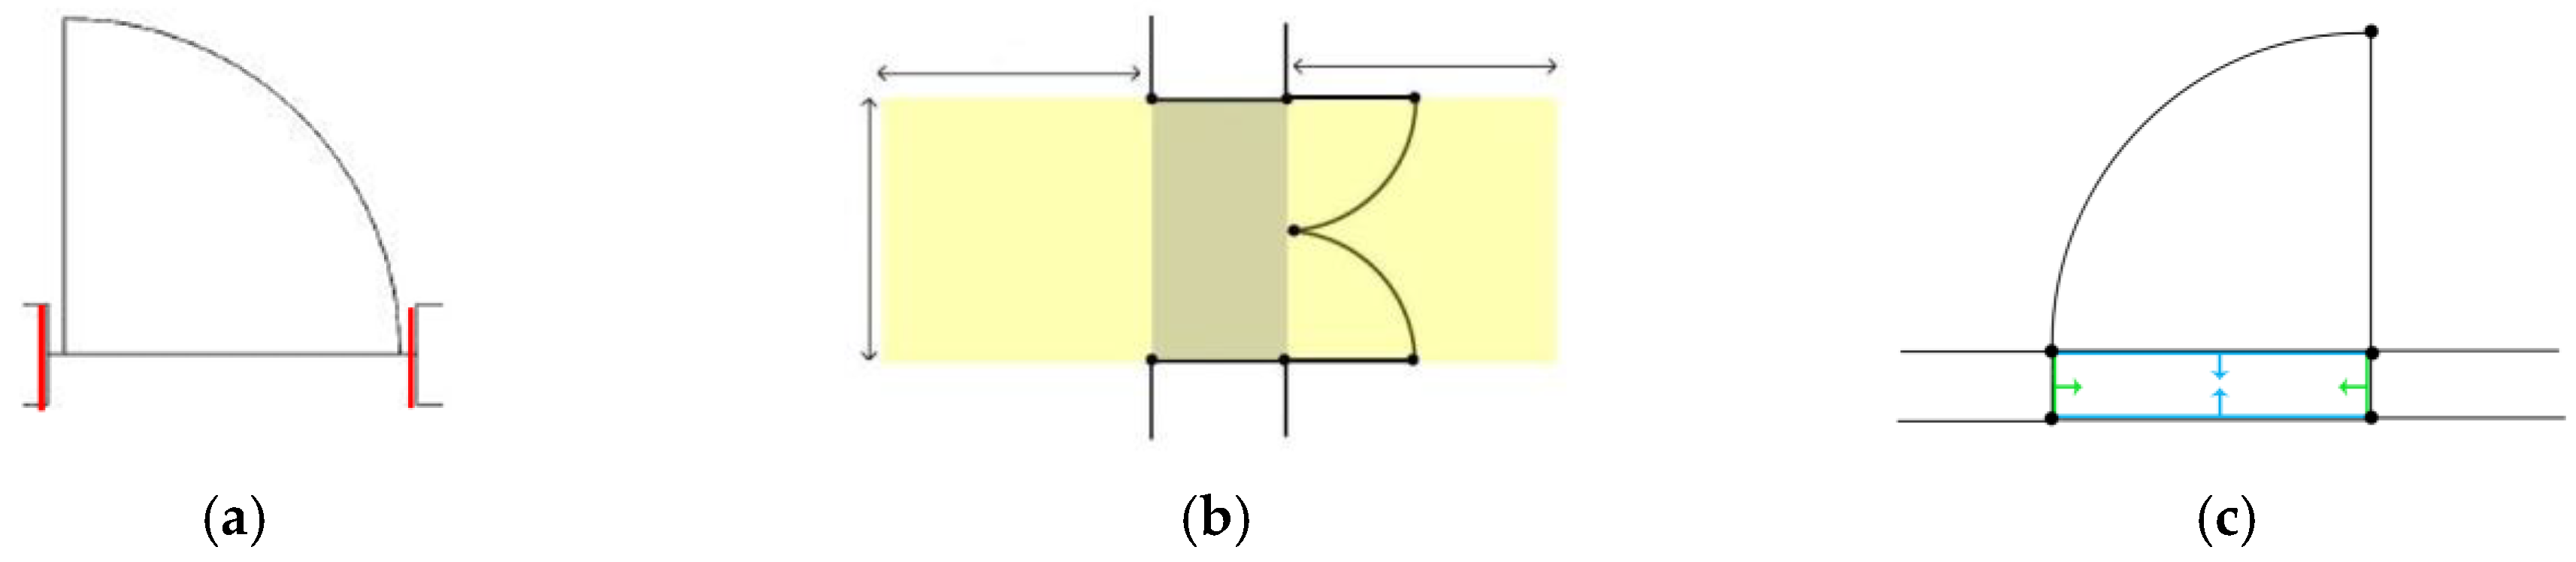
As a starting point, the algorithm tries to detect the door frame. Hence, a list of all possible edges representing one side of a door frame is extracted with the constraint of a limited length. This length is determined by the usual thickness of walls. Sequent edges with the same direction are summarized since a door frame could consist of multiple edges. In addition, these nodes need to have at least one other connected edge which would usually describe the nearby wall continuation. As a second condition, these edges are further analyzed regarding the symmetry of openings. Every valid door needs a frame consisting of two similar almost parallel edges in a specific distance range. This step creates a pairwise subset of edges (
Figure 6a red lines), building an almost perfect rectangle. In addition, every corner node needs to have an adjacent edge in a certain direction representing a wall.
The third condition mainly eliminates false positives in the area of interior objects. For that reason, the search algorithm spans a square area (see
Figure 6b) with the width of the potential door opening in both directions and collects all elements within this area. If an arc exists in this area which is directly connected to the frame, a door is detected. In case of a symbol that is missing an arc, it has to have a connection to the frame, which could be a sliding door. In that way, it is possible to see if another object such as a table is blocking the element in an area where the path should be free.
If all conditions are met a door is recognized and one more step has to be performed in order to continue to find wall segments. In this second stage, the detected symbol has to be prepared for the wall detection step. Not all door representations have a connected door frame on the long side (see
Figure 6a the direct connection between the red lines). These connections have to be added to the graph to be able to follow wall edges all around a potential room. In addition to that, a normal vector pointing to the inside of the door symbol is added to every edge belonging to the symbol (see
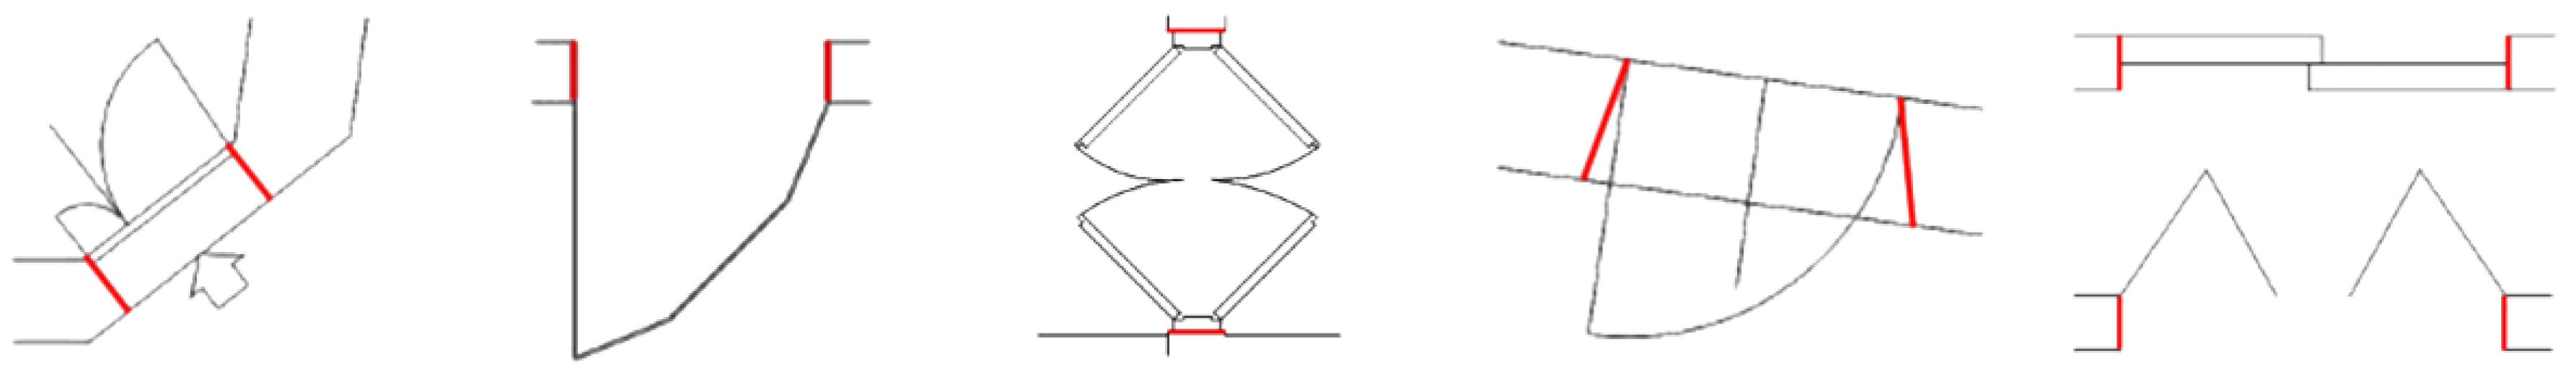
Figure 6c). Not all shapes can be detected with this approach especially more complex ones containing not connected elements could be left undetected.
Figure 7 shows a selection of door openings which can be detected with the described process.
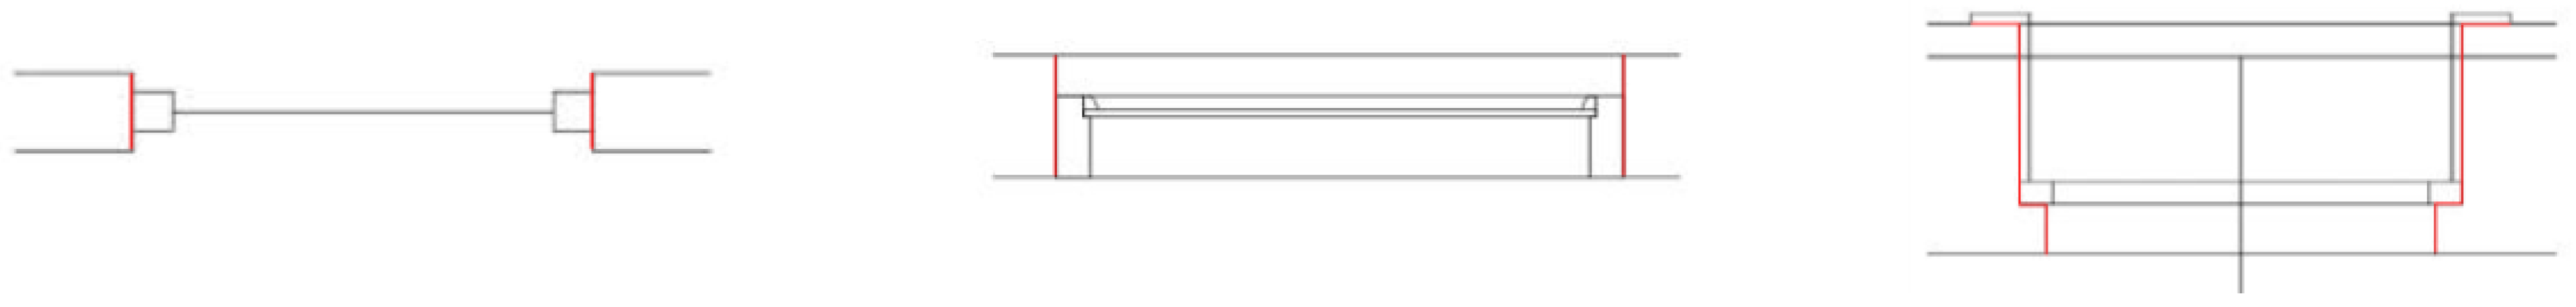
For detecting windows, the same approach is used to find pairwise edges. When searching for windows the long sides of the symbol have to be connected through one or multiple segments (see
Figure 8). Window symbols are usually more complex within the boundaries of the wall. The main constraint of windows relies on the occurrence of one or more rectangular elements within the boundaries. For that reason, it is especially important to use split edges. The algorithm tries to detect these shapes by following nodes and calculating angles between edges. With this approach, multiple windows could be detected in one symbol. For that reason, in a further analyzing step it is testing if symbols are overlapping. In this case, the bigger and more complex candidate is taken. Some windows have a more complex connection to walls. These types are ignored within the first run of the detection, since it would result in false positive results. Windows having a step or multi-step connection to the wall will be searched for after wall segments are already classified. In this second search cycle, fewer restrictions are used to find the remaining openings. The restrictions of parallelism of the pairwise line segments and the straight connection to the wall elements are dropped. This cycle can be repeated multiple times if necessary.
Figure 9 shows a selection of detectable window styles.
The automated approach of detecting openings is designed to find a broad variety of different openings thereby keeping false positive results low. This is the reason why there are certain limitations in the automated detection process. Every door element for example needs to be connected to at least one side of the frame to be detected. Sliding doors which have no connection to the wall are currently not detected, due to the misinterpretation of the blocking element (door leaf). Also, certain configurations of design elements could be misinterpreted as an opening. Additional structures on the outside or inside of the opening do not influence the process. However, as the analyses of floor plans showed, certain exotic door or window structures are built up in a different configuration such as folding doors, etc. For this rather rare occurrence a template matching algorithm was implemented, together with a segmentation method to be able to fully process a floor plan. This “One-Click” approach is described in the next section.
One-Click Detection of Openings
In contrast to the automated approach an exact pattern of the occurring symbol has to be known. The “One-Click” segmentation and detection approach can be used on top of the fully automated process. Templates are defined by line structure, angular relation between them and position of adjacent wall segments. The advantage of this approach is the flexibility and the adaptability to new representations. On top of that all symbols are collected in a database, thereby it is possible to build up a library of detected symbols over time. This can further be used to improve the detection algorithm. Since also the ground truth is available, it can be used in a learning process. To use symbols for detection two components had to be developed: (1) the “One-Click” method to separate a symbol and (2) an effective and reliable graph search mechanism to find related objects in the drawing.
The only user interaction required is to select just one line belonging to the object to be extracted. From there on the algorithm tries to spread towards the outer edges of a possible opening in four steps. Since the graph is structured in a way that it is easy to find neighboring edges, the tree just has to be followed in every direction within a certain search range. These nodes are extracted into a separate sub-graph. This sub-graph is searched for symmetry axes to mirror the wall sockets of arbitrary structure, similar to the pairwise search for door frames. In a next step, a connection between these two segments is added if it is not available in the graph. At the next step, all lines between the wall sockets are assigned to the opening. If these lines are not connected to each other the symbol is composed of more than one connected component and the object is rejected.
The outcome of this approach is a list of candidates (see
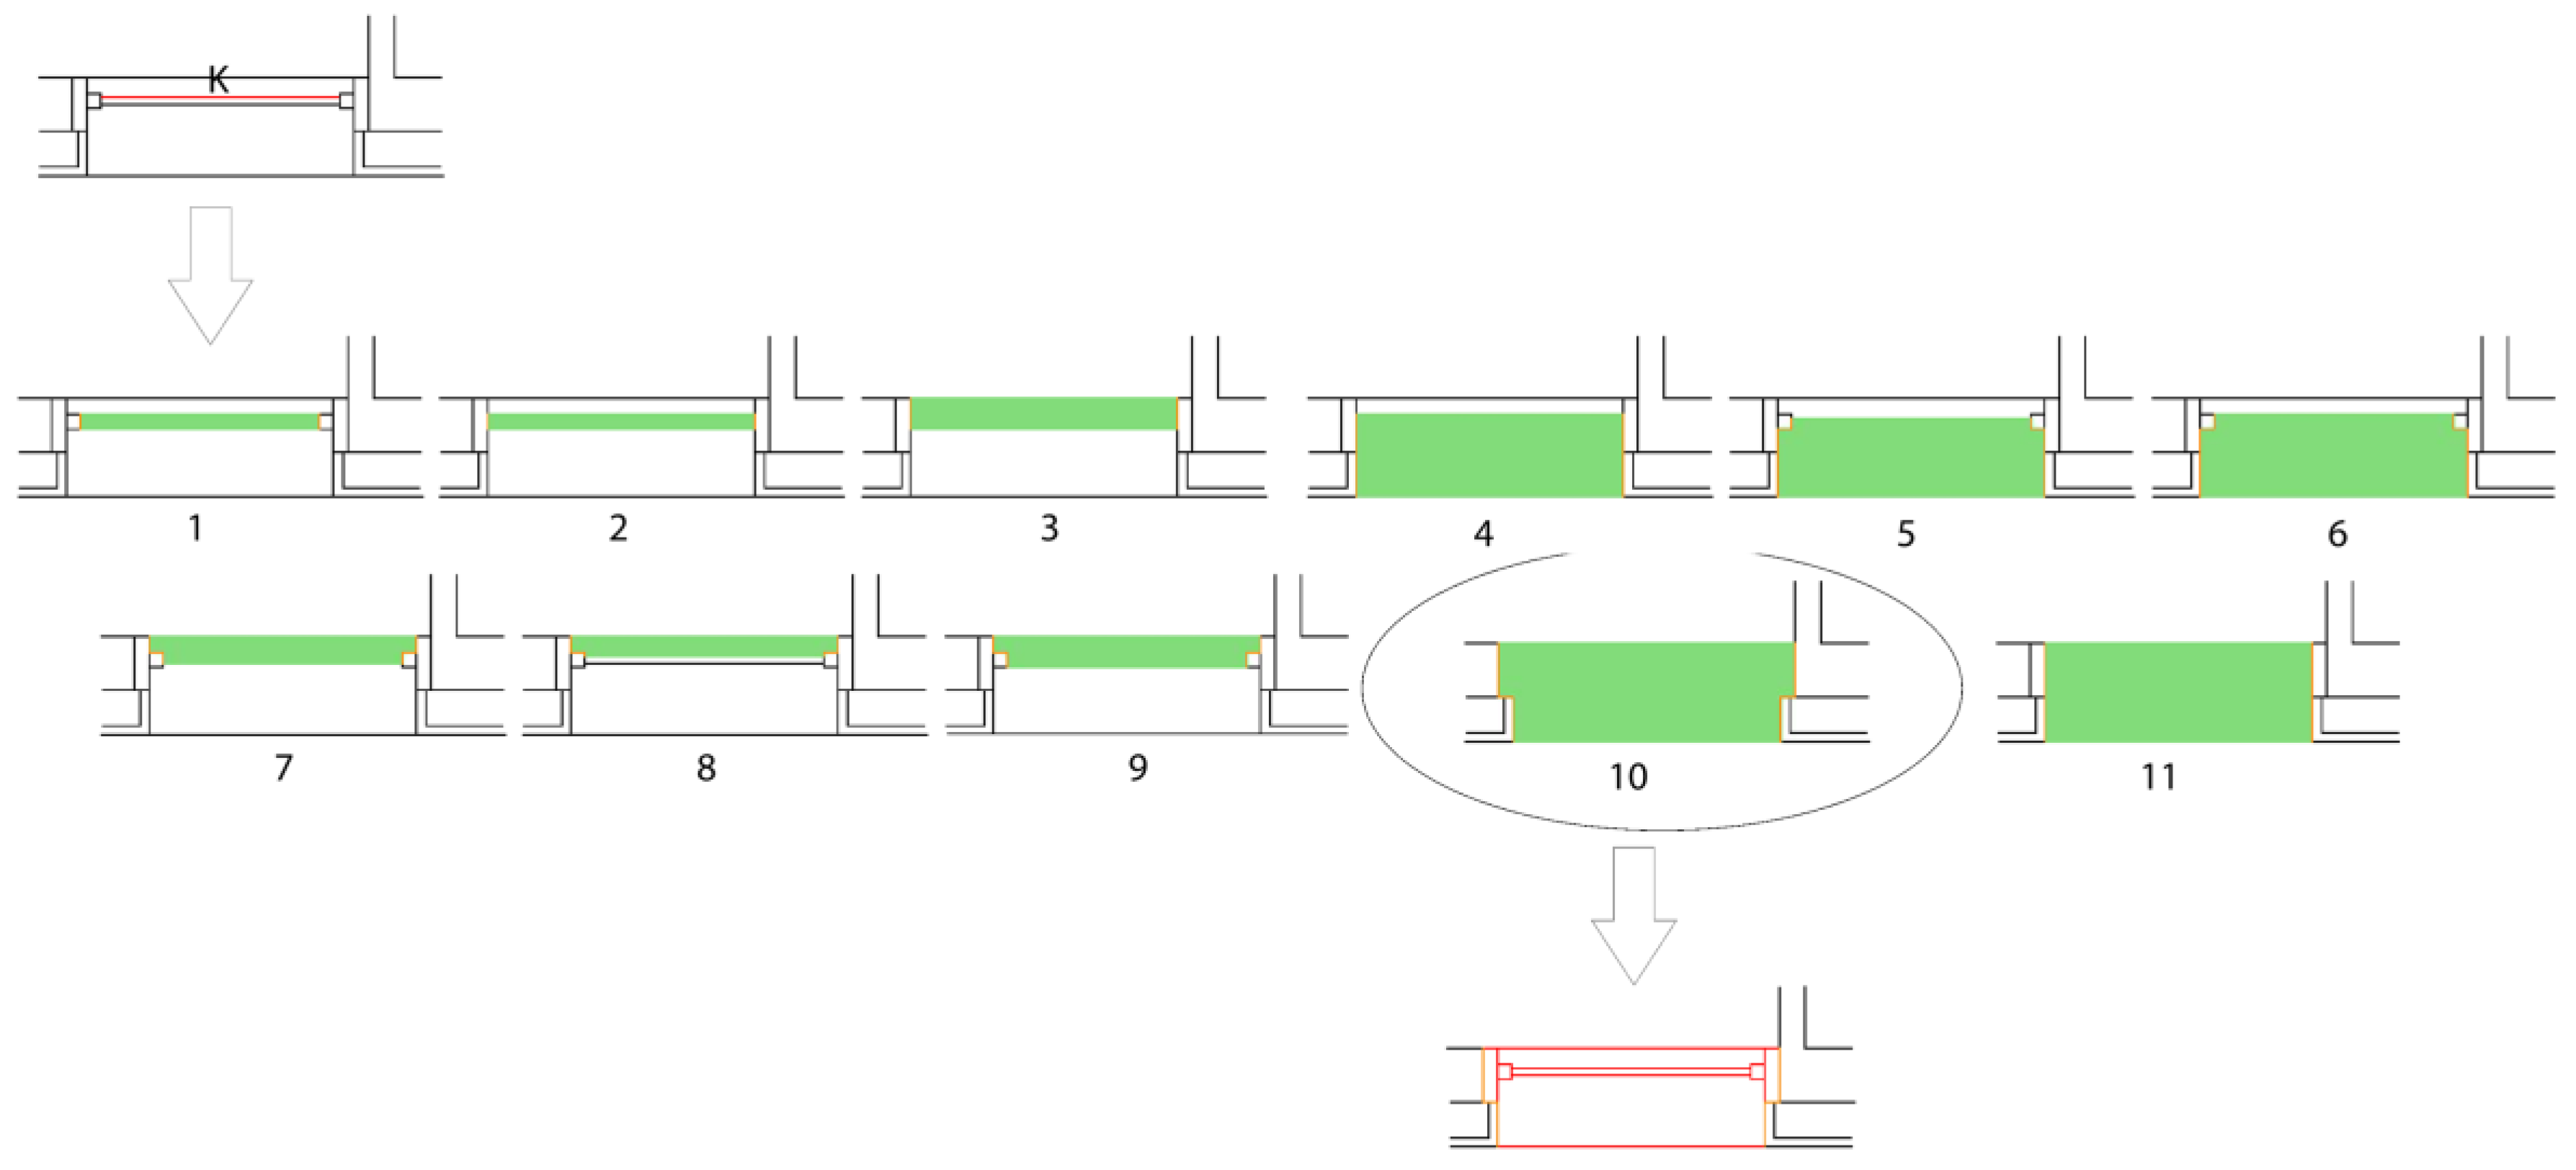
Figure 10). The number of candidates depends on the complexity and symmetry of the symbol. The last step in this approach has to analyze the search result to deliver one final symbol. The candidates are sorted according to their size, thereby searching for the biggest thickness, but shortest length. Symbol 10 in the example is therefore selected since more edges are representing the thickness of the opening and it is one of the widest elements.
Before saving the symbol, it is quickly analyzed towards the type of symbol. If one or multiple arcs or similar structures are induced the element is categorized as a door. Otherwise, the flag window will be assigned. The graph structure of the current symbol is saved in the symbol library including semantic information about the wall sockets (red). Every entry of the symbol library is added in a well-defined XML formatted database in order to collect many symbols over time.
Detecting objects of the symbol library within a floor plan is a complex and time demanding operation. The designed approach within this work is based on the concept of detecting symbols in technical drawings as presented in [
1,
4]. They focus on finding specific configurations in graphs.
On top of that, the used approach in this paper takes the symbol to find and select a starting edge, which is either an arc or the line with the most neighbors. By doing this the search area can be minimized. All candidates of that starting edge are then searched within the graph representation. Every possible edge candidate is then compared to the symbol by using a recursive depth search. The comparison considers the amount and orientation of neighbors. In order to detect different variations of the symbol, the orientation may differ to a certain predefined angle. In contrast to other approaches, the dimensions of the individual parts are not considered. This allows for a more tolerant to non-uniform scaling, which can happen due to variable wall thickness.
When talking about architectural components symbols appear mirrored in one and the same floor plan. For that reason, the search is started for the occurrence of all four possible variations.
3.1.3. Wall Detection
The main idea of the proposed approach is based on the hypothesis that every room has at least one opening. So, it should be possible to detect all wall components by following wall segments starting at an already detected opening. The main challenge when dealing with wall representation is that walls can hold information about the inner structure and can thereby be represented through multiple lines. For the application area at hand, creating a 3D surface model, the only information that is needed are the inside and the outside lines of wall elements.
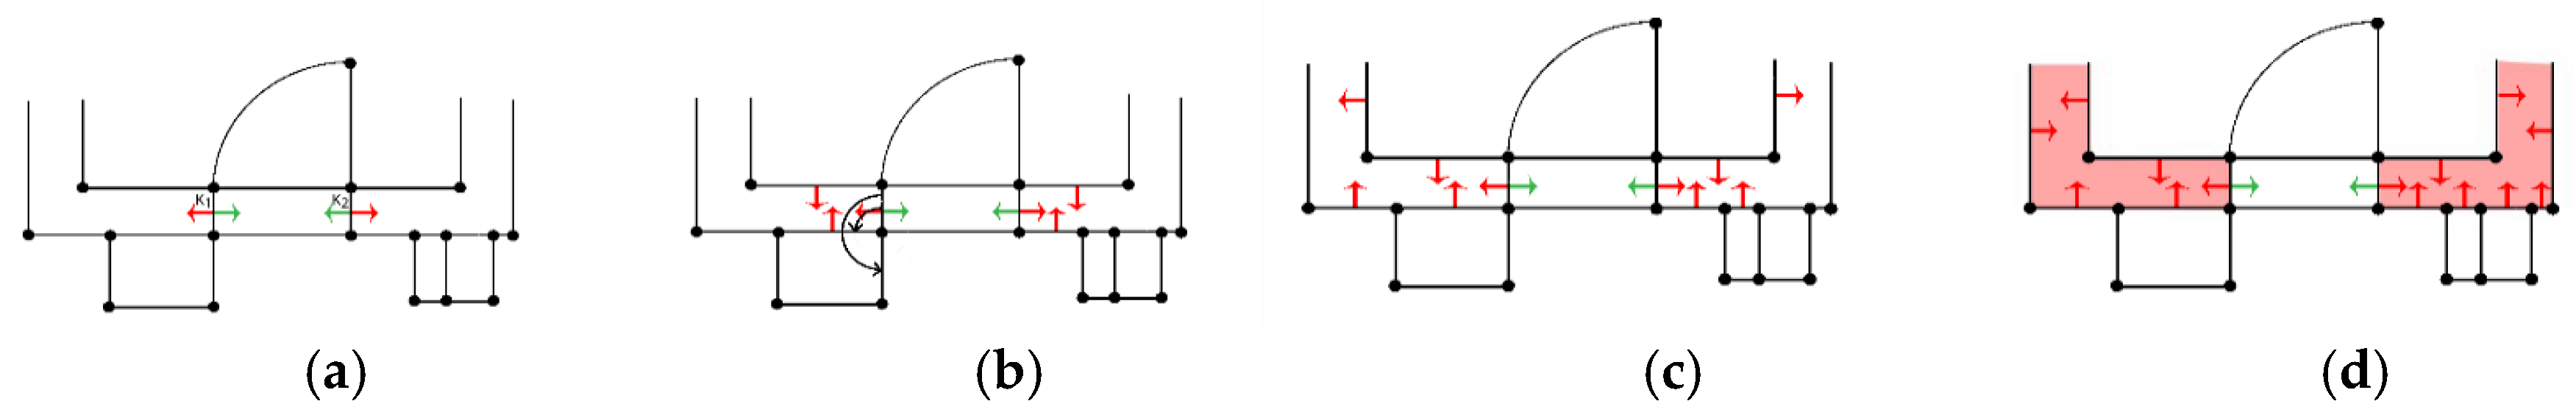
At this stage, the algorithm is already aware of components in the graph which belong to an opening. On top of that, every found opening also contains the wall socket elements and the normal vectors indicating the inside of the wall. The wall detecting approach can be compared to a fill algorithm for rasterized images (see
Figure 11). For exporting wall segments the area has to be defined as a polygon. Starting points for wall detection are the adjacent wall segments of the openings. By looking closer at the openings, the width of the wall can be defined. This allows ignoring all structural elements acquired inside the wall. The neighbors of a current wall node are searched for the edge with lowest angle difference compared to the normal vectors. This concept is repeated until a wall segment is found which has the same orientation as the starting point. The following rules were defined for completion and in order to extend the search area:
Details inside the wall are only deleted if two opposing normal vectors can be assigned
If no further neighbor is available, the last node will be searched for another edge
If the search meets another wall polygon, the information is combined. As
Figure 11 shows, elements which are directly connected to the wall, such as the interior, are automatically ignored.
3.1.4. Room Detection
For creating a virtual experience in the area of real estate it is necessary to have access to the individual room structures of the building. Later in the process the room area detection allows a better texturing by dividing mesh structures according to the room structure as well as for distinguishing the inside from the surface of the facade. Furthermore, it can be used for analyzing the room types or for just having a colliding object when exploring the environment in VR.
At this point wall structures as well as openings in the walls are known in position and size. This information forms the basis for detecting rooms and defining room polygons.
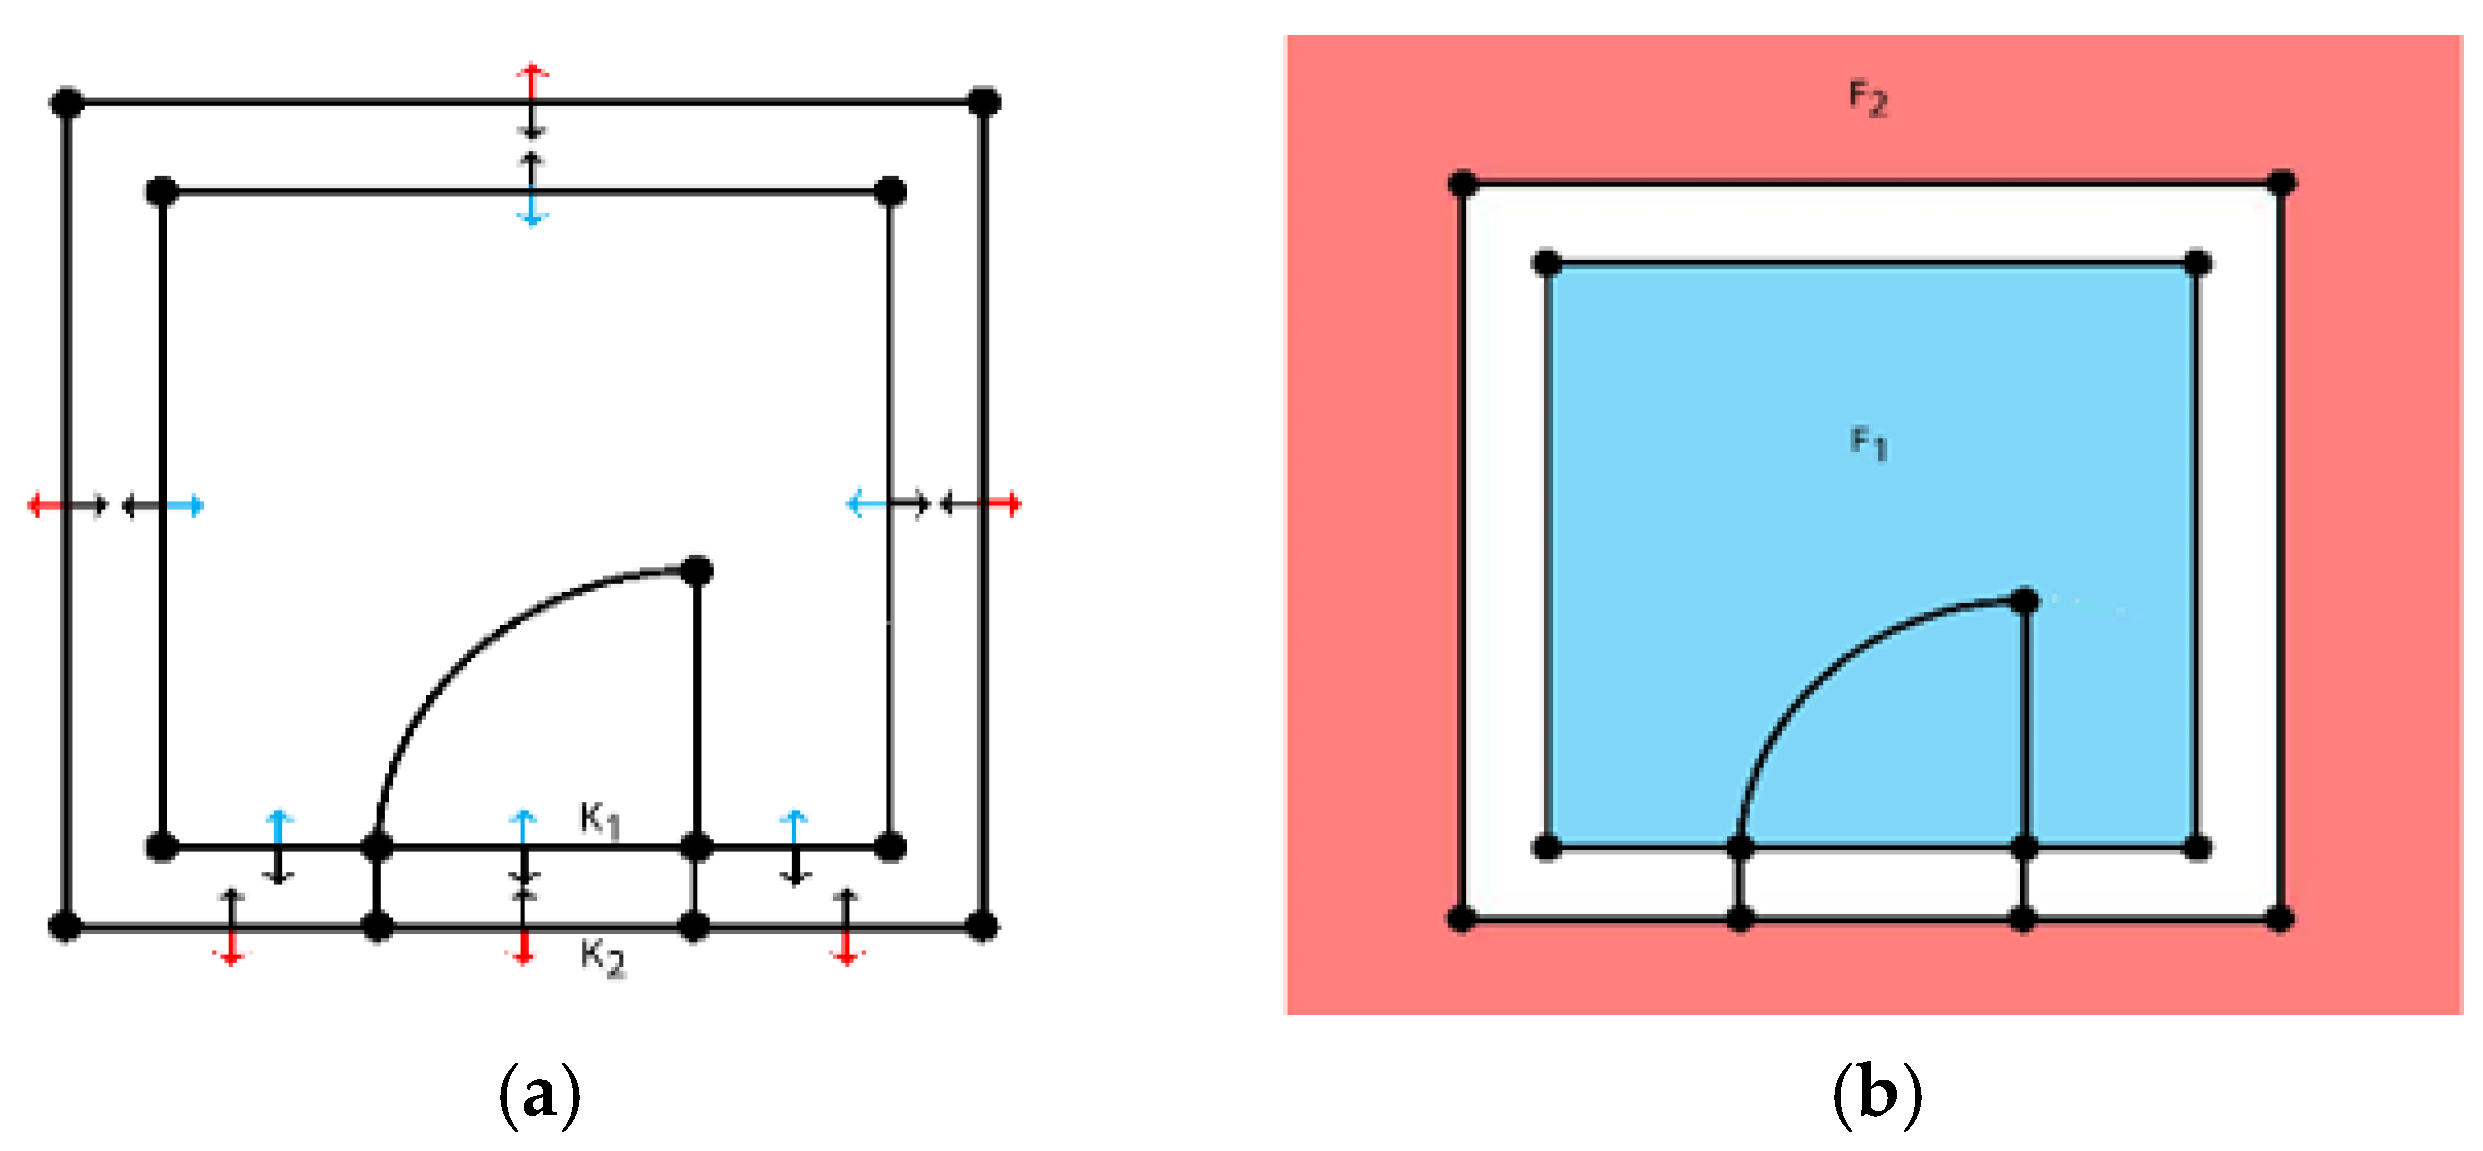
Figure 12a illustrates the detection of room polygons and the contour of the building. Since every room has to be accessible it also has to have a door or window. For that reason, the room detection process starts at a door element K1and K2. The inverted normal vector is used to follow the inside direction of the room. By following the edges clockwise until K1 is reached again a polygon can be defined.
The detected area can be on the inside or on the outside. In one case a conventional room is found. The other case describes either the outer shell of the building or a situation where a room is located inside a room. To distinguish the two cases, the angular differences between the neighboring edges are observed. In the case F1 in
Figure 12b the normal vectors looking to the inside are taken for the calculation. Taking an arbitrary but close point in direction of the normal vector it is possible to test if the point is inside or outside the polygon. This is done by using the approach of Shimrat et al. [
22]. If the point is inside the polygon a room is detected otherwise the outer shell of the floor plan is found. All edges passed on the way are marked and assigned to the room area. In addition to that also the openings can now be assigned to the correct room.
Starting from the contour of the building, which consists only of walls the detection of balconies or terraces directly connected to the outer wall can be done. Following the lines on the outside of the shell, it can be detected if it starts and ends at the outer shell. The spanning area is calculated. On top of that, the algorithm searches for a door in this area, which is necessary to access the balcony. By comparing different resulting areas in size and position the correct part is selected which is connected to a door.
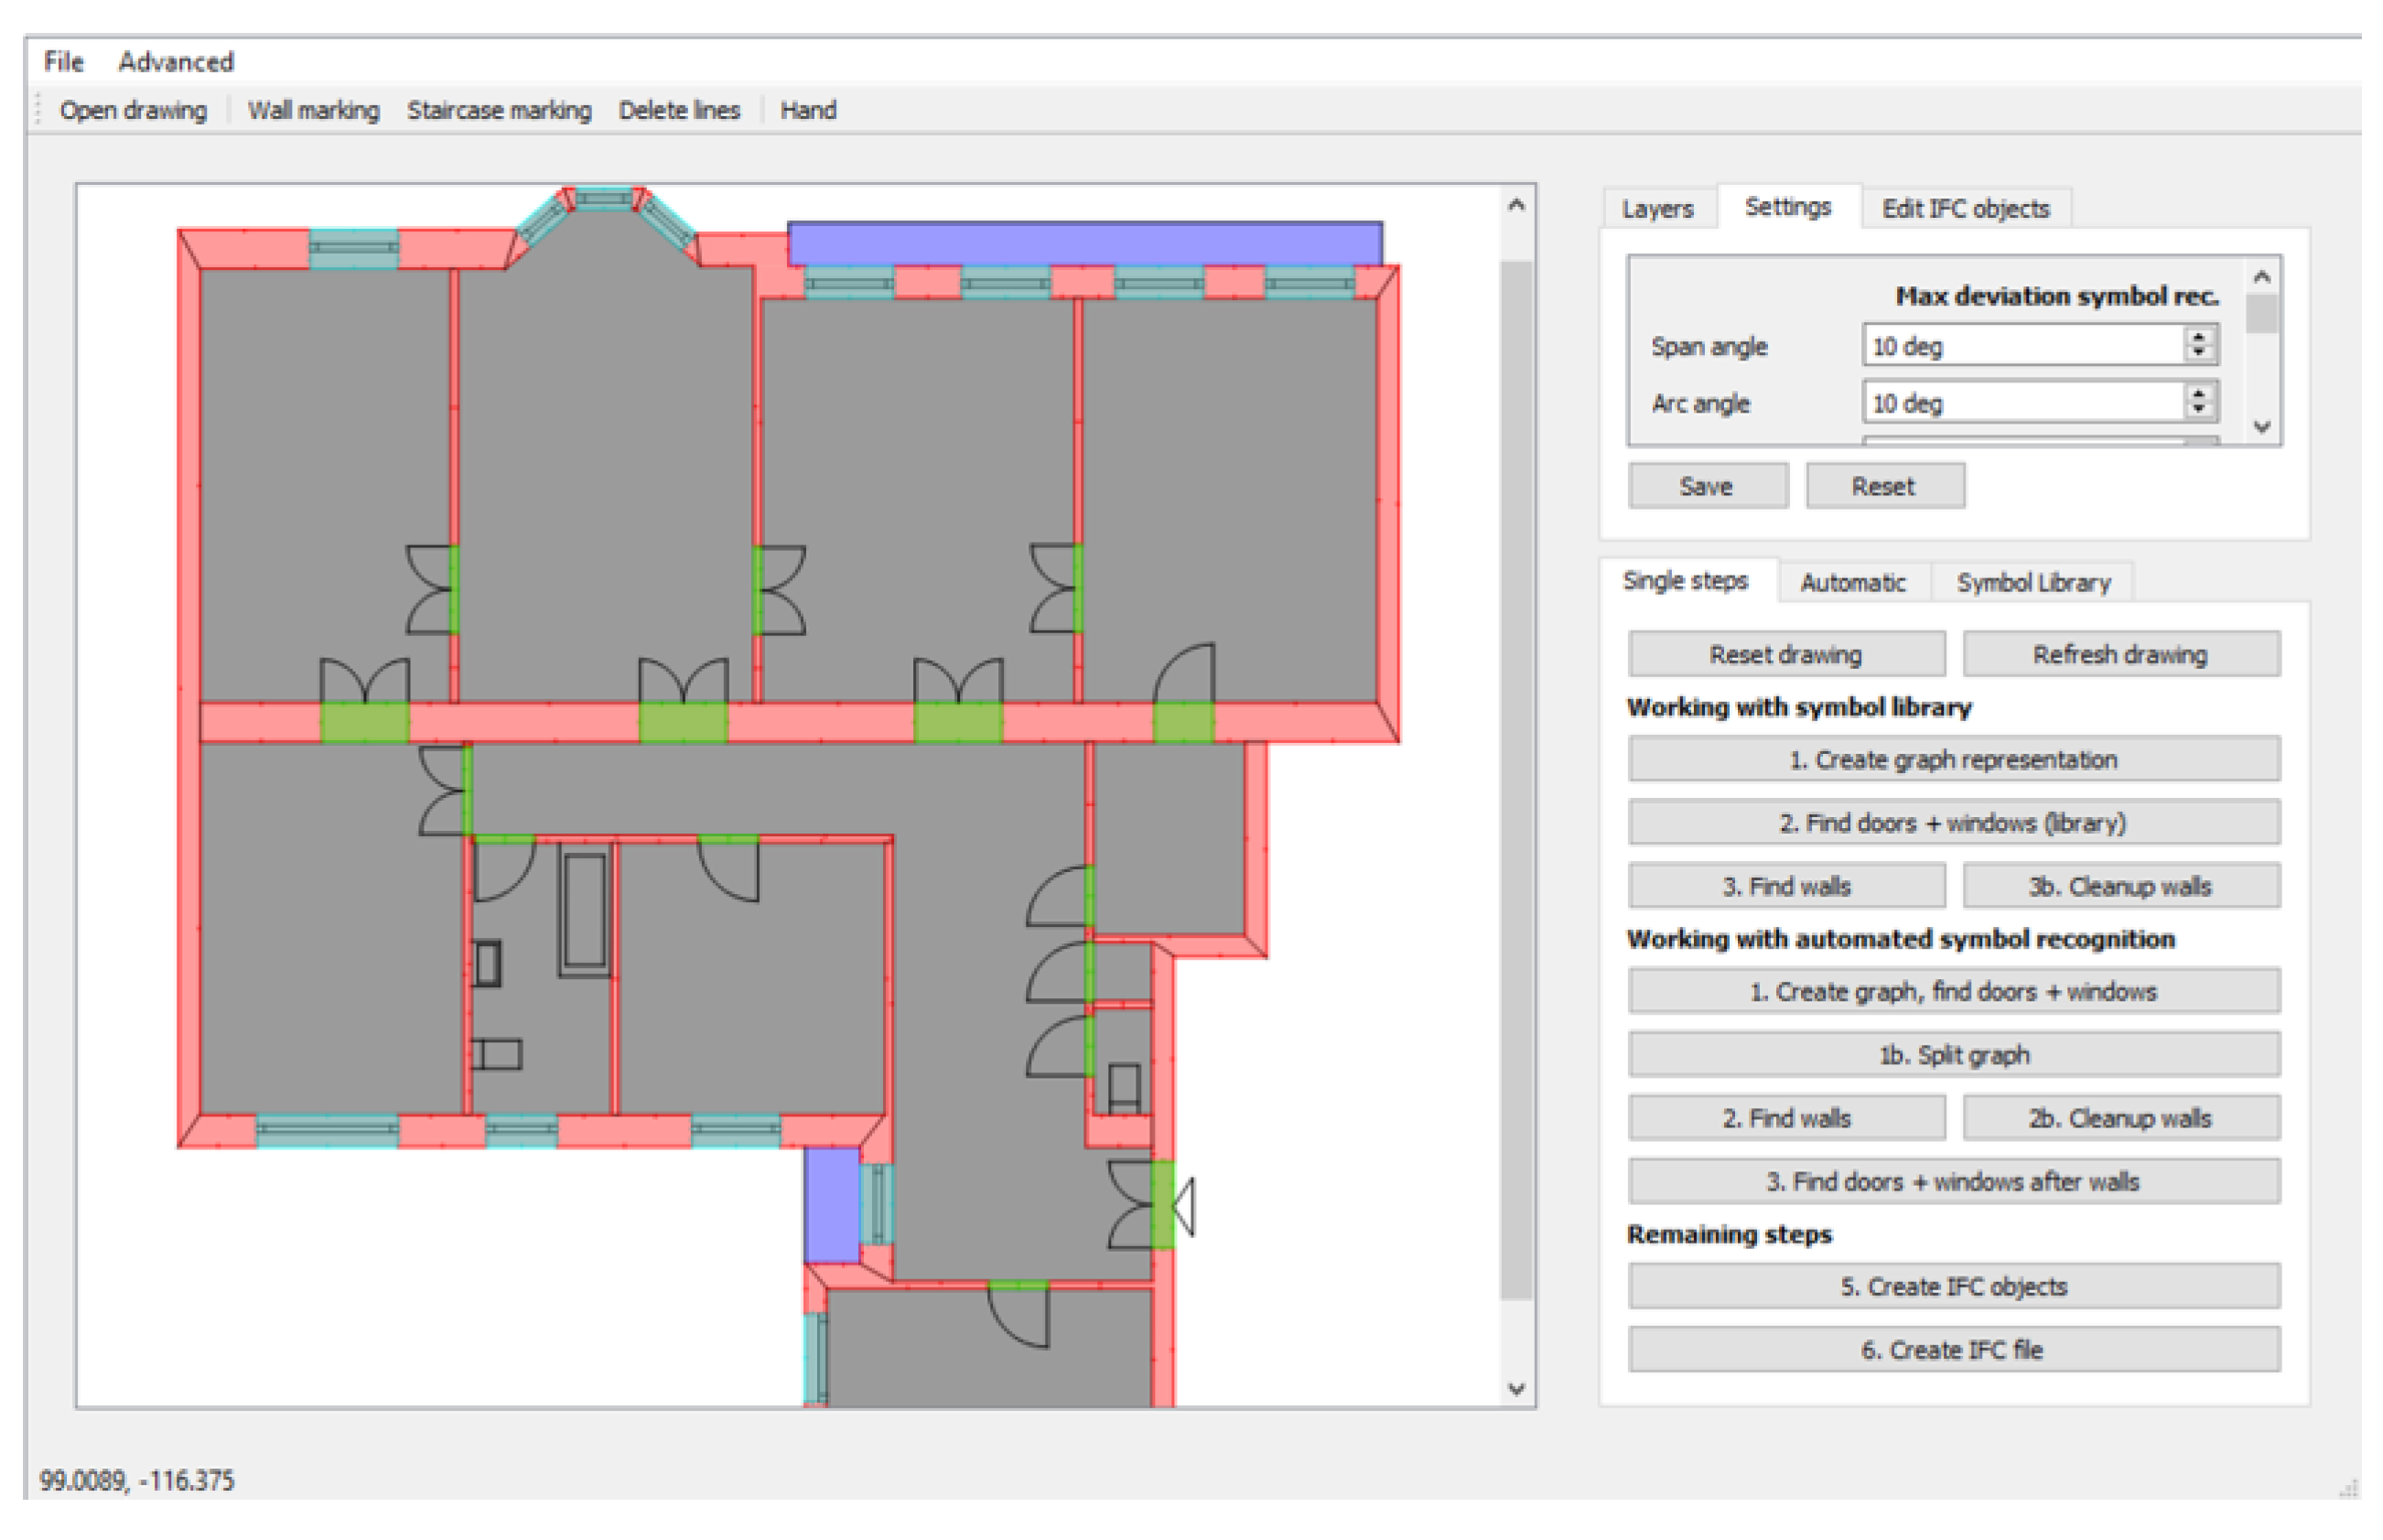
3.1.5. Interface
A graphical user interface (see
Figure 13) allows for importing floor plans, for evaluating the results and for user intervention. In addition to that, the user is able to supervise and correct mistakes if necessary before exporting everything into the Industry Foundation Classes (IFC) data model. IFC is a platform-neutral and open file format specification to describe building and construction industry data. In our approach we only use a small subset of available IFC types. Every detected component of the previously described elements is converted to the appropriate IFC standard format. The following elements are used for exporting: IfcWall, IfcWindow, IfcDoor, IfcSpace, and IfcSlab. This is the first step where 3D information is created and could already be interpreted as a 3D model with an appropriate application. However, to use this with interactive VR it has to be further processed.
3.2. VR Apartment Generation
The IFC file provides the 3D structure of components and can be read with any application which is able to interpret IFC files. In contrast to these applications, the here developed IFC interpreter is based on the IFC Engine Library and extended by requirements for an automated construction of a virtual reality experience within the Unreal Engine. These VR requirements are very specific and are to our best knowledge not supported by other IFC viewers. For creating a successful VR experience, the following requirements have to be met and are described in this
Section 3.2. At first a realistic representation of an apartment has to be produced, in order to support potential customers in their buying decision. To achieve this goal, the application has to run on desktop environments as well as mobile devices. Furthermore, the 3D model has to be prepared for texturing and interaction. Because of this the produced mesh has to be separated into individual wall segments thereby defining [u,v] coordinates for a correct texture mapping. To assign appropriate textures a room type estimation heuristic was developed.
3.2.1. 3D Model Generation
The generation of the 3D model is implemented with the Unreal game engine and running in the editor mode. This means that the model can already be computed, displayed and manipulated before the VR application is built. As a representation of each mesh the procedural mesh component is used which was still an experimental plugin for Unreal at that time.
At this point, the IFC file contains the high-level geometry of the floor plan. The result of the floor plan interpreter module can be read into the Unreal engine with the help of the IFC Engine library. A direct integration with the game engine is not possible since the IFC file only holds corner points of elements, but not triangulated mesh data. The IFC representation containing the base profile (polygon) and the height has to be converted to triangle arrays. This is done for every IFC object containing a geometry definition. This conversion does not consider the further use of an immersive and realistic representation of the model. The first result of this step is a collection of mesh elements mostly clustered by rooms. The ceiling and the floor consist of one global representation each.
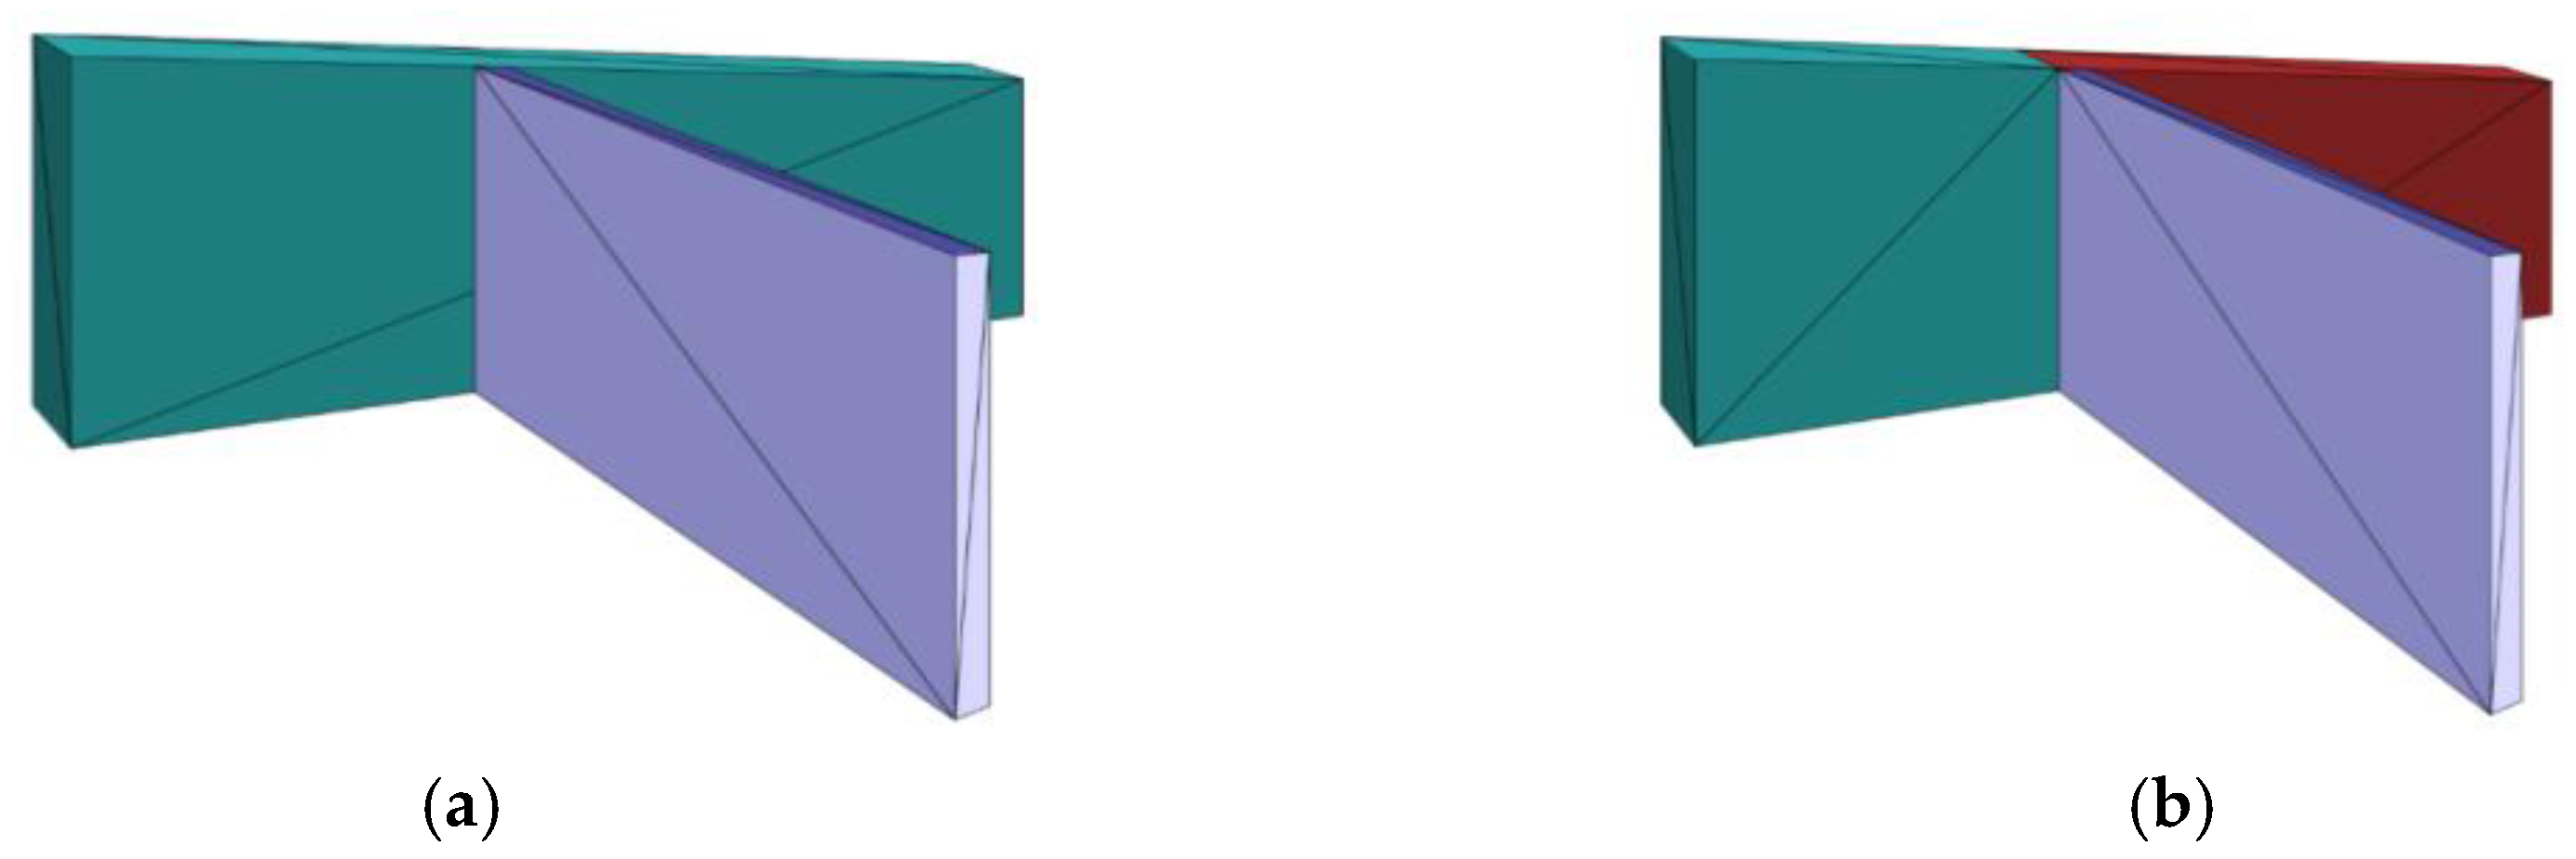
On top of the mesh generation, a semantic mesh segmentation algorithm was implemented to achieve a finer granularity of meshes. First, for a realistic dynamic lighting, it is important to keep the meshes waterproof so no light from the other side of the mesh is leaking along the edges. Besides the number of triangles should be kept low, the surfaces belonging to a room should be separated in order to allow different texture styles in one room. An example of a mesh belonging to multiple rooms can be seen in
Figure 14a. Two walls connected to each other have to be subdivided according to the adjacent IFC space which is describing the volume of a room. To achieve this, every space is clipped against the meshes of the walls. Thereby overlapping wall segments are assigned to the current room (see
Figure 14b). This is done for every room and every mesh belonging either to a wall, the ceiling or the floor. It also allows to separate walls belonging to several rooms. At this point, every wall surface can be selected individually after adding a collider component.
The IFC file does not contain any information about texture coordinates. This has to be considered in a next automated step. In order to achieve a high visual quality, it is necessary to realize automated surface unwrapping. Thereby each mesh is divided into coplanar sub-surfaces. Each of the resulting surfaces is projected on a unit square and for every vertex, a pair of (u,v) texture coordinates between [0,1] is assigned. The longer side of the mesh is aligned with the u-vector. To achieve a realistic look especially if tiles or a wooden floor is used a global scaling factor is multiplied. One unit in texture space represents one meter in real scale.
3.2.2. Room Type Estimation
In the process of preparing the 3D model for exploration, rooms should also be textured in an appropriate style. To achieve this, it is beneficial to know the type of the rooms of the floor plan. This information can also help the user when working with furniture pieces since the system can present a manageable subset of furniture models according to the current room type. Extracting the room types directly from the floor plan can only be done if the appropriate text is available. Most of the floor plans however do not mention the room type or use non-standard abbreviations. For that reason, this auxiliary tool to estimation room types according to a heuristic was implemented.
It is necessary to analyze the floor plan in relation to available apartments before the room types can be estimated. In order to subdivide the floor plan into individual apartments, the rooms and the connections between them are transferred to an unweighted graph. The rooms form the nodes and door openings are the edges. At the same time, the distance between rooms is calculated by the magnitude of number of doors in between. This is stored in a distance matrix. In the first step shared spaces, not belonging to an apartment, such as a staircase, is searched for. So, a room is selected which has the lowest connection sum to all other rooms. In a next step, all combinations of apartments are clustered due to three rules. (1) An apartment has just one entrance to a shared space, but not leading to the outside. (2) At least two rooms are assigned to one apartment, whereas also smaller rooms are counted. (3) Finally, a minimum value of the overall living space is defined.
In a filtering step, all combinations of disjunct apartment structures are selected and are now possible solutions which have to be ranked. To achieve this, a grading system awards better combinations. If a shared space exists, which can be accessed by all apartments, this combination gets a higher value, in contrast to other combinations having rooms that could not be assigned to an apartment. Due to the ranking, the algorithm takes the top result for further processing. Within the interface the user is presented with multiple solutions and can select the most preferable one.
Since at this point an apartment configuration has been selected, it is now possible to estimate the type of rooms. For this detection process, the following room types are considered: toilet, bathroom, living room, bedroom, kitchen, dining room, and storage room. Since many buildings have rooms with multiple purposes the here presented approach is able to assign multiple roles to one room. As a minimum configuration in every apartment, there should be space for a toilet, bathroom, kitchen, dining room, bedroom, and a living room. Whereas the dining room, hallway, and kitchen are only assigned once. These six types are the first ones distributed over all available rooms. To assign the most plausible type for every room a plausibility value for every available type is calculated according to well-defined factors.
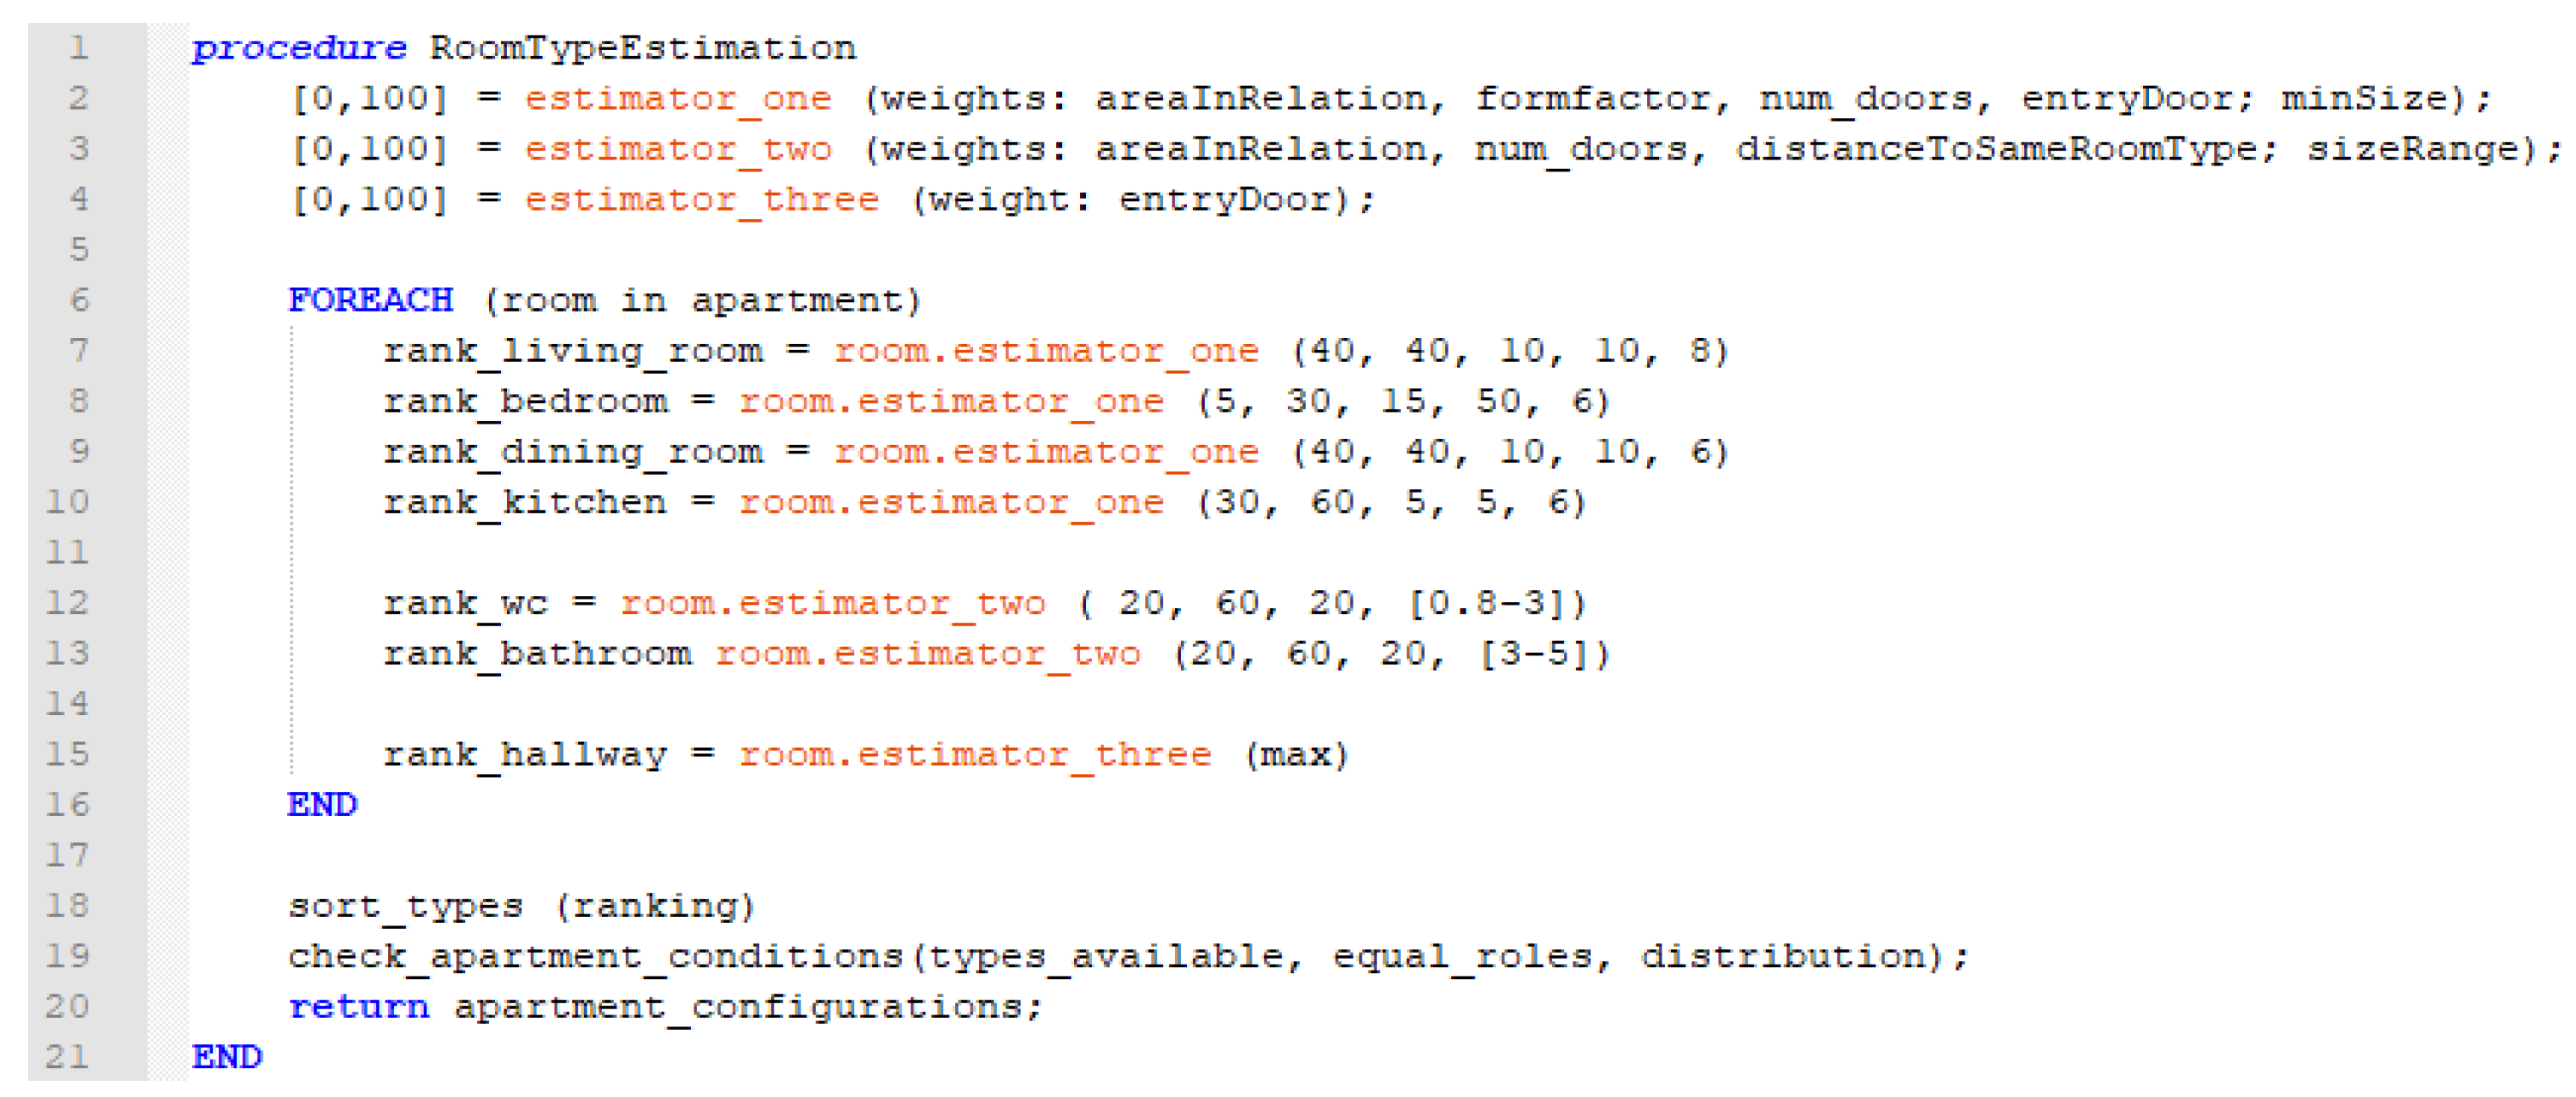
Figure 15 shows the concept of the room type estimation algorithm. Three basic estimators are used to classify the room types. The estimators are configured with different weights according to the currently tested room type.
The first factor is related to the size of the room. On the one hand, a normalized value in relation to the size of the largest room and the apartment is used (areaInRelation). On the other hand, the real size is used to define a lower and upper limit for specific room types (sizeRange). Another important factor is the connection possibilities to other rooms (num_doors). A toilet or a bathroom is restricted to one door only in the first assigning round. The factor of a number of doors is less considered when dealing with rooms with less privacy such as kitchen, dining room or living room. Rooms with high privacy are also checked if a door leads to the outside or a shared space with other apartments (entryDoor).
The concavity factor usually helps in combination with the number of doors to define a potential hallway (form_factor), which is calculated as the relation between the size and the convex hull of the room. Hallways are more likely to be more complex than other rooms. Size is not a relevant value since hallways can be the largest rooms or might not even exist. Bathroom or toilets are never assigned to the largest room and the plausibility of being a bedroom is also lower. After every room is checked with every possible room type a ranking is generated according to the plausibility value. Finally, the global apartment configuration is examined according to equal roles, necessary roles and distribution. The user is getting a list of the most possible configurations. If no interaction is done the first result is used.
3.3. VR Experience
To prepare a model for exploration the automatic texturing according to the results of the room estimation heuristic is the next step. Especially correctly textured surfaces are important for immersion since they support the sense of scale and the sense of orientation. This
Section 3.3 also describes the assignment of 3D models of openings and the placement of light sources. Finally, an interaction technique for locomotion in VR and interaction with textures and furniture is also required in order to be able to evaluate the additional benefit when searching for apartments.
3.3.1. Finalizing the Model
At this point in the process, the algorithm can already provide a true to scale 3D model of the apartment with subdivided meshes prepared for texturing. Furthermore, every room is assigned to a specific set of room types. Presenting the current stage to a customer is however not recommended. Without lights in the environment and by not having realistic texturing, users would find it hard to rely on their sense of scale and orientation within the VR environment. Furthermore, openings should also be filled with appropriate models.
In order to finalize the 3D model for VR presentation, meshes of windows and doors are added. The IFC file provides, therefore, the “IFCOpening“ entities with the correct parameters. For placing these models especially with door openings, it was necessary to extend the door openings to the side and to the top since the door frame is usually thicker than the opening itself.
To increase the visual quality in the experience lightning is an important factor. By putting light sources in every room according to the room structure, it is possible with the Unreal game engine to have dynamic shadows which enhances the realism. The position of the light is dependent on the geometry of the room. Every room polygon is checked if it is a convex or concave. In rooms with a convex area, a single light source is added at the center of masses at the ceiling. Rooms, which are bigger than a certain threshold (20 m2) will get another light source by dividing the room in two equal areas. Non-convex rooms, on the other hand, will be split into concave elements. Every element bigger than 10 m² is fitted with a light source again at the center of mass. Light sources consist of a 3D mesh of a flat ceiling lamp and a dynamic point light source strong enough to illuminate the room.
Finally, textures are automatically assigned to wall elements according to the room type. Humid rooms such as bathrooms are usually fit with tiles and all other rooms with wooden floor and a single color for every wall. This concludes the automated phase for the visual creation of the apartment. At this point, a designer could still influence the appearance of the 3D model within the Unreal Editor and the additionally implemented interface. This allows for changing room types, textures, adding furniture or changing the light situation before exporting the environment as a VR application.
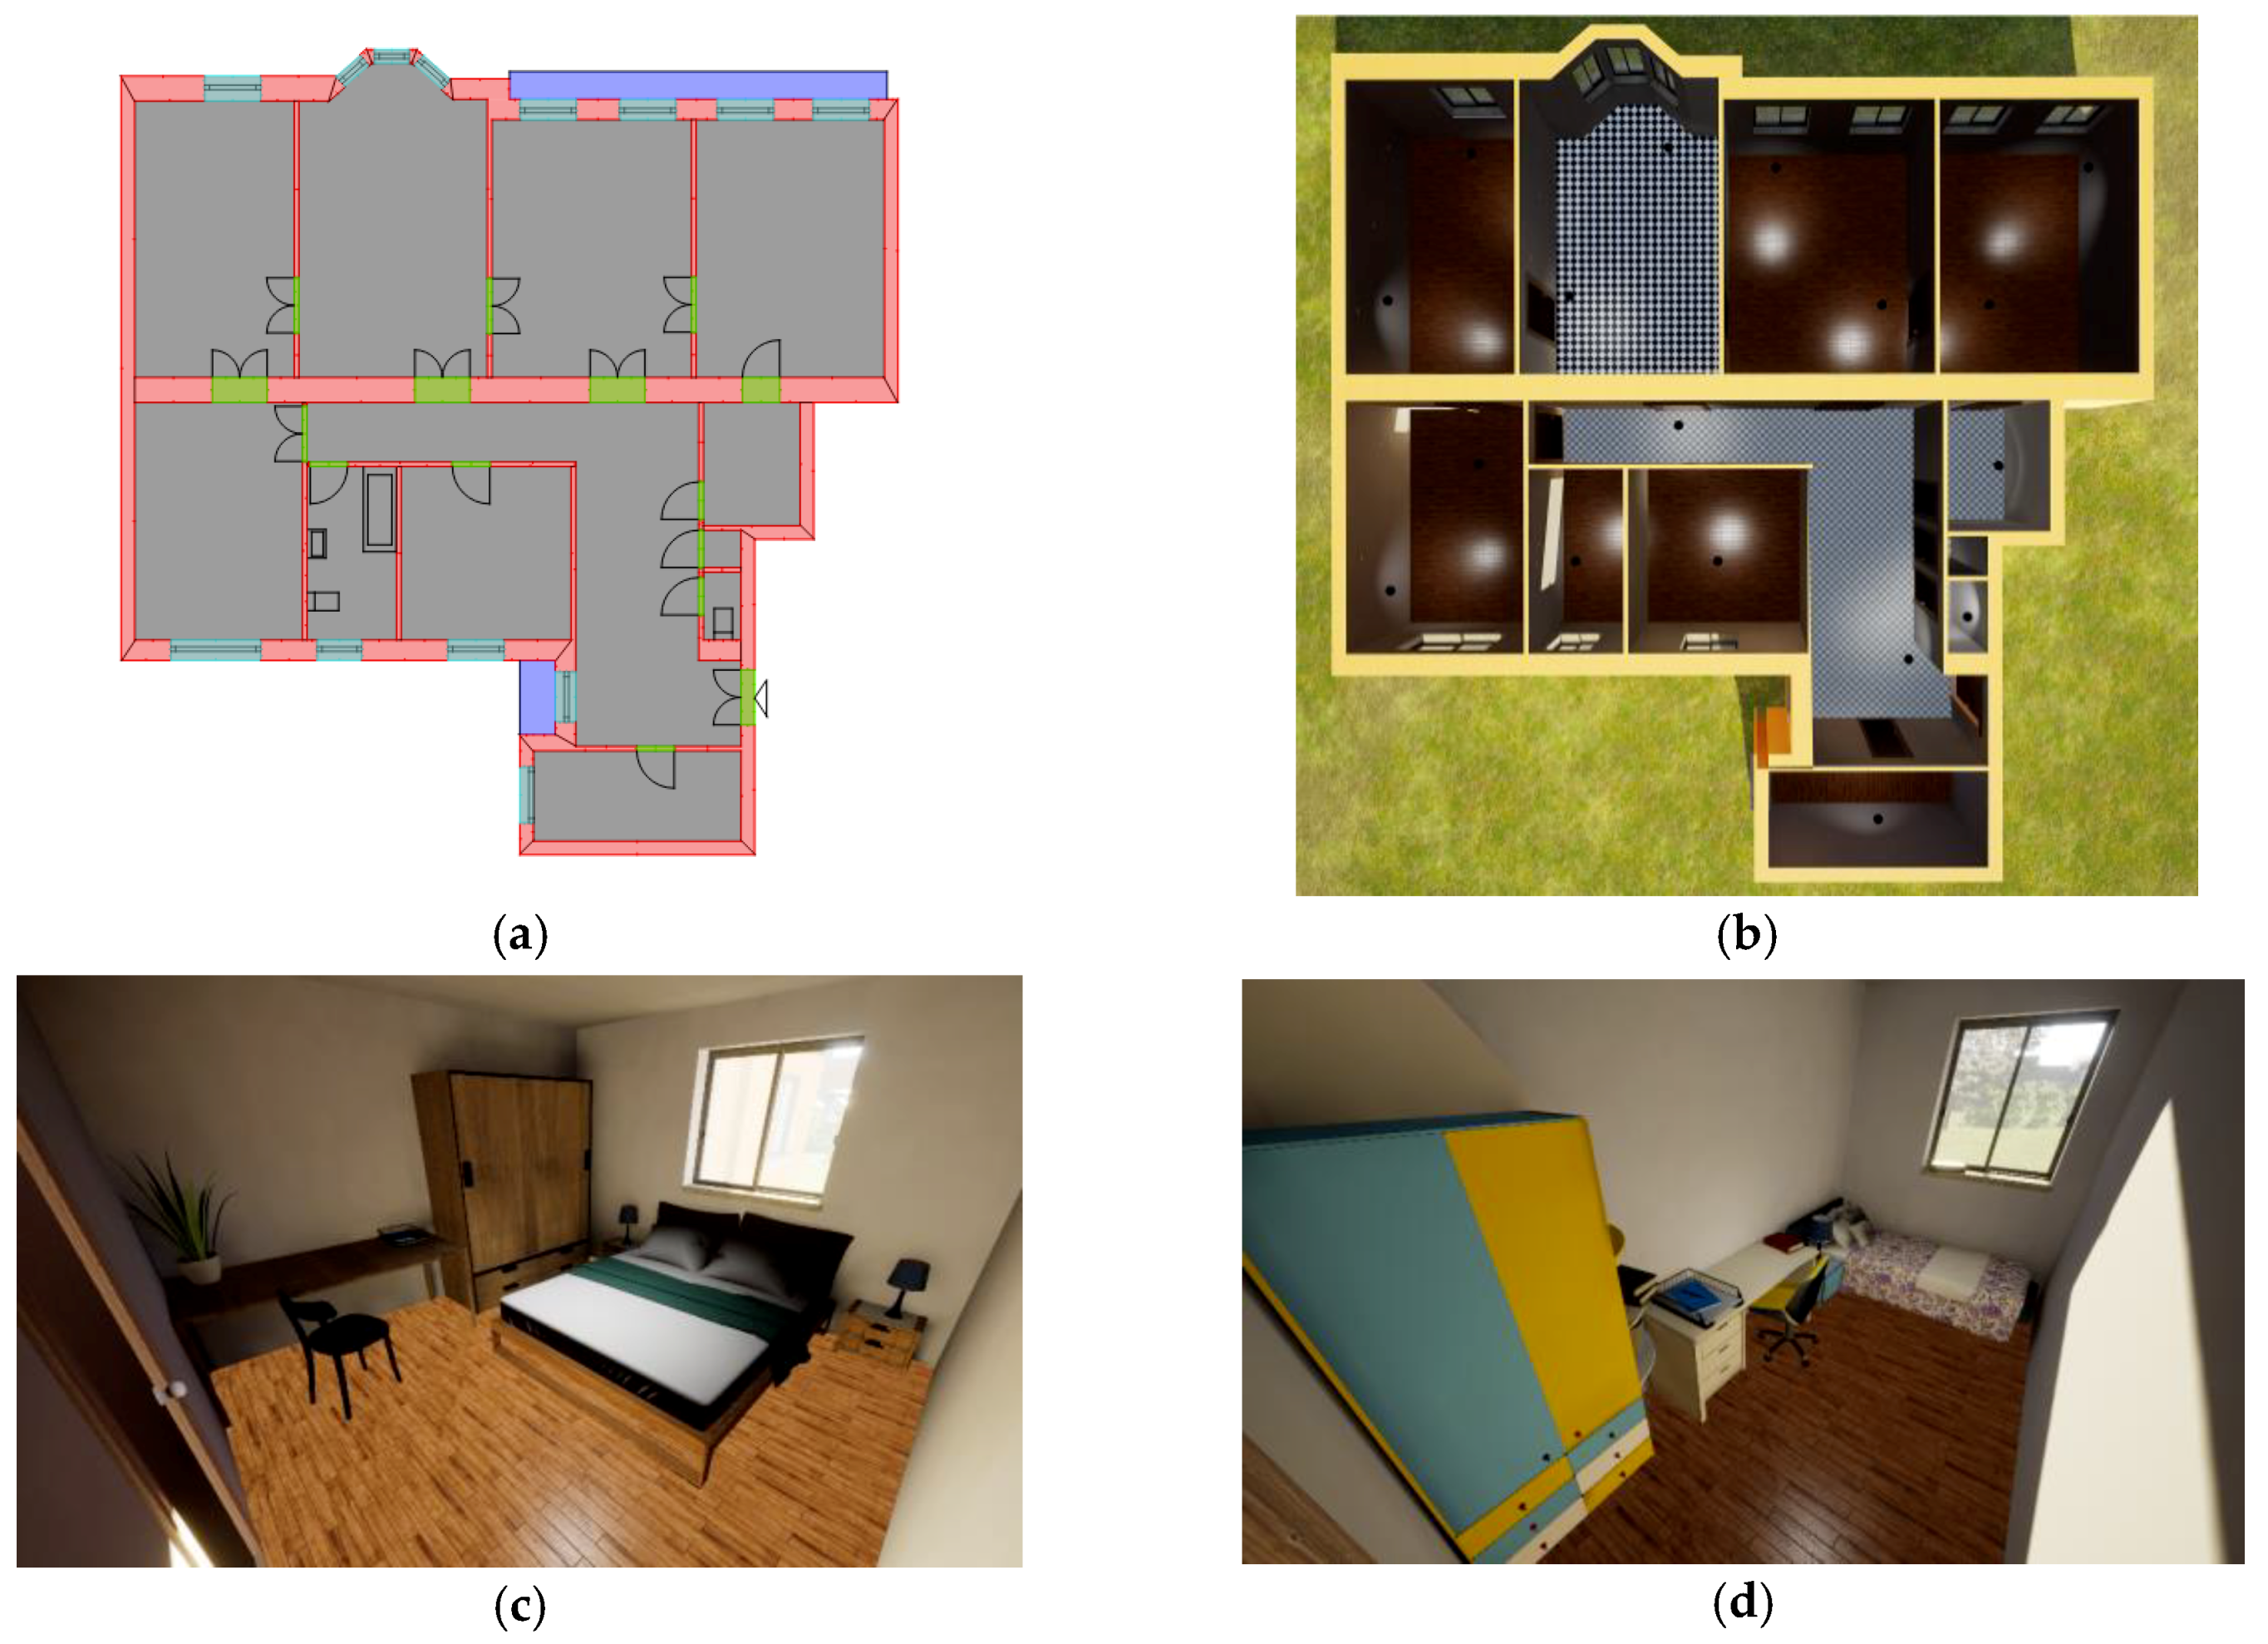
Figure 16 shows the different stages of the reconstructed environment. As an optional step the created 3D model can then be furnished automatically using a greedy cost optimization. This implementation by Kan et al. [
23] works well together on top of our automated model creation method.
3.3.2. Interaction
Another main goal of the presented approach is the possibility of exploring the indoor environment with the help of a VR headset. To be able to navigate through the environment and to provide an interaction possibility an appropriate interaction metaphor needs to be designed. This interaction has to provide the possibility to allow the selection and manipulation of furniture pieces and surface textures. Furthermore, an appropriate locomotion metaphor has to be available. For the application at hand two tracked controllers, the Oculus Touch were used.
The user is tracked in an area of about four by four meters with the Oculus Rift setup. This represents the direct interaction room for the user. In order to reach points beyond this space in VR, the left controller is used for the standard teleportation method provided by the VR template of the Unreal engine to teleport to an arbitrary point in the line of sight of the user. The right controller represents the interaction device. It is virtually surrounded by small but recognizable 3D items (
Figure 17a,b). These items are hovering in a circle following the position of the controller. The user can select the desired object in the menu by rotating the controller around the lateral axis. The freedom of motion of the user’s wrist, which is about 180° is subdivided by the number of currently used items in the menu. Selected objects in the menu are highlighted by a yellow contour. The user can enter a submenu by clicking a button on the controller. To go back the most left item in the list has to be selected. All submenus are grouped to individual topics: textures (tiles, colors, wood, …) or furniture (chairs, tables, beds, …). In the first hierarchy, the user can decide between changing textures and working with furniture. In order to be able to handle a big database of furniture, the user gets only those items presented which fit the current room type. If for example, the user is currently standing in a bedroom all 3D models belonging to the kitchen are not shown in the menu. Placing furniture or selecting a wall for changing the texture is based on a ray-cast. The user can point with the controller, which is shooting a ray into the scene, to an object which gets highlighted if any interaction can be performed with the object. When confirming with a button the object (chair) is bound to the collision point of the ray-cast and the floor thereby fixating roll and elevation. For a better control of furniture, the same rotation as used in the menu is applied and amplified to the azimuth of the currently selected furniture.
4. Results
To assess the implemented features (see
Table 2) and the generated 3D model of an interactive VR apartment, two evaluation methods were chosen. At first, a technical evaluation was performed in order to show the accuracy of the detection process and the degree of automation. Performing an appropriate evaluation is a non-trivial task due to the complexity of different floor plans. This can also be seen in other publications of this area since they omit evaluation [
2,
6,
10,
24,
25]. The finally constructed environment was tested with users, put into a situation of buying or renting the real estate object. The main goal was to evaluate if the system helps in their decision-making process.
4.1. Technical Evaluation
In order to evaluate the accuracy of the detection process of architectural components, the authors decided to ask professionals for architectural floor plans. Because of copyright issues and intellectual property, it is hard to get floor plans for evaluation and publication purposes. For that reason, the authors asked three professionals to draw floor plans of apartments. In order to have a variety of architectural elements, these people were asked to draw apartments of usual size. Windows and doors should have different appearances. In addition to that, every room had to contain design elements such as furniture. There were no other restrictions, not even the choice of the application was dictated. The reason why three floor plans per person were requested was, on the one hand, to limit the effort for drawing and on the other hand the fact that one floor plan contains multiple elements to analyze. In the dataset given by the professionals over 180 openings and between 200 and 300 individual wall elements were contained. No floor plan that was used for designing the algorithm was used to evaluate the method in order not to bias the results.
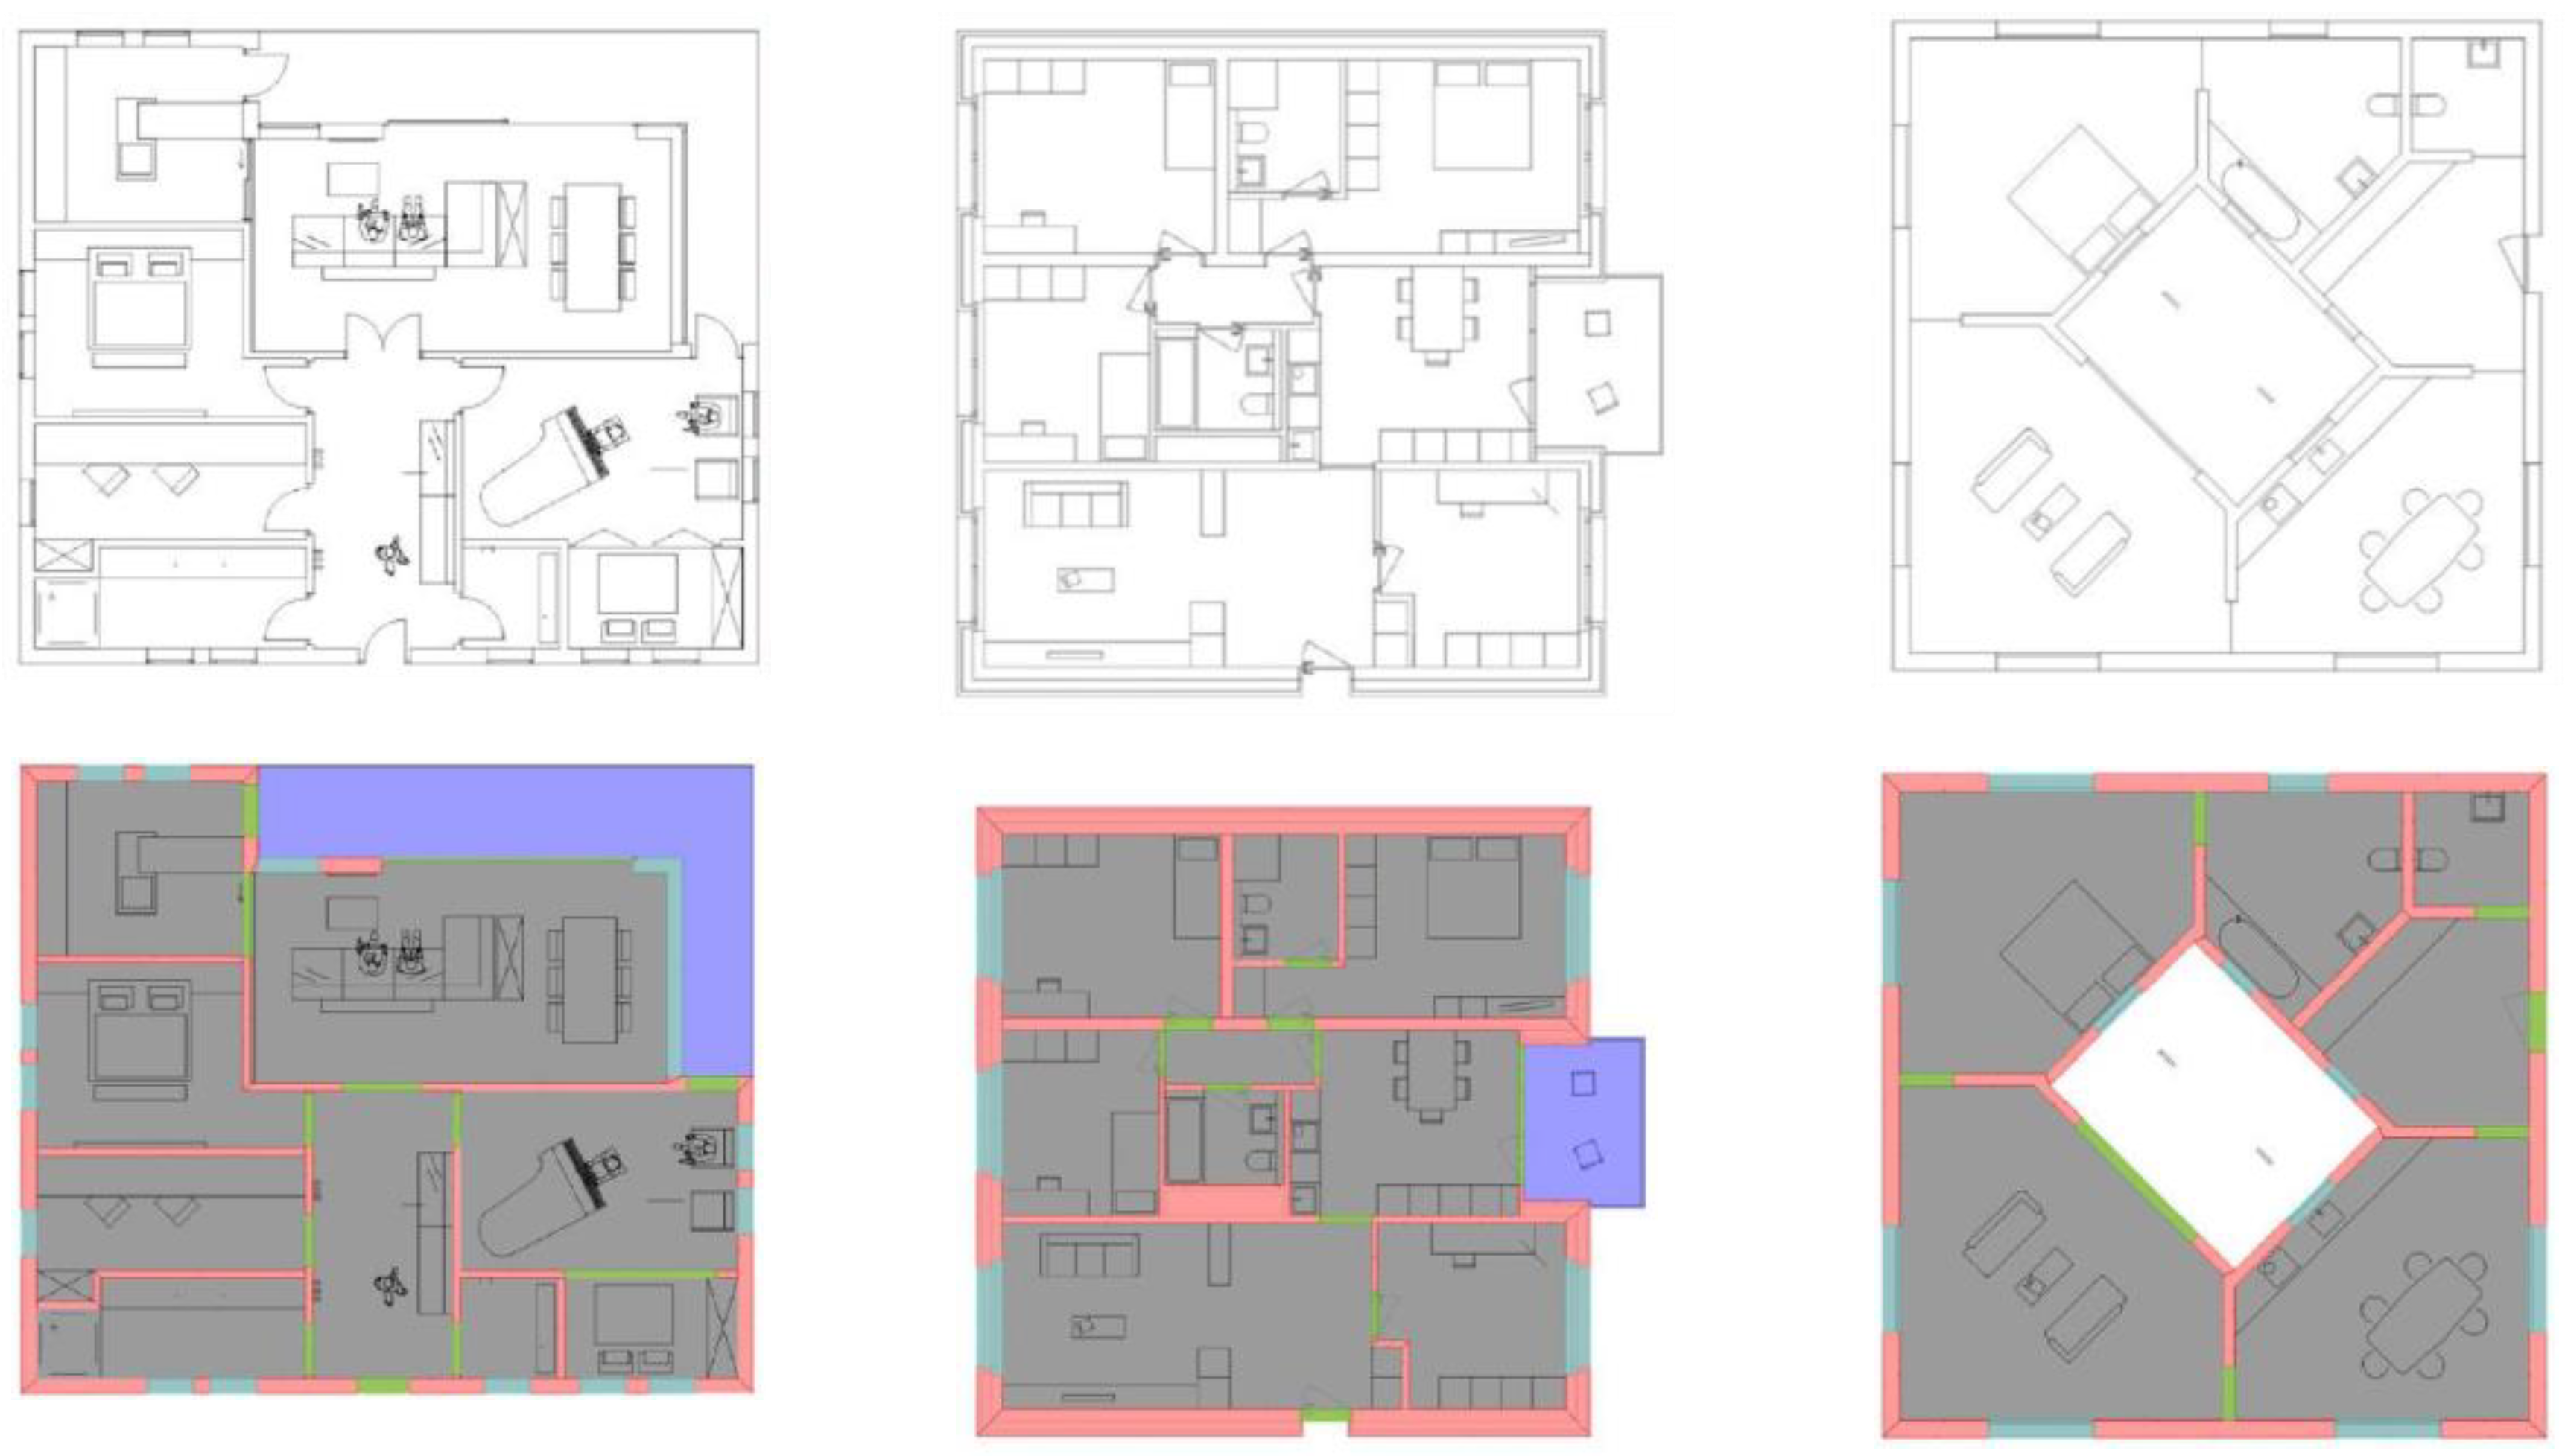
Figure 18 shows three examples of the analyzed floor plans. Every IFC object is visualized in a separate color (doors – green, windows – blue, rooms-grey, walls – red, outside areas – purple). The technical evaluation should evaluate the whole procedure including the fully automated detection as well as the “One Click” detection, where a specific symbol is first added to a library and then used for detection. Every floor plan was first analyzed with the automated process in order to detect as many openings as possible. Only in case a symbol was missed or a false positive was detected the “One Click” approach was used to finalize the detection process. In order to assess the effort, the number of user interactions needed to complete the detection was counted.
The floor plans used for the evaluation contain 91 doors and the same number of windows, whereas 20 different styles of doors and 10 different styles of windows were present in the drawings. Symbols are considered as identical if the number of edges and the number of neighbors of a node are the same.
The fully automated process reached a precision of 98.2% and a recall value of 92.30% when detecting window openings (see
Table 3). There were only two floor plans with false positive matches. In contrast to windows, door elements performed slightly worse. A precision of 87.87% and a recall of 89.01% can be explained by the rather loose rules used to detect a broad diversity of doors. The restriction of finding a door leaf in the symbol would improve the result in this dataset.
Table 4 shows the overall detected symbols. At the end of the automated process, seven windows and ten doors out of 91 symbols could not be categorized, due to the complexity of the symbol. With the “One Click” method one type after the other was added to a library until the detection has been completed. In the end, only 2 door symbols could not be detected at all since they were not at all connected to the wall segments and therefore categorized as furniture elements. In the 3D model, in the end, this would be represented as an open gate without a door.
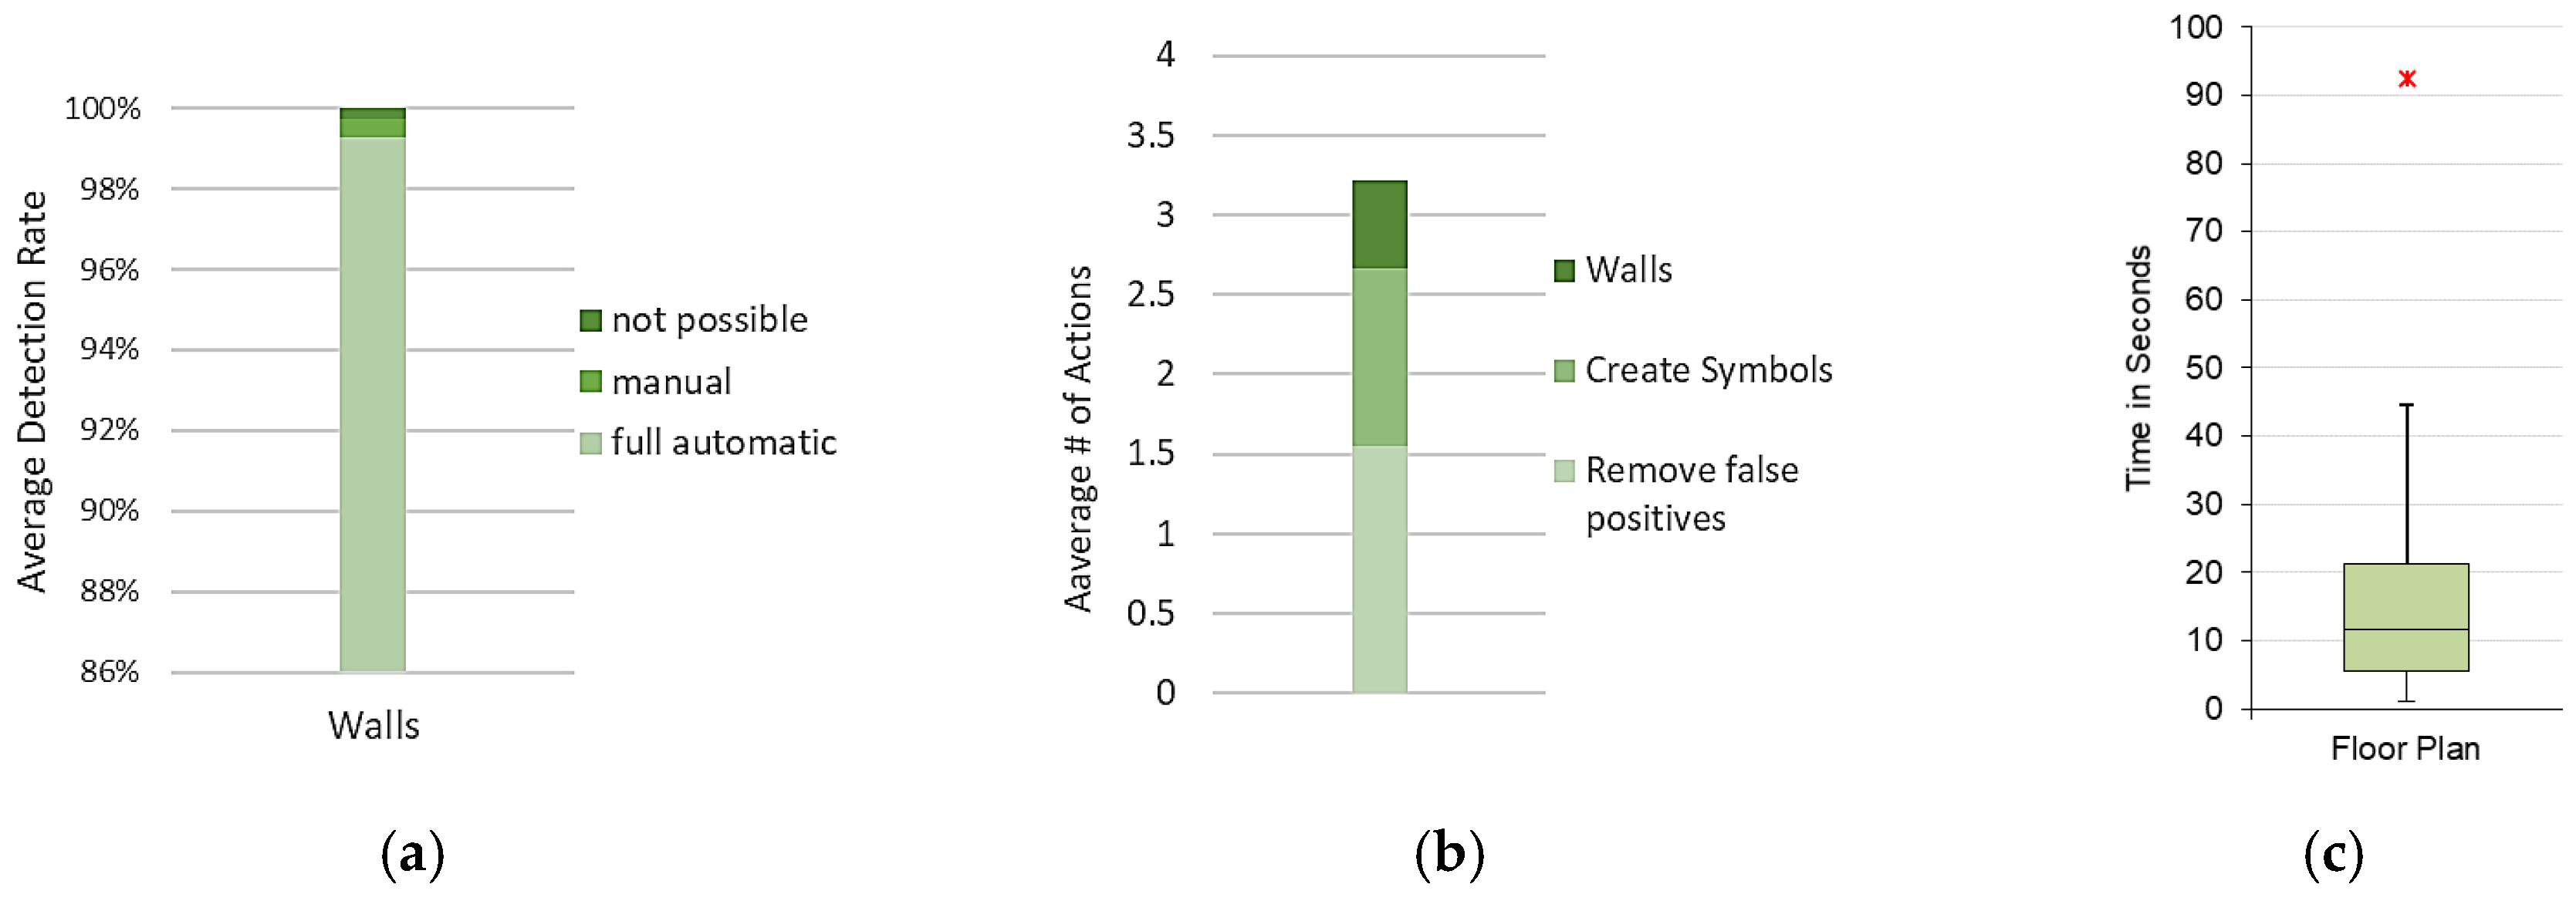
The automatic detection of walls achieved an average of 99.26% as shown in
Figure 19a. By manually adding wall segments this value could be increased by 0.49%. Only 0.13% of all wall elements were not able to be added correctly. This happened because one drawing contained a design element which was placed inside a wall.
On average 3.2 (σ = 2.04) interactions were necessary to complete a detection in a floor plan (see
Figure 19b). As an individual interaction adding or removing a wall segment, a “OneClick” definition of a symbol or removing a false positive element are counted. Finally,
Figure 19c shows the average processing time of the full automated step of all analyzed floor plans with a median of 11.65 s. The duration is highly dependent on the complexity of the floor plan and the number of contained line segments.
4.2. User Study
In addition to the technical evaluation of the presented system, the authors conducted a user study in order to research the applicability of the resulting VR environment in a real-world scenario. The main objective of the user study is concentrating on the decision-making process of a person searching for an apartment. The research question evaluates if users prefer a more detailed environment with furniture and the possibility of interacting or if they find an empty VR apartment more helpful in this situation. Within the user study, we compare three different representations of an apartment: 2D renderings, empty VR apartment, and a furnished apartment. Furthermore, the question if people are willing to use such a tool while searching an apartment was answered.
To research these questions a setup was built with one and the same apartment reconstructed for each user. The participants were asked to put themselves in the position of searching for an apartment which is still in the construction phase, whereas the factors: number of persons, income and age should not be considered. The user was confronted with three different scenarios representing the same apartment. After each of these three tasks, the user had to answer multiple questions based on the 5 points Likert scale [
26]. All three scenarios are a direct result of the implemented system. At first, each user was confronted with multiple renderings of the apartment and a perspective top view of a printed paper. For the rest of the study, the participant was equipped with an Oculus CV1 HMD and was tracked within an area of approximately 4 m by 4 m. With the two Oculus Touch controllers, the participant could navigate through the environment with a teleporting metaphor. In the first VR scenario, the user was put into an empty VR apartment and asked to visit every room. The final VR condition was an apartment equipped with furniture and the possibility of changing the appearance of all surfaces. Finally, the participant was asked to furnish the only empty room in the apartment.
Overall six women and seven men were part of the study at an age of 25 to 55 years. Nine participants have been searching for apartments over three times in their life and the other four people two times. So, everyone was familiar with the situation they were put in. On the other hand, people did not feel experienced with VR hardware (mean value 2.38 with σ = 0.76). All except one participant confirmed to have no problems experiencing depth in 3D movies which are an important factor in a VR application.
The decision-making process when searching for an appropriate apartment is complex and dependent on multiple factors. The user study at hand, tries to analyze some factors which could lead to a conclusion. The following aspects are covered: object appearance in VR, the sense of presence, the importance of information available in VR and the readiness of actually using such a system. This was achieved by an extensive questionnaire, where the most important results will be discussed here.
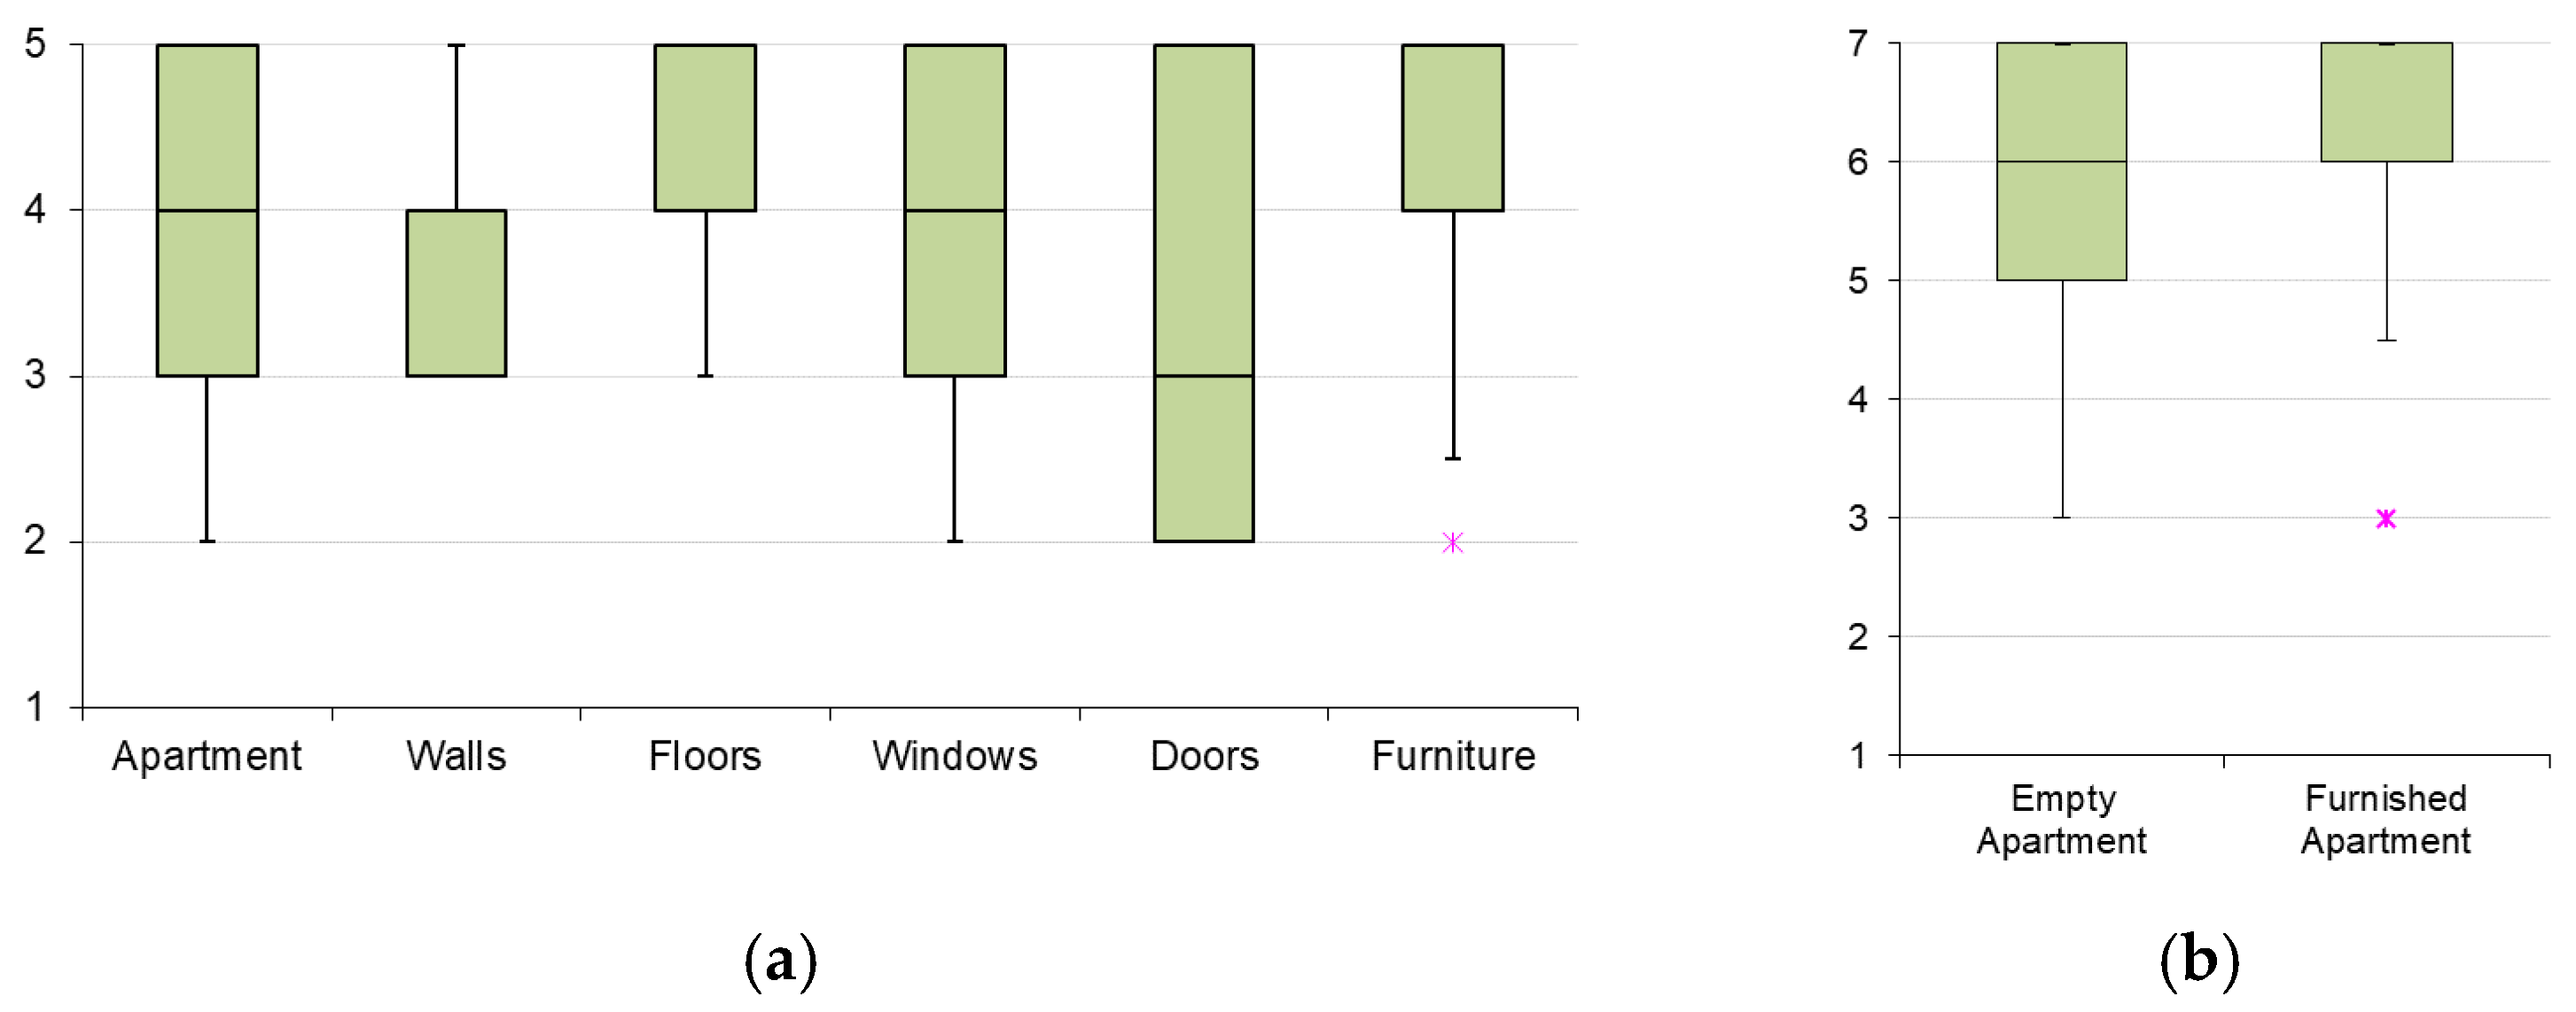
After experiencing the three different presentations of the apartment the participants were asked about the visual appearance of the automatically generated apartment. The results can be seen in
Figure 20a which shows that 70% of the participants rated the general appearance of the apartment with “realistic” (4) or “very realistic” (5). The individual components of the VR setup were rated in a similar range, only doors and windows were rated lower. This can be caused by the usage of only one door and window model for the whole apartment which are scaled to the size of the opening and look therefore a bit distorted.
After each VR session, the presence according to Usoh et al. [
27] was measured which should show how immersed the users felt while being in the VR environment. As
Figure 20b shows, the overall rating is rather high in both scenarios. While the average rating of an empty apartment was rated at 5.71 (σ = 1.16) the fully furnished version reached an average of 6.18 (σ = 1.12) on the 7-point Likert scale.
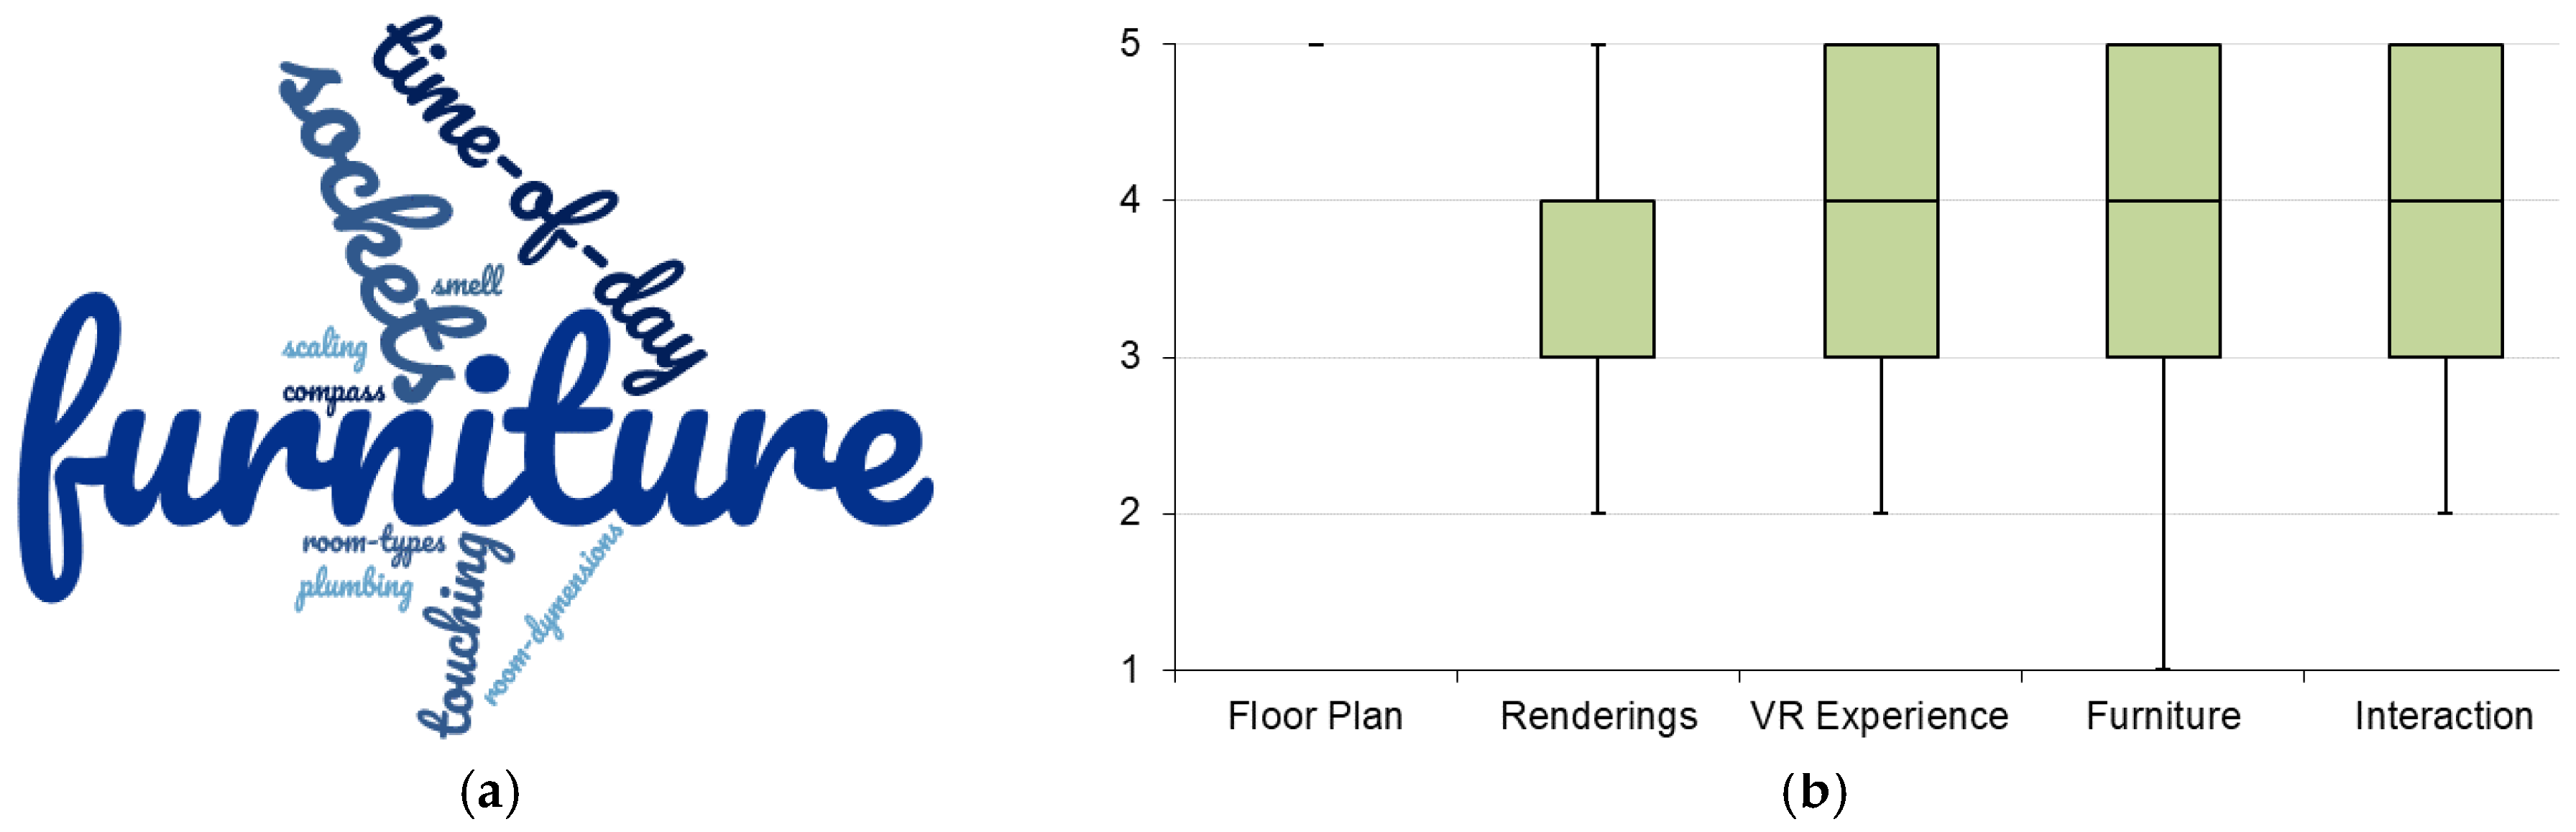
After the first VR exposure without furniture, the participants were asked which information they are missing within the environment in order to get a better impression of the situation.
Figure 21a shows the most mentioned keywords. The majority of participants mentioned that furniture as a keyword without knowing that the final VR setup will contain this feature. Furthermore, a visualization of the time of the day and the location of plug sockets was considered important.
In comparison to all kind of representations, the floor plan itself is considered to be the most important source of information. An interesting finding is that the VR experience and the possibility of interacting with the environment were rated slightly better or equal to the renderings (see
Figure 21b). So, all provided information seemed to be helpful to the user in order to get a better understanding of the apartment.
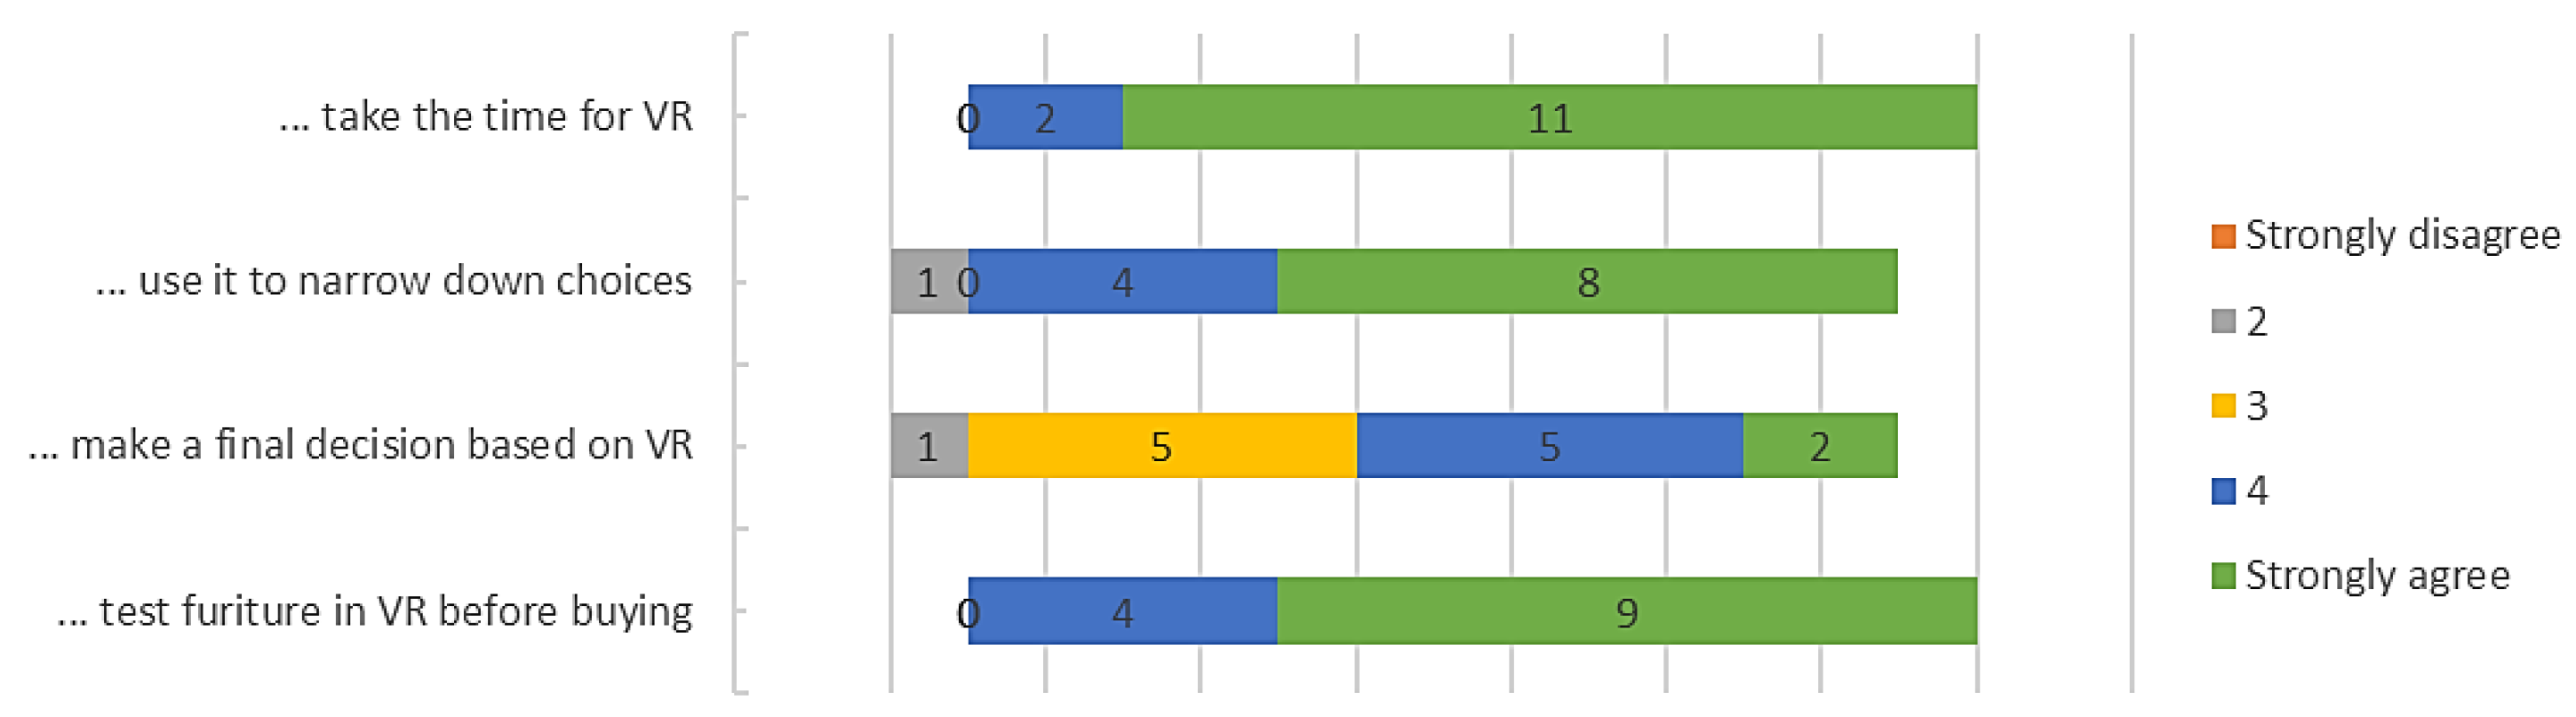
Because visiting an apartment in VR is associated with high time expenditure the authors also asked how plausible it is to actually use such a system in case of searching for a real estate. All participants were asked if they would take the time to use the setup and for which purpose.
Figure 22 shows the results. All participants rated either for “Strongly agree” or “Agree” to use the system when searching for a real estate (average 4.84 and σ = 0.36). Similar results can be seen when asking for the purpose. Participants would like to narrow down the potential offers (average 4.45 and σ = 0.84) with the help of the system. Making a final decision, on the other hand, resulted still in a positive direction but was rated lower (average 3.62 and σ = 0.83).
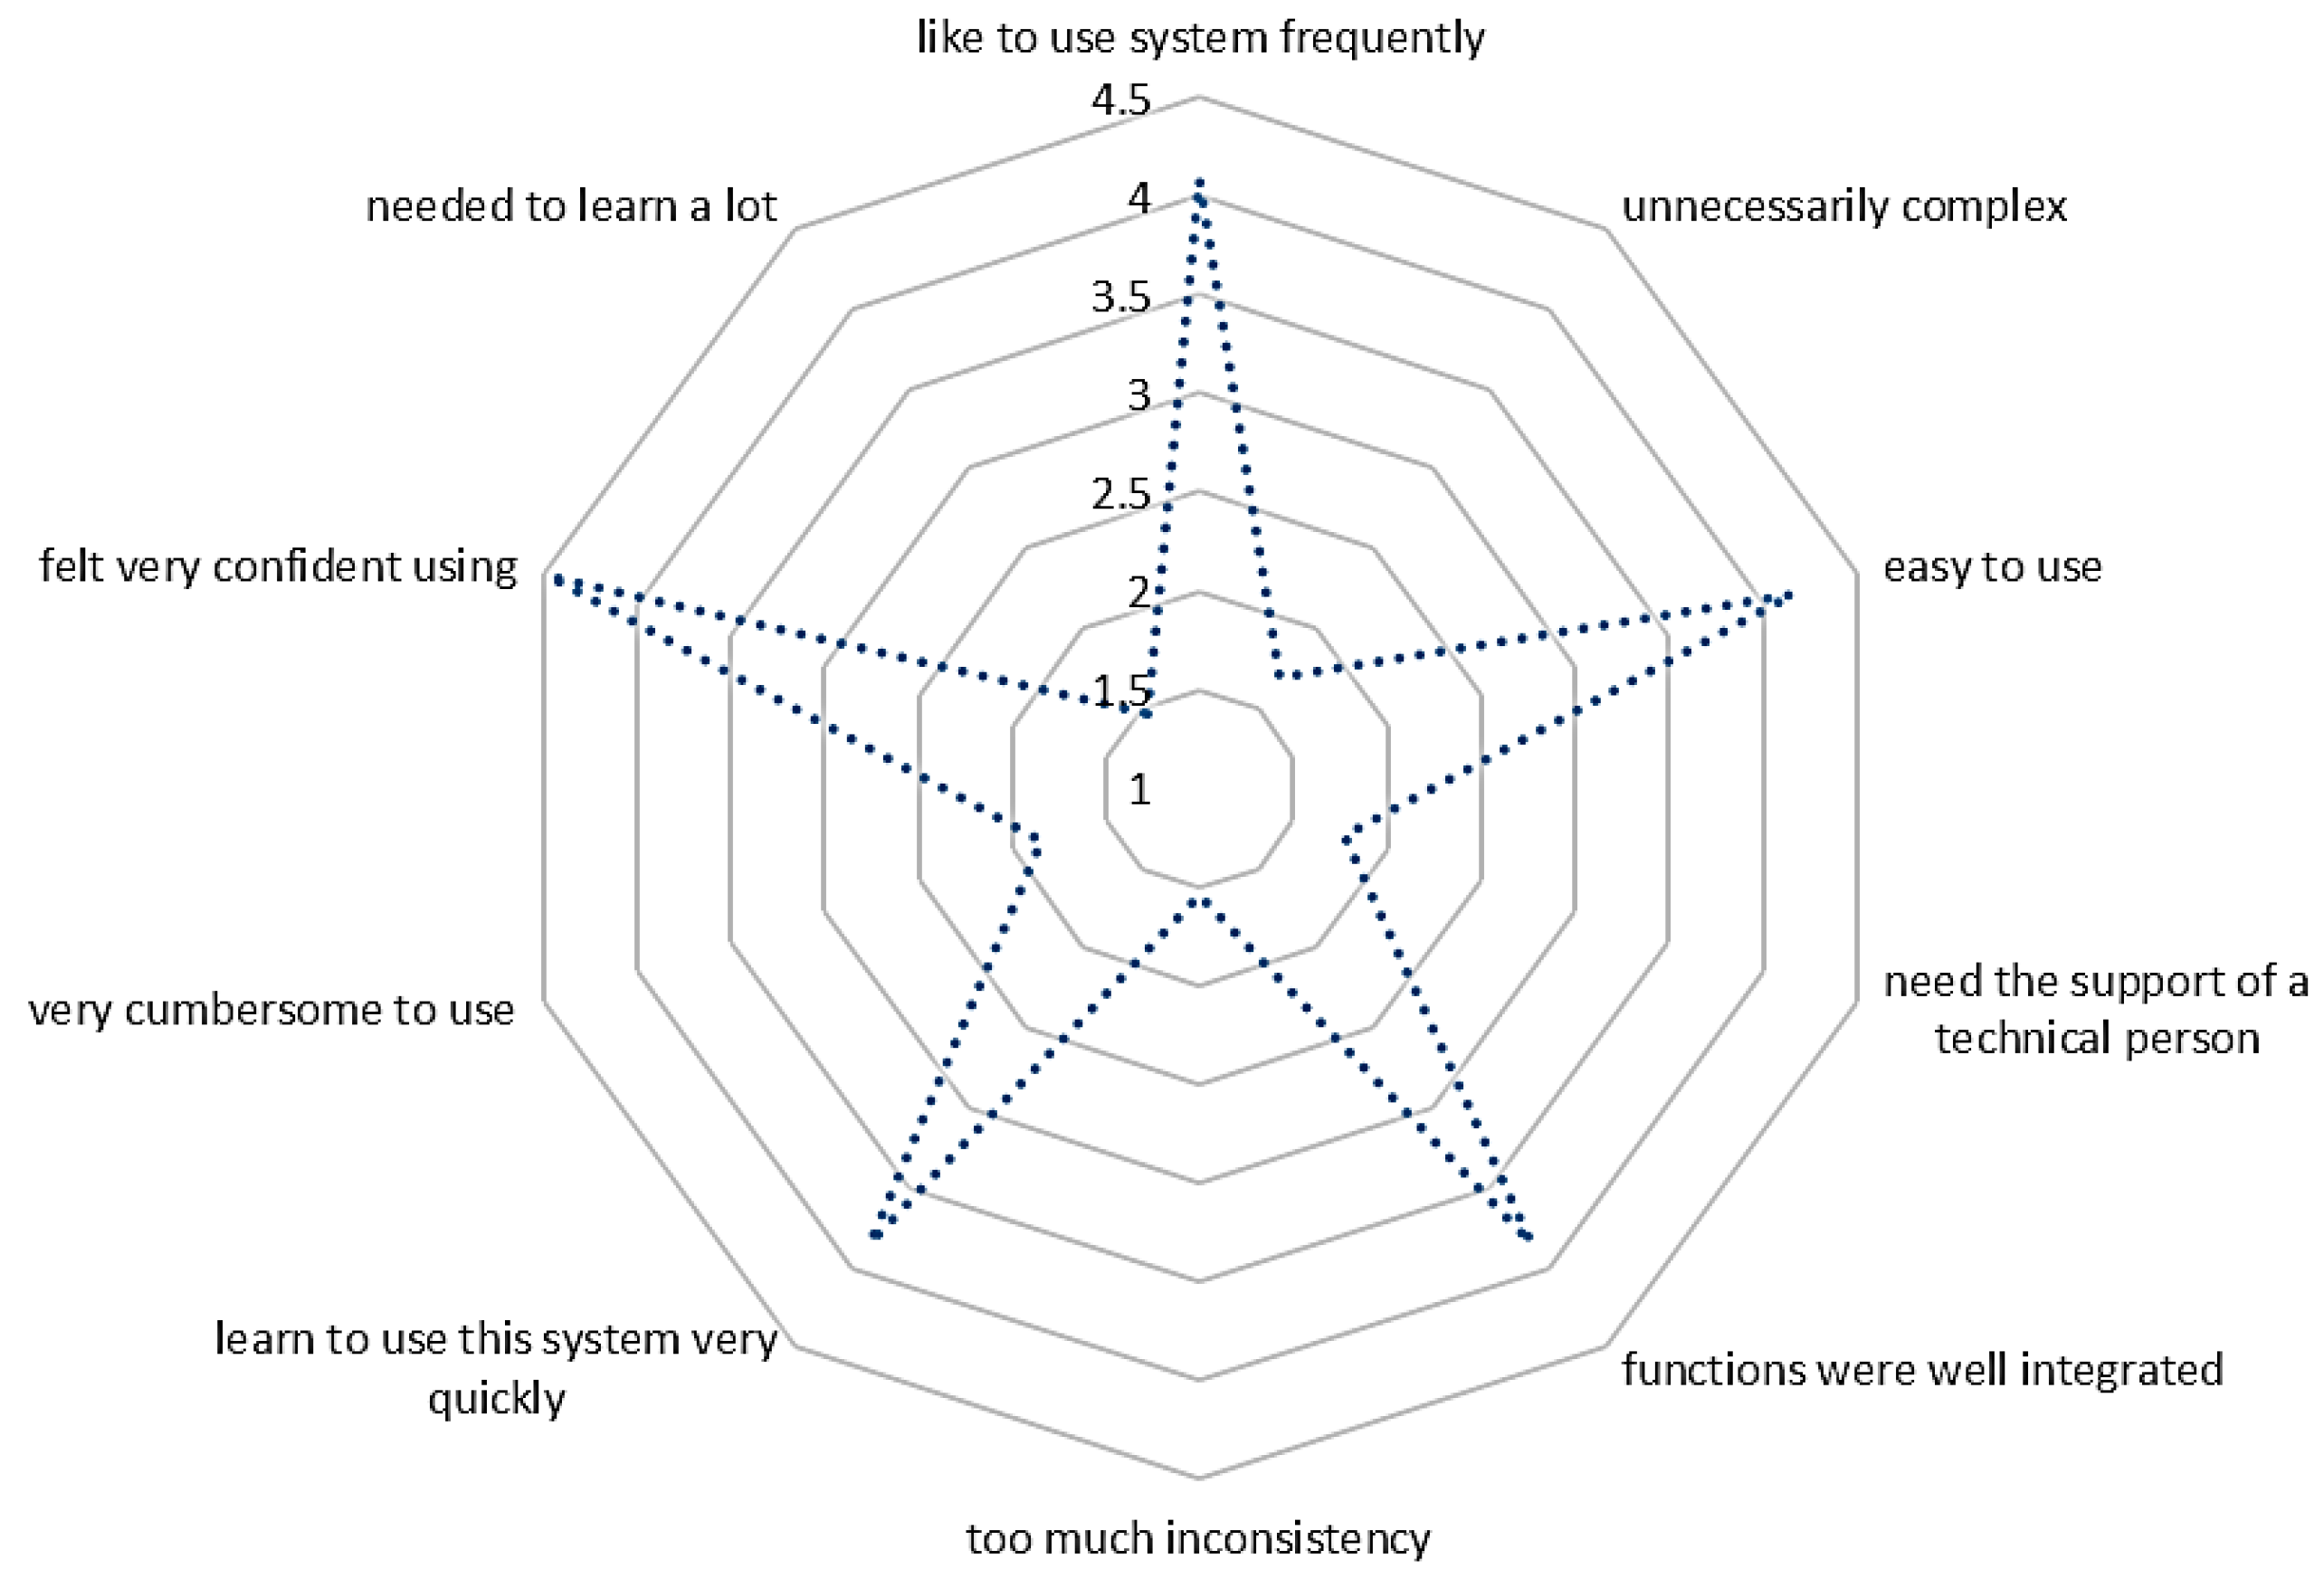
The implemented interaction technique was part of the second VR task where people could interact with surfaces and place furniture in a room. In order to get an understanding of the usability the System Usability Scale (SUS) [
28] questionnaire was used. An average score of 80.19 was achieved. The individual results of the 10 questions can be seen in
Figure 23. Participants also “Strongly agreed” to the statement, that they would like to use the system for their home in order to place and try out new furniture (average 4.69 and σ = 0.46).
Finally, all participants were asked whether they would buy or rent the shown apartment either only from seeing renderings, experiencing an empty apartment or a fully furnished one. Furthermore, they could differentiate between an already existing object and a not yet existing object. By far the best results were recorded in the fully furnished condition of a not yet existing apartment. The majority of the participants would agree to buy it without seeing the object. Considering a 5-point Likert scale people agreed with an average of 4.15 (σ = 0.77), followed by the condition of a furnished, but already existing VR apartment with an average of 3.46 (σ = 1.15). The conventional way of providing a floor plan and renderings was rated far behind with an average score of 2.54 (σ = 1.01).
To prove that the participants were not influenced by cybersickness the Simulator Sickness Questionnaire (SSQ) [
29] was used before and after the VR experience. The results of the pre- and post-questionnaire showed no extreme results. According to the total score, nine participants felt better after the experiment. The total value of the four others was slightly worse, mainly due to sweating. This could also be caused by the high temperature of above 26 °C in the laboratory setup. Only one participant reported a moderate problem with nausea after the experiment.
5. Conclusions
In this paper, we presented a complete automated 3D model generation workflow for apartment structures in order to be experienced in VR by potential buyers. As a starting point, a vectorized floor plan is analyzed regarding only structural elements. A game engine is used to further process this information by generating a 3D mesh for appropriate VR interaction, assigning suitable room types, textures, and lights. Finally, a user study and a technical evaluation were performed.
The main focus of the work at hand was to construct a workflow with a high degree of automation which allows providing a large number of VR experiences of apartments available on the market at a reasonable effort. With a floor plan analyzing the time of about one minute for an apartment of average complexity and about three to four interactions on average, the detection process is finished in a few minutes. The 3D model generation process including the baking of the lights in the Unreal game engine takes another two to three minutes. In general, it can be said that an apartment can be finished for exploration without furniture in about 10 to 15 min. We have shown that it is possible to process floor plans from different sources with different complexity. In contrast to other approaches the concept at hand poses only few requirements to the floor plan. As such we do not rely on parallel lines [
8,
12] or any other layer information [
9]. The automated detection of openings also works without the need of an initialization step [
7] or any user input. Of course, our approach could also benefit from layer information or text contained in the input file to speed up the process or to extend the functionality, but it is not necessary.
Creating the VR experience in this work allows professional interior designers to adapt and extend the appearance of the apartment before exporting the VR application. This user-oriented feature is also a benefit of our implementation in contrast to other approaches.
A meaningful numerical comparison between the here presented concepts and similar work is not possible since to our best knowledge there is no public database of floor plans available to calculate comparable performance measurements. But the quality of the result was measured in multiple ways. Besides the already good precision and recall values for the automated detection process, the full detection process within the tested drawings only had problems with two door symbols. This reflects the technical quality. More important than a good 3D representation is the acceptance to use the system. The results of our evaluation suggest that the majority of people derive added value from the VR experience. On the one hand, they agreed to invest time to experience an apartment in VR. On the other hand, participants would even buy an apartment only by experiencing it in VR. Finally, people consider a VR visit similarly important than having 2D renderings.
The findings within this work at hand can be very important for many application areas, as an automated 3D model can be used in various scenarios such as maintenance, security, advertising and many more. Due to the lack of available living space in some areas, apartments are often sold before they have been built. Having a tool to create such a representation has an added value to these people. Application areas such as buying furniture or refurbishing a room could benefit from our system.
Further research in this area can be based on a database that is created by the detection algorithm and will be used to further develop the detection process with the help of neural networks. A big dataset of ground truth data will be needed in order to train a working network.


