Article

Comparing Approaches for Evaluating Digital Interventions on the Shop Floor †

by
Francisco José Lacueva-Pérez
1,*,
Lea Hannola
2,
Jan Nierhoff
3,
Stelios Damalas
4,
Soumyajit Chatterjee
2,
Thomas Herrmann
3 and
Marlene Schafler
4
1
Department of ICT-Multimedia, ITAINNOVA, 50018 Zaragoza, Spain
2
Industrial Engineering and Management, Lappeenranta University of Technology, FI-53851 Lappeenranta, Finland
3
Institute of Applied Work Science, Ruhr-University Bochum, 44801 Bochum, Germany
4
Smart Production and Human-Centered Solutions, Virtual Vehicle Research Center, 8010 Graz, Austria
*
Author to whom correspondence should be addressed.
This paper is an extended version of our paper published in Proceedings of the 11th International Conference on PErvasive Technologies Related to Assistive Environments (PETRA 2018), Island of Rhodes, Greece, 26–29 June 2017.
Submission received: 30 October 2018 / Revised: 30 November 2018 / Accepted: 3 December 2018 / Published: 5 December 2018
(This article belongs to the Special Issue Technologies for Industry 4.0)

Abstract

:
The introduction of innovative digital tools for supporting manufacturing processes has far-reaching effects at an organizational and individual level due to the development of Industry 4.0. The FACTS4WORKERS project funded by H2020, i.e., Worker-Centric Workplaces in Smart Factories, aims to develop user-centered assistance systems in order to demonstrate their impact and applicability at the shop floor. To achieve this, understanding how to develop such tools is as important as assessing if advantages can be derived from the ICT system created. This study introduces the technology of a workplace solution linked to the industrial challenge of self-learning manufacturing workplaces. Subsequently, a two-step approach to evaluate the presented system is discussed, consisting of the one used in FACTS4WORKERS and the one used in the “Heuristics for Industry 4.0” project. Both approaches and the use case are introduced as a base for presenting the comparison of the results collected in this paper. The comparison of the results for the presented use case is extended with the results for the rest of the FACTS4WORKERS use cases and with future work in the framework.

1. Introduction

Kiel et al. [1] have described Industry 4.0 (I4.0) as referring to the integration of Internet of Things technologies into industrial value creation, enabling manufacturers to harness entirely digitized, connected, smart, and decentralized value chains. The authors signaled that I4.0 poses several implications for manufacturers in terms of economic, ecological, and social aspects, referring to the Triple Bottom Line of sustainable value creation.
Benefits and challenges, both for organizations and workers, have been analyzed by several studies since the concept I4.0 was introduced in 2013 [2]. Kiel et al. [1] gathered qualitative research based on performing semi-structured interviews with managers regarding the sustainable value creation. Muller et al. [3] searched for the factors driving the implementation of I4.0 in quantitative research involving 746 manufacturing companies. In both cases, social sustainability is highlighted as an important factor to be considered.
Social sustainability refers to company-specific actions that preserve and develop the human and social capital of society [1]. Based on the results of the studies we introduced in a previous paragraph, it is expected that the implementations of I4.0 provide many benefits to workers. Examples of these benefits are more job security due to the emergence of new jobs, optimization of the human-machine interaction, a higher quality of work due to the simplification of tasks or best human learning supported by the introduction of technical assistance systems, the reduction of monotonous work, and increased employee satisfaction on shop-floors. On the other hand, these studies also highlight that many challenging issues still need to be solved. Examples of the challenges to be faced are the qualification of employees, long-term employees’ loyalty against the background of a shortage of skilled workers, employeess’ fears, and trust in and acceptance of I4.0 implementations.
Wittenberg [4] signaled that within the smart factories, production elements become so-called cyber-physical devices that have an increased intelligence and ability to communicate. This makes it possible for cyber-physical systems to take part in the plan and dispositive tasks. In consequence, due to the fact that the machines undertake more tasks from the operator, the remaining operator´s tasks are seen to display an increasingly observing character. The operator has to monitor and supervise the automated production system. However, the increased information and communication power of these systems lead to a complexity that is not understandable by classic user interfaces used in the industry. The changes in interfaces apply to new production system engineering, operation, and maintenance. In the opinion of Ansari et al. [5], engineering and operation management jobs in the age of Industry 4.0 require more multi- and interdisciplinary skills for handling combined task elements.
This study is part of the on-going FACTS4WORKERS (F4W) project (Project Homepage: http://facts4workers.eu), which develops and demonstrates worker-centered solutions that support the inclusion of increasing elements of knowledge work on the shop floor of smart factories. The F4W project’s primary goal is to develop, pilot, and evaluate worker-centered solutions, which are designed for industrial shop floor workers by using new models for work optimization and the utilization of production systems. The main objective of the project lies in increasing job satisfaction, innovation & problem-solving (I & PS) skills (of workers), and increasing the productivity of factories. The shop floor workers are the key actors for evaluating the interventions through digital tools, which are expected to fulfill these project objectives.
This study introduces a solution with digital interventions at the shop floor (Section 3) and introduces two approaches for evaluating the solution from the workers’ perspective (Section 2). The first approach is the F4W Evaluation Framework, which has the goal of demonstrating and evaluating the impacts of the interventions performed. The framework is developed as a combination of several tools and methods, taking existing ones from the literature as a base, tailoring them, and defining new approaches when considered reasonable for measuring these changes and for demonstrating that these changes result from the digital interventions.
Existing job satisfaction tools do not completely cover all the factors we consider important for measuring the project goals or they do not measure the worker’s feelings about the Information System (IS) being used [6,7]. In the F4W project, we consider the introduction of new IS solutions and new work practices as aspects that reciprocally affect each other and they should thus be seen as one entity. Existing job satisfaction literature does not consider these changes in worker practices and IS solutions as one intervention. In addition, system acceptance and success models explain user satisfaction and system use as dependent on the system and information quality as a determinant of net benefits, but do not show how to measure them. The assessment of system quality (Human Machine Interaction—HMI and Human Computer Interaction—HCI in particular) does not include shop floor workers. The evaluation framework presented in this study is a more detailed approach to evaluating the acceptance of a system.
Using heuristics is the second approach of this study for evaluating the digital interventions. The used heuristics start from the project “Heuristics for Industry 4.0” (hi4), and are utilized to deepen the understanding of the developed IS solution in regard to the most critical aspects of socio-technical system design and to identify possible flaws or shortcomings. Heuristics promise to be a pragmatic approach, in which the most critical flaws can be identified with a reasonable amount of effort. However, they do not claim to produce perfect “100% solutions”. Thus, this study increases the theoretical and practical understanding of two different kinds of evaluation approaches in the context of digital interventions at the shop floor of industrial production environments.

2. The Evaluation Frameworks

2.1. F4W Evaluation Framework Method and Strategy

The F4W evaluation framework is introduced in detail in [8]. The framework takes existing Information System success models [9,10,11] as the base and extends them with the aim of measuring the impacts of an IS intervention at production environment shop floors.
The evaluations are based on two different concepts: Impact Analysis (IA) and Validation, following the work of [12]. The IA is used for assessing the designed artefacts’ impact on individual and organizational levels. On the one hand, according to the project’s main goal, the individual impact comprises job satisfaction, as well as innovation and project solving (I&PS) skills. On the other hand, the impact on organizations includes measures of productivity. For measuring the impact, the following impact dimensions (ID), which represent our project goals, are used: (1) autonomy, (2) competence, (3) variety, (4) relatedness, (5) protection, (6) efficiency, and (7) quality. Finally, it anticipates the expected impact that IS artefacts would have on the IP’s context of use.
Validation refers to the process of determining if the evaluated artefact provides the (system, information, and interaction) quality that the user expects. The results of the validation strongly depend on the maturity of the artefacts. Mock-ups/demonstrators, as less mature artefacts, probe the functional feasibility of an idea (proof of concept). Prototypes show the value provided by a solution (proof of value). Pilots, as more mature artefacts, show the capability of a solution for addressing complex issues of operational feasibility (proof of use).
Figure 1 shows the tools that the framework considers for performing the evaluations. This set of tools tries to find a balance between:
  • the support to scientific research and the use by IT practitioners;
  • the need to support artefacts with different development maturity states (mockups, prototypes, pilots);
  • the use of the framework in different legal and regulatory environments.
Without considering the goal of the tool (validating the solution or assessing the impact), the framework classifies the tools into two categories. First, it considers what we call Classical Approaches (CA). They are worker (human) driven. CAs directly obtain data from workers by interviewing or surveying them. Under this category, we consider the set of tools as the academic SotA of tools and methods for evaluating purposes.
In the second category of tools, Technological Approaches (TA), data-driven tools are included. They base their measurements on the available data, from applications of their logs. In consequence, these tools can only be used by mature artefacts: prototypes used by workers in short/long term periods. The use of the provided prototypes will generate large amounts of data (logs, content/application data). Taking care to preserve legal conditions, these data can be used to analyze how the worker is interacting with the solution, as well as to analyze their performance when using the solution.

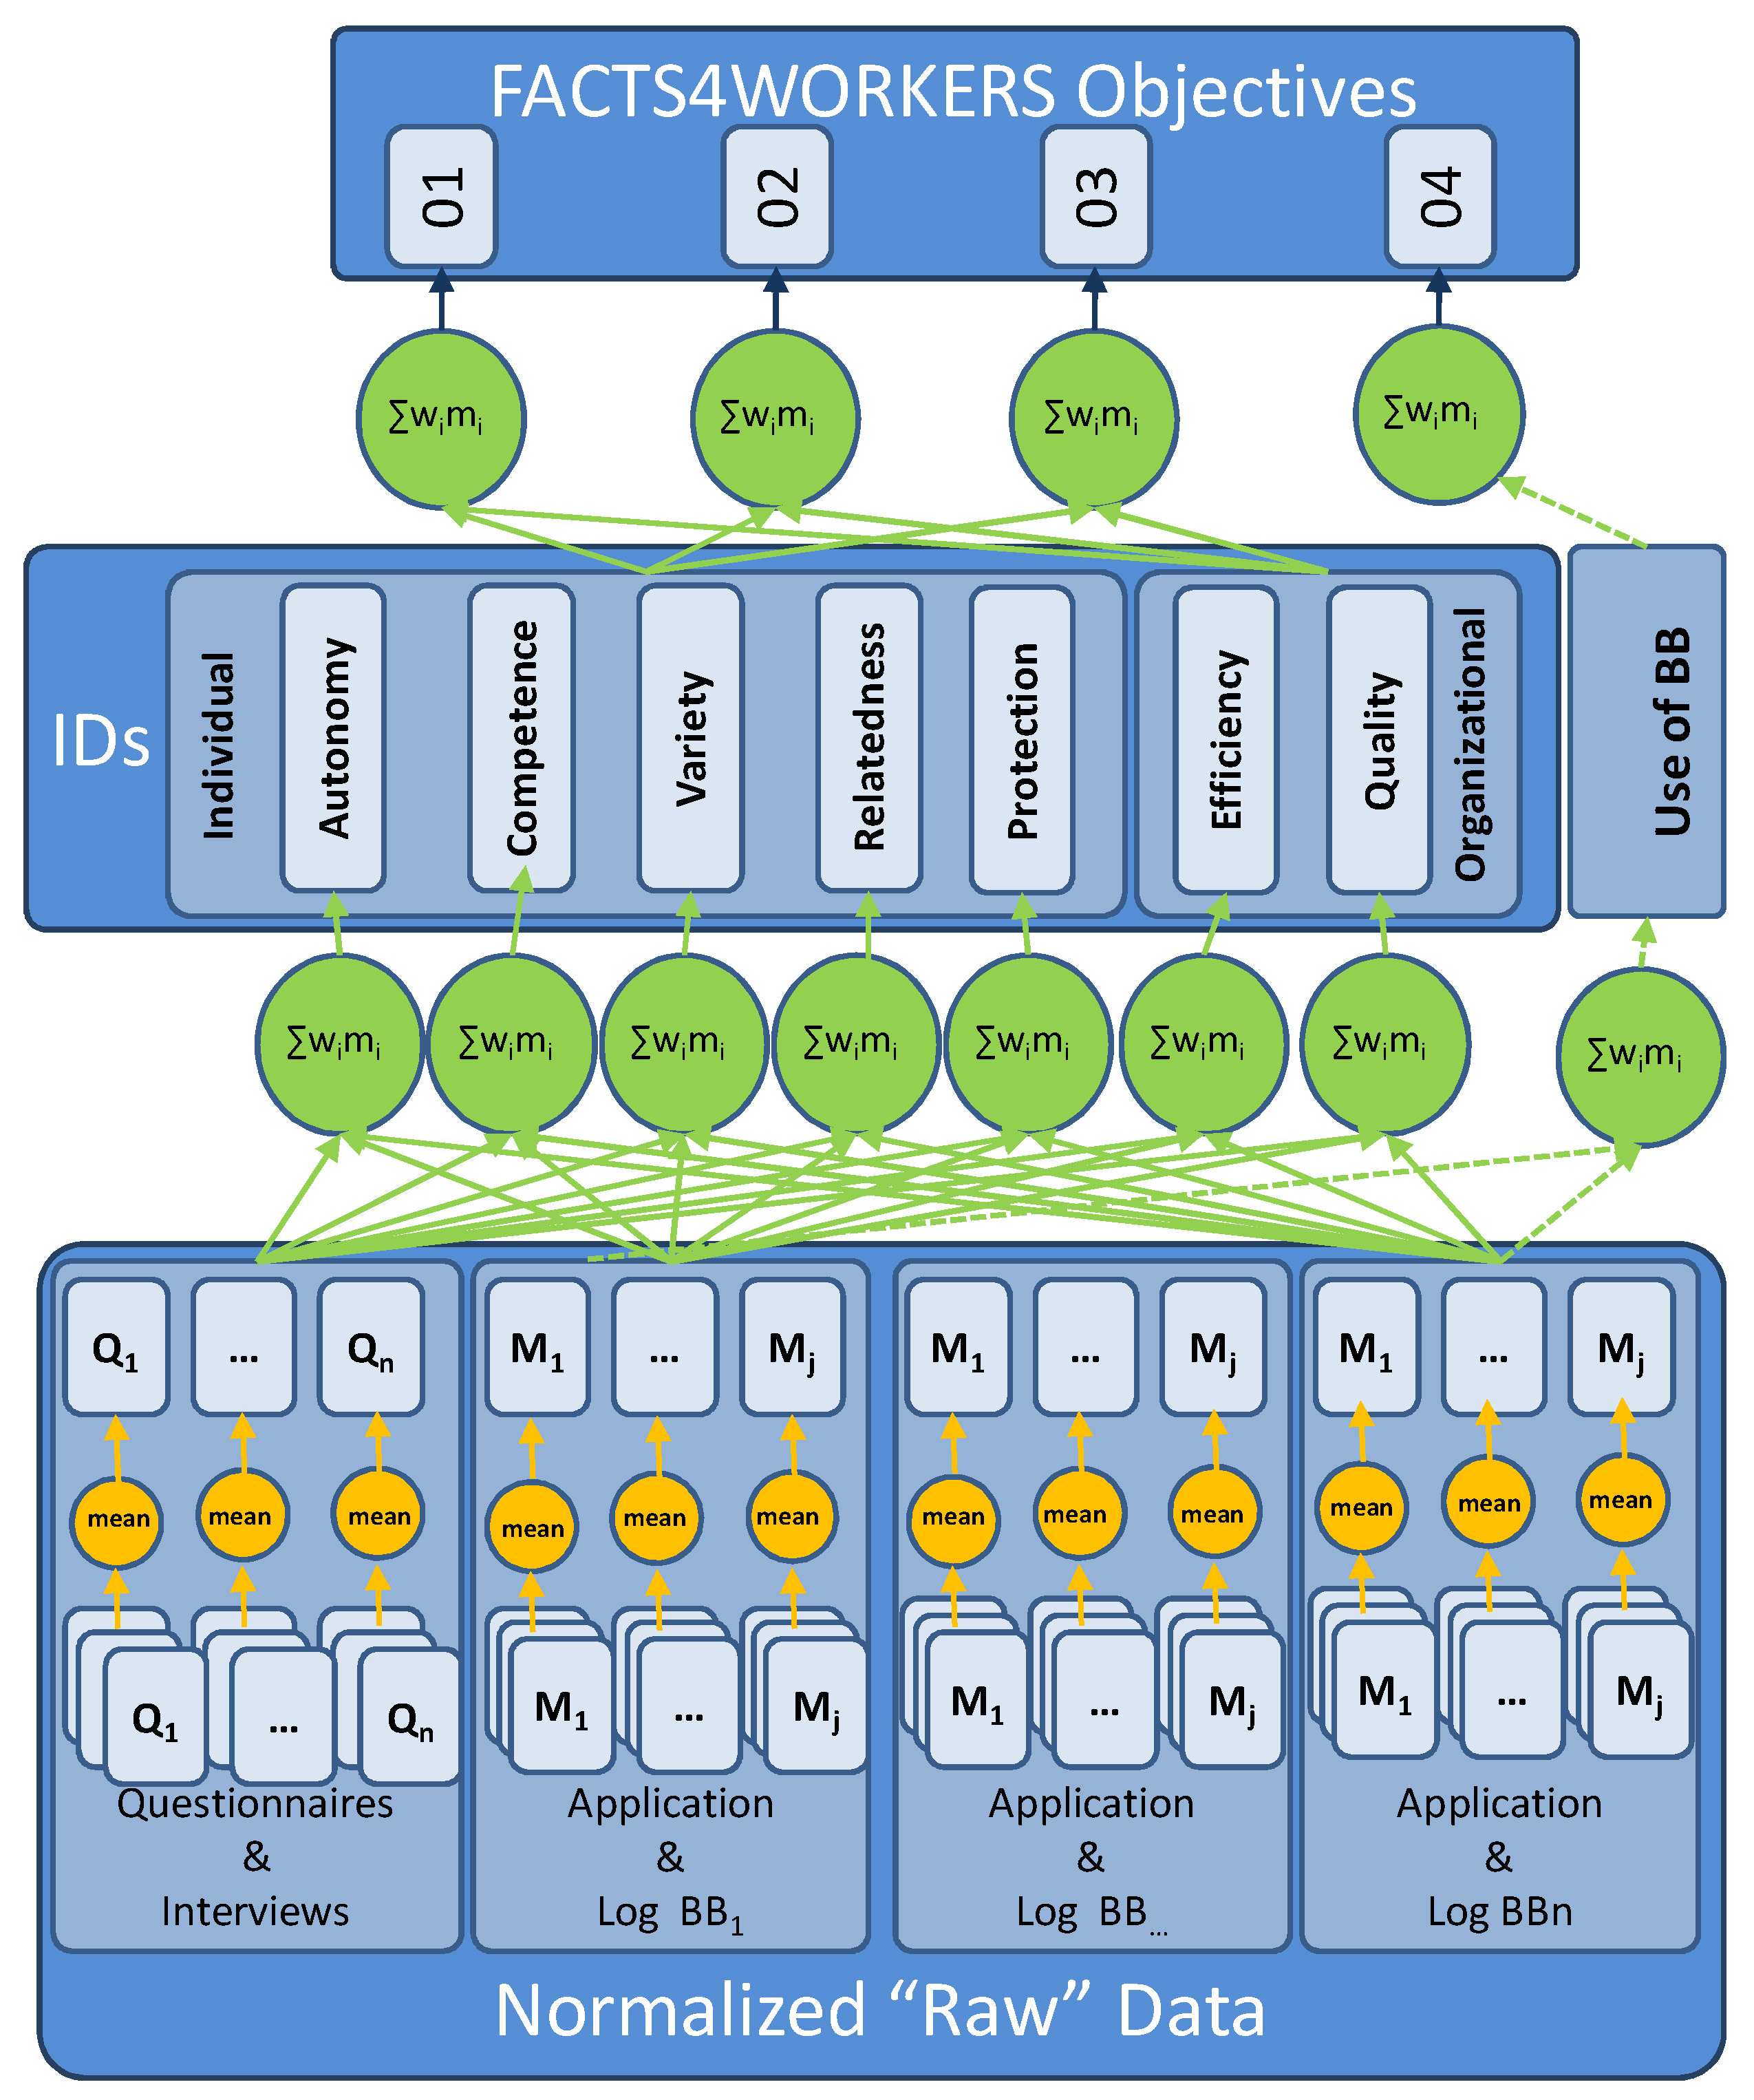
2.1.1. F4W Impact Assessment Quantification Process

The Process of Quantification (PQ) of the IA has the objective of calculating indicators of the impact of interventions on workers and organizations under the condition of preserving the worker’s anonymity. These indicators are obtained from the assessed values on the different IDs. Obtaining the values on the IDs requires the combination of data gathered using both CA and TA tools. This means dealing with raw data from multiple sources and, in consequence, having different metrics. These raw data must converge in common metrics which can be used for determining the degree of achievement of project objectives.
The definitions of the quantification and interpretation strategies are based on the Goal-Question-Measurement process defined in [13] and the processes followed in Big Data projects for transforming data in knowledge [14]. This problem formulation, how to move from raw data to a set of project KPIs, can be divided into more specific sub-problems to be solved considering the different features of the handled data and of the surrounding evaluation environment. These sub-problems are described in the next paragraphs.
The first problem we deal with is how to determine the effect of external factors on the results of evaluations. External factors’ biases can be determined using a Control Group (CG) of workers (workers not using F4W solutions). However, the temporary events can affect how feelings evolve over time [15] and they affect both CG and F4W. In consequence, although the effect of temporary events is quickly blurred after they have finished, they can compromise the results of an evaluation. In particular, the temporary events can affect the results when they happen just before or during the evaluation. The FACTS4WORKERS framework includes a set of rules for trying to minimize the external factor’s influence in evaluations. The general rule is to note the event occurrence as a possible explanation of unexpected results. When the event happens before starting the evaluation, whenever it is possible, the best approach is to delay the full evaluation or, if it is not possible, to perform the second part close to the first one (within an interval of two or three weeks). In the case the event happens between both evaluations, if possible, the second must be delayed as much as possible (three or six weeks).
Considering the nature of the data, the first problem to consider is that data obtained from interviews are qualitative. In these cases, it is necessary to bring the data into context and interpret the workers’ answers to gain knowledge about the impact and the effects that F4W solutions have on individuals and the organization. Relevant statements from the transcriptions of the interviews or from the interviewers’ notes can be extracted and encoded to core-statements and then assigned to categories representing the possible impact dimensions [16]. Finally, the results are sorted and ranked by relevance (counting the references to each category frequency, the content of the category relevance, etc.). The coding and ranking are subjective processes to some extent. However, this can be addressed by making each step transparent and by including a team of researchers in the analysis [17]. In doing so, the results that are gained from the qualitative data collection of different use cases (UC) are comparable. Furthermore, they can be normalized and hence, aggregated to data that have been obtained from other sources (such as surveys or log data).
Once all the data are quantified, the next step is to make them comparable and operable. Normalization could be a way to avoid problems related with multisource values. Our normalization process assumes that; all the managed data is quantified; for each of the measurement sources, it is possible to define an order scale of values; there is a concrete range of valid values for the scope of the evaluation; and, in consequence, it is possible to define an optimal value for the project’s objectives within this range. Considering this, values are normalized using the relative distance from the current measurement to the optimal value. By applying this function to the measures, values are transformed to values within the range [0, 1] not having any unit of reference and the interpretation of the results is simplified. Finally, we want to signal that this normalization process makes the raw data comparable and operable. In consequence, aggregations can be applied to a set of these.
One difference between CA and TA data is that CA data is event-driven data, while TA data is time-driven data. Event-driven data means that the data are obtained during an event, which happens at a point of time. Time-driven data are obtained through the time, their values can change with time, and their metrics need to include the time interval in the definition of the measurement units to make sense. This means that for making TA and CA normalized values comparable and operable, the interval of time considering the TA data must correspond to the time interval (ti, ti + 1) between the point before and after the evaluation.
After normalizing the data, we have to deal with the issue of having a huge quantity of measurements (answer to questions, data from logs, etc.), which must be mapped to the project objectives in order to determine their achievement. Moreover, as we previously introduced, we consider that F4W objectives 1–3 are composed of the impact dimensions (ID). In consequence, we need to first map the measurements to ID and then map the ID to the project objectives.
Similarly, as the framework’s tools are thought to measure specific issues of the IDs, their measurement results are going to contribute differently to the measurements of the IDs. Additionally, a final fact to be considered is that the maturity of the artefacts under evaluation is going to determine whether some tools can be used. In consequence, the transformation method also has to consider this. In other words, we need to be able to transform normalized data into ID measurements and then into objective achievement measurements that are able to consider different levels of contributions from the raw data to the ID measurements and from ID measurements to objective measurements.
Figure 2 summarizes what we exposed in the previous paragraph. For simplicity, it does not include all the connections between the ID and the objectives or between the measures and the ID. It can be observed that the method that we use for measuring the achievement of the objectives is going to create trees of relationships, of hierarchical relations, between the objectives and the raw data measurements. In each of these trees, one per objective, the root is the objective, the intermediate nodes are the ID measurements, and the leaves are the individual measurements.
The link between all them will be the function we apply for transforming the data from each level to the next one. According to what is exposed in the previous paragraphs, this function should be able to model the different influences that the results of the parameters have. Moreover, it would be desirable for the obtained value to be in the range [0, 1]. This feature eases the interpretation of the results, as we explained in a previous chapter. Finally, the obtained results must be interpreted. For interpreting the results, they must consider both the IA results and the validation results, as the latter provide the context of the interpretation.

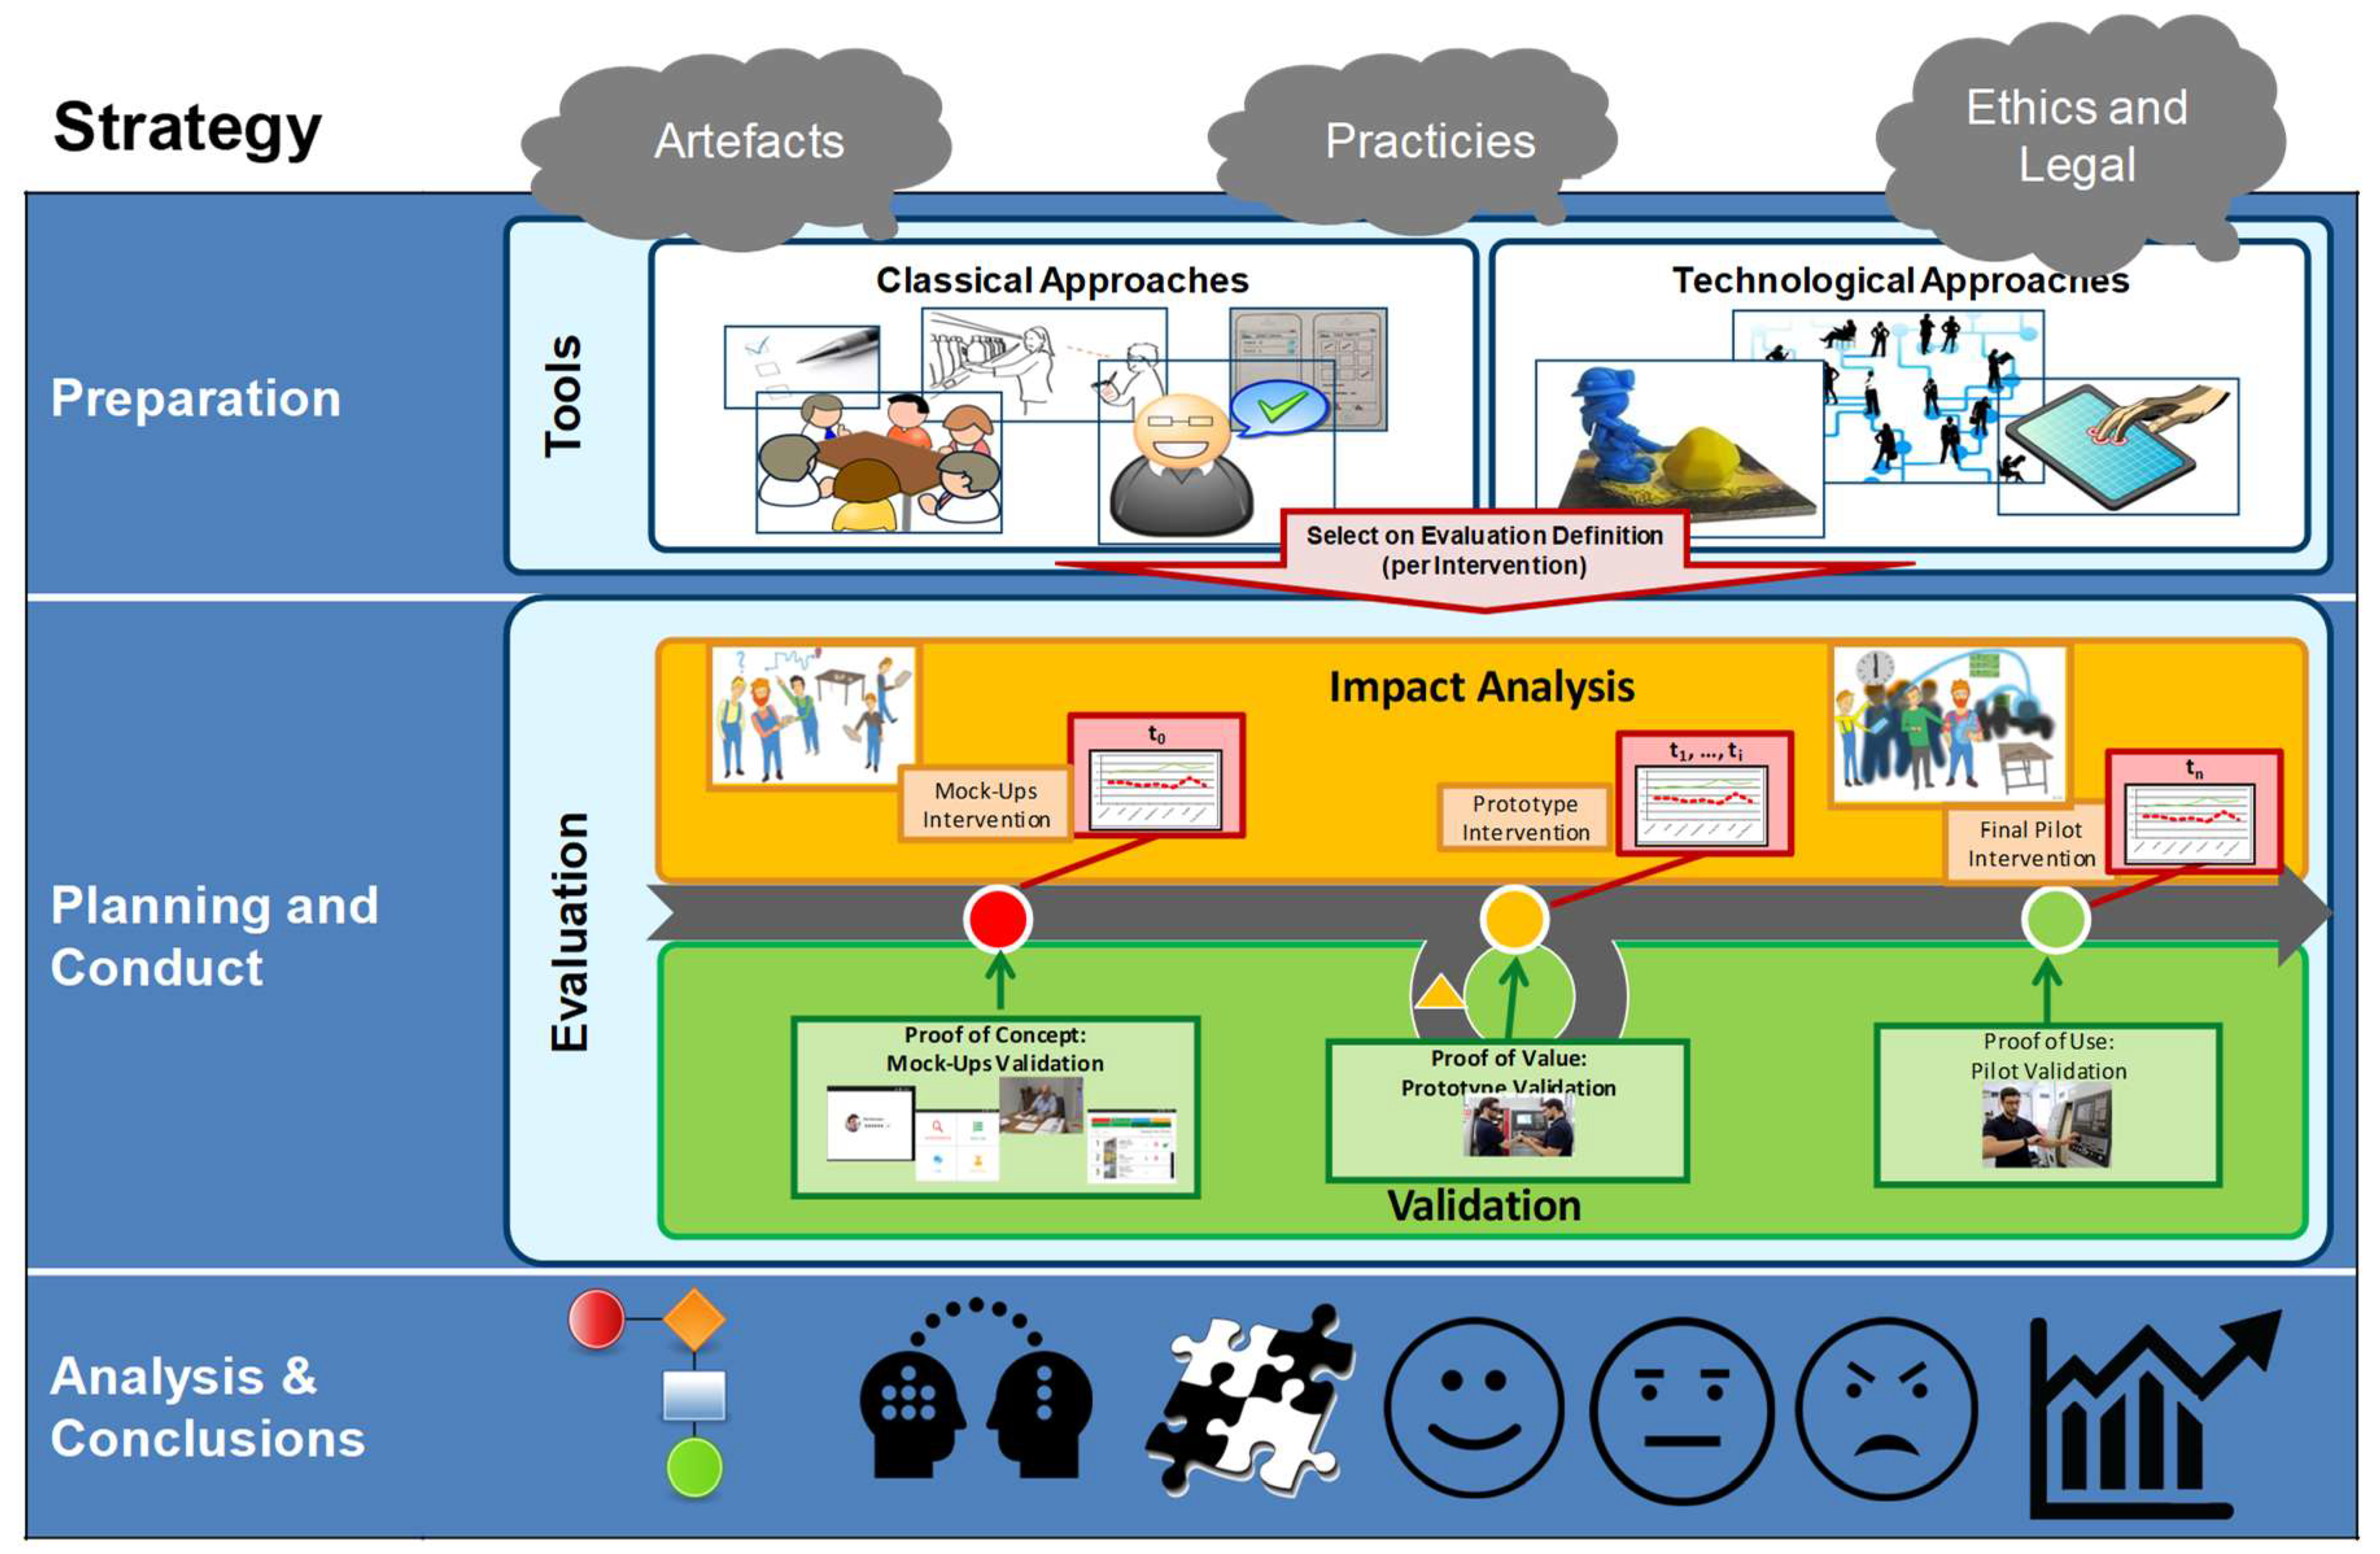
2.1.2. F4W Evaluation Strategy

The framework and the strategy (see Figure 3) were tested last year (2017) when the first prototypes of the solutions were deployed [8]. An example of using the results is presented in [18]. This paper uses the results of the evaluation performed at an industrial partner and shows how they are used for determining the achievement of the industrial challenge, which is exposed in [19].
From a more general point of view, that is not restricted to the F4W scope, and the final goal of our evaluations is to support the adoption of informed decisions about the next step of a project. After evaluating an intervention, considering the impact achievements, the room for improvement, and the cost of changing the solution, the next step can be determined. Therefore, the F4W Evaluation Framework supports the decision to either stop or continue the project and, in this case, the definition of features to be implemented in order to improve the software prototype.
The strategy we follow for performing longitudinal evaluations of project developments takes the F4W objective’s definition as a starting point. The UCs of the F4W project represent the field of application of all industry partners for the smart factory solution to be developed. They are defined in [20,21], based on the identification of the industrial partner context of use and on the description of the “as-is” and “the should-be” scenarios. The UC definitions include a high level requirements definition and the expected impact of their full implementation. From the high level requirements, the more important software building blocks can be identified and prioritized, their main functionalities can be defined, and the first artifacts can be created and evaluated.
The process described in the previous paragraph is both the starting and the final point of evaluation iterations: because the solution is developed under the perpetual beta philosophy and under agile project management, each release of the software artifacts must be evaluated. Although first and last evaluation iterations are considered special, all the iterations are performed following a three-phase pattern: preparation, execution, and analysis of the result and extraction of conclusions [22].
The maturity of the artifacts to be deployed and the legal frameworks will have an influence on the tools to be used for performing the evaluations. Maturity will also determine whether a before-deployment intervention and after-deployment evaluation are required. Finally, the specific evaluation determines how the results are interpreted.
Before-deployment evaluation is required for all the artifacts, without considering their maturity. The more relevant results are those obtained from the quality validation. These results determine if the quality of the artifacts is sufficient and, in consequence, will support the decision of continuing with the deployment or stopping the next steps, i.e., for mockups, as they provide proof of concept negative results that could mean project cancellation. The impact analysis, which takes place before the intervention, provides a baseline to be used as a reference after the solution is deployed and used for a particular period of time. Additionally, when the impact analysis is performed during the initial development iterations, it provides valuable feedback about the right understanding of the evaluation purpose and the tools used by the workers.
As artifacts mature, the after-deployment evaluations increase their value and are required for the prototypes created. These prototypes provide real functionalities and their usage is going to support the workers with their daily work. This has an effect on their working practices, which makes the impact measurement relevant. The impact is measured by comparing after-deployment results with the before-deployment evaluation. While this comparison could also be made at a project baseline, we recommend performing it for the before-intervention as it will be more isolated from being influenced by external factors (even in the case where their bias can be detected using a control group of workers).
Although the results obtained by quality validation are less relevant than those of the impact analysis for mature artifacts, they still provide high value for supporting the decision of the next steps of a project. These results will suggest changes for improvements of the deployed artifacts, new use of the artifacts, new artifacts, or changes in work practices. Changes in deployed artifacts, new functionalities, and new artifacts can be quoted, and by considering the current impact, it can be decided what to do next in the project.

2.2. Heuristics for Exploring Socio-Technical Systems

A different approach for analyzing systems is the usage of heuristics. While heuristic approaches do not claim to produce perfect “100% solutions”, they offer a pragmatic way to sufficiently identify the most urgent problems with a reasonable amount of effort. The most prominent example for this kind of employing of heuristics is provided by Nielsen’s usability inspection method for evaluating interactive systems [23], and Industry 4.0 scenarios go beyond interactive systems. They feature interdependencies between actors of multiple roles and technology that is characterized by cyber-physical components, autonomy, real-time capabilities, and decentralization. The combination of a networked technical infrastructure and complex interactions between people in various roles constitutes a typical socio-technical setting [24]. It is characterized by intertwining technical components with organizational measures for communication, collaboration, and coordination. Socio-technical systems can only be incompletely described and documented [25] and are a subject of continuous evolution [26].
To evaluate socio-technical systems, the project “Heuristics for the Industry 4.0” has developed a set of heuristics that originate from five different domains: socio-technical design procedures, job re-design, privacy, computer supported cooperative work, human-computer interaction, and process redesign [26]. Based on literature research in these domains, over 170 design recommendations were identified. A group of five experts discussed and clustered these recommendations in three iterations. The resulting clusters were the starting points to formulate an initial set of heuristics that was presented in [27]. To validate and refine this initial set of heuristics, a problem database was built. It contains over 370 problems from 17 real world UCs (status in October 2018) that occurred during the implementation and operation of sociotechnical systems, like smart factory solutions.
We suggest that Industry 4.0 systems are an appropriate domain for such a heuristic-based analysis. The refined set consists of the following eight heuristics (More details and examples at http://heuristics.iaw.rub.de).
#1
Visibility and feedback about task handling success. Focused information is continuously offered about the progress of technical processes and as far as permitted about collaborative workflows. This helps us to understand what further steps are possible or not possible and why, and how far the expectations of others are met;
#2
Flexibility for variable task handling, leading to a participatory evolution of the system. One can vary manifold options of task handling and can flexibly decide about technology usage, time management, sharing of tasks, etc. Consequently, one can develop a wide range of competences that support participation in the ongoing evolution of the whole system;
#3
Communication support for task handling and social interaction. By technical and spatial support for communication, one can be reached to an influenceable extent for purposes of task handling and coordination This support is intertwined with negotiating duties and rights of roles, including values, so that reciprocal reliability can be developed;
#4
Purpose orientated information exchange for facilitating mental work. To support task handling, information is purposefully exchanged via technical means, updated, and kept available and minimized. This implies the technical linking of information and the emergence of personal profiles that must be visible and a subject of privacy-related self-determination;
#5
Balance between effort and benefit experienced by organizational structuring of tasks. Tasks being assigned to people are pooled, and technically supported in a way that they make sense and provide fun. They comply with individual technical, social, and physical competences and support health. These measures aim at the sustainable balancing of efforts and benefits;
#6
Compatibility between requirements, development of competences, and the system’s features. Technical and organizational features of the system are continuously adjusted to each other. Within clarified limits, they meet the requirements from outside in a way that is based on the development of competencies and proactive help for dealing with varying challenges;
#7
Efficient organization of task handling for holistic goals. Through appropriate sequencing, tailoring, and distribution of tasks between humans and technology seamless collaboration is supported. Unnecessary steps or a waste of resources are avoided. An increase of efficiency can be realized if needed;
#8
Supportive technology and resources for productive and flawless work. Technology and further resources support work and collaboration by taking the intertwining of criteria into account, such as technology acceptance, usability, and accessibility for different users, avoiding consequences of mistakes and misuse, security, and constant updating.
Each of the eight heuristics addresses a significant aspect of socio-technical system design. It is to be noted that fulfilling the heuristics is not trivial, because a system’s design decisions may have contrary effects regarding different heuristics. For example, an assistance system at a manufacturing workplace that is very strict and gives a strong guidance to the worker, provides good support in regard to heuristic 8 (Supportive technology and prevention of errors), but decreases the worker’s flexibility (heuristic 2). When using the heuristics, the goal is to find balanced solutions that are suitable for the situation at hand. Considering the heuristics in system design decreases the probability of the occurrence of severe system flaws. The heuristics can be applied either to observations made in concrete industrial plants, to models of Industry 4.0 solutions, to interviews that are run with experts who know the solution, or to a combination of these possibilities.

3. Smart Factory Workplace Solution

In the F4W project, four smart factory industrial challenges (IC) prevail in order to demonstrate and evaluate applications of assistive technologies that are developed by perpetual beta principles. These ICs are: Personalized Augmented Operator; Worked-centric Rich-media Knowledge Sharing; Self-learning Manufacturing Workplaces; and In-situ Mobile Learning in the Production. These ICs are described in [28] and try to advance the transformation of shop-floor workers to knowledge shop-floor workers able to adapt to the evolving conditions of today and future production-related tasks.
To materialize these requirements, for each industrial partner, we identified cases of representative uses considering their relationship with each of the ICs, and ensured that the results of the project were representative of the greatest possible number of production methods and areas of knowledge of the plants (operators, maintenance, quality, etc.). A detailed explanation of each of the UCs, the context of the IPs, and the expected impact of their full implementation on workers and organizations can be found in [21,22].
Because of the number of UCs (eight), four of them where selected as the main implementations of each of the ICs. The rest of the UCs represent second implementations which take advantage of the features of the first implementations and show the possibility to extend them and the expected results to several contexts-of-use of both FACTS4WORKERS IPs and other industrial contexts. Interested readers can take a look at [29].
In this paper, we present the solution deployed at Hidria for advancing the IC self-learning manufacturing workplaces and evaluate it using two different approaches.

3.1. Industrial Challenge Self-Learning Manufacturing Workplaces

This industrial challenge envisions creating a shop floor prototype solution applied directly to a particular manufacturing line with either a product, resource, or process data integration system that will monitor a combination of process or machine parameters. This self-learning manufacturing workplace should provide proactive, predictive decision support to shop floor workers. This should be established by extracting patterns of successful production processes and linking heterogeneous information sources from workers’ environment and beyond [30].
By implementing advanced IT solutions, IoT technologies and knowledge management procedures serve many possibilities for making the production more successful. A concrete advantage is the creation of self-learning manufacturing workplaces. With the utilization of manufacturing operation data, companies are able to, e.g., conduct predictive maintenance and machine assisted decision making for calibrations that allow the reduction of process-based or setup-based disruptions in order to maintain a smooth workflow. Hidria, an automotive supplier, takes over the role of a forerunner in this industrial challenge, where disparate data sources are linked to realize novel decision supporting tools to enable continuous optimization of the manufacturing process [31].

3.2. Case Vignette Hidria

Hidria is a Slovenian supplier of the automotive industry, to which the company delivers critical components. The production and assembly lines are characterized by a fast production rate and consist of many complex operations. A difficult machine setup and many complex fault conditions lead to lengthy solution findings, which are very dependent on the experience of the workers. The information is scattered and difficult to access and maintenance is only event-driven. The F4W project aims to improve knowledge management regarding problem solving and problem prevention. Workers will have fast access to relevant information and more effective collaboration with peers to produce a shared approach to arising problems. This should enable them to carry out more maintenance work themselves and prevent machine stops. The production data will be used to analyse and predict upcoming fault conditions in order to prevent them.

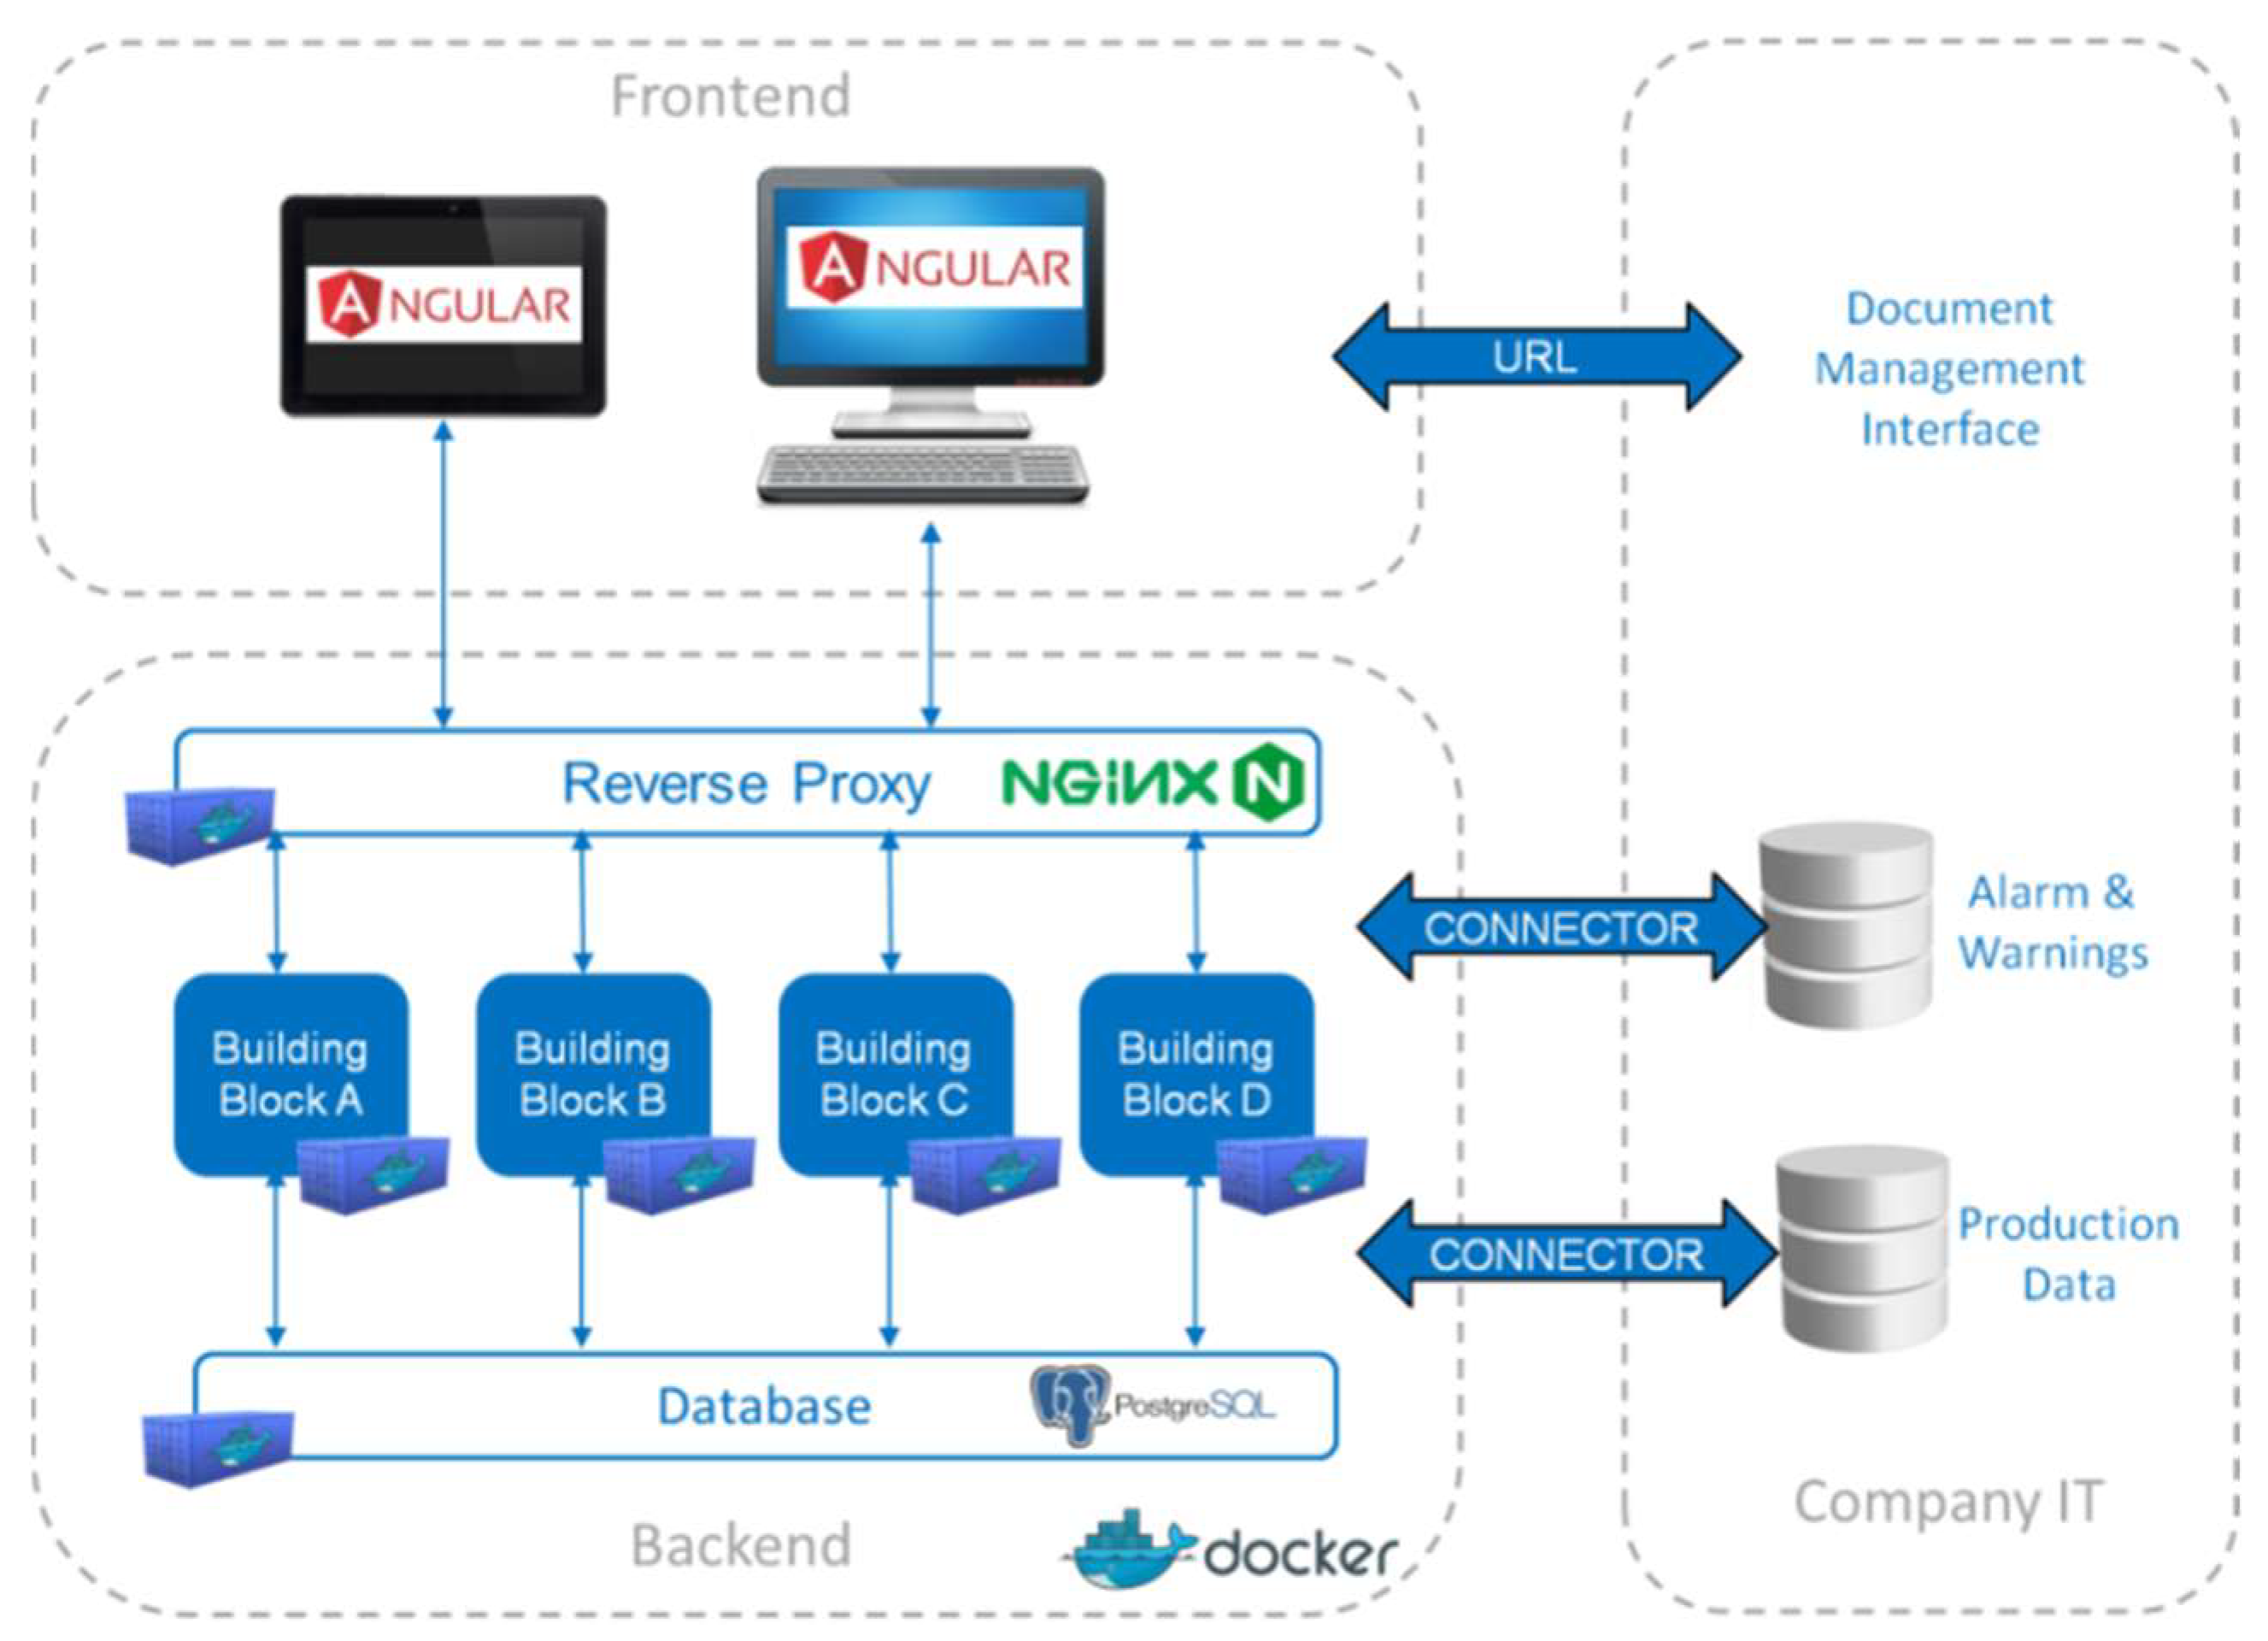
3.3. Technological Approach

The F4W solution provides a wide range of functionalities supporting workers in different processes on the shop floor. Therefore, different technologies, frameworks, and programming languages are used within the project. The whole software architecture shown in Figure 4 is built with the application build and deployment tool Docker, which allows the whole system to be split into smaller building blocks. This approach permits the development of each of the building blocks separately and facilitates the reuse and integration of externally developed building blocks.
At Hidria, the mark-up language HTML5 and the framework Angular are used in combination for the frontend building blocks. The backend building blocks are created using various frameworks, depending on the functionalities requested. For communication and exchange of data between the different building blocks, REST APIs are used and an NGINX reverse proxy is implemented. Data of geometrical measurements and the alarms and warnings will be queried from the company’s database using a specific adapter. The data will be stored in the F4W database, implemented with PostgreSQL, and accessible to all the backend building blocks. The company’s document management is linked with the F4W solution by a URL.

3.4. The F4W Solution at Hidria

The F4W solution aims to support different workers at Hidria (machine operators, team leaders, and maintenance workers). Depending on the role of the workers, the solution provides information for solving problems occurring during the production, during the set-up of new products, or during maintenance operations. Workers can modify the solutions provided in order to improve them.
The solution is used by employing a tablet directly at the workplace. After log in, workers receive contextualized access to functions described in the next chapters.

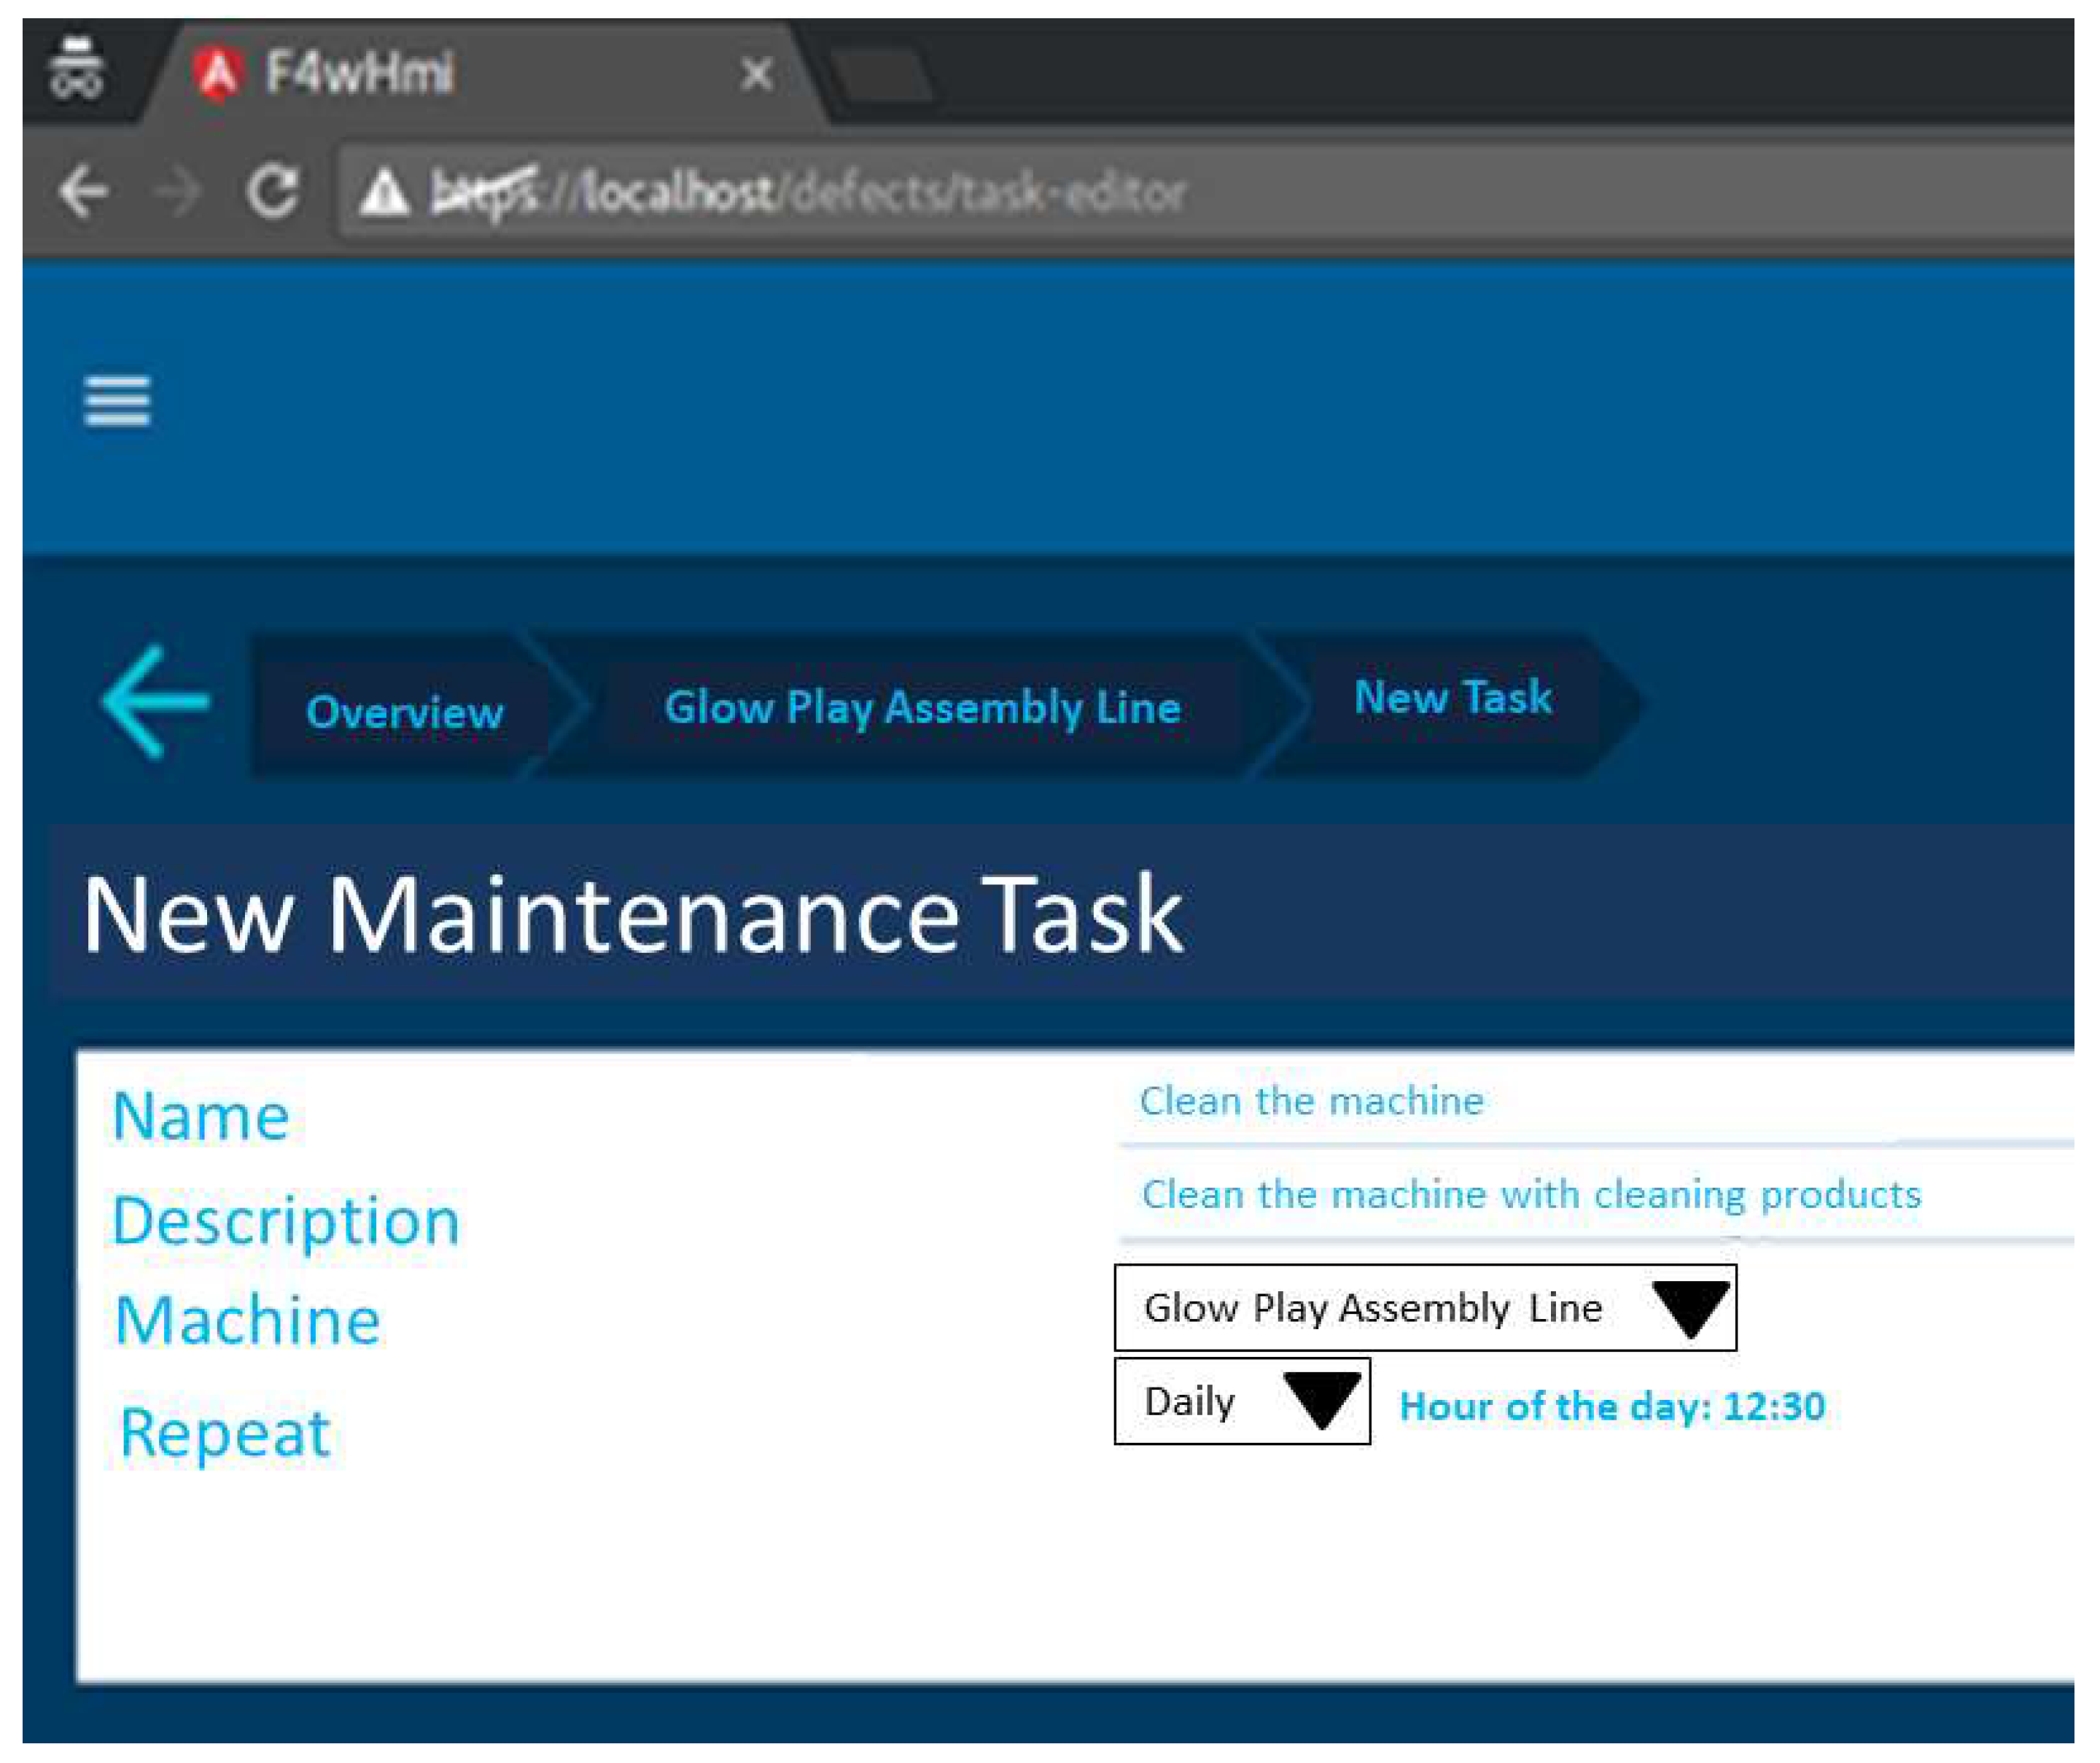
3.4.1. Maintenance Scheduling

The maintenance leader defines the periodic tasks that must be carried out by the operator to support a preventive maintenance plan. The building block Job Scheduler manages the scheduled events that are stored in the F4W database and can be submitted to workers based on a predefined list. Operations and instructions are available on the tablet of the worker. Figure 5 shows the screen for creating new maintenance tasks.

3.4.2. Defects and Solutions

For each alarm, warning, and maintenance action, the worker can access a database of possible actions (solutions) to cope with the current issue. The Defects and Solutions building block creates a relation between a defect and an already-tested solution. It is possible to access all the tested solutions for a specific defect, add new defects and solutions, and create a report. The actions will be explained using peer-to-peer comments, videos, photos, and audio tracks. These file uploads are handled by a Multimedia Management building block. The general approach is to share workers’ knowledge for easier and faster problem solving. The user-generated content can be rated by the other peers with the Content Rating building block. This helps to increase the quality of the material provided and to prioritize the search results.

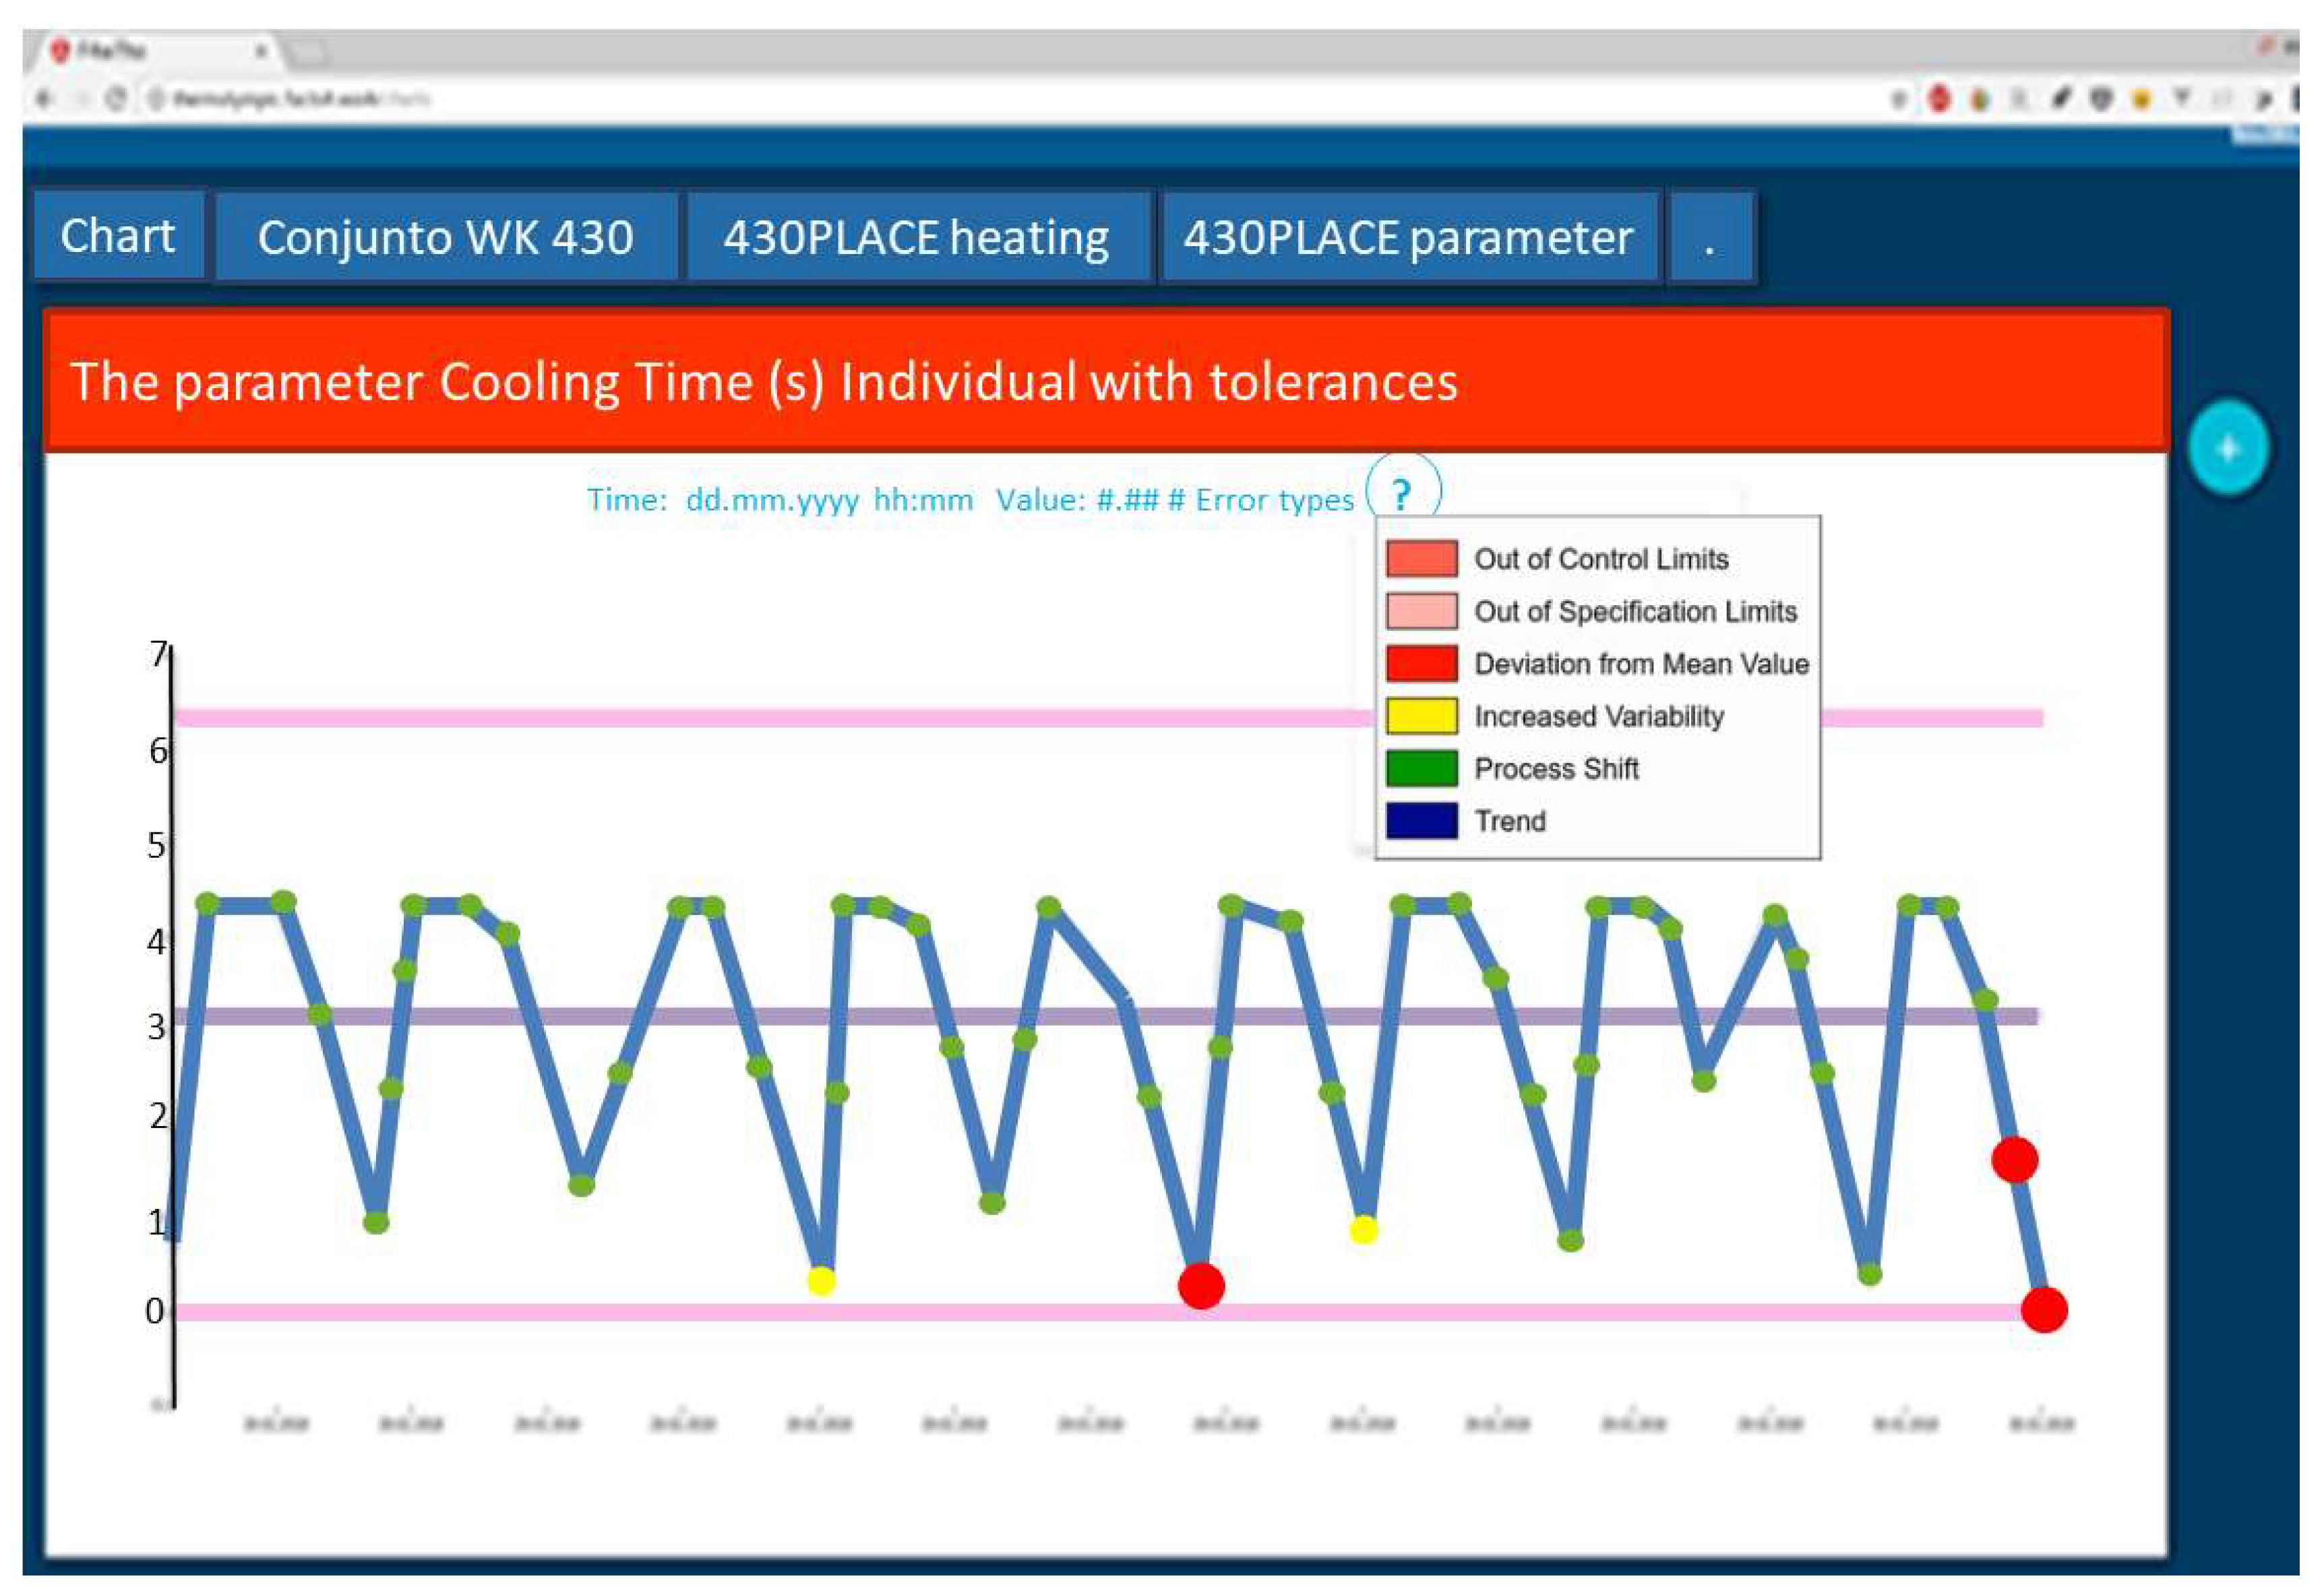
3.4.3. Digital Data Visualization

The data regarding the machine setup, operation manuals, description of operation, machine layout, etc., will be available on the tablet of the worker, thanks to the remote access to the repository of the documents. The building block Machine Status, accessible through the screen shown in Figure 6, acquires and shows the status of many machines and allows the real-time monitoring of overall production.

3.4.4. Trend Analysis

The digital data collected by the machine (measurements, production rate, etc.) will be analyzed and graphically represented. The building block Control Charts enables the workers to define a specific trend analysis of production data. Figure 7 shows an example of the data visualization screen. The data source and metrics can be easily defined by every worker. With their own analysis template, they can analyse production data in real-time and therefore support the decision-making process.

4. Results and Discussion

The system was tested by the technologist of the line, who is a sort of shift leader, and the two shift workers. For testing the solution, a convertible (add-on keyboard) was selected by Hidria.
The evaluation executed at Hidria considered the prototypes implementing the solution of a UC covering two scenarios: “Automated fault prediction and guided checking procedures” and “Shared documents and integrated human-machine information” [14]. To allow maximal flexibility for the workers, the software was deployed locally and made available by tablets. In this way, the workers could record the information at any place and time. The intervention was carried out in April and June 2017 and comprised two rounds of data collection.

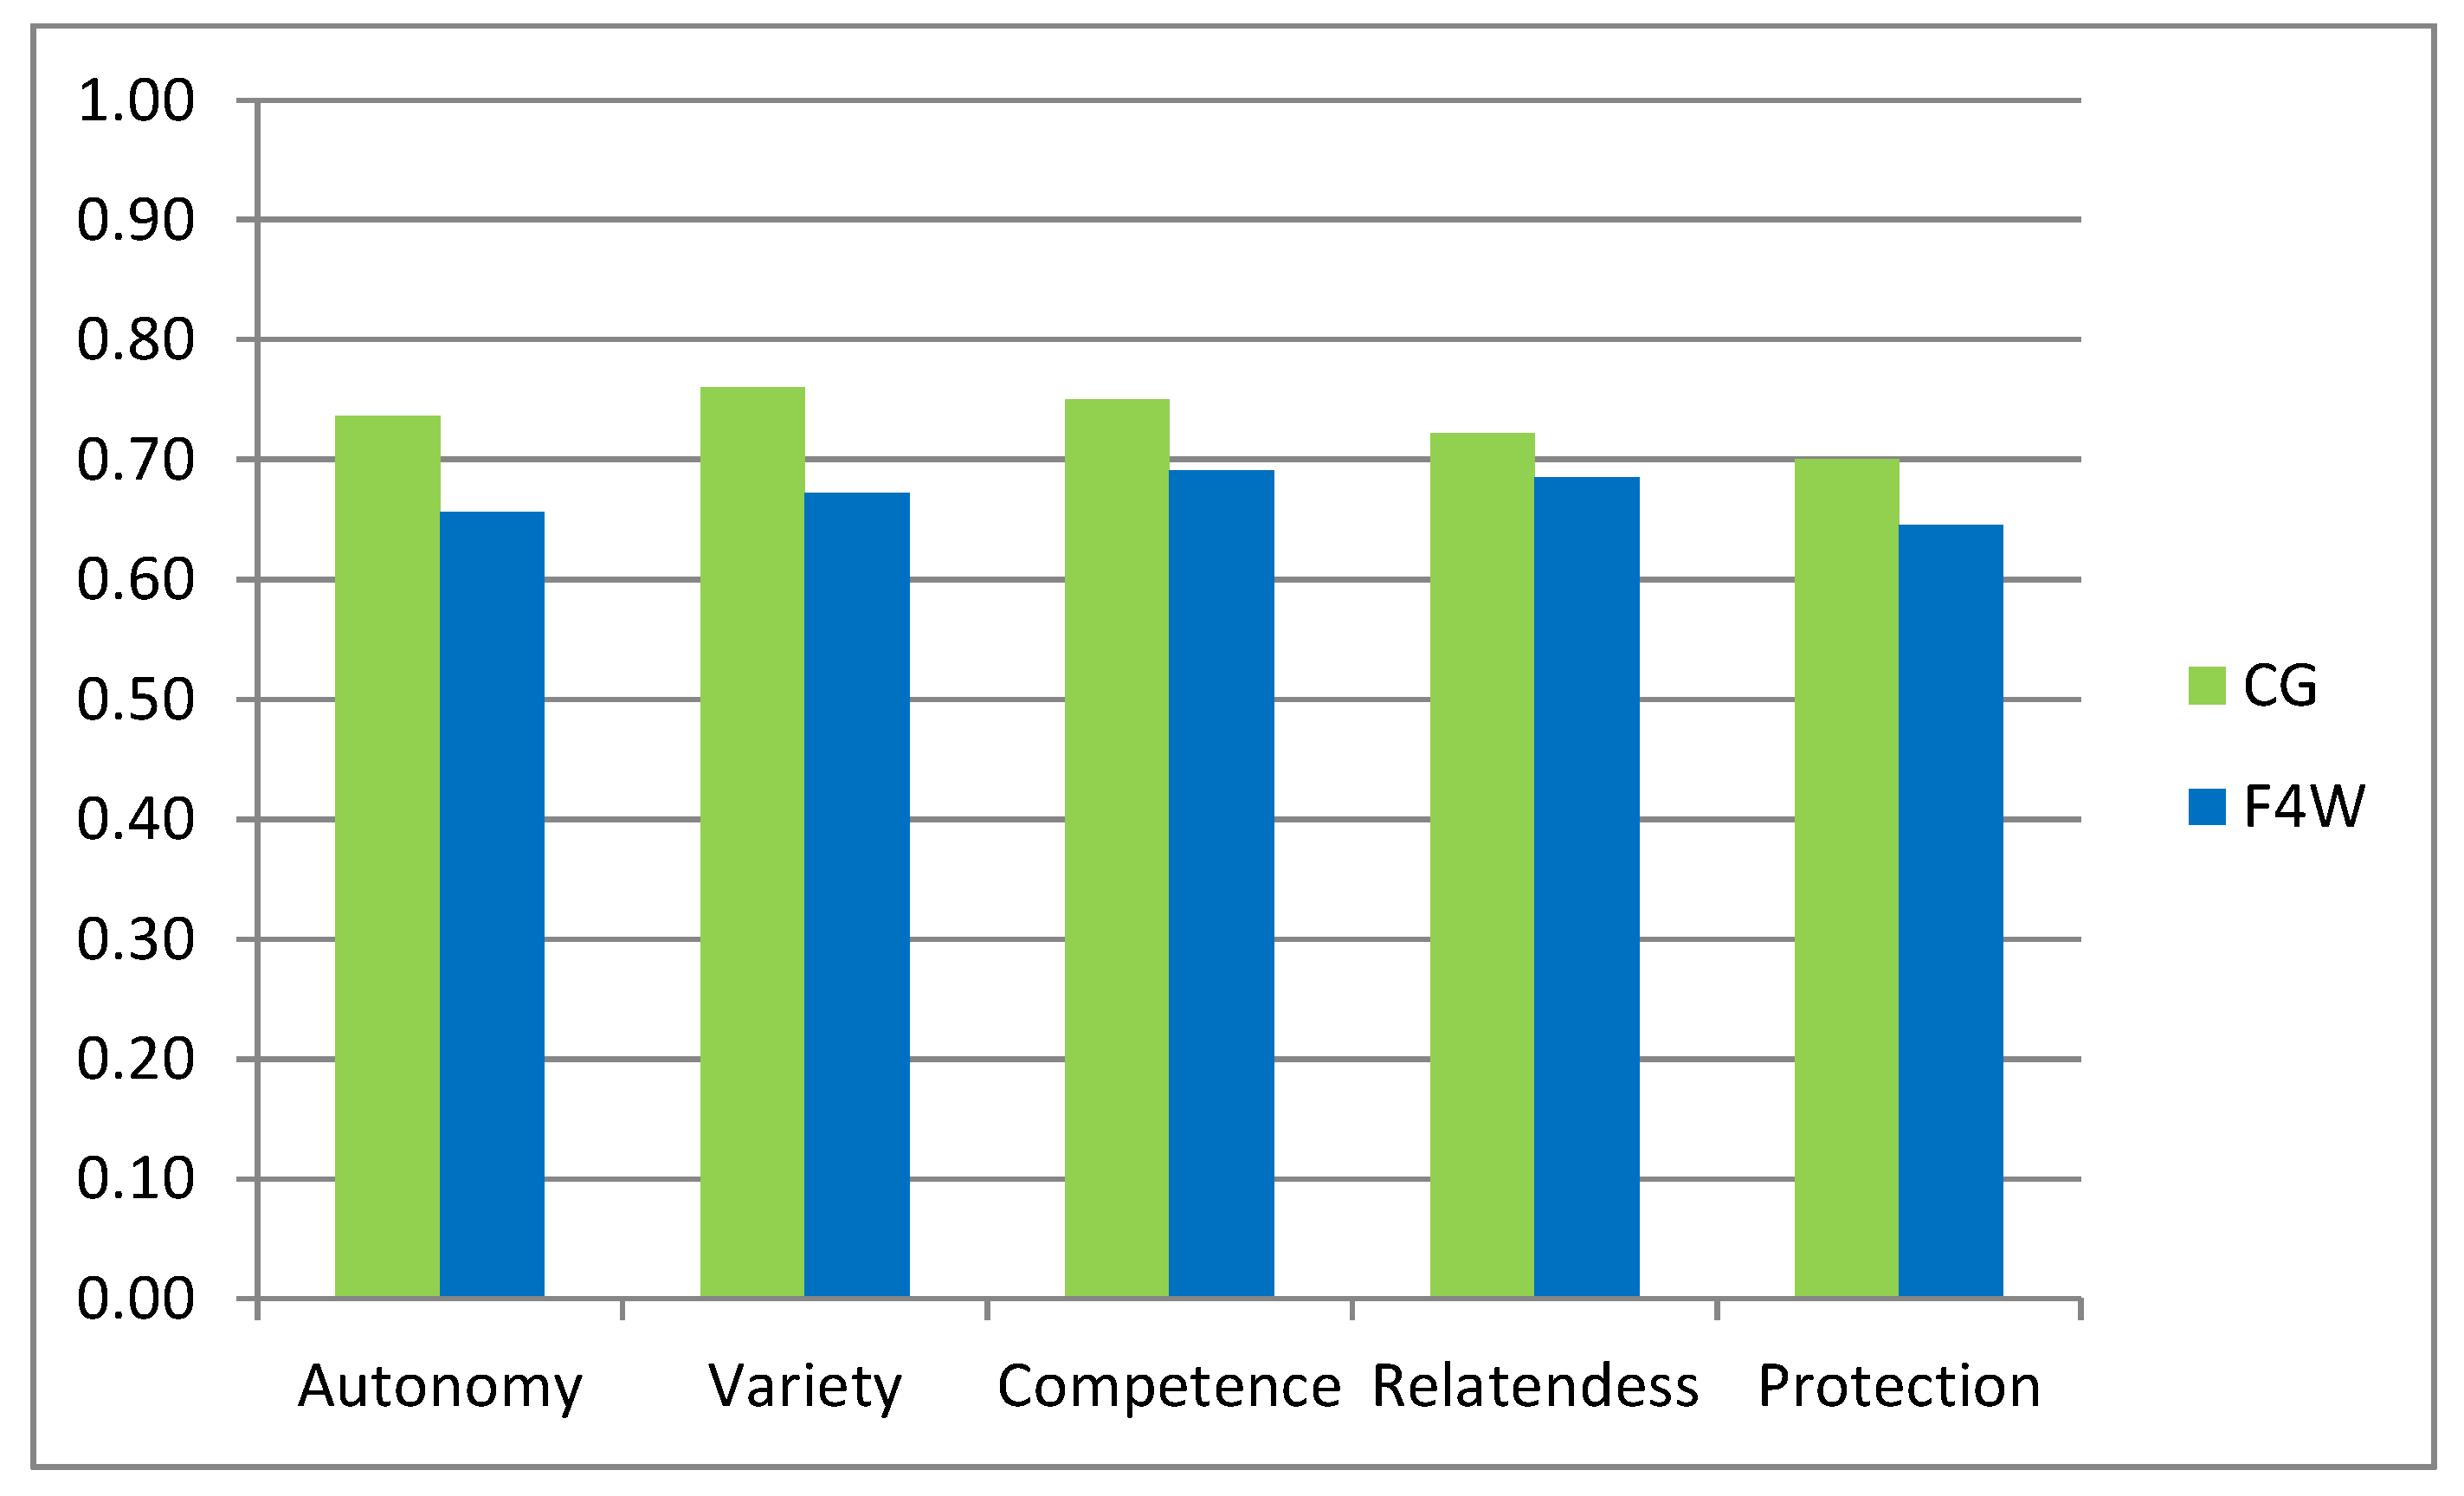
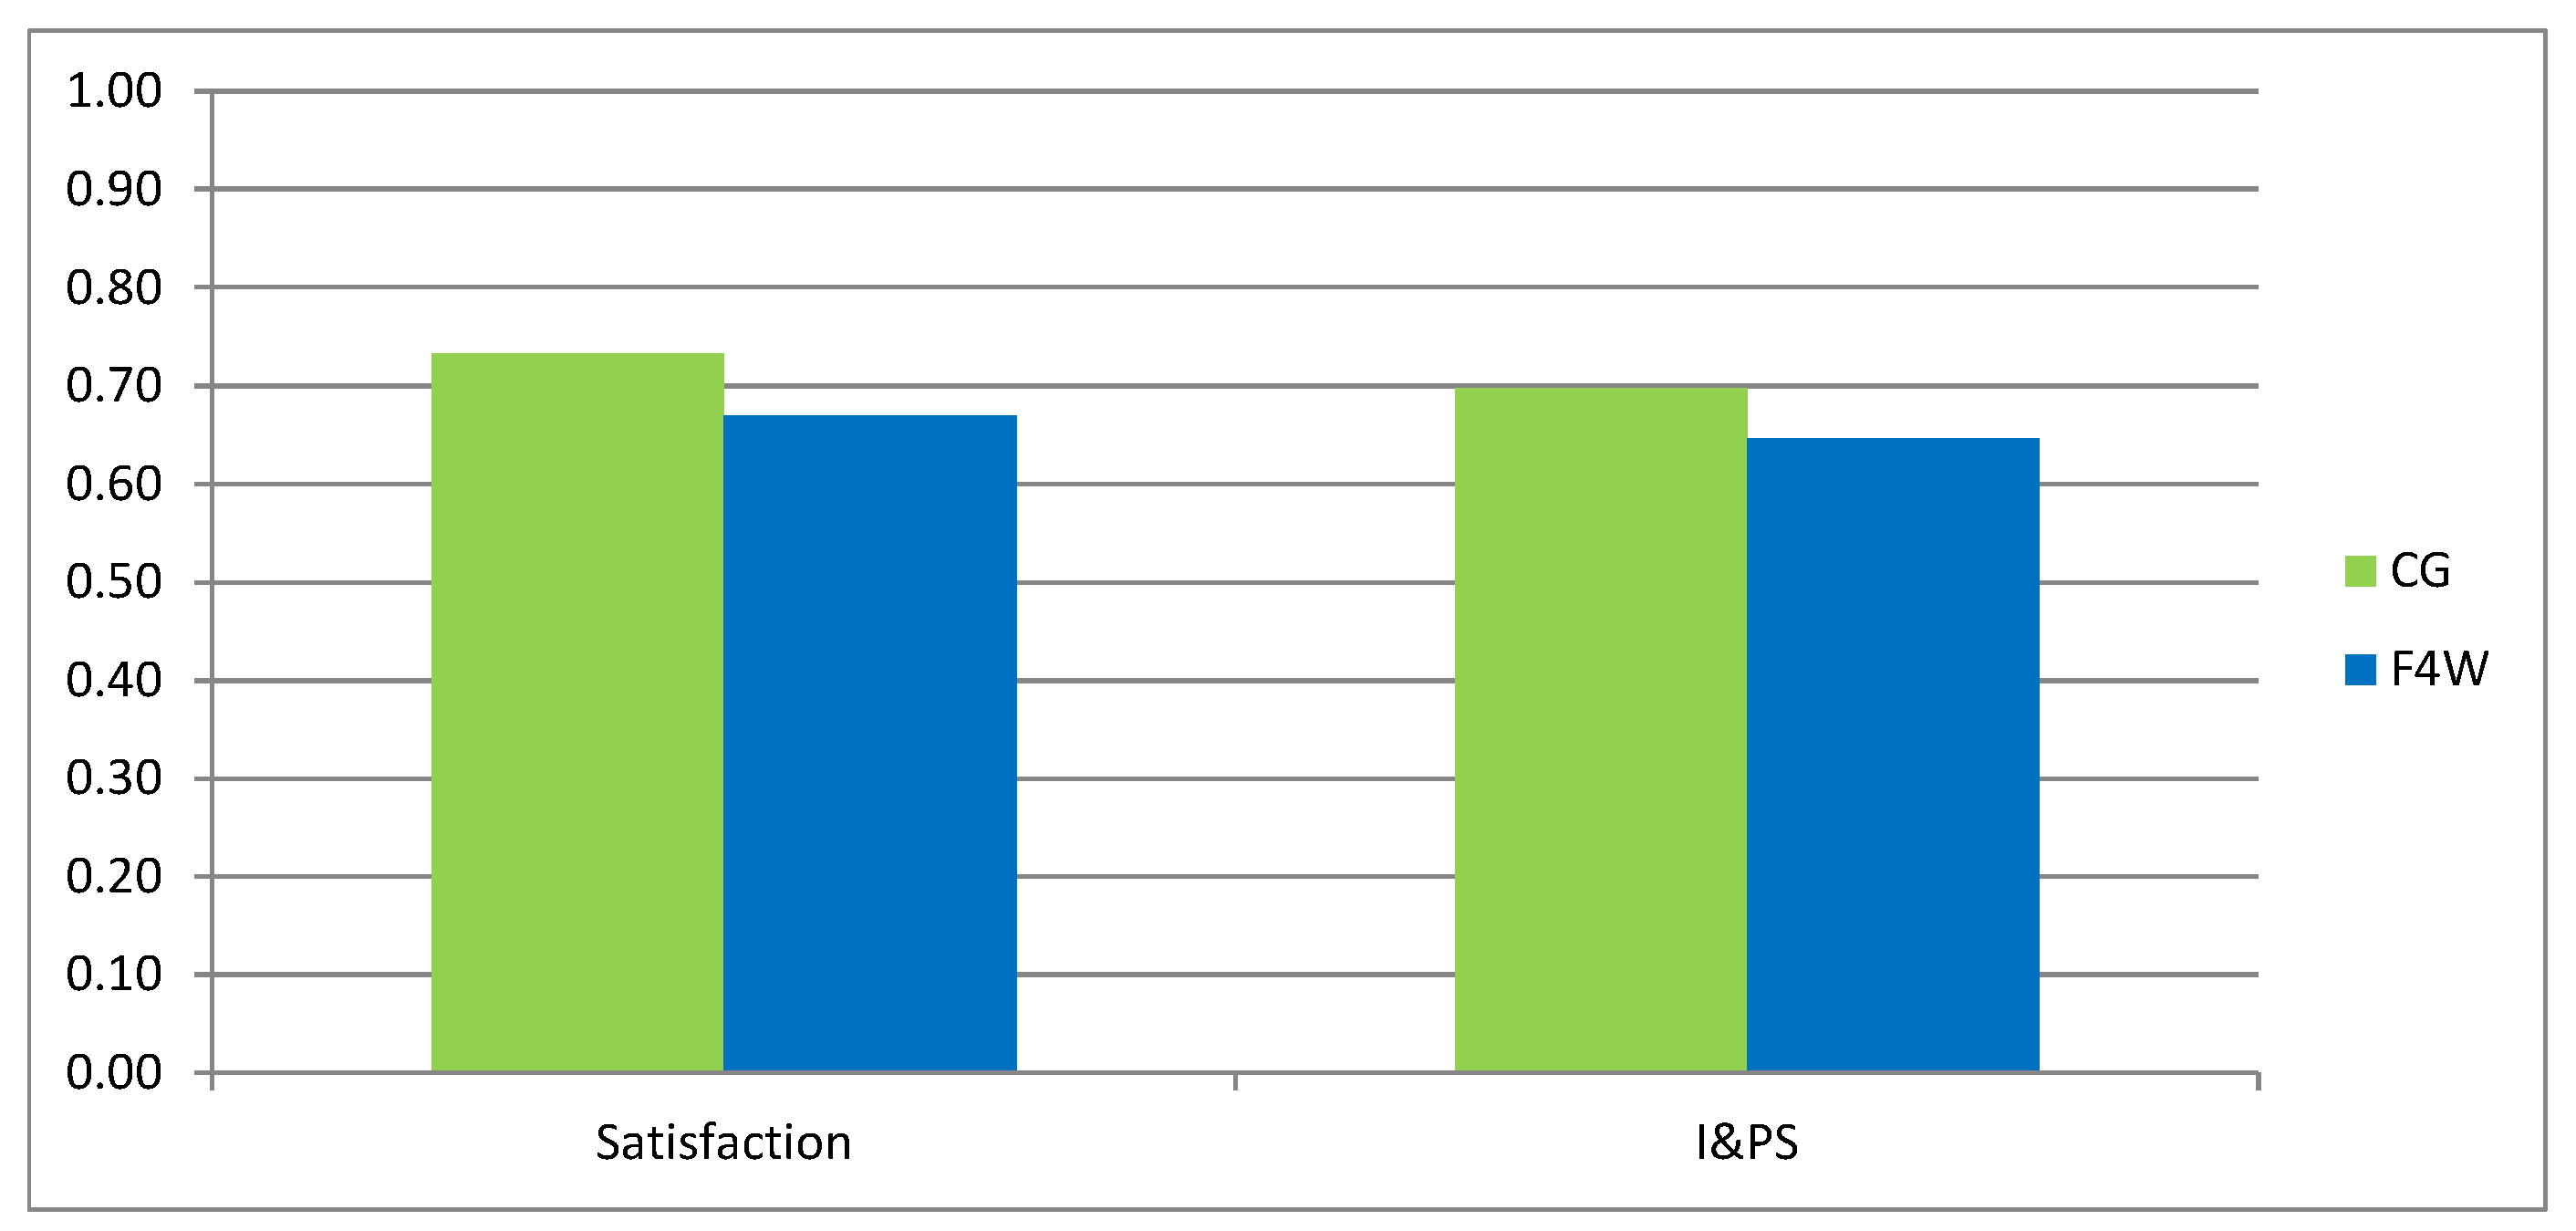
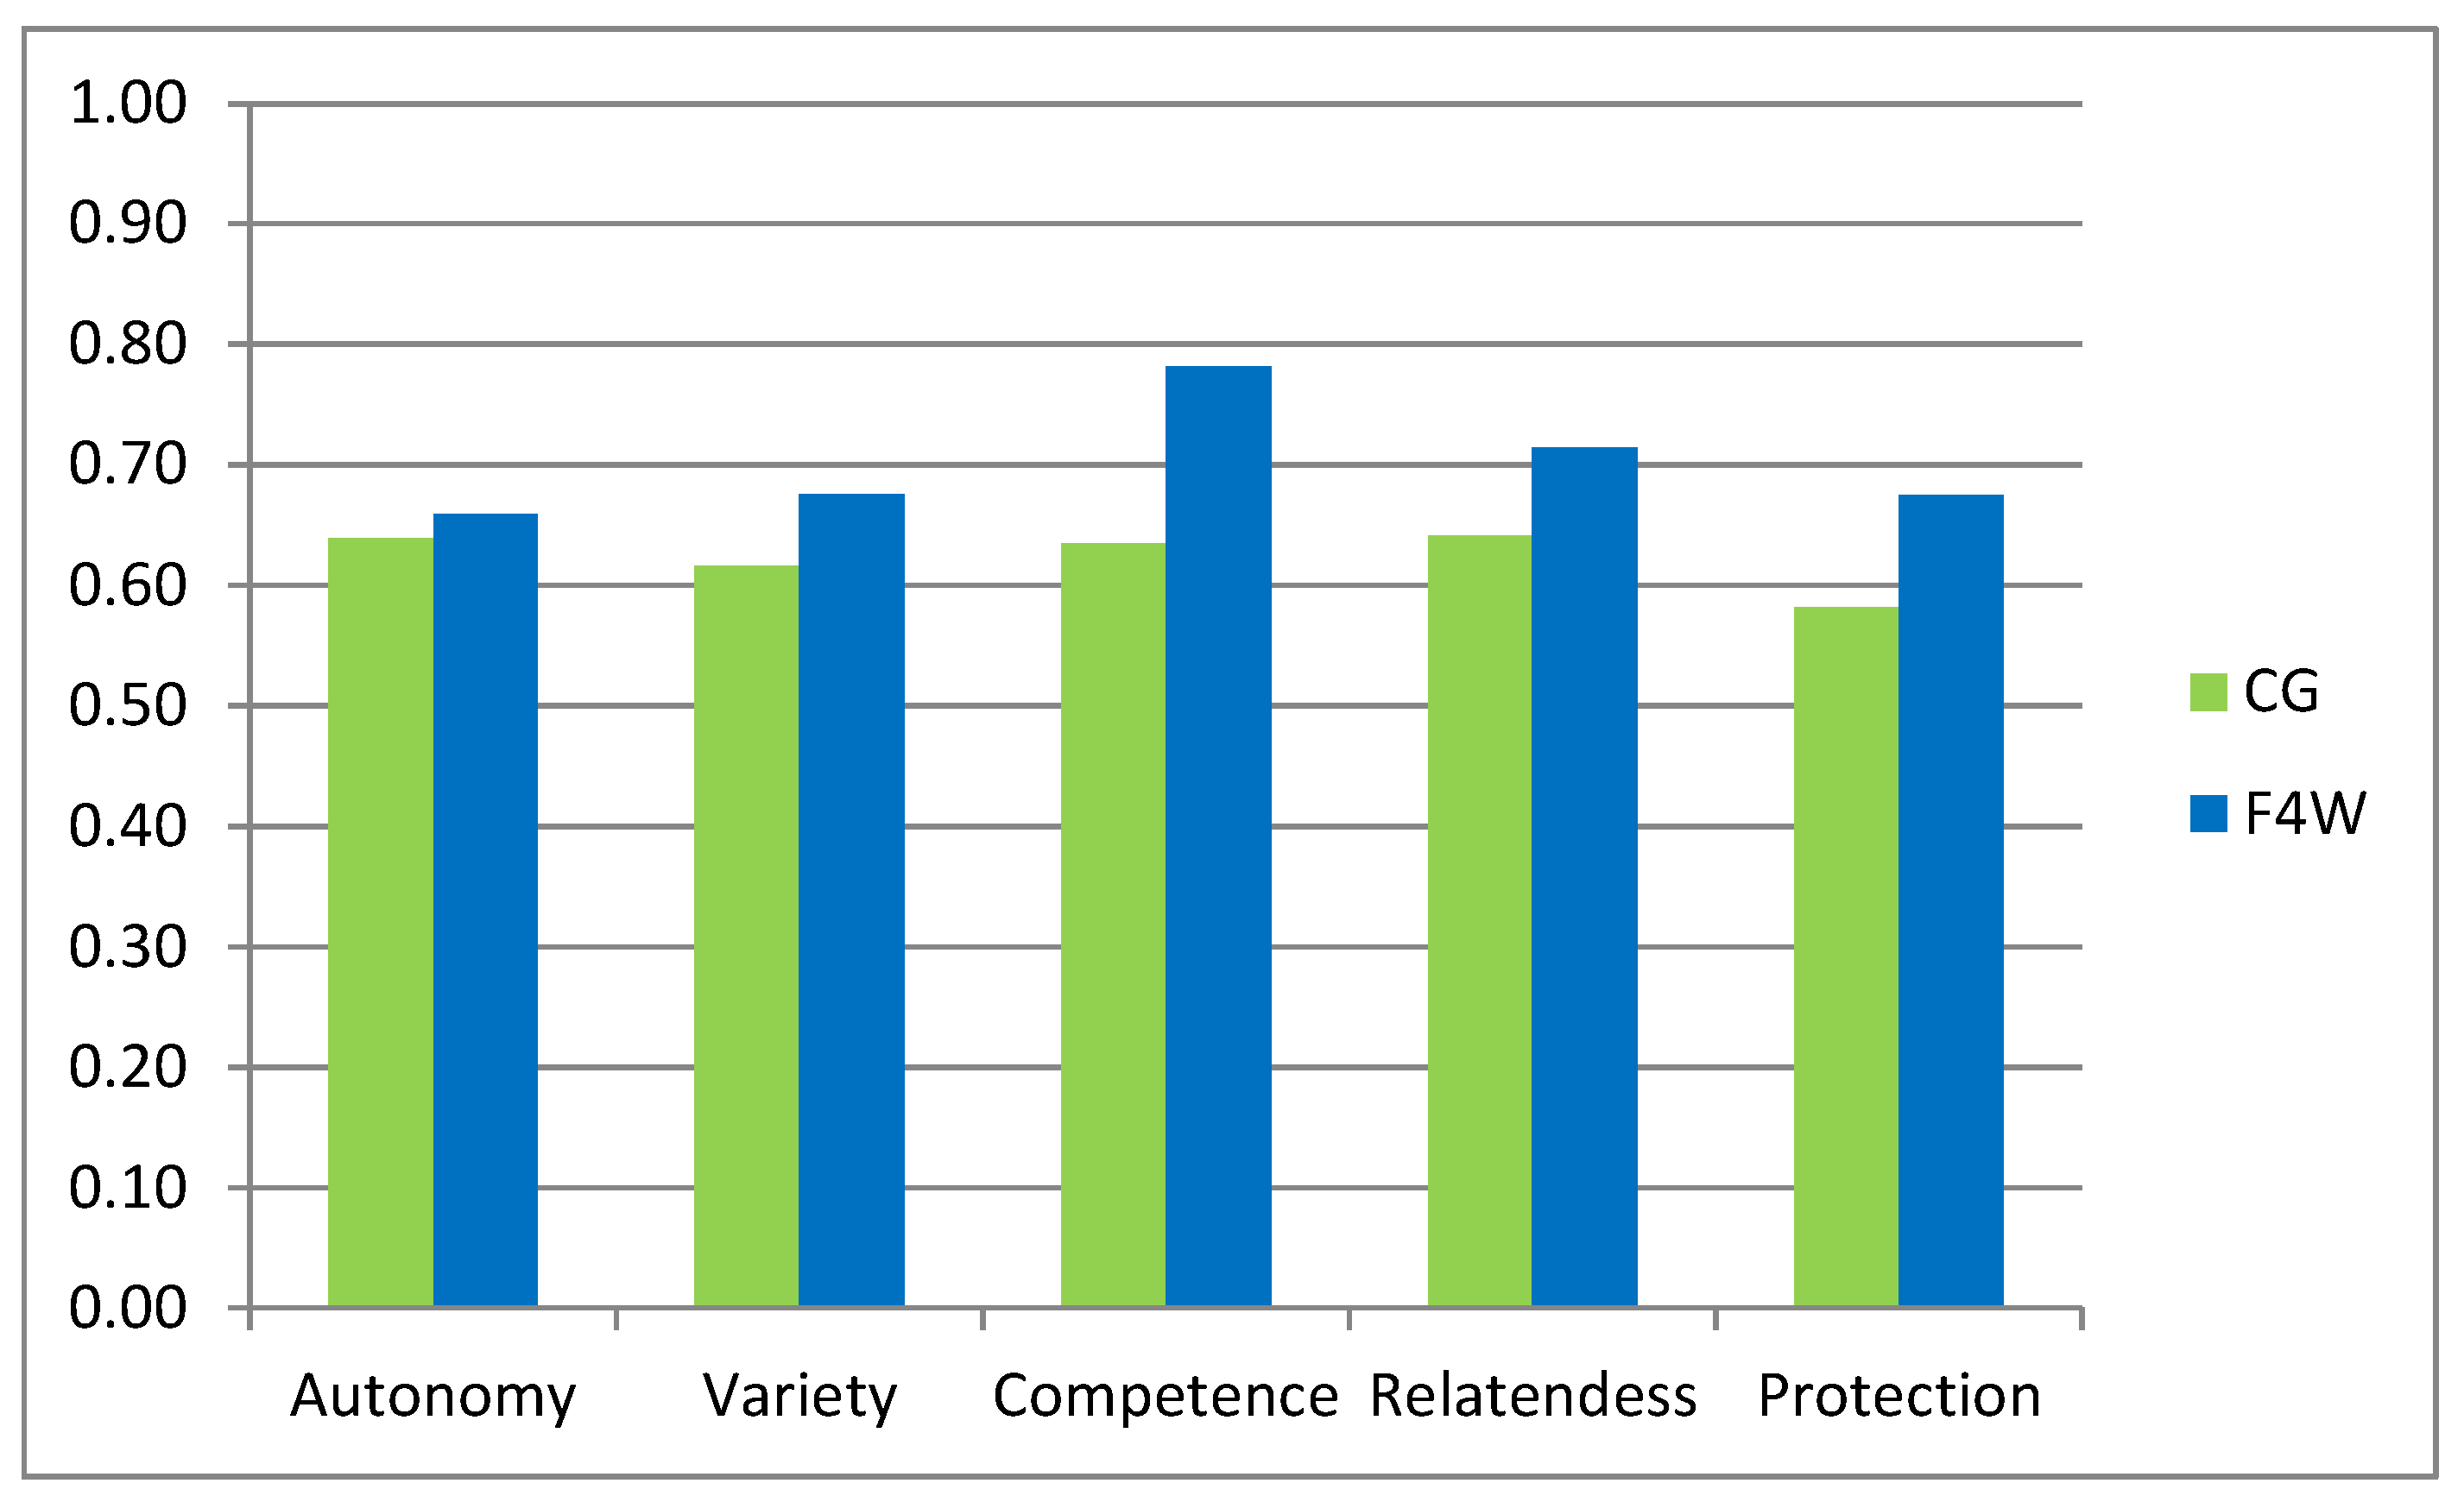
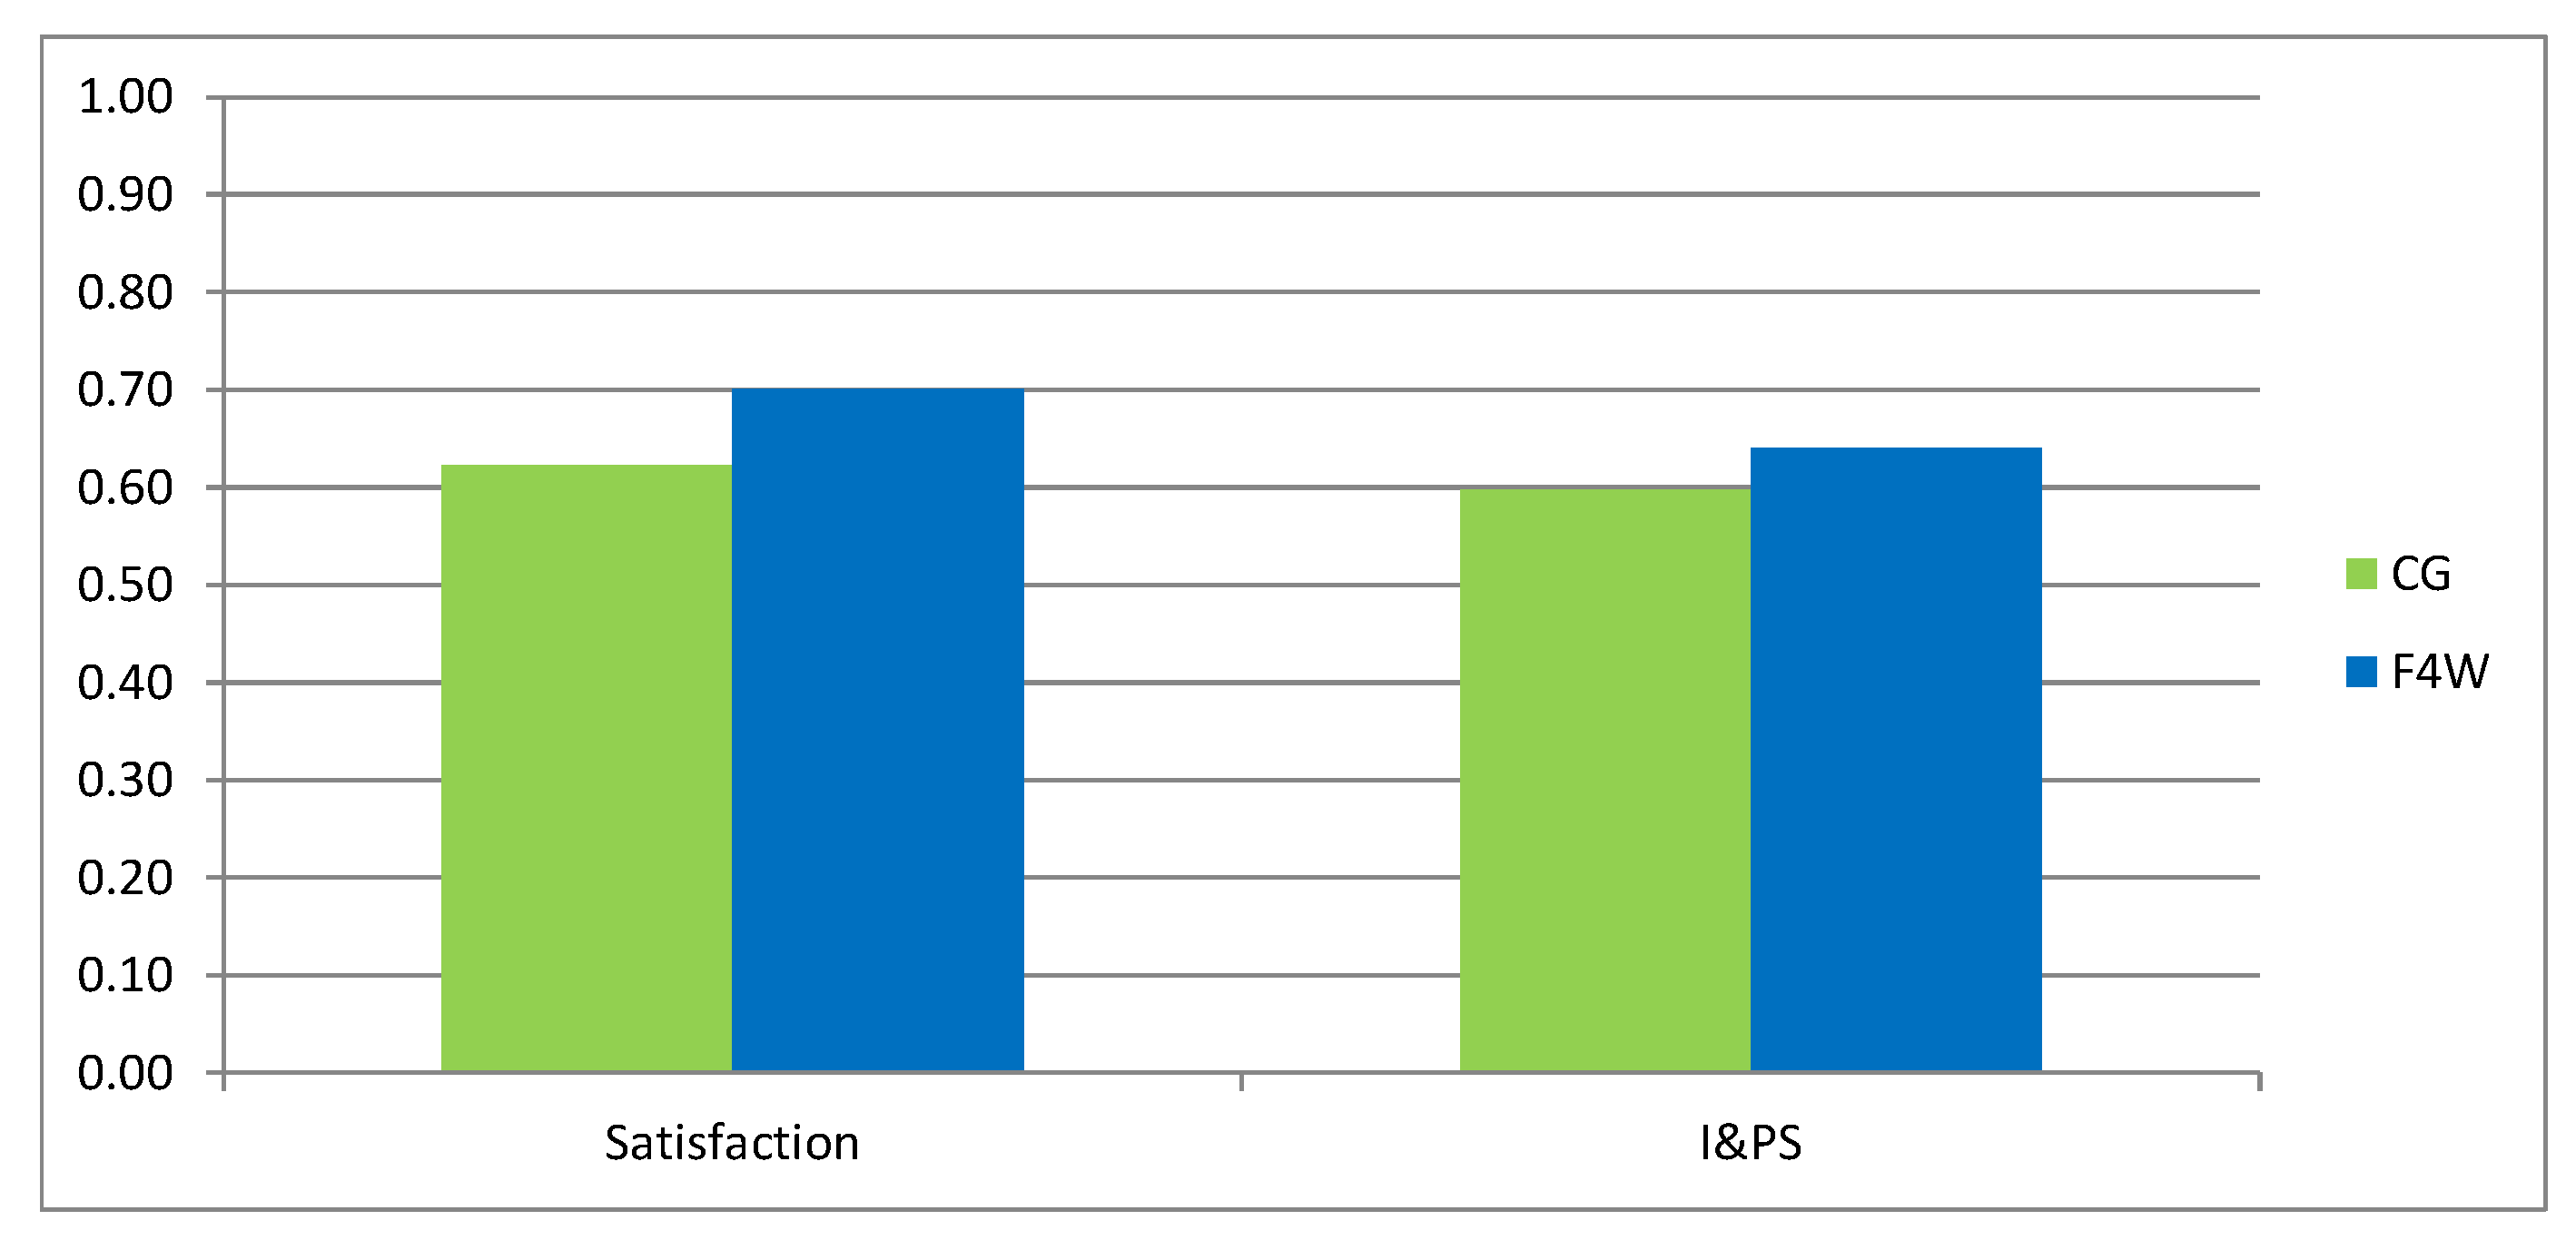
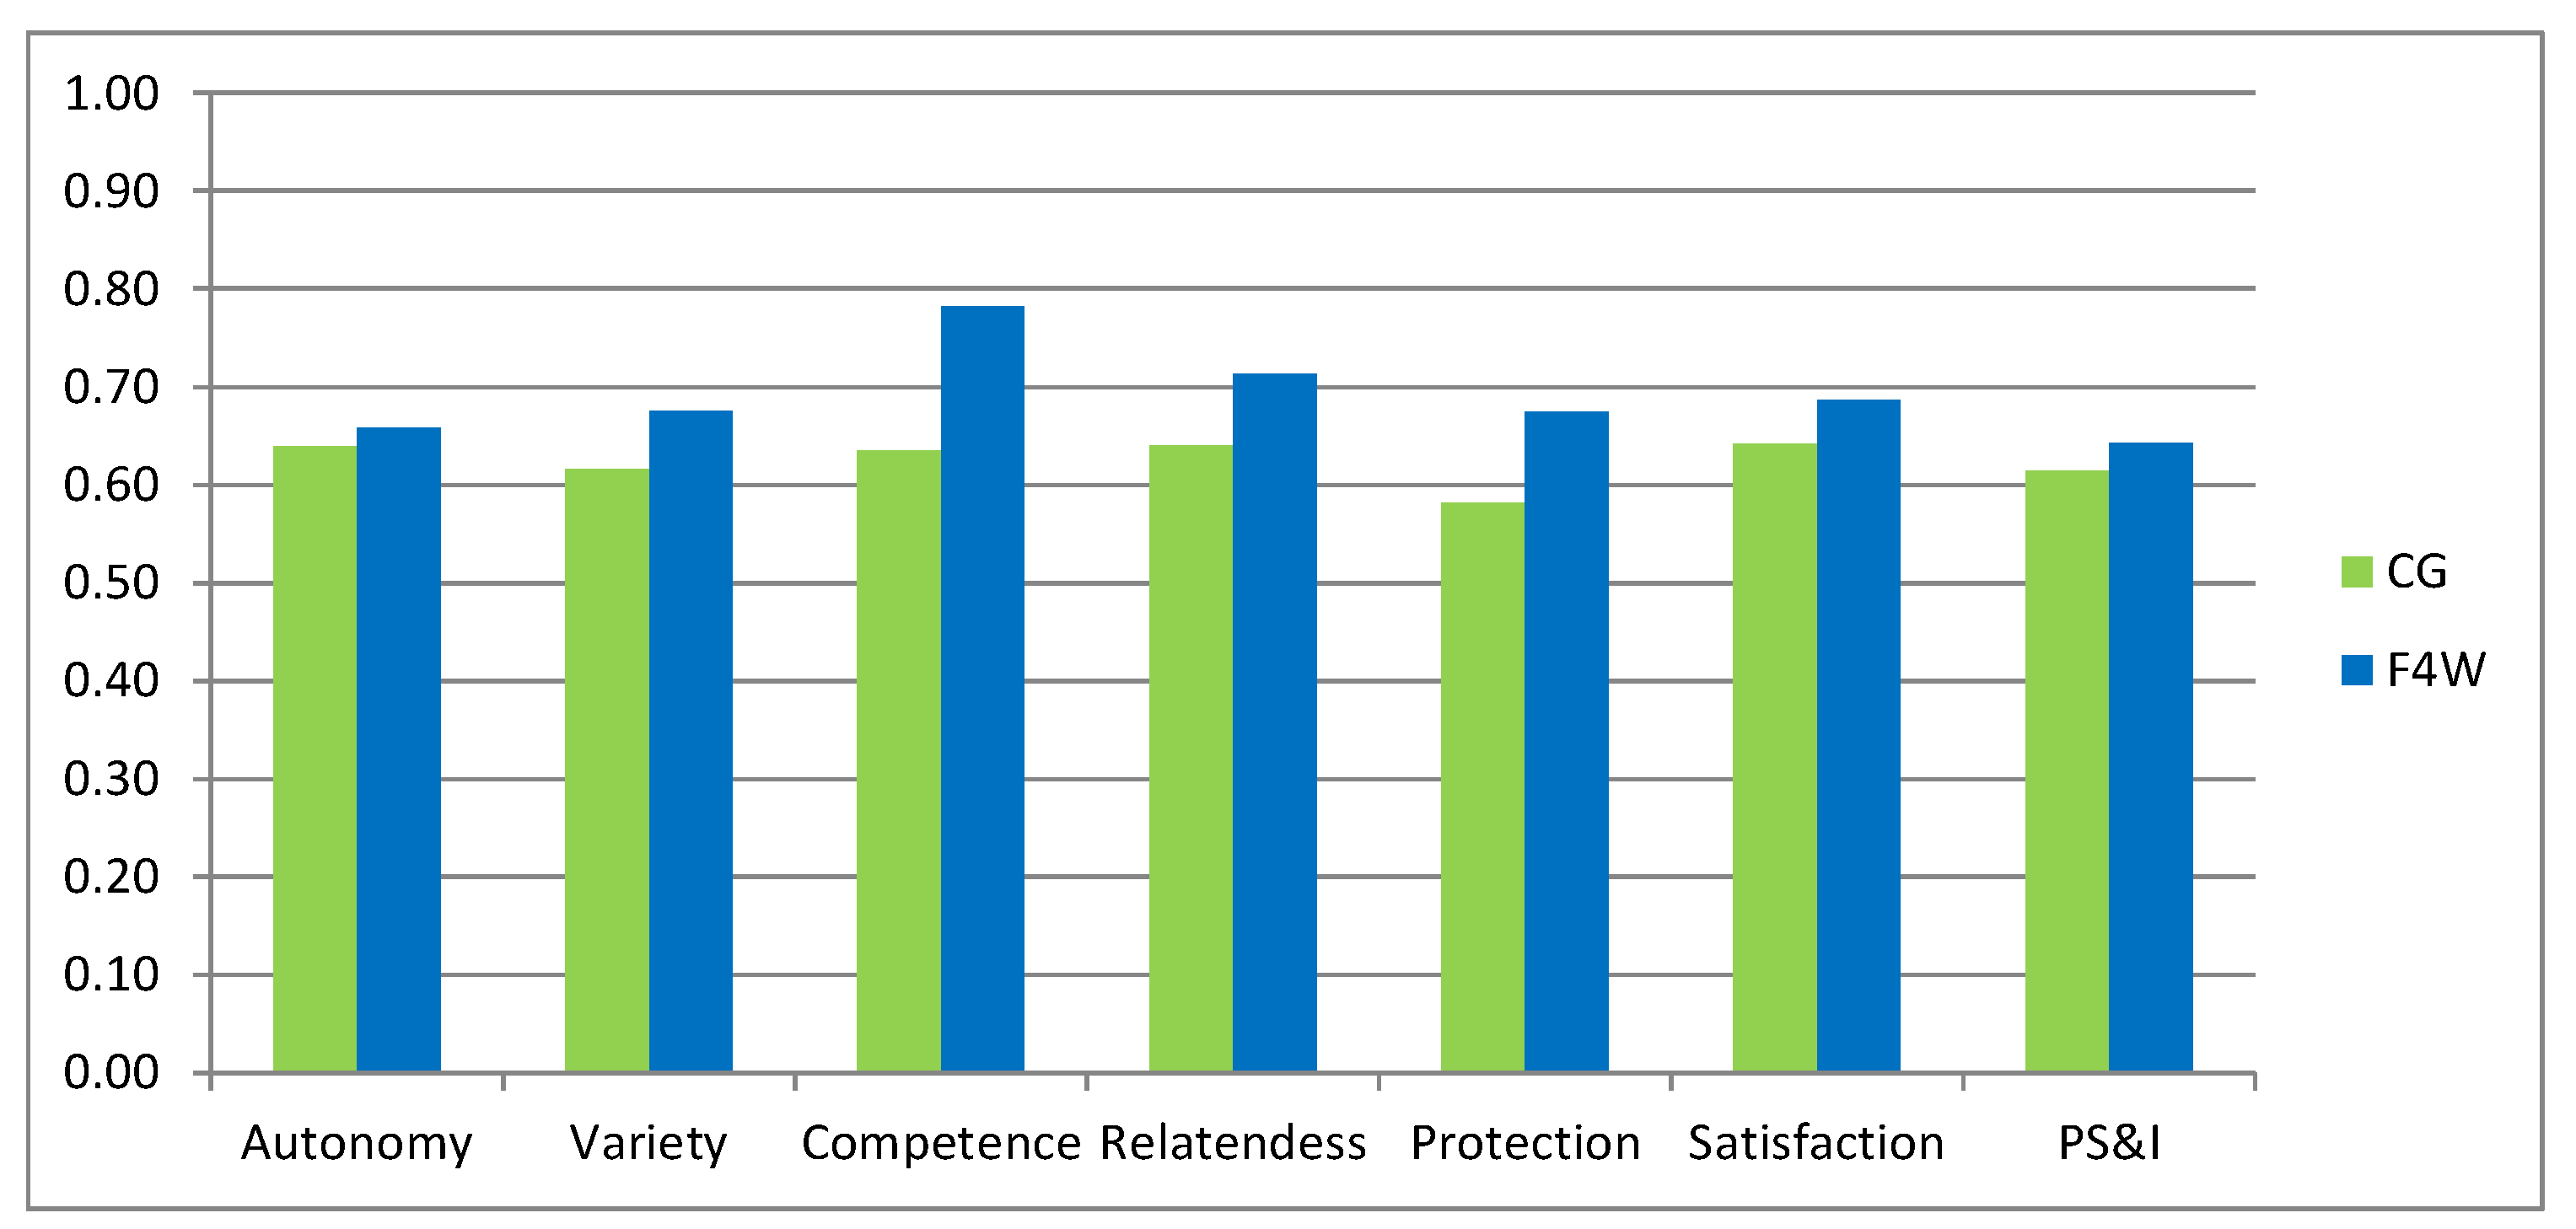
4.1. Evaluation Results Based on the F4W Evaluation Framework

The evaluated artifact was the first release of the functional prototype and the quality validation results are thus going to be more relevant than those of the impact analysis. This release covers the core functionalities of “Maintenance Scheduling” and “Defects and Solutions”. In any case, the impact analysis assessment was performed in order to validate the approach and to find possible improvements.
Table 1 summarizes the evaluation execution: when it was performed, the tools selected, and the object of each evaluation process. The evaluation process considers a group of workers using the solution and a control group of workers with the same role, but without any relation to the project.
The evaluation procedure was set up as followed (both at t0 and t1). At t0, before the pilot test started, the solution was briefly presented to workers. Afterwards, they were supposed to use a PC and started to work autonomously on the tablet. The process was really smooth and workers immediately understood the functionality of the tool. After five minutes testing without any questions from their side, they highlighted possible improvements and new functionalities, and requested the replication of the solution for other production lines. As expected, because of the maturity of the evaluated artifact, more relevant results correspond to quality validation. Next are the more relevant findings: the application needs some solutions inside the database to be used by the operators, so they will be created by the technologist before releasing the application to the operators; the operators suggested also including the timestamp to the solutions used; if the readability of the solution is correct, it is easy to access and the icon used is appreciated; and the feature to create a new solution was easily accessed. The tablet was OK for creating a single solution on the spot, but they asked us to use the application on a PC for a massive data input (many solutions to be included to populate the database); the keyboard of the tablet was appreciated by the operators; and the assignment (just click on a button…) of tasks was completed by the operators without any issues.
They suggested that some events should be automatically assigned by the system to the maintenance leader; a table to select the initial assignment of each event for different roles will be released (2nd product release).
As shown in Table 1 and introduced before, in parallel to the quality validation of the artifact, an assessment of the impact was performed. In the HID scenario, the measurement was performed using questionnaires and a Control Group (CG) in order to determine potential biases of impact dimensions and FACTS4WORKERS goals due to events external to the project interventions.
Figure 8 and Figure 9 show the impact measurements and the achievement of project goals at t0, respectively. The y-axis of these figures and the rest of the figures of this chapter represents the average values of the assessments for the dimensions or objectives shown by the labels of the x-axis, considering the measurement of each of the workers participating in the experiments. As explained in Section 2.1.1, these values are normalized values obtained from multisource raw data following a process which transforms different measurements to values without considering units.
Previous figures show that measurements within the CG are slightly better than for the group of workers using the solution. As we previously explained, because of the maturity of the artifact, these measurements are not expected to be significant, but they can be used as a baseline for comparison in the next deployments.
The second roll out of the prototype was performed in June of 2018. The validated prototype corrected detected bugs and implemented the most important worker solutions. Moreover, most already known solutions were added to the supporting database. As no relevant bugs were found, the rollout was developed in two productions lines (and it is expected to extend to the other two lines in brief).
While the measurements shown in Figure 10 and Figure 11 are compared with the ones present in previous figures, they show that for workers using FACTS4WORKERS solutions, Job Satisfaction improved a bit, while I&PS skills remained equal; they do not display good results. However, when compared with the measurements of CG, the results can be better interpreted: the job satisfaction and I&PS skills of CG decreased, while they improved for the workers using the solutions.
Even though the t0 assessments favored the control group, a composite analysis of t0 and t1 indicates that the F4W group fared better when compared to the control group across all the measured categories, as shown in Figure 12. The maturity of the artefacts at t1 seems to have positively influenced the F4W group to such an extent that the overall results across the evaluation phase favor the F4W group. A visual analysis of the bar graph indicates the possibility of a significant difference in terms of competence, relatedness, protection, and satisfaction constructs between the two evaluation groups.

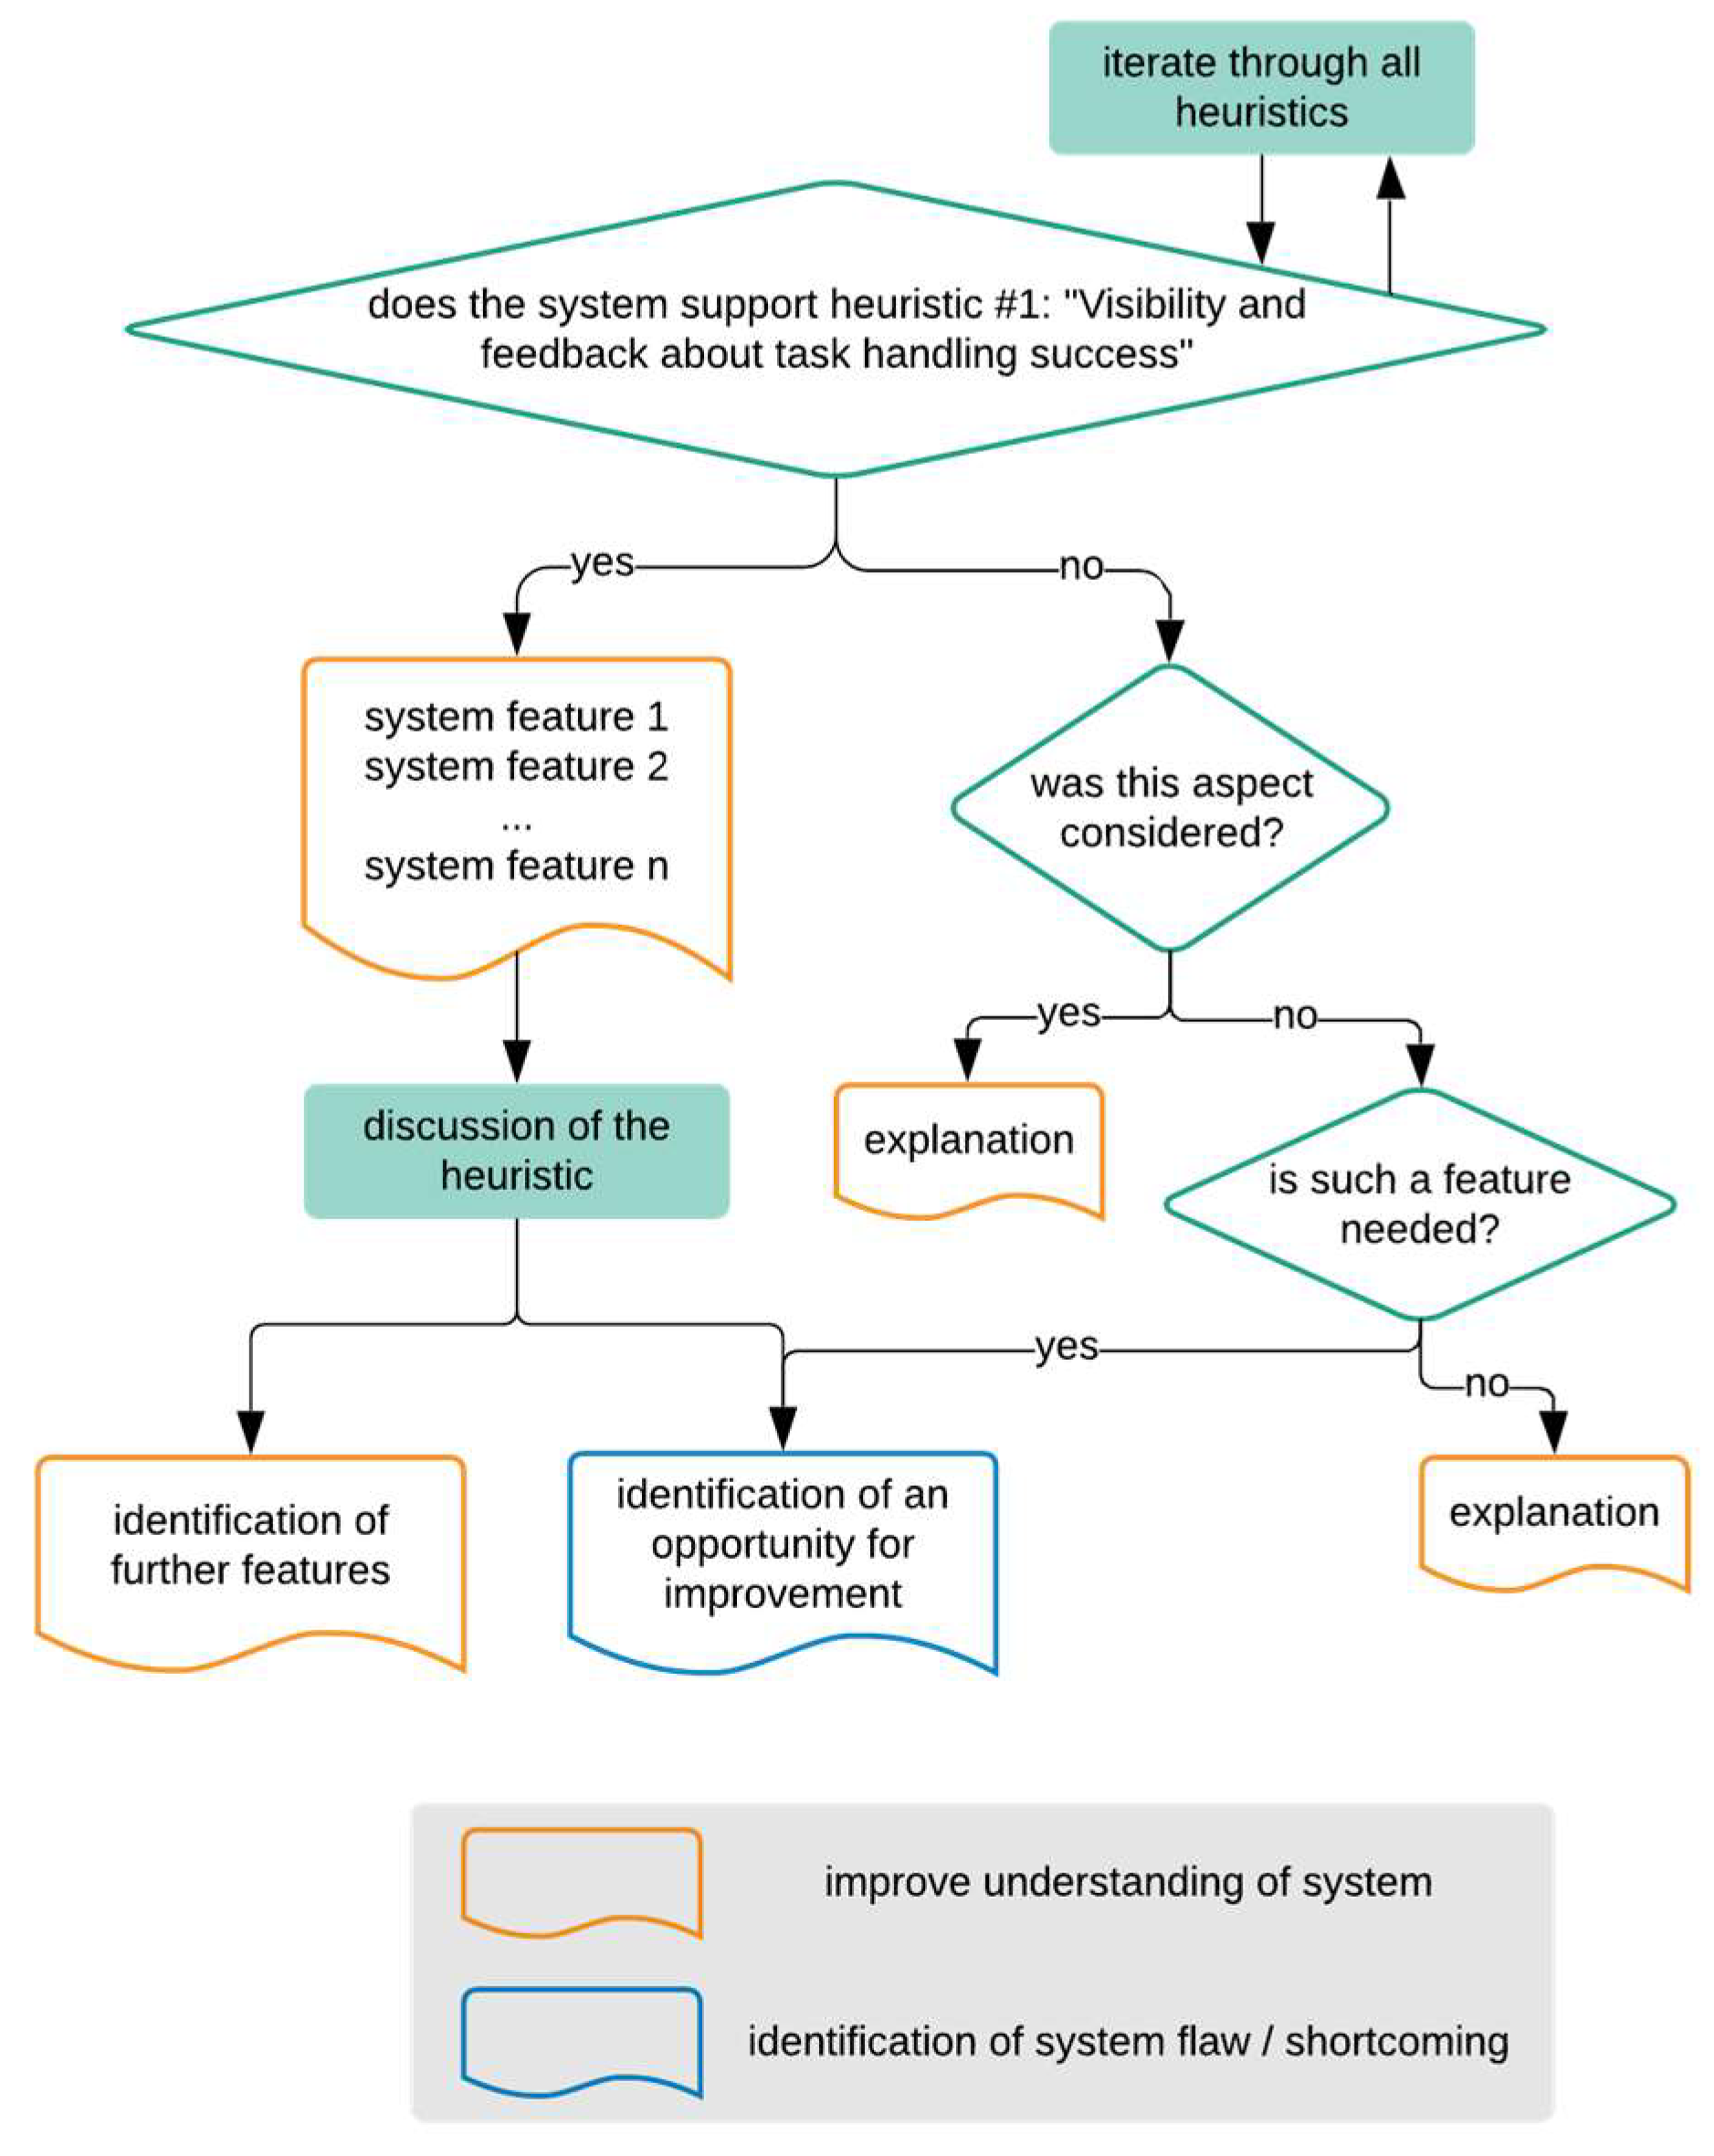
4.2. Analyzing the Hidria Use Case with the Help of Heuristics

Heuristics were used to structure a group interview session with designers of the discussed solution. Four people took part in this session; two interviewees and two interviewers. The two interviewees were researchers responsible for the application of the ICT-system that is described in Section 3 and had detailed insights into the software’s test run, which is reported at the beginning of Section 4 and is described in the next list:
  • Visibility and feedback about task handling success;
  • Flexibility for variable task handling, leading to a participatory evolution of the system;
  • Communication support for task handling and social interaction;
  • Purpose orientated information exchange for facilitating mental work;
  • Balance between effort and experienced benefit by organizational structuring of tasks;
  • Compatibility between requirements, development of competences, and the system’s features;
  • Efficient organization of task handling holistic goals;
  • Supportive technology and resources for productive and flawless work.
The two interviewers were researchers from the distinct project hi4 and thus, had little prior knowledge about the technical solution of this specific case and no knowledge about how the system was put to use by workers during the test run.
The interview showed that the heuristics help:
  • to deepen the comprehension of the system and to find out about the features that are being offered to its users;
  • to understand why the system designers added certain features while others were left out;
  • to identify blind spots of the system design that demand further clarification or give hints for improvement.
In summary, the interview confirmed the background of the management’s decision to roll out the proposed solution on a larger scale: the system seems well-designed as it covers most of the critical aspects of socio-technical system design in a proactive, elaborated manner.
The following paragraphs describe some of the interview’s insights. We add a 2-tuple to every finding where the first position refers to the corresponding heuristic and the second position indicates whether the system offers sufficient support (+), shows a deficit (−), or requires further clarification (?); e.g., (2,−) means that there is a flaw in regard to heuristic #2 ‘flexibility’. For clarity, these results are also presented in Table 2, where rows link findings to each heuristics and to the assessment of the system support.
Knowledge management is per se a central contribution to the proper exchange of information (4,+). It requires extra effort for documentation. This additional workload was minimized by making capturing as easy as possible (7,+), with the help of mobile devices that can record videos (8,+); 250 newly entered solutions indicate a successful design choice. Documenting solutions immediately on the shop floor was identified as the ideal task workflow (7,+) and is enabled by the system (8,+), but not enforced (2,+). After a roll out on a large scale, it should be evaluated whether the workforce in general is motivated to contribute to documentation (5,?).
The system relies on user-generated content. Before starting the usage of the systems, 50 solutions for the most common problems were entered. This measure helped to avoid an initial deadlock situation in which workers that need support could not find any content in the system, but were asked to provide content themselves (5,+). While descriptions of solutions can be created and edited by the users (2,+), the set of problems on which the system can react is fixed (2,−).
A major challenge is to offer the appropriate solutions or warnings for the situation the worker has to deal with. It still has to be evaluated how appropriate these solutions/warnings are (6,?)(8,?) and whether the workers perceive a relevant benefit, e.g., by reducing the stress of complex maintenance work (5,?). Features for letting the workers rate the quality and appropriateness of the proposed solutions allow them to be in control (2,+), make the quality of these proposals comprehensible for others (1,+), potentially eliminate bad solutions (8,+), and potentially foster continuous improvement (2,+).
No aggregated data is provided to allow the management to evaluate the workers’ performance; consequently, privacy is maintained (4,+). However, the workers can identify the authors of the documented solutions (1,+), e.g., to contact them if questions arise (3,+). However, it is unclear whether the system offers a direct communication channel with the authors (3,?). The possibility that some workers may be too timid to record a video, which could be bypassed by allowing anonymous postings, was not taken into consideration (2,−).
Connecting the knowledge management system with other technological components, such as additional channels for human-human communication (3,−) or the automated provision of the resources (tools, replacement parts) that are needed to work on a problem (7,−), are open tasks (8,−).
The whole knowledge management system offers fluent transitions between working and learning on the job; editing or authorizing solutions is an opportunity for reflection (6,+).
Due to time restrictions, the topic of autonomy could not be discussed in detail. It has to be understood whether following the proposed solution is mandatory or at least socially solicited (2,?) or how the processes of editing an existing solution and of creating a new description are defined (7,?).
Besides the elaborate design, the high acceptance of the tested system was probably increased by a young workforce that has an affinity towards new technologies. Additionally, a successful information campaign of the management framed the goal of the system as “making work more exciting” instead of emphasizing “increasing efficiency”. This framing avoided fear of losing jobs because of technological advancements.
Figure 13 describes the forging of potential evaluation results. If the socio-technical system takes a heuristic into account (left branch), the investigation can try to check whether the details and features of this heuristic are addressed by the system. If not (right branch), it has to be determined whether this is intentionally the case or not. If the heuristic, such as “Visibility” in Figure 13, is intentionally neglected, the reasons for this omission can be elicited.
If the heuristic was unintentionally ignored, it is possible to check whether measures for improvement should take place or which reasons stand against such an improvement.

5. Summary

In this paper, we present two different approaches for assessing and evaluating novel ICT solutions in a shop floor environment. Within the FACTS4WORKERS project, we have performed an experimental study. Therefore, an evaluation framework has been developed to measure, on the one hand, the impact of smart factory solutions on workers and organizations (change in practices and ICT solutions); on the other hand, it has been developed to gather qualitative feedback from workers for continuous improvements of the workplace solutions. It is a tool in order to support decisions at all stages of software development which follows a bottom-up approach. In contrast to this framework, we have also performed a theoretical study that aims to offer a pragmatic way to sufficiently identify the most urgent problems with a reasonable amount of effort. This was realized with the help of heuristics—a top-down approach—which help to obtain a more detailed understanding of critical aspects of the socio-technical systems developed. Using the heuristics to structure an interview helped the process of creating a diverse understanding of the system (for people that do not know the system) and pointed the creators of the system towards aspects they potentially overlooked when designing it.
While comparing both approaches, the first issue to be highlighted is that even considering different starting points, a relation between the concepts they focus on can be easily established. Additionally, the impact dimension “relatedness” considered by the evaluation framework can be linked to the G and I heuristics proposed by hi4 (see Figure 3). Both methodologies consider the dimension autonomy.
Moreover, a parallelism between the way hi4 heuristics are clustered and the way the evaluation framework groups its tools can also be established. The first cluster can be linked to the framework’s set of tools for validating the quality of the system, while the other three clusters are linked to the individual impact dimensions of the impact analysis tools. However, the evaluation framework also considers the organizational impact dimensions—efficiency and quality—which can be considered as similar to heuristics K and M, and are not clustered together by hi4.
Out of the F4W project, we applied these two methods to one specific context-of-use, which was addressed by requirements regarding the industrial challenge “Self-learning manufacturing workplaces”. Therefore, several software building blocks which interact with each other were deployed. For this industrial challenge, other industry partners are also reusing software building blocks to meet their particular requirements.
Heuristics provide a good way of analyzing qualitative data that can be used for clarifying the definition of the context-of-use and requirements, as well as what has to be measured for each ICT solution. This method can also be used to create system descriptions or project reports in a structured way. The evaluation framework can be used for quantifying the fulfillment of the requirements, continuous improvement of the ICT solution, and as a decision support system which is based on an impact analysis in order to decide what to do next in the project. This procedure can be extended by exploring the workplace solutions with the help of heuristics in order to obtain a holistic view of the human-centered design process. This offers a new method of cooperation in future projects.
Although it is not easy, more workers must be included in the research in order to obtain statistical significance. In FACTS4WORKERS, it was not possible because of the reduced workplaces in which solutions are deployed and because of the legal regulations. However, extracted conclusions are similar to the ones obtained from heuristics.
At the project level, based on these results and the ones published in the final report of the project [32], the most important issues linked to performing a correct evaluation are the provision of correct information to the workers of the goals of the intervention, the evaluation, and a clear and simple evaluation of the concepts under evaluation.
The use of qualitative and quantitative data obtained from workers for evaluating the solution provides very valuable results on the impact of the solutions, their validity, and the changed or introduced practices. Their combined use for the validation provides valuable insights into the impact. These insights are not always possible to extract from the impact assessment or with the use of questionnaires or interviews. We believe that our framework can be improved by blurring the border between the validation of the solution and the assessment of the impact. Despite this, we think that it must continue to be used in order to be able to correctly interpret the results of the evaluation as it is linked to the maturity of the artefacts.

Author Contributions

The team of FACTS4WORKERS (F.J.L.-P., L.H., S.D., S.C., and M.S.) provided the F4W evaluation sections. The team of Heuristic for Industry 4.0 project (J.N. and T.H.) provided the content of heuristics. The introduction and conclusions were made together.

Funding

This research is part of the work in progress of FACTS4WORKERS and Heuristic for Industry 4.0 projects. FACTS4WORKERS is funded by the European Union’s Horizon 2020 research and innovation program under Grant Agreement No. 636778. The study is also partially funded by the COMET K2—Competence Centers for Excellent Technologies Programme of the Federal Ministry for Transport, Innovation and Technology (bmvit); the Federal Ministry for Digital, Business and Enterprise (bmdw); the Austrian Research Promotion Agency (FFG); the Province of Styria; and the Styrian Business Promotion Agency (SFG). Heuristics for Industry 4.0 is funded by MKW NRW, supported by FGW.

Acknowledgments

We thank Isa Jahnke and Alexander Nolte for the co-development of the heuristics. We would also like to thank all the companies for good cooperation. Please visit http://heuristics.iaw.rub.de for more information about the heuristics or contact [email protected] for access to the sociotechnical problem database.

Conflicts of Interest

The authors declare no conflict of interest. The founding sponsors had no role in the design of the study; in the collection, analyses, or interpretation of data; in the writing of the manuscript, and in the decision to publish the results.

References

  1. Kiel, D.; Müller, J.M.; Arnold, C.; Voigt, K.I. Sustainable industrial value creation: Benefits and challenges of industry 4.0. Int. J. Innov. Manag. 2017, 21, 1740015. [Google Scholar] [CrossRef]
  2. Kagermann, H.; Helbig, J.; Hellinger, A.; Wahlster, W. Recommendations for implementing the strategic initiative INDUSTRIE 4.0: Securing the future of German manufacturing industry. In Final Report of the Industrie 4.0 Working Group; Forschungsunion: Berlin, Germany, 2013. [Google Scholar]
  3. Müller, J.M.; Kiel, D.; Voigt, K.I. What Drives the Implementation of Industry 4.0? The Role of Opportunities and Challenges in the Context of Sustainability. Sustainability 2018, 10, 247. [Google Scholar] [CrossRef]
  4. Wittenberg, C. Human-CPS Interaction-requirements and human-machine interaction methods for the Industry 4.0. IFAC-Pap. OnLine 2016, 49, 420–425. [Google Scholar] [CrossRef]
  5. Ansaria, F.; Erola, S.; Sihna, W. Rethinking Human-Machine Learning in Industry 4.0: How Does the Paradigm Shift Treat the Role of Human Learning? Educ. Train. 2018, 2351, 9789. [Google Scholar] [CrossRef]
  6. Kritzler, M.; Murr, M.; Michahelles, F. Remotebob—Support of On-site Workers via a Telepresence Remote Expert System. In Proceedings of the 6th International Conference on the Internet of Things, Stuttgart, Germany, 7–9 November 2016. [Google Scholar]
  7. van Saane, N.; Sluiter, J.; Verbeek, J.; Frings-Dresen, M. Reliability and validity of instruments measuring job satisfaction—A systematic review. Occup. Med. 2002, 53, 191–200. [Google Scholar] [CrossRef]
  8. Hannola, L.; Lacueva-Pérez, F.J.; Steinhueser, M.; Kokkonen, K.; Ojanen, V.; Schafler, M. An evaluation framework for worker-centric solutions in production environments. DEStech Trans. Eng. Technol. Res. 2017. [Google Scholar] [CrossRef]
  9. Spector, P.E. Measurement of Human Service Staff Satisfaction: Development of the JS Survey. Am. J. Commun. Psychol. 1985, 13, 693–713. [Google Scholar] [CrossRef]
  10. Fishbein, M.; Ajzen, I. Belief, Attitude, Intention and Behavior: An Introduction to Theory and Research; Reading Addison-Wesley: Boston, MA, USA, 1975. [Google Scholar]
  11. Venkatesh, V.; Morris, M.G.; Davis, G.B.; Davis, F.D. User Acceptance of Information Technology: Toward a Unified View. MIS Q. 2003, 27, 425–478. [Google Scholar] [CrossRef]
  12. Gable, G.G.; Sedera, D.; Chan, T. Re-conceptualizing information system success: The IS-impact measurement model. J. Assoc. Inf. Syst. 2008, 9, 18. [Google Scholar] [CrossRef]
  13. Caldiera, V.R.B.G.; Rombach, H.D. Goal question metric paradigm. Ency. Softw. Eng. 1994, 1, 528–532. [Google Scholar]
  14. Chen, M.; Mao, S.; Liu, Y. Big data: A survey. Mob. Netw. Appl. 2014, 19, 1–39. [Google Scholar]
  15. Stone, A.A.; Bachrach, C.A.; Jobe, J.B.; Kurtzman, H.S.; Cain, V.S. The Science of Self-Report: Implications for Research and Practice; Psychology Press: London, UK, 1999. [Google Scholar]
  16. Mayring, P. Qualitative content analysis. Forum Qual. Soc. Res. 2000, 2, 1–28. [Google Scholar]
  17. Walsham, G. Doing Interpretive Research. Eur. J. Inf. Syst. 2006, 15, 320–330. [Google Scholar] [CrossRef]
  18. Delone, W.H.; McLean, E.R. The DeLone and McLean model of information systems success: A ten-year update. J. Manag. Inf. Syst. 2003, 19, 9–30. [Google Scholar]
  19. Hannola, L.; Heinrich, P.; Richter, A.; Stocker, A. Sociotechnical challenges in knowledge-intensive production environments. In Proceedings of the XXVII ISPIM Innovation Conference, Porto, Portugal, 19–22 June 2016. [Google Scholar]
  20. Hannola, L.; Steinhüser, M.; Richter, A.; Schafler, M.; Lacueva-Pérez, F.J. Assessing the Impact of Digital Interventions on the Shop Floor. In Proceedings of the 20th International Working Seminar on Production Economics, Innsbruck, Germany, 19–23 February 2018. [Google Scholar]
  21. Heinrich, P.; Richter, A. Captured and structured practices of workers and contexts of organizations. In Project Report—FACTS4WORKERS: Worker-Centric Workplaces in Smart Factories; VIRTUAL VEHICLE Research Center: Graz, Austria, 2015. [Google Scholar]
  22. Denner, J.; Heinrich, P.; Heldmann, C.; Richter, A. First version of requirements of workers and organisations. In Project Report—FACTS4WORKERS: Worker-Centric Workplaces in Smart Factories; VIRTUAL VEHICLE Research Center: Graz, Austria, 2015. [Google Scholar]
  23. Schafler, M.; Hannola, L.; Lacueva-Pérez, F.J.; Milfelner, M.; Steinhüser, M.; Gracia-Bandrés, M.A. Evaluating worker-centered smart interventions on the shop floor. In Proceedings of the Mensch und Computer 2017-Workshopband, Regensburg, Germany, 10–13 September 2017. [Google Scholar]
  24. Nielsen, J. Heuristic Evaluation. In Usability Inspection Methods; Nielsen, J., Mack, R.L., Eds.; Wiley: Hoboken, NJ, USA, 1994; pp. 25–62. [Google Scholar]
  25. Baxter, G.; Sommerville, I. Socio-technical systems: From design methods to systems engineering. Interact. Comput. 2011, 23, 4–17. [Google Scholar] [CrossRef] [Green Version]
  26. Suchman, L. Making work visible. Commun. ACM 1995, 38, 56–64. [Google Scholar] [CrossRef]
  27. Schafler, M.; Lacueva-Pérez, F.J.; Hannola, L.; Damalas, S.; Nierhoff, J.; Herrmann, T. Insights into the Introduction of Digital Interventions at the shop floor. In Proceedings of the 11th Pervasive Technologies Related to Assistive Environments Conference (PETRA’18), Corfu, Greece, 26–29 June 2018; pp. 331–338. [Google Scholar] [CrossRef]
  28. Unzeitig, W.; Wifling, M.; Stocker, A.; Rosenberger, M. Industrial challenges in human-centred production. In Proceedings of the MOTSP 2015-International Conference Management of Technology, Porec, Croatia, 22–24 April 2015; pp. 10–12. [Google Scholar]
  29. Hannola, L.; Kutvonen, A.; Ojanen, V.; Papinniemi, J. Detailed and Refined Industrial Challenges, version I. In Deliverable 1.3. Project Report—FACTS4WORKERS: Worker-Centric Workplaces in Smart Factories; VIRTUAL VEHICLE Research Center: Graz, Austria, 2016. [Google Scholar]
  30. Fischer, G.; Herrmann, T. Socio-technical systems: A meta-design perspective. IGI Glob. 2011, 3, 1–33. [Google Scholar] [CrossRef]
  31. Richter, A.; Vodanovich, S.; Steinhüser, M.; Hannola, L. IT on the Shop Floor—Challenges of the Digitalization of manufacturing companies. In Proceedings of the 30th Bled eConference, Bled, Slovenia, 18–21 June 2017. [Google Scholar]
  32. Lacueva-Pérez, F.J.; Gracia-Bandrés, M.A. Final Evaluation Report. In Deliverable 6.4. Project Report—FACTS4WORKERS: Worker-Centric Workplace in Smart Factories; VIRTUAL VEHICLE Research Center: Graz, Austria, 2018. [Google Scholar]
Figure 1. Tools and methods for the evaluation framework.
Technologies 06 00116 g001
Figure 2. Detailed Raw Data-Objectives Measurement Formulation.
Technologies 06 00116 g002
Figure 3. Overview of the F4W evaluation strategy.
Technologies 06 00116 g003
Figure 4. Software Architecture of the F4W solution at Hidria.
Technologies 06 00116 g004
Figure 5. New Maintenance Task Creation Screen-Shot.
Technologies 06 00116 g005
Figure 6. Machine Selection Screen-Shot.
Technologies 06 00116 g006
Figure 7. Machine Data Visualization Screen-Shot.
Technologies 06 00116 g007
Figure 8. Assessment of Impact Dimension at t0.
Technologies 06 00116 g008
Figure 9. FACTS4WORKERS project goals measurement at t0.
Technologies 06 00116 g009
Figure 10. Assessment of Impact Dimension at t1.
Technologies 06 00116 g010
Figure 11. FACTS4WORKERS project goals measurement at t0.
Technologies 06 00116 g011
Figure 12. Overall Comparison of Impact Assessment and Goal Achievements between CG & FACTS4WORKERS Group.
Technologies 06 00116 g012
Figure 13. Exploring a system design with the help of heuristics.
Technologies 06 00116 g013
Table 1. HID evaluations summary.
DateNo. of ParticipantsObjectMethod
(Future) F4W UsersControl Group
April 201763F4W: IA base lineQuestionnaires
April 201730F4W QVObservation, interview
June 201830F4W: IAQuestionnaires
Table 2. Heuristics at HID.
HeuristicFindingSystem Support (+/−)
1. VisibilityRating solutions makes the quality of these proposals comprehensible for others.+
Workers can identify the authors of the documented solutions.+
2. FlexibilityDocumenting solutions on shop-floor is not enforced.+
The descriptions of solutions can be created and edited by the users+
The set of problems on which the system can react is fixed.
Worker are able to rate the quality and appropriateness of the proposed solutions+
Rating solutions potentially fosters continuous improvement.+
The possibility that some workers may be too timid to record a video, which could be bypassed by allowing anonymous postings, was not taken into consideration.
It has to be understood whether following the proposed solution is mandatory or at least socially solicited.?
3. Communication SupportAuthors of the solutions can be contacted if questions arise.+
It is unclear though, if the system offers a direct communication channel with the authors.?
Connecting the knowledge management system with other technological components such as additional channels for human-human communication.
4. Information ExchangeKnowledge management (KM) a central contribution to the proper exchange of information.+
No aggregated data is provided to allow the management to evaluate the workers performance; consequently, privacy is maintained.+
5. Balance between effort and benefitAfter a roll out in the large it should be evaluated whether the workforce in general is motivated to contribute to documentation.?
Initial loaded content is requested to be extended/improved by workers.+
Do worker perceive the provided solutions as beneficial for them??
6. CompatibilityProvided solutions/workings must be evaluated in order to determine how appropriate they are for the situation a worker has to deal with.?
The whole knowledge management system offers fluent transitions between working and learning on the job; editing or authorizing solutions is an opportunity for reflection.+
7. Efficient organizationKM requires additional workload for documenting but can be minimized by making capturing as easy as possible.+
Documenting solutions immediately on the shop floor was identified as the ideal task workflow.+
Automated provision of the resources (tools, replacement parts) that are needed to work on a problem.
How the processes of editing an existing solution and of creating a new description are defined??
8. Supportive technologyVideos can be used for capturing knowledge from workers on shop floor.+
Provided solutions/workings must be evaluated in order to determine how appropriate they are for the situation a worker has to deal with.
Rating solutions potentially eliminates bad solutions.?
Connecting the knowledge management system with other technological components such as additional channels for human-human communication or the automated provision of the resources (tools, replacement parts) that are needed to work on a problem are open tasks.+

