Emotion Recognition from Speech Using the Bag-of-Visual Words on Audio Segment Spectrograms †

1
Institute of Informatics and Telecommunications, National Centre for Scientific Research “Demokritos”, 15341 Athens, Greece
2
Department of Computer Science, University of Thessaly, 38221 Lamia, Greece
3
Department of Computer Engineering T.E., Technological Education Institute of Sterea Ellada, 34400 Lamia, Greece
4
Department of Informatics, Ionian University, 49132 Corfu, Greece
*
Author to whom correspondence should be addressed.
†
This paper is an extended version of our paper published in Proceedings of the 11th PErvasive Technologies Related to Assistive Environments Conference, Corfu, Greece, 26–26 June 2018; pp. 106–107.
Technologies 2019, 7(1), 20; https://0-doi-org.brum.beds.ac.uk/10.3390/technologies7010020
Submission received: 30 November 2018
/
Revised: 21 January 2019
/
Accepted: 30 January 2019
/
Published: 4 February 2019
(This article belongs to the Special Issue The PErvasive Technologies Related to Assistive Environments (PETRA))
Abstract
:It is noteworthy nowadays that monitoring and understanding a human’s emotional state plays a key role in the current and forthcoming computational technologies. On the other hand, this monitoring and analysis should be as unobtrusive as possible, since in our era the digital world has been smoothly adopted in everyday life activities. In this framework and within the domain of assessing humans’ affective state during their educational training, the most popular way to go is to use sensory equipment that would allow their observing without involving any kind of direct contact. Thus, in this work, we focus on human emotion recognition from audio stimuli (i.e., human speech) using a novel approach based on a computer vision inspired methodology, namely the bag-of-visual words method, applied on several audio segment spectrograms. The latter are considered to be the visual representation of the considered audio segment and may be analyzed by exploiting well-known traditional computer vision techniques, such as construction of a visual vocabulary, extraction of speeded-up robust features (SURF) features, quantization into a set of visual words, and image histogram construction. As a last step, support vector machines (SVM) classifiers are trained based on the aforementioned information. Finally, to further generalize the herein proposed approach, we utilize publicly available datasets from several human languages to perform cross-language experiments, both in terms of actor-created and real-life ones.
1. Introduction
The recognition of a human’s emotional state constitutes one of the most recent trends in the field of human computer interaction [1]. During the last few years, many approaches have been proposed that make use of either sensors placed in the users’ environments (e.g., cameras and microphones), or even sensors placed on the users’ bodies (e.g., physiological or inertial sensors). Although during the last few years people are shifting from text to video, when they need to publicly express themselves [2], when observed by either cameras or microphones, they typically feel that their privacy is violated [3]. Of course, the use of body sensors for long time periods is a factor that may also cause discomfort. Among the least invasive approaches, those that make use of microphone sensors placed on the users’ environment and capturing their speech are usually considered. Vocalized speech is composed of two discrete parts. The first one is the linguistic content of speech; it consists of the articulated patterns that are pronounced by the speaker, i.e., what the speaker said. The second component of speech is its non-linguistic content, i.e., how the speaker pronounced it [4]. More specifically, the non-linguistic content of speech consists of the variation of the pronunciation of the articulated patterns, i.e., the acoustic aspect of speech. Typically, the description of linguistic patterns is qualitative. On the other hand, low-level features may be extracted from the non-linguistic ones, such as the rhythm, the pitch, the intensity, etc. Many emotion classification approaches from speech work based on both types of information.
Moreover, linguistic patterns are typically extracted by using an automatic speech recognition system (ASR). However, the main drawback of such approaches is that they do not easily provide language-independent models. This happens since a plethora of different sentences, speakers, speaking styles and rates exist [5]. On the other hand, approaches based on non-linguistic features are often more robust to different languages. Of course, even when such features are used, the problem of emotion recognition from speech is still a challenging one. The main reason is that, even in this case, non-linguistic content may significantly vary due to factors such as cultural particularities. Sometimes, a potential chronic emotional state of a given speaker may play a serious role.
Choosing the right approach in education is rather challenging. A classroom is an emotional setting on its own. Students’ emotions affect the way they learn as well as the way they put their abilities to use. There has not been enough research on how to manage or even neutralize the affect of emotions (not the emotion itself), so as to help students learn regardless of their emotional state. In order to manage emotions, it is critical to be able to identify them. Moreover, when it comes to distance or electronic learning, it is essential for educators to identify their students’ emotions so as be able to alter their teaching according to their students needs. In the case of a classroom (whether a real-world or a virtual one), any approach should be as less invasive as possible so as the students do not feel that “they are been watched,” in order to freely express their emotions. Adaptation of learning contexts could be helpful to improve both learning and negative emotions [6].
The majority of approaches that use the non-linguistic component of speech typically rely on the extraction of spectral or cepstral features from the raw audio speech signals [4]. Contrary to previous works, we do not extract any audio features herein. Instead, we propose a computer vision approach that is applied on spectrogram representations of audio segments. More specifically, a spectrogram is a visual representation of the spectrum of the frequencies of a signal, as they vary with time. A spectrogram is a 2D signal that may be treated as if it were an image. Thus, we apply an algorithm derived from computer vision known as “Bag-of-Words” (BoW) or “Bag-of-Visual Words” (BoVW) model [7]. It should be noted here that, in a previous work [8], we have first experimented with this model and obtained promising results using several well-known datasets.
In this work, we provide a thorough investigation of the BoVW model on its application to audio spectrograms, and by utilizing publicly available datasets of several languages. We perform cross-language experiments and also experiments where datasets have been contaminated with artificial noise. Moreover, apart from using datasets that have been created using actors, we also present a real-life experiment. More specifically, we have applied the proposed methodology in a real-life classroom environment, using a group of middle-school students and conducted an experiment where they were asked to freely express their unbiased opinion regarding the exercise they participated. The outcomes of the interviews (i.e., the resulting recordings) were annotated and used for emotion classification.
The structure of the rest of this paper is as follows: in Section 2, we present related works on emotion recognition from audio, focusing on applications in education. Then, in Section 3, we describe in detail the Bag-of-Visual Words model and the proposed emotion classification strategy. The data sets that have been used and the series of experiments that have been performed are presented in Section 4. Finally, results are discussed and conclusions are drawn in Section 5, where some of our future plans for the application of emotion recognition in education are also presented.
2. Related Work
2.1. Non-Linguistic Approaches for Emotion Recognition
Emotion recognition from the non-linguistic component of multimedia documents containing speech has been typically based on the extraction of several low-level features which were then used to train models and map them to the underlying emotions. Such research efforts [9,10,11] in many cases included fusion of multimodal features such as audiovisual signals. Wang and Guan [9] introduced such a system that combined audio characteristics extracted using Mel-frequency Cepstral Coefficient (MFCC), along with a face detection scheme based on the hue, saturation, value (HSV) color model. Experimental results showed an effectiveness in emotion recognition that according to the authors rates up to 82.14%. In case of music signals, several efforts have turned to the recognition of their affective content with applications to affect-based retrieval from music databases [12,13] using audio content analysis so as to retrieve information related to emotion, using different hierarchical as well as non-hierarchical methods. Well-known classifiers have been used, e.g., Hidden Markov Models or Support Vector Machines, to extract features to emotional states. Such states either include fear, happiness, anger etc. [9,10], or in other cases [14,15,16] follow the dimensional approach [17] that originates from psychophysiology. Spectrograms have also been previously used for other audio analysis-related tasks, such as content classification [18] and segmentation [19], for stress recognition [20] and more recently for emotion recognition with convolutional neural networks [21,22].
2.2. Emotion Recognition in Education
Many definitions exist in the literature for the term emotion. One of the generally accepted ones defines an emotion as a “reaction to stimuli that can last for seconds or minutes” [23]. Moreover, schooling is an emotional process for all parties involved (student, teacher, parent), whereas emotions are involved in every aspect of the teaching and learning processes. In order to create a collaborative environment, teachers attempt to understand their students’ experiences, prior knowledge and emotions. Such understanding could provide educators with the necessary tools to create engaging and comprehensive lessons so as to fulfill their educational goals [24]. A student’s emotional state can affect their concentration, the quality of information they receive and process, their problem solving skills as well as their decision-making skills [25,26]. Therefore, instead of emphasizing on scores and tests, educators who seek educational reform aim at transforming their teaching so as to reflect their students needs and emotions.
In principle, the teacher–student relationship has proven to affect a student’s performance in school; a positive teacher–student relationship leads to an engaged and higher competent performance [27]. Within the school environment, emotions can interfere with attention, facilitate or disrupt problem solving and are triggered by both teachers and students’ goals and expectations. Therefore, it is important for students’ educational progress to manage and regulate their emotions, whereas “downregulating” negative emotions and “upregulating” positive emotions tend to be the most common goal in education [28]. Emotion regulation [29]—a group of processes that a person could use in order to hold on, transform, control or change both positive or negative emotions [30]—enables students and teachers to avoid negative emotions and enhance positive emotions. Research shows that Emotion Regulation strategies in the classroom, e.g., reflection, reappraisal, rumination, distraction, expressive suppression, and social sharing [31], could lead to a positive educational outcome. Those strategies may vary since not all people express or process emotions in the same way and teachers should choose between or combine emotion regulation strategies keeping in mind the plethora as well as amalgam of different personalities within a classroom so as to manage the demands both of an entire classroom as well as of a student individually.
In recent years, there has been plenty of research works analyzing the importance of emotion recognition and regulation in different scientific areas (e.g., psychology, AI, education, training, etc.) along with several types of software developed in an attempt to automatically recognize and analyze emotion via facial expressions, speech, attaching sensors, as well as hand and/or body gestures. It has become rather important lately to identify emotions during certain states (learning, working, etc.), so as to improve an individual’s performance. There is evidence through research which shows that certain emotions support learning processes, while other emotions suppress them [25]. Other research works indicated that students and teachers with positive emotions can produce better ideas and result to a better outcome. Positive emotions enhance levels of motivation, whereas negative emotions can reduce working memory [32]. Emotion also affects the way the brain works. According to [33], when a student is under stress, a major part of the brain “shuts down” and turns into “survival mode,” expressing emotions such as defensiveness [29], making clear that the way a student’s brain operates may affect the way they learn and adapt into the school environment.
As for applications of emotion recognition in education, the focus is typically given on moral emotions (guilt, remorse, shame), which differ from the basic ones (sadness, happiness, etc.) [34]. In addition, virtual agents have been used in the role of educator [35] which were provided with the ability to sense the emotional state of the students. Upon emotion recognition, these agents could then make interaction more appealing for the students. Bahreini et al. [36] examined the advantages of speech emotion recognition in e-learning, in order to facilitate smoother interaction between humans and computers. A type of software developed to recognize emotion is the Framework for Improving Learning Through Webcams And Microphones (FILTWAM). FILTWAM software [37] was developed in order to provide real-time online feedback to e-learning educators using both facial and voice emotion recognition. According to the authors, FILTWAM allows continual observation of the learners’ behavior which then “translates” to emotions with an overall accuracy of 67% [36]. Another way to identify emotion is by using emotion sensors in intelligent tutors and facial detection software [38], by collecting data streams from students. In classroom experiments, this approach indicated a success of 60% in predicting students’ emotions. Kim et al. [39], on the other hand, proposed a smart classroom system which allows real-time suggestions so as the teacher/presenter can make adjustments to their non-verbal behavior in order to make their presentation more effective. Challenges lie in the creation of a holistic system and an algorithmic adaptation in order to allow real-time execution and quantification of valid educational variables for use in algorithms. The MaTHiSiS project [40,41] is introduced as an end-to-end solution aiming at each learner’s personal needs. This educational ecosystem uses sensing devices such as cameras, microphones, etc. and aims at engaging learners to the learning activities adjusting to their skill level as needed so as to decrease boredom and anxiety and increase the learning outcome taking into consideration any learning or physical disabilities.
3. Emotion Recognition from Spectrograms Using BoVW
In the following subsections, we focus on the Bag-of-Visual Words model, on which the herein presented approach is based. In addition, we describe the spectrogram generation process and we present the proposed computer vision-based emotion recognition methodology in attempt to illustrate the innovative aspects of our work.
3.1. The BoVW Model
The origin of the Bag-of-Words (BoW) model goes back to the 1950s and to the field of text document analysis [42]. In that case, the main idea was to describe a text document (either at its whole, or a small part) by using a histogram that is constructed on word frequencies. This idea, during the 2000s, has been adopted accordingly in order to suit the needs of several computer vision-related tasks. Notable examples include high-level visual concept detection, image classification, object/scene recognition problems [43], etc. The adopted model is often referred to as the “Bag-of-Visual Words” (BoVW) model.
BoVW is a weakly supervised model, built upon the notion of visual vocabularies. A visual vocabulary is actually a set of “exemplar” image patches, which are commonly referred to as “visual words.” Using such a vocabulary, a given image may be described based on these words. To built an appropriate visual vocabulary, one should use a large corpus of representative images of the domain of interest, so that they would be closely related to the problem at hand. Typically, a clustering approach such as the well-known k-means algorithm is applied on the extracted features. The centroids (or in some cases the medoids) that result upon the application of clustering are then selected as the words () that comprise the visual vocabulary. The size N of the visual vocabulary is typically determined heuristically, upon a trial-and-error or an extensive evaluation of various vocabulary sizes. Note that the visual vocabulary acts as a means of quantization of the feature space; it consists of the locally-extracted descriptors, which are accordingly quantized to their nearest word.
More specifically, any given image is described by a feature vector (histogram) consisting of frequencies of visual words. The latter originates from the constructed visual vocabulary. In order to construct such description, features are first extracted using the exact method that was used during the vocabulary construction process, e.g., the same description, tuned with the same parameters. Each feature is then translated (i.e., quantized) to the most similar visual word of the vocabulary, using an appropriate similarity metric. The majority of approaches adopt the well-known Euclidean distance. This way, a histogram of visual words is extracted and is then used for the description of the whole image. It is represented using a -dimensional feature vector; the i-th component of the feature vector corresponds to the i-th visual word, i.e., , while its value denotes the appearance frequency of this word within the whole image. Note that one of the main advantages of BoVW is that it provides a fixed-size representation of the image, i.e., N is independent of the number of features that have been originally extracted. This property is important, since, in many widely used feature extraction approaches, such as salient point extraction, the number of feature varies depending on the image content which often makes their use non-trivial. In contrast to this case, the fixed size feature vectors generated by BoVW may be easily used to train several well-known classifiers and models, such as neural networks and support vector machines.
3.2. Spectrogram Generation
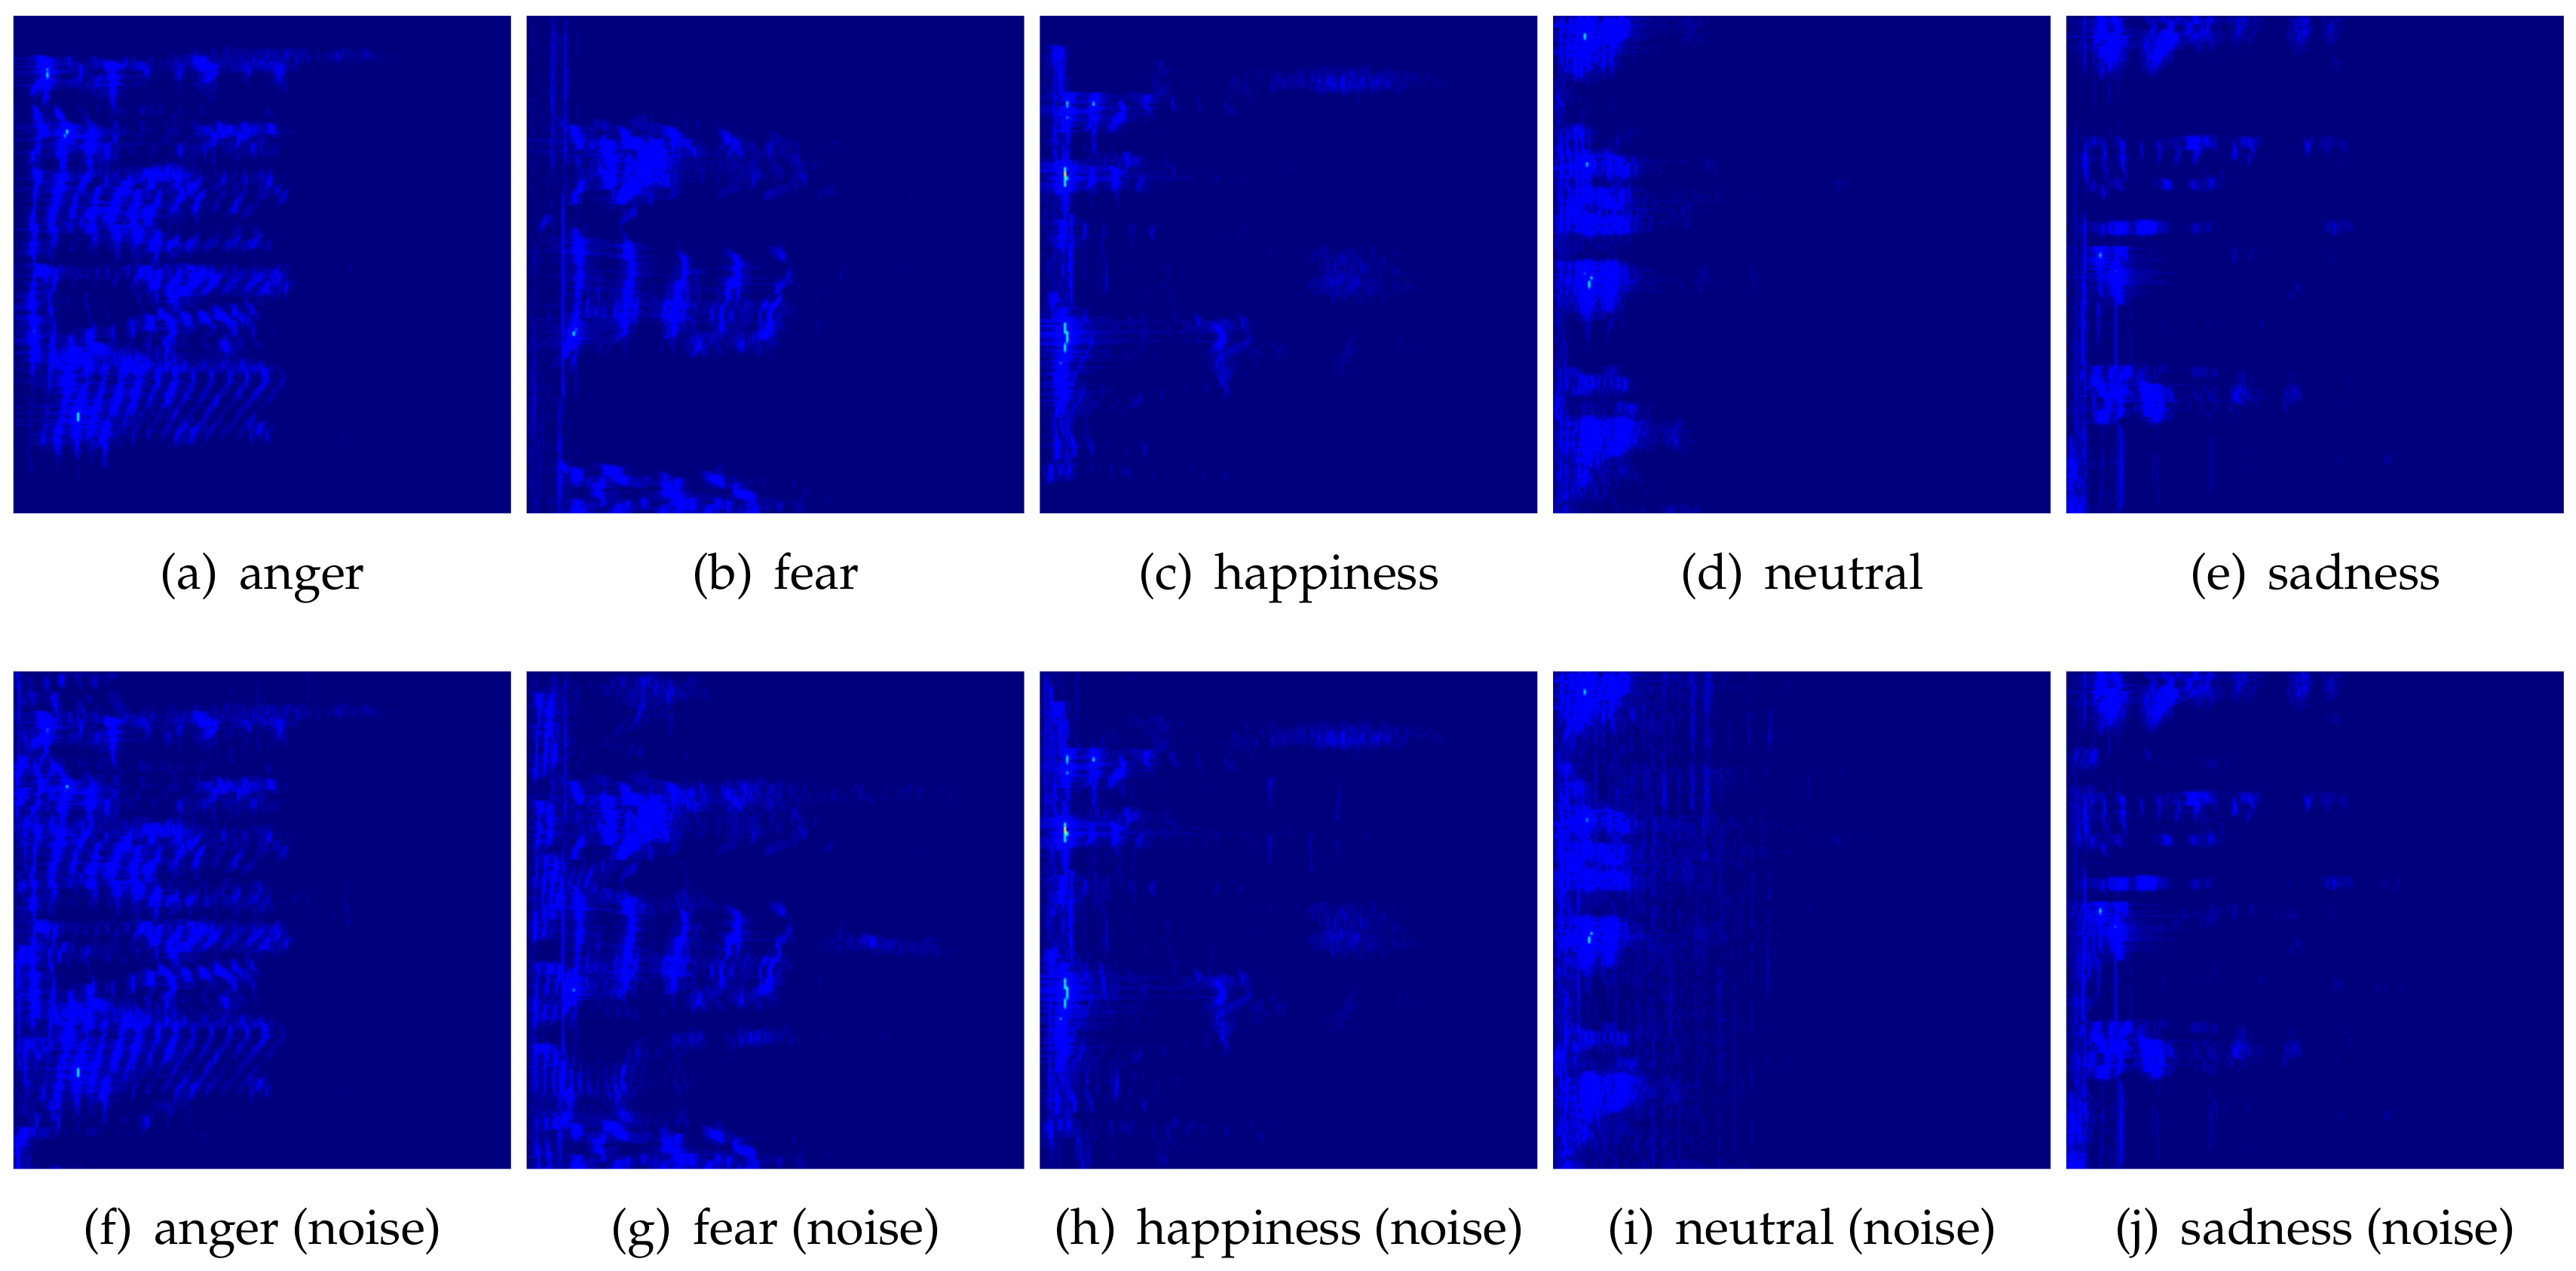
Moving on to the generation of spectrograms, we first extract a single segment of length sec from any given audio sample. This segment is randomly selected from the entire sample. Then, we apply the Short-Time Fourier Transform (STFT) on the original signal. We use short-term windows of fixed size and step . Pseudocolored images of spectrograms from five emotions that have been used within the experimental evaluation of this work are illustrated in Figure 1, Figure 2, Figure 3 and Figure 4. In order to evaluate our approach in the present of noise, before extracting the spectrogram of each training sample, we added a background sound (i.e., music, playing the role of noise) in three different Signal-To-Noise ratios (SNRs) (5, 4 and 3) for the crop of the original audio sample.
3.3. Emotion Recognition Using BoVW
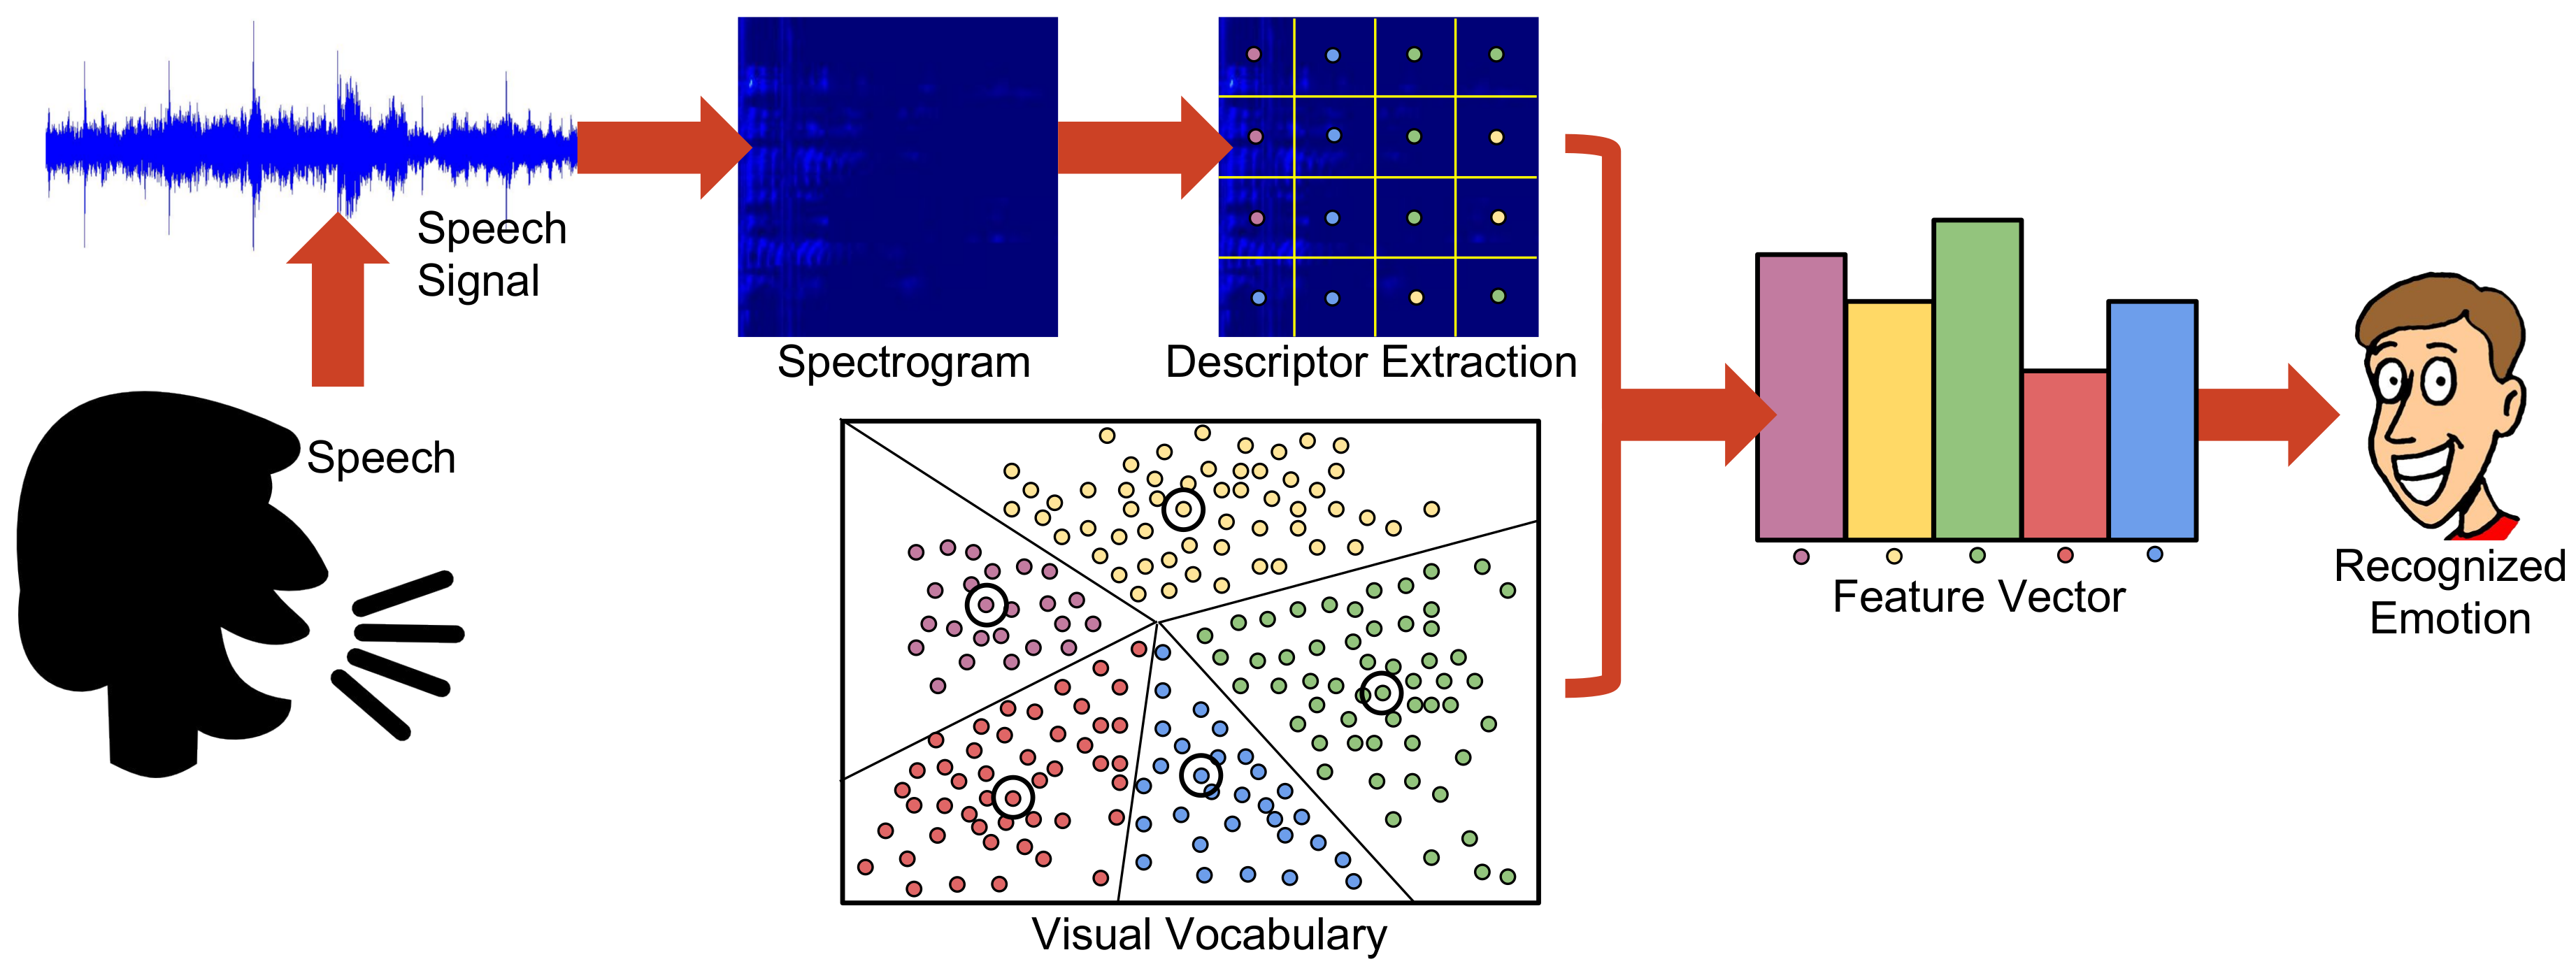
As a last step and regarding the extraction of visual features from spectrograms, we adopted a grid-based approach. Contrary to salient point approaches that first extract a set of points and extract descriptions from patches surrounding them, the first step of a grid-based approach is the selection of a rectangular grid. Each crossing of the grid is used to define a point (pixel) of interest. More specifically, we use a regular, i.e., square grid. From each resulting pixel, we extract the widely used Speeded-Up Robust Features (SURF) [47]. SURF are well-known for combining fast extraction speed, while being robust to several transformations and also illumination changes. Therefore, they have been adopted in many real-life computer-vision problems. Note that, in principle, SURF is both a salient point extraction and description scheme, yet we omit the first step and only use the latter. Although SURF salient regions have been effectively used into BoVW problems [48], in our case, initial experiments with part of the dataset indicated that the extracted number of points was rather small, and insufficient to produce effective histograms. Moreover, it has been demonstrated in [49] that the regions that result from grid-based image sampling may also carry useful information, which is in general adequate to provide a content description that can be used in classification schemes. For classification, we trained support vector machines (SVMs) with kernels on the extracted feature vectors. In Figure 5, we illustrate a visual overview of the whole process, which may be summarized by the following steps: (a) capturing of raw speech signal; (b) spectrogram generation; (c) descriptor extraction; (d) feature vector generation based on a previously constructed visual vocabulary; and (e) emotion recognition by feature vector classification using a previously trained SVM classifier.
4. Experiments
In this section, we describe the artificial datasets that we have used and also the real-life one that has been created within a classroom experiment. Moreover, we present several implementation details and also the results of the performed experiments.
4.1. Artificial Datasets
The first part of our experimental evaluation consisted of experiments using three widely known and freely available datasets of three different languages and also another custom dataset. More specifically, we used: (a) EMOVO [44], which is an emotional speech dataset in Italian. Six actors (three women/three men) performed 14 sentences, simulating six emotional states, i.e., disgust, fear, anger, joy, surprise, sadness plus the neutral state; (b) SAVEE [46], which is a larger emotional speech dataset in English. Four native English male speakers performed each 15 sentences per emotion, representing the same emotions as in EMOVO; (c) EMO-DB [45], which is an emotional speech dataset in German. Five male and 5 female actors performed 493 utterances in total, simulating anger, boredom, disgust, fear, happiness, sadness and neutral. The recordings were collected in an anechoic chamber with high-quality recording equipment; and (d) MOVIES which is a custom made dataset that has been annotated by several researchers of NCSR-“Demokritos.” It includes audio samples gathered from movies. All the movies used for the creation of this dataset were in English except one that was in Portuguese. Note that this sample was omitted from our evaluation, so that this dataset may be considered as a fully english one. For our task, we chose 5 of the common emotion classes, namely Happiness, Sadness, Anger, Fear and Neutral.
4.2. Real-Life Classroom Experiment
The in-classroom experiment, involved 24 middle school students (15 males/9 females). It was conducted within a school computer laboratory in Corfu, Greece. The participants were all aged between 12–13 years old. They all had some prior knowledge on robotic building and coding, since they had taken such courses in the past. During the experiment, their Information and Communications Technology (ICT) teacher was present the entire time. Her duties were (a) to describe in detail the task given, so that students would be able to accomplish it without any external help; and (b) to document their reactions during the experiments. Students were familiar with their teacher, so their emotional reactions were expected to be authentic and they were randomly divided into two teams. Specific care was taken so that both teams consisted of both male and female students and contained members of various levels of robotics’ knowledge. Each team was assigned with a different task which involved building and programming an educational robot using LEGO Mindstorm EVE 3 Educational kit [50]. Note that both tasks were considered to be of the same difficulty level. Programming involved both the Lego Mindstorm software and MIT Scratch [51]. It is rather important to point out that all students involved have volunteered to take this course among several other options and were in general satisfied with the use of Mindstorm kits in many previous activities.
The first team was instructed to program the robot to perform several tasks such as “move forward”, “turn right”, “turn left”, and “lift and drop certain small objects”. Controlling the robot was performed via a smart mobile phone. The second team was instructed to program the robot to follow a pre-defined route (using simple “line-follow”) by equipping the robot with an Red-Green-Blue (RGB) color sensor, select small LEGO bricks of red color only and push them outside of the canvas. Both teams were not given any instructions about the size or type of robot, and there were no further instructions or interference by the instructor. Upon the completion of the tasks, students were interviewed separately by the instructor and they were asked to describe their experience encouraging them to express their emotions during the whole procedure. The interviews were recorded using a computer microphone and annotated based on the students’ vocal and facial appearance, according to the instructor’s experience. Special care had been taken so that all recordings took place within an environment free of ambient noises. Additionally, recordings were post-processed using the Audacity Software [52], in order to remove parts with silence and/or the voice of the instructor. This way, we ended up with 42 recordings, with an average duration of 7.8 seconds. Upon the annotation process, the dataset consisted of 24 samples with a positive emotion, eight with a negative and ten with a neutral. We shall refer to this dataset in the following as “kids”.
4.3. Results
In both cases, we experimented with segments with and sec, msec and step msec. For the vocabulary size, we used . The BoVW model has been implemented using the Computer Vision Toolbox of Matlab R2017a (R2017a, MathWorks, Natick, MA, USA) [53]. We used a grid of size . The spectrograms have sizes px and have been extracted using the pyAudioAnalysis open source Python library [54].
To validate the effectiveness of our approach, we have designed a series of experiments. Note that we also perform multilingual experiments, i.e., training and evaluation sets are comprised by audio samples originating from different languages. We remind that, in all cases, the emotion classes are Happiness, Sadness, Anger, Fear and Neutral. To imitate real-life situations where recognition takes place within a noisy environment, we have also added noisy samples, as we have already described in Section 3.2.
Validity threats during the experiment both internal and/or external have been identified so as to be avoided or controlled. Internal threats consisted of (a) the lack of understanding the process of the experiment by the students; (b) the possibility of the participants’ fatigue during the experiment; (c) the level of students’ academic performance and ability; and (d) the possibility of one or more students dropping out due to lack of interest. The only external threat consisted of the number of students participating; this could mean that the results are under-represented.
At each experiment, we keep the 90% of the samples of the smallest class for training. All remaining samples are used for evaluation. We run each experiment 10 times and we estimate the average F score. Then, in Table 1, we report the best average F score, in terms of the visual vocabulary size N. In the first series of experiments, samples originating from the same language are included in both training and validation sets for the cases of both regular and noisy samples. In this case, best results were achieved in all experiments by using visual vocabularies of size N so that 1100 1500. In the second series of experiments, we aimed to assess whether the proposed approach may be used for cross-language scenarios. A major difficulty in such cases is the great differences between languages, since, besides the linguistic differences, there are also cultural ones, i.e., big variability in the way each emotion is expressed. To this goal, training and testing do not contain samples from the same language. In that case, best results were achieved in all experiments by using visual vocabularies of size N so that 100 400. As it may be observed in Table 1, in many cases, the proposed approach shows adequate performance in cross-language experiments. In particular, the more training sets that are available, the bigger the increase of performance is observed. Moreover, in all cases, it is robust to noise showing in all cases of comparable performance.
We compared our approach with a baseline one (which will be referred to as “baseline 1”) that used an SVM classifier using an early fusion approach on standard features. More specifically, we used Histograms of Oriented Gradients (HOGs) [55], Local Binary Patterns [56] and histograms of color coefficients. Feature extraction has been performed in a grid rationale, i.e., all features have been computed on four grids and then the resulting feature vectors were merged to a single feature vector that represents the whole image. We also compared our approach to one that was based on early fusion of several short-term audio features (which will be referred to as “baseline 2”), i.e., features extracted on the speech signal. These features have been extracted using [54] and are zero-crossing rate, energy, entropy of energy, spectral centroid, spectral spread, spectral entropy, spectral flux, spectral rolloff, mel frequency cepstral coefficients, a chroma vector and the chroma deviation. As it may be observed in Table 2, in almost all cases, the proposed BoVW scheme outperformed the baseline approaches. Note that, for comparisons, we did not perform any cross-language experiment. In addition, in case of the kids dataset, since it originated from a significantly different domain, we felt that we should not use it in cross-language experiments.
5. Conclusions and Future Work
In education, there is a difficulty in recognizing as well as regulating the emotions of children and this is where current state-of-the-art research and technology “steps-in” to assist the educator to identify emotions in a faster and a more sufficient way so as to try and control any negative outcome.
In this framework, we presented herein an approach for recognizing the emotional state of humans, relying only on audio information. More specifically, our approach extracts non-linguistic information from spectrograms that represent audio segments. From each spectrogram, we overlaid a sampling grid and extracted a set of interest points. From each, we extracted SURF features and used them to train a BoVW model, which was then used for emotion classification with SVMs. We evaluated the proposed approach on three publicly available artificial datasets. On top of that, we created a dataset that consisted of real-life recordings from middle-school students. Our experimental results show that, in almost all cases, the proposed approach outperformed two baseline approaches: one that also worked on visual features from spectrograms and another that relied on audio spectral features. It should be also pointed out that our approach does not rely at any step on spectral features. Within our future work, we plan to enhance the application domain of our methodology and perform experiments targeting on students with learning difficulties, where emotion expression is somehow more difficult to retrieve and assess. Furthermore, we plan to conduct research on how this system could evolve, so as to be used as a stealth assessment technique, in order to extract real-time information from students, evaluate students’ acquired knowledge, make accurate inferences of competencies and manage to react in immediate and meaningful ways.
In conclusion, we feel that emotion recognition is a research area that will attract interest of many application areas, apart from education. We feel that most popular fields of application may include: (a) dynamical marketing which would become adaptive to the emotional reactions of users (i.e., of potential customers); (b) smart cars, i.e., for recognizing the drivers’ emotional states e.g., for the prevention of accidents due to an unpleasant one; (c) evaluation of personality of candidates e.g., during an interview; (d) evaluation either of employees or of satisfaction acquired by users during their interaction e.g., in call centers; and (e) enhancing gaming experience by understanding the players’ emotional response and dynamically changing the scenario of the game.
Author Contributions
The conceptualization of the approach was done by E.S., R.N., I.V., and P.M.; E.S., and P.M. performed the theoretical analysis, R.N., and I.V. focused on the practical analysis and experimentation. E.S., R.N., I.V., and P.M. validated the theoretical analysis and experimentation results. P.M., and E.S. supervised the process. All authors analyzed the results, and contributed to writing and reviewing the manuscript.
Funding
This research has been co-financed by the European Union and Greek national funds through the Operational Program Competitiveness, Entrepreneurship and Innovation, under the call RESEARCH–CREATE–INNOVATE (project code: T1EDK-02070). Part of work presented in this document is a result of the MaTHiSiS project. This project has received funding from the European Union’s Horizon 2020 Programme (H2020-ICT-2015) under Grant No. 687772.
Conflicts of Interest
The authors declare no conflict of interest.
References
- Cowie, R.; Douglas-Cowie, E.; Tsapatsoulis, N.; Votsis, G.; Kollias, S.; Fellenz, W.; Taylor, J.G. Emotion recognition in human-computer interaction. IEEE Signal Process. Mag. 2001, 18, 32–80. [Google Scholar] [CrossRef]
- Poria, S.; Chaturvedi, I.; Cambria, E.; Hussain, A. Convolutional MKL based multimodal emotion recognition and sentiment analysis. In Proceedings of the 2016 IEEE 16th International Conference on Data Mining, Barcelona, Spain, 12–15 December 2016; pp. 439–448. [Google Scholar]
- Zeng, E.; Mare, S.; Roesner, F. End user security and privacy concerns with smart homes. In Proceedings of the Third Symposium on Usable Privacy and Security (SOUPS), Pittsburgh, PA, USA, 18–20 July 2007. [Google Scholar]
- Anagnostopoulos, C.N.; Iliou, T.; Giannoukos, I. Features and classifiers for emotion recognition from speech: A survey from 2000 to 2011. Artif. Intell. Rev. 2015, 43, 155–177. [Google Scholar] [CrossRef]
- El Ayadi, M.; Kamel, M.S.; Karray, F. Survey on speech emotion recognition: Features, classification schemes, and databases. Pattern Recognit. 2011, 44, 572–587. [Google Scholar] [CrossRef]
- Alibali, M.W.; Knuth, E.J.; Hattikudur, S.; McNeil, N.M.; Stephens, A.C. A Longitudinal Examination of Middle School Students’ Understanding of the Equal Sign and Equivalent Equations. Math. Think. Learn. 2007, 9, 221–247. [Google Scholar] [CrossRef]
- Fei-Fei, L.; Perona, P. A bayesian hierarchical model for learning natural scene categories. In Proceedings of the 2005 IEEE Computer Society Conference on Computer Vision and Pattern Recognition, San Diego, CA, USA, 20–25 June 2005; Volume 2, pp. 524–531. [Google Scholar]
- Spyrou, E.; Giannakopoulos, T.; Sgouropoulos, D.; Papakostas, M. Extracting emotions from speech using a bag-of-visual-words approach. In Proceedings of the 12th International Workshop on Semantic and Social Media Adaptation and Personalizationon, Bratislava, Slovakia, 9–10 July 2017; pp. 80–83. [Google Scholar]
- Wang, Y.; Guan, L. Recognizing human emotional state from audiovisual signals. IEEE Trans. Multimedia 2008, 10, 936–946. [Google Scholar] [CrossRef]
- Nwe, T.L.; Foo, S.W.; De Silva, L.C. Speech emotion recognition using hidden Markov models. Speech Commun. 2003, 41, 603–623. [Google Scholar] [CrossRef]
- Hanjalic, A. Extracting moods from pictures and sounds: Towards truly personalized TV. IEEE Signal Process. Mag. 2006, 23, 90–100. [Google Scholar] [CrossRef]
- Lu, L.; Liu, D.; Zhang, H.J. Automatic mood detection and tracking of music audio signals. IEEE Trans. Audio Speech Lang. Process. 2006, 14, 5–18. [Google Scholar] [CrossRef]
- Yang, Y.H.; Lin, Y.C.; Su, Y.F.; Chen, H.H. A regression approach to music emotion recognition. IEEE Trans. Audio Speech Lang. Process. 2008, 16, 448–457. [Google Scholar] [CrossRef]
- Wöllmer, M.; Eyben, F.; Reiter, S.; Schuller, B.; Cox, C.; Douglas-Cowie, E.; Cowie, R. Abandoning emotion classes-towards continuous emotion recognition with modelling of long-range dependencies. In Proceedings of the INTERSPEECH 9th Annual Conference of the International Speech Communication Association, Brisbane, Australia, 22–26 September 2008; pp. 597–600. [Google Scholar]
- Giannakopoulos, T.; Pikrakis, A.; Theodoridis, S. A dimensional approach to emotion recognition of speech from movies. In Proceedings of the 2009 IEEE International Conference on Acoustics, Speech and Signal Processing, Taipei, Taiwan, 19–24 April 2009; pp. 65–68. [Google Scholar]
- Grimm, M.; Kroschel, K.; Mower, E.; Narayanan, S. Primitives-based evaluation and estimation of emotions in speech. Speech Commun. 2007, 49, 787–800. [Google Scholar] [CrossRef]
- Robert, P. Emotion: Theory, Research, and Experience. Vol. 1: Theories of Emotion; Academic Press: Cambridge, MA, USA, 1980. [Google Scholar]
- Lee, H.; Pham, P.; Largman, Y.; Ng, A.Y. Unsupervised feature learning for audio classification using convolutional deep belief networks. In Proceedings of the 22nd International Conference on Neural Information Processing Systems, Vancouver, BC, Canada, 7–10 December 2009; pp. 1096–1104. [Google Scholar]
- Zhang, T.; Kuo, C.C.J. Audio content analysis for online audiovisual data segmentation and classification. IEEE Trans. Speech Audio Process. 2001, 9, 441–457. [Google Scholar] [CrossRef]
- He, L.; Lech, M.; Maddage, N.; Allen, N. Stress and emotion recognition using log-Gabor filter analysis of speech spectrograms. In Proceedings of the 3rd International Conference on Affective Computing and Intelligent Interaction and Workshops, Amsterdam, Netherlands, 10–12 September 2009; pp. 1–6. [Google Scholar]
- Mao, Q.; Dong, M.; Huang, Z.; Zhan, Y. Learning salient features for speech emotion recognition using convolutional neural networks. IEEE Trans. Multimedia 2014, 16, 2203–2213. [Google Scholar] [CrossRef]
- Papakostas, M.; Spyrou, E.; Giannakopoulos, T.; Siantikos, G.; Sgouropoulos, D.; Mylonas, P.; Makedon, F. Deep Visual Attributes vs. Hand-Crafted Audio Features on Multidomain Speech Emotion Recognition. Computation 2017, 5, 26. [Google Scholar] [CrossRef]
- Picard, R.W.; Papert, S.; Bender, W.; Blumberg, B.; Breazeal, C.; Cavallo, D.; Machover, T.; Resnick, M.; Roy, D.; Strohecker, C. Affective learning—A manifesto. BT Technol. J. 2004, 22, 253–269. [Google Scholar] [CrossRef]
- Mahn, H.; John-Steiner, V. The gift of confidence: A Vygotskian view of emotions. In Learning for Life in the 21st Century: Sociocultural Perspectives on the Future of Education; Wiley: Hoboken, NJ, USA, 2002; pp. 46–58. [Google Scholar] [CrossRef]
- Kołakowska, A.; Landowska, A.; Szwoch, M.; Szwoch, W.; Wrobel, M.R. Emotion recognition and its applications. Hum. Comput. Syst. Interact. Backgr. Appl. 2014, 3, 51–62. [Google Scholar]
- Sutton, R.E.; Wheatley, K.F. Teachers’ emotions and teaching: A review of the literature and directions for future research. Educ. Psychol. Rev. 2003, 15, 327–358. [Google Scholar] [CrossRef]
- Howes, C. Social-emotional classroom climate in child care, child-teacher relationships and children’s second grade peer relations. Soc. Dev. 2000, 9, 191–204. [Google Scholar] [CrossRef]
- Sutton, R.E. Emotional regulation goals and strategies of teachers. Soc. Psychol. Educ. 2004, 7, 379–398. [Google Scholar] [CrossRef]
- Fried, L. Teaching teachers about emotion regulation in the classroom. Aust. J. Teach. Educ. 2011, 36, 3. [Google Scholar] [CrossRef]
- Macklem, G.L. Practitioner’s Guide to Emotion Regulation in School-Aged Children; Springer Science and Business Media: New York, NY, USA, 2007. [Google Scholar]
- Macklem, G.L. Boredom in the Classroom: Addressing Student Motivation, Self-Regulation, and Engagement in Learning; Springer: New York, NY, USA, 2015; Volume 1. [Google Scholar]
- Linnenbrink, E.A.; Pintrich, P.R. Multiple pathways to learning and achievement: The role of goal orientation in fostering adaptive motivation, affect, and cognition. In Intrinsic and Extrinsic Motivation: The Search for Optimal Motivation and Performance; Sansone, C., Harackiewicz, J.M., Eds.; Academic Press: San Diego, CA, USA, 2000; pp. 195–227. [Google Scholar] [CrossRef]
- Weare, K. Developing the Emotionally Literate School; Sage: London, UK, 2003. [Google Scholar]
- Martiínez, J.G. Recognition and emotions. A critical approach on education. Procedia Soc. Behav. Sci. 2012, 46, 3925–3930. [Google Scholar] [CrossRef]
- Tickle, A.; Raghu, S.; Elshaw, M. Emotional recognition from the speech signal for a virtual education agent. J. Phys. Conf. Ser. 2013, 450, 012053. [Google Scholar] [CrossRef]
- Bahreini, K.; Nadolski, R.; Westera, W. Towards real-time speech emotion recognition for affective e-learning. Educ. Inf. Technol. 2016, 21, 1367–1386. [Google Scholar] [CrossRef]
- Bahreini, K.; Nadolski, R.; Qi, W.; Westera, W. FILTWAM—A framework for online game-based communication skills training—Using webcams and microphones for enhancing learner support. In The 6th European Conference on Games Based Learning (ECGBL); Felicia, P., Ed.; Academic Conferences and Publishing International: Reading, UK, 2012; pp. 39–48. [Google Scholar]
- Arroyo, I.; Cooper, D.G.; Burleson, W.; Woolf, B.P.; Muldner, K.; Christopherson, R. Emotion sensors go to school. AIED 2009, 200, 17–24. [Google Scholar]
- Kim, Y.; Soyata, T.; Behnagh, R.F. Towards emotionally aware AI smart classroom: Current issues and directions for engineering and education. IEEE Access 2018, 6, 5308–5331. [Google Scholar] [CrossRef]
- Spyrou, E.; Vretos, N.; Pomazanskyi, A.; Asteriadis, S.; Leligou, H.C. Exploiting IoT Technologies for Personalized Learning. In Proceedings of the 2018 IEEE Conference on Computational Intelligence and Games (CIG), Maastricht, The Netherlands, 14–17 August 2018; pp. 1–8. [Google Scholar]
- Tsatsou, D.; Pomazanskyi, A.; Hortal, E.; Spyrou, E.; Leligou, H.C.; Asteriadis, S.; Vretos, N.; Daras, P. Adaptive Learning Based on Affect Sensing. Int. Conf. Artif. Intell. Educ. 2018, 10948, 475–479. [Google Scholar]
- Harris, Z.S. Distributional structure. Word 1954, 10, 146–162. [Google Scholar] [CrossRef]
- Sivic, J.; Zisserman, A. Efficient visual search of videos cast as text retrieval. IEEE Trans. Pattern Anal. Mach. Intell. 2009, 31, 591–606. [Google Scholar] [CrossRef] [PubMed]
- Costantini, G.; Iaderola, I.; Paoloni, A.; Todisco, M. Emovo corpus: An italian emotional speech database. In Proceedings of the International Conference on Language Resources and Evaluation (LREC 2014), Reykjavik, Iceland, 26–31 May 2014; pp. 3501–3504. [Google Scholar]
- Burkhardt, F.; Paeschke, A.; Rolfes, M.; Sendlmeier, W.F.; Weiss, B. A database of German emotional speech. In Proceedings of the Ninth European Conference on Speech Communication and Technology, Lisbon, Portugal, 4–8 September 2005. [Google Scholar]
- Haq, S.; Jackson, P.J.; Edge, J. Speaker-dependent audio-visual emotion recognition. In Proceedings of the 2009 International Conference on Auditory-Visual Speech Processing, Norwich, UK, 10–13 September 2009; pp. 53–58. [Google Scholar]
- Bay, H.; Ess, A.; Tuytelaars, T.; Van Gool, L. Speeded-up robust features (SURF). Comput. Vis. Image Underst. 2008, 110, 346–359. [Google Scholar] [CrossRef]
- Alfanindya, A.; Hashim, N.; Eswaran, C. Content Based Image Retrieval and Classification using speeded-up robust features (SURF) and grouped bag-of-visual-words (GBoVW). In Proceedings of the 2013 International Conference on Technology, Informatics, Management, Engineering and Environment, Bandung, Indonesia, 23–26 June 2013. [Google Scholar]
- Tuytelaars, T. Dense interest points. In Proceedings of the 2010 IEEE Computer Society Conference on Computer Vision and Pattern Recognition, San Francisco, CA, USA, 13–18 June 2010; pp. 2281–2288. [Google Scholar]
- Mindstorms. Available online: https://www.lego.com/en-us/mindstorms (accessed on 3 February 2019).
- Scratch. Available online: https://scratch.mit.edu/ (accessed on 3 February 2019).
- Audacity. Available online: https://www.audacityteam.org/ (accessed on 3 February 2019).
- MATLAB and Computer Vision Toolbox Release, 2017a; The MathWorks, Inc.: Natick, MA, USA.
- Giannakopoulos, T. pyaudioanalysis: An open-source python library for audio signal analysis. PLoS ONE 2015, 10, e0144610. [Google Scholar] [CrossRef] [PubMed]
- Dalal, N.; Triggs, B. Histograms of oriented gradients for human detection. In Proceedings of the 2005 IEEE Computer Society Conference on Computer Vision and Pattern Recognition, San Diego, CA, USA, 20–25 June 2005; Volume 1, pp. 886–893. [Google Scholar]
- Guo, Z.; Zhang, L.; Zhang, D. A completed modeling of local binary pattern operator for texture classification. IEEE Trans. Image Process. 2010, 19, 1657–1663. [Google Scholar] [PubMed]
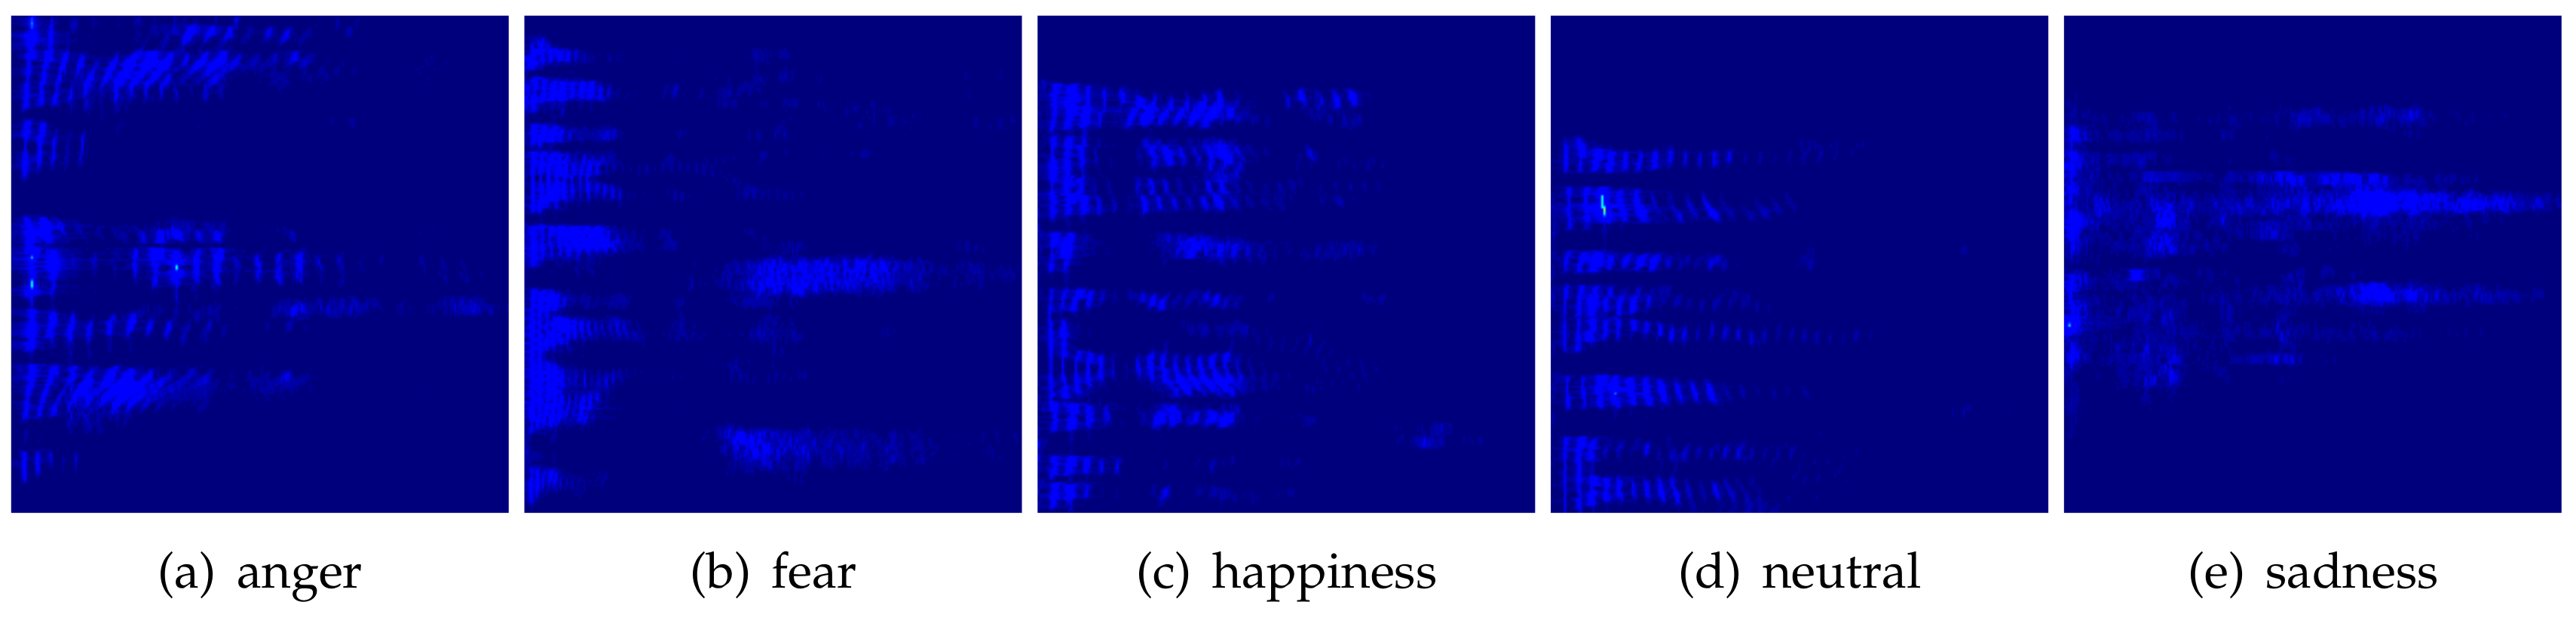
Figure 1.
Example pseudocolored spectrogram images per emotion that have been generated from the EMOVO [44] dataset. First row: actual audio segments; second row: audio segments with added noise (the figure is best viewed in color, images have been post-processed for illustration purposes).
Figure 1.
Example pseudocolored spectrogram images per emotion that have been generated from the EMOVO [44] dataset. First row: actual audio segments; second row: audio segments with added noise (the figure is best viewed in color, images have been post-processed for illustration purposes).


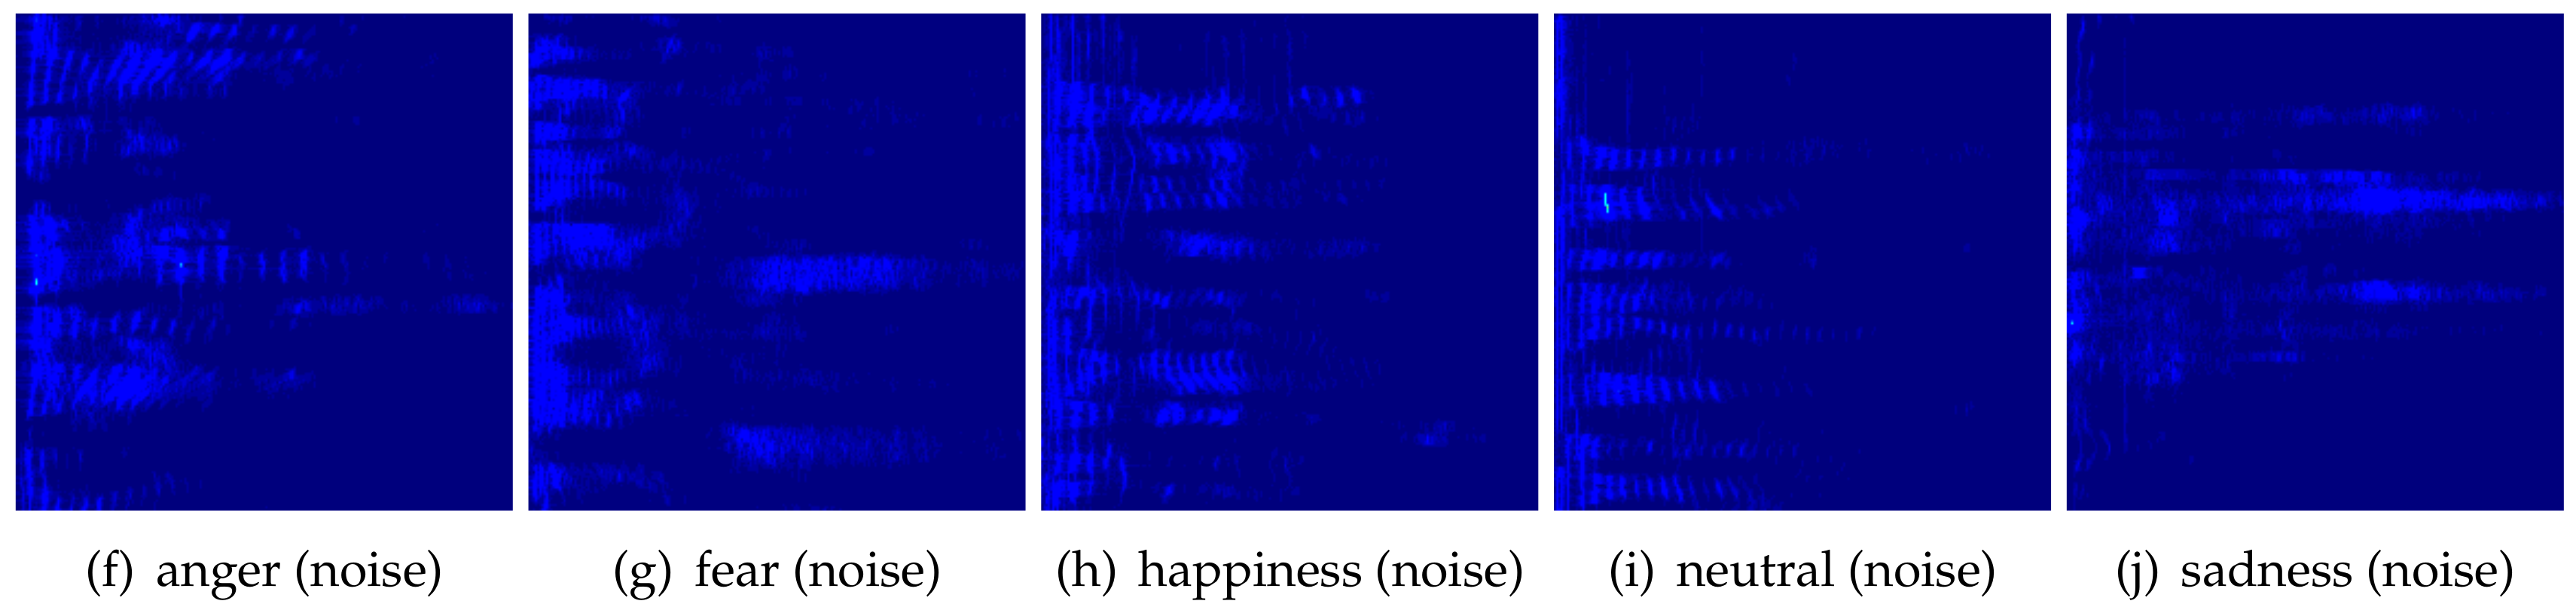
Figure 2.
Example pseudocolored spectrogram images per emotion that have been generated from the EMO-DB [45] dataset. First row: actual audio segments; second row: audio segments with added noise (the figure is best viewed in color, images have been post-processed for illustration purposes).
Figure 2.
Example pseudocolored spectrogram images per emotion that have been generated from the EMO-DB [45] dataset. First row: actual audio segments; second row: audio segments with added noise (the figure is best viewed in color, images have been post-processed for illustration purposes).

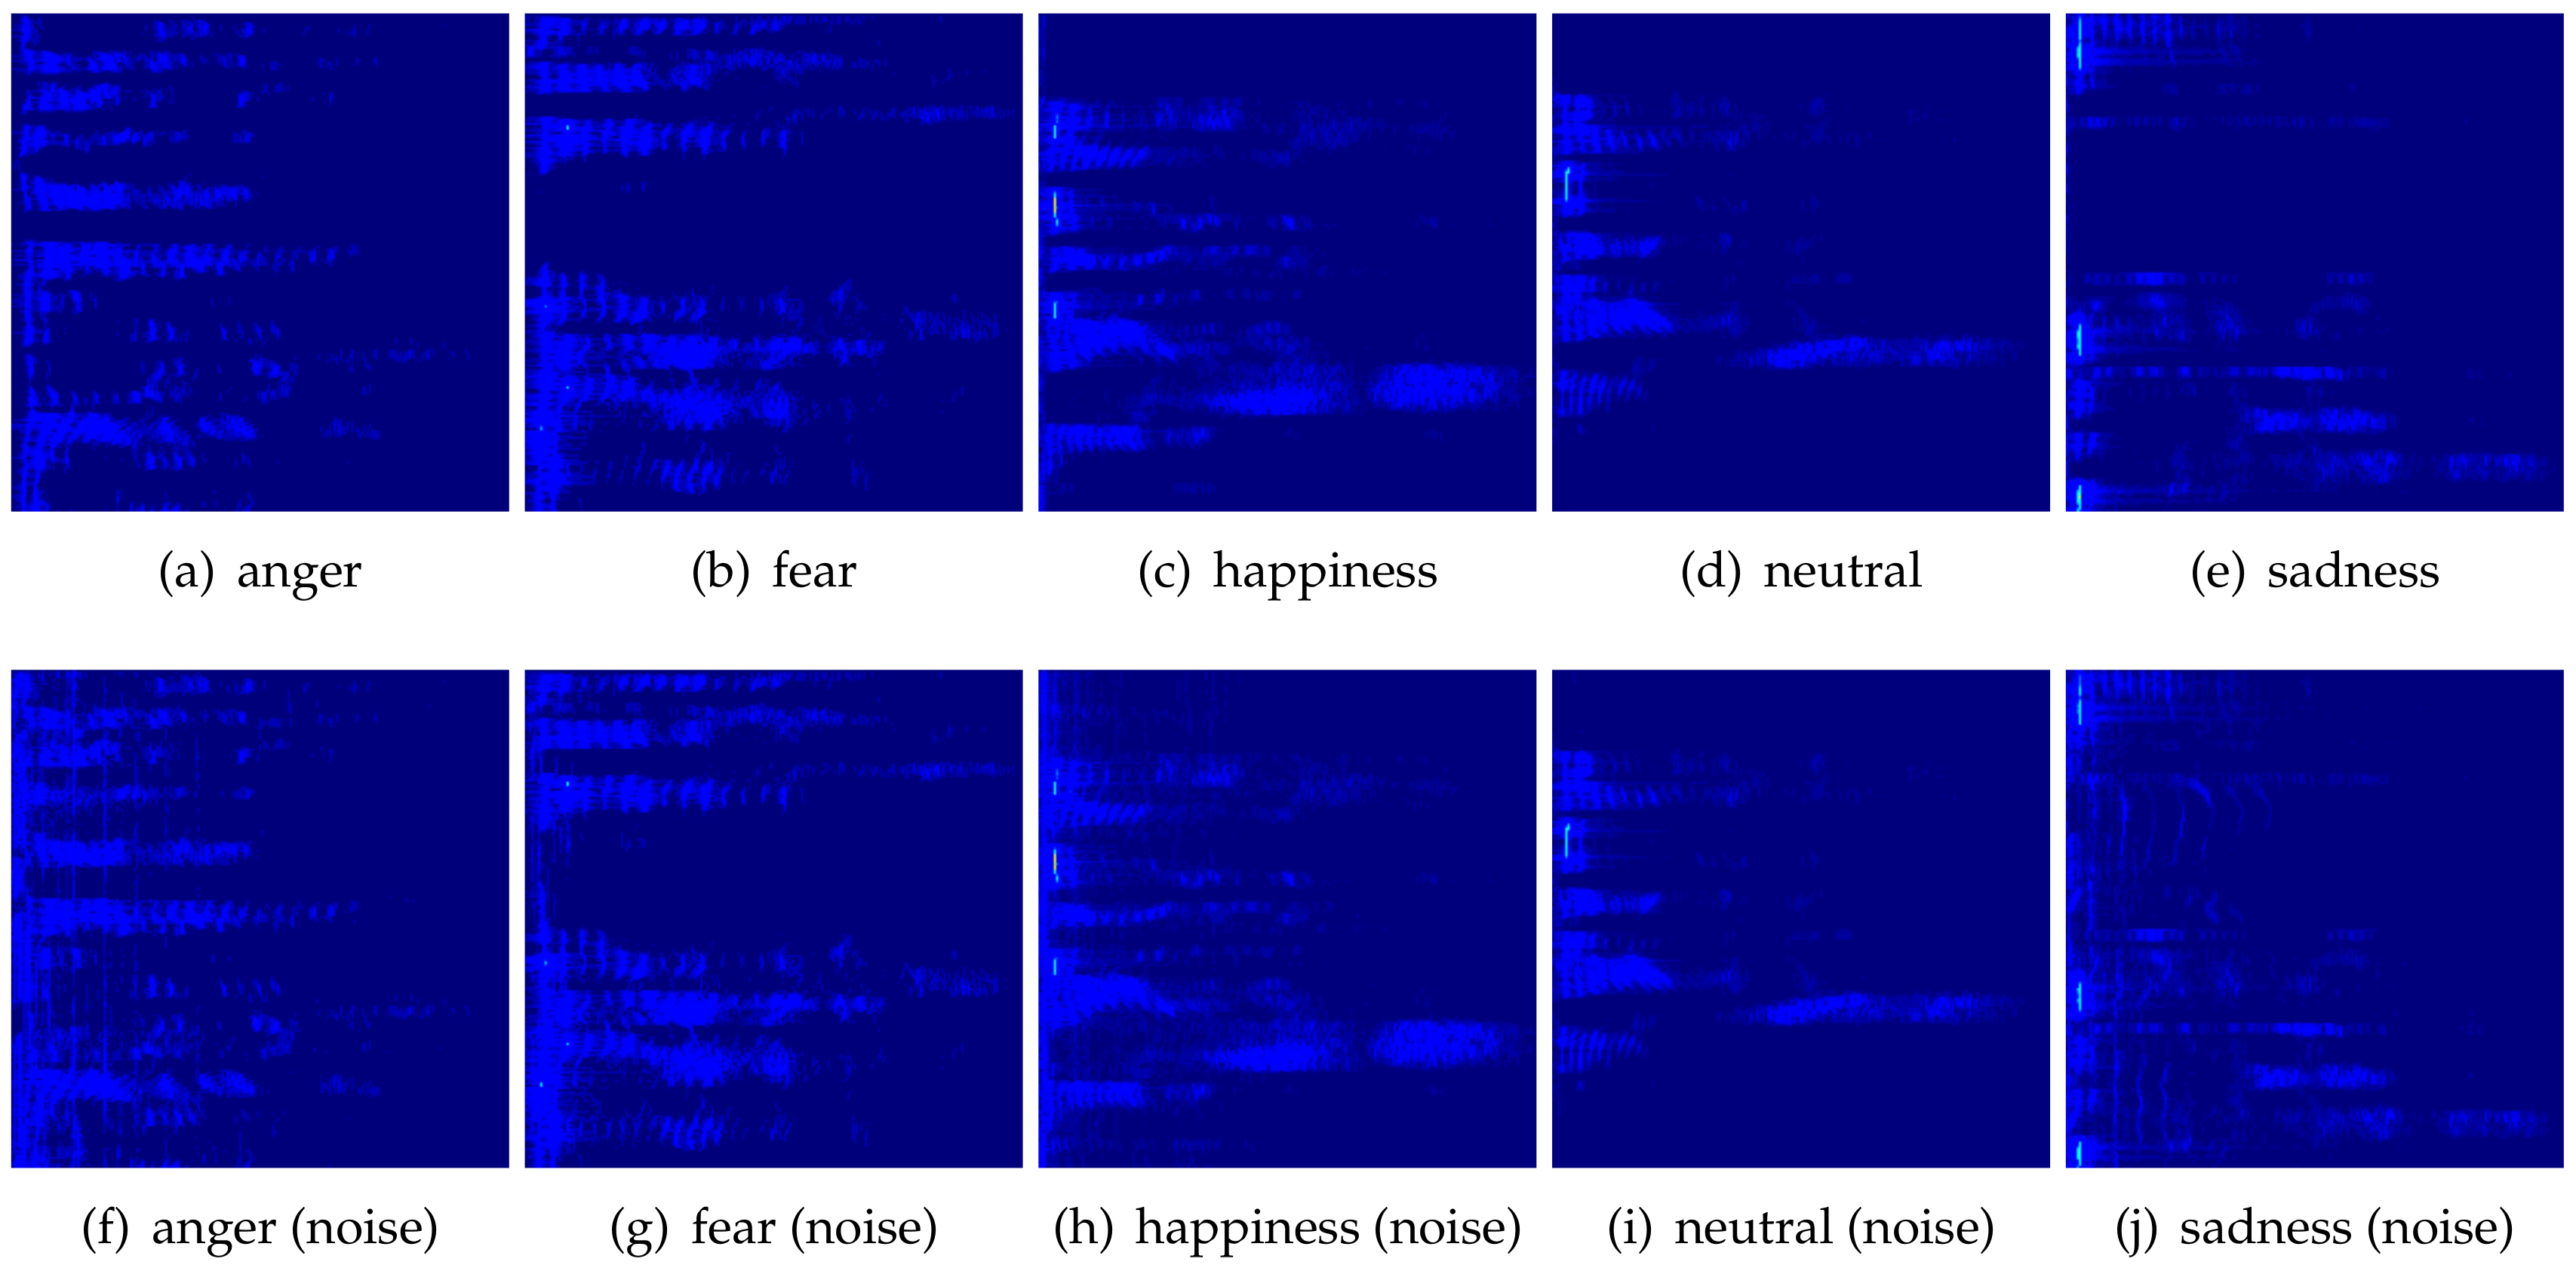
Figure 3.
Example pseudocolored spectrogram images per emotion that have been generated from the SAVEE [46] dataset. First row: actual audio segments; second row: audio segments with added noise (the figure is best viewed in color, images have been post-processed for illustration purposes).
Figure 3.
Example pseudocolored spectrogram images per emotion that have been generated from the SAVEE [46] dataset. First row: actual audio segments; second row: audio segments with added noise (the figure is best viewed in color, images have been post-processed for illustration purposes).

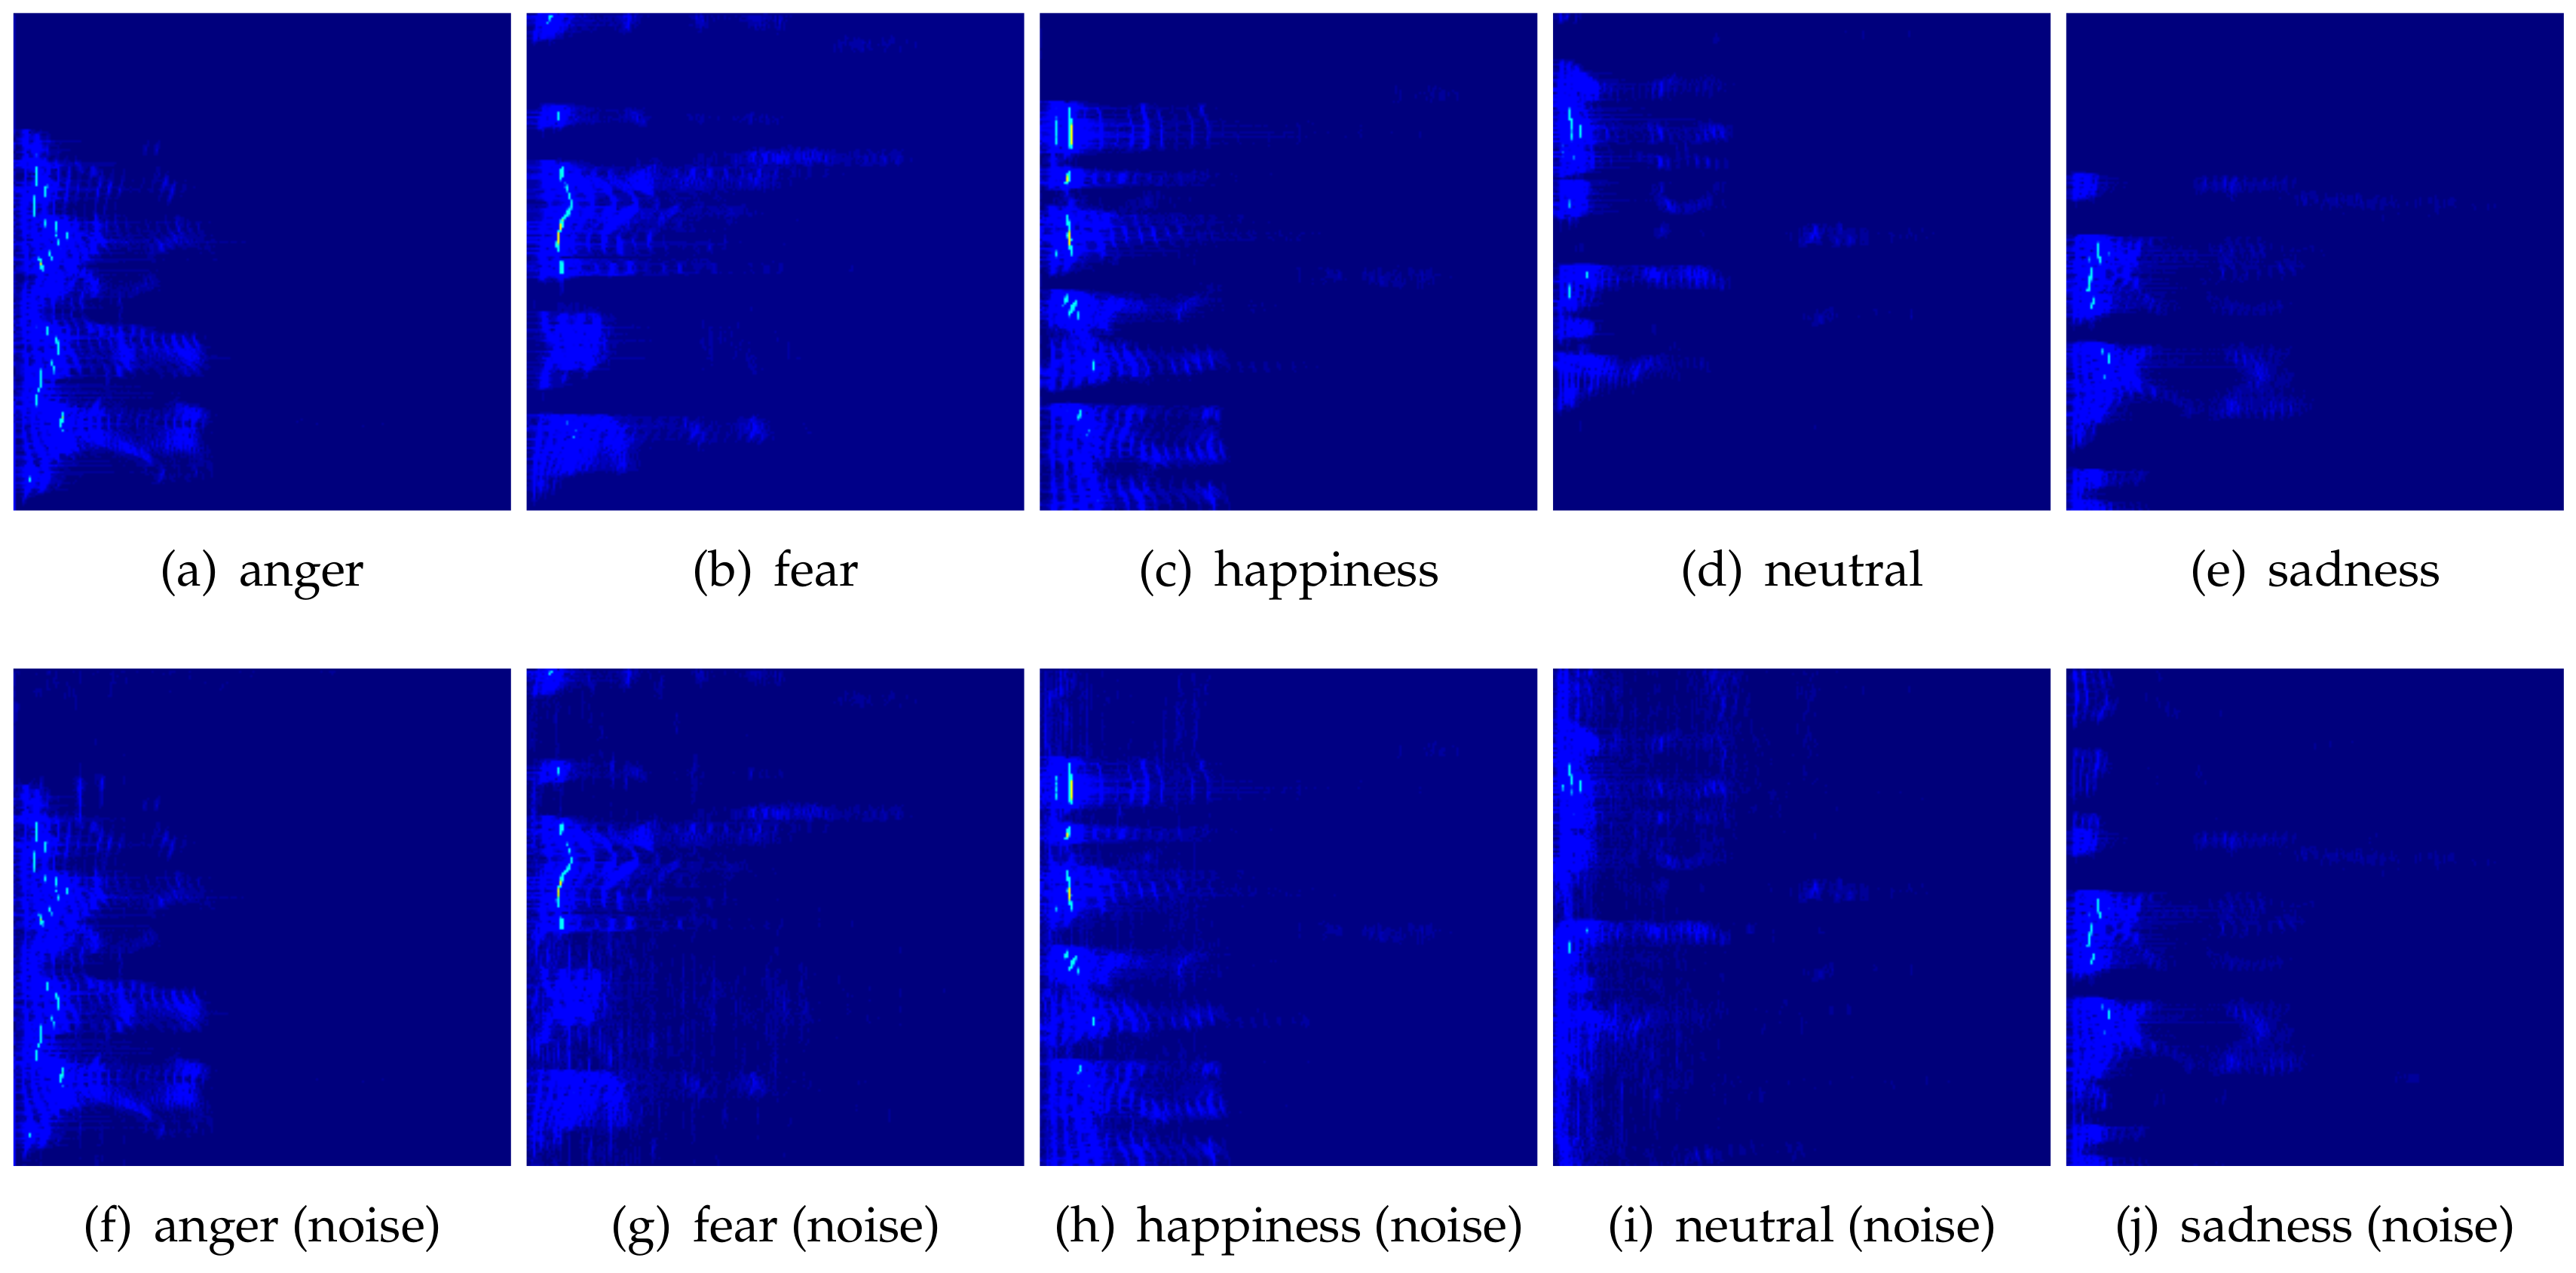
Figure 4.
Example pseudocolored spectrogram images per emotion that have been generated from the movies dataset. First row: actual audio segments; second row: audio segments with added noise (the figure is best viewed in color, images have been post-processed for illustration purposes).
Figure 4.
Example pseudocolored spectrogram images per emotion that have been generated from the movies dataset. First row: actual audio segments; second row: audio segments with added noise (the figure is best viewed in color, images have been post-processed for illustration purposes).

Figure 5.
A visual overview of the proposed emotion recognition scheme (the figure is best viewed in color).
Figure 5.
A visual overview of the proposed emotion recognition scheme (the figure is best viewed in color).


Table 1.
Experimental results for emotion recognition using all possible combinations of training and testing data sets, with the best vocabulary size per case.
Table 1.
Experimental results for emotion recognition using all possible combinations of training and testing data sets, with the best vocabulary size per case.
| Train | Test | With Noise | Without Noise | ||
|---|---|---|---|---|---|
| Vocabulary Size N | Best Mean-F Score | Vocabulary Size N | Best Mean-F Score | ||
| EMOVO, EMO-DB | EMOVO, EMO-DB | 1100 | 0.50 | 1400 | 0.51 |
| EMOVO, movies | EMOVO, movies | 500 | 0.39 | 1100 | 0.40 |
| EMOVO, SAVEE | EMOVO, SAVEE | 500 | 0.41 | 800 | 0.41 |
| EMOVO | EMOVO | 1100 | 0.49 | 800 | 0.54 |
| EMO-DB, movies | EMO-DB, movies | 800 | 0.49 | 1300 | 0.49 |
| EMO-DB, SAVEE | EMO-DB, SAVEE | 1000 | 0.50 | 1100 | 0.55 |
| EMO-DB | EMO-DB | 1500 | 0.65 | 500 | 0.64 |
| movies, SAVEE | movies, SAVEE | 1200 | 0.40 | 1500 | 0.39 |
| movies | movies | 1400 | 0.47 | 200 | 0.41 |
| SAVEE | SAVEE | 1500 | 0.43 | 1500 | 0.49 |
| EMOVO | EMO-DB | 200 | 0.40 | 100 | 0.43 |
| EMOVO | SAVEE | 1500 | 0.18 | 1500 | 0.18 |
| EMO-DB | EMOVO | 1500 | 0.37 | 100 | 0.37 |
| EMO-DB | SAVEE | 1400 | 0.14 | 700 | 0.14 |
| SAVEE | EMOVO | 1200 | 0.16 | 300 | 0.13 |
| SAVEE | EMO-DB | 1300 | 0.16 | 1500 | 0.14 |
| EMOVO | movies | 1300 | 0.22 | 200 | 0.20 |
| EMO-DB | movies | 500 | 0.24 | 700 | 0.29 |
| movies | EMOVO | 1300 | 0.28 | 500 | 0.30 |
| movies | EMO-DB | 900 | 0.38 | 400 | 0.35 |
| movies | SAVEE | 800 | 0.24 | 600 | 0.32 |
| SAVEE | movies | 1400 | 0.28 | 500 | 0.20 |
| SAVEE, movies, EMO-DB | EMOVO | 400 | 0.34 | 1300 | 0.34 |
| EMOVO, movies, SAVEE | EMO-DB | 300 | 0.43 | 400 | 0.48 |
| EMOVO, EMO-DB, SAVEE | movies | 200 | 0.27 | 1200 | 0.25 |
| EMOVO, EMO-DB, movies | SAVEE | 900 | 0.24 | 400 | 0.24 |
Table 2.
Comparative results of the proposed method with two baselines, in terms of F score and for all five aforementioned datasets (EMOVO, SAVEE, EMO-DB, movies, kids)—numbers in bold indicate best performance value.
Table 2.
Comparative results of the proposed method with two baselines, in terms of F score and for all five aforementioned datasets (EMOVO, SAVEE, EMO-DB, movies, kids)—numbers in bold indicate best performance value.
| Proposed | Baseline 1 | Baseline 2 | |
|---|---|---|---|
| EMOVO | 0.49 | 0.42 | 0.45 |
| SAVEE | 0.43 | 0.32 | 0.30 |
| EMO-DB | 0.65 | 0.68 | 0.80 |
| movies | 0.47 | 0.39 | 0.32 |
| kids | 0.83 | 0.73 | 0.75 |
© 2019 by the authors. Licensee MDPI, Basel, Switzerland. This article is an open access article distributed under the terms and conditions of the Creative Commons Attribution (CC BY) license (http://creativecommons.org/licenses/by/4.0/).
Share and Cite
MDPI and ACS Style
Spyrou, E.; Nikopoulou, R.; Vernikos, I.; Mylonas, P. Emotion Recognition from Speech Using the Bag-of-Visual Words on Audio Segment Spectrograms. Technologies 2019, 7, 20. https://0-doi-org.brum.beds.ac.uk/10.3390/technologies7010020
AMA Style
Spyrou E, Nikopoulou R, Vernikos I, Mylonas P. Emotion Recognition from Speech Using the Bag-of-Visual Words on Audio Segment Spectrograms. Technologies. 2019; 7(1):20. https://0-doi-org.brum.beds.ac.uk/10.3390/technologies7010020
Chicago/Turabian StyleSpyrou, Evaggelos, Rozalia Nikopoulou, Ioannis Vernikos, and Phivos Mylonas. 2019. "Emotion Recognition from Speech Using the Bag-of-Visual Words on Audio Segment Spectrograms" Technologies 7, no. 1: 20. https://0-doi-org.brum.beds.ac.uk/10.3390/technologies7010020
Note that from the first issue of 2016, this journal uses article numbers instead of page numbers. See further details here.