Power Density Distribution for Laser Additive Manufacturing (SLM): Potential, Fundamentals and Advanced Applications


Abstract
:
1. Introduction
- -
- An initial analysis of the control factors related to SLM machines on the prepared powders before production with the purpose of receiving confirmed experimental data of the current conditions of the materials and environment;
- -
- Improved techniques for pre-treatment of the powders: mechanical pre-treatment with the purpose of obtaining more regular shapes and sizes in the initial powder; thermal pre-treatment of the powders with the intent to remove excess air in powder and increase the density of the powder;
- -
- Improved techniques in mechanical post-treatment of the produced objects with the purpose of obtaining smoother surfaces; thermal post-treatment of the object with the intention of improving the internal microstructure and mechanical properties of the produced object;
- -
- Installation of in situ optical monitoring tools with the aim to control processing.
- (1)
- Investigation of principal abilities of laser power redistribution at the spot and mathematical corroboration of the developed approach;
- (2)
- Development of the experimental setup for power density redistribution and verification of the developed system;
- (3)
- Demonstration of energy redistribution using the designed system and characterization of the specimens;
- (4)
- Supporting the obtained data by video monitoring and optical diagnostics.
2. Materials and Methods
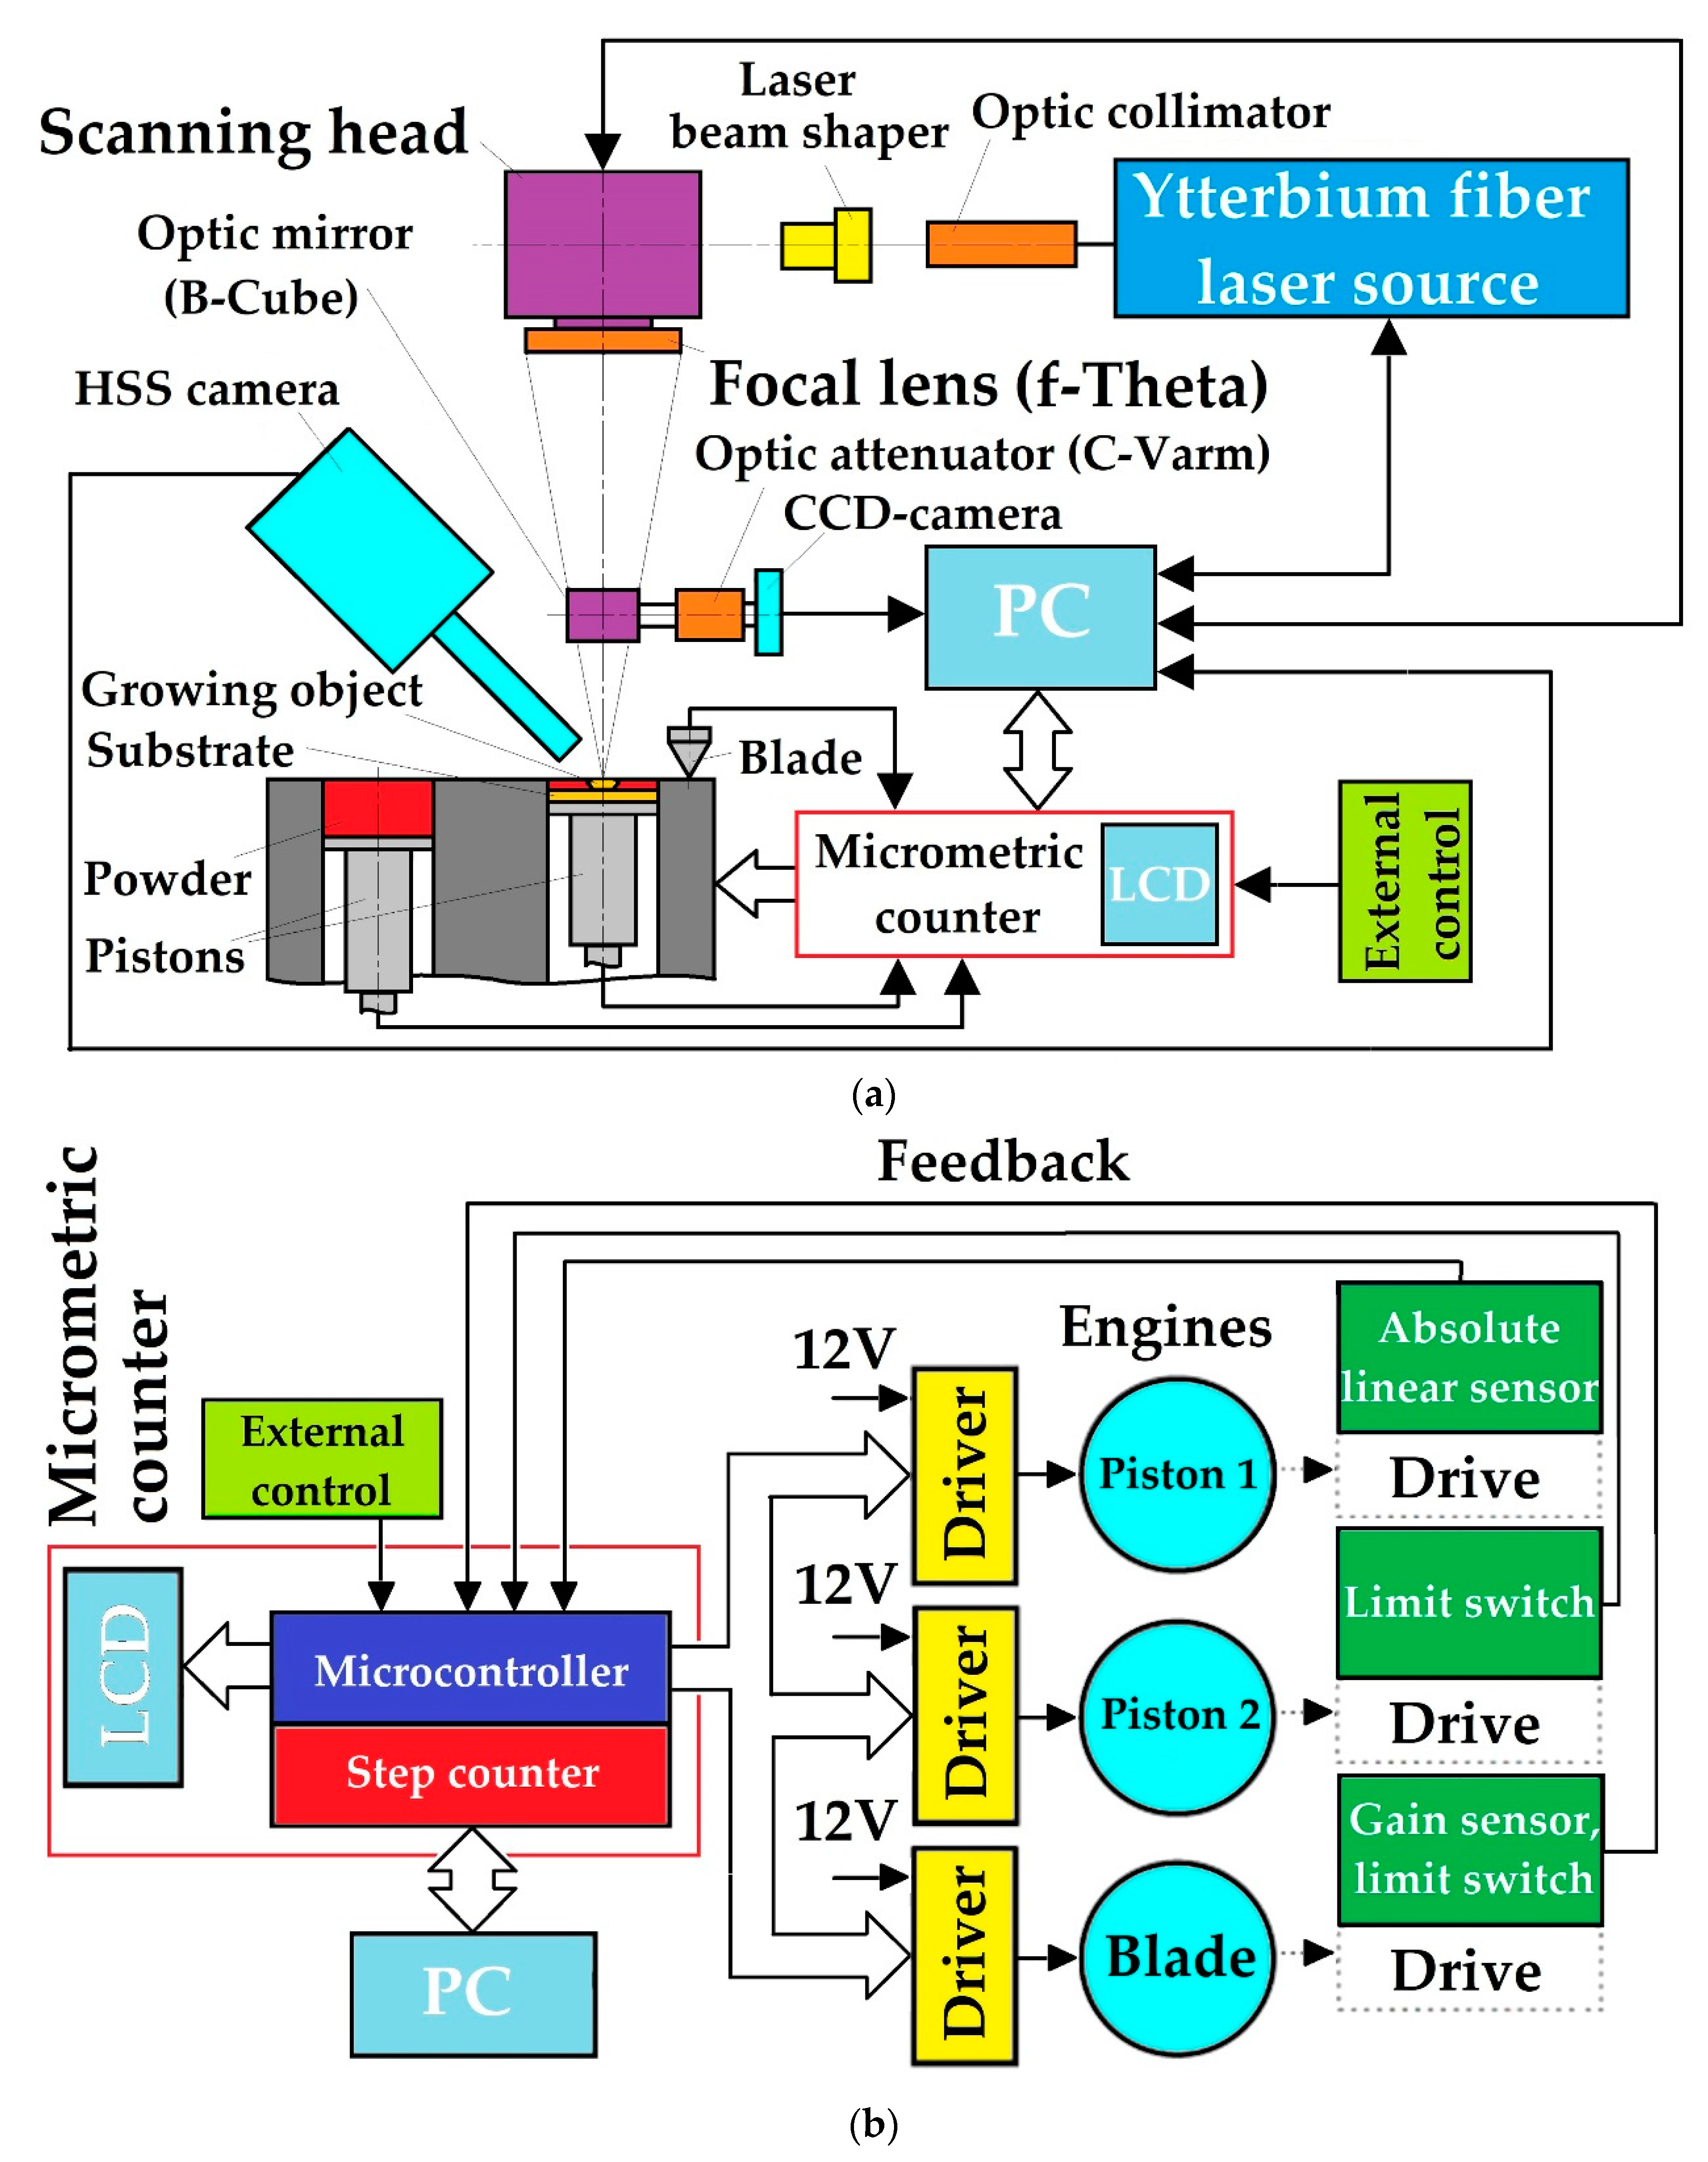
2.1. Experimental Setup
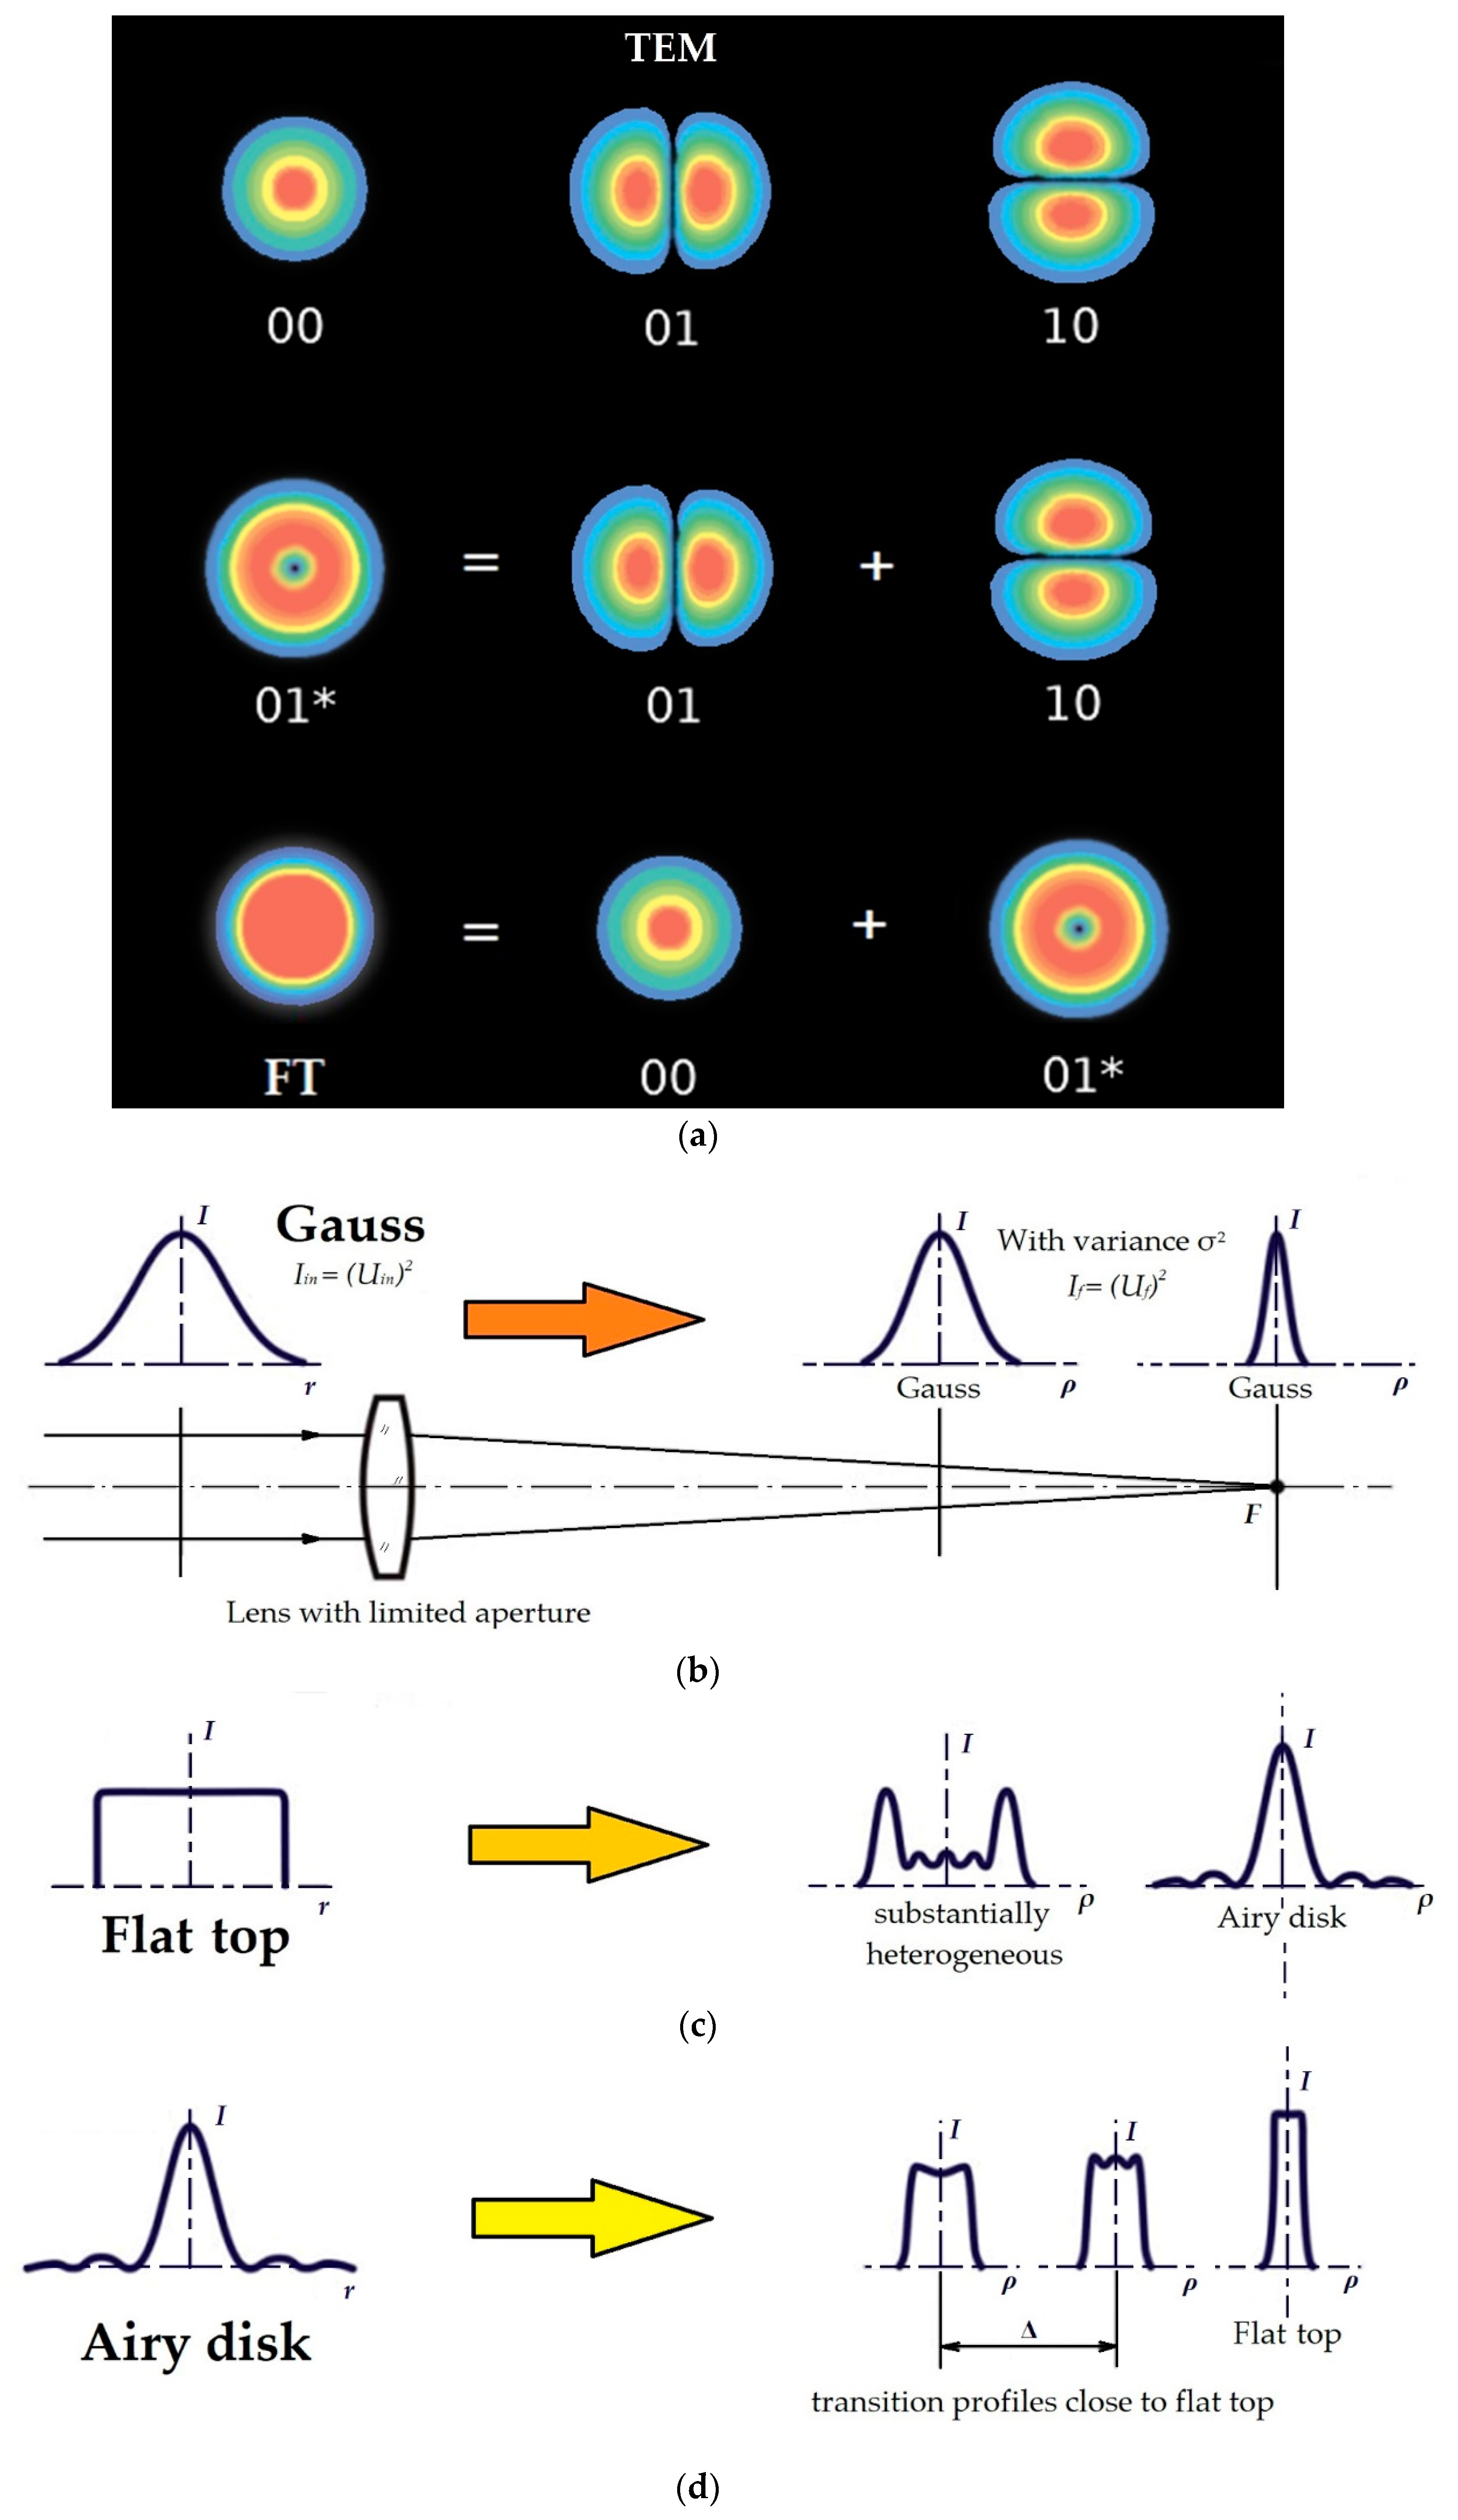
2.2. Methods for Converting the Mode Composition of Laser Radiation
- (a)
- focusing a TEM00 (Gaussian) laser beam [46];
- (b)
- (c)
2.3. Achievability of Laser Modes
2.4. Powder Material
2.5. Characterization of the Samples
3. Results
3.1. Investigation of Principal Abilities of Laser Power Redistribution in the Spot and Mathematical Corroboration of the Developed Approach
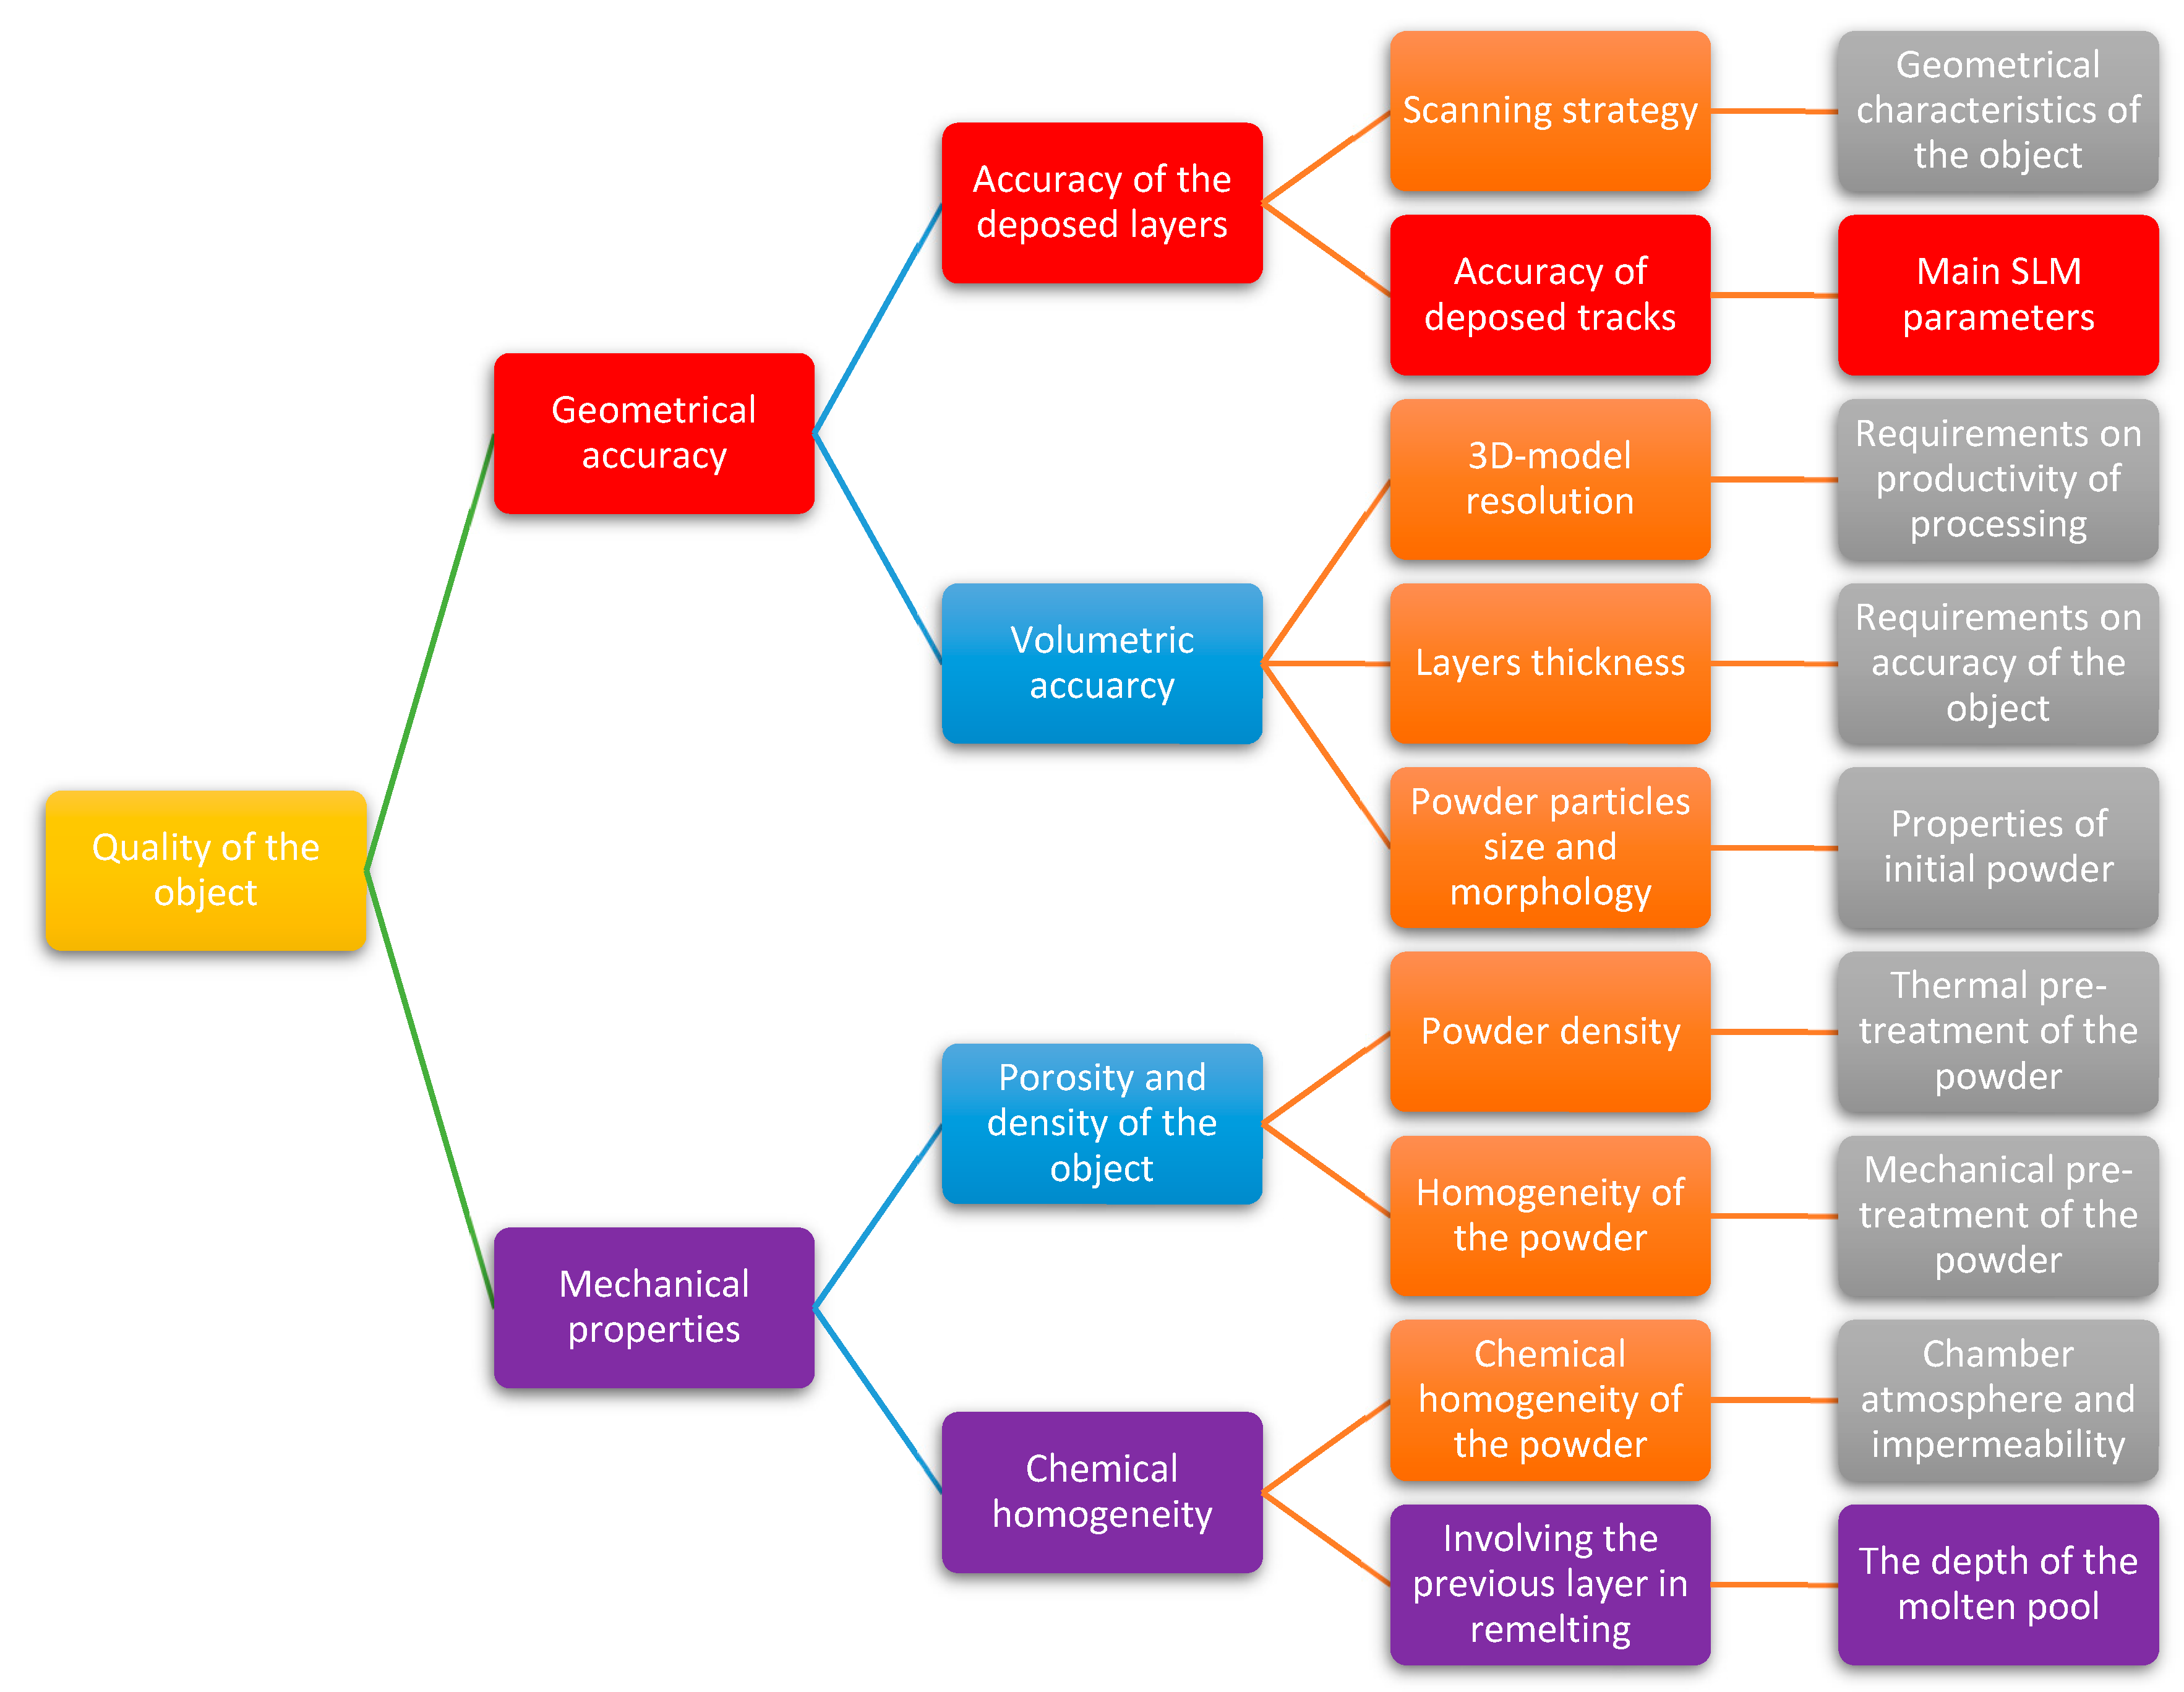
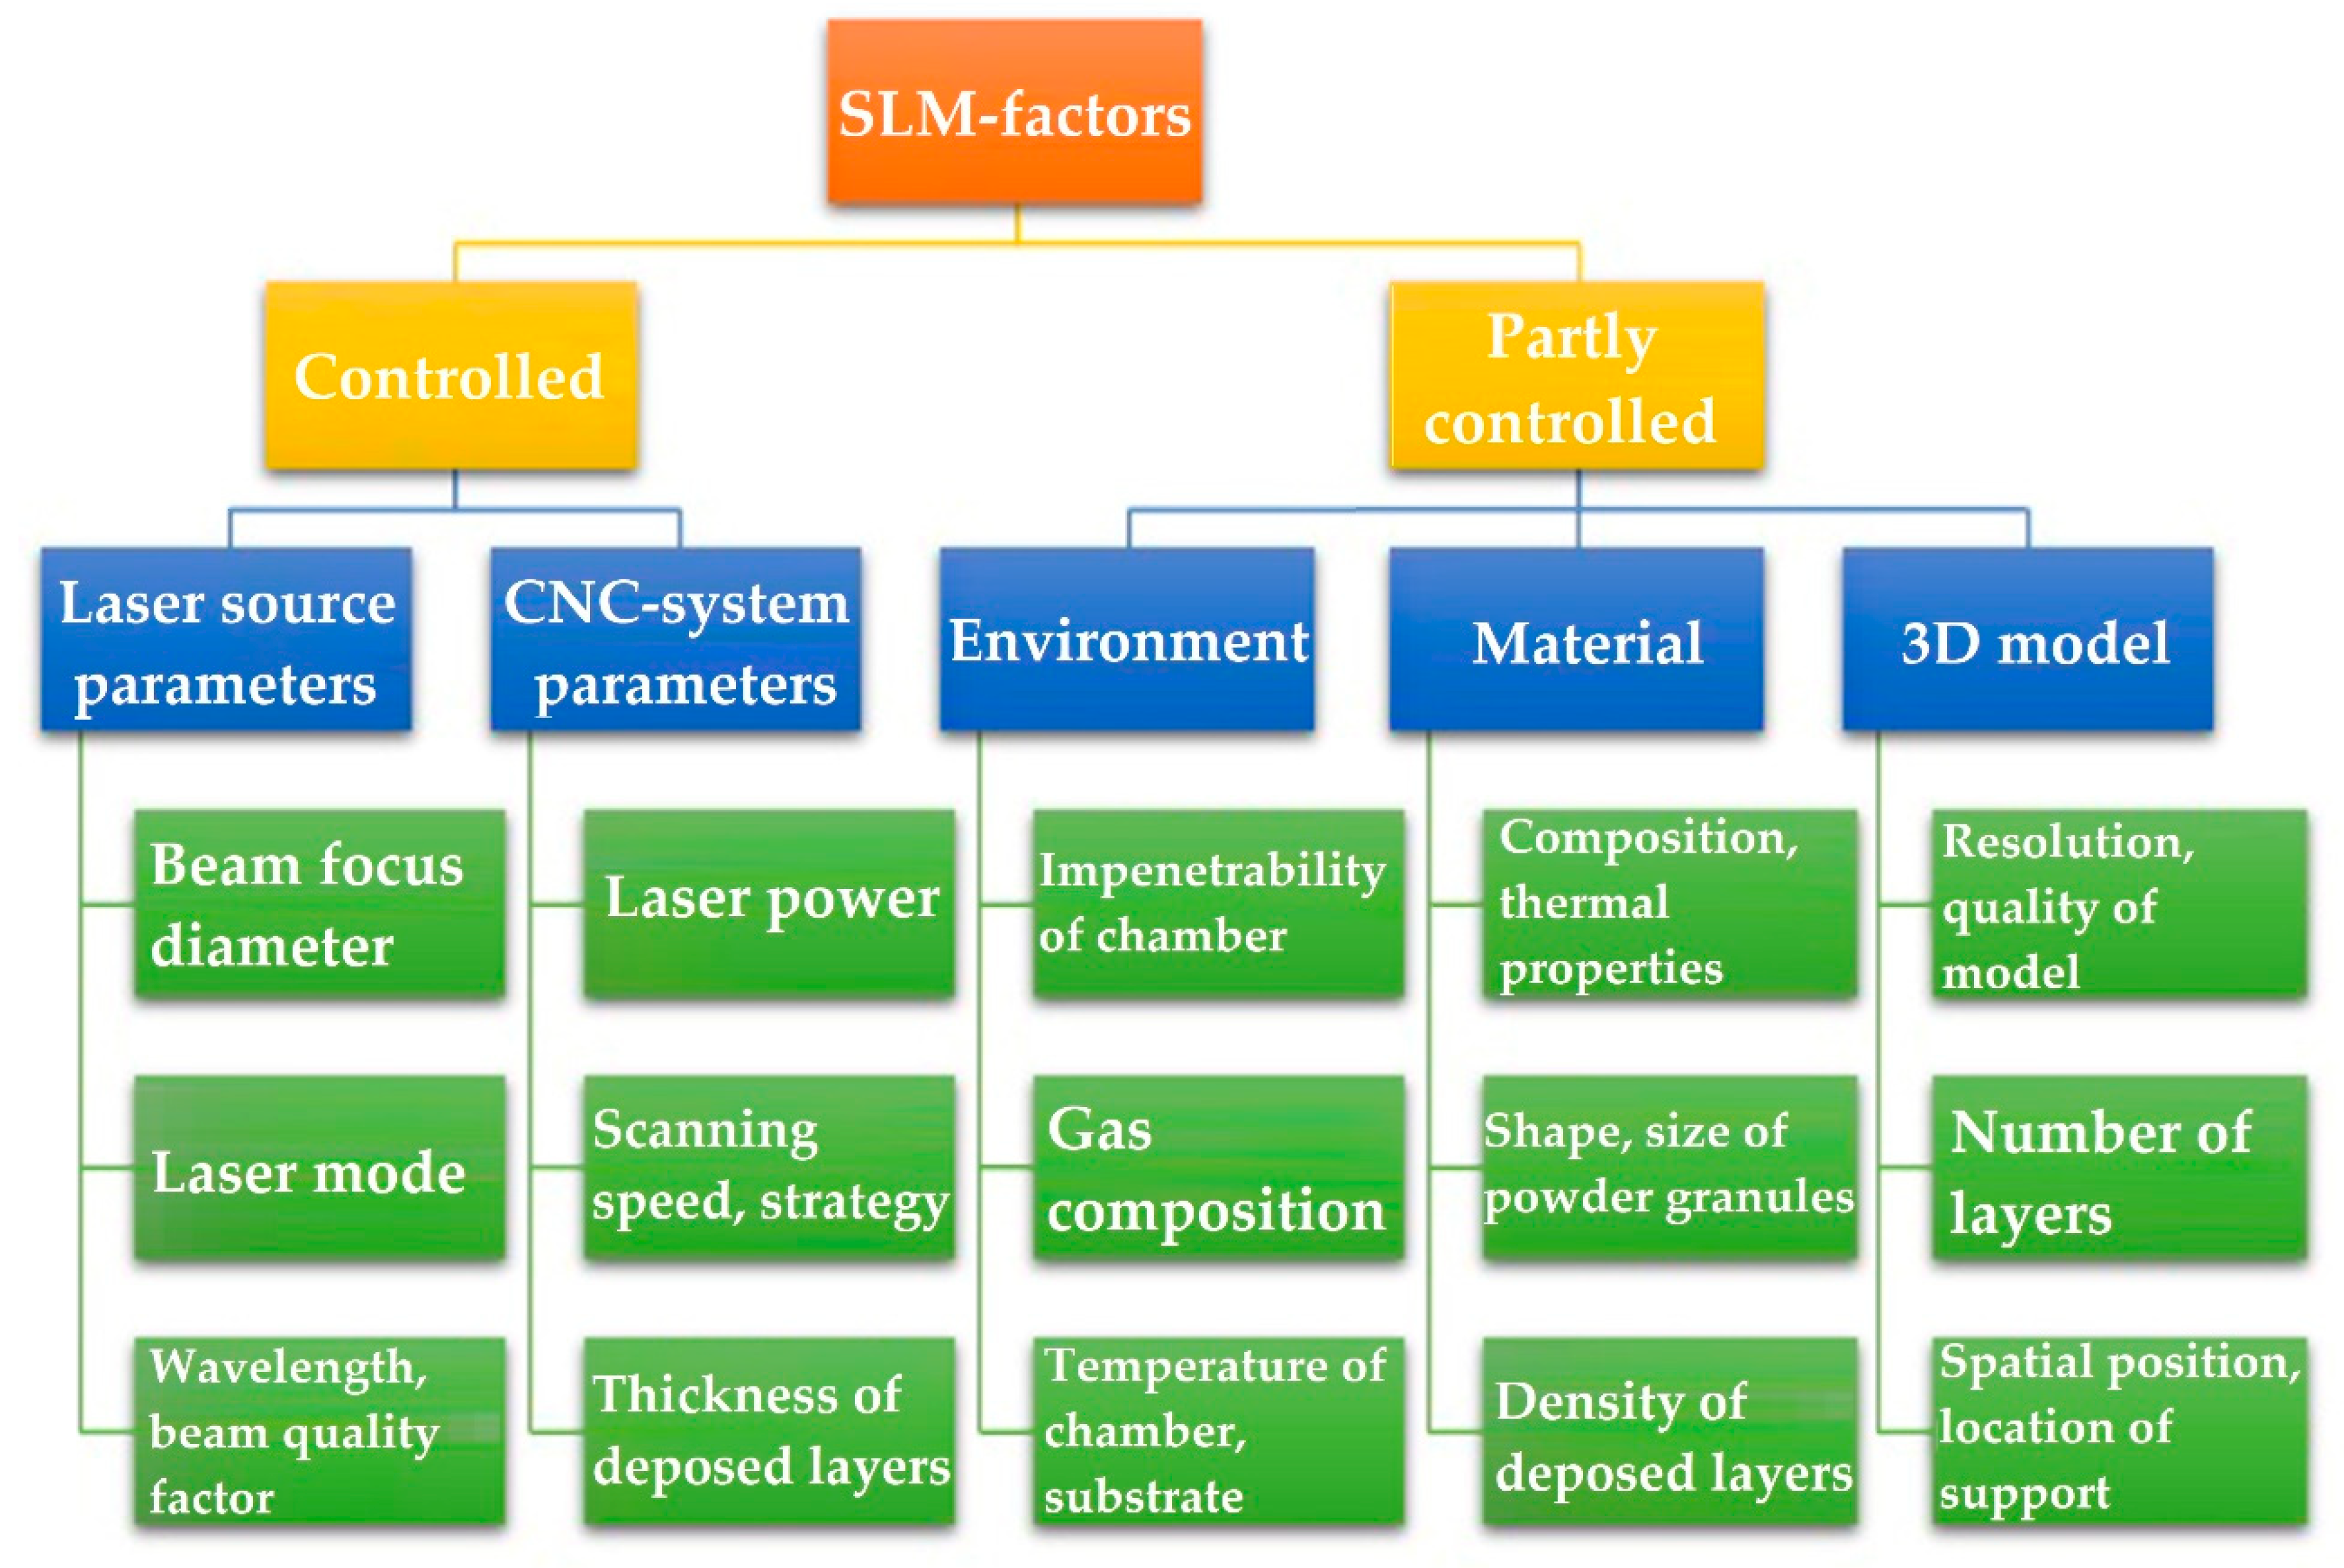
3.1.1. Classification of the Main SLM Parameters and the Way of Laser Power Redistribution
3.1.2. Short Description of the Developed Approach
3.2. Development of the Experimental Setup for Power Density Redistribution and its Approbation
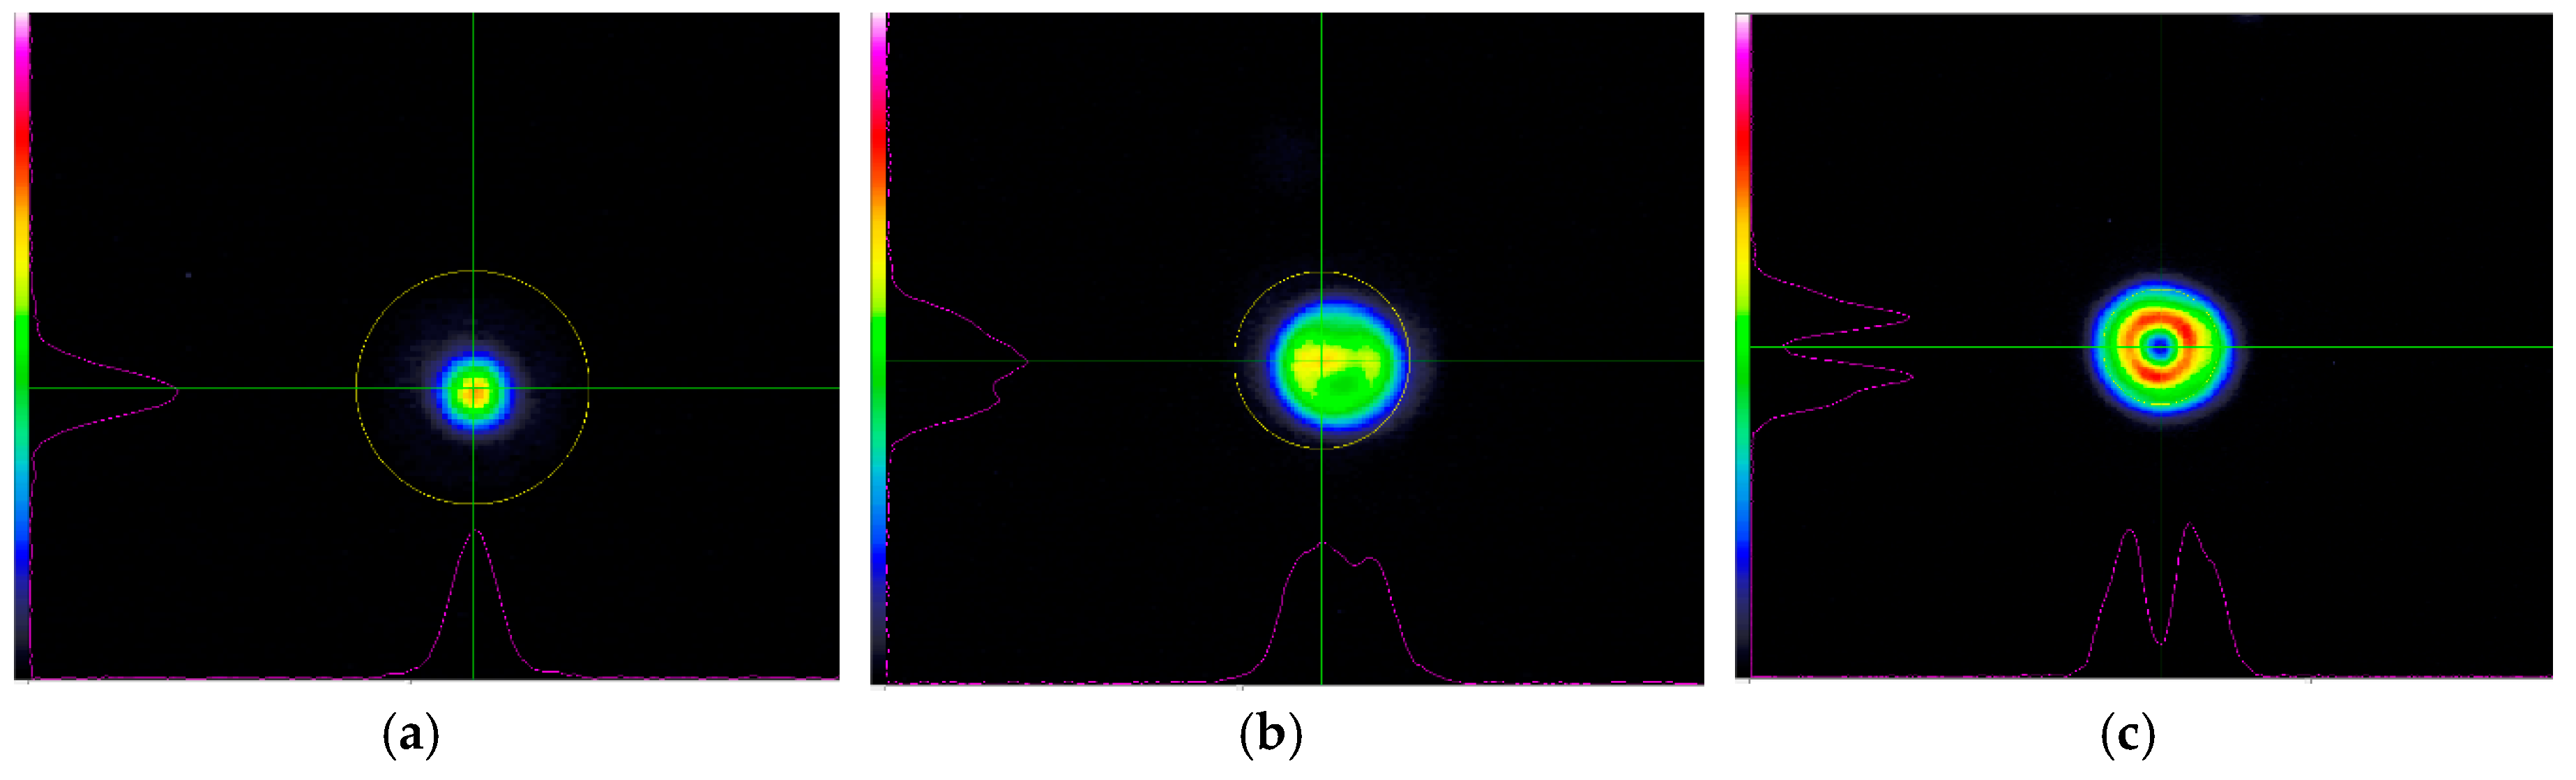
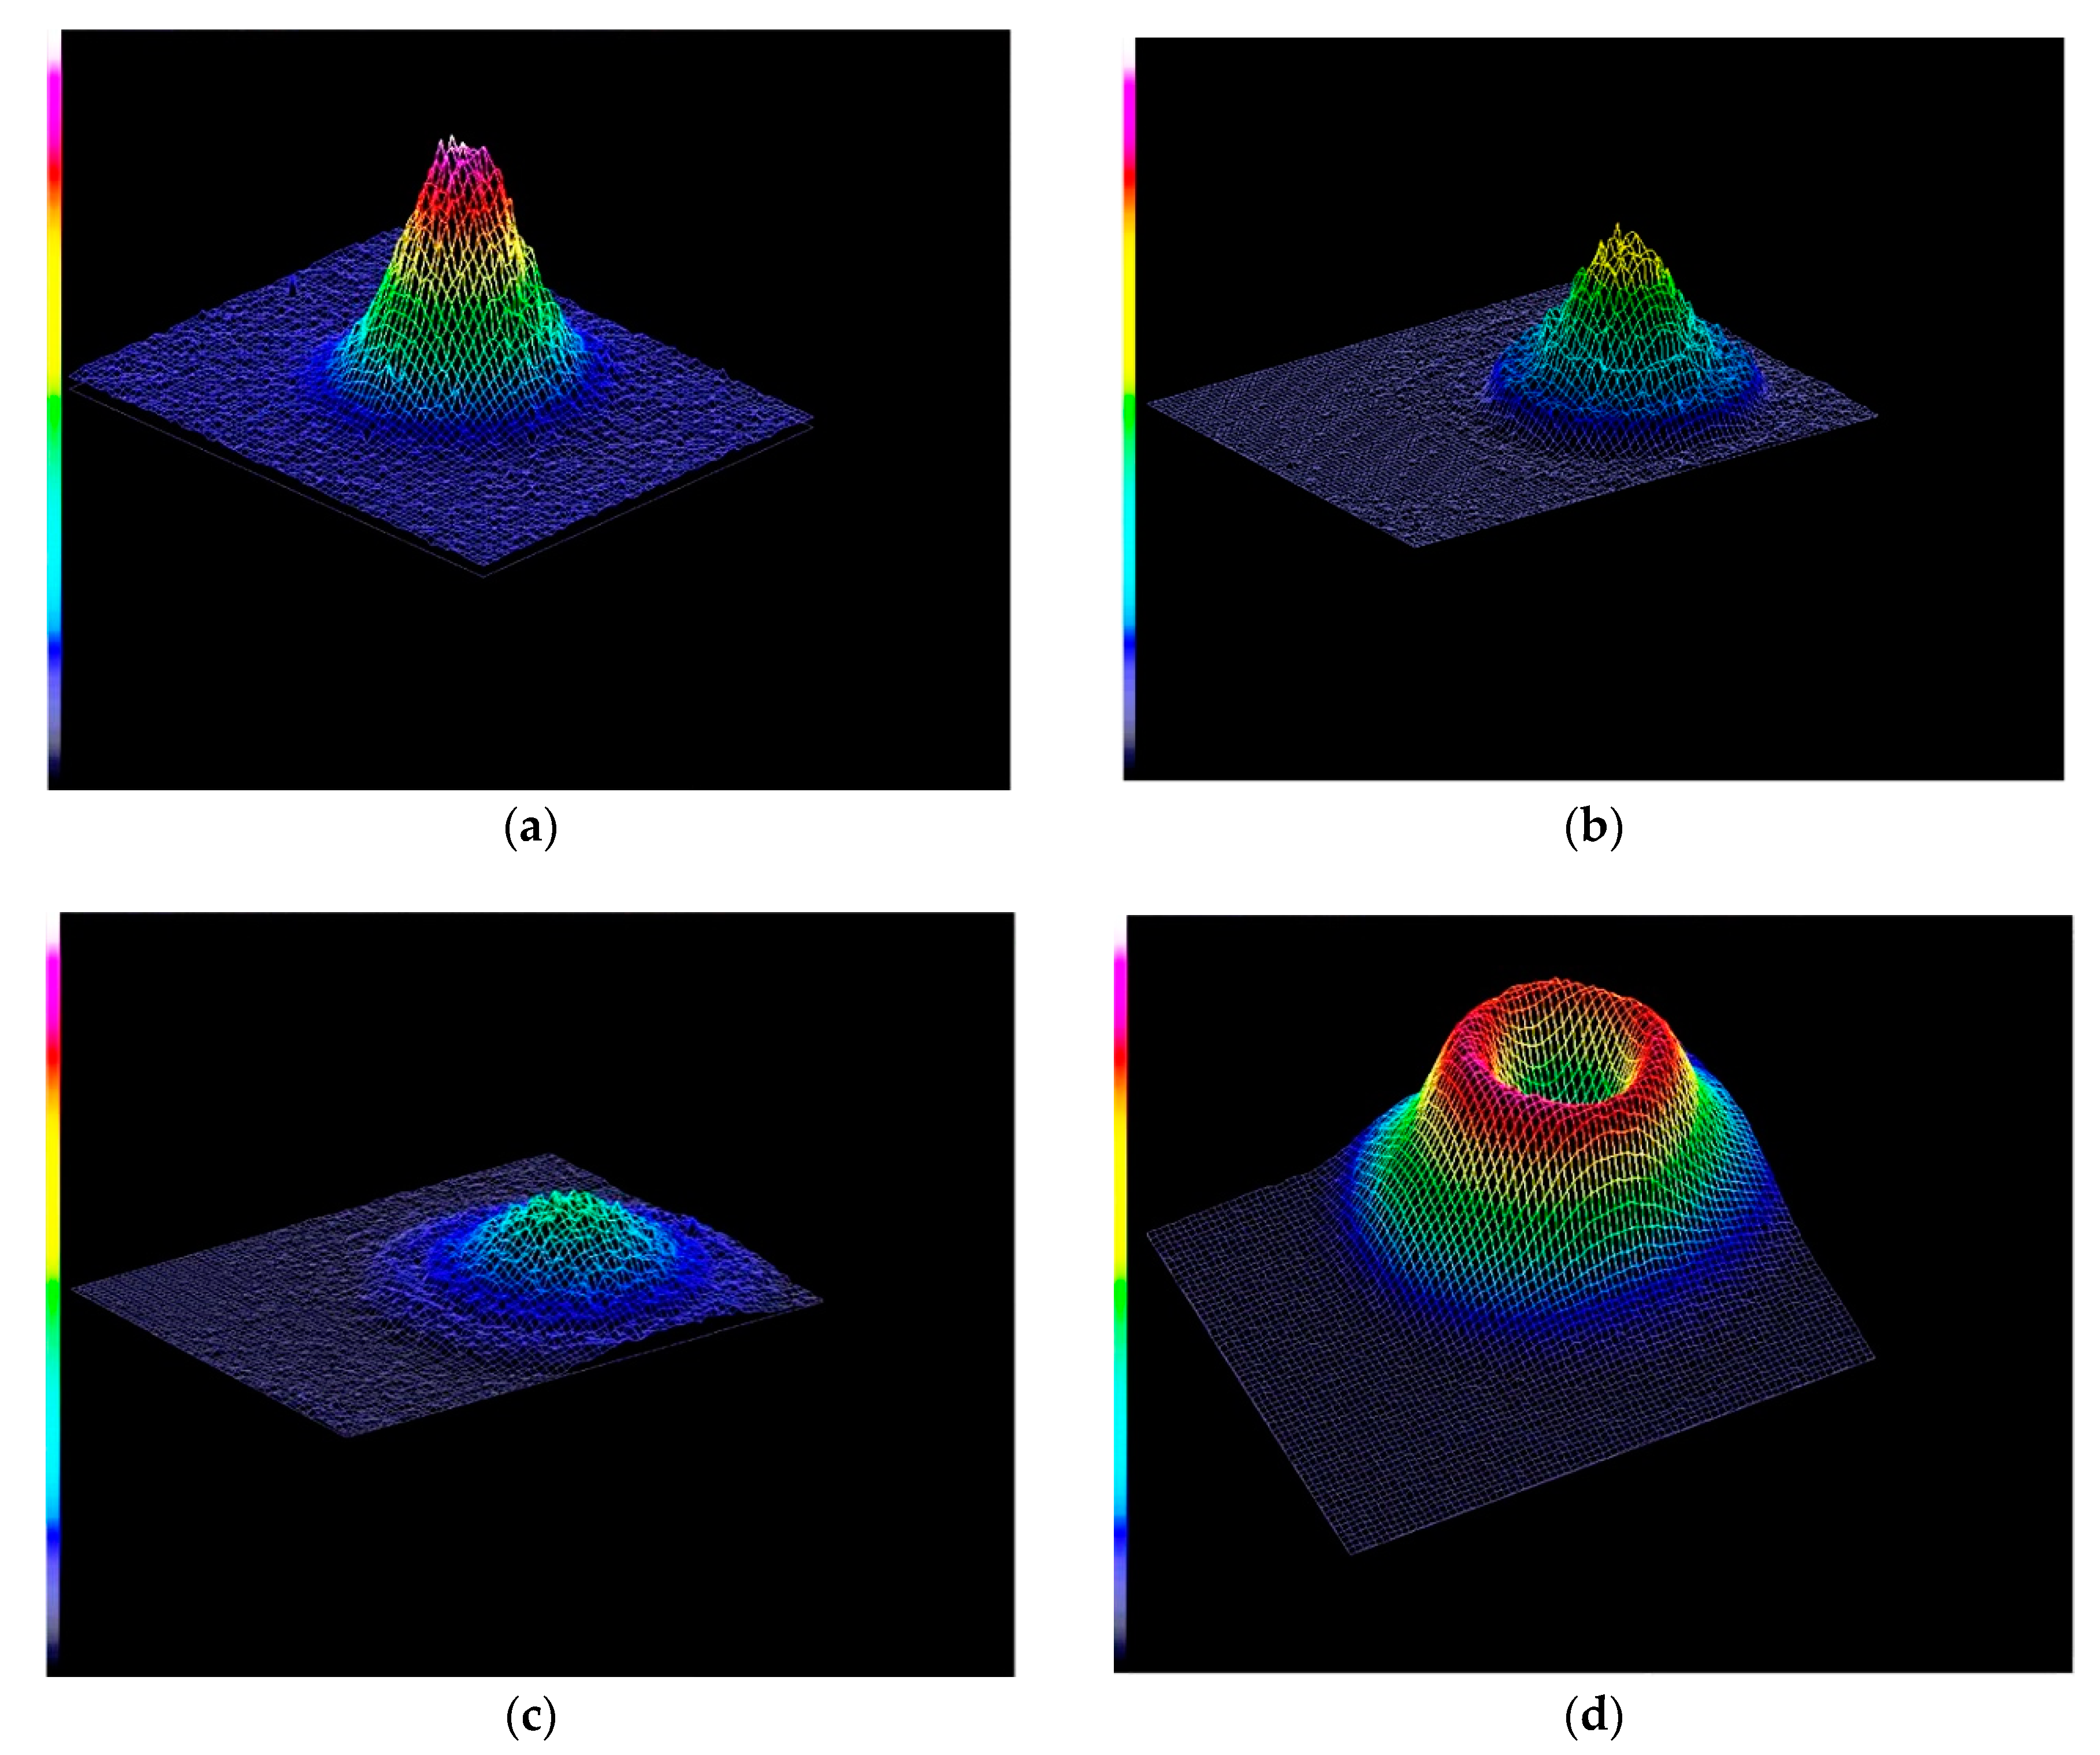
3.2.1. Construction of the Experimental Setup and Laser Beam Modes
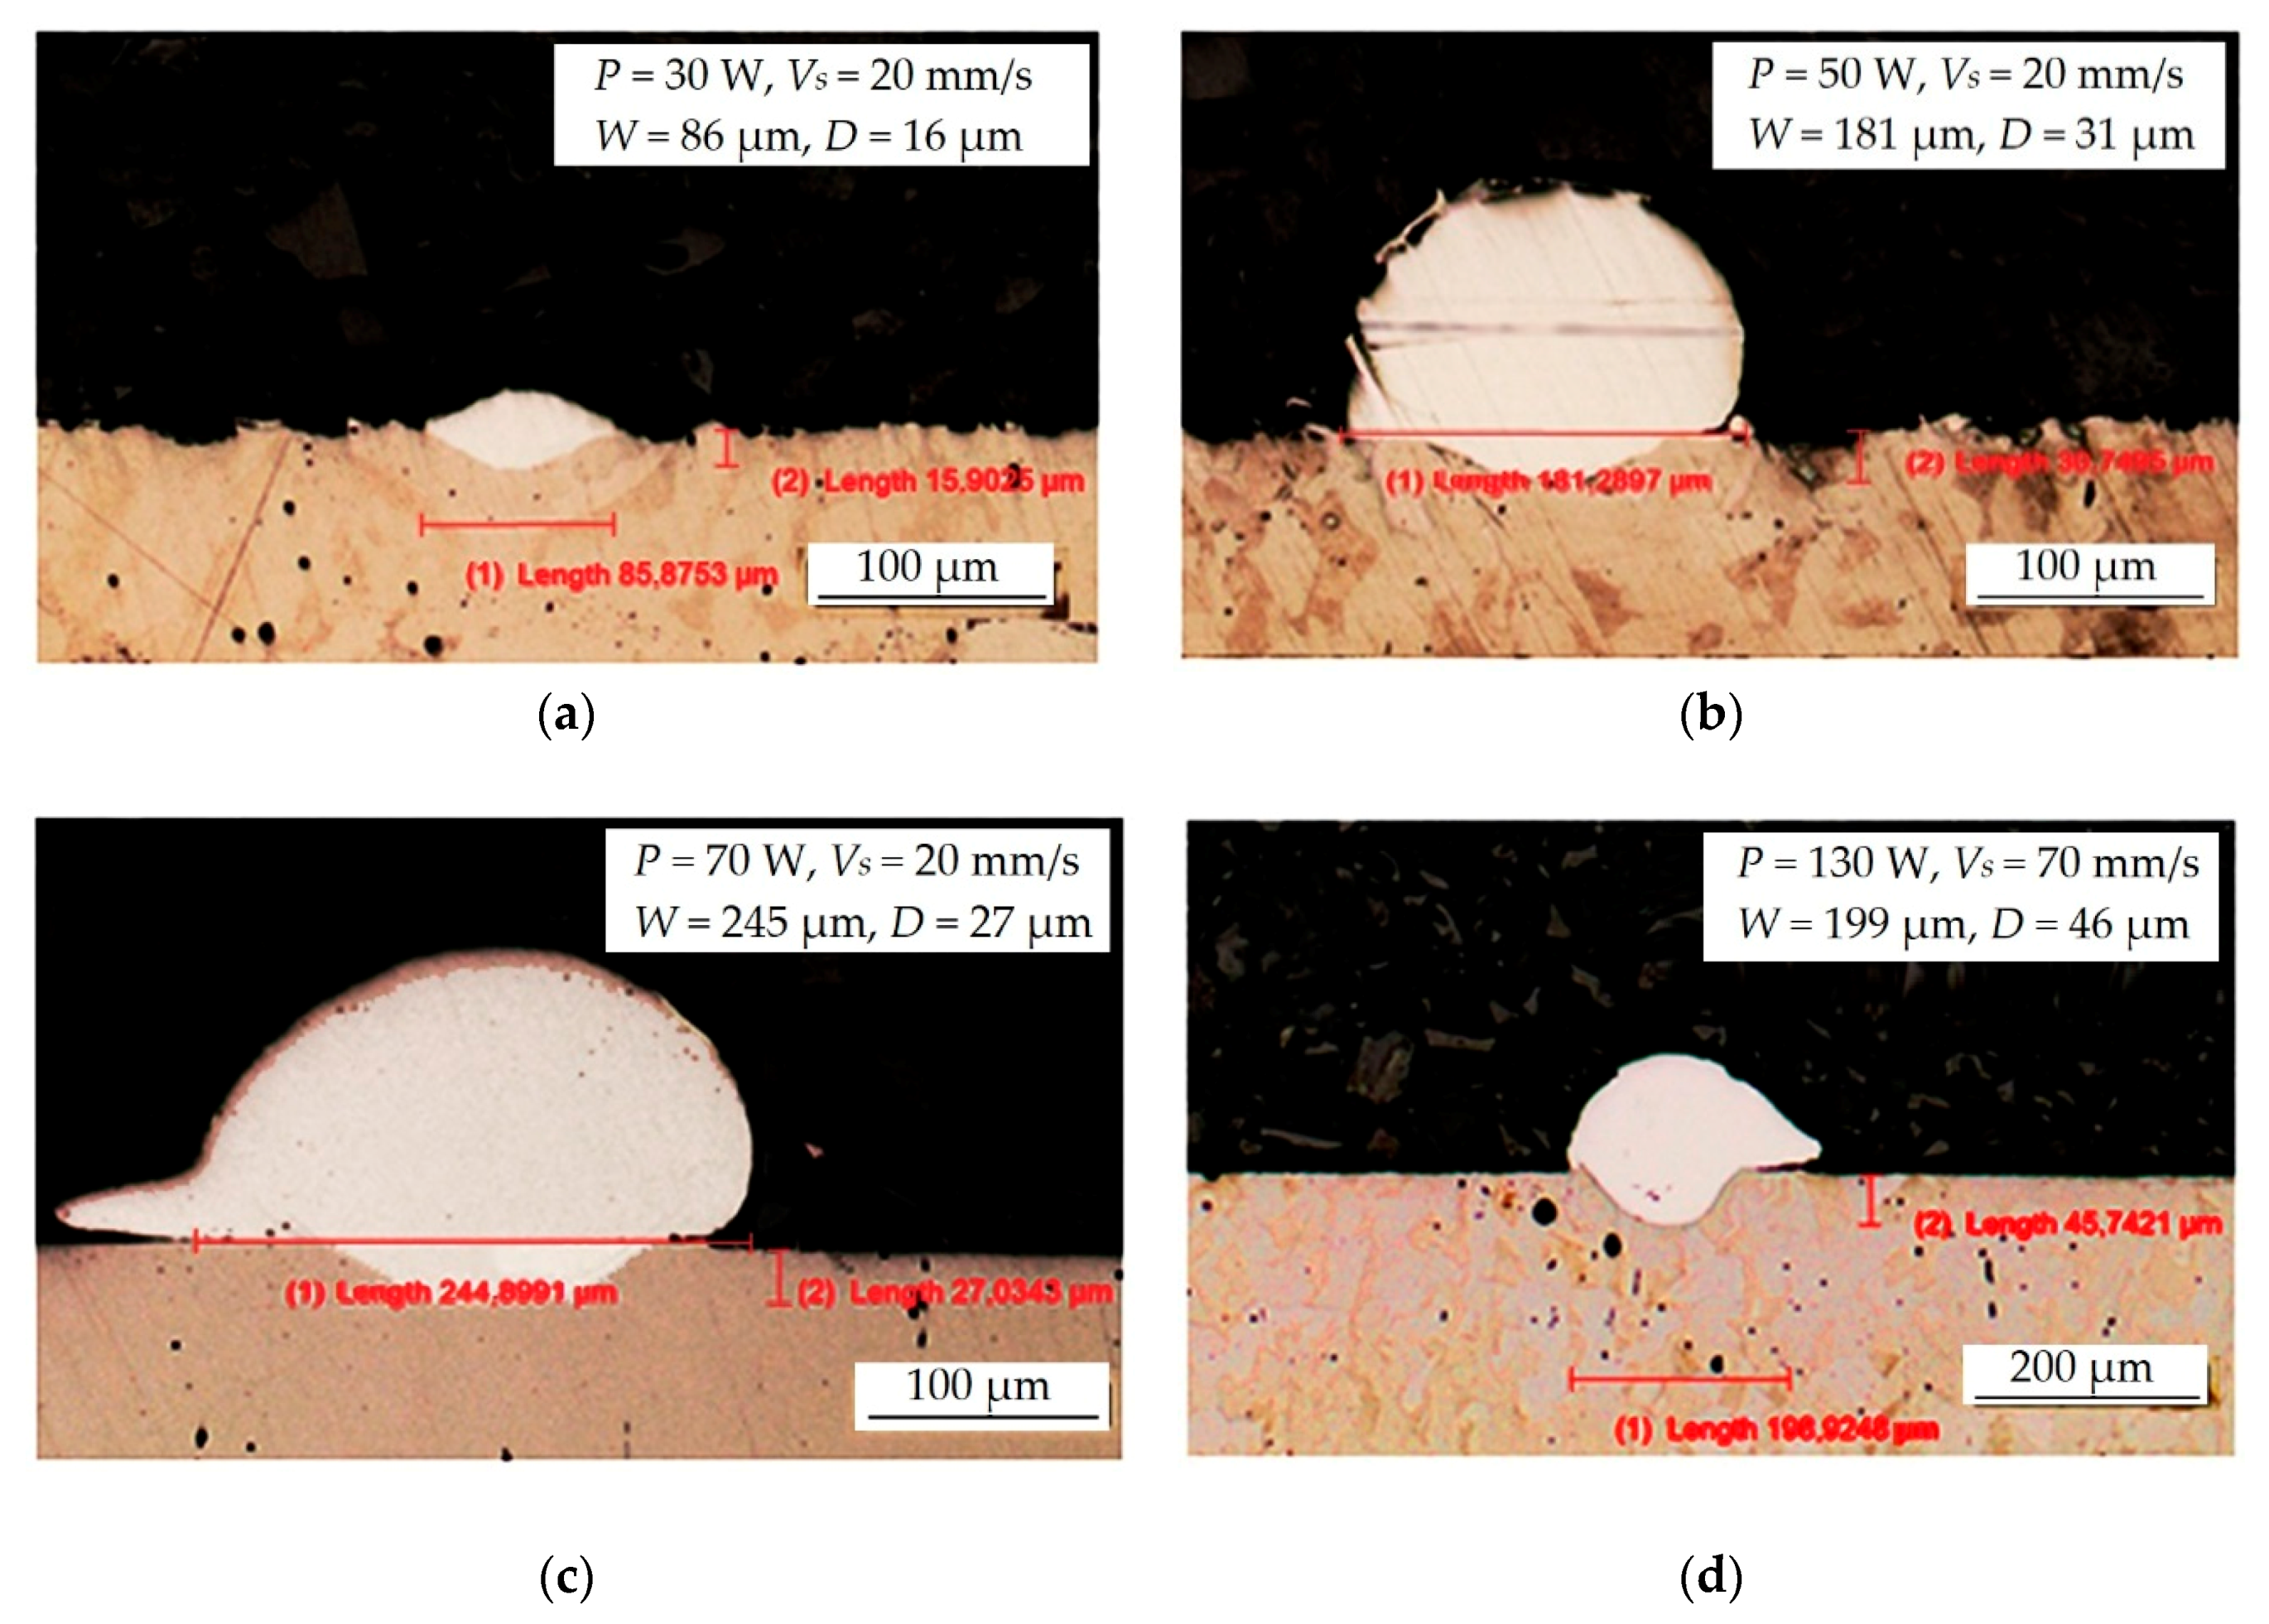
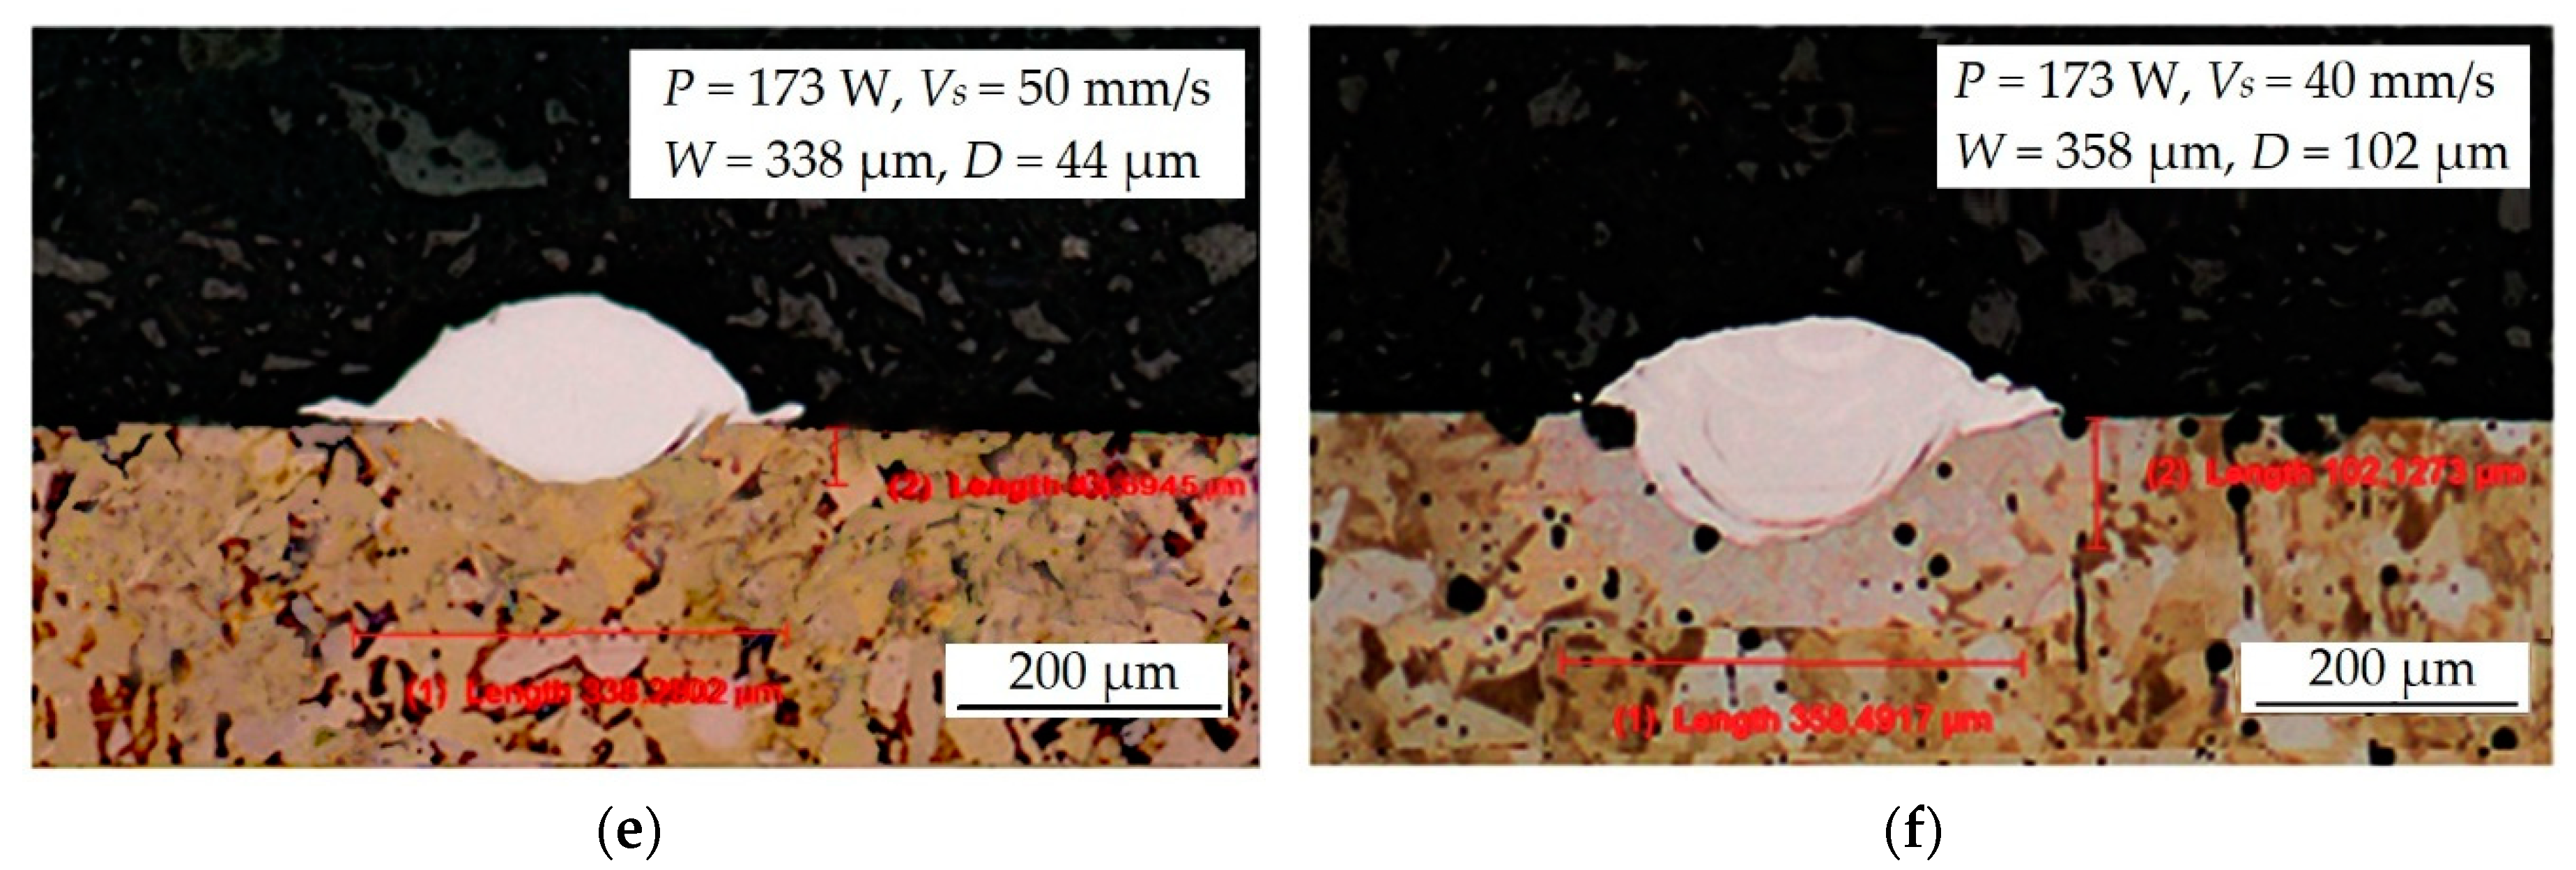
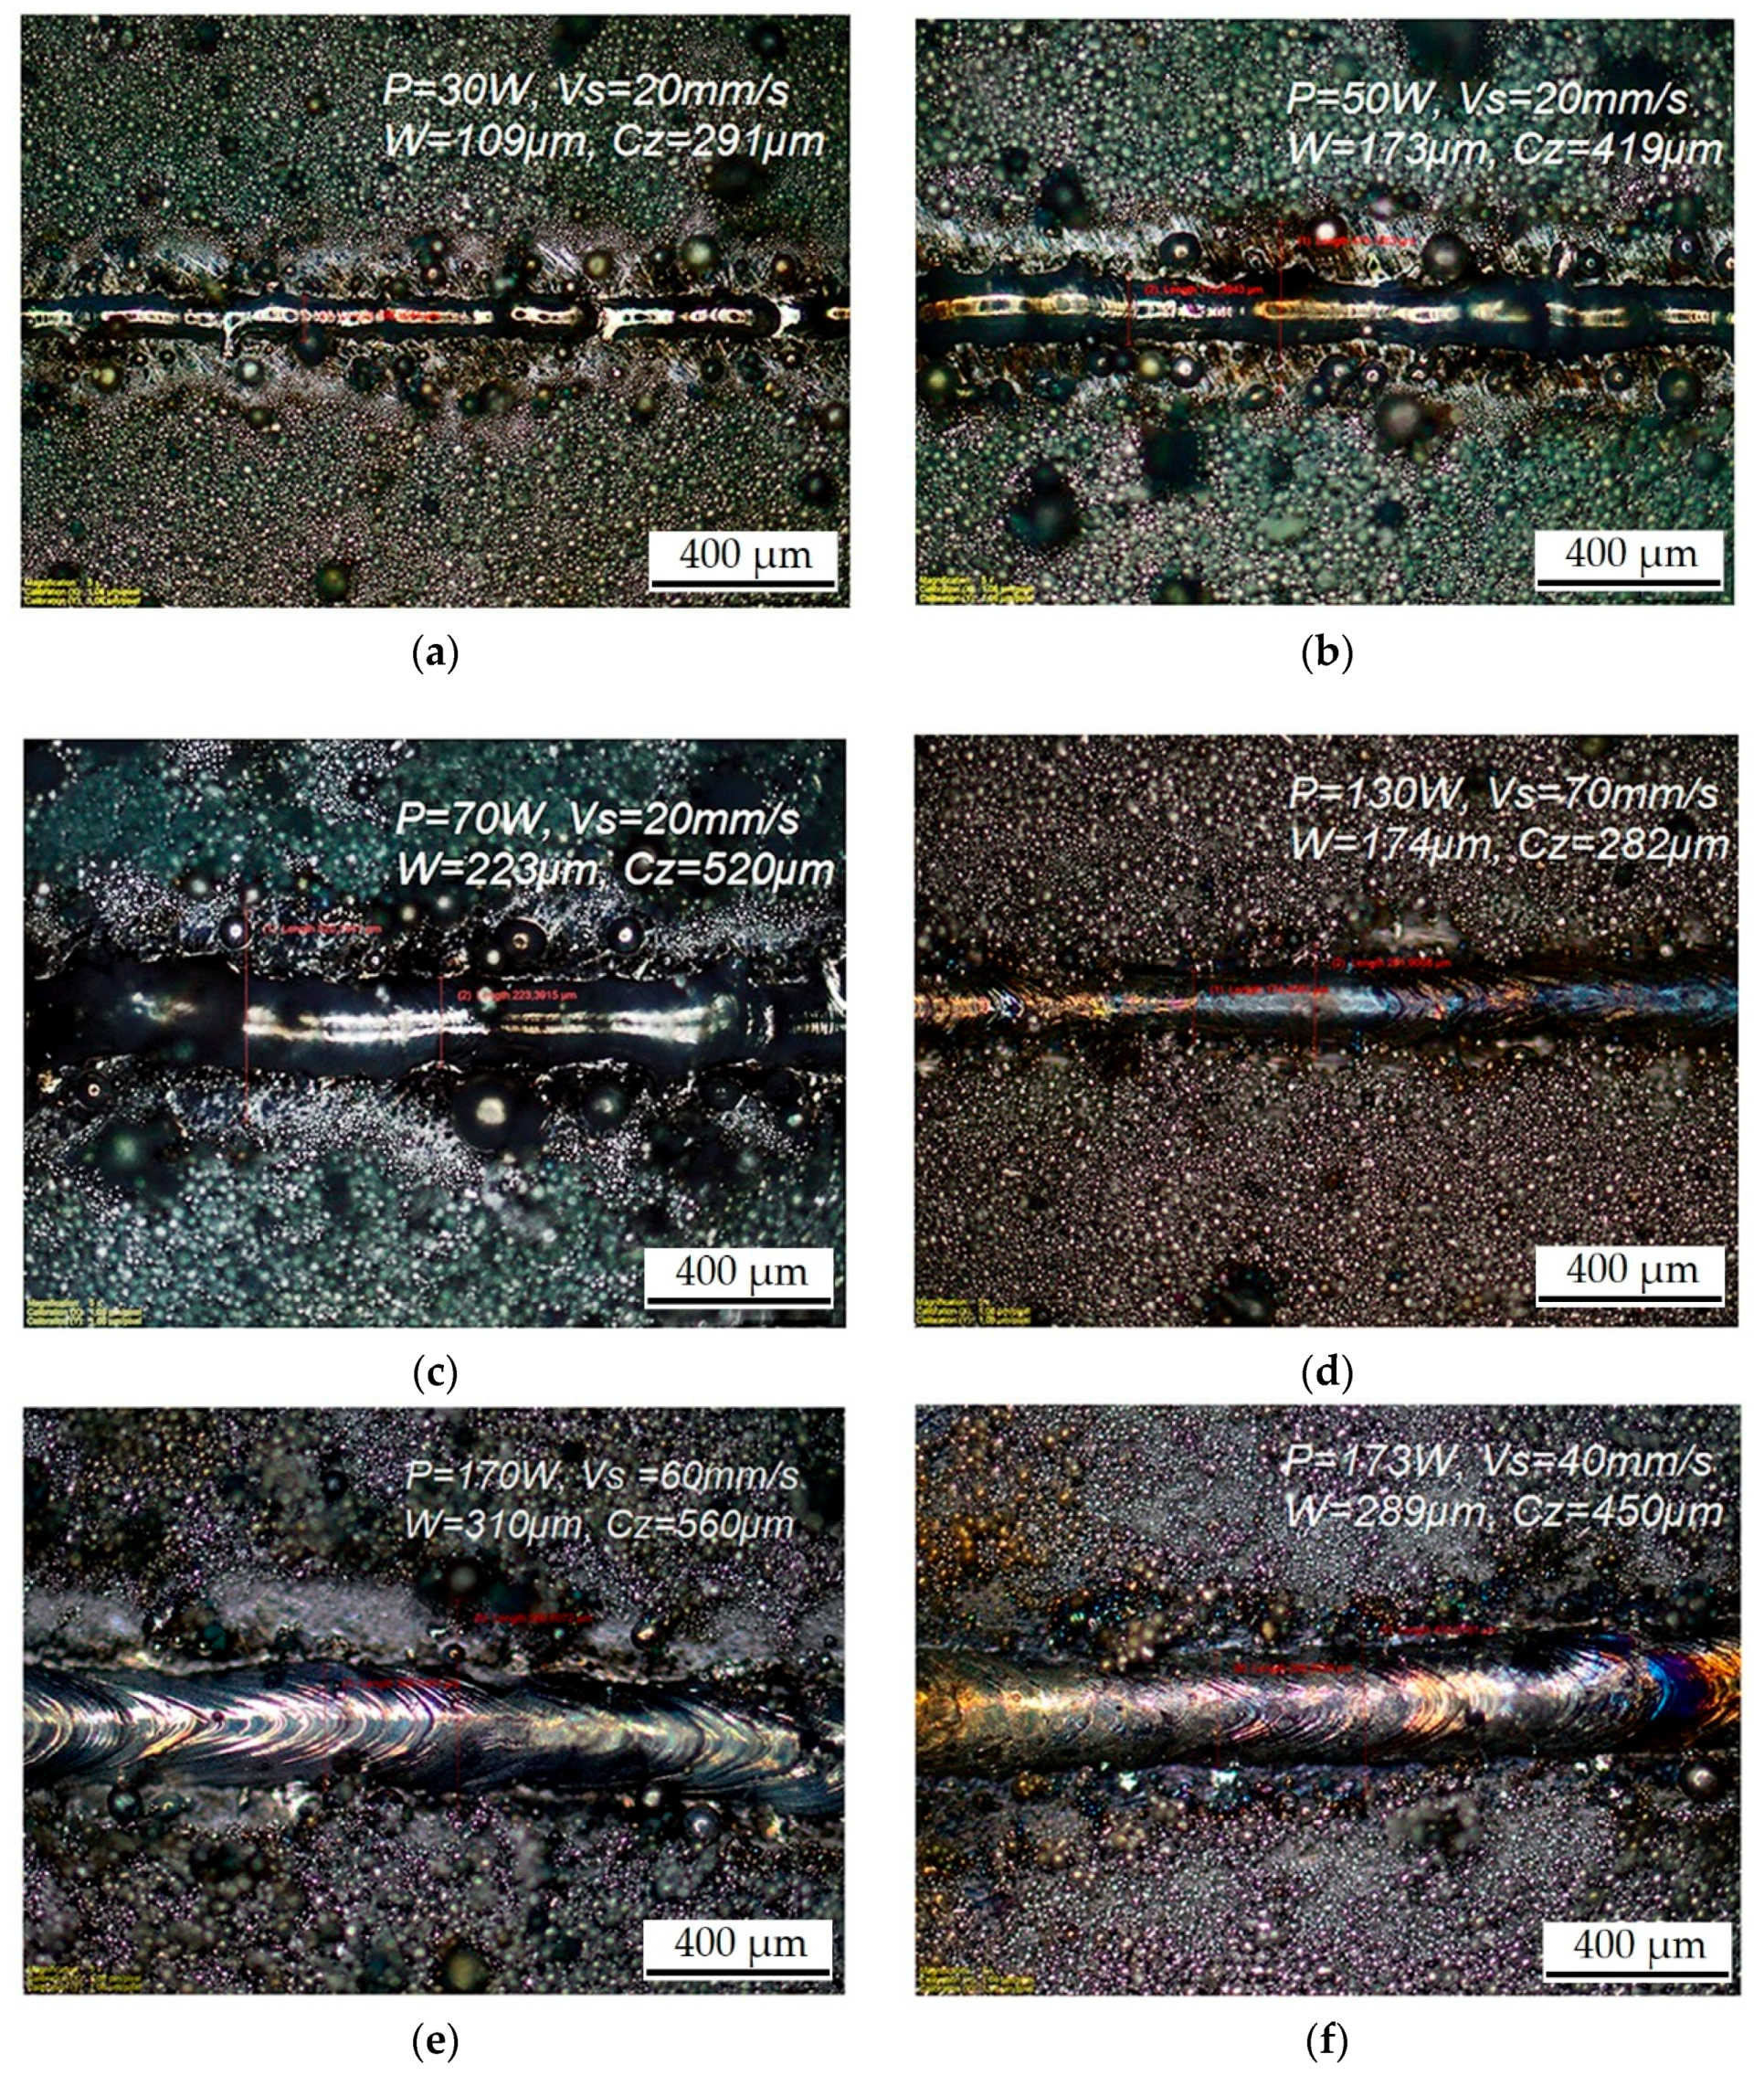
3.2.2. Formation of Single Tracks and its Characterization
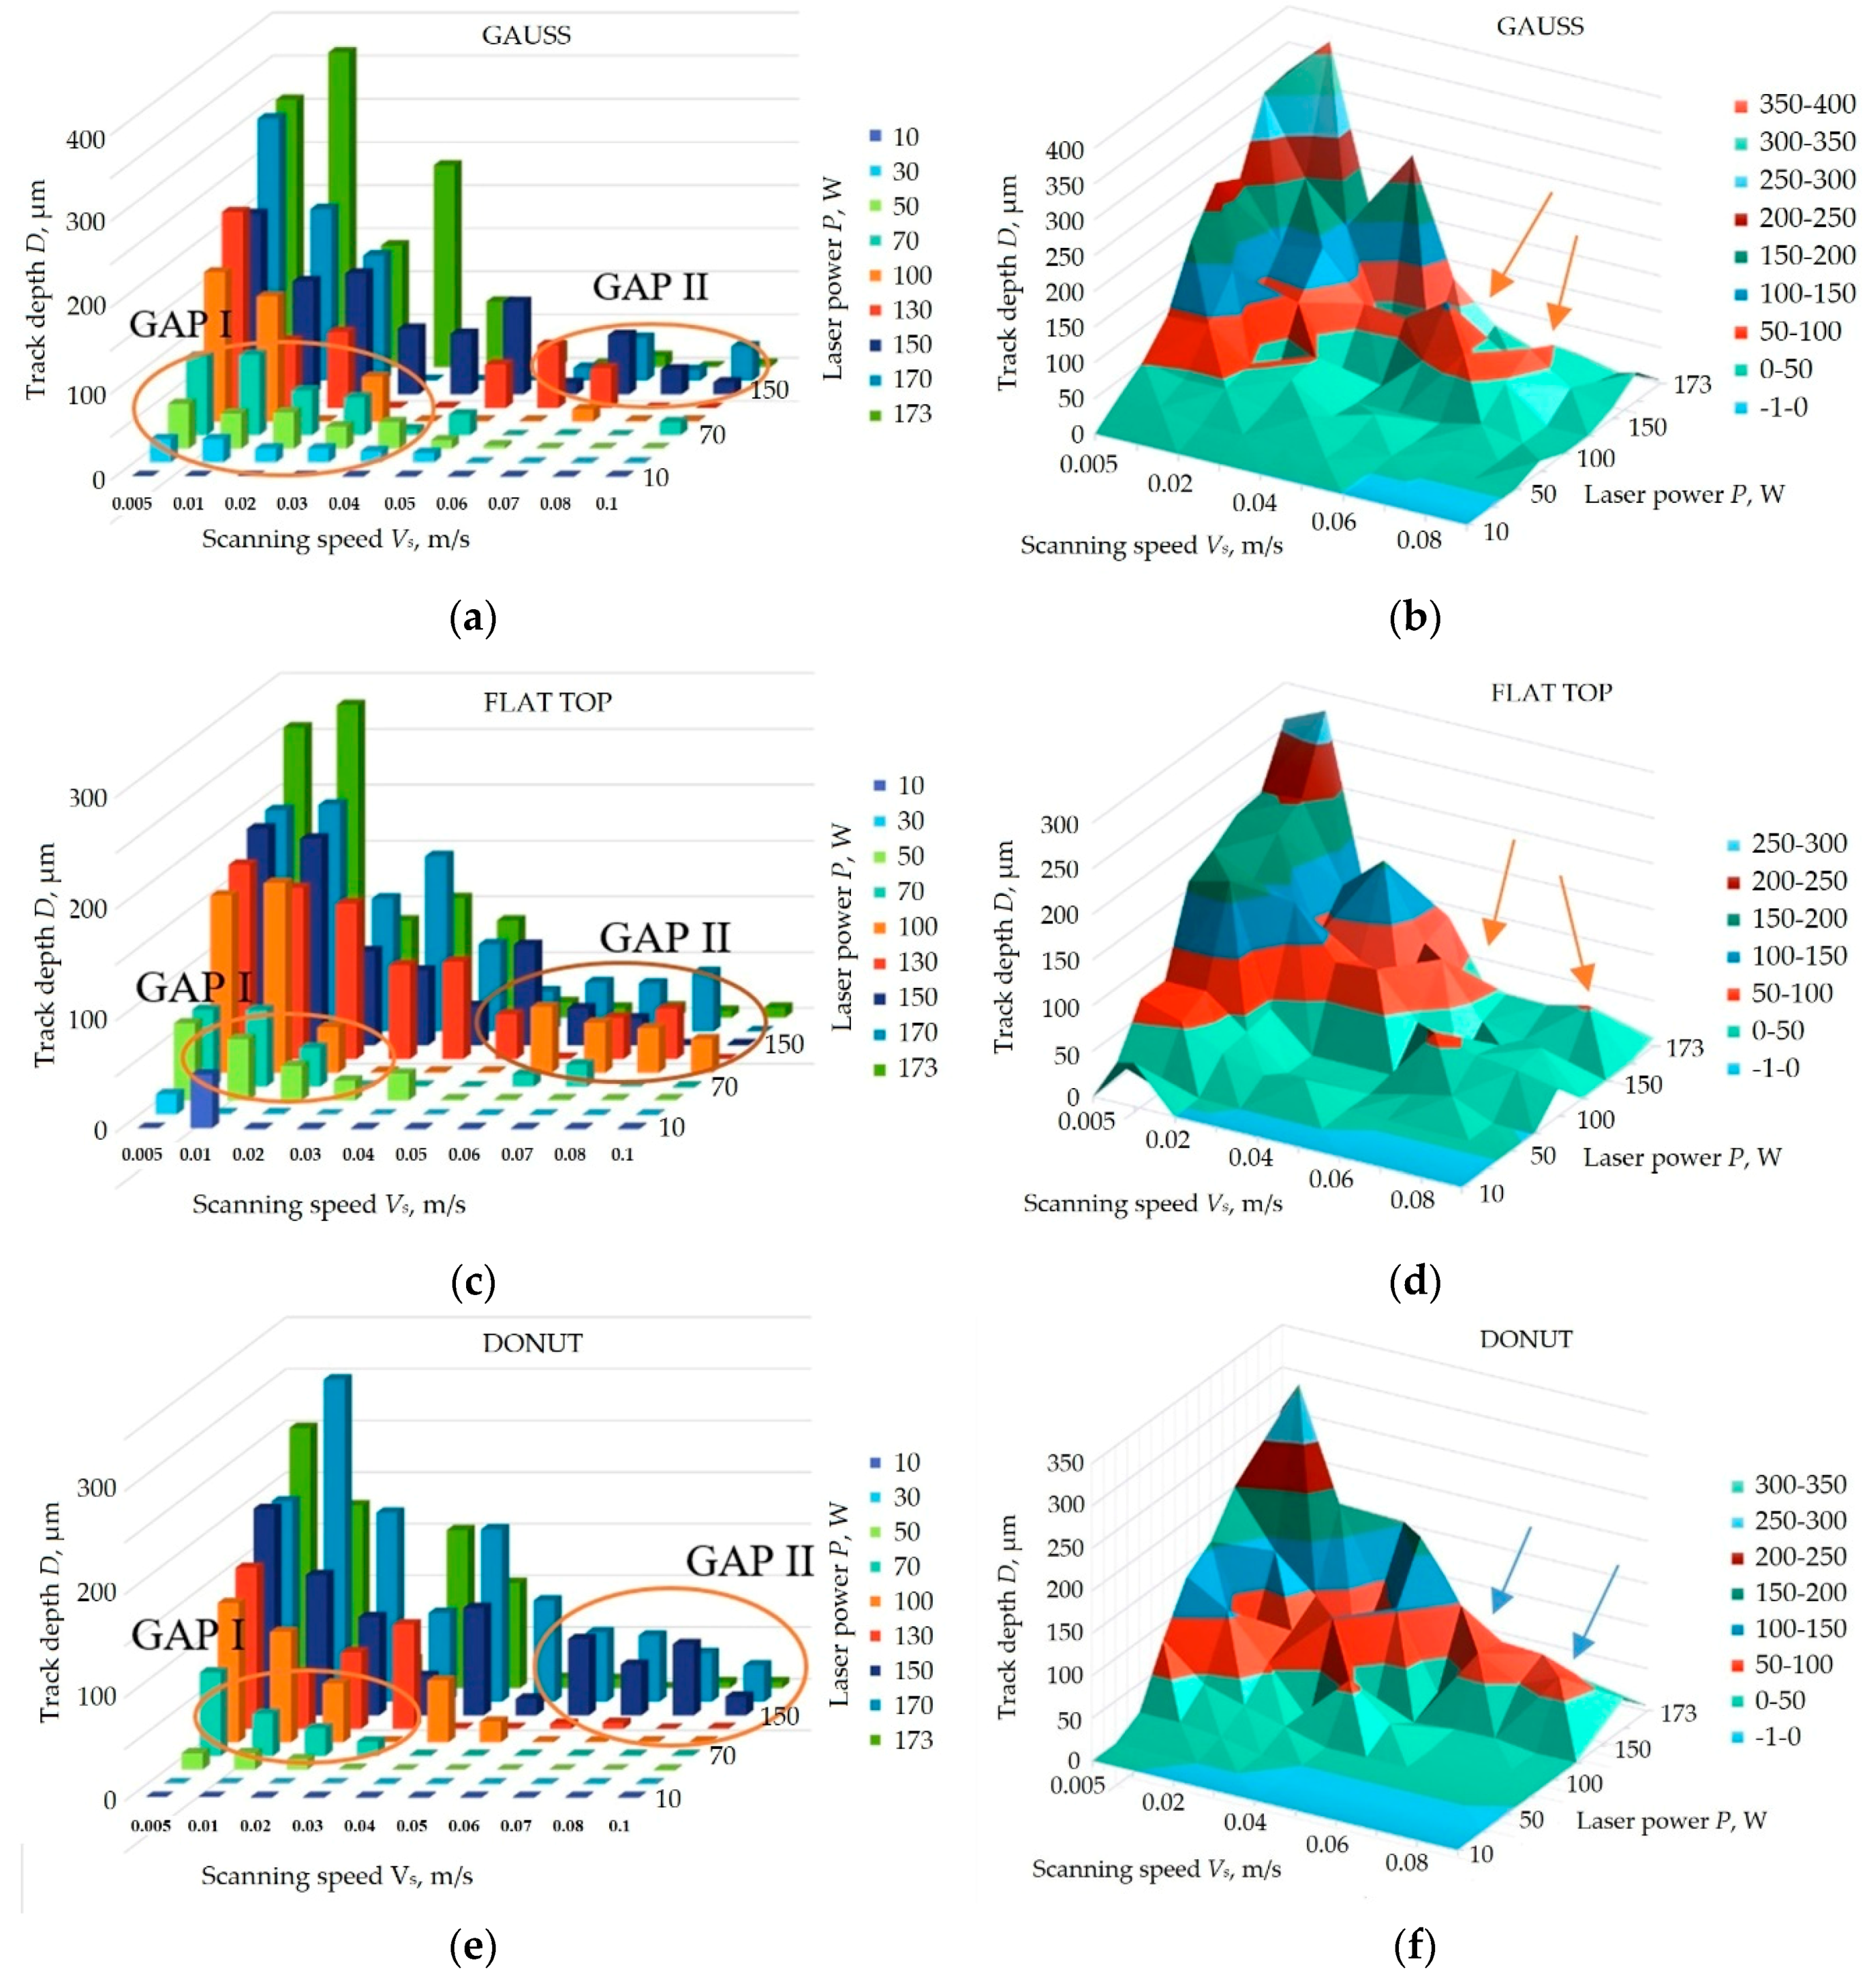
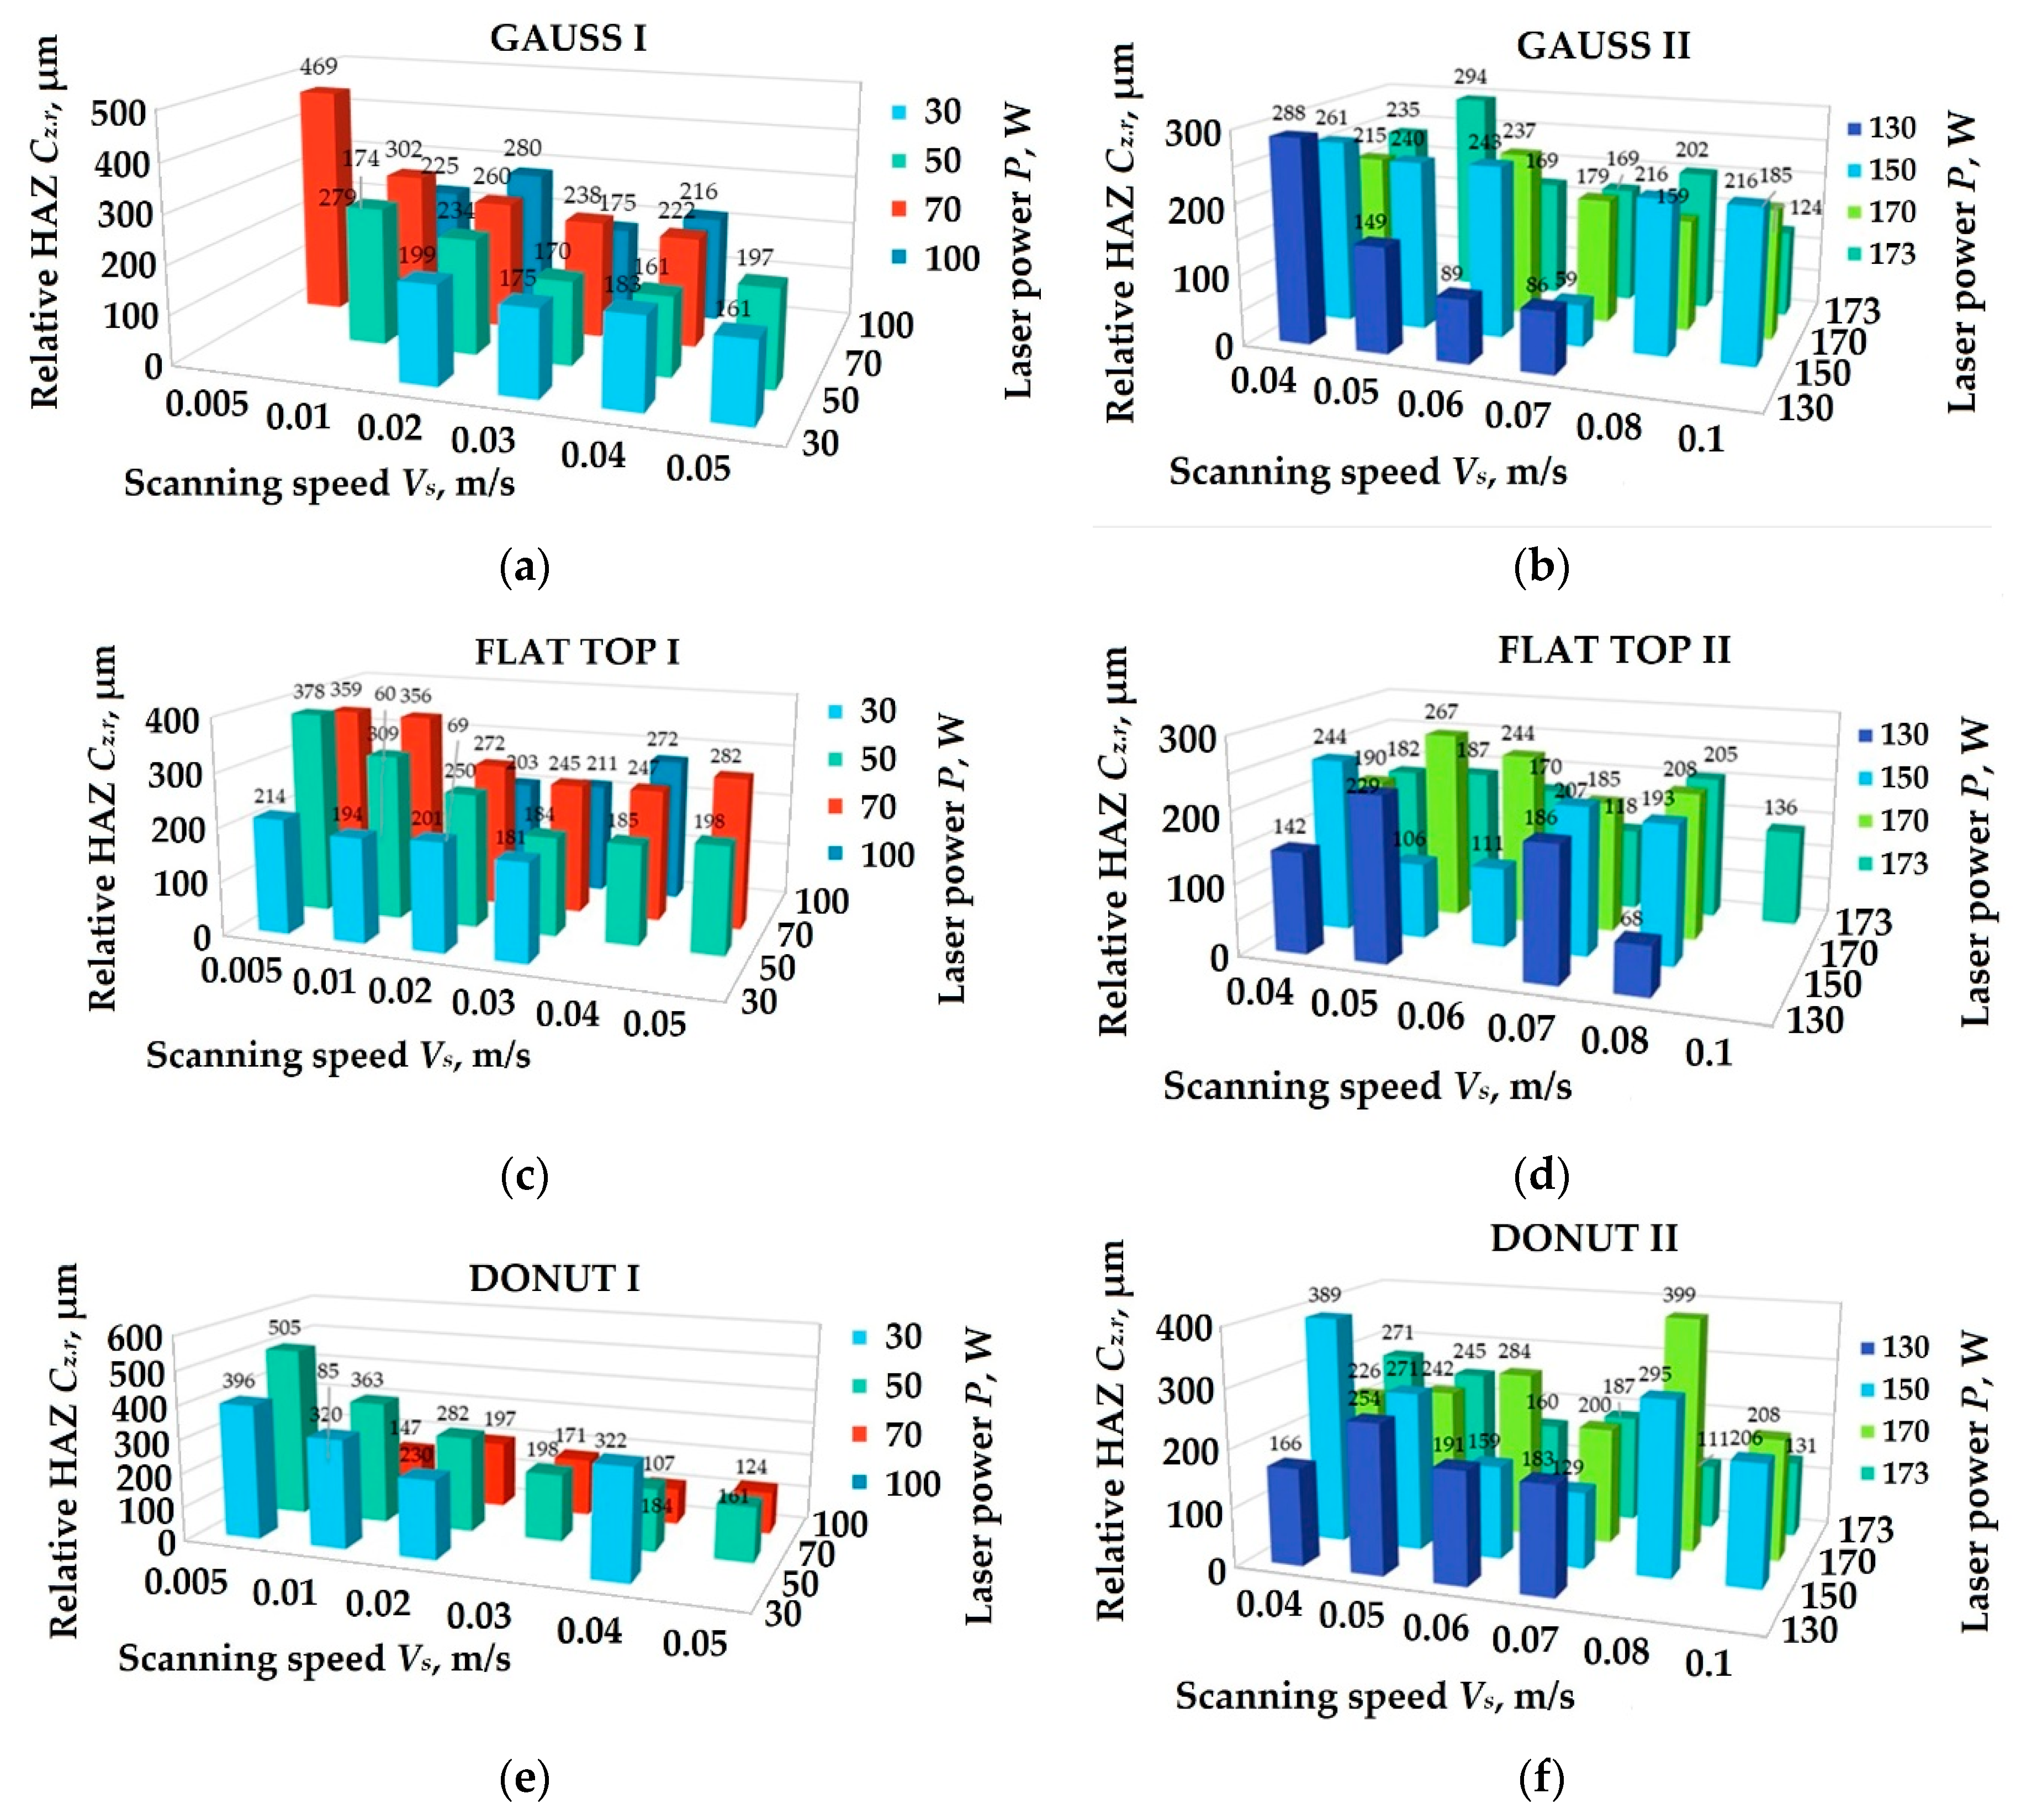
3.2.3. Analyses of Geometric Characteristics of the Tracks
4. Discussion
4.1. Industrial SLM Equipment with Higher Laser Power
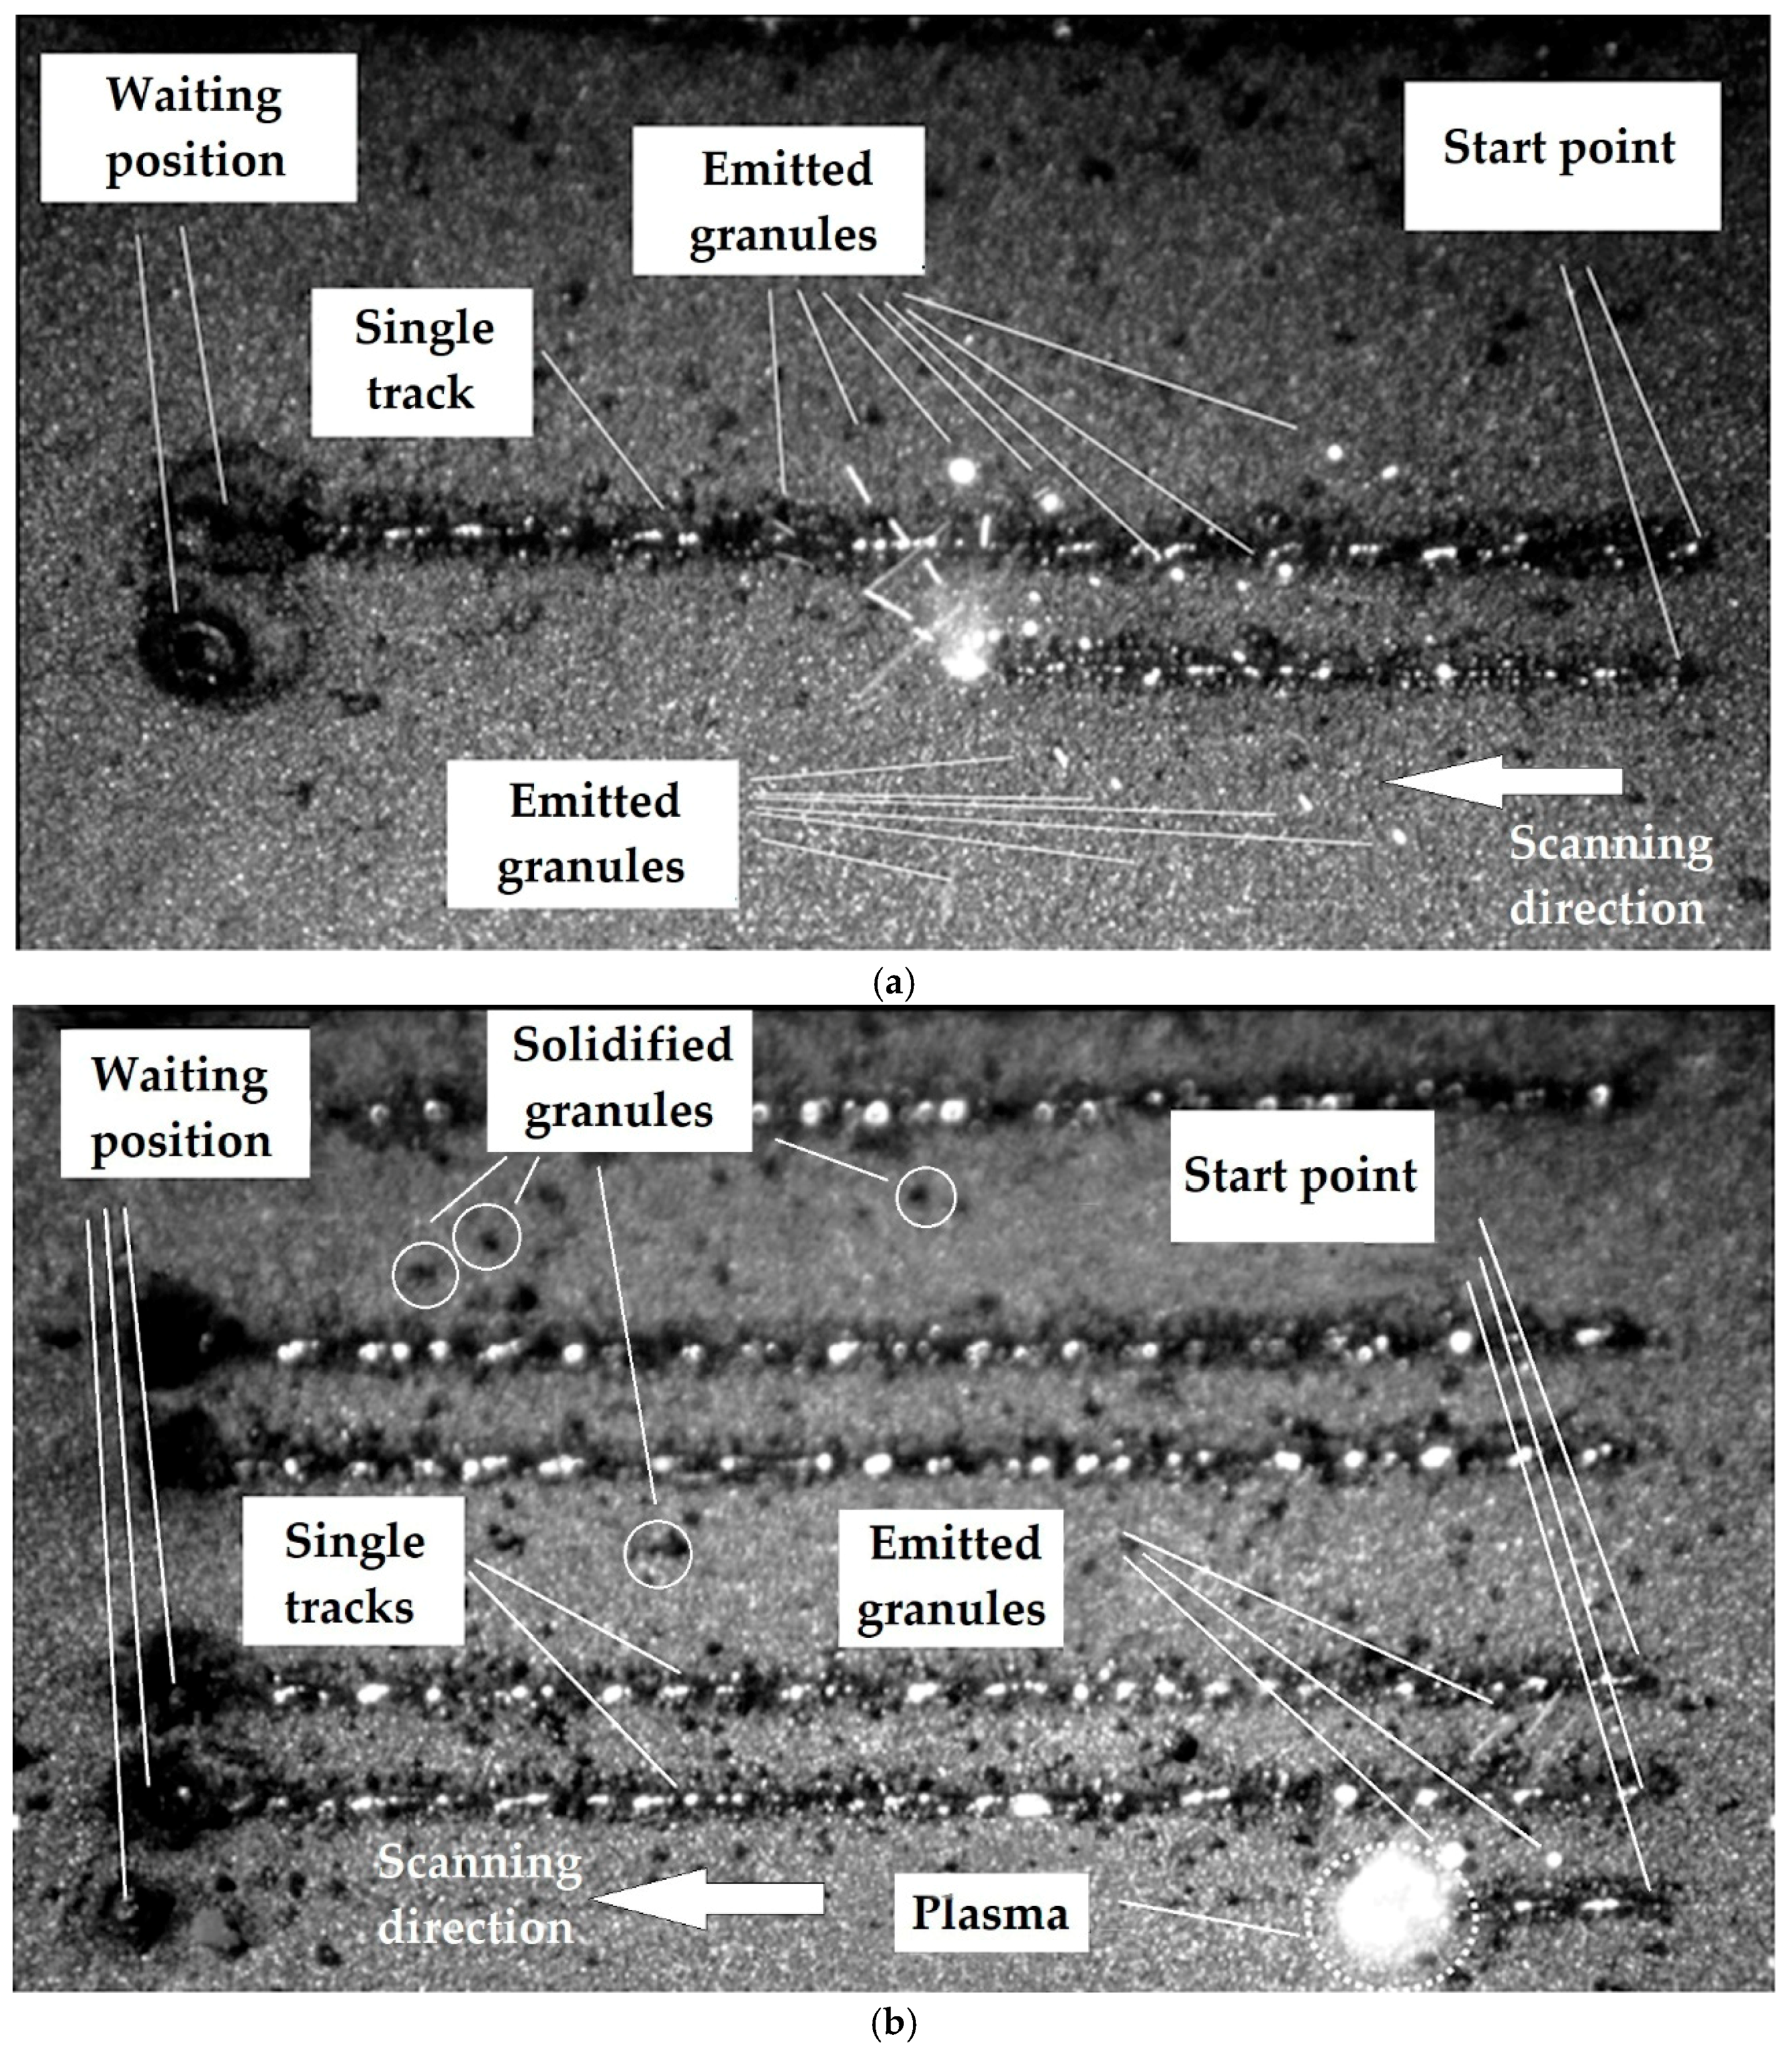
4.2. Discussion on Results of Video Monitoring
4.3. Achievability of the Alternative Laser Profiles
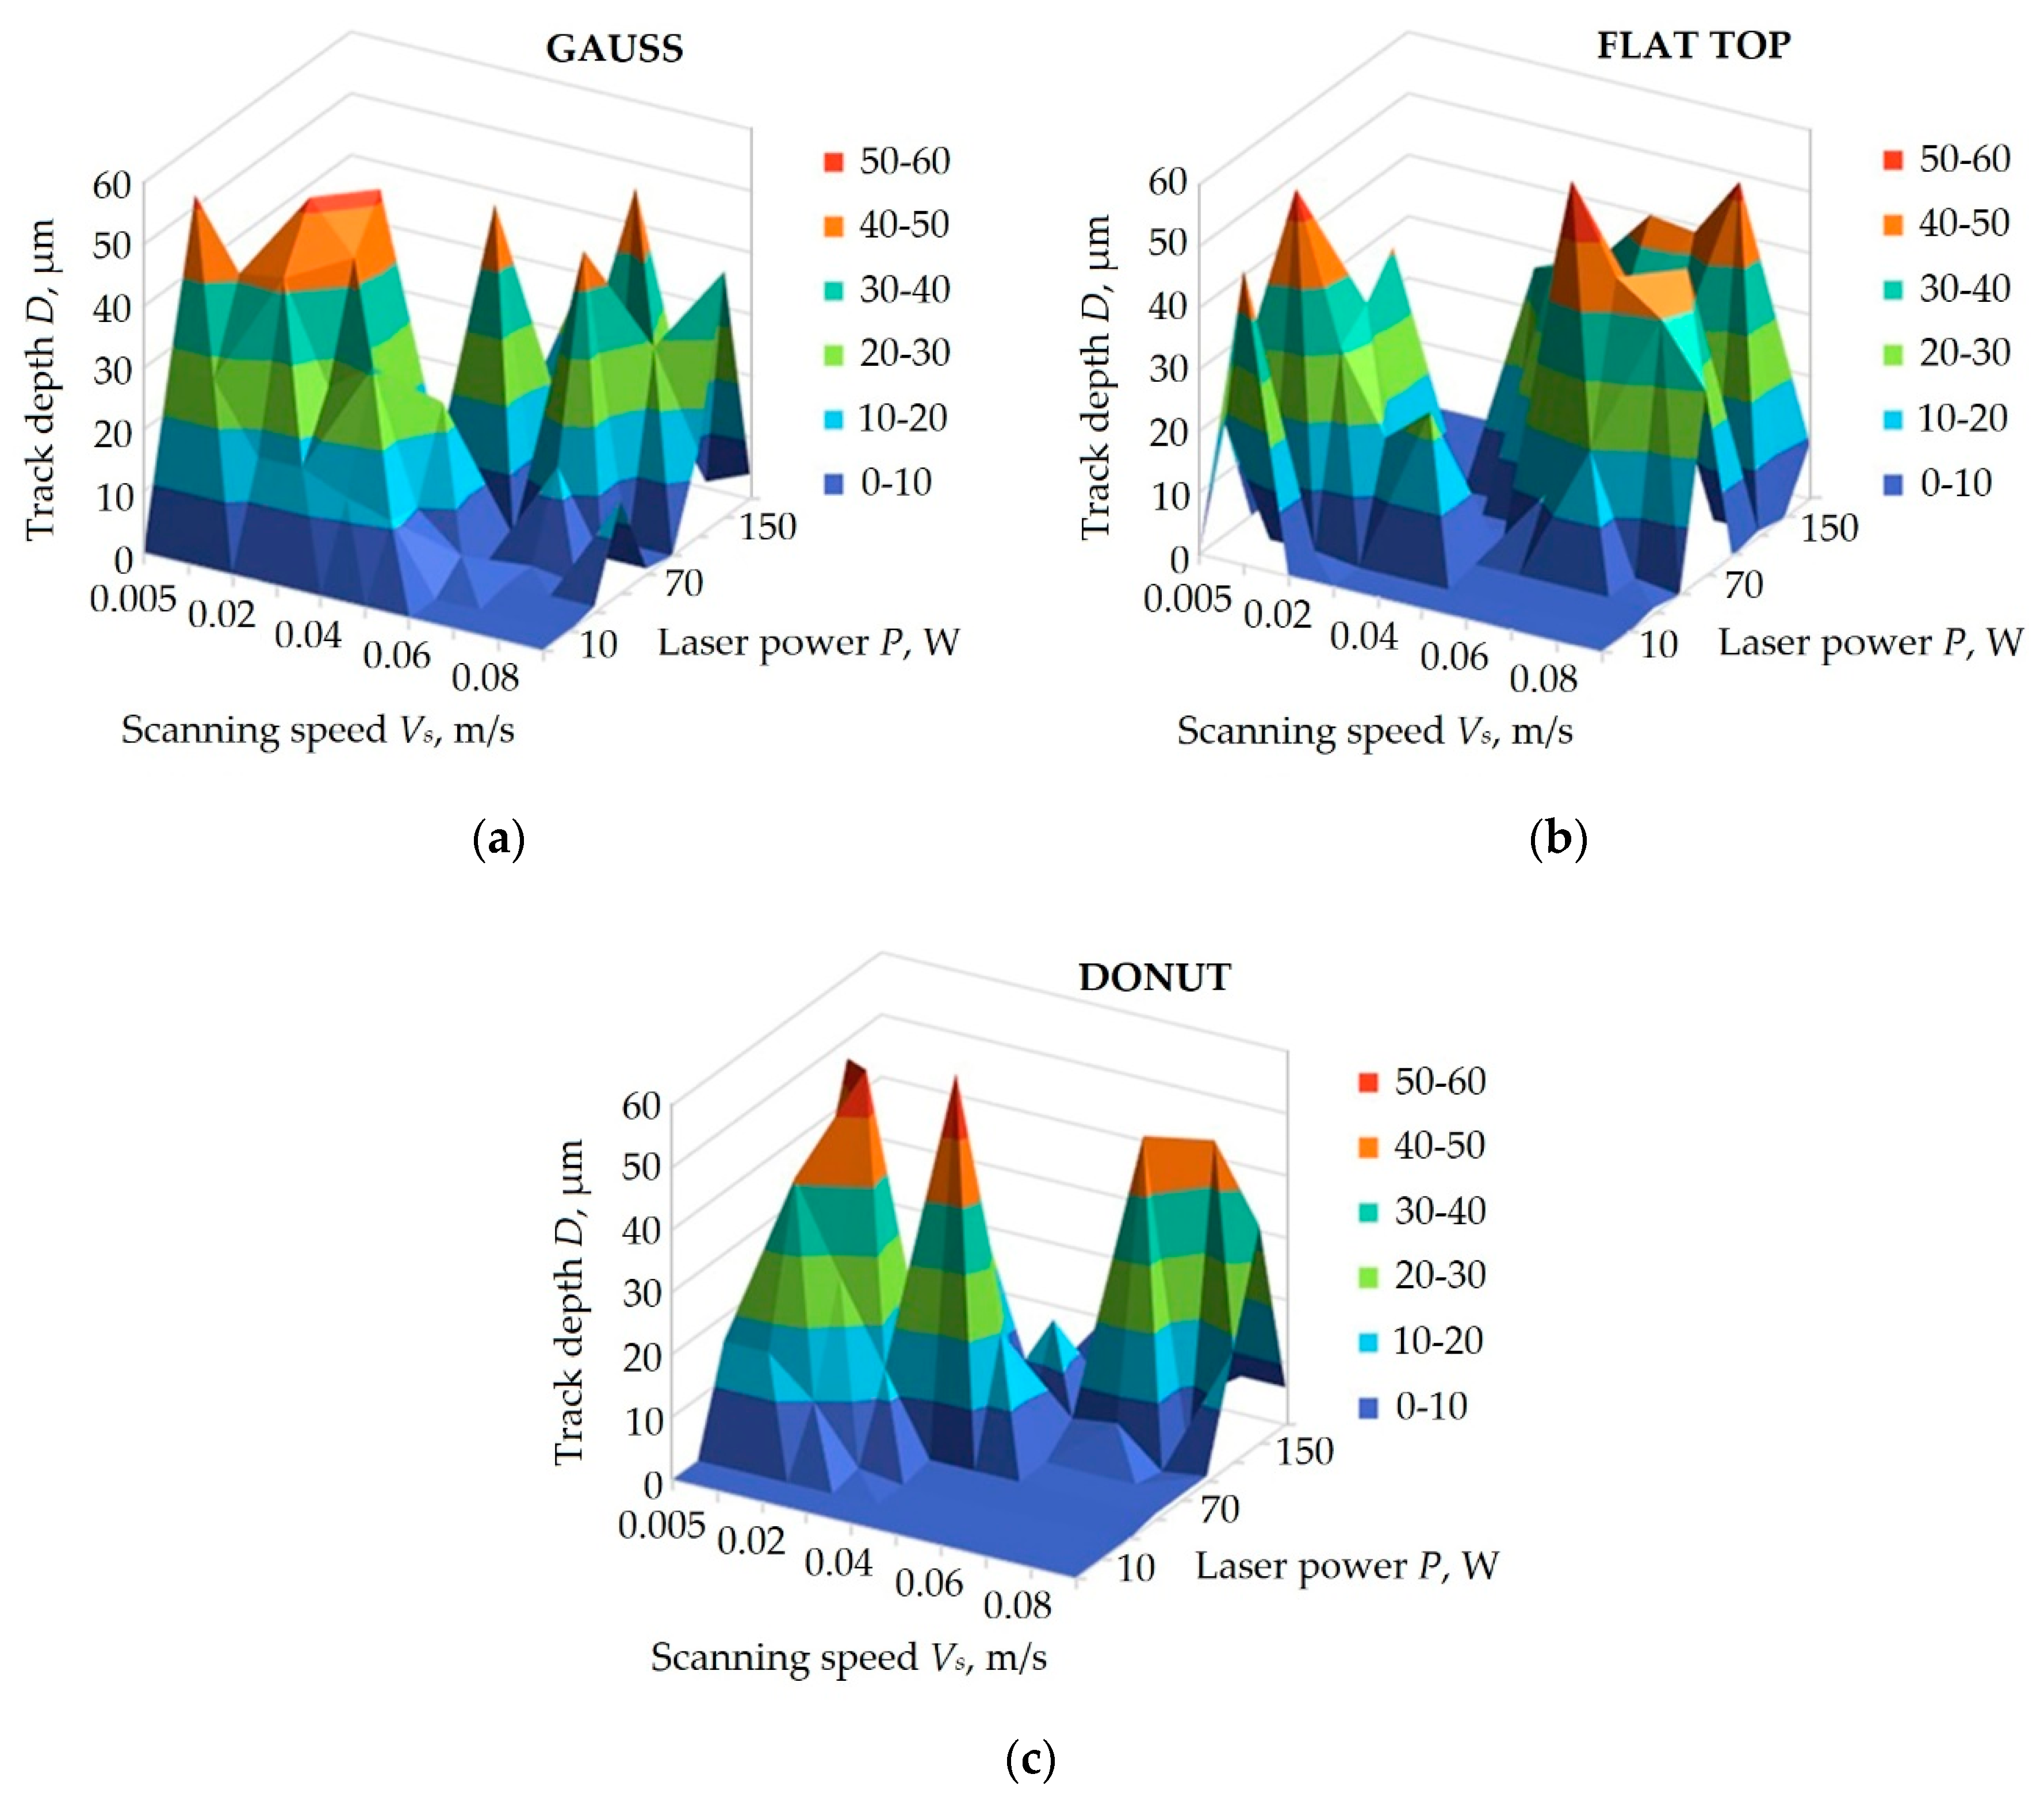
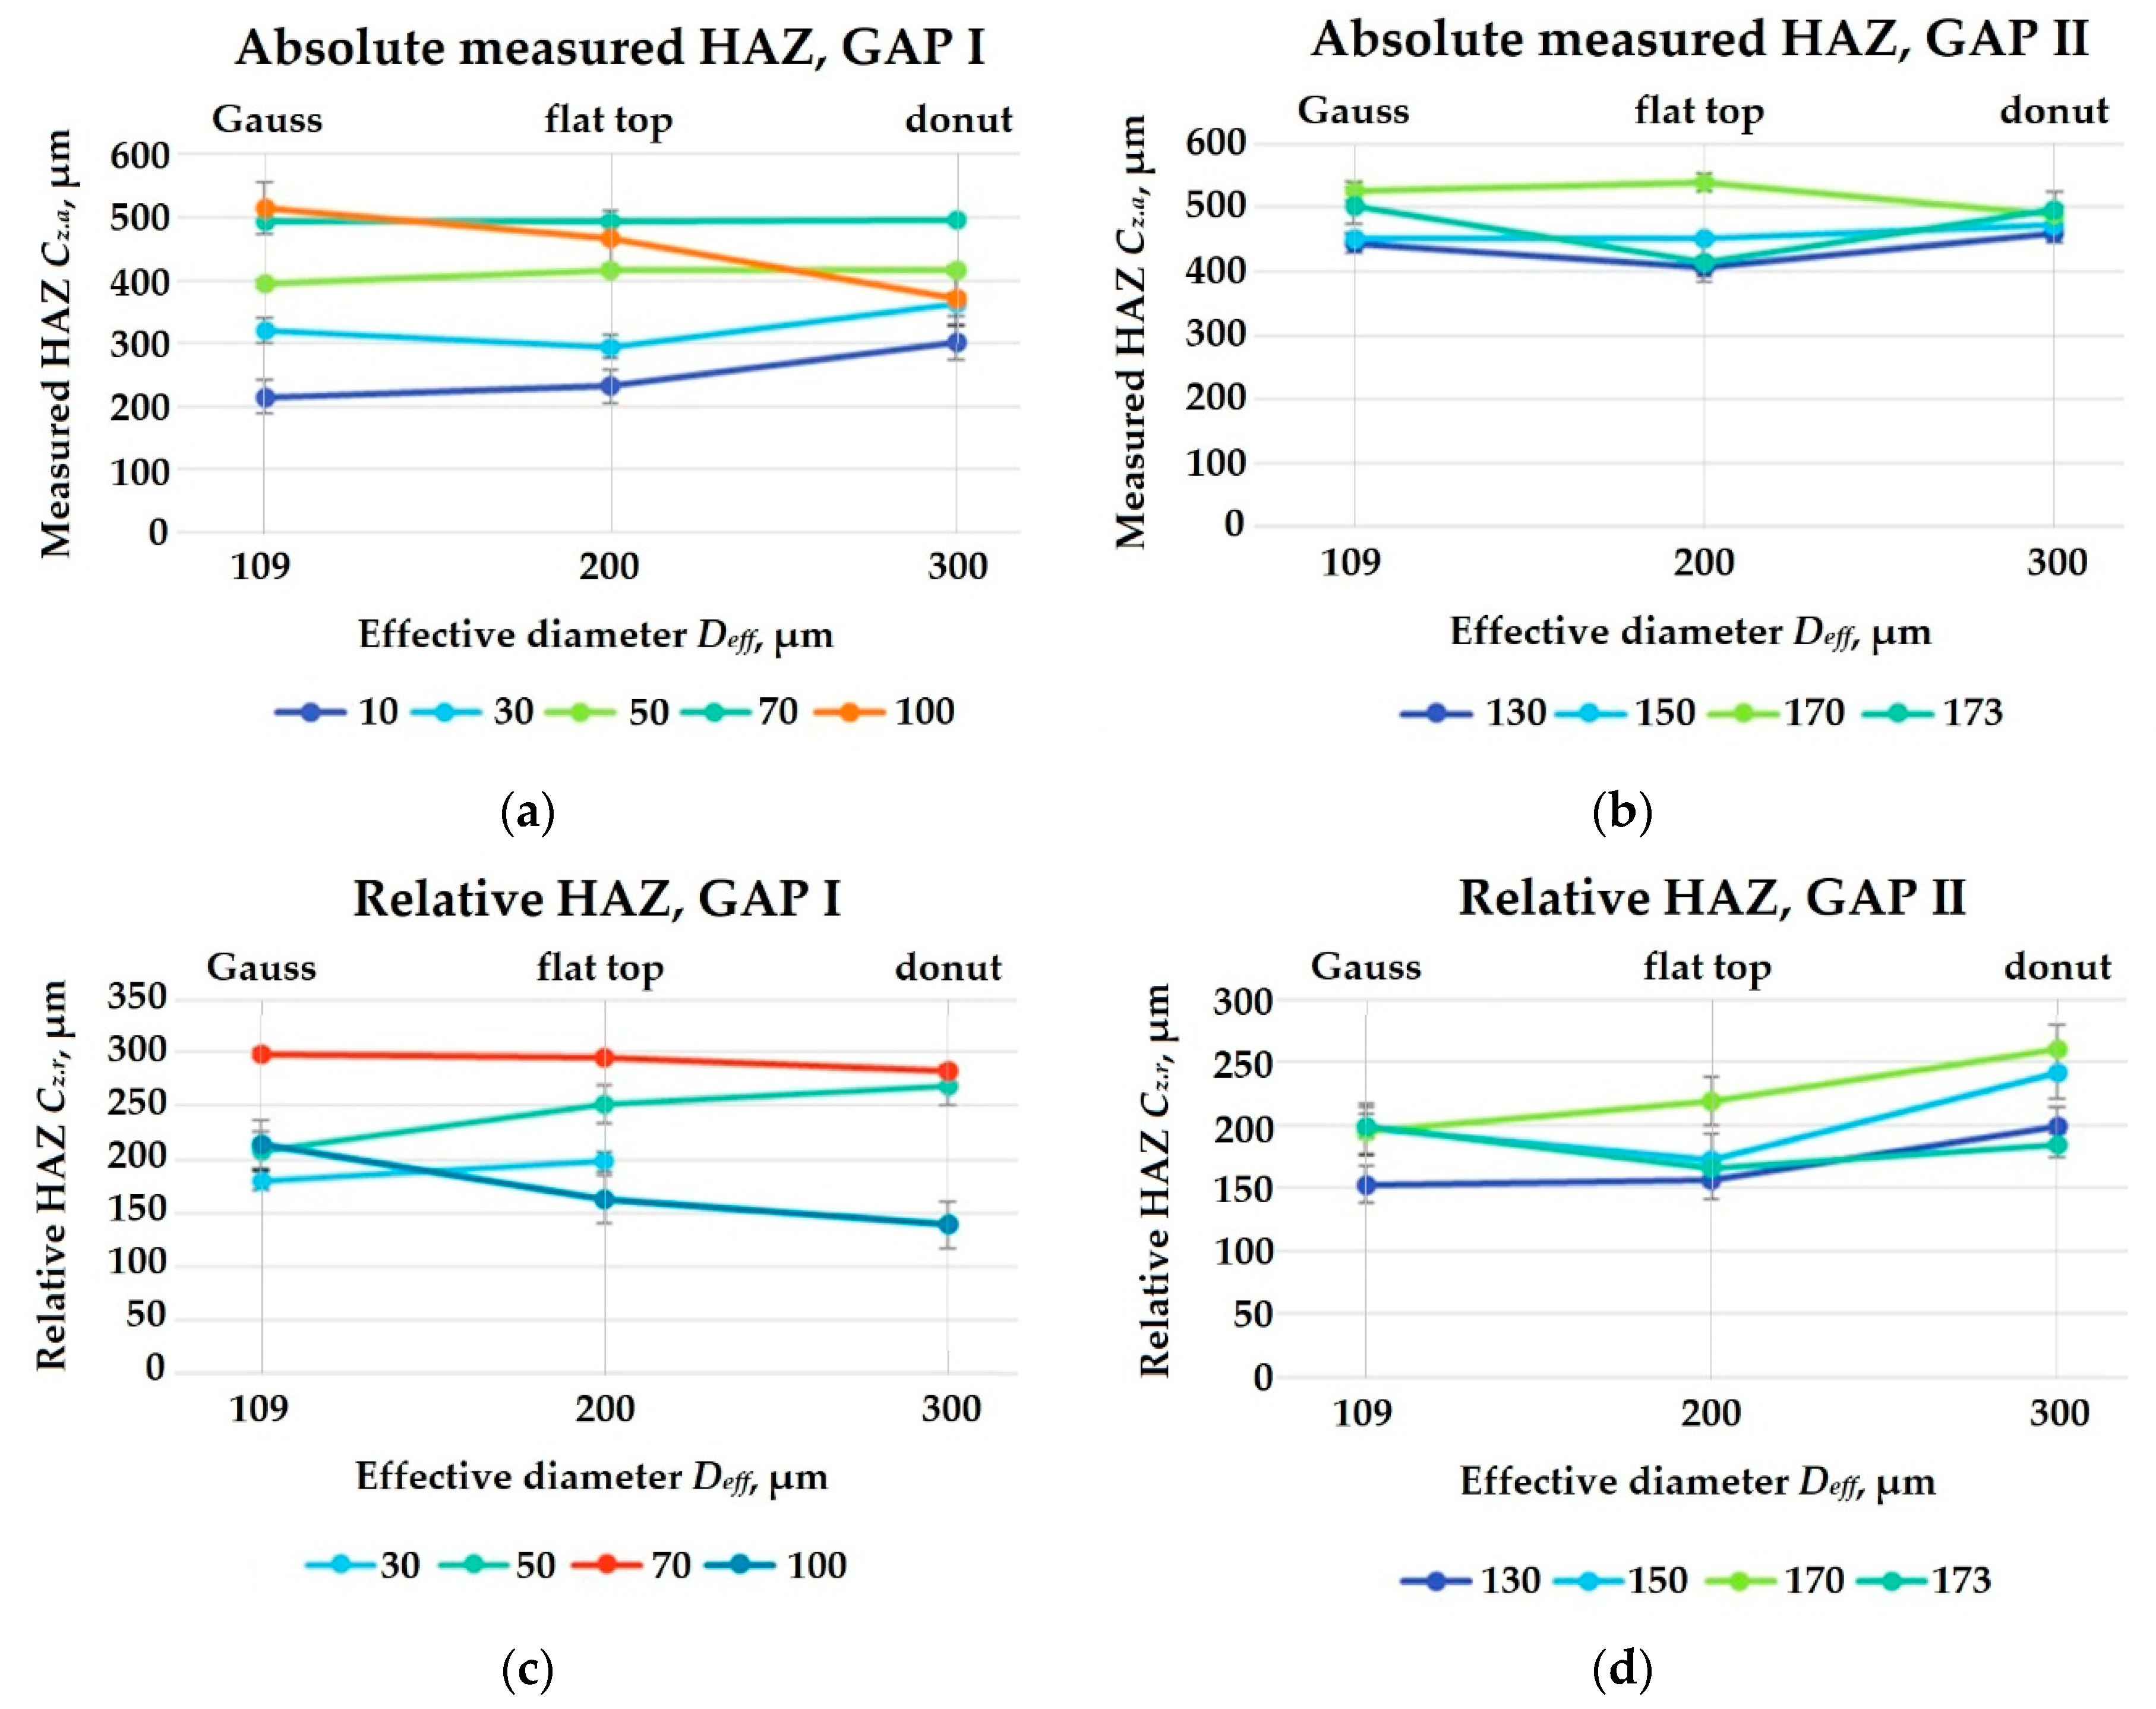
4.4. Influence of Laser Density Distribution on Geometry of the Tracks
5. Conclusions
6. Patents
- Smurov, I.Y.; Grigoriev, S.N.; Yadroitsev, I.A.; Okunkova, A.A.; Vladimirov, Yu. G. A Method of Manufacturing Products from Composite Powdered Materials; RU 2491152C1, 2013.08.27.
- Kozochkin, M.P.; Okunkova, A.A.; Podrabinnik, P.A.; Peretyagin, P.Yu.; Safronov, V.A.; Khmyrov, R.S. Device for Laser Processing of Powder Materials; RU163795U1, 2016.08.10.
Author Contributions
Funding
Acknowledgments
Conflicts of Interest
References
- Zhang, K.; Mao, Z.; Fu, G.; Zhang, D.Z.; Liu, C.; Li, Z.H. A feasible method of support slimming based on the different thresholds of polar angles in selective laser melting. Mater. Des. 2018, 157, 501–511. [Google Scholar] [CrossRef]
- Konstantinou, I.; Vosniakos, G.-C. Rough-cut fast numerical investigation of temperature fields in selective laser sintering/melting. Int. J. Adv. Manuf. Technol. 2018, 99, 29–36. [Google Scholar] [CrossRef]
- Zavala-Arredondo, M.; Ali, H.; Groom, K.M.; Mumtaz, K. Investigating the melt pool properties and thermal effects of multi-laser diode area melting. Int. J. Adv. Manuf. Technol. 2018, 97, 1383–1396. [Google Scholar] [CrossRef] [Green Version]
- AlMangour, B.; Grzesiak, D.; Cheng, J.; Ertas, Y. Thermal behavior of the molten pool, microstructural evolution, and tribological performance during selective laser melting of TiC/316L stainless steel nanocomposites: Experimental and simulation methods. J. Mater. Process. Technol. 2018, 257, 288–301. [Google Scholar] [CrossRef]
- Salman, O.O.; Funk, A.; Waske, A.; Eckert, J.; Scudino, S. Additive Manufacturing of a 316L Steel Matrix Composite Reinforced with CeO2 Particles: Process Optimization by Adjusting the Laser Scanning Speed. Technologies 2018, 6, 25. [Google Scholar] [CrossRef]
- Song, W.; Wu, Y.; Gao, Y.; Chen, T.; Zheng, W.; Fang, H.; Song, L.; Yuan, X. Flexibly adjustable depth-of-focus photoacoustic microscopy with spatial light modulation. Appl. Phys. Lett. 2018, 113, 163502. [Google Scholar] [CrossRef]
- Carluccio, D.; Bermingham, M.J.; Zhang, Y.; StJohn, D.H.; Yang, K.; Rometsch, P.A.; Wu, X.; Dargusch, M.S. Grain refinement of laser remelted Al-7Si and 6061 aluminium alloys with Tibor (R) and scandium additions. J. Manuf. Process. 2018, 35, 715–720. [Google Scholar] [CrossRef]
- Nguyen, Q.B.; Zhu, Z.; Chua, B.W.; Zhou, W.; Wei, J.; Nai, S.M.L. Development of WC-Inconel composites using selective laser melting. Arch. Civ. Mech. Eng. 2018, 18, 1410–1420. [Google Scholar] [CrossRef]
- Kang, N.; Ma, W.; Heraud, L.; El Mansori, M.; Li, F.; Liu, M.; Liao, H. Selective laser melting of tungsten carbide reinforced maraging steel composite. Addit. Manuf. 2018, 22, 104–110. [Google Scholar] [CrossRef]
- Tan, C.; Zhou, K.; Ma, W.; Attard, B.; Zhang, P.; Kuang, T. Selective laser melting of high-performance pure tungsten: Parameter design, densification behavior and mechanical properties. Sci. Technol. Adv. Mater. 2018, 19, 370–380. [Google Scholar] [CrossRef]
- Ivekovic, A.; Omidvari, N.; Vrancken, B.; Lietaert, K.; Thijs, L.; Vanmeensel, K.; Vleugels, J.; Kruth, J.-P. Selective laser melting of tungsten and tungsten alloys. Int. J. Refract. Met. Hard Mater. 2018, 72, 27–32. [Google Scholar] [CrossRef]
- Enneti, R.K.; Morgan, R.; Atre, S.V. Effect of process parameters on the Selective Laser Melting (SLM) of tungsten. Int. J. Refract. Met. Hard Mater. 2018, 71, 315–319. [Google Scholar] [CrossRef]
- Uhlmann, E.; Bergmann, A.; Bolz, R.; Gridin, W. Application of additive manufactured tungsten carbide tool electrodes in EDM. Proc. CIRP 2018, 68, 86–90. [Google Scholar] [CrossRef]
- Banas, A.; Engay, E.; Bunea, A.-I.; Daedalus Separa, S.; Glückstad, J. Three-dimensional light sculpting using a geometric analysis. Opt. Commun. 2019, 431, 210–215. [Google Scholar] [CrossRef]
- Bartolomeu, F.; Costa, M.M.; Gomes, J.R.; Alves, N.; Abreu, C.S.; Silva, F.S.; Miranda, G. Implant surface design for improved implant stability—A study on Ti6Al4V dense and cellular structures produced by Selective Laser Melting. Tribol. Int. 2019, 129, 272–282. [Google Scholar] [CrossRef]
- Yang, L.; Yan, C.; Han, C.; Chen, P.; Yang, S.; Shi, Y. Mechanical response of a triply periodic minimal surface cellular structures manufactured by selective laser melting. Int. J. Mech. Sci. 2018, 148, 149–157. [Google Scholar] [CrossRef]
- Wang, X.W.; Ho, J.Y.; Leong, K.C.; Wong, T.N. Condensation heat transfer and pressure drop characteristics of R-134a in horizontal smooth tubes and enhanced tubes fabricated by selective laser melting. Int. J. Heat Mass Transf. 2018, 126, 949–962. [Google Scholar] [CrossRef]
- Gusarov, A.V.; Grigoriev, S.N.; Volosova, M.A.; Melnik, Y.A.; Laskin, A.; Kotoban, D.V.; Okunkova, A.A. On productivity of laser additive manufacturing. J. Mater. Process. Technol. 2018, 261, 213–232. [Google Scholar] [CrossRef]
- Wei, M.; Chen, S.; Xi, L.; Liang, J.; Liu, C. Selective laser melting of 24CrNiMo steel for brake disc: Fabrication efficiency, microstructure evolution, and properties. Opt. Laser Technol. 2018, 107, 99–109. [Google Scholar] [CrossRef]
- Wessels, H.; Weissenfels, C.; Wriggers, P. Metal particle fusion analysis for additive manufacturing using the stabilized optimal transportation meshfree method. Comput. Methods Appl. Mech. Eng. 2018, 339, 91–114. [Google Scholar] [CrossRef]
- Aqilah, D.N.; Sayuti, A.K.M.; Farazila, Y.; Suleiman, D.; Amirah, M.; Izzati, W. Effects of Process Parameters on the Surface Roughness of Stainless Steel 316L Parts Produced by Selective Laser Melting. J. Test. Eval. 2018, 46, 1673–1683. [Google Scholar] [CrossRef]
- Wen, S.; Dong, A.; Lu, Y.; Zhu, G.; Shu, D.; Sun, B. Finite Element Simulation of the Temperature Field and Residual Stress in GH536 Superalloy Treated by Selective Laser Melting. Acta Metall. Sin. 2018, 54, 393–403. [Google Scholar]
- Anilli, M.; Demir, A.G.; Previtali, B. Additive manufacturing of laser cutting nozzles by SLM: Processing, finishing and functional characterization. Rapid Prototyp. J. 2018, 24, 562–583. [Google Scholar] [CrossRef]
- Buchbinder, D.; Schleifenbaum, H.; Heidrich, S.; Meiners, W.; Bültmann, J. High Power Selective Laser Melting (HP SLM) of Aluminum Parts. Phys. Procedia 2011, 12, 271–278. [Google Scholar] [CrossRef]
- Kumar, S.; Czekanski, A. Optimization of parameters for SLS of WC-Co. Rapid Prototyp. J. 2017, 23, 1202–1211. [Google Scholar] [CrossRef]
- Kimura, T.; Nakamoto, T. Thermal and Mechanical Properties of Commercial-Purity Aluminum Fabricated Using Selective Laser Melting. Mater. Trans. 2017, 58, 799–805. [Google Scholar] [CrossRef]
- Alfaify, A.Y.; Hughes, J.; Ridgway, K. Critical evaluation of the pulsed selective laser melting process when fabricating Ti64 parts using a range of particle size distributions. Addit. Manuf. 2018, 19, 197–204. [Google Scholar] [CrossRef]
- Raus, A.A.; Wahab, M.S.; Ibrahim, M.; Kamarudin, K.; Aqeel, A.; Shamsudin, S. Mechanical and Physical Properties of AlSi10Mg Processed through Selective Laser Melting. AIP Conf. Proc. 2017, 1831, 020027. [Google Scholar]
- Buchbinder, D.; Meiners, W.; Wissenbach, K. Selective laser melting of aluminum die-cast alloy-Correlations between process parameters, solidification conditions, and resulting mechanical properties. J. Laser Appl. 2015, 27, S29205. [Google Scholar] [CrossRef]
- Yuan, P.; Gu, D. Molten pool behaviour and its physical mechanism during selective laser melting of TiC/AlSi10Mg nanocomposites: Simulation and experiments. J. Phys. D Appl. Phys. 2015, 48, 035303. [Google Scholar] [CrossRef]
- Vrána, R.; Červinek, O.; Maňas, P.; Koutný, D.; Paloušek, D. Dynamic Loading of Lattice Structure Made by Selective Laser Melting-Numerical Model with Substitution of Geometrical Imperfections. Materials 2018, 11, 2129. [Google Scholar] [CrossRef] [PubMed]
- Patel, R.; Hirsch, M.; Dryburgh, P.; Pieris, D.; Achamfuo-Yeboah, S.; Smith, R.J.; Light, R.A.; Sharples, S.D.; Clare, A.T.; Clark, M. Imaging Material Texture of As-Deposited Selective Laser Melted Parts Using Spatially Resolved Acoustic Spectroscopy. Appl. Sci. 2018, 8, 1991. [Google Scholar] [CrossRef]
- Weißmann, V.; Boss, C.; Schulze, C.; Hansmann, H.; Bader, R. Experimental Characterization of the Primary Stability of Acetabular Press-Fit Cups with Open-Porous Load-Bearing Structures on the Surface Layer. Metals 2018, 8, 839. [Google Scholar] [CrossRef]
- Siddique, S.; Awd, M.; Wiegold, T.; Klinge, S.; Walther, F. Simulation of Cyclic Deformation Behavior of Selective Laser Melted and Hybrid-Manufactured Aluminum Alloys Using the Phase-Field Method. Appl. Sci. 2018, 8, 1948. [Google Scholar] [CrossRef]
- Hartunian, P.; Eshraghi, M. Effect of Build Orientation on the Microstructure and Mechanical Properties of Selective Laser-Melted Ti-6Al-4V Alloy. J. Manuf. Mater. Process. 2018, 2, 69. [Google Scholar] [CrossRef]
- Okunkova, A.; Peretyagin, P.; Vladimirov, Y.; Volosova, M.; Torrecillas, R.; Fedorov, S.V. Laser-beam modulation to improve efficiency of selecting laser melting for metal powders. Proc. SPIE 2014, 9135, 913524. [Google Scholar]
- Kotoban, D.; Grigoriev, S.; Okunkova, A.; Sova, A. Influence of a shape of single track on deposition efficiency of 316L stainless steel powder in cold spray. Surf. Coat. Technol. 2017, 309, 951–958. [Google Scholar] [CrossRef]
- Isaev, A.; Grechishnikov, V.; Pivkin, P.; Kozochkin, M.; Ilyuhin, Y.; Vorotnikov, A. Machining of thin-walled parts produced by additive manufacturing technologies. Procedia CIRP 2016, 41, 1023–1026. [Google Scholar]
- Isaev, A.V.; Kozochkin, M.P. Use of a Measurement Information System to Increase the Precision with which Thin-Walled Parts are Machined on Numerically Controlled Milling Machines. Meas. Tech. 2014, 56, 1155–1161. [Google Scholar] [CrossRef]
- Kozochkin, M.P.; Porvatov, A.N.; Sabirov, F.S. The fitting of technological equipment with data-measuring systems. Meas. Tech. 2012, 55, 530–534. [Google Scholar] [CrossRef]
- Metel, A.S.; Grigoriev, S.N.; Melnik, Y.A.; Prudnikov, V.V. Glow discharge with electrostatic confinement of electrons in a chamber bombarded by fast electrons. Plasma Phys. Rep. 2011, 37, 628–637. [Google Scholar] [CrossRef]
- Kim, W.C.; Park, N.C. Effect of birefringence of lens material on polarization status and optical imaging characteristics. Opt. Commun. 2018, 413, 329–335. [Google Scholar]
- Peng, C.; He, Y.; Wang, J. Optimization of pencil beam f-theta lens for high-accuracy metrology. Opt. Eng. 2018, 57, 015101. [Google Scholar] [CrossRef]
- Grigoriev, S.N.; Kozochkin, M.P.; Sabirov, F.S.; Kutin, A. Diagnostic Systems as Basis for Technological Improvement. Procedia CIRP 2012, 1, 599–604. [Google Scholar] [CrossRef]
- Kozochkin, M.P.; Porvatov, A.N.; Sabirov, F.S. Vibration Testing of Technological Processes in Automated Machining Equipment. Meas. Tech. 2014, 56, 1414–1420. [Google Scholar] [CrossRef]
- Liu, Z.; Wu, J.; Zhang, Y.; Zhang, Y.X.; Tang, X.Y.; Yang, X.H.; Zhang, J.Z.; Yang, J.; Yuan, L.B. Optical trapping and axial shifting for strongly absorbing particle with single focused TEM00 Gaussian beam. Appl. Phys. Lett. 2018, 113, 091101. [Google Scholar] [CrossRef]
- Bhebhe, N.; Rosales-Guzman, C.; Forbes, A. Classical and quantum analysis of propagation invariant vector flat-top beams. Appl. Opt. 2018, 57, 5451–5458. [Google Scholar] [CrossRef] [PubMed]
- Oliker, V.; Doskolovich, L.L.; Bykov, D.A. Beam shaping with a plano-freeform lens pair. Opt. Express 2018, 26, 19406–19419. [Google Scholar] [CrossRef] [PubMed]
- Naidoo, D.; Litvin, I.A.; Forbes, A. Brightness enhancement in a solid-state laser by mode transformation. Optica 2018, 5, 836–843. [Google Scholar] [CrossRef]
- Kanzler, K.J. Transformation of a Gaussian laser beam to an Airy pattern for use in focal plane intensity shaping using diffractive optics. Proc. SPIE 2001, 4443, 58–66. [Google Scholar] [CrossRef]
- Almeida, J.; Liang, D.; Vistas, C.R. A doughnut-shaped Nd: YAG solar laser beam. Opt. Laser Technol. 2018, 106, 1–6. [Google Scholar] [CrossRef]
- Prashanth, K.G.; Scudino, S.; Chatterjee, R.P.; Salman, O.O.; Eckert, J. Additive Manufacturing: Reproducibility of Metallic Parts. Technologies 2017, 5, 8. [Google Scholar] [CrossRef]
- Bassoli, E.; Denti, L. Assay of Secondary Anisotropy in Additively Manufactured Alloys for Dental Applications. Materials 2018, 11, 1831. [Google Scholar] [CrossRef] [PubMed]
- Zhuang, Y.-X.; Zhang, X.-L.; Gu, X.-Y. Effect of Annealing on Microstructure and Mechanical Properties of Al0.5CoCrFeMoxNi High-Entropy Alloys. Entropy 2018, 20, 812. [Google Scholar] [CrossRef]
- Wang, J.-H.; Ren, J.; Liu, W.; Wu, X.-Y.; Gao, M.-X.; Bai, P.-K. Effect of Selective Laser Melting Process Parameters on Microstructure and Properties of Co-Cr Alloy. Materials 2018, 11, 1546. [Google Scholar] [CrossRef] [PubMed]
- Harun, W.S.W.; Kamariah, M.S.I.N.; Muhamad, N.; Ghani, S.A.C.; Ahmad, F.; Mohamed, Z. A review of powder additive manufacturing processes for metallic biomaterials. Powder Technol. 2018, 327, 128–151. [Google Scholar] [CrossRef]
- Bai, Y.; Fu, F.; Xiao, Z.; Zhang, M.; Wang, D.; Yang, Y.; Song, C. Progress in selective laser melting equipment, related biomedical metallic materials and applications. J. Zhejiang Univ. Sci. A 2018, 19, 122–136. [Google Scholar] [CrossRef]
- Yang, Y.Z.; Ong, J.L.; Tian, J. Deposition of highly adhesive ZrO2 coating on Ti and CoCrMo implant materials using plasma spraying. Biomaterials 2003, 24, 619–627. [Google Scholar] [CrossRef]
- Kuzin, V.V.; Grigor’ev, S.N.; Volosova, M.A. Effect of a TiC Coating on the Stress-Strain State of a Plate of a High-Density Nitride Ceramic under Nonsteady Thermoelastic Conditions. Refract. Ind. Ceram. 2014, 54, 376–380. [Google Scholar] [CrossRef]
- Volosova, M.A.; Grigor’ev, S.N.; Kuzin, V.V. Effect of Titanium Nitride Coating on Stress Structural Inhomogeneity in Oxide-Carbide Ceramic. Part 4. Action of Heat Flow. Refract. Ind. Ceram. 2015, 56, 91–96. [Google Scholar] [CrossRef]
- Essa, K.; Sabouri, A.; Butt, H.; Basuny, F.H.; Ghazy, M.; El-Sayed, M.A. Laser additive manufacturing of 3D meshes for optical applications. PLoS ONE 2018, 13, e0192389. [Google Scholar] [CrossRef]
- Nguyen, V.L.; Kim, E.-A.; Lee, S.-R.; Yun, J.; Choe, J.; Yang, D.-Y.; Lee, H.-S.; Lee, C.-W.; Yu, J.-H. Evaluation of Strain-Rate Sensitivity of Selective Laser Melted H13 Tool Steel Using Nanoindentation Tests. Metals 2018, 8, 589. [Google Scholar] [CrossRef]
- Metel, A.; Bolbukov, V.; Volosova, M.; Grigoriev, S.; Melnik, Y. Source of metal atoms and fast gas molecules for coating deposition on complex shaped dielectric products. Surf. Coat. Technol. 2013, 225, 34–39. [Google Scholar] [CrossRef]
- Metel, A.S. Ionization Effect in Cathode Layers on Glow-Discharge Characteristics with Oscillating Electrons. 1. Discharge with the Hollow-Cathode. Zhurnal Tekh. Fiz. 1985, 55, 1928–1934. [Google Scholar]
- Metel, A.; Bolbukov, V.; Volosova, M.; Grigoriev, S.; Melnik, Y. Equipment for Deposition of Thin Metallic Films Bombarded by Fast Argon Atoms. Instrum. Exp. Tech. 2014, 57, 345–351. [Google Scholar] [CrossRef]
- Chang, C.; Chen, X.; Chen, Z.; Lin, Z.; Li, X.; Pu, J. Experimental investigation on a nonuniformly correlated partially coherent laser. Appl. Opt. 2018, 57, 4381–4385. [Google Scholar] [CrossRef] [PubMed]
- Gupta, D.K.; Tata, B.V.R.; Ravindran, T.R. A Technique to Calibrate Spatial Light Modulator for Varying Phase Response over its Spatial Regions. AIP Conf. Proc. 2018, 1953, 140112. [Google Scholar]
- Bell, T.; Hasnaoui, A.; Ait-Ameur, K.; Ngcobo, S. Excitation of high-radial-order Laguerre-Gaussian modes in a solid-state laser using a lower-loss digitally controlled amplitude mask. J. Opt. 2017, 19, 105604. [Google Scholar] [CrossRef]
- Wang, M.; Zong, L.; Mao, L.; Marquez, A.; Ye, Y.; Zhao, H.; Vaquero Caballero, F.J. LCoS SLM Study and Its Application in Wavelength Selective Switch. Photonics 2017, 4, 22. [Google Scholar] [CrossRef]
- Wang, H.; Piestun, R. Dynamic 2D implementation of 3D diffractive optics. Optica 2018, 5, 1220–1228. [Google Scholar] [CrossRef]
- Kang, N.; El Mansori, M.; Guittonneau, F.; Liao, H.; Fu, Y.; Aubry, E. Controllable mesostructure, magnetic properties of soft magnetic Fe-Ni-Si by using selective laser melting from nickel coated high silicon steel powder. Appl. Surf. Sci. 2018, 455, 736–741. [Google Scholar] [CrossRef]
- Drexler, M.; Greiner, S.; Lexow, M.; Lanzl, L.; Wudy, K.; Drummer, D. Selective laser melting of polymers: Influence of powder coating on mechanical part properties. J. Polym. Eng. 2018, 38, 667–674. [Google Scholar] [CrossRef]
- Papadakis, L.; Chantzis, D.; Salonitis, K. On the energy efficiency of pre-heating methods in SLM/SLS processes. Int. J. Adv. Manuf. Technol. 2018, 95, 1325–1338. [Google Scholar] [CrossRef]
- Wang, X.; Kustov, S.; Van Humbeeck, J. A Short Review on the Microstructure, Transformation Behavior and Functional Properties of NiTi Shape Memory Alloys Fabricated by Selective Laser Melting. Materials 2018, 11, 1683. [Google Scholar] [CrossRef] [PubMed]
- Kumar, V.; Dixit, U.S.; Zhang, J. Determination of thermal conductivity, absorptivity and heat transfer coefficient during laser-based manufacturing. Measurement 2019, 131, 319–328. [Google Scholar] [CrossRef]
- Zhang, Z.; Huang, Y.; Kasinathan, A.R.; Imani Shahabad, S.; Ali, U.; Mahmoodkhani, Y.; Toyserkani, E. 3-Dimensional heat transfer modeling for laser powder-bed fusion additive manufacturing with volumetric heat sources based on varied thermal conductivity and absorptivity. Opt. Laser Technol. 2019, 109, 297–312. [Google Scholar] [CrossRef]
- Yadroitsev, I.; Gusarov, A.; Yadroitsava, I.; Smurov, I. Single track formation in selective laser melting of metal powders. J. Mater. Process. Technol. 2010, 210, 1624–1631. [Google Scholar] [CrossRef]
- Gusarov, A.V.; Gnedovets, A.G.; Smurov, I. Two-dimensional gas-dynamic model of laser ablation in an ambient gas. Appl. Surf. Sci. 2000, 154, 66–72. [Google Scholar] [CrossRef]
- Gusarov, A.; Liegeois, F. Experimental study of a tunable fiber ring laser stability. Opt. Commun. 2004, 234, 391–397. [Google Scholar] [CrossRef]
- Gusarov, A.V.; Smurov, I. Two-dimensional numerical modelling of radiation transfer in powder beds at selective laser melting. Appl. Surf. Sci. 2009, 255, 5595–5599. [Google Scholar] [CrossRef]
- Sova, A.; Okunkova, A.; Grigoriev, S. Velocity of the Particles Accelerated by a Cold Spray Micronozzle: Experimental Measurements and Numerical Simulation. J. Therm. Spray Technol. 2013, 22, 75–80. [Google Scholar] [CrossRef]
- Sobol’, O.V.; Andreev, A.A.; Grigoriev, S.N.; Volosova, M.A.; Gorban, V.F. Vacuum-arc multilayer nanostructured TiN/Ti coatings: Structure, stress state, properties. Met. Sci. Heat Treat. 2012, 54, 28–33. [Google Scholar] [CrossRef]
- Tarasova, T.V.; Nazarov, A.P.; Prokof’ev, M.V. Effect of the regimes of selective laser melting on the structure and physicomechanical properties of cobalt-base superalloys. Phys. Met. Metallogr. 2015, 116, 601–605. [Google Scholar] [CrossRef]
- Grigor’ev, S.N.; Tarasova, T.V.; Gvozdeva, G.O.; Nowotny, S. Micro-Laser Facing of Al–Si System Alloys. Met. Sci. Heat Treat. 2013, 55, 242–246. [Google Scholar] [CrossRef]
- Grigoriev, S.N.; Tarasova, T.V.; Gvozdeva, G.O.; Nowotny, S. Microcladding of hypereutectic Al-Si alloys: Technological aspects and structure features. Int. J. Cast Met. Res. 2014, 27, 357–361. [Google Scholar] [CrossRef]
- Shi, X.; Ma, S.; Liu, C.; Wu, Q. Parameter optimization for Ti-47Al-2Cr-2Nb in selective laser melting based on geometric characteristics of single scan tracks. Opt. Laser Technol. 2017, 90, 71–79. [Google Scholar] [CrossRef]
- Santos, L.M.S.; de Jesus, J.; Ferreira, J.M.; Costa, J.D.; Capela, C. Fracture Toughness of Hybrid Components with Selective Laser Melting 18Ni300 Steel Parts. Appl. Sci. 2018, 8, 1879. [Google Scholar] [CrossRef]
- Fedorov, S.V.; Pavlov, M.D.; Okunkova, A.A. Effect of structural and phase transformations in alloyed subsurface layer of hard-alloy tools on their wear resistance during cutting of high-temperature alloys. J. Frict. Wear 2013, 34, 190–198. [Google Scholar] [CrossRef]
- Sova, A.; Doubenskaia, M.; Grigoriev, S.; Okunkova, A.; Smurov, I. Parameters of the Gas-Powder Supersonic Jet in Cold Spraying Using a Mask. J. Therm. Spray Technol. 2013, 22, 551–556. [Google Scholar] [CrossRef]
- Fousova, M.; Dvorsky, D.; Vronka, M.; Vojtech, D.; Lejcek, P. The Use of Selective Laser Melting to Increase the Performance of AlSi9Cu3Fe Alloy. Materials 2018, 11, 1918. [Google Scholar] [CrossRef]
- Kovalev, O.B.; Yudin, P.V.; Zaitsev, A.V. Formation of a vortex flow at the laser cutting of sheet metal with low pressure of assisting gas. J. Phys. D Appl. Phys. 2008, 41, 155112. [Google Scholar] [CrossRef]
- Kovaleva, I.O.; Kovalev, O.B. Simulation of the acceleration mechanism by light-propulsion for the powder particles at laser direct material deposition. Opt. Laser Technol. 2012, 44, 714–725. [Google Scholar] [CrossRef]
- Kovalev, O.B.; Gurin, A.M. Multivortex convection of metal in molten pool with dispersed impurity induced by laser radiation. Int. J. Heat Mass Transf. 2014, 68, 269–277. [Google Scholar] [CrossRef]
- Han, X.; Sawada, T.; Schille, C.; Schweizer, E.; Scheideler, L.; Geis-Gerstorfer, J.; Rupp, F.; Spintzyk, S. Comparative Analysis of Mechanical Properties and Metal-Ceramic Bond Strength of Co-Cr Dental Alloy Fabricated by Different Manufacturing Processes. Materials 2018, 11, 1801. [Google Scholar] [CrossRef] [PubMed]


| The Way of Laser Energy Transformation | Optimization on the Way to Reduce the Energy Loss | Theoretical Level of Influence on SLM Efficiency | Practical Level of Influence on SLM Efficiency |
|---|---|---|---|
| 1: Laser source | Optimization of wavelength λ [3,69] | ~0.3–1% | ~0.5% |
| 2: Optic system | Brightness enhancement of optic glasses [70] | ~1–2% | ~0.5% |
| 3: Powder absorption | Coatings, structure of powder surface, pre-heating to reduce a temperature gradient, pre-drying to reduce porosity [71,72,73] | ~10% | ~10–15% |
| 4: Heat and mass transfer in a molten pool | Optimization of laser power density distribution | ~2–3 times | The subject of study |
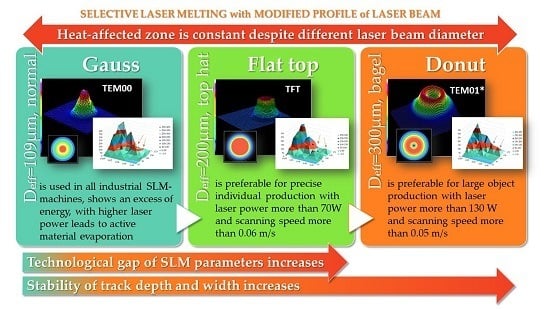
| Laser Beam Profiles | Effective Diameter Deff 1 (mm) | Group of SLM Parameters | Range of Values for Laser Power P (W) | Range of Values for Scanning Speed Vs (m/s) |
|---|---|---|---|---|
| Gaussian TEM00 | 0.109 | GAP I | 30 ÷ 70 | 0.02 ÷ 0.05 |
| GAP II | 130 ÷ 150 | 0.05 ÷ 0.07 | ||
| flat top TFT = TEM00 + TEM01* | 0.200 | GAP I | 50 ÷ 70 | 0.005 ÷ 0.03 |
| GAP II | 130 ÷ 170 | 0.04 ÷ 0.08 | ||
| donut TEM01* = TEM01 + TEM10 | 0.300 | GAP I | 50 ÷ 70 | 0.01 ÷ 0.03 |
| GAP II | 150 ÷ 173 | 0.05 ÷ 0.1 |
| Laser Power P, W | Scanning Speed Vs, m/s | |||||||||
|---|---|---|---|---|---|---|---|---|---|---|
| 0.005 | 0.01 | 0.02 | 0.03 | 0.04 | 0.05 | 0.06 | 0.07 | 0.08 | 0.1 | |
| Gauss | ||||||||||
| 10 | 0 1 | 0 | 0 | 0 | 0 | − 2 | − | − | − | − |
| 30 | 0 | 0 | 109 | 94 | 86 | 90 | − | − | − | − |
| 50 | 0 | 200 | 141 | 164 | 133 | 119 | 115 | 102 | 0 | 0 |
| 70 | 238 | 257 | 200 | 185 | 188 | 0 | 0 | 0 | 0 | 136 |
| 100 | 326 | 312 | 287 | 238 | 250 | 0 | 0 | 187 | 0 | 0 |
| 130 | 345 | 344 | 315 | 263 | 363 | 236 | 220 | 178 | 0 | 0 |
| 150 | 404 | 372 | 309 | 335 | 301 | 225 | 287 | 198 | 251 | 209 |
| 170 | 415 | 393 | 335 | 0 | 405 | 0 | 310 | 269 | 252 | 182 |
| 173 | 474 | 401 | 408 | 338 | 346 | 332 | 297 | 246 | 323 | 279 |
| Flat-top | ||||||||||
| 10 | 0 | 0 | − | − | − | − | − | − | − | − |
| 30 | 134 | 110 | 105 | 86 | 0 | 0 | − | − | − | − |
| 50 | 200 | 173 | 169 | 165 | 149 | 135 | 119 | 100 | 100 | 107 |
| 70 | 241 | 214 | 212 | 200 | 190 | 140 | 157 | 152 | 0 | − |
| 100 | 258 | 271 | 263 | 255 | 281 | 0 | 192 | 170 | 157 | 164 |
| 130 | 322 | 300 | 264 | 268 | 239 | 233 | 0 | 243 | 155 | 0 |
| 150 | 452 | 365 | 419 | 405 | 332 | 259 | 257 | 256 | 256 | 0 |
| 170 | 414 | 373 | 402 | 293 | 322 | 253 | 324 | 277 | 234 | 0 |
| 173 | 462 | 397 | 408 | 346 | 324 | 245 | 258 | 226 | 229 | 204 |
| Donut | ||||||||||
| 10 | 0 | 0 | − | − | − | − | − | − | − | − |
| 30 | 0 | 0 | 0 | 0 | − | − | − | − | − | − |
| 50 | 213 | 186 | 182 | 0 | 0 | 0 | 0 | 0 | 0 | − |
| 70 | 224 | 237 | 232 | 230 | 186 | 174 | 0 | 148 | 0 | 0 |
| 100 | 238 | 235 | 232 | 237 | 219 | 238 | 201 | 201 | 197 | 176 |
| 130 | 308 | 403 | 296 | 235 | 346 | 258 | 239 | 234 | 0 | 0 |
| 150 | 406 | 398 | 304 | 337 | 232 | 350 | 211 | 207 | 190 | 204 |
| 170 | 384 | 287 | 265 | 347 | 253 | 237 | 254 | 210 | 205 | 215 |
| 173 | 473 | 418 | 462 | 269 | 321 | 347 | 342 | 372 | 259 | 235 |
| Laser Beam Profiles | Max Depth of the Track (µm) | Range of Values for Laser Power P (W) | Range of Values for Scanning Speed Vs (m/s) |
|---|---|---|---|
| Gauss | 365 | 173 | 0.01 |
| Flat top | 280 | 173 | 0.01 |
| donut | 312 | 170 | 0.01 |
| Laser Beam Profiles | Effective Diameter Deff (µm) | Laser Power P (W) | ||||||||
| 10 | 30 | 50 | 70 | 100 | 130 | 150 | 170 | 173 | ||
| Scanning Speed Vs (m/s) | ||||||||||
| 0.005 ÷ 0.05 | 0.04 ÷ 0.1 | |||||||||
| Gauss | 109 | 214.5 | 320.5 | 395.7 | 493.7 | 513.2 | 444.5 | 451 | 525.8 | 502.7 |
| flat top | 200 | 232 | 294.7 | 415.8 | 493 | 468.2 | 407 | 451.3 | 540 | 414 |
| donut | 300 | 301 | 361.5 | 415.5 | 496 | 371.7 | 460 | 473.8 | 488 | 496.8 |
| Laser Beam Profiles | Effective Diameter Deff (µm) | Laser Power P (W) | ||||||||
| 10 1 | 30 1 | 50 | 70 | 100 | 130 | 150 | 170 | 173 | ||
| Scanning speed Vs (m/s) | ||||||||||
| 0.005 ÷ 0.05 | 0.04 ÷ 0.1 | |||||||||
| Gauss | 109 | - | 179.5 | 208.2 | 298.2 | 214 | 153 | 197.2 | 195 | 198.8 |
| flat top | 200 | - | 197.5 | 250.7 | 293.5 | 163 | 156.3 | 172.2 | 218.8 | 166.3 |
| donut | 300 | - | - | 269.3 | 282.2 | 138.5 | 198.5 | 241.5 | 259.8 | 184.2 |
© 2018 by the authors. Licensee MDPI, Basel, Switzerland. This article is an open access article distributed under the terms and conditions of the Creative Commons Attribution (CC BY) license (http://creativecommons.org/licenses/by/4.0/).
Share and Cite
Metel, A.S.; Stebulyanin, M.M.; Fedorov, S.V.; Okunkova, A.A. Power Density Distribution for Laser Additive Manufacturing (SLM): Potential, Fundamentals and Advanced Applications. Technologies 2019, 7, 5. https://0-doi-org.brum.beds.ac.uk/10.3390/technologies7010005
Metel AS, Stebulyanin MM, Fedorov SV, Okunkova AA. Power Density Distribution for Laser Additive Manufacturing (SLM): Potential, Fundamentals and Advanced Applications. Technologies. 2019; 7(1):5. https://0-doi-org.brum.beds.ac.uk/10.3390/technologies7010005
Chicago/Turabian StyleMetel, Alexander S., Michael M. Stebulyanin, Sergey V. Fedorov, and Anna A. Okunkova. 2019. "Power Density Distribution for Laser Additive Manufacturing (SLM): Potential, Fundamentals and Advanced Applications" Technologies 7, no. 1: 5. https://0-doi-org.brum.beds.ac.uk/10.3390/technologies7010005