1. Introduction and Background
In recent years, there has been some resurgence in the research interest dedicated to engineering and characterization of magneto-optic iron garnet materials [
1,
2,
3,
4]. Thin-film magnetic garnets are semitransparent magnetic dielectrics possessing record specific Faraday rotations of up to several thousand °/cm, in the near-infrared spectral range, if containing bismuth substitution [
5]. Generically, the chemical composition of garnet materials of this type is described by the formula (Bi
xRe
3-x)Fe
yM
5-yO
12, where Re is rare-earth metal (e.g., Dy, Sm, Lu, Nd, or Ce), and M is transition metal such as Ga or Al [
5]. The exploration of this important subclass of functional materials has a decades-long history, starting from the days of bubble-domain magnetic memory development, and more recently, continued with renewed research activities, in application areas ranging from on-chip nonreciprocal components (waveguide isolators, [
2,
6]), to magnetic recording [
7]. Magnetic garnet materials synthesized by a range of thin-film deposition techniques and crystal-growth methods have also attracted a significant research and development momentum since the 1990s, and throughout the last two decades, in areas ranging from photonic crystals to spintronics [
8,
9,
10,
11,
12,
13,
14,
15].
Various approaches to the design and manufacture of magnetic photonic crystals (MPC) with tunable properties, and potentially suitable for the fabrication of nonreciprocal optical components have been reported [
8,
9,
10,
11,
12,
13,
14,
15,
16,
17,
18]. The one-dimensional MPC are structured (periodic or quasi-periodic) sequences of the magnetic and nonmagnetic material layers deposited on optical substrates, which are defined by the layer order and thickness. Many research groups have focused on optimizing the thickness of one-dimensional (1D) MPC structures to simultaneously achieve 45° of Faraday rotation angle and maximal possible transmission at optical telecommunication wavelengths. The MPC based on quarter-wavelength thin-film stacks, which are sequences of magnetic and nonmagnetic layers with multiple embedded phase shifts (termed defects, or missing layers), have been shown to possess a significant potential for practical implementation of integrated optical isolators. This is due to the necessity of approaching Faraday rotations as large as 45°, which has been shown to be attainable, due to the resonant enhancement of Faraday rotation observed in such structures. Complex 1D MPC designs featuring a “flat-top” spectral response, with almost 100% transmission within a large bandwidth (several nanometers), and close to 45° of Faraday rotation at 1550 nm can contain in excess of 200 layers [
10,
11], limiting their applications to the near-infrared range, where the magnetic garnets possess very low (negligible) optical absorption. Since the original development of the MPC optimization program in 2005 [
18], multiple garnet material development efforts have been undertaken within our group [
19,
20,
21], all of which have relied substantially on material characterization options featured within the same software package. In particular, the option of deriving the data for the spectral dispersion of the absorption coefficient using the measured transmission spectrum and refractive index dispersion data has been very useful to characterize new nanocomposite-type garnet materials synthesized by cosputtering using an extra oxide material source [
19]. The present-day performance limits of 1D MPC in the visible spectral range have been evaluated using the same software [
22] and using the available spectral data on the optical properties of the best-performing magnetic garnet compositions. Optical constants data of multiple recently-synthesized magnetic garnet compositions have been evaluated using the measured transmission spectra in conjunction with MPC Optimization software and Swanepoel envelope method [
23]. Our group’s preferred method for calibrating the quartz microbalance sensor’s tooling factors of various deposition sources also involves fitting the actual film layer thickness using MPC Optimization software in conjunction with measured transmission spectra.
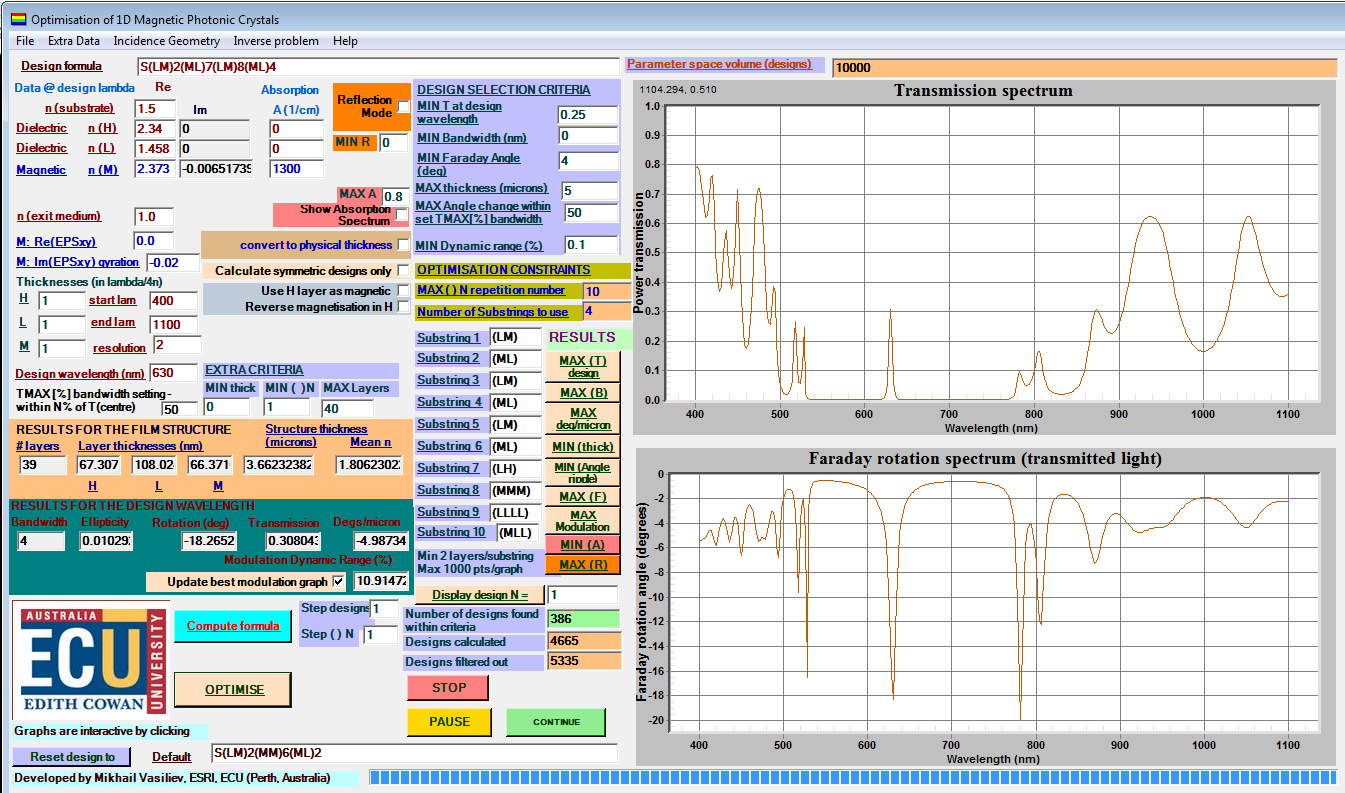
A graphical snapshot of the controls and features implemented within MPC Optimization software is shown in
Figure 1, which also presents a sample optimization result. The computation time to obtain this result is typically around one min (after analyzing almost 5000 MPC designs out of a possible 10,000 defined by the preset film structure features). Some of calculated designs exceed the maximum limits set for thickness or layer number, and thus are not fully evaluated. The default spectral range of calculations is extremely broad, slowing down the optimization algorithm significantly, since the default wavelength settings and resolution have been entered to assist in fitting film layer thickness conveniently, which is one of the most common everyday applications of this software. Running the actual MPC optimization algorithm is best performed by zooming onto the spectral range of interest, which is usually represented by a wavelength region surrounding a narrow peak of transmission or reflection, where it is possible to engineer the enhancement of Faraday rotation.
The default-entered materials-related data used to optimize MPC designs (within the parameter space and constraints also entered as default values not relevant to any particular application) relate to a MPC design which is based on magnetic garnet composition Bi2Dy1Fe4Ga1O12 and SiO2 L-type layers, deposited on a glass substrate. The optical constants and gyration data for wavelengths near 630 nm have been obtained from thick garnet layers of this composition, and the corresponding index dispersion dataset is also preloaded into the menu item “Extra data | Account for refractive index dispersion”.
The contents of the compiled html (.chm) help file accessible from the “Help” menu are sufficient to enable most beginner-level MPC (or thin-film) designers to quickly learn the main features of program and its data representation formats. In the following sections of this article, these main features are described in detail, with examples provided to enable the productive and convenient use of this feature-rich software package. The main aim of this present work has been to provide a set of computational tools and algorithms for use by the developers of MPC and other nanostructured material systems (e.g., thin-films and multilayers containing MO materials). These tools will enable both the characterization of functional material layers and the application-specific design of Faraday rotators. Other contributions of this work include a number of experimentally-validated optical and MO property datasets of several garnet material types possessing giant Faraday rotation and good MO quality, synthesized by our group using RF sputtering followed by high-temperature annealing crystallization processes. Examples of particularly important MPC-based Faraday rotator design types are reviewed, focusing on the ways that strong peaks of Faraday rotation are engineered to spectrally coincide with the peaks of transmission, while paying special attention to the role of limiting factors such as absorption.
2. Overview of Package Operation and Key Examples
Since the structure of 1D MPC is essentially represented by a sequence of magnetic and nonmagnetic material layers on a substrate, most of the core terminology, design structure description conventions, and analysis techniques are derived from the field of multilayer thin-film design. The input datasets necessary to define the layer sequence and the optical properties of each material type and individual layer are entered into the relevant text boxes, starting from the top-left corner of the Windows Form. The design formula field defines the layer sequence, starting necessarily from the capital letter S defining the substrate. The layer sequence must be entered in an alphanumeric string format containing special symbols such as round, square, or curled brackets, corresponding to one of the three main design-string representation types. These types are: (i) quarter-wave stack-based notation, e.g., SLH(ML)2 which is perhaps the most common system of layer structure abbreviation in thin-film design; (ii) physical thickness-based notation, e.g., SM [1000]L[5 0], and (iii) advanced designs notation, e.g., S{1.0}(L/2HL/2)1{1.06}(L/2HL/2)3 further described within the help documentation. The optical properties of the substrate material (which is presumed to be dielectric, semi-infinite, and non-absorbing) are defined using only the real part of refractive index. Up to three different optical materials are allowed, denoted by the letters H, L, and M, however, H-type layers are not restricted to mean “high refractive index”. The layer-naming conventions are derived from thin-film terminology for convenience only. In the preceding thin-film abbreviation example (SLH(ML)2), the symbols mean a substrate (S) with the following sequence of layers deposited, in the following order: L, H, M, L, M, and L.
The M layers can optionally be modeled as magnetic dielectrics, where a gyration value at the design wavelength (the imaginary part of the nondiagonal dielectric tensor component, or Im(εxy)) needs to be entered into its relevant text box. This imaginary component of the off-diagonal dielectric tensor element describes magnetic circular birefringence and manifestes as Faraday rotation of the polarization plane in the transmitted or reflected light waves. The real part of this tensor component is treated as zero, in most applications, unless the experimentally-measured value is known, which is related to characterizing magnetic circular dichroism and polarization state ellipticity effects. For applications requiring good numerical accuracy over broad spectral ranges, the spectral dispersion of both the gyration and the refractive indices of all relevant materials need to be loaded from .txt format data files, using the options within the “Extra Data” menu. Optionally, H-type layers are selected to also represent a magnetic dielectric, with the same off-diagonal dielectric tensor components as in M-type material (but optionally with different refractive index and absorption), in order to model a special physical situation where an MPC has layer-specific magnetization reversal possibilities in some individual magnetic layers within the structure. If M layers are modeled as nonmagnetic (e.g., just implying medium-index dielectric layers), then both the real and imaginary parts of εxy are entered as zero values, however, if a small gyration is still entered by error, it will not measurably distort the transmission or reflection spectral calculations, and therefore, in this case, the results regarding the Faraday rotation spectra should be ignored.
The details of the physical situation being modeled, in terms of incidence geometry, and the ways in which the transmitted (or reflected) light intensity is normalized with respect to the incident wave intensity, are defined using sets of checkboxes within the menu entry “Incidence Geometry”, where the relevant descriptions are given. The incidence geometry settings defined as default are the ones used most often and generic in general, since these enable the convenient and accurate fitting of lab-measured transmission spectra in deposited film-substrate systems, to the corresponding theoretically-modeled spectra, where the effects of each interface (including the back surface of substrate) are correctly accounted for in the model. The only parameter not accounted for is the physical thickness of substrate, which is modeled as non-absorbing. Alternative settings for the incidence geometry are useful for considering more theoretical situations, such as calculations of the optical intensity transmitted into a semi-infinite substrate medium, or in reflection-mode calculations, where it is often necessary to compare reflected-wave intensities, which vary with the direction of incidence.
One of the most important material parameters in all layer types is the optical absorption coefficient at the design wavelength (entered in cm
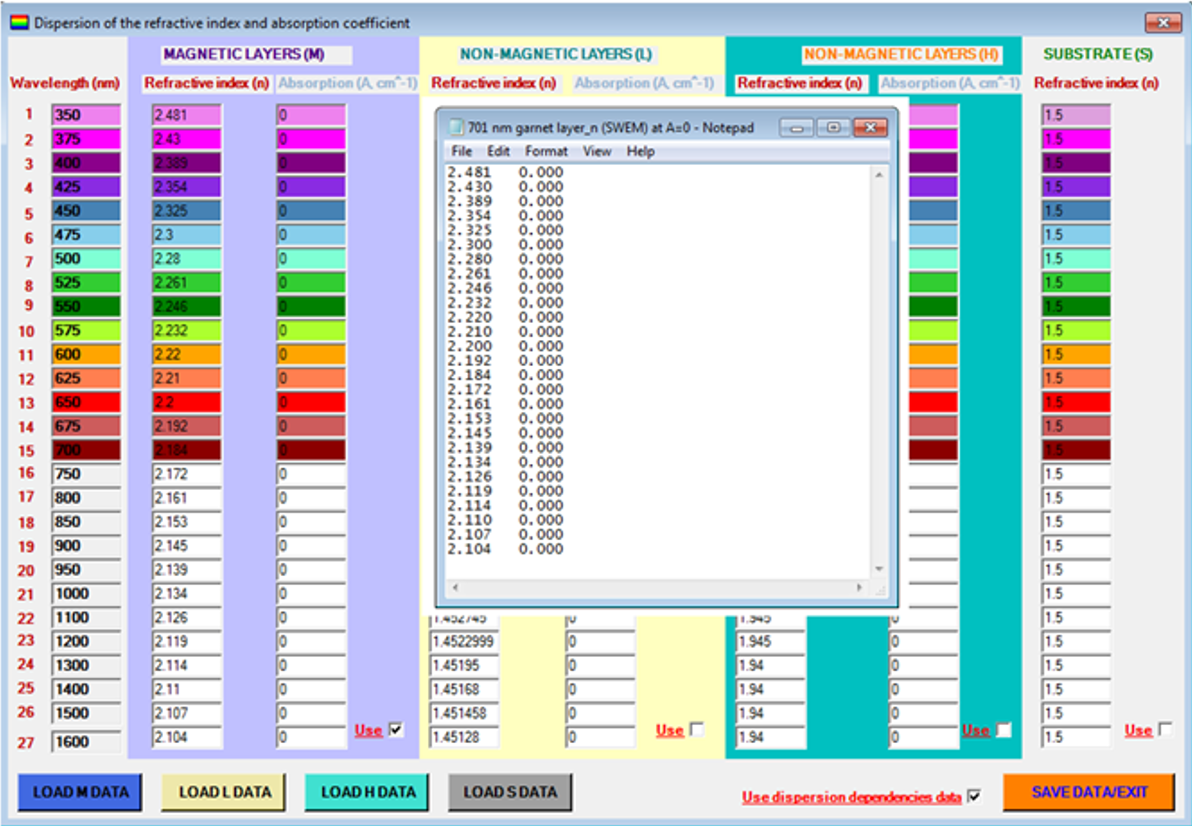
−1 into relevant text boxes; the corresponding extinction coefficients will then be displayed after the film design is characterized by pressing the “compute formula” button), especially for materials possessing significant spectral dependency in their optical absorption. For accurate characterization of thin films or MPC, ideally, every material should have its optical constants dataset available for loading from the “Extra Data” menu option “Account for refractive index dispersion” and loaded into the specialized form (shown in
Figure 2) prior to calculations. The material-specific optical constants data files are prepared using zeros entered in place of an unknown absorption coefficient, for the purposes of physical layer thickness fitting, based on the accurately measured transmission spectrum data (as discussed more in detail in subsequent sections). The end-of-file (EOF) marker in these .txt material data files prepared using editor applications such as Notepad must be placed immediately after the last figure in the last column, by way of making sure to delete any possible symbols or empty row spaces below.
Once the refractive index dispersion information is loaded from data file(s), the data in text boxes that corresponds to the index and absorption at the design wavelength are no longer used in the main spectral calculations, but used only for calculating the quarter-wave stack physical thickness in nm. For all wavelength points between the 27-point data grid, the values of refractive index and absorption are linearly interpolated from the nearest grid-located points. This can erroneously cause small spectral shifts to appear in the spectral locations of the transmission, reflection, or Faraday rotation peaks, seen away from the precise design wavelength, if the interpolated refractive index at that wavelength does not coincide with the value entered into front-panel text box. This is not a significant issue for the experienced designers of MPC, once the origin of these possible small data errors is known or eliminated by entering precise (same as interpolated from the index dataset for the design wavelength) index data into front-panel text boxes. It is a known a priori that the actual spectral response peak locations in quarter-wave stack-type designs will appear precisely at the design wavelengths, due to the nature of optical interference-related phenomena. In situations when the refractive index dispersion data are only available within a limited spectral interval of interest, rather than for all wavelengths in the 350–1600 nm range, it is recommended that the available refractive index data are entered into the newly-generated data file. The refractive index and absorption coefficient values at other wavelengths still need to be entered. The recommended practice is as follows: for example, if the available data starts from 500 nm, enter the same values as are known at 500 nm into the wavelength grid positions for all shorter wavelengths; alternatively, use any available models to predict the unknown values (e.g., Cauchy dispersion model). If the refractive indices or absorption are only available up to 800 nm, it is best to enter (for all larger wavelengths), the same (n, A) data as at the last data point (800 nm). Whilst the optical properties cannot be extrapolated outside a known range by the values measured at the range limits, the designers of thin film and MPC structures are encouraged to make numerical experiments with the package to evaluate the errors expected to result from the possible refractive index data inaccuracies, in each particular design case. The refractive index of the exit medium surrounding the substrate-film system is defined only by its real part (typical value is 1.0 for air), and the same exit medium is presumed to precede the (thickness-undefined) substrate, and to exist beyond the last deposited film layer, regardless of the direction of light incidence. The checkbox “reflection mode” sets up the calculations of the reflection spectra, and also the Faraday rotation spectrum for the reflected light, if checked. Optionally, the “show absorption spectrum” checkbox is checked, after which the “compute formula” button will initiate new calculations, resulting in the display of the calculated absorption spectrum.
The theoretical analysis of the spectral properties of MPC has been implemented using the 4 × 4 complex-valued transfer matrix approach [
16]. The method is reliant on finding a transfer matrix that relates the complex electric and magnetic field amplitudes of the light in front of the MPC and behind it. The transfer matrix for the whole structure is represented by the product of the transfer matrices calculated for each layer of the MPC. The transfer matrices of layers are determined by the thickness of the layers and their dielectric tensor components. Nonmagnetic layers are treated as isotropic media having a diagonal dielectric tensor, whereas, magnetic layers are described by tensors containing the magnetization-dependent off-diagonal dielectric tensor components containing wavelength-dependent gyration information, which are related to specific Faraday rotation spectra. When running the optimization algorithm, a C++ code implemented using Microsoft Visual Studio.NET 2003 generates a look-up table of all possible design structure variations (within the design constraints specified). From this table, an optimum MPC structure is obtained by successive tightening of the desired spectral response specifications, guided by the user inputs. The optimization approach used in our algorithm is based on the “exhaustive computation” of the entire parameter space defined by an arbitrary selected type of a structural formula composed of “design substrings” representing user-selected elementary building blocks of the MPC design.
2.1. Multi-Defect Multilayer MPC Characterization and Optimisation Examples Suitable for Validating Calculations
To illustrate the suitability of software to correctly calculate the spectral responses of complex, multi-defect MPC designs, it is easiest to use the design or optimization examples described in the published literature, e.g., [
11] and [
22]. One of the common goals of optimizing the MPC structures has been to achieve strong spectral peaks in either the transmission or reflection (ideally approaching 100%) that coincident spectrally with peaks of enhanced Faraday rotation, in either the transmission or reflection-mode operation, and ideally approach 45°, if efficient modulation of light intensity is required. It is important to note that Faraday rotation in the reflected wave is different in its physical nature from Kerr rotation [
5] (although there may exist some terminological misinterpretations, even in the published literature). This program calculates only the angles of polarization-plane rotation due to Faraday effect, in either geometry, and does not account for Kerr effect.
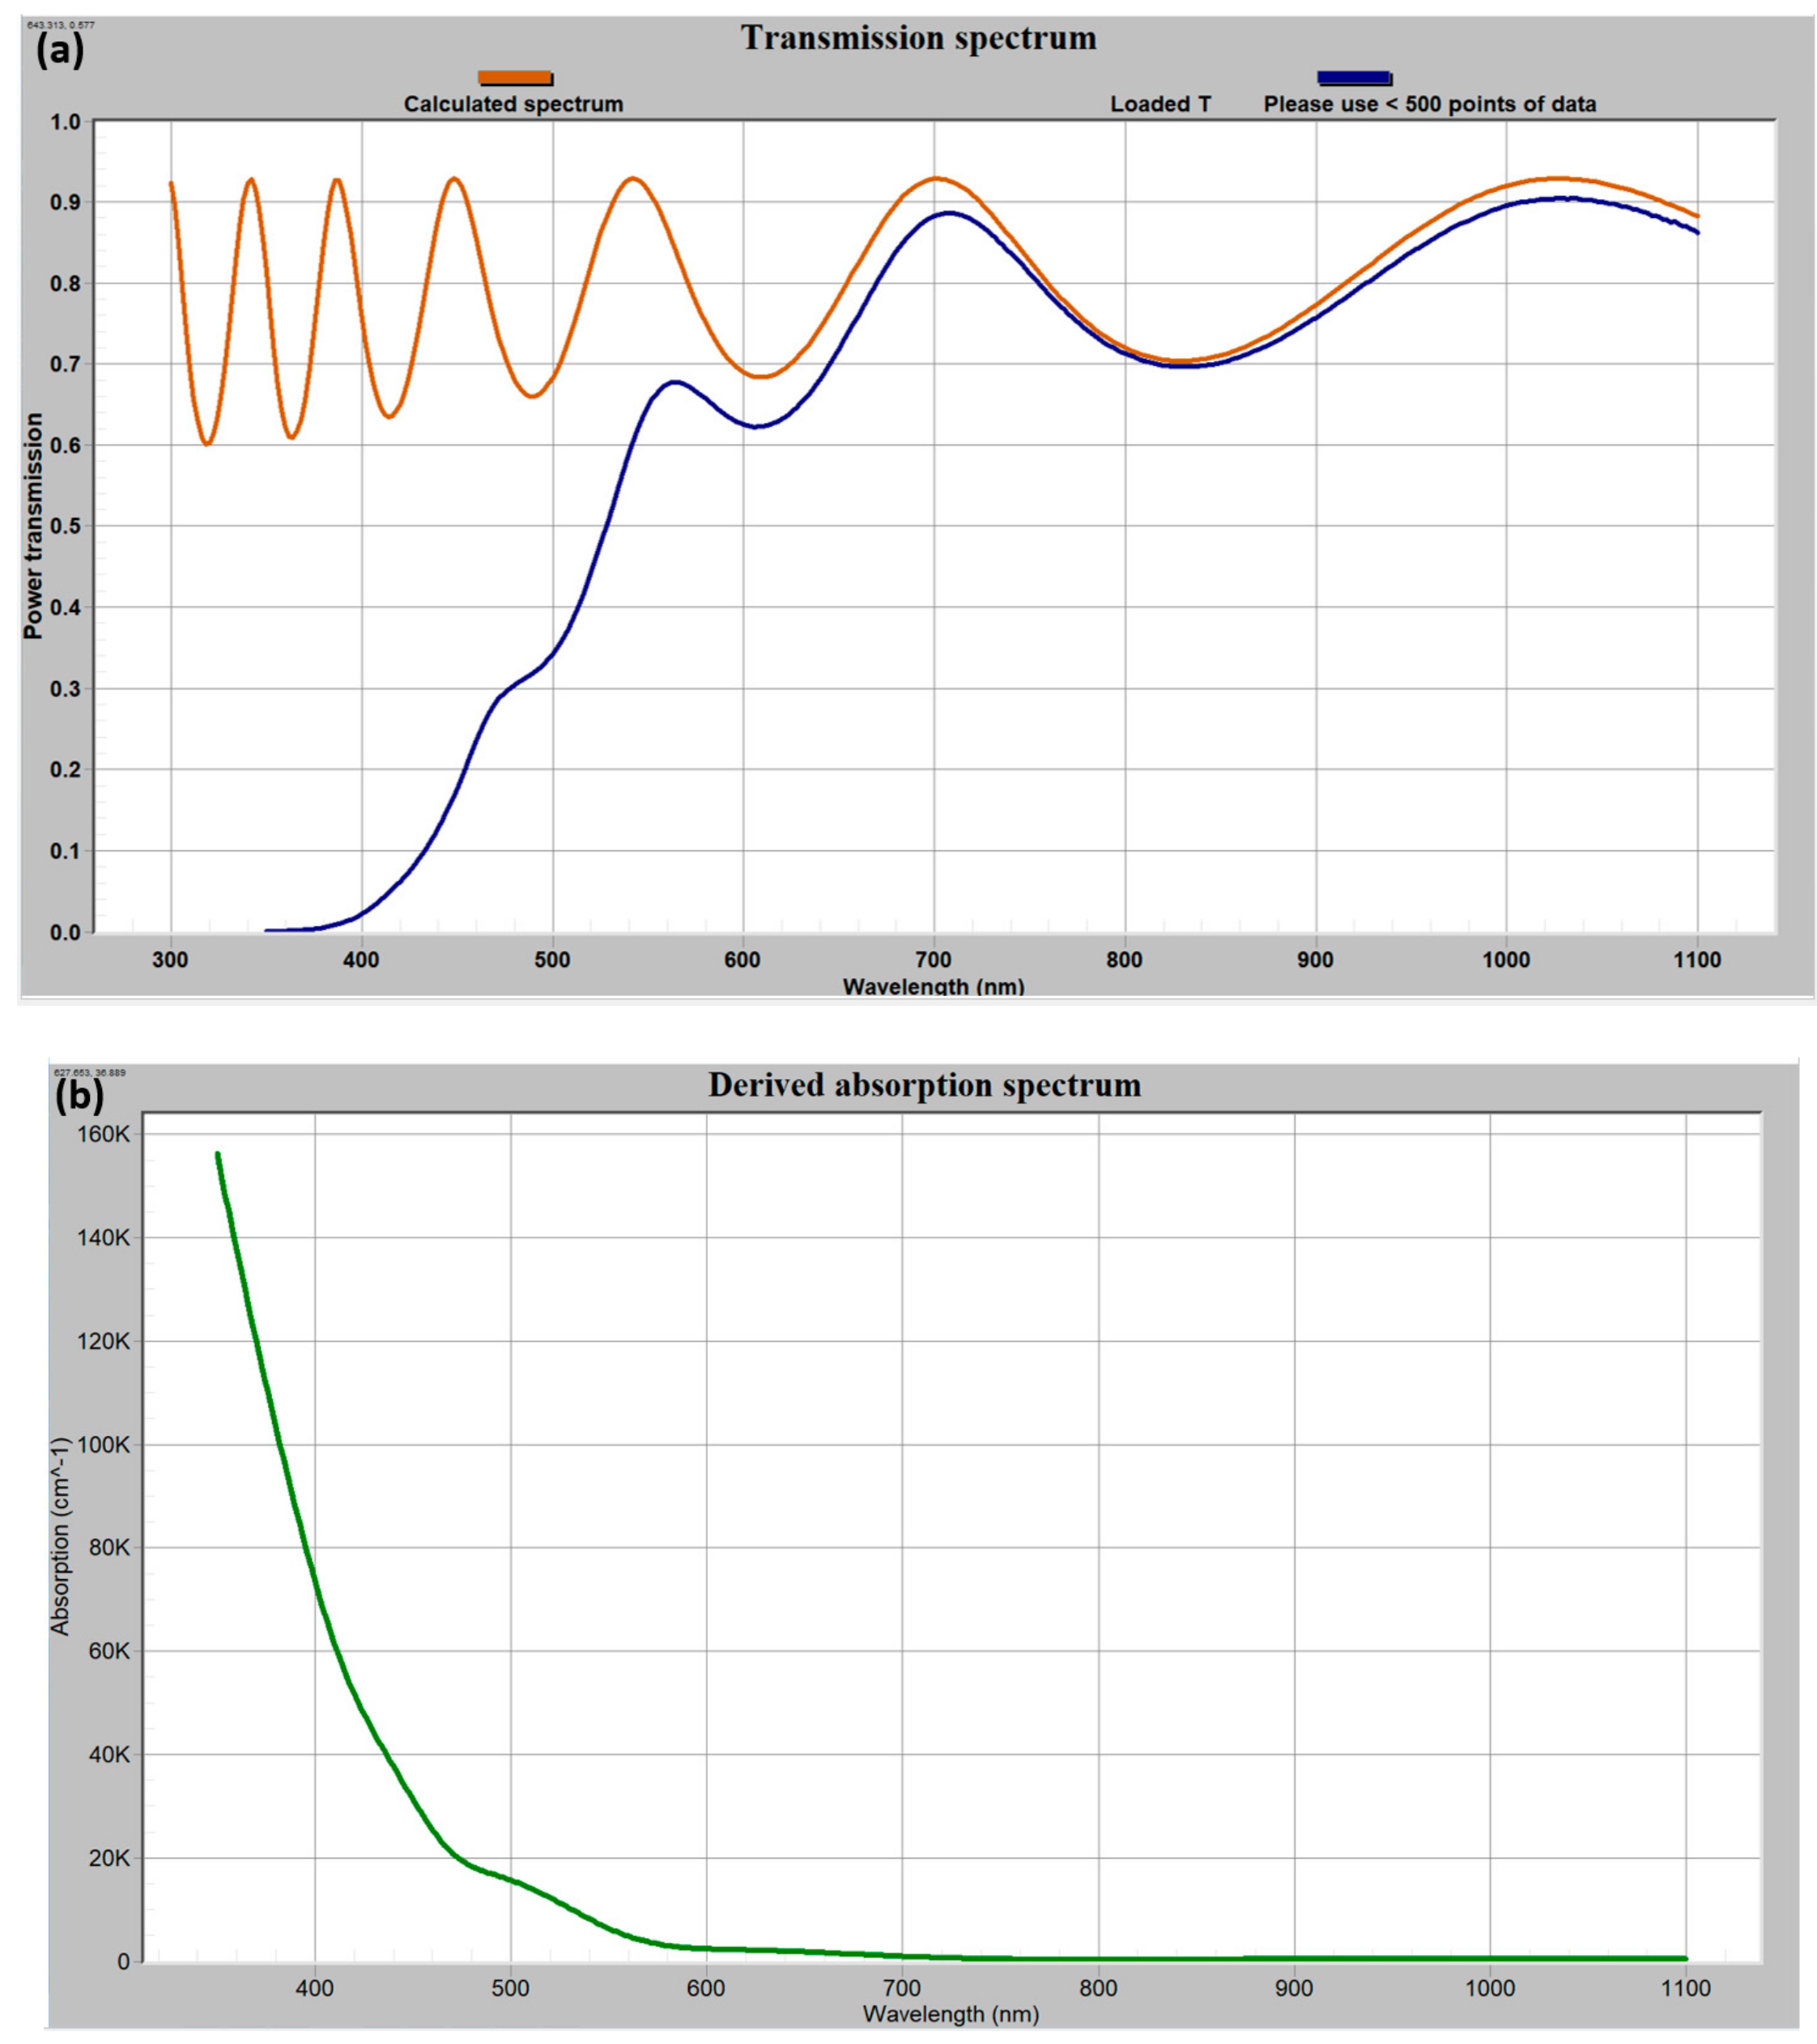
Figure 3 presents a graphical summary of the input parameters necessary to enter in the relevant text boxes to evaluate one remarkable MPC design from the published literature [
11], as well as the results of calculations. The practical implementation of this MPC design is expected to be difficult, due to factors such as the extremely high number of layers, large total thickness, the expected nonzero (but possibly well below about 0.1 cm
−1) optical absorption coefficient in garnets at 1550 nm, as well as the scattering effects expected to occur at multiple layer boundaries. From the theoretical insight perspective, this high-performance MPC design is still an outstanding example of MPC application potential, especially in systems using optimized surrounding media, index-matched to the mean refractive index of structure. A .mpc file (MPC Design from JLT Vol. 19 No. 12 p. 1964.mpc) is included in the subfolder “Optimization results files” of the program installation directory, and can be loaded from the “File” menu, enabling easy recalculation of the contents of
Figure 3, using preloaded design data. The way this MPC has been modeled also involves the customized incidence geometry settings, where film-side incidence is modeled, without normalizing the transmitted intensity after the substrate. Rather, transmission into the substrate material is modeled, which explains why the modeled transmission within 1550 nm peak closely approaches 100%. Running the MPC optimization algorithm, on the other hand, requires using substrate-side incidence geometry settings only.
All materials-related data values were used as per the description in [
11], and the data in the calculated graphs reproduce the results presented in Figure 3b of [
11] with precision. Due to materials-related constraints, such as the spectral dependencies of the absorption coefficient and gyration, achieving strong enhancements in Faraday rotation simultaneously with low optical losses becomes progressively more difficult with the reducing design wavelength. Across the visible spectral range, the optical absorption in bismuth-substituted iron garnet materials becomes the limiting factor, placing stringent limits on the achievable MPC performance characteristics, regardless of their intended application area or the design type. Therefore, the ability to generate and compare multiple and differently-structured optimized MPC designs is crucial for achieving the best possible performance characteristics, limited only by the fundamental, materials-related constraints.
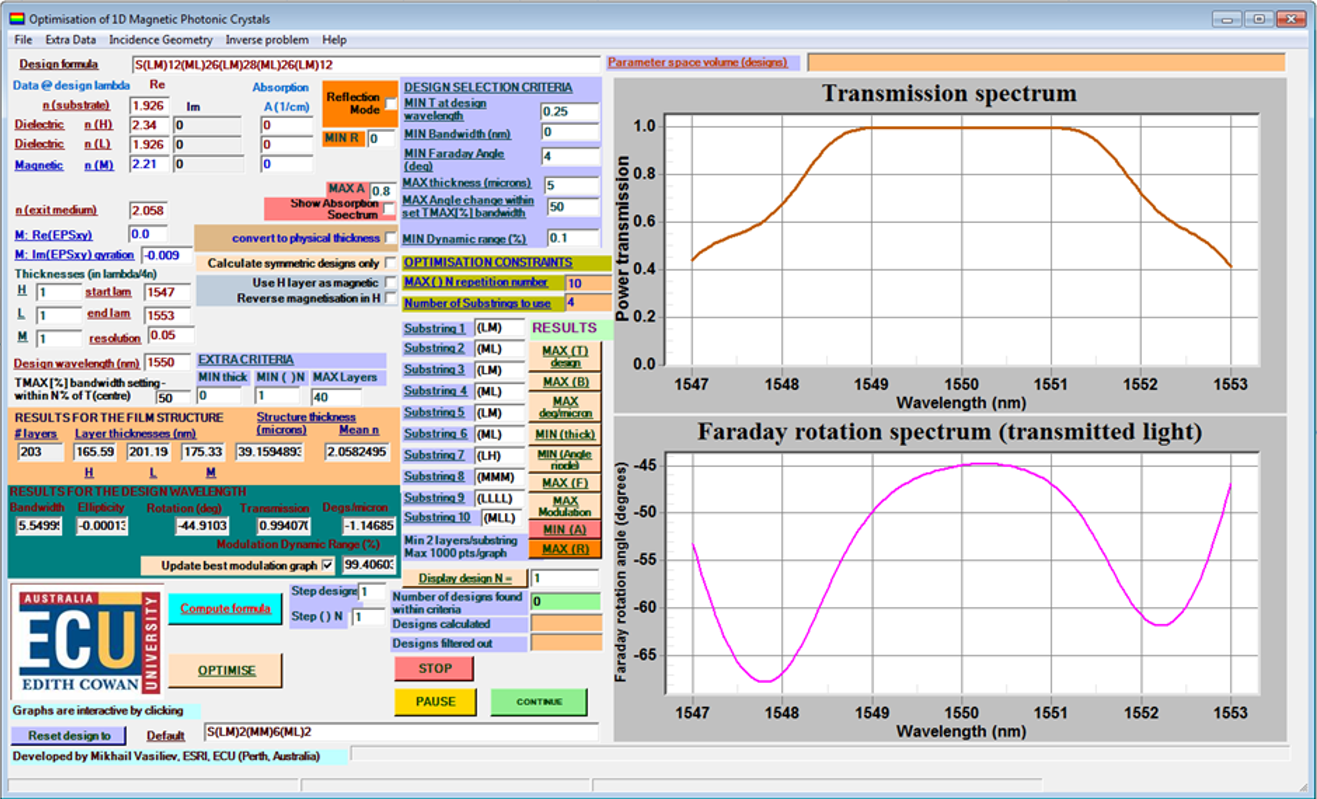
In order to directly reproduce the optimization result reported in [
11], by way of running a constrained optimization algorithm using the MPC Optimization software, the materials-related datasets and a set of optimization constraints, as shown in
Figure 4, must be used prior to clicking the “optimize” button. It is also necessary to set the substrate-side incidence geometry, and uncheck the second checkbox related to the way the transmitted intensity is normalized. The “flat-top” optimized MPC design will be retrieved from the database of calculated MPC designs within the set of defined criteria (60 different designs will be found to fit these overall criteria and constraints, as set per data of
Figure 4), by selecting the design with the maximized spectral response bandwidth. This is done by pressing the “MAX (B)” button. Importantly, all design substrings must be entered as per
Figure 4 to reproduce this optimization result, with precisely five substrings and a maximum of 30 entered for the substring-repetition index. Another constraint which needs to be entered relates to the maximum allowed layer number which is 203. The checkbox “calculate symmetric designs only” needs to be checked, and it is best to set the spectral resolution to 1 nm during optimization, followed by changing it to 0.1 nm for calculating the spectral properties more accurately. The optimized design equivalent to the design of
Figure 3 (and [
11]) is retrieved from 60 possible designs found within the criteria, by pressing the “MAX (B)” button. This retrieves the design with maximized full fidth at half maximum (FWHM) bandwidth, according to the data entered into the TMAX(%) text box.
The settings applied to the normalization of the transmitted intensity within the Incidence Geometry menu corresponded to the physical situation equivalent to that applied during the calculation of the MPC properties in [
11], stipulating the transmitted intensity normalization procedure involving transmission “from within” the substrate material, into the index-matched exit medium.
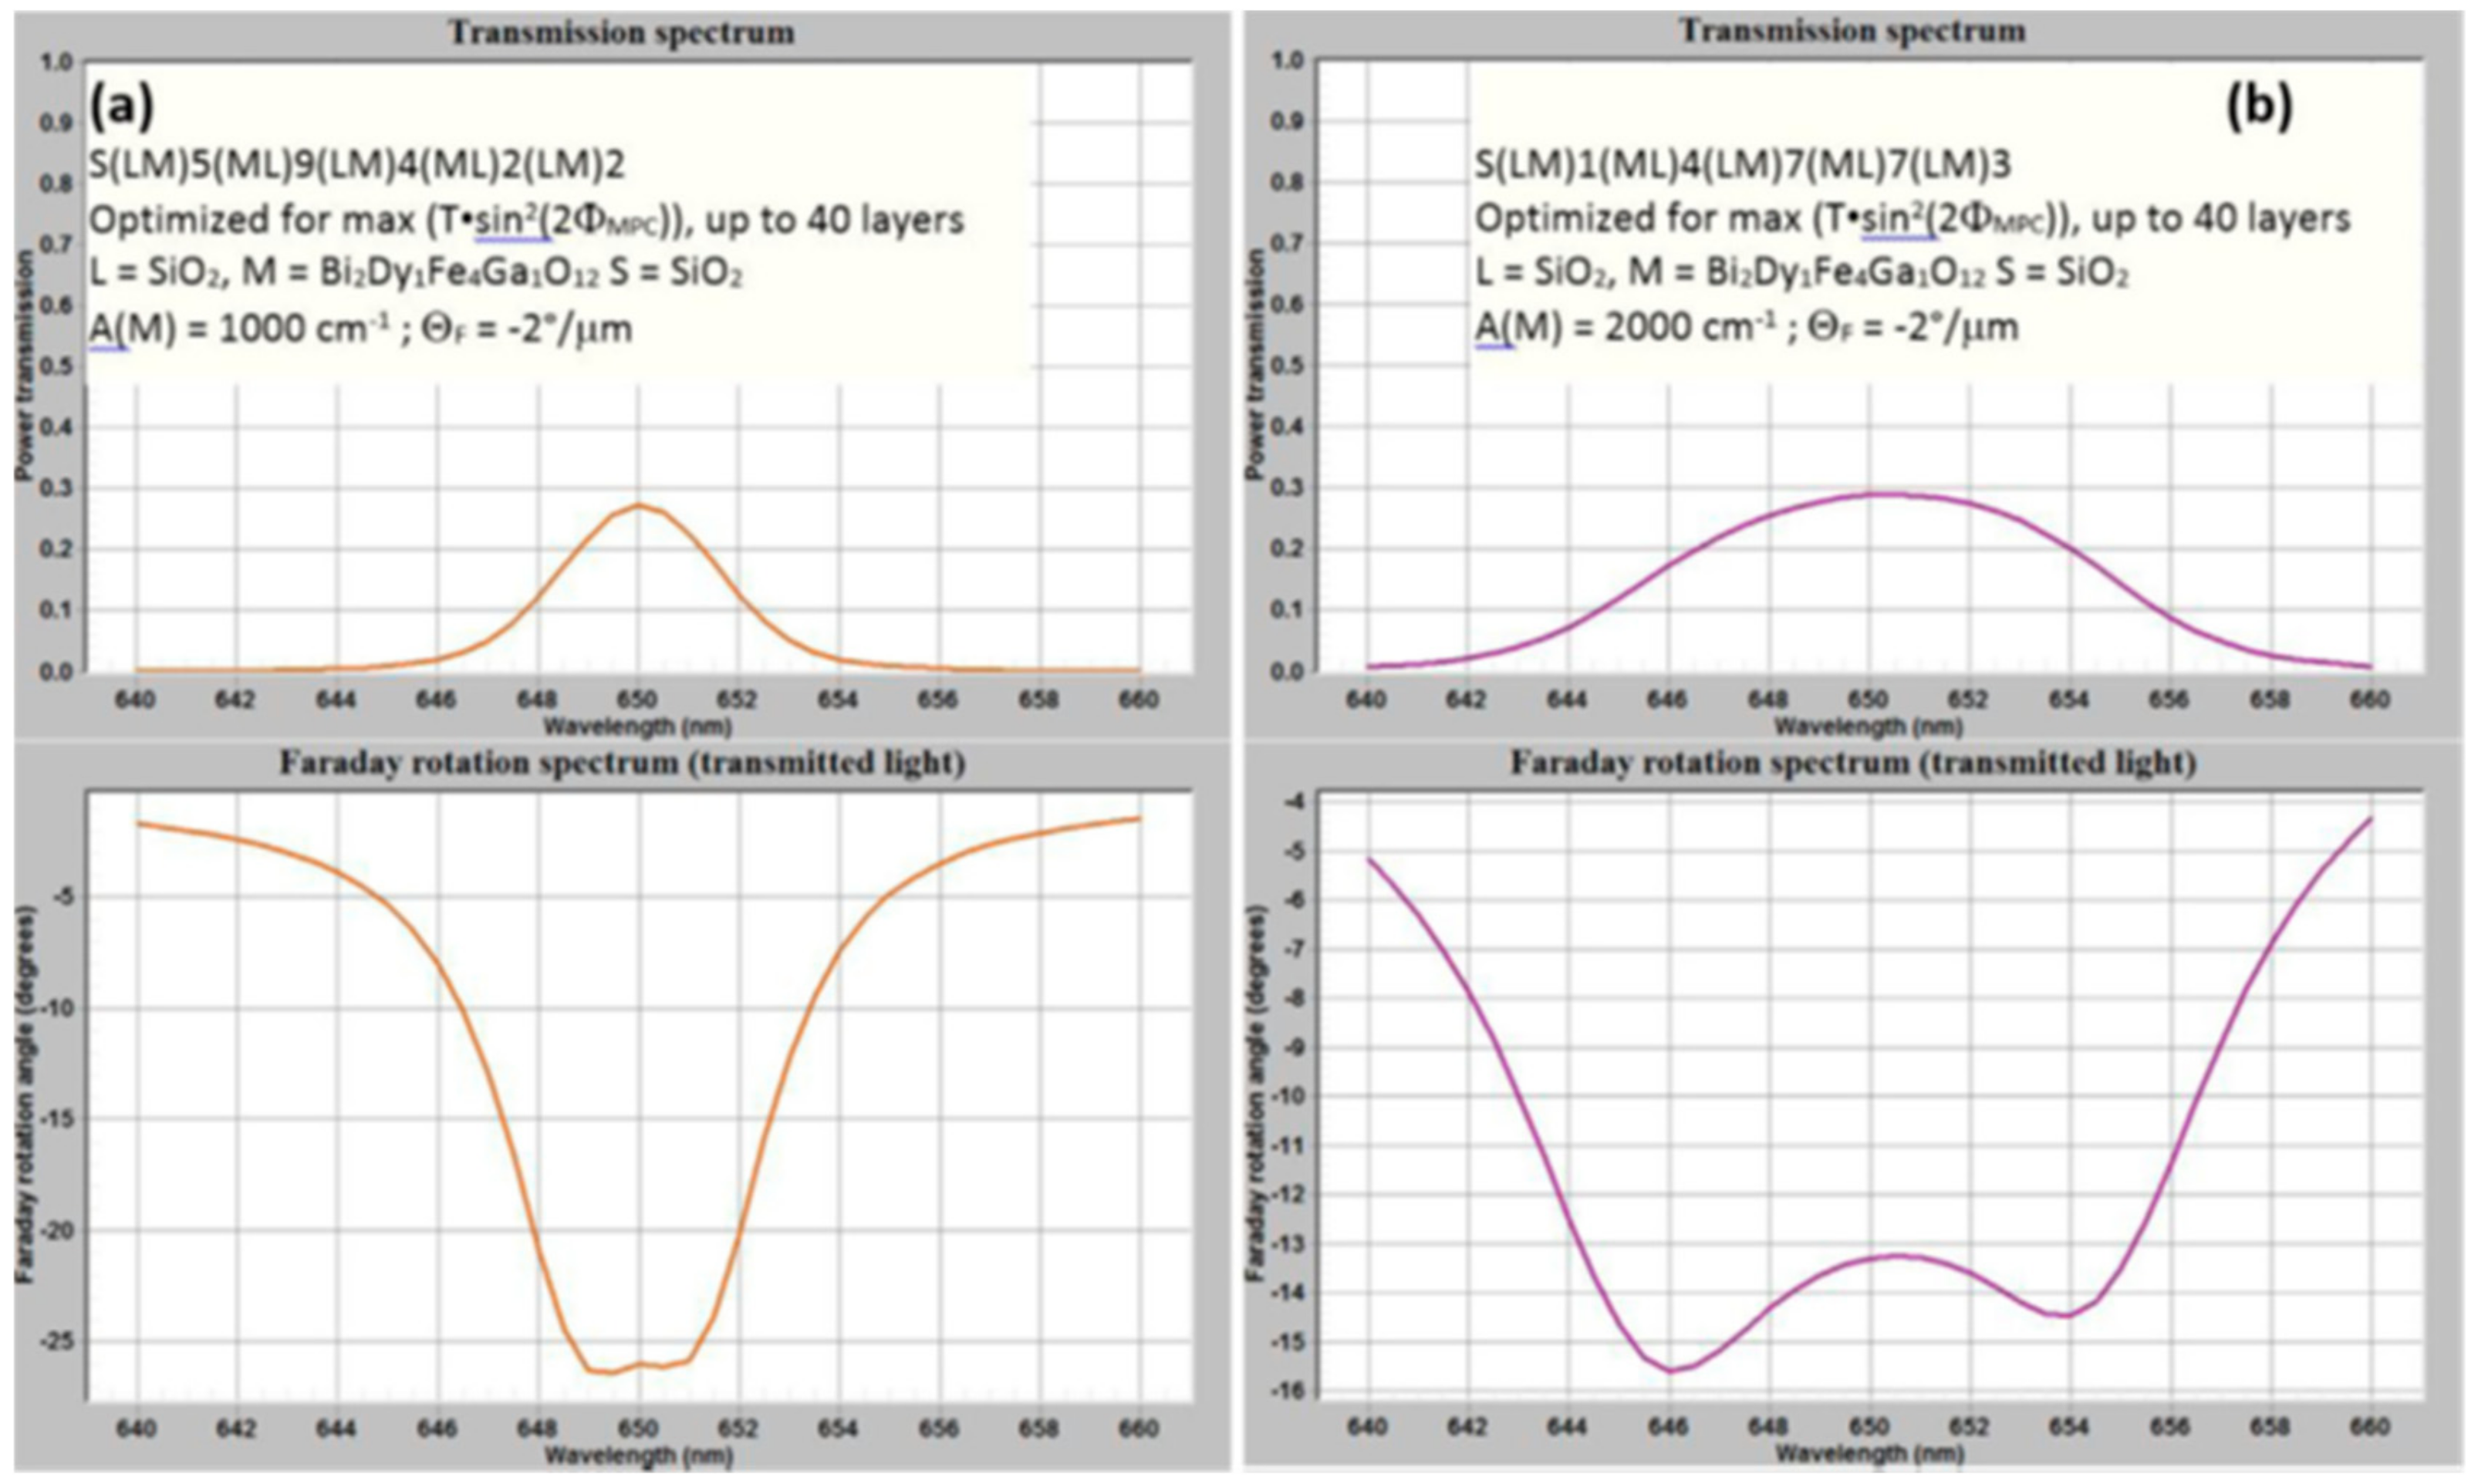
Figure 5 shows a graphic summary of the MPC optimization results first reported in [
22], which illustrate the current performance limits of MPC designs aimed at developing transmission-mode magneto-optic light intensity modulators working at near 650 nm. The optical and MO material parameters relevant to Bi
2Dy
1Fe
4Ga
1O
12 and similar highly bismuth-substituted nanocrystalline garnet materials (synthesized by techniques such as RF sputtering) were used in the calculations.
The data of
Figure 5 can be reproduced by running optimization of four-defect structures with up to 40 layers and thickness up to 5 μm, composed of five sequenced (LM) and (ML) substrings, as shown, using the default entered n(L) value and n(M) = 2.376. The gyration value corresponding to 2°/μm needs to be entered as –0.02 for wavelengths near 650 nm, accounting for the composition-specific sign of Faraday rotation, which is defined by the convention reported in [
5] and other sources. The maximum repetition index value is set to either 10 or, e.g., 12, prior to running the optimization with either absorption coefficient.
The results shown in
Figure 5 illustrate clearly that the optical absorption is the limiting factor in the visible-range MPC design, even at long-wavelength red wavelengths, where the absorption is still moderate, and the thin constituent garnet layers used within MPC would have been almost visually clear. This is demonstrated by entering a design string, such as SM[68.39], into design formula text box, and running the absorption-mode calculation (e.g., using α = 2000 cm
−1) to reveal the graph area by zooming in with mouse, that individual MO layers absorb only about 1.2% of the incident power on each single-pass transmission).
2.2. Generating Optimized Antireflector Film Designs Using Spectral Target Points
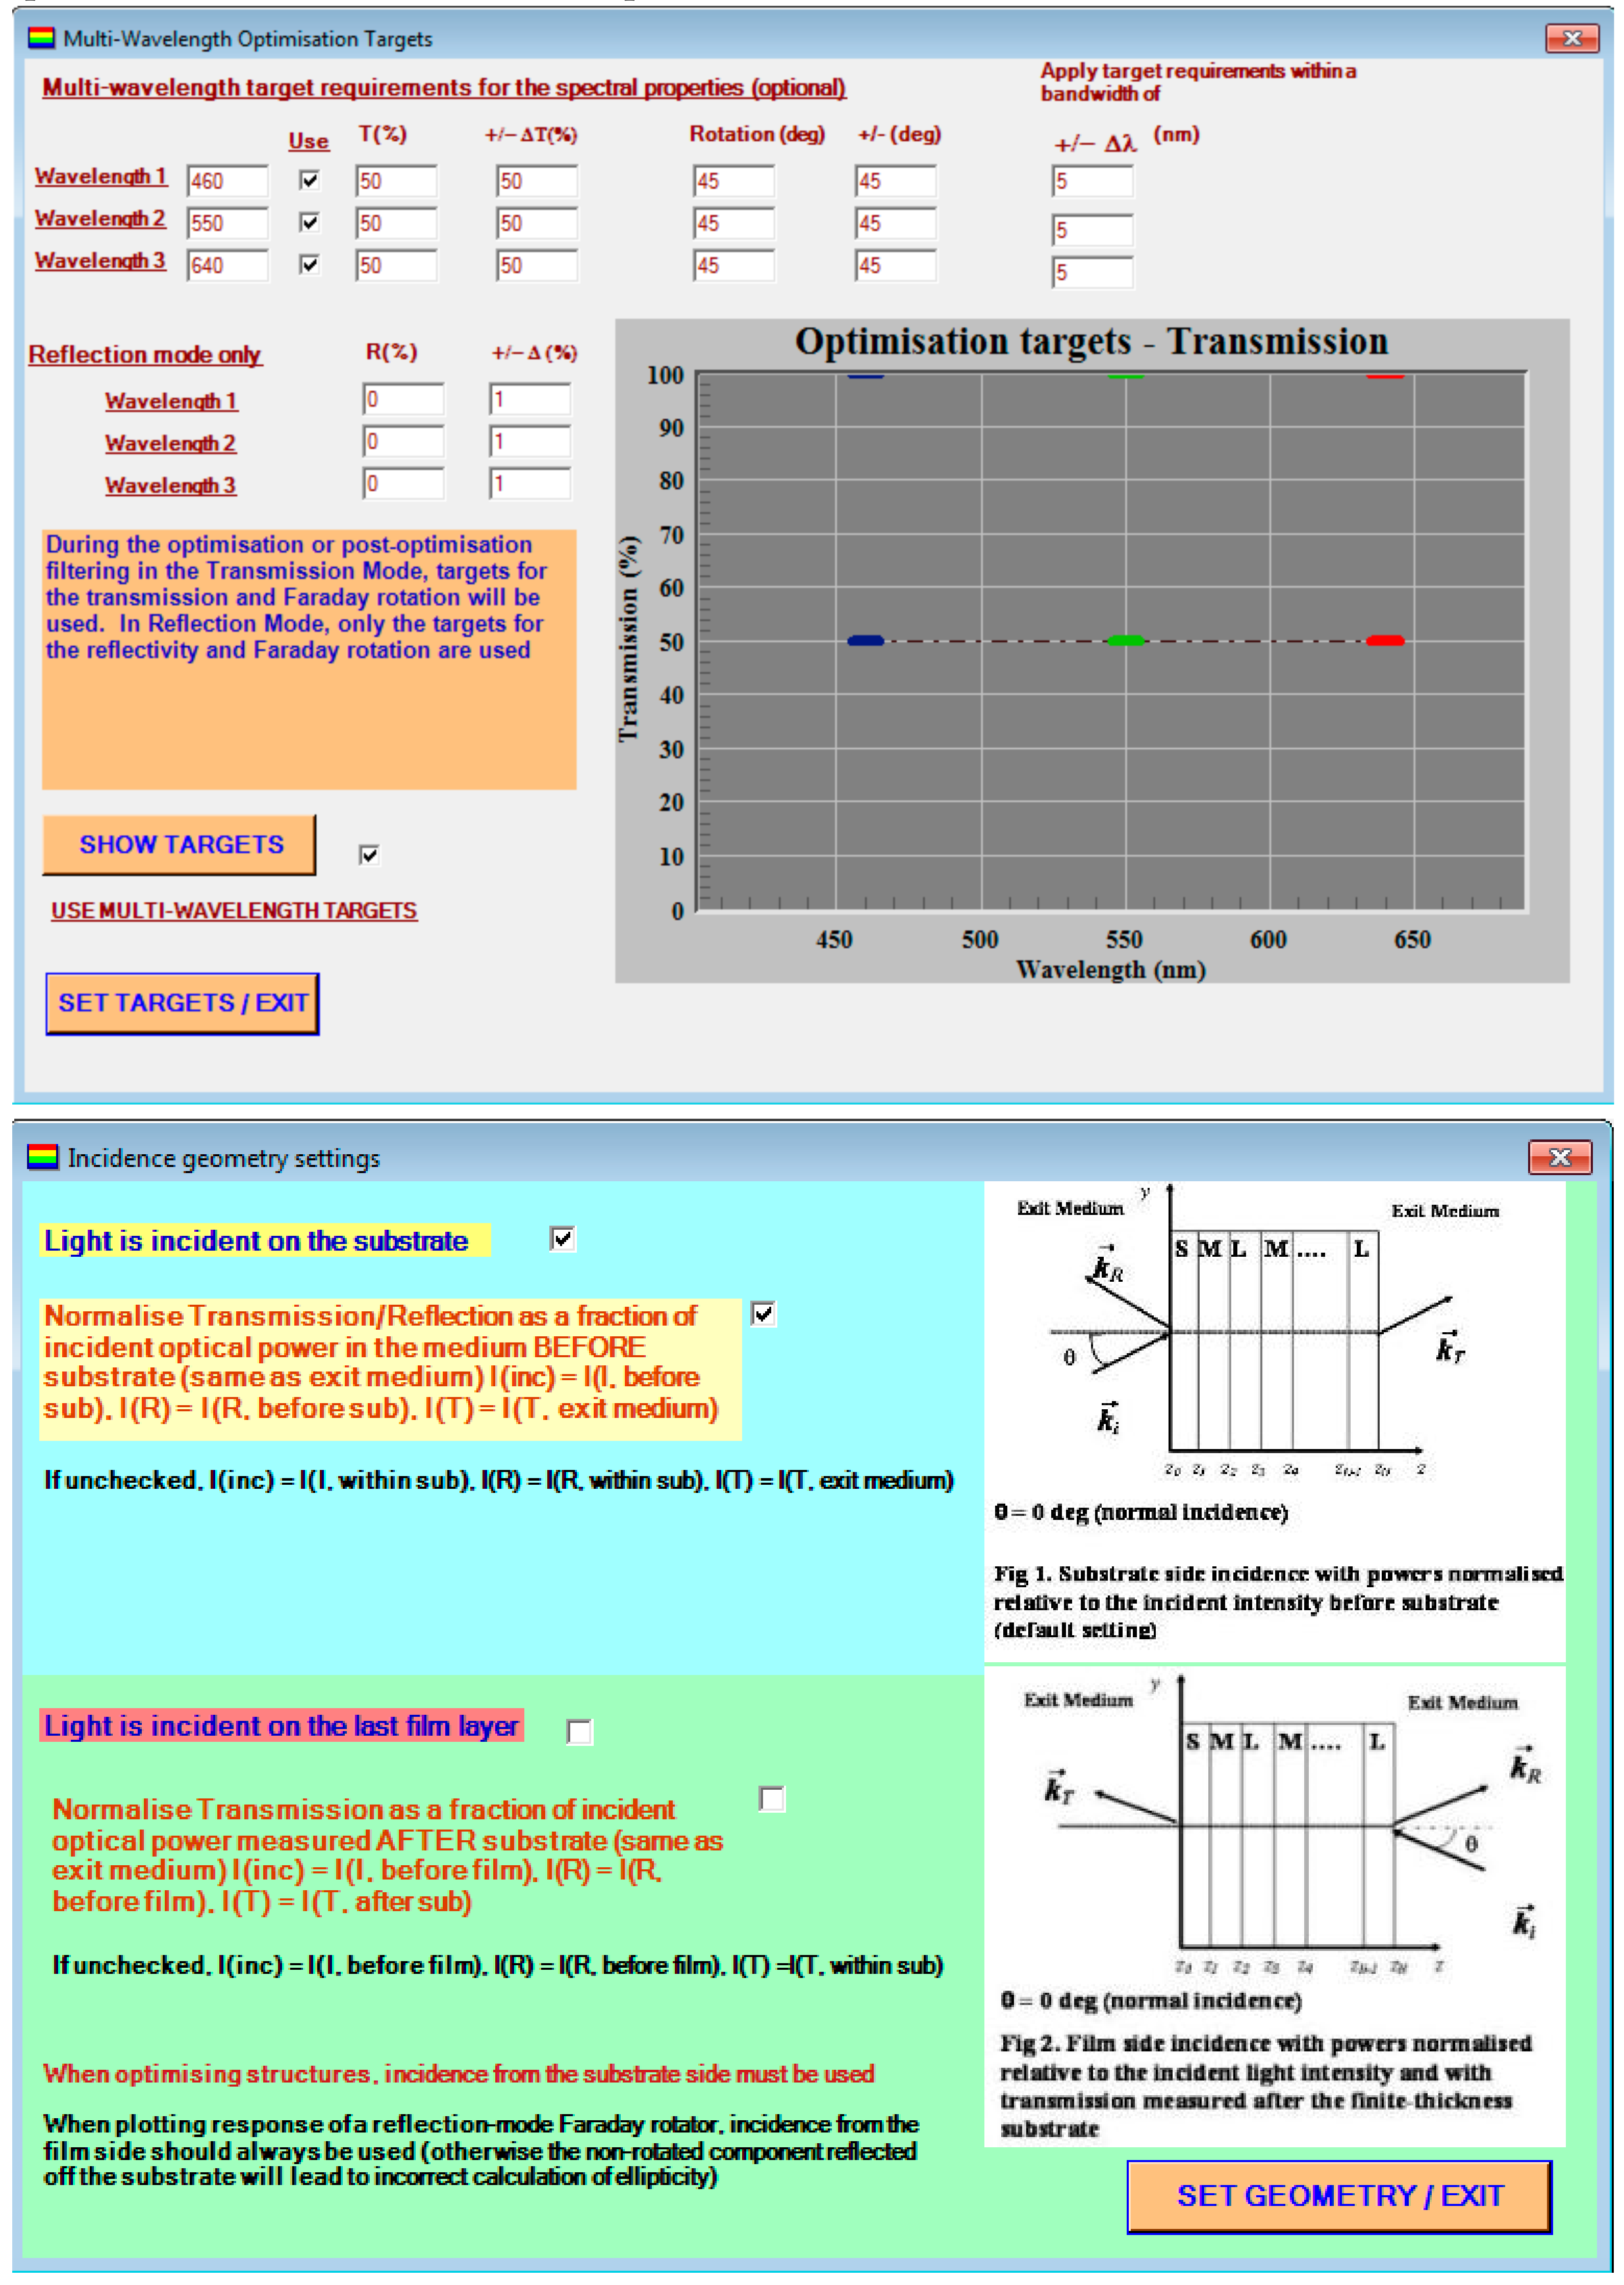
It is possible to apply additional optimization constraints at up to three selected wavelength points, to force the algorithm to output the designs with specific spectral features, in either the transmission or reflection mode. An example of obtaining the optimized five-layer thin-film broadband antireflector coating designs is stored in the file Try_optimise_5-layer antireflector.mpc which is placed into the subdirectory of “Optimization results files” in the installation directory. The menu item “Extra Data | Multi-wavelength spectral targets” is used to enter the additional optimization constraints, regardless of whether the Faraday rotation features are being optimized or not.
Figure 6 shows the required inputs within the two submenus related to the multi-wavelength spectral targets and the incidence geometry options, which will result in reproducing the five-layer antireflector design shown also in
Figure 6. Selecting the design with maximum transmission at the design wavelength (either after running the optimization, or simply after loading the relevant example file) will reveal the reflection spectrum as shown.
This example also demonstrates the use of scaled QWOT layers for use in thin substrings, the thickness of which is then being optimized by the algorithm by adjusting the repetition indices. The calculation of more than 750,000 designs should still take only a few minutes. A number of antireflector-type designs are revealed by using the button “display design N=” with any corresponding number not exceeding the number of designs found within criteria.
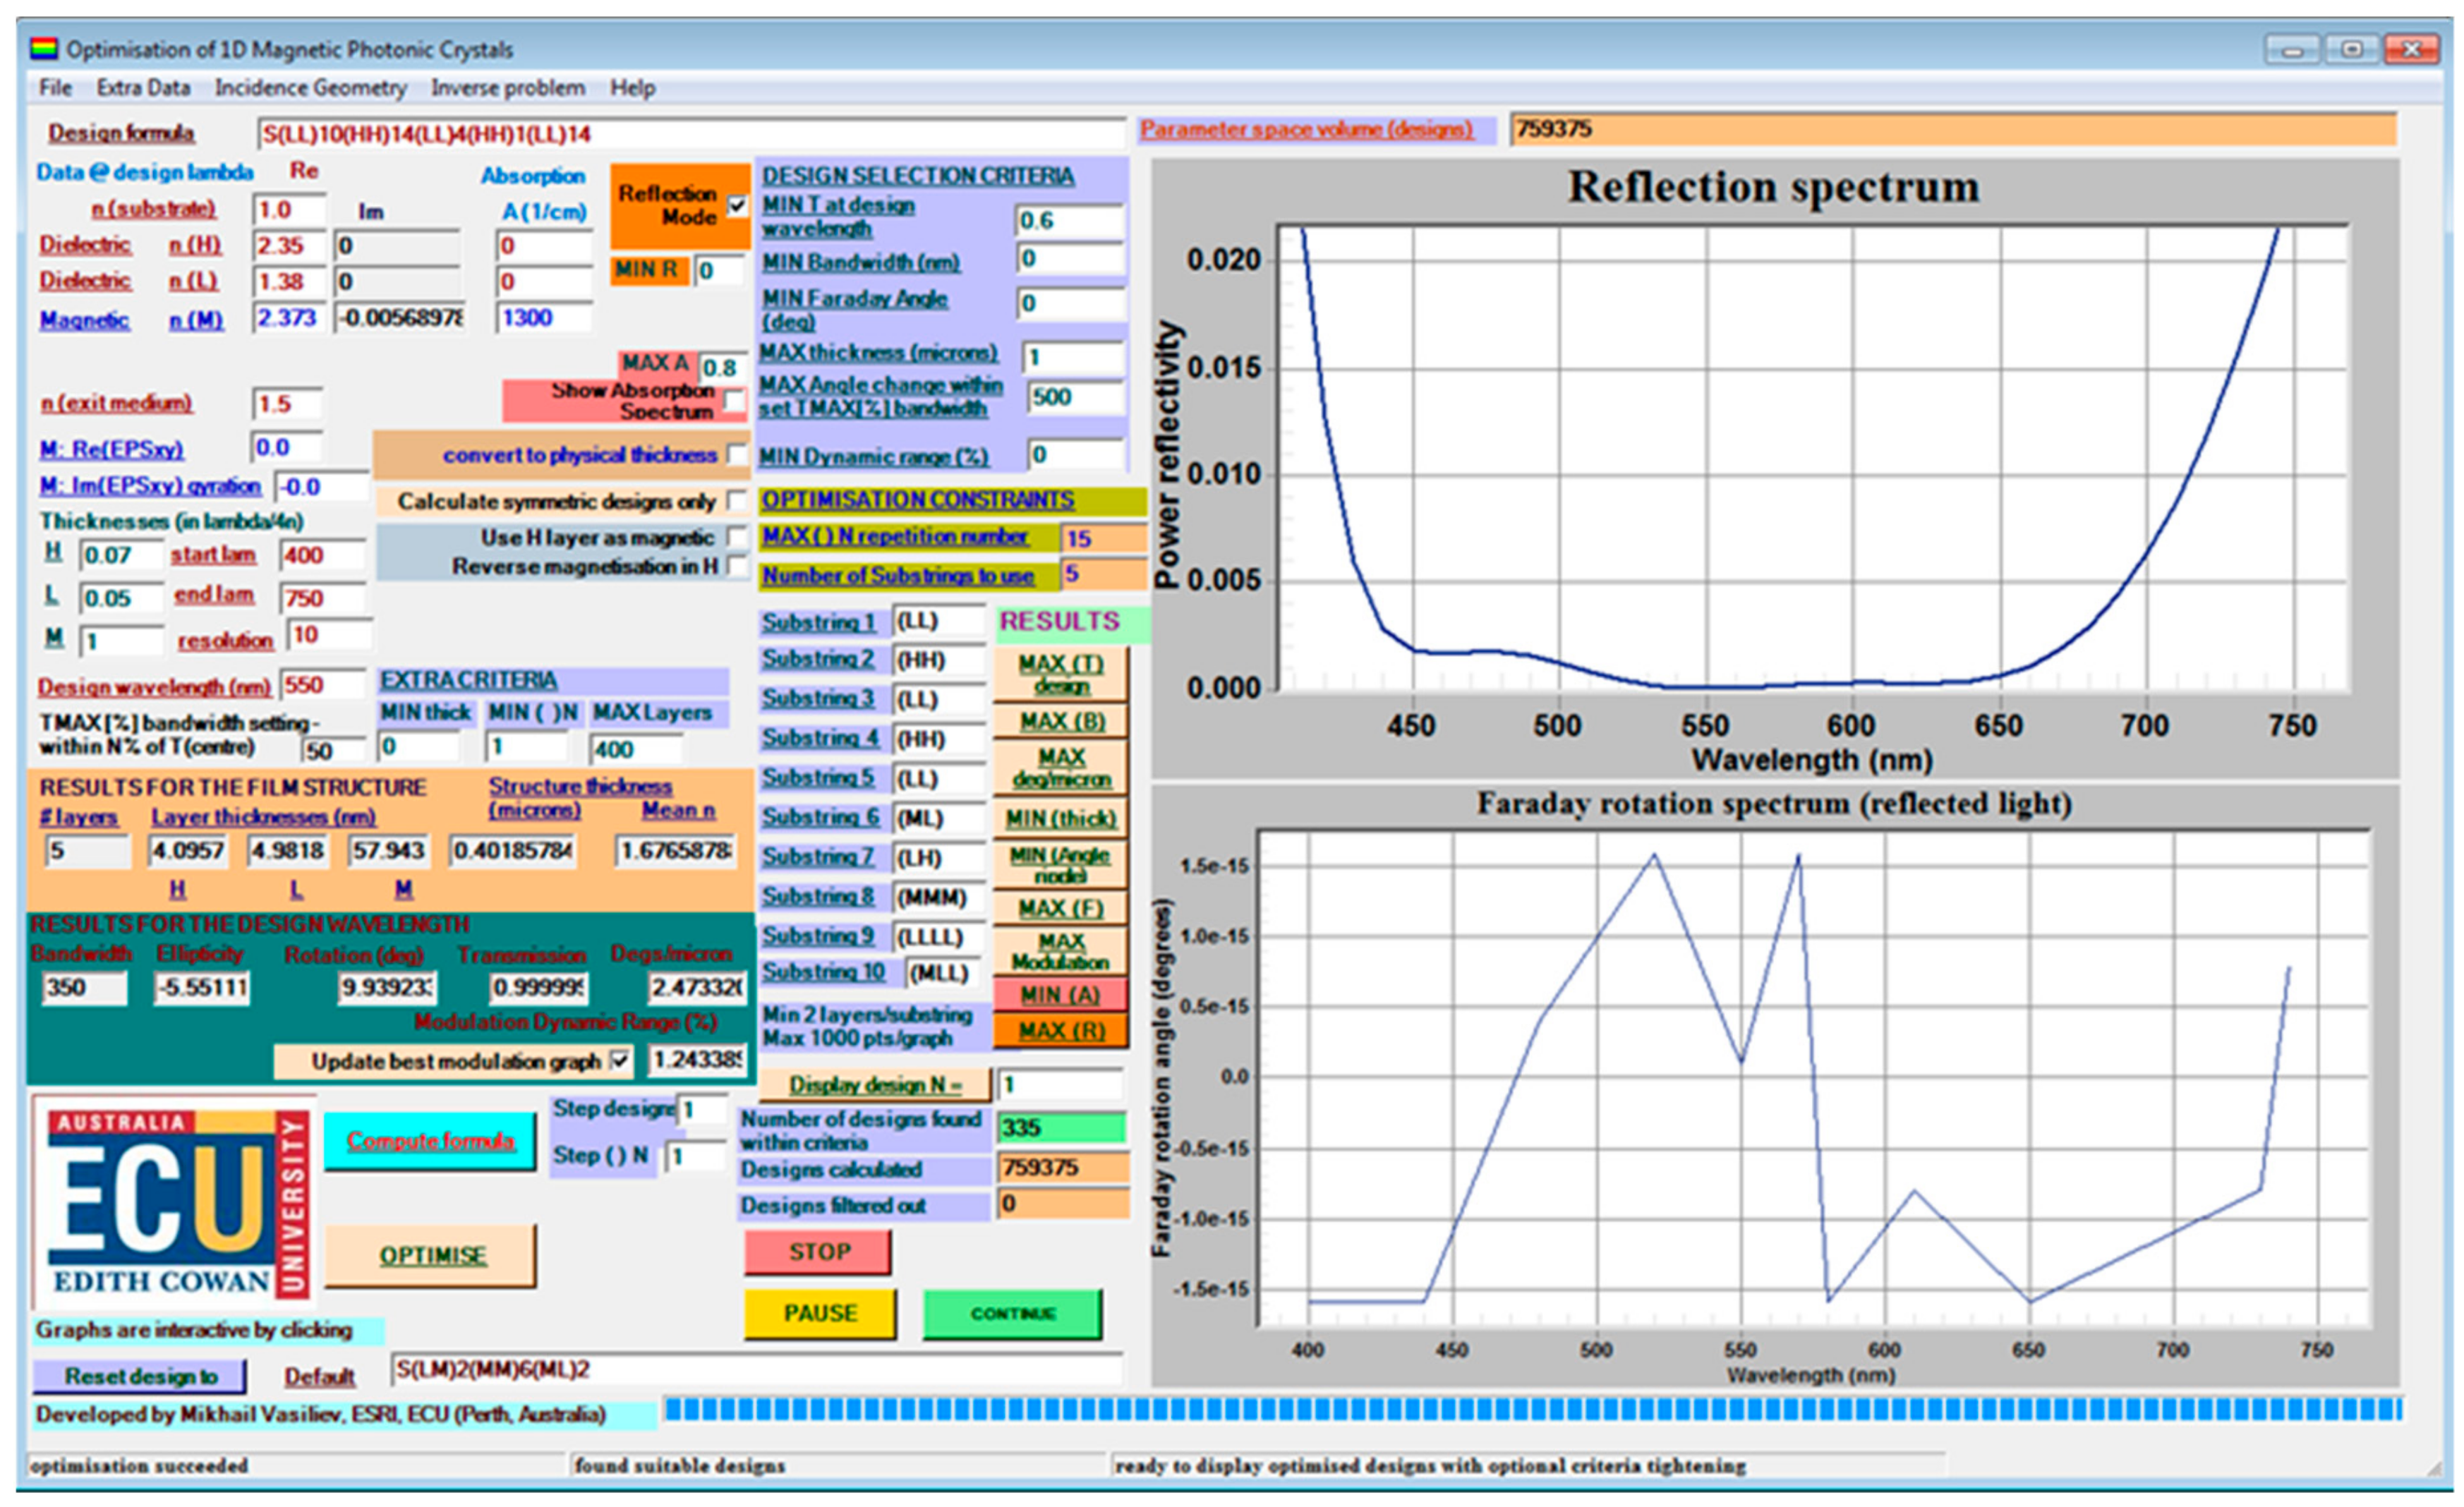
Since the optimization algorithm presumes the substrate-side incidence, it is convenient to define air as the subtrate, and set the exit medium to glass. The obtained design S(LL)10(HH)14(LL)4(HH)1(LL)14 needs to have its deposition sequence reversed and be re-evaluated for the film-side incidence case from air. Using the physical thickness notation is preferable in this case, i.e., the design needs to be changed into S(LL)14(HH)1(LL)4(HH)14(LL)10. In physical thickness notation, for a practical deposition-ready design description, this is equivalent to SL[139.49]H[8.19]L[39.85]H[114.68]L[99.64]. It is important to not forget to set n(S) to 1.5 and n(exit) to 1.0(air) in this case. Now, the incidence geometry settings are checked to correspond to the film-side incidence. Note, the way the reflectivity of the back side of the substrate is accounted for in the detailed incidence geometry settings.
2.3. Fitting of the Measured Thin-Film Transmission Spectra to Theoretical Models
One of the most frequently used applications of MPC Optimization software, apart from optimizing the MPC structures, is expected to be the fitting of actual deposited layer thickness, for thin-film materials with known refractive index dispersion function. The option of loading the measured transmission spectrum for immediate comparison with the modeled transmission spectrum of the same substrate-film system is available from the menu item “Inverse problem | Load T spectrum for fitting”. To enable accurate modeling, both of the two checkboxes that correspond to the substrate-side incidence within the menu “Incidence Geometry | Define geometry” must be checked, which is done by default. A measured reflection spectrum (if available for the normal-incidence reflection, which is rare with most instruments) can also be fitted in the same way as transmission, by running the calculations in reflection mode, with the corresponding checkbox checked. During the calibration of in-situ thickness control systems, e.g., quartz crystal microbalances or reflectometer-type systems, the task of determining the actual physical thickness of deposited thin-film layers is very common, where MPC Optimization software can be used effectively, in conjunction with other methods such as SEM or profilometry characterization.
Figure 6 illustrates graphically the results of fitting the loaded (measured) transmission spectra of two thin films of composition type Bi
0.9Lu
1.85Y
0.25Fe
4.0Ga
1O
12 (the refractive index dispersion data file for this composition is supplied within the appropriate sub-folder in the program installation directory of the target machines). A thinner (684 nm) film modeled as deposited on a glass substrate (n(S) = 1.5) was fitted using the refractive index and absorption coefficient data file related to the as-deposited (amorphous-phase) garnet films of this composition. Since the transmission of an annealed (garnet-phase) film was actually loaded, its transmission at shorter wavelengths was in excess of that modeled. The absorption of garnet-phase films is practically always less in the crystallized state as compared with amorphous garnet-precursor films. A thicker film of fitted thickness (transmission shown in
Figure 7b) was measured in the amorphous phase, and therefore the quality of fit is better. Some systematic transmission discrepancies across a wide spectral range can be attributed to a combination of possible light scattering on the film surface features and film layer refractive-index nonuniformity.
If the spectral dependency of the film material absorption coefficient is completely unknown (or the data are not reliable), but the dispersion of its refractive index is well known (e.g., from variable-angle spectroscopic ellipsometry data), then the index dispersion data files need to be prepared with zero values entered for all absorption coefficients. These data files still enable, in many cases, very reliable fitting of the physical thickness. It is highly recommended, then, to back up these thickness fitting results by also applying the Swanepoel method-based techniques, e.g., methods reported in [
23].
2.4. Fitting of the Absorption Coefficient Spectra in Single-Layer Films of Known Refractive Index Dispersion Function, Transmission Spectrum, and Thickness
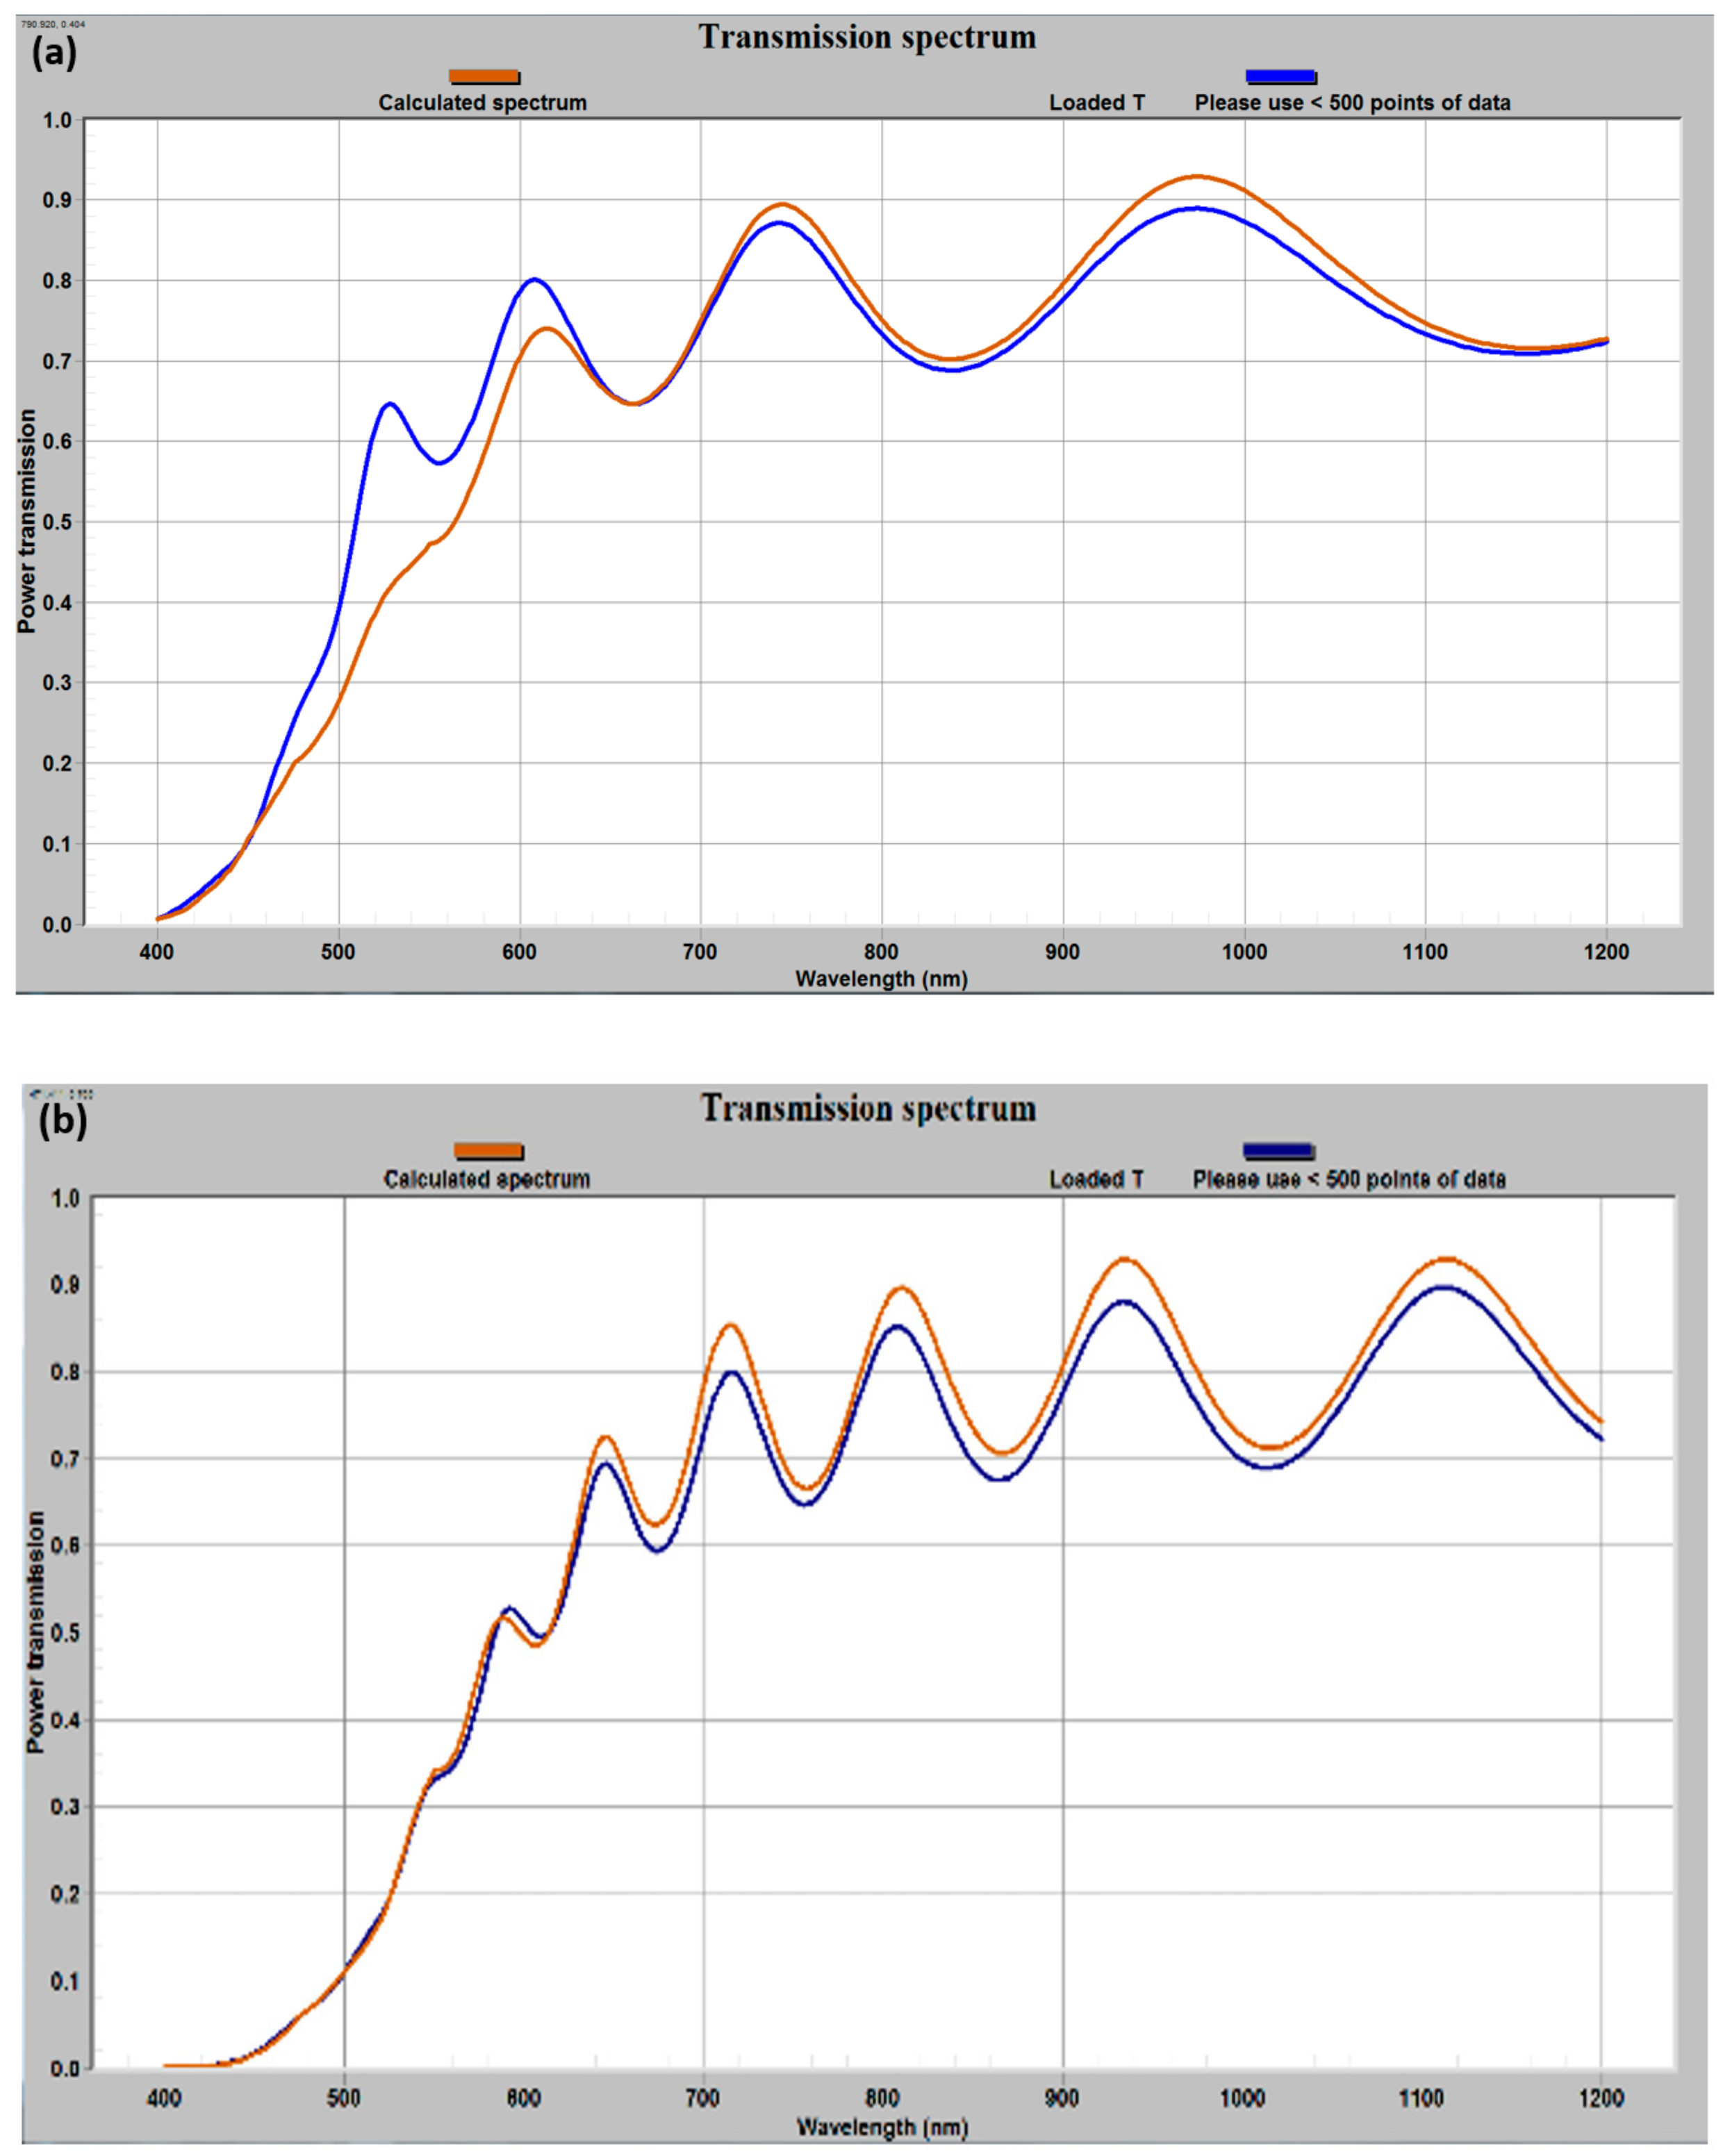
In situations when only the refractive index spectral distribution and the measured transmission spectrum of a semitransparent material layer are available, it is possible to use the custom-prepared “zero absorption” refractive index dispersion data file, and then first fit the physical thickness (typical results are shown in
Figure 8a), followed by a derivation of fitted absorption coefficient spectrum using a dedicated algorithm from the program menu item “Inverse problem | Derive absorption spectrum”. In order to minimize errors, this combination of fitting procedures is only recommended if several deposited films of the same material are available which have a significantly different physical thickness, and the fitting procedures applied to more than one film consistently lead to obtaining well correlated datasets as a result of the absorption fitting. It is also recommended to apply the Swaneopol method-based fitting procedures [
23], to reconfirm the validity and accuracy of the physical thickness data.
Figure 8 illustrates the results of physical thickness and absorption fitting procedures obtained using a transmission file of a 481 nm thick Bi
0.9Lu
1.85Y
0.25Fe
4.0Ga
1O
12 as-deposited film on a glass substrate, and the corresponding material’s “zero-absorption” refractive index data file, both of which are included with program distribution in the corresponding subdirectories of the installation folder. The data file named 701 nm Bi
0.9Lu
1.85Y
0.25Fe
4Ga
1O
12 garnet layer_n (SWEM) at A = 0 .txt must be loaded using the “load M data” button and the subfolder corresponding to this material type (we previously characterized the refractive index of a 701 nm thick film of this material). After the best fitted thickness value (481 nm) is obtained by comparing different models of design string, such as SM[450], …, SM [481], the same design string must be re-entered using a quarter-wave thickness notation, e.g., S(MM)3, where the QWOT multiplier for M thickness is set to 1.125 (for n(M) = 2.21, corresponding to the nearest index data point to the default 630 nm), to match the physical thickness of 481 nm in this notation. The text box “structure thickness (microns)” must be used to check the physical thickness changes in response to changing either the (MM)N repetition index, or the QWOT multiplier for the M layers. The index n(M) = 2.21 should be entered into its corresponding text box, after looking up the 630 nm (default design wavelength) data for the actual refractive index, to avoid possible misrepresentations of the QWOT data. This notation conversion is required for running the absorption coefficient fitting algorithm, as well as using M-type layers only, regardless of whether the material possesses any magnetic properties or not.
Once within the “derive absorption spectrum” submenu, the same measured transmission file should again be reloaded on the graph from file, followed by a relatively self-explanatory procedure for deriving the graph of absorption spectrum. No changes are usually required in any other text boxes. The result of the fitting procedure with the data files (as described above) is shown in
Figure 8b.
In the cases where the fitting algorithm produces exceptions such as described within a dialog text box, e.g., “at some or all wavelengths, even at zero absorption in M layers, the transmission of this structure should be less than specified”, adjustments are made to either check that the incidence geometry settings are correct, or the refractive index of the substrate is increased in the model, removing these fitting procedure errors. In cases when these issues persist in the low-absorption wavelength ranges, the wavelength range of the model is reduced to include only the regions where the fit results can be obtained. Nonuniformities in real thin films can lead to reduced refractive index values, leading then to reductions in the modeled reflection, thus showing increased transmission at some wavelengths as compared with theory models. After the absorption spectrum fitting procedure has been completed, the plotted data points are exported into other formats or saved in the data files using the options provided.
3. Installation and Code-Related Information
The installation of MPC Optimization software is easy, and it is enabled by running the installer (.msi) file supplied within the .zip archived folder used for program redistribution. A necessary prerequisite to program installation is the Microsoft .NET Framework 1.1, which must be installed on any Windows machine prior to running the MPC Optimization installer. The .NET 1.1 Framework installation file (dotnetfx.exe) is supplied within the archived folder file used to redistribute MPC optimization. So far, no known problems have been identified to exist in relation to installing this older version of .NET Framework on modern computer systems. A number of example data files containing the samples of measured garnet thin film transmission spectra and files containing the data on the refractive index and absorption coefficient spectra of various garnets and other optical materials are placed into the selected program installation folder on installation. These data enable the users to recreate the example calculations presented within this article, and therefore are useful in mastering the software operation.
The program has been written as Microsoft Visual Studio .NET 2003 Solution and it is composed of three projects: (i) class library project written using managed C++ code, and built as .dll class library providing matrixrelated computation functions; (ii) main program project, written using visual C# and implemented as Windows forms project; and (iii) deployment project, used for including the necessary reference assemblies, class libraries, license files, organizing the file system structure within the installation directory, and generating the Installer files for program distribution. The installed MPC optimization program runs on any Windows system architecture, whether 32-bit or 64-bit, regardless of the processor type.
Two main third-party software components have been embedded in the program structure and the necessary developer licenses have been purchased commercially. Bluebit Matrix Library 2.2 has been used to provide classes that enable efficient complex-valued 4 × 4 matrix operations functionality. The class library .dll assembly referencing the Bluebit Matrix Library assembly has been required, through the terms of a developer-grade matrix software license, to be compiled as a signed assembly, using a strong-name assembly key file, which is not allowed for redistribution by the developers. The second embedded component was GigaSoft ProEssentials 5 .NET package, which has been installed on the developer’s computer to provide ActiveX controls that enable scientific-type graphing output functions. The assemblies GigaSoft.ProEssentials.dll and Pegrpcl.dll are referenced by the C# project, embedding the scientific graphing controls as Microsoft component object model (COM) objects into the structure of Windows forms project-related software assemblies. The use of licensed third-party software components, with the associated restrictions, is the primary reason why the MPC optimization program code is not intended for open-source distribution. Additionally, newer versions of Bluebit Matrix Library designed to work with present-day versions of .NET Framework, as well as significant code syntax changes applied throughout the projects, would have been required to successfully port the solution into current versions of Visual Studio, e.g., VS2015 or VS2017. The program installation pre-requisites, installation files, and related documentation are available for download from the
Supplementary Material section.
Appendix A provides a concise summary of the program functionality, code-related technical details, and outlines some limitations in relation to using the embedded graphing controls.


