Data-Driven Recognition and Extraction of PDF Document Elements


1
Institute of Information Management in Mechanical Engineering, RWTH Aachen University, 52068 Aachen, Germany
2
Chair of Technologies and Management of Digital Transformation, University of Wuppertal, 42119 Wuppertal, Germany
*
Author to whom correspondence should be addressed.
†
These authors contributed equally to this work.
Technologies 2019, 7(3), 65; https://0-doi-org.brum.beds.ac.uk/10.3390/technologies7030065
Submission received: 18 August 2019
/
Revised: 1 September 2019
/
Accepted: 6 September 2019
/
Published: 11 September 2019
(This article belongs to the Section Information and Communication Technologies)
Abstract
:In the age of digitalization, the collection and analysis of large amounts of data is becoming increasingly important for enterprises to improve their businesses and processes, such as the introduction of new services or the realization of resource-efficient production. Enterprises concentrate strongly on the integration, analysis and processing of their data. Unfortunately, the majority of data analysis focuses on structured and semi-structured data, although unstructured data such as text documents or images account for the largest share of all available enterprise data. One reason for this is that most of this data is not machine-readable and requires dedicated analysis methods, such as natural language processing for analyzing textual documents or object recognition for recognizing objects in images. Especially in the latter case, the analysis methods depend strongly on the application. However, there are also data formats, such as PDF documents, which are not machine-readable and consist of many different document elements such as tables, figures or text sections. Although the analysis of PDF documents is a major challenge, they are used in all enterprises and contain various information that may contribute to analysis use cases. In order to enable their efficient retrievability and analysis, it is necessary to identify the different types of document elements so that we are able to process them with tailor-made approaches. In this paper, we propose a system that forms the basis for structuring unstructured PDF documents, so that the identified document elements can subsequently be retrieved and analyzed with tailor-made approaches. Due to the high diversity of possible document elements and analysis methods, this paper focuses on the automatic identification and extraction of data visualizations, algorithms, other diagram-like objects and tables from a mixed document body. For that, we present two different approaches. The first approach uses methods from the area of deep learning and rule-based image processing whereas the second approach is purely based on deep learning. To train our neural networks, we manually annotated a large corpus of PDF documents with our own annotation tool, of which both are being published together with this paper. The results of our extraction pipeline show that we are able to automatically extract graphical items with a precision of 0.73 and a recall of 0.8. For tables, we reach a precision of 0.78 and a recall of 0.94.
1. Introduction
The industrial benefits and associated value of digital data have changed in recent years. As a result, enterprises began to collect and store large amounts of data. However, it is not enough just to store the data. It is particularly important to generate added value from this data so that enterprises are able to convert it into capital. Thus, the sustainable, comprehensive collection and storage of digital data and its targeted further processing and provision is becoming a new enterprise goal. The objectives pursued vary according to company and industry. For instance, production enterprises pursue goals such as the realization of new services, predictive maintenance and quality, or the realization of resource-saving production.
Unfortunately, most of the methods that are applied in order to pursue these goals solely focus on the integration and analysis of structured and semi-structured data sources. The reason for this is that it is quite easy to analyze these data sources as their data follow a structure. However, according to [1], about 80% of the data available globally is unstructured data, i.e., text documents, images, videos, audio files or other binary encoded data, such as PDF documents. Especially in companies, these PDF documents play an important role because they are used as an exchange format for textual and tabular data. For instance, PDF documents are used to send orders to suppliers and invoices to customers or to exchange reports between employees. For these examples, the data should additionally be stored in databases, i.e., the enterprises have access to the data in a structured way. However, enterprises also own data for which no structured source data are available. Reasons for this might be that they received the PDF documents from other stakeholders, such as suppliers, that the original source data was deleted in order to save storage capacity or that the documents are just scans from original documents. Since these data are also very interesting for analysis, it becomes more and more important to also prepare these data for analysis.
One metric that is especially important in this context is the time to analytics [2]. The term time to analytics refers to the total time that elapses between the collection of the data and the time of analysis by the data analyst. In the context of enterprises, this concerns the time for collecting the data, storing them in a suitable data management system as well as preparing them in such a way that a data scientist can make use out of it. In the context of PDF documents, this especially includes the time for discovering the files contributing to the analysis as well as the extraction of the different types of document elements that might be of interest for the analysis, such as tables or diagrams.
Hence, as soon as data scientists want to analyze a certain use case, they first have to find the data contributing to their planned analysis. For that, they first have to find all the required data. This includes all kinds of structured, semi-structured and unstructured data, such as PDF documents. After the data scientists have found these documents; they first have to manually extract all tables, figures and text paragraphs before they are able to start analysing it. After performing this extraction, the data scientist has to conduct the tailor-made analysis for the different types of document elements, such as performing natural language processing for the different text paragraphs or applying object detection algorithms on the different figures. Again, depending on the figure, different kinds of algorithms might contribute to the analysis. For instance, data visualizations are analyzed differently than photos and various other kinds of diagrams might be analyzed in a different way again.
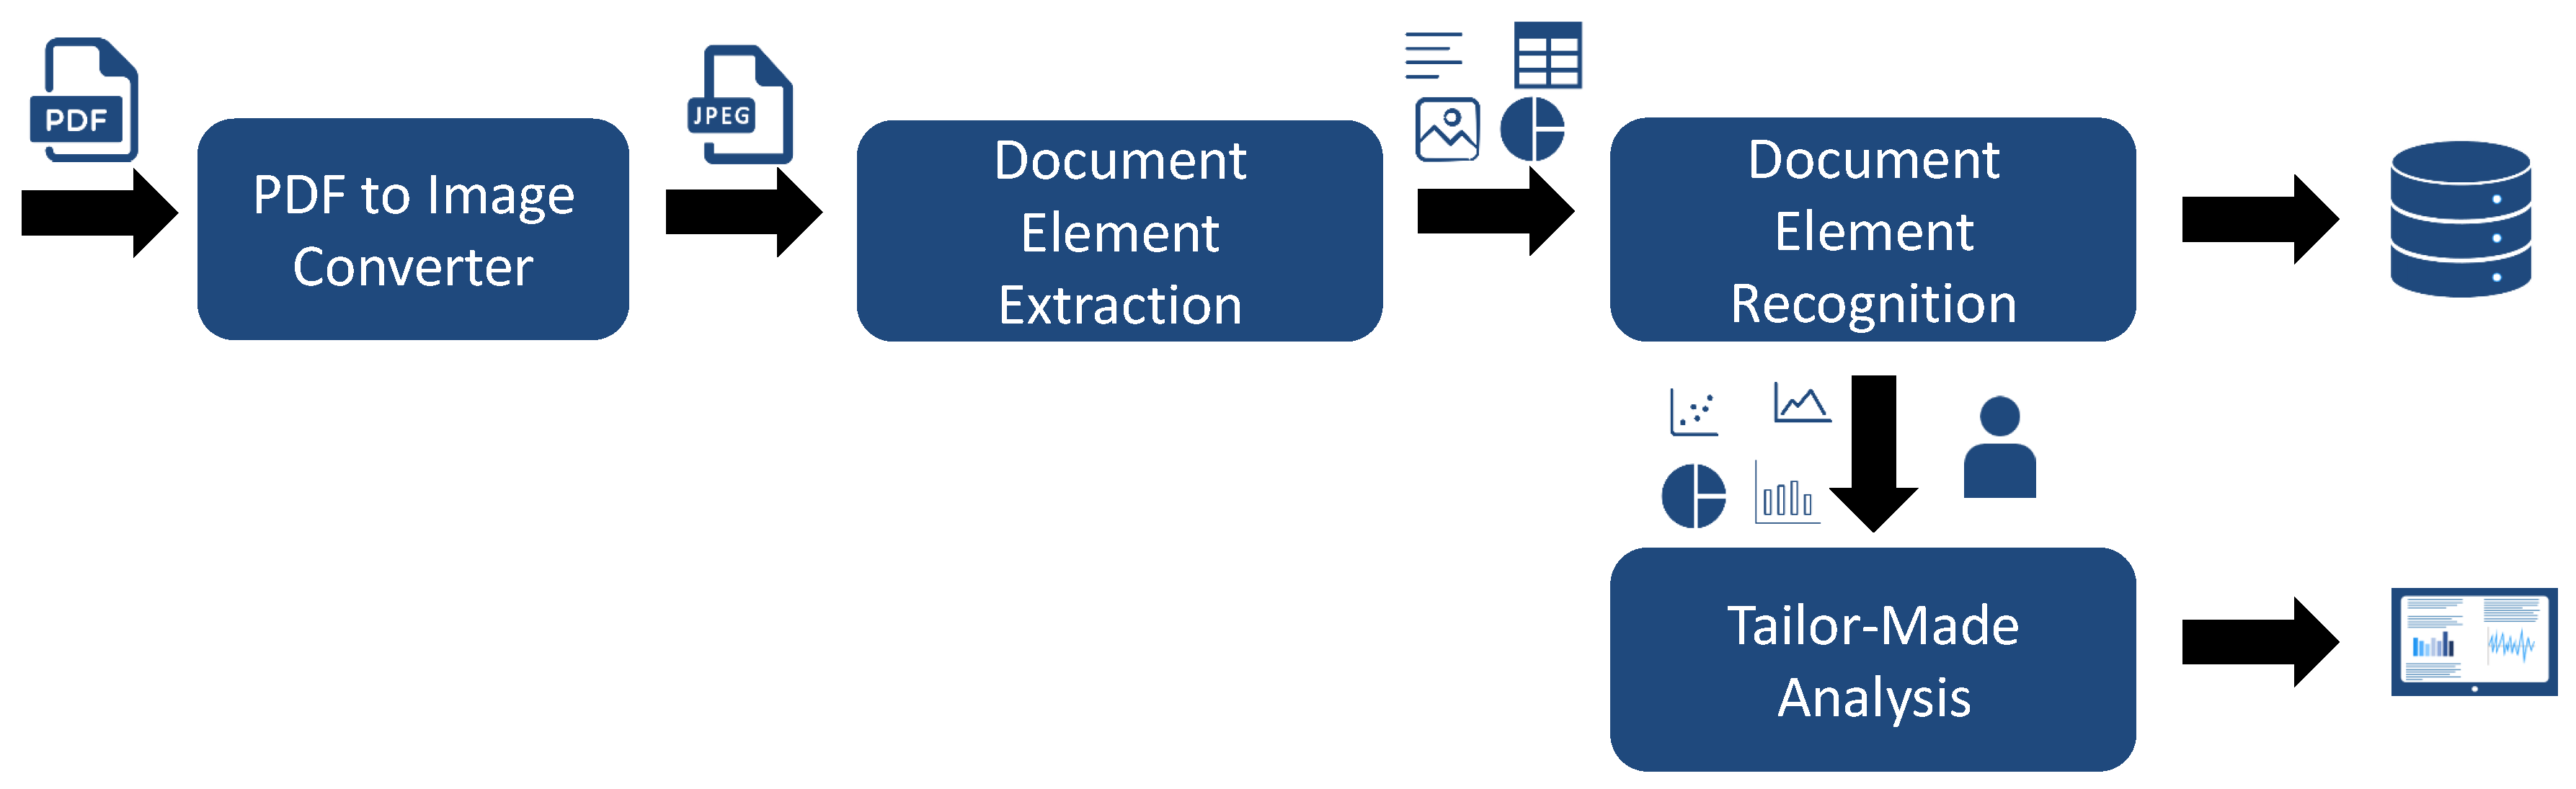
In order to support data scientists and reduce the time to analytics for them, we focus in this paper on structuring unstructured data by identifying relevant document elements within this data that contribute to an improved retrievability and analysis. We limit our research to the examination of PDF documents and neglect audio files or videos, which are also summarized under the umbrella term unstructured data. Figure 1 illustrates the pipeline that we use for processing such PDF documents. For each PDF document that we receive, we convert the document into an image. The reason for this is that we always have to assume that our pipeline is compatible with PDF documents where no additional metadata is available, such as scanned documents. Afterwards, we extract the relevant document elements, such as figures, tables or algorithms. After detecting the different document elements, it would make sense to directly analyze them in more detail. For instance, for detected data visualizations, we could further classify them in scatter plots, pie charts etc. For tables, it would make sense to detect the header etc. After these additional information are extracted and recognized, we store these information in a database so that the corresponding PDF document must not be processed a second time. Moreover, data scientists are able to directly retrieve the information from the database. The results from the document element recognition are then used by data scientists for further analysis and processing. For instance, they could apply object detection on recognized images, apply algorithms for reverse engineering the original data sets from the given data visualizations or analyze the values within the tables and merge them with additional data sources. The depicted pipeline illustrates steps that are necessary in order to make PDF documents retrievable and analyzable. However, each of these steps is challenging. Hence, in this paper, we especially focus on the extraction part. In order to achieve this goal, we focus on the development of an approach for the automatic identification and extraction of document elements, such as figures, data visualizations, tables and algorithms. In comparison to related work, which solely focuses on extracting figures and tables, we additionally classify figures in more detail by differentiating between data visualizations, photos or other types of figures during the extraction phase. Moreover, the definition of figures and tables within the related work is subtly unsuitable. Taking a look at common PDF documents, tables are often stored as images. However, if a document element is captioned as figure but shows a table then some of the approaches that exist in related work annotate it as figure. To further process and analyze this document element, it must be classified as a table, which it actually represents, and not as a figure.
To accomplish the identification and extraction of data visualizations, photos, tables etc., we present and evaluate two different approaches. The first approach, called Segmentation Approach, uses a combination of deep learning and rule-based image processing techniques to perform the identification and extraction of the document elements. By contrast, the second approach, named Object Detection-based Approach, formulates the problem of identifying these document elements as an object detection problem and only uses deep learning. To train the neural networks of the two approaches, we manually labeled a large corpus of PDF documents from multiple domains that we publish along with this paper. We evaluate our approaches by comparing them to the approaches from the related work. Specifically, we compare our approaches against PDFFigures [3], PDFFigures2 [4] and DeepFigures [5]. The results of our extraction pipeline show that our best approach automatically extracts figures with a precision of 0.73 and a recall of 0.80. For tables, we reach a precision of 0.78 and a recall of 0.94. We also distinguish data visualizations from other figures with an accuracy of 0.89.
The rest of this paper is structured as follows: Section 2 presents a motivating example and Section 3 discusses related work. Afterwards, Section 4 introduces a detailed problem definition. Based on these sections, we introduce our created data set corpus in Section 5 before we present our solutions in Section 6. Finally, we show and discuss our evaluation and results in Section 7 before we conclude in Section 8.
2. Motivating Example
In this section, we present a motivating example that illustrates the need for enterprises to ensure that their stored PDF documents can be retrieved, analyzed and processed.
The scenario consists of a multinational manufacturing company with several locations in different countries, which is already centralizing its data in a data lake. In addition to the structured and semi-structured data sets, the lake also contains PDF documents from various sources. The stored PDF documents cover issued and received invoices, issued and received orders, internal business unit reports, management reports and a variety of external reports received by consulting companies. In addition to these documents, the data lake also stores PDF documents on maintenance work carried out. These reports contain a section for each maintenance work performed. Each section includes a fault description, a cause and a solution, as well as a table showing the material used and the quantity removed from the stock and photos of the documented damage. Unfortunately, this enterprise only saved these PDF documents as scans, as each of the reports had to be printed first to be signed by the supervisor. Subsequently, the reports were scanned again and stored in the data lake. A few years after a lot of maintenance reports were collected, the management decides to implement a predictive maintenance use case within the enterprise. Based on the collected reports, data scientists shall identify which spots are frequently damaged as well as which materials are required for the repair. In addition, the required costs for the spots need to be determined. In order to fulfill their task, the data scientists first need to identify which of the PDF documents in the data lake contribute to their analysis. For that, they have to manually open each document and decide if the document contains the required information. Afterwards, they are able to download all the required PDF documents as well as the files that contain the costs of the used material. Since the PDF documents are scanned images, the data scientists have to apply Optical Character Recognition (OCR) software to extract the text. In addition, they need to extract each table separately, since the OCR software is able to recognize the text within the tables, but the information that it is a table is lost. This results in a large effort as it has to be done for each PDF document resulting in a high time to analytics as the data preparation takes a lot of time. After extracting all the necessary information, the computer scientists are able to analyze the text sections using natural language processing methods and to merge the various tables with the files on material costs. This allows them to answer the questions raised by the management.
In considering this scenario, we identify several disadvantages of the current way the enterprise deals with the storage, retrieving as well as analysis of the PDF documents. First, the crude process of the enterprise in storing the different maintenance reports. While there already exists an original document that could be retrieved and processed in a more efficient way as it contains the raw data, the enterprise only stores a scanned version of it due to the required signature of the supervisor. Although we are aware that this disadvantage of course exists only for our presented example, these cases occur again and again in the real world. Instead of storing recorded data in a structured way, they are often converted into unstructured formats and then the original raw data is discarded. In order to change this, approaches to sustainable data integration and management would be required. This process would require to store additional metadata for each PDF document. The second disadvantage is the way the data scientists have to retrieve the documents from the data lake. Basically, this disadvantage results from the bad data integration. By storing additional metadata, such as semantic annotations, a more efficient retrievability would be reached. The third disadvantage is the way PDF documents, especially those that are images, have to be analyzed. Currently, it lacks suitable approaches for preparing PDF documents for analysis. This requires the automatic recognition of the various document elements present in PDF documents so that these document elements can be stored in a structured manner. This would allow a targeted processing and analysis of these document elements. In the example above, this would mean that the data scientist would have obtained the tables as extracted separate document elements, which would have meant that the information would have been preserved that it is a table. Afterwards, an identification of the header and the data values by means of OCR would have led to an efficient analysis. This automatic process would significantly shorten the time to analytics.
3. Related Work
In literature, different approaches exist for dealing with information extraction, information retrieval as well as content analysis of unstructured data. One domain that is actively developing and applying these methods is the area of research data management. Possible use cases include the development of recommendation systems for similar publications (e.g., Doerfel et al. [6]), the visualization of research networks (e.g., Thiele et al. [7]) or plagiarism detection (e.g., Potthast et al. [8]).
Since the goal of our paper is to detect and extract figures and tables in documents, approaches that could make use of the detected items are also relevant. For example, Santosh et al. [9,10,11] propose a technique for extracting information from tables in business documents. This is accomplished using OCR and graph mining techniques on a graph composed from the spatial relations of text pieces. Combined with information from an OCR technique, this can be used to reconstruct a table from an image in a machine-readable way.
Due to the challenges raised by PDF documents, many approaches use the original source data, just as the original Microsoft Word document or Latex code and resources in order to implement their use cases. For instance, Scharpf et al. [12,13,14] focus their research on discovering and recognizing mathematical formulas in scientific publications in order disambiguate formula identifiers so that mathematical publications become interpretable by computers. Groza et al. [15,16], on the other hand, deal with the insertion of metadata at the phase of writing in order to improve the retrievability of scientific publications. Their system, called SALT (Semantically Annotated Latex for Scientific Publications), extends the Latex writing environment so that users can add additional annotations based on an underlying ontology. This allows, for instance, the application of natural language processing approaches in order to get additional annotations for the document.
Working with the original source data has the advantage that the methods can benefit from the provided structure and the resources. Thus, working with the original source data is the most promising approach for documents in order to enable a sophisticated retrievability, analysis, and processing. However, what all these approaches have in common is that they require access to the original source code. While this might be possible for new publications, their approach cannot be used with already existing PDF documents. Moreover, depending on the approach, it might be limited to a specific type of source code, such as Latex or Microsoft Word. Hence, it must be ensured that the approach is compatible with all different types of source codes. Another disadvantage of the approach presented by Groza et al. [15,16] is that the added metadata are all obsolete once the annotated documents are printed out and scanned. In these cases, all the integrated additional information are lost. Hence, other approaches relying on the extraction of information are required as these approaches are able to deal with all kinds of PDF documents.
For that reason, much research is done on the retrievability and analysis of PDF documents published as scientific work for which no source data are available. Reasons for this might be that most of these publications are either too old or that they are published as PDF documents without publishing the corresponding source data, such as figures, raw data from experiments etc. Constantin et al. [17] developed the Document Component Ontology for dealing with the description of scientific documents. The idea of this ontology is to define all kinds of document elements that exist within scientific documents, such as authors, titles, glossaries, figures, lists, paragraphs, sections etc. After extracting all different kinds of elements, the ontology supports the description of the different document elements. In order to extract these document elements, different approaches exist, which we discuss and examine in the following.
One of the first approaches on extracting diagrams from documents was proposed by Praczyk et al. [18]. They implement and evaluate a rule-based system called PDFPlots specifically designed to extract diagrams from papers in the domain of high-energy physics. They reach a recall of 0.94 on an evaluation corpus of high-energy physics research papers, however, they evaluate their system by comparing the number of detected figures on each document page to the correct number of figures. This approach is somewhat questionable in that it does not ensure that the diagrams are located correctly. In addition, they evaluated their approach only on a corpus coming from a single domain. However, the differences between domains are quite important as figures, tables and especially the layout of the proceedings and papers (e.g., single column vs. multi column) is very different.
Furthermore, a series of systems called PDFFigures [3], PDFFigures2 [4], which were developed by Clark et al. as well as DeepFigures [5] that was developed by Siegel et al. were developed for the inclusion in the Semantic Scholar search engine (https://www.semanticscholar.org) and discussed in the literature. In the following, we refer to these systems as the PDFFigures systems. PDFFigures and PDFFigures2 are rule-based systems. They operate by performing full text search of a list of keywords on the bare text of the document to locate captions of figures and tables. Precise bounding boxes are then generated by finding nearby graphical elements in the object model of the document. DeepFigures, meanwhile, is a deep learning-based system, specifically using deep residual networks in combination with OverFeat to enable object detection. They train their system using an automatically annotated corpus comprised of articles from arXiv and PubMed. Evaluation in all three papers is done by comparing the results over three corpora, CS-100, CS-Large and PubMed. The first two of these only contain research papers from the computer science domain while the third corpus is drawn from a repository of medicinal literature. Evaluation results are given w.r.t. the reached F1 score, where a figure or table is marked as detected correctly if its Intersection over Union (IoU) score with the corresponding ground truth document element is greater than 0.8. In the evaluation, PDFFigures2 fares better than the other two systems, reaching a recall of 0.879 on figures on the CS-Large data set compared to 0.849 reached by DeepFigures. However, DeepFigures far exceeds PDFFigures for documents from the PubMed corpus. The nature and goals of the PDFFigures systems are somewhat different from ours: They aim to detect all figures and tables with captions in scientific research papers, which is somewhat different from our goal as explained in Section 4. Moreover, PDFFigures and PDFFigures2 only work on raw PDF documents that still have an internal document structure. Thus, they do not work on scanned documents. However, DeepFigures also detects diagrams in documents that lack an internal data structure (e.g., scanned documents).
A very recent system was proposed by Li et al. [19]. They use a large weakly supervised data corpus in combination with the Faster R-CNN object detection algorithm and the ResNeXt-152 network architecture [20] to achieve a pixel-wise recall of 0.90 in the most general case. However, they specifically only detect tables and do not focus on other document elements like figures or algorithms.
4. Problem Definition
Compared to related work, which solely focuses on identifying and extracting figures and tables from PDF documents for displaying them, e.g., as additional information on a search engine, our goal is to extract document elements in such a way that they can contribute to document retrieval and analytic use cases more efficiently. To accomplish this goal, it is important not only to extract figures, but also to distinguish between data visualizations, and other types of diagrams, since all of these may later require different approaches to infer information from them.
Up until now, this paper has used many different terms for the document elements that we want to extract interchangeably. This section intends to clarify the terminology going forward. In general, by document elements, we mean any of the things which we extract, including tables, figures, data visualizations, algorithm listings and so forth. Document elements may be defined according to two different definition systems:
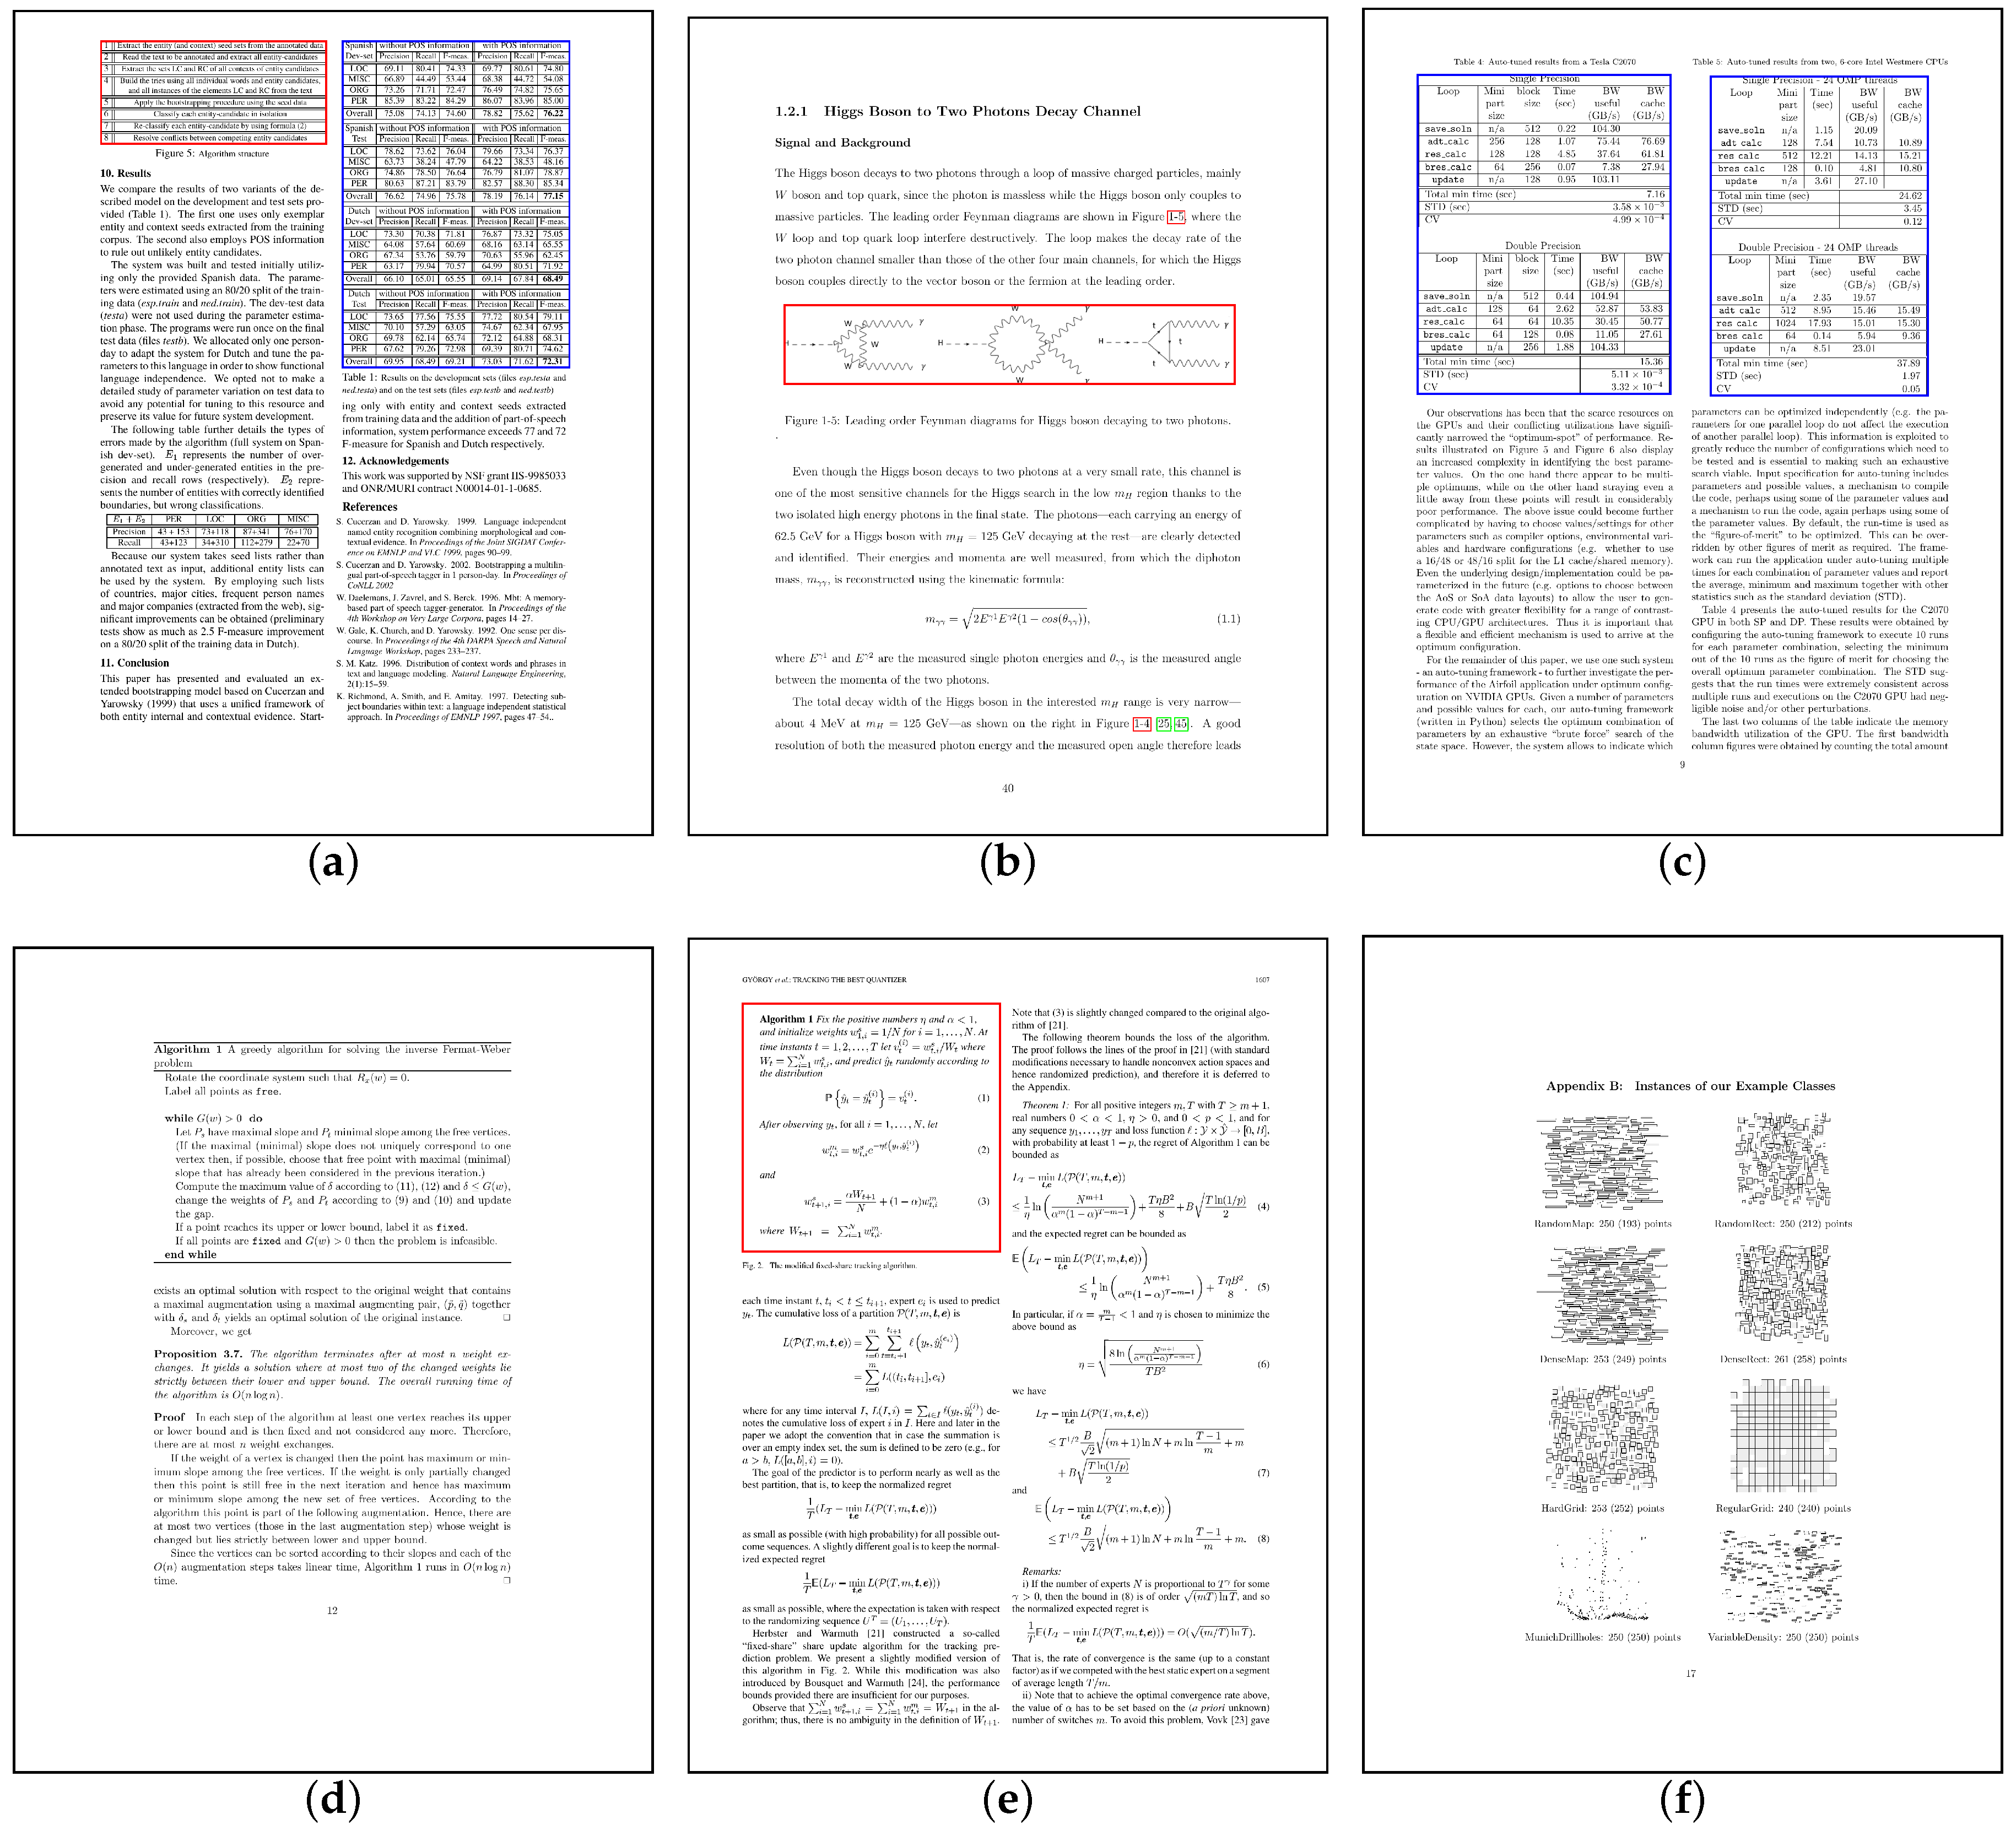
The caption-oriented definition system defines as a Figure anything that is accompanied in the document by a caption that starts with “Figure” or a similar term. A Table is defined similarly, but using the term “Table”. This definition system was implicitly proposed by Clark et al. in work [3] and also used in the subsequent works [4,5]. It has the advantageous properties of being very suited to their use case and being easy to implement by a rule-based system. For example, text search can be used to great effect. However, it has the negative property of not being very fine-grained. For example, what one might intuitively call two tables may be defined to be one single table by this definition system if only a single caption is present. Furthermore, table-ness or figure-ness is not decided by any structural or graphical properties but merely by the presence of the correct type of caption. Another consequence of the definition is that in the absence of captions like Figure and Table no documents elements even exist. Some of the more unintuitive consequences of this definition system can be seen in the CS-Large data corpus, which is used for evaluation by works [3,4,5]. Figure 2 shows some examples. We stress that this is not a criticism of the PDFFigures papers in and of themselves because their definition system makes sense for their use case.
The semantic-oriented definition system defines more different types of document elements: Tables, Data Visualizations, Algorithms and Other Images. In this definition system, how fine-grained document elements are depends not on the presence of caption, but on the notion of minimal separate interpretability. If two line charts next to each other share a single legend, then they are not interpretable on their own, regardless of whether or not they share a caption. Furthermore, subclassification of document elements does not follow a keyword from the caption but the graphical character of the element itself. This definition is, in a sense, less formally precise. However, it is more helpful for our purposes because a data scientist using the system implementing this definition system will usually not care whether the caption of an item calls it a “Figure” or “Table” or whether a caption even exists. Furthermore, the “Data Visualization” class of document elements specifically refers to elements that visualize some kind of usually columnar data in a narrow sense, i.e., it should be possible at least for a human observer to proceed from the visualization to some kind of quantitative data set. Similar document elements that do not have this property are classified as Other Image, a class which also includes many other kinds of graphical document elements.
In the subsequent chapters, we use these terms strictly as defined here. Some terms are used by both definition systems, like document element and table. In the following, we always clarify on which definition system we are operating where necessary.
Having discussed these definition systems, we also note that the definitional mismatch between our semantic interpretability definition system and their caption-oriented definition system makes fair evaluation difficult. This is because evaluation requires presupposing a certain ground truth and comparing two systems with regards to how close their results are to this ground truth. Section 5 details how we create a data corpus that can be used to train and evaluate systems using both individual definitions.
5. Creating a Data Corpus
To deal with the definition mismatch and also create a more varied training and testing data set, we assembled a new data corpus. We randomly sample documents from several open access preprint repositories, namely ArXiv, BioRxiv, ChemRxiv and SocArxiv. With respect to ArXiv, we pick certain categories that presumably contain many diverse types of diagrams and tables. For instance, we select the Algorithms and Datastructures subcategory specifically to make sure the corpus includes some algorithm listings. Furthermore, to also handle nonscientific documents, we download annual reports of several publicly traded companies. The composition of the corpus is shown in Table 1.
We manually annotate each of the documents resulting in 31,639 labeled PDF pages. Furthermore, a third of the documents are declared the test portion of the corpus. All pages from these documents are annotated but never used in training, only for the final evaluation. In addition to these pages, our corpus also contains all of the document pages from the CS-Large corpus presented in [4] by Clark et al.
Specifically, we assign labels to each document element and mark it as one of Table, Data Visualization, Algorithm or Other Image. In addition, we annotate the whole corpus also according to the caption-oriented definition system, using only the labels Figure and Table and grouping document elements if they share a caption.
This dual annotation approach ensures that one can train and evaluate according to both definition systems. We also label the positions of figure and table captions and the first word of each of those captions (usually Figure or Table). We refer to this first word as the caption tag.
The data corpus as well as our annotation tool are freely available at the URL https://archive.org/services/purl/purl/document-item-extraction-2019. We welcome community contributions to the data corpus, especially where diagrams that our system has trouble detecting are concerned.
6. Segmentation- and Object Detection-Based Approaches
To be able to provide an even broader comparison of approaches, we implemented two approaches to the problem. The first approach relies on a semantic segmentation technique based on deep learning and rule-based image processing whereas the second one is an object detection approach solely based on deep learning.
6.1. Segmentation Approach
The first approach is based on semantic segmentation techniques. The basic idea of this approach, especially compared to work in the literature such as DeepFigures, is the insight that it is extremely rare for two tables or figures to overlap with each other in a document. Therefore, one could apply semantic segmentation techniques based on fully-convolutional networks as described by Long et al. [21]. This method has the advantage of incorporating only local information, so it should yield a system that is independent to the layout of the document as a whole. However, to also be able to detect figures according to the caption-oriented definition, one does occasionally need spatially distant information. Specifically, it is very important for the detection quality to use information about the locations of captions to determine if, e.g., two diagrams belong to a single figure. To achieve this, we also detect the tags of all captions in documents. This information is then used to augment the initial detection with a rule-based post-processing step incorporating such information.
The full system is designed as follows: We train three networks on our whole data corpus. The first network is responsible for tables and only trained on such labels. The second network is responsible for all other types of document items including everything labeled as Data Visualization, Other Image, or Algorithm. Finally, the third one is responsible for the detection of caption tags. Each of these networks can be used to generate a heatmap marking the locations of these document elements on a given page. These markings are accurate enough to use them to easily create bounding boxes by finding their contours. The networks themselves used fairly standard architectures based on VGG-16 [22], each using a sequence of triples, each consisting of two convolutional layers and a max-pooling layer in the first half of the network or a supersampling layer in the second half. We applied dropout regularization and batch normalization throughout the networks and optimized them by using ADAM. As a loss function, we used Dice loss [23], which is similar to a pixel-wise F1 score. To ensure uniform size, all input images were scaled or padded with whitespace to 896 x 448 pixels. The networks were trained for roughly a week each on an Nvidia Tesla V100 GPU.
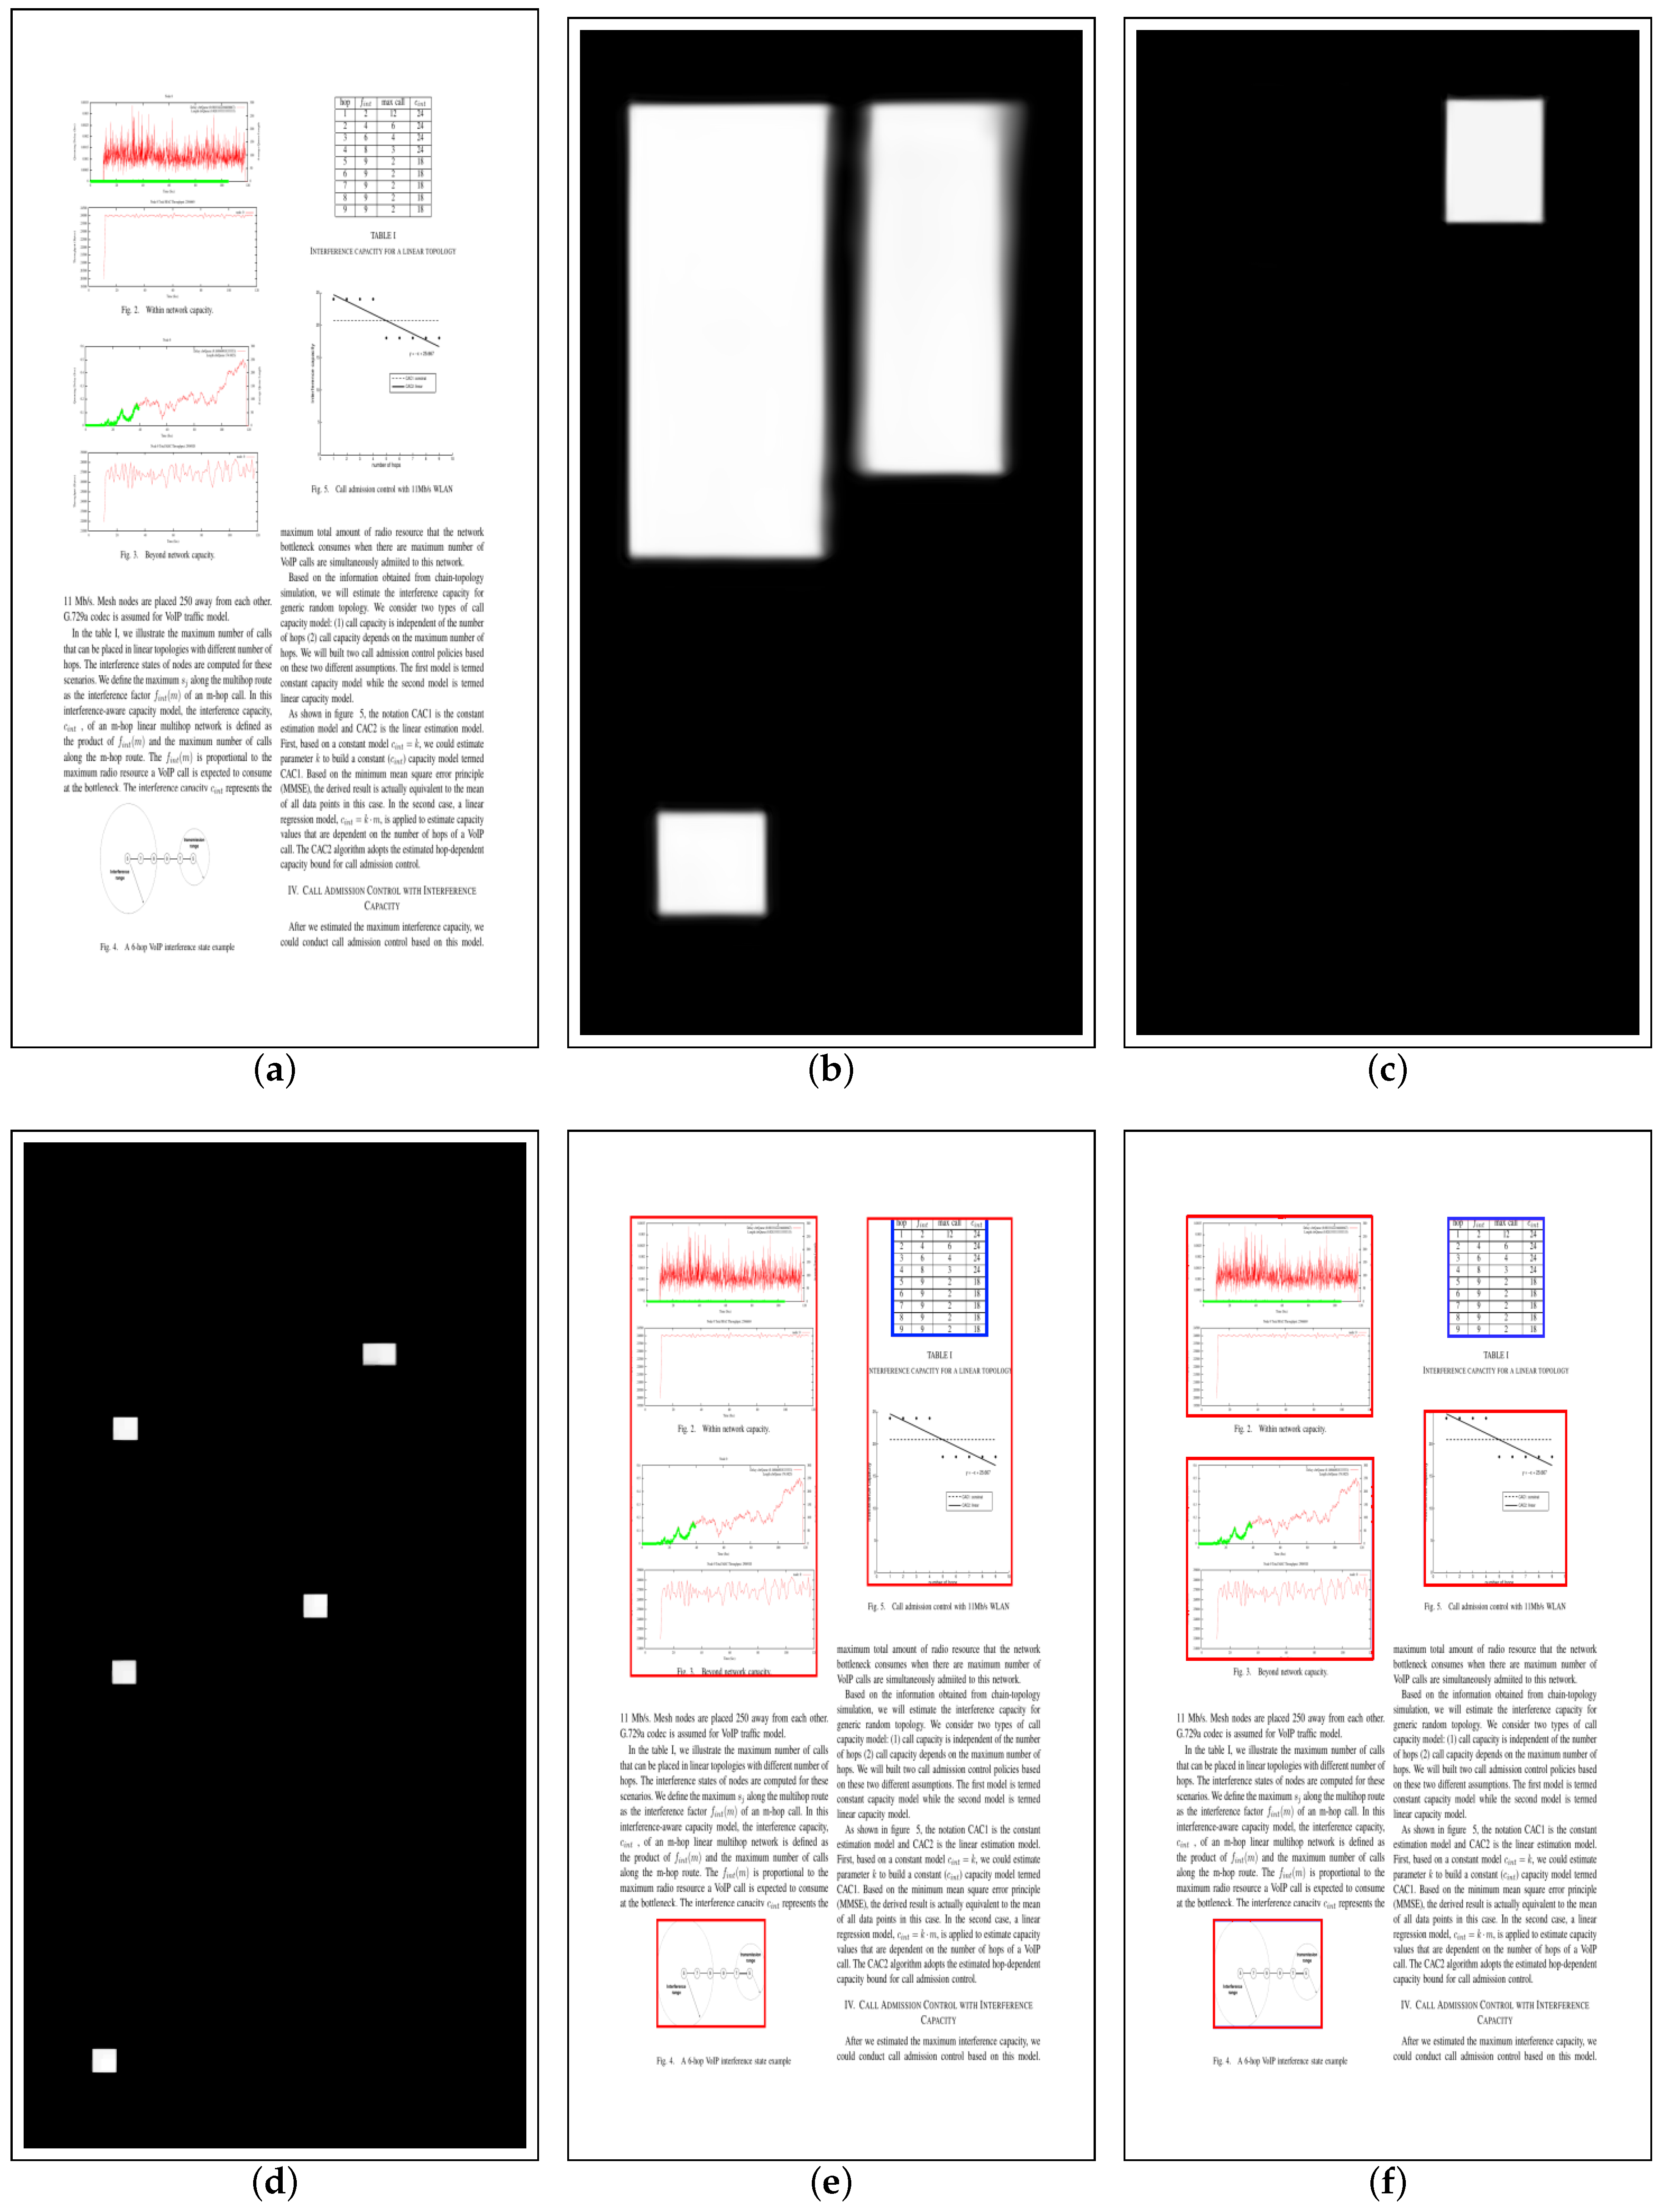
We perform two major post-processing steps. In the first step, our approach crops out whitespace on the sides of detected bounding boxes and includes all connected components of non-whitespace that the bounding box includes. The second post-processing step separates bounding boxes that were erroneously joined together if there is more than one nearby caption tag. The process is illustrated in Figure 3.
6.2. Object Detection-Based Approach
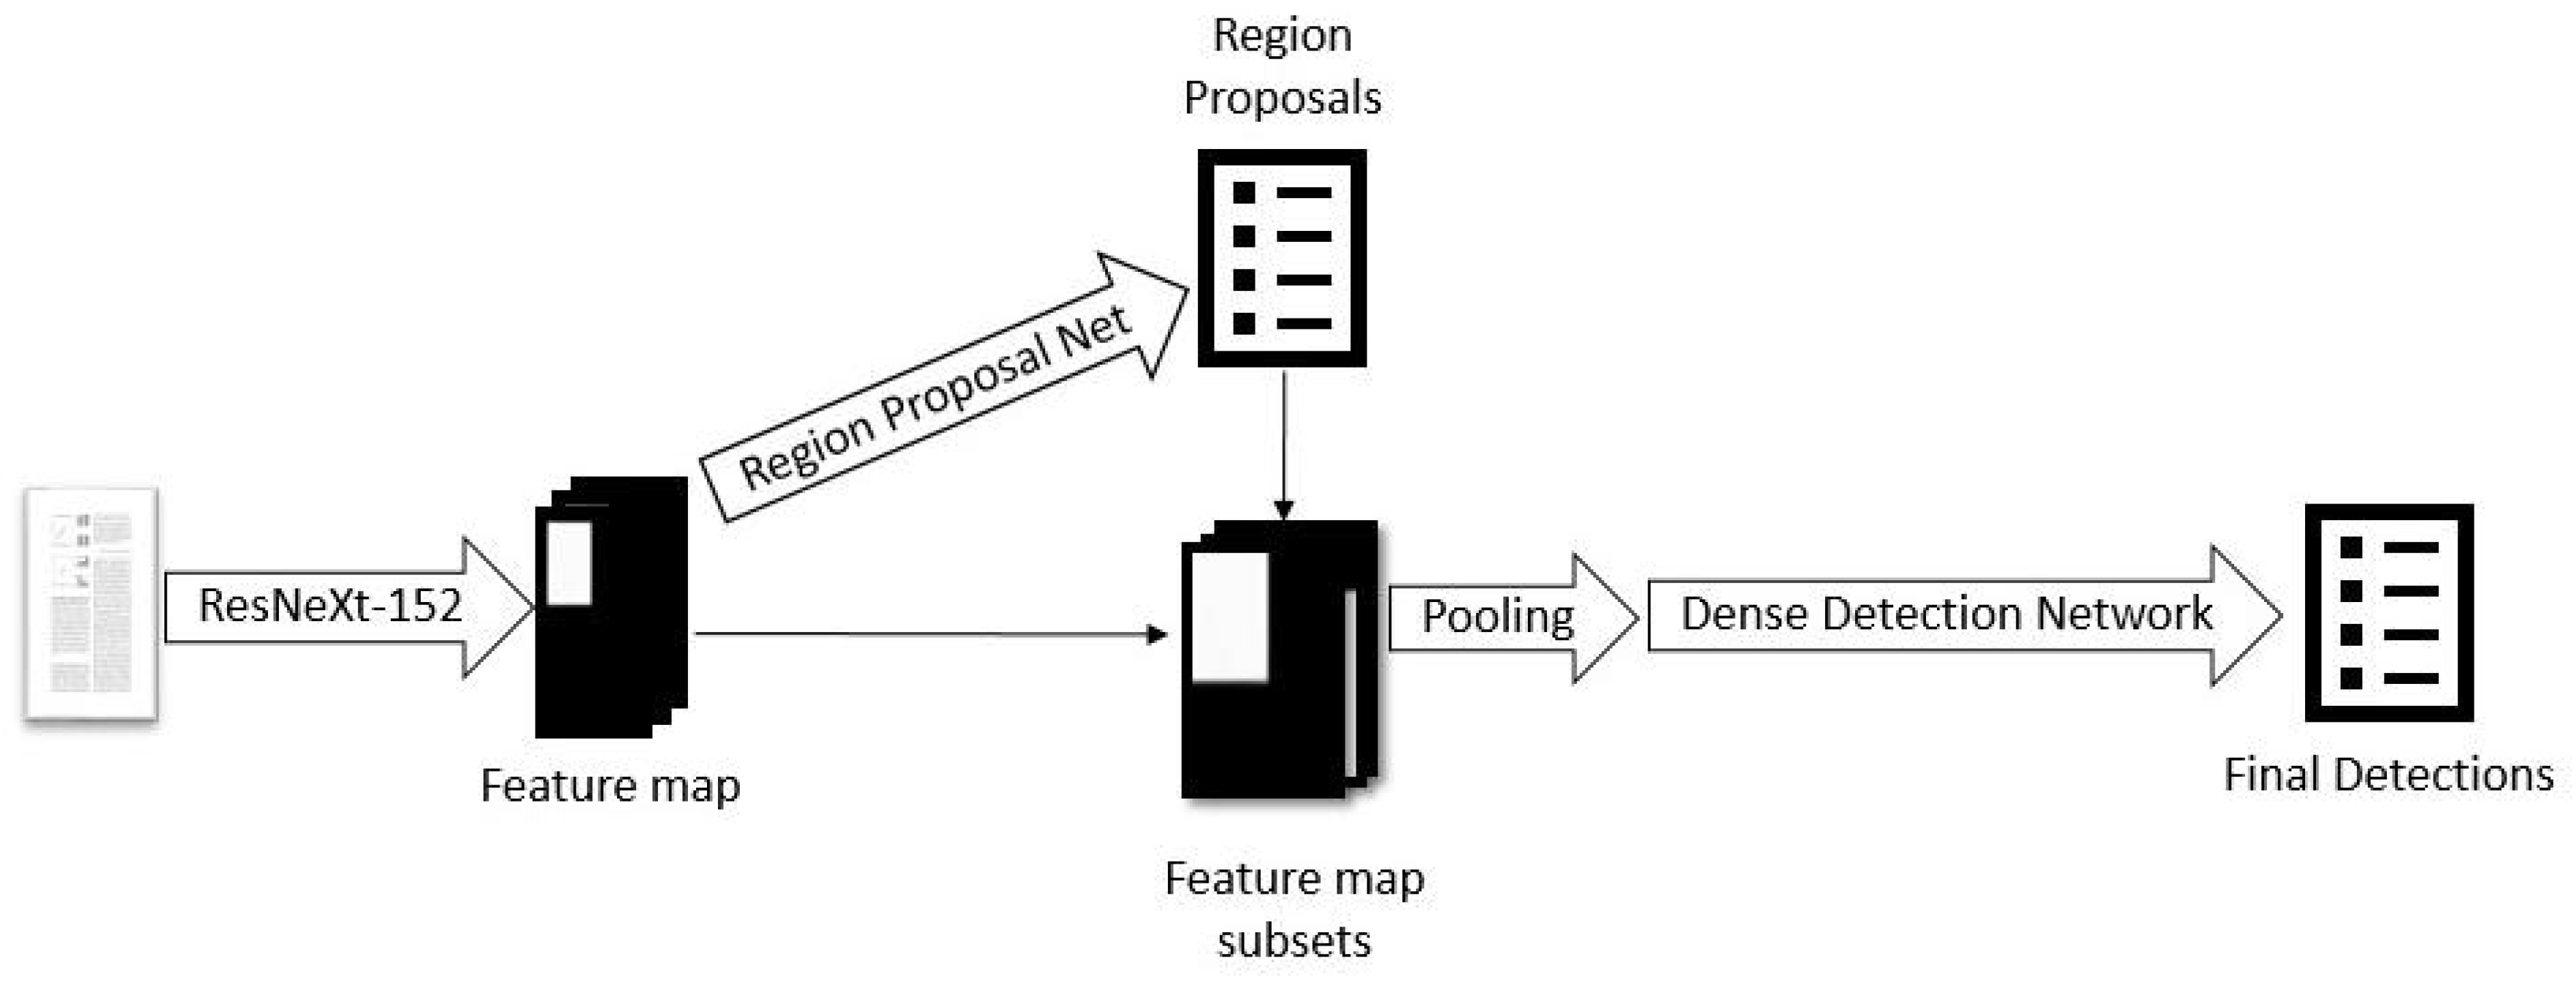
Beside the segmentation approach, we also implement a second approach, based on object detection techniques. Here, we used the Detectron framework [24] in combination with the Faster R-CNN algorithm and the ResNeXt-152 network architecture [20] in a similar setup as [19]. ResNeXt is, in essence, a combination of the previously very successful ResNet and InceptionNet, combining the depth and skip connections of ResNet with the multiple pathed modules of InceptionNet. The Faster R-CNN works as follows: Initially, the image is passed through a convolutional network, which in our case is ResNeXt-152, to produce a feature map. Then, this feature map is used as the input of a region proposal network. This network computes a set of class probabilities and a set of precise coordinates for each window of the feature map and each anchor box, where the scales and aspect ratios of the anchor boxes are predefined hyperparameters. After obtaining the class probabilities and coordinates, we filter out all bounding boxes that are unlikely to belong to any class. The remaining bounding boxes are passed to a detection network, which first performs max-pooling on the corresponding section of the initial feature map to reduce its size to a predefined constant shape and then applies some fully connected layers to obtain a final result. The initial ResNeXt-152 component of the network is pre-trained on the ImageNet data set and then both components, the region proposal network and the detection network are optimized jointly, i.e., each backward pass affects the whole network and the initial convolutional layers are changed according to combined effects from both the region proposal network and the detector network. The architecture of the Faster-RCNN is shown in Figure 4.
We train the network for 36 hours on an Nvidia Tesla V100 GPU. The implementations of both approaches are made publicly available at the URL https://archive.org/services/purl/purl/document-item-extraction-2019.
7. Evaluation and Results
For testing the accuracy of our approaches, we performed a detailed evaluation. The goal of our evaluation is to answer three different questions: Firstly, how does our system compare to the PDFFigures systems, presupposing their definition system (cf. Section 7.2)? Secondly, how do the systems compare when our definition and our data corpus (cf. Section 7.3) are used instead? Finally, our definition system includes a more fine-grained classification of document elements, especially according to whether or not they visualize data. How well can our systems distinguish this and classify what types of document elements it has encountered (cf. Section 7.4)?
7.1. Methodology
We evaluate our results compared to reproductions of PDFFigures2 and DeepFigures using the code and weights provided by the authors to extract bounding boxes and labels, i.e., identical systems to the ones used by the authors. For our systems, we train each system twice: First, we use the training portion of our corpus and the labels according to the caption-oriented definition system. Second, we use the training portion of our corpus and the labels according to the semantic-oriented definition system. In the evaluation, we use the appropriate version of the weights corresponding to the task.
To count errors, we find the Intersection over Union (IoU) values of pairs of detected and ground truth bounding boxes. Detected bounding boxes count as correct detections if this value is greater than 0.8. In this respect, our evaluation is identical to the corresponding publications for PDFFigures2 and DeepFigures. To an extent, their chosen criterion for correct detection (IoU > 0.8) is somewhat arbitrary insofar as one may need more accurate detection for our use case. We therefore extended their evaluation to also give some results obtained when varying the correctness threshold by steps of 0.05. In addition, we found some of the provided bounding boxes in the provided data set to be obviously wrong and thus we corrected them where necessary (cf. Figure 5).
To perform the evaluation, one needs to match detected boxes to ground truth boxes in some way. Identically to the evaluation in [5], we use the Hungarian algorithm to optimize the sum of the IoU values of all pairs of ground truth document elements and extracted document elements for each page. Compared to the greedy matching used for evaluation in [4], this should either slightly improve the results or have no effect. Our object detection-based method has a test-time hyperparameter used for detection: The system outputs bounding boxes with a confidence in the interval [0,1]. Bounding boxes can be filtered according to the confidence and this affects the precision and recall of the result. Figure 6 illustrates how the value is chosen.
7.2. Results with the Caption-Oriented Definition
Table 2 shows the results when evaluating on CS-Large according to the caption-oriented definition system, e.g., the same evaluation setting used in the papers for PDFFigures 2 and Deepfigures. Because the choice of 0.8 for the IoU threshold is somewhat arbitrary, we also show recall over different values of the IoU threshold in Figure 7. This also gives a nice overview of how precisely each system locates the document elements it finds.
Counting only the results that we could reproduce, our object detection-based system achieves the highest recall but rather low precision on tables as well as figures. Further manual inspection reveals that this is because the object detection-based system frequently outputs bounding boxes around a whole figure as well as its subfigures, likely because it is uncertain about these cases. The segmentation-based system does not suffer from this problem because it is somewhat more inclined to just merge all the bounding boxes together in these cases. Other cases where false positives occur are algorithms, which are frequently not annotated in CS-Large (cf. Section 4), and other uncaptioned document elements, such as tables without headings or even portraits of the authors. The biggest contributors to false negatives are textual figures, i.e., some algorithms and mathematical formulae that are captioned as figures. A likely reason for this is that the algorithms that occurred in our training set followed relatively uniform layout conventions while the CS-Large data set, being sampled from subfields of computer science and several different conferences, exhibited more diversity in this regard. Another frequent source of errors was the exclusion of text that belonged to a figure but was located near one of its margins.
Both of these issues occur in the object detection-based system as well as in the segmentation-based system, so are likely consequences of data set bias.
We were also interested in finding out if the choice of the data set played any role in the results: Do PDFfigures2 and DeepFigures perform better on the CS-Large data set, which only contains papers from the computer science domain? To check this, we also evaluated the systems on the test portion of the Mixed-Large corpus, while presupposing their caption-oriented definition. The results are shown in Table 3. They show that the performance of our system is practically identical to what was achieved on CS-Large, i.e., our system performs equally well on both corpora. Meanwhile, DeepFigures and PDFFigures2 experience a sharp decline in recall when evaluating compared to the Mixed-Large corpus instead of the CS-Large, all else being equal.
7.3. Results with the Semantic-Oriented Definition
The results when evaluating on the Mixed-Large corpus according to the semantic-oriented definition system are shown in Table 4. The PDFFigures2 and DeepFigures systems perform significantly worse when operating with this definition. This is unsurprising as especially PDFFigures2 made design choices that strongly hinge on the kind of definition system used and DeepFigures was only trained with data annotated according to the caption-oriented definition. Meanwhile, our systems perform significantly better, with the object detection-based system yielding the best results, especially concerning table extraction. The underperformance of the segmentation-based system is likely due to the loss function used: having a dividing non-figure space between two figures that are close to each other but still separate does not reduce the loss by a large amount, so the network tends to connect such figures, leading to a bounding box that is not precise enough to count as a true positive.
Both of our systems still perform somewhat poorly on detecting items of the Data Visualization class. The most frequent sources of false negatives are situations where two visualizations share an axis label or legend but the system does not detect this and outputs two separate data visualizations as shown in Figure 8a. Another frequent source of errors are figures that contain some text but are not exclusively textual as in Figure 8b. Finally, there are also some cases where separate figures are merged together erroneously (cf. Figure 8c) and cases where figures are detected but not located quite correctly (cf. Figure 8d). The false positive rate of the object detection-based system is here mostly due to cases of compound figures that belong together according to our definition but are split apart by the system. In this case, every single partial detection counts as a false positive.
7.4. Results with Respect to Classification
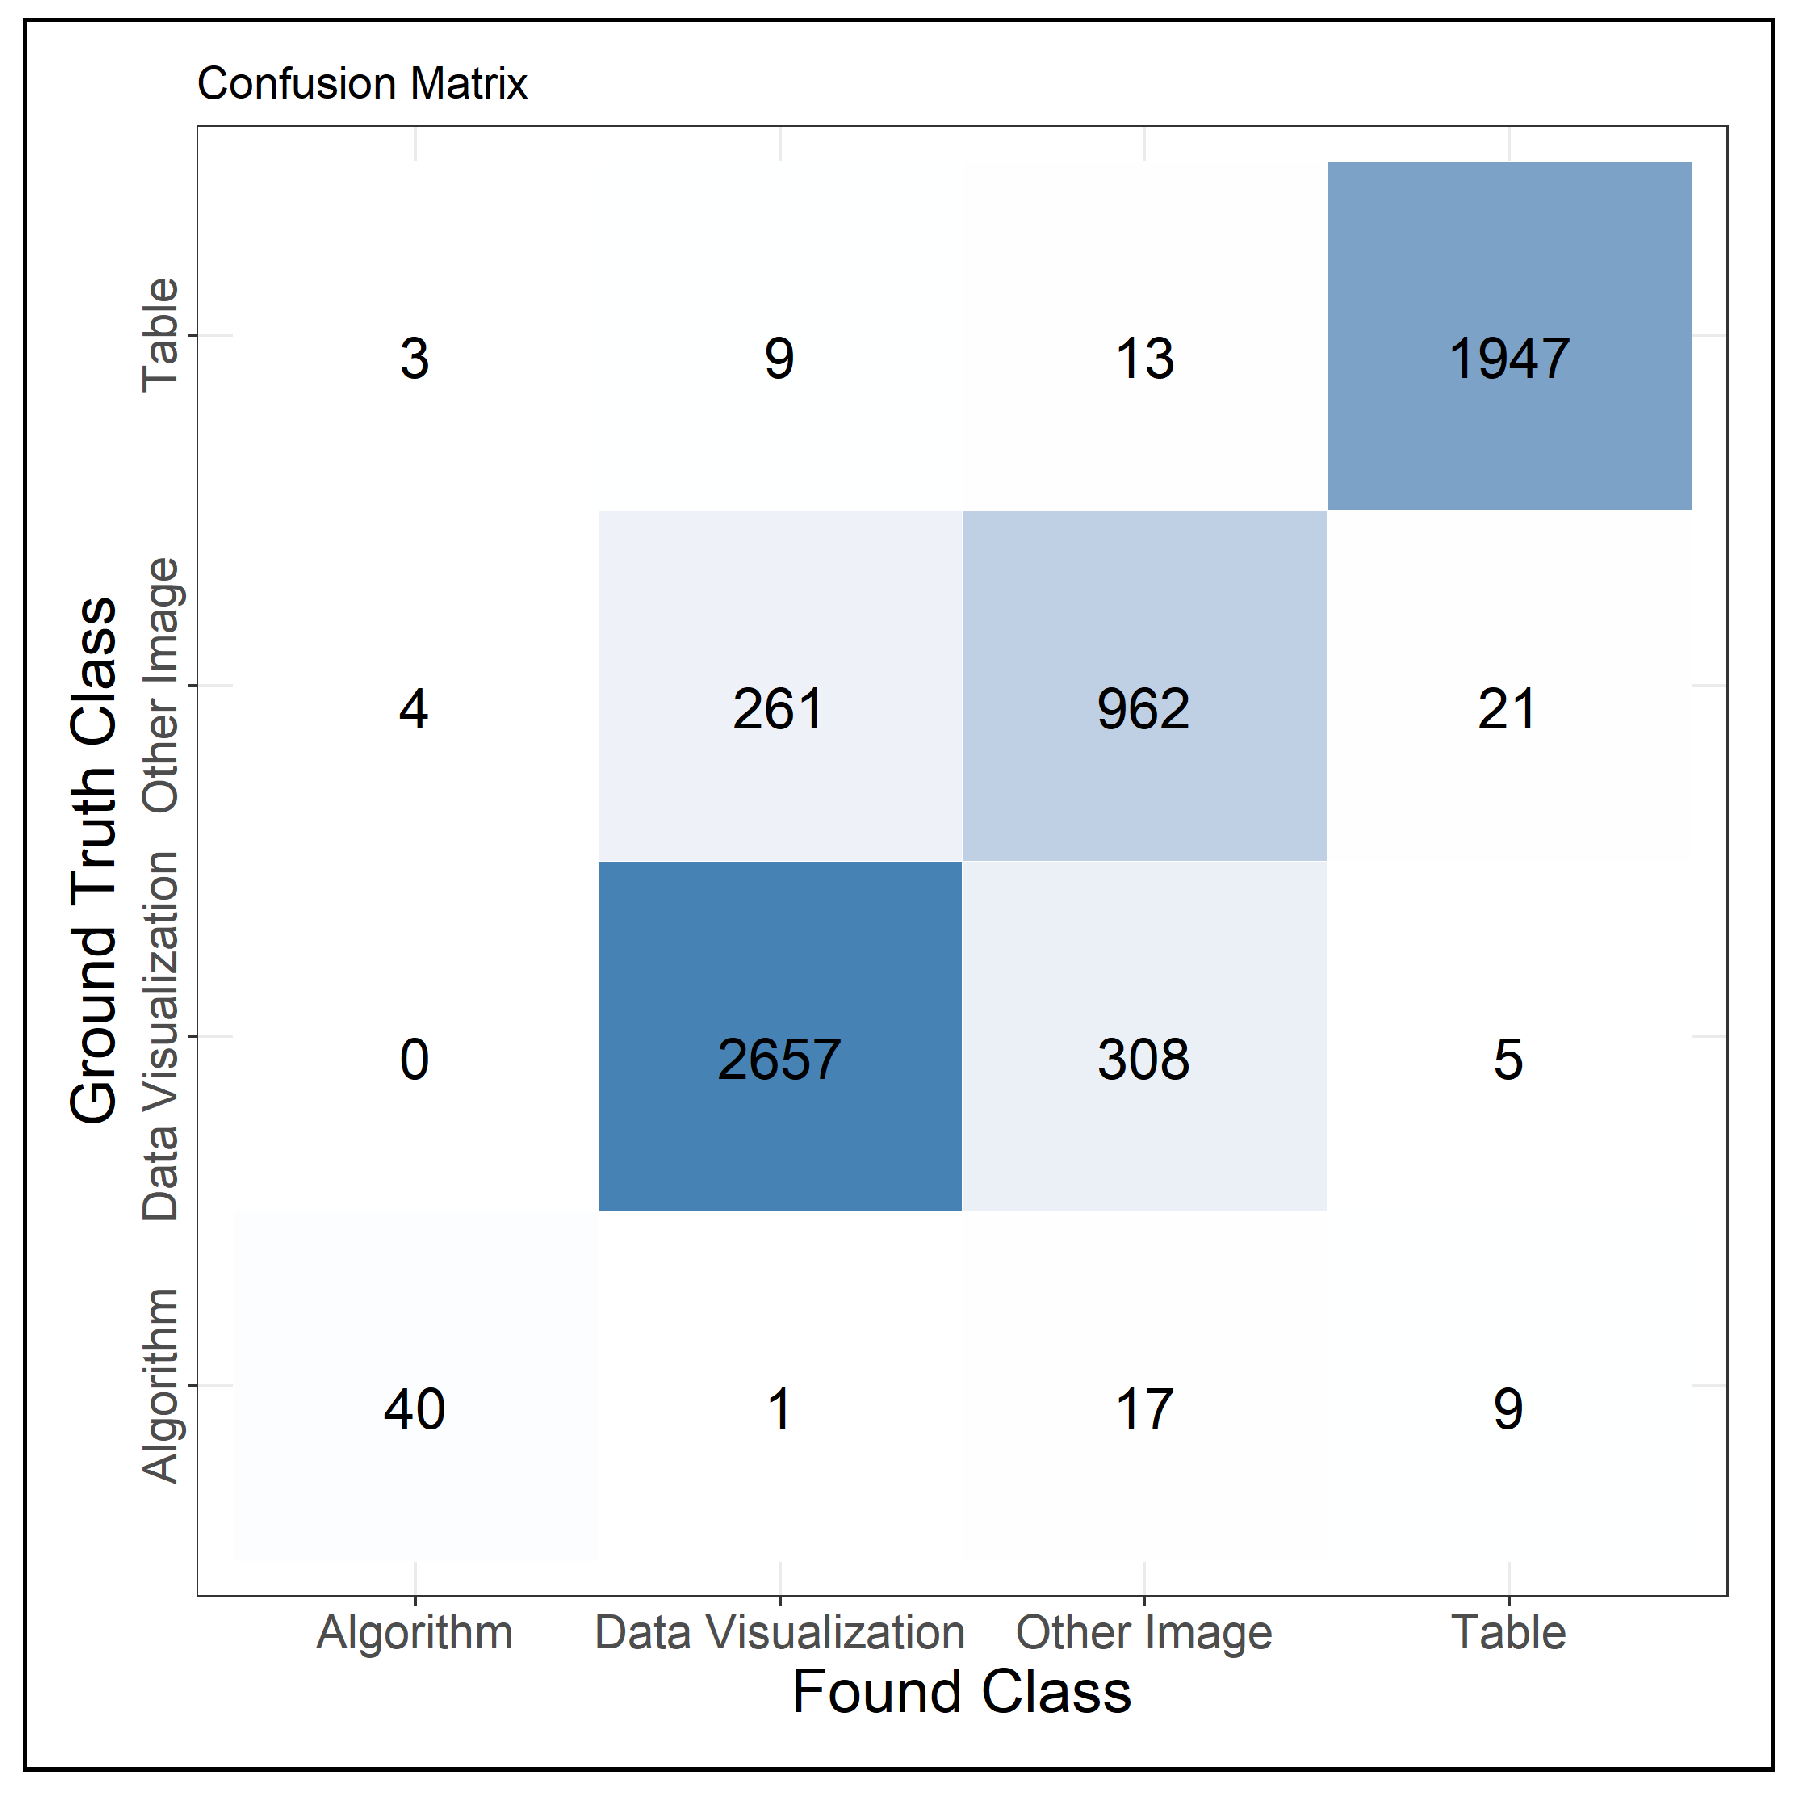
Because the object detection-based system performs well on detecting figures in general and trains faster, we use only this system to investigate how well we are able to distinguish the items in our corpus. To evaluate this, we train the network on the training portion of the Mixed-Large corpus using the fine-grained annotations and all of the labels in the corpus. Figure 9 shows the confusion matrix obtained when only investigating document elements that were localized correctly. This matrix shows that the classification of document elements works relatively well. The only situations where the network has problems are when trying to decide between “Data Visualization” and “Other Image”, which makes sense because in some cases, the distinction depends on small details like the presence of labels on the diagram. Otherwise, the system has some problems distinguishing the (relatively rare) “Algorithm” class from “Other Image” type document elements. This is due to “Other Image” being kind of a catch-all class that includes quite diverse types of items, some of them being very text-like.
7.5. Limitations
With respect to our evaluation, we have not yet compared our system’s table detection rate to one recently published work [19]. The authors use a very similar system to our object detection-based approach and reach a slightly lower recall than ours in the most general case. However, they use a different evaluation data set and a different definition of precision and recall than we do (pixel-wise as opposed to document element-wise), so it would be interesting to see how the systems compare when the same metric is chosen. The difference in choice of metric combined with time constraints precluded us from comparing the systems more fairly. Additionally, the detection performance is still worse on non-table document elements. Here, it would be very helpful to investigate the errors the system makes and their causes further.
With respect to the corpus, currently the only non-scientific documents contained are company annual reports. While these documents are easily obtainable, they are not exceptionally diverse in their graphical style. Therefore, it would be helpful to add other non-scientific documents to the corpus.
8. Conclusions
In this paper, we focused on the problem that PDF documents, which are widespread within enterprises, contain valuable information that can contribute to different analytical use cases. However, finding and analyzing these PDF documents is quite challenging as PDF documents contain different kinds of unstructured data, such as figures, text paragraphs, data visualizations or tables. Due to their high variety, each of these document elements needs to be analyzed with different tailor-made approaches.
To tackle this issue, we focused in this paper on a system that enables the structuring of PDF documents by extracting and classifying document elements available in the PDF documents. In order to accomplish our goal, we have presented a new system for the detection of data visualizations, figures and tables, which performs competitively with state of the art systems like PDFFigures2 and DeepFigures. In addition, we have discussed limitations of the caption-oriented definition system and introduced our semantic interpretability oriented definition system. We present a new evaluation and training data set annotated also according to our own definition system, demonstrating that PDFFigures2 and DeepFigures are not suited to application for our use case. Having evaluated two different systems, we find that an object detection-based approach yields superior results. To improve the progress in this research area, we published our source code, models, data corpus and annotation tool so that they can be used by the community in order to train and evaluate their own systems.
Altogether, we conclude that our current approach provides a good basis for structuring unstructured data like PDF documents. By extracting the different document elements within the PDF documents, we enable data scientists to directly receive the different components that they require for their analysis. In addition, by extracting suitable information from the extracted elements during the data integration phase, the retrievability can be improved as well.
Our future work will go into different directions. On the one hand, we focus on the improvement of our current approach. For that, we will improve the detection for tables and data visualizations and we will additionally focus on retrieving semantic information by considering the content of the PDF documents and applying approaches from the research area of natural language processing. For instance, we focus on extracting and recognizing relevant pieces of text from the detected document elements. In addition, we plan to use our system for improving the process of querying PDF documents from large data stores by semantically annotating them with concepts and relationships from an ontology. Current systems annotate PDF documents solely based on keywords that were identified within the text. By extracting and analyzing figures and tables, more fine grained semantic information can be attached to the document so that are queryable analogously to structured data. By additionally using the ontology provided by Constantin et al. [17], we aim at describing the complete structure of PDF documents just by extracting the different document elements. Furthermore, we aim at also developing approaches for other kinds of unstructured data so that their discoverability and understandability will increase as well.
Author Contributions
Conceptualization, M.H. and A.P.; Data curation, M.H. and K.E.; Formal analysis, M.H.; Investigation, M.H. and A.P.; Methodology, M.H. and A.P.; Project administration, A.P. and T.M.; Resources, K.E.; Supervision, A.P. and T.M.; Validation, M.H.; Visualization, M.H. and A.P.; Writing—original draft, M.H. and A.P.; Writing—review & editing, M.H., A.P. and T.M.
Funding
This research received no external funding.
Acknowledgments
The authors would like to thank the German Research Foundation (DFG) for the kind support within the Cluster of Excellence “Internet of Production” (IoP). Project-ID 390621612.
Conflicts of Interest
The authors declare no conflict of interest.
References
- Hurwitz, J.S.; Nugent, A.; Halper, F.; Kaufman, M. Big Data for Dummies; John Wiley & Sons: Hoboken, NJ, USA, 2013. [Google Scholar]
- Pomp, A.; Paulus, A.; Kirmse, A.; Kraus, V.; Meisen, T. Applying semantics to reduce the time to analytics within complex heterogeneous infrastructures. Technologies 2018, 6, 86. [Google Scholar] [CrossRef]
- Clark, C.A.; Divvala, S.K. Looking Beyond Text: Extracting Figures, Tables and Captions from Computer Science Papers. In Proceedings of the AAAI Workshop: Scholarly Big Data, Austin, TX, USA, 25–26 January 2015. [Google Scholar]
- Clark, C.; Divvala, S. PDFFigures 2.0: Mining Figures from Research Papers. In Proceedings of the IEEE/ACM Joint Conference on Digital Libraries, Newark, NJ, USA, 19–23 June 2016; pp. 143–152. [Google Scholar]
- Siegel, N.; Lourie, N.; Power, R.; Ammar, W. Extracting scientific figures with distantly supervised neural networks. In Proceedings of the 18th ACM/IEEE on Joint Conference on Digital Libraries, Fort Worth, TX, USA, 3–7 June 2018; pp. 223–232. [Google Scholar]
- Doerfel, S.; Jäschke, R.; Hotho, A.; Stumme, G. Leveraging Publication Metadata and Social Data into FolkRank for Scientific Publication Recommendation. In Proceedings of the 4th ACM RecSys Workshop on Recommender Systems and the Social Web, New York, NY, USA, 9 September 2012; pp. 9–16. [Google Scholar]
- Thiele, T.; Jooß, C.; Richert, A.; Jeschke, S. Terminology based visualization of interfaces in interdisciplinary research networks. In Proceedings of the 19th Triennial Congress of the IEA, Melbourne, Australia, 9–14 August 2015. [Google Scholar]
- Potthast, M.; Stein, B.; Barrón-Cedeño, A.; Rosso, P. An Evaluation Framework for Plagiarism Detection. In Proceedings of the 23rd International Conference on Computational Linguistics: Posters, Association for Computational Linguistics, Stroudsburg, PA, USA, 23–27 August 2010; pp. 997–1005. [Google Scholar]
- Santosh, K.; Belaïd, A. Client-driven content extraction associated with table. arXiv 2013, arXiv:1304.1930. [Google Scholar]
- Santosh, K.; Belaïd, A. Document information extraction and its evaluation based on client’s relevance. In Proceedings of the 2013 12th International Conference on Document Analysis and Recognition, Washington, DC, USA, 25–28 August 2013; pp. 35–39. [Google Scholar]
- Santosh, K. g-DICE: Graph mining-based document information content exploitation. Int. J. Doc. Anal. Recog. (IJDAR) 2015, 18, 337–355. [Google Scholar] [CrossRef]
- Scharpf, P.; Schubotz, M.; Cohl, H.; Gipp, B. Towards Formula Concept Discovery and Recognition. In Proceedings of the 4th Joint Workshop on Bibliometric-enhanced Information Retrieval and Natural Language Processing for Digital Libraries (BIRNDL 2019) held in conjunction with the 42nd International ACM SIGIR Conference on Research and Development in Information Retrieval (SIGIR 2019), Paris, France, 25 July 2019. [Google Scholar]
- Scharpf, P.; Mackerracher, I.; Schubotz, M.; Beel, J.; Breitinger, C.; Gipp, B. AnnoMathTeX—A Formula Identifier Annotation Recommender System for STEM Documents. In Proceedings of the 13th ACM Conference on Recommender Systems (RecSys 2019), Copenhagen, Denmark, 16–20 September 2019. [Google Scholar]
- Schubotz, M.; Greiner-Petter, A.; Scharpf, P.; Meuschke, N.; Cohl, H.S.; Gipp, B. Improving the Representation and Conversion of Mathematical Formulae by Considering Their Textual Context. In Proceedings of the 18th ACM/IEEE on Joint Conference on Digital Libraries, New York, NY, USA, 3–7 June 2018; pp. 233–242. [Google Scholar]
- Groza, T.; Handschuh, S.; Möller, K.; Decker, S. SALT—Semantically Annotated LaTeX for Scientific Publications. In The Semantic Web: Research and Applications; Franconi, E., Kifer, M., May, W., Eds.; Springer: Berlin/Heidelberg, Germany, 2007; pp. 518–532. [Google Scholar]
- Groza, T.; Schutz, A.; Handschuh, S. SALT: A semantic approach for generating document representations. In Proceedings of the 2007 ACM Symposium on Document Engineering, Winnipeg, MB, Canada, 28–31 August 2007; pp. 171–173. [Google Scholar]
- Constantin, A.; Peroni, S.; Pettifer, S.; Shotton, D.; Vitali, F. The document components ontology (DoCO). Semant. Web 2016, 7, 167–181. [Google Scholar] [CrossRef]
- Praczyk, P.A.; Nogueras-Iso, J. Automatic Extraction of Figures from Scientific Publications in High-Energy Physics. Inf. Technol. Lib. 2013, 32, 25–52. [Google Scholar] [CrossRef]
- Li, M.; Cui, L.; Huang, S.; Wei, F.; Zhou, M.; Li, Z. TableBank: Table Benchmark for Image-based Table Detection and Recognition. arXiv 2019, arXiv:1903.01949. [Google Scholar]
- Xie, S.; Girshick, R.; Dollár, P.; Tu, Z.; He, K. Aggregated residual transformations for deep neural networks. In Proceedings of the IEEE Conference on Computer Vision and Pattern Recognition, Honolulu, HI, USA, 21–26 July 2017; pp. 1492–1500. [Google Scholar]
- Long, J.; Shelhamer, E.; Darrell, T. Fully Convolutional Networks for Semantic Segmentation. In Proceedings of the IEEE conference on computer vision and pattern recognition, Boston, MA, USA, 7–12 June 2015; pp. 3431–3440. [Google Scholar]
- Simonyan, K.; Zisserman, A. Very Deep Convolutional Networks for Large-scale Image Recognition. arXiv 2014, arXiv:1409.1556. [Google Scholar]
- Milletari, F.; Navab, N.; Ahmadi, S.A. V-net: Fully convolutional neural networks for volumetric medical image segmentation. In Proceedings of the 2016 Fourth International Conference on 3D Vision (3DV), Stanford, CA, USA, 25–28 October 2016; pp. 565–571. [Google Scholar]
- Girshick, R.; Radosavovic, I.; Gkioxari, G.; Dollár, P.; He, K. Detectron. 2018. Available online: https://github.com/facebookresearch/detectron (accessed on 11 September 2019).
Figure 1.
The pipeline that we use for processing PDF documents. First, each PDF document is converted into an image. Second, we extract the relevant document elements, such as figures, tables or algorithms. After detecting the different document elements, they have to be further classified and analyzed. After this additional information is extracted and recognized, we store it in a database and forward it to the data scientists. The results from the document element recognition are then used by data scientists for further analysis and processing.

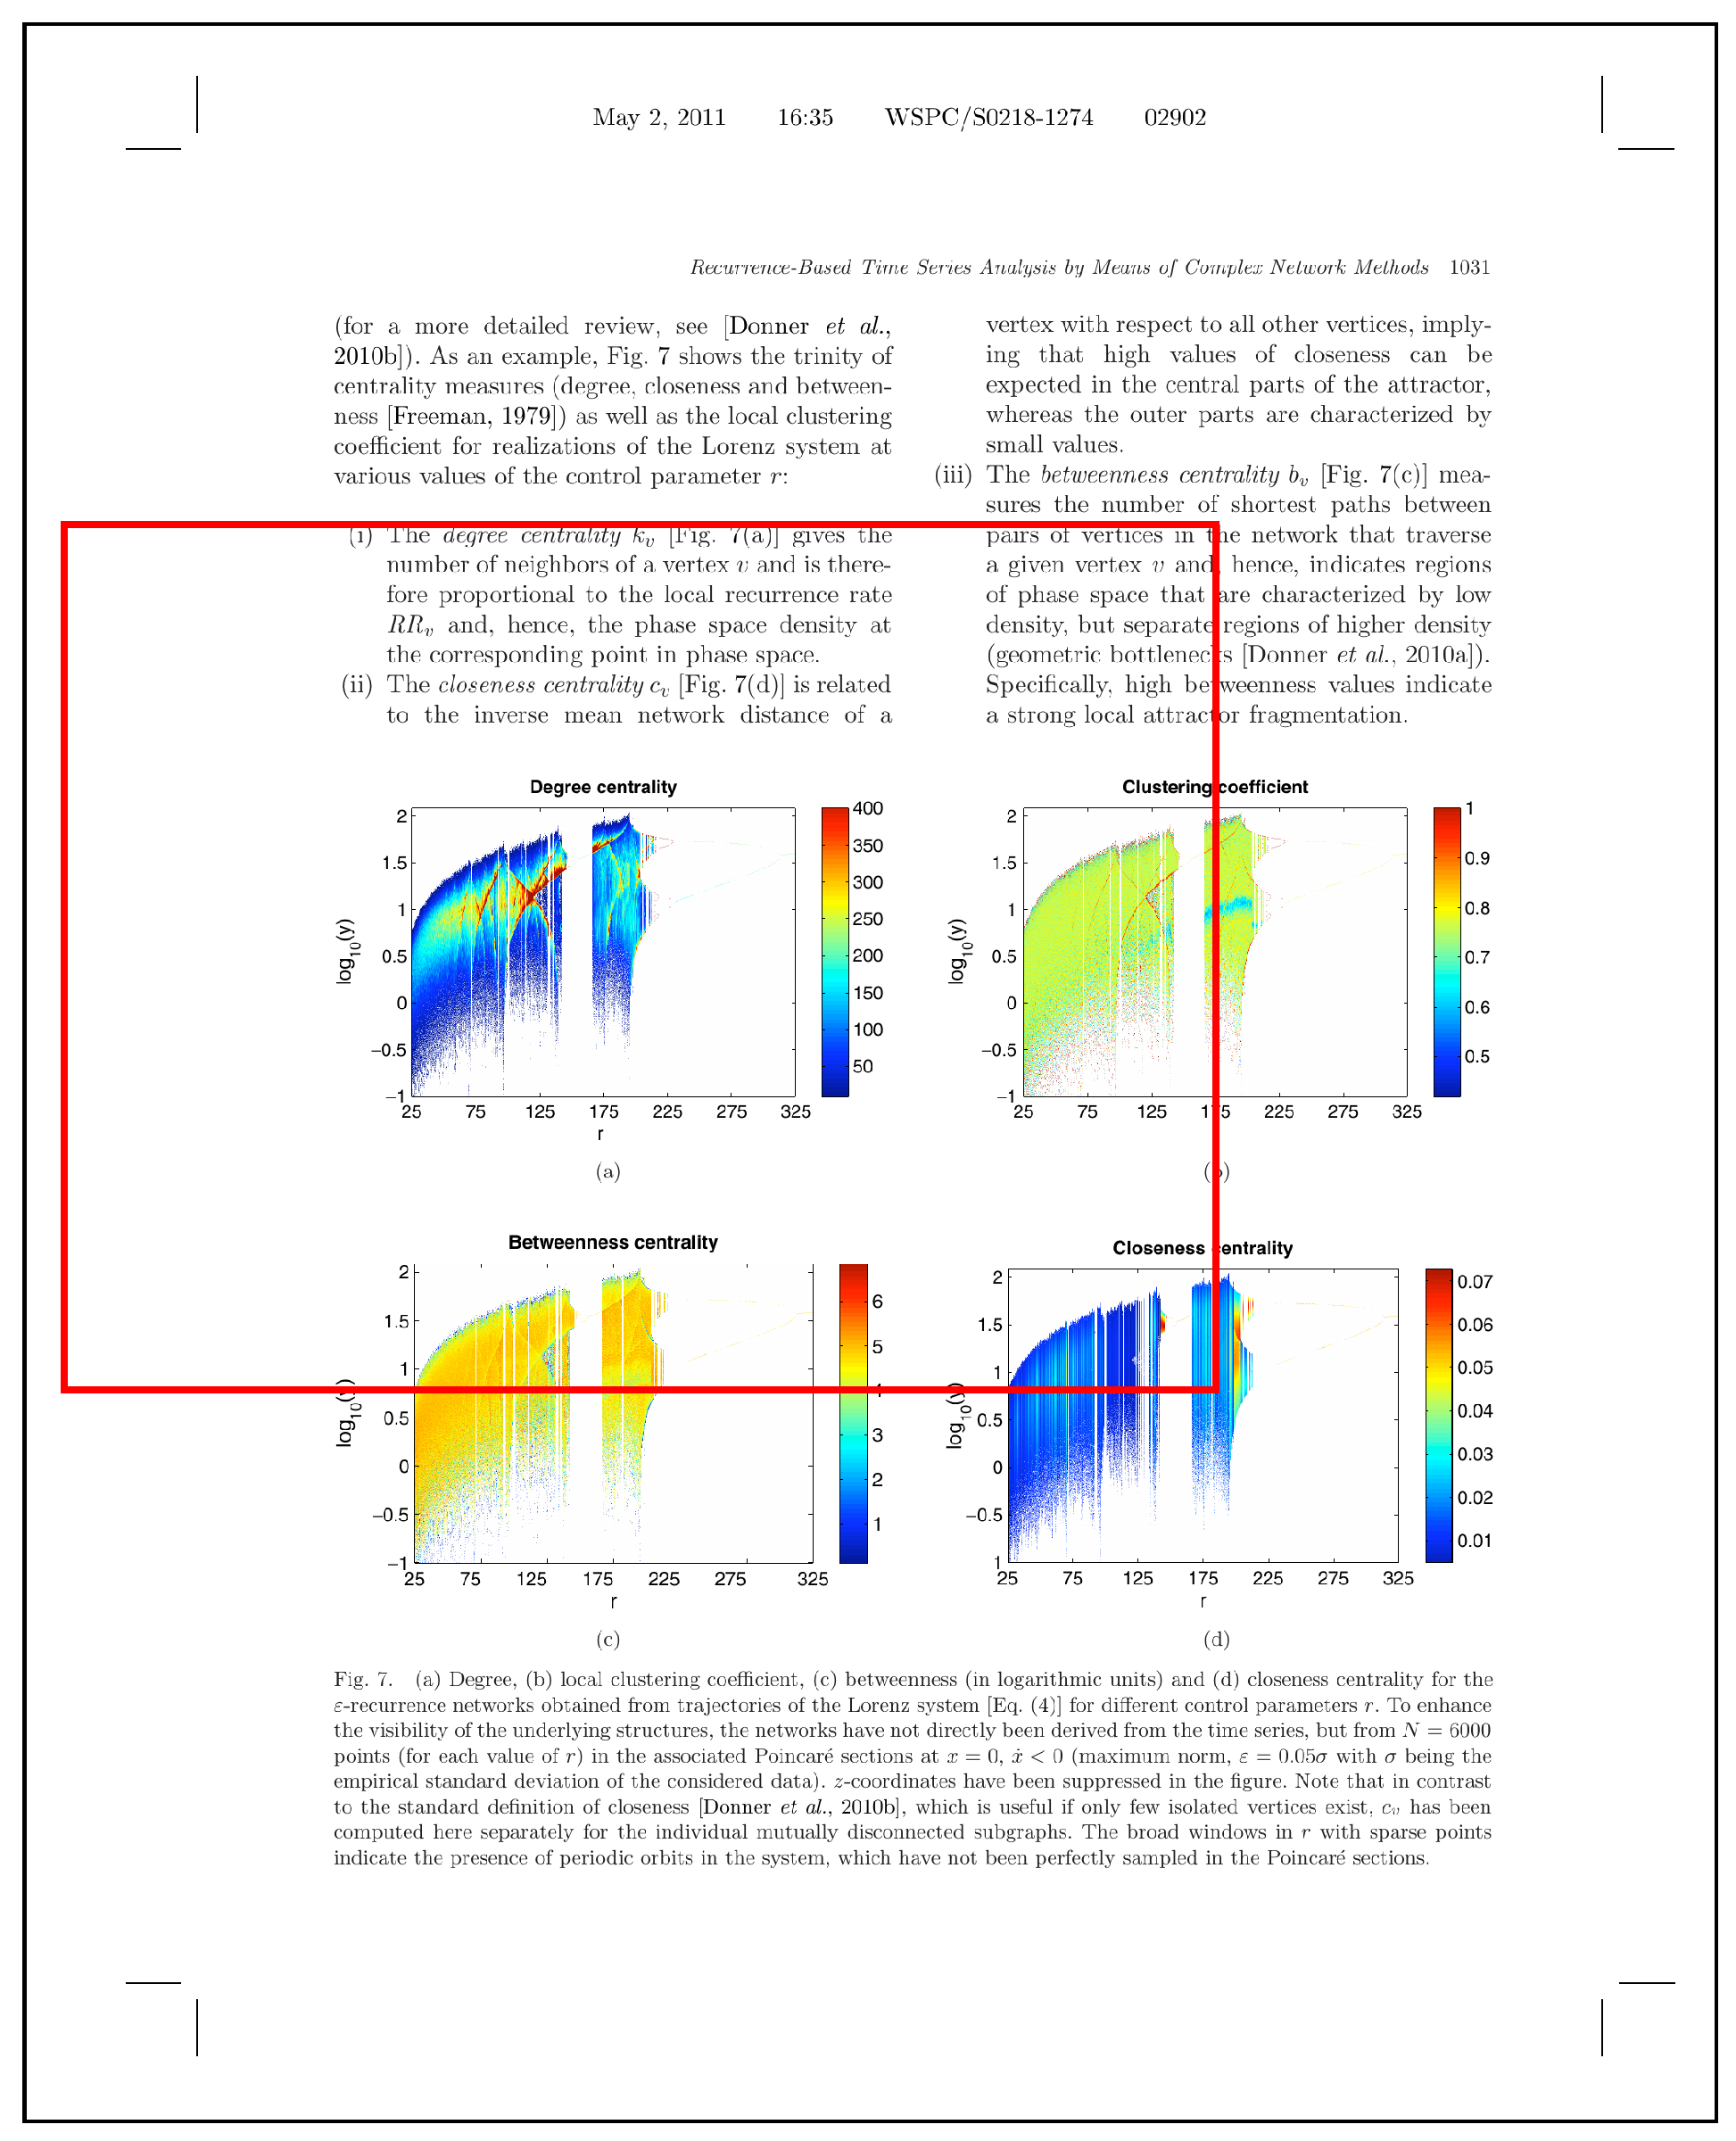
Figure 2.
Some annotated examples from the CS-Large corpus [4]. Table annotations in blue, figure annotations in red. Subfigure (a) shows a document with three tables. One of them is annotated as a table, one as a figure and one is not annotated at all because the annotated type follows the caption of the figures in the document. Subfigure (b) shows a document with three data visualizations, which are annotated with a single bounding box. A similar case with tables is shown in Subfigure (c). Subfigures (d,e) show that the annotation of algorithms follows any additional captions they might have. An algorithm without a Figure or Table caption is not annotated. Finally, Subfigure (f) shows that items that have no caption starting with the word Figure or Table or similar are also not annotated.

Figure 3.
Intermediate outputs of the segmentation-based approach. In this case, the top right table was initially detected also as a figure and the networks did not detect the boundaries between some figures. However, with the knowledge of the tag positions, correct bounding boxes could nevertheless be detected. (a) original document; (b) heatmap figures; (c) heatmap tables; (d) heatmap tags; (e) initial boxes; (f) boxes post-processed.

Figure 4.
The Faster R-CNN Algorithm.

Figure 5.
One of the cases where the labels in CS-Large were obviously wrong and had to be corrected. These cases seem to be due to wrong scaling. However, they occur in multiple documents with a different scaling factor every time. The annotations do contain a “dpi” attribute, but applying scaling based on this attribute was not helpful for these cases.

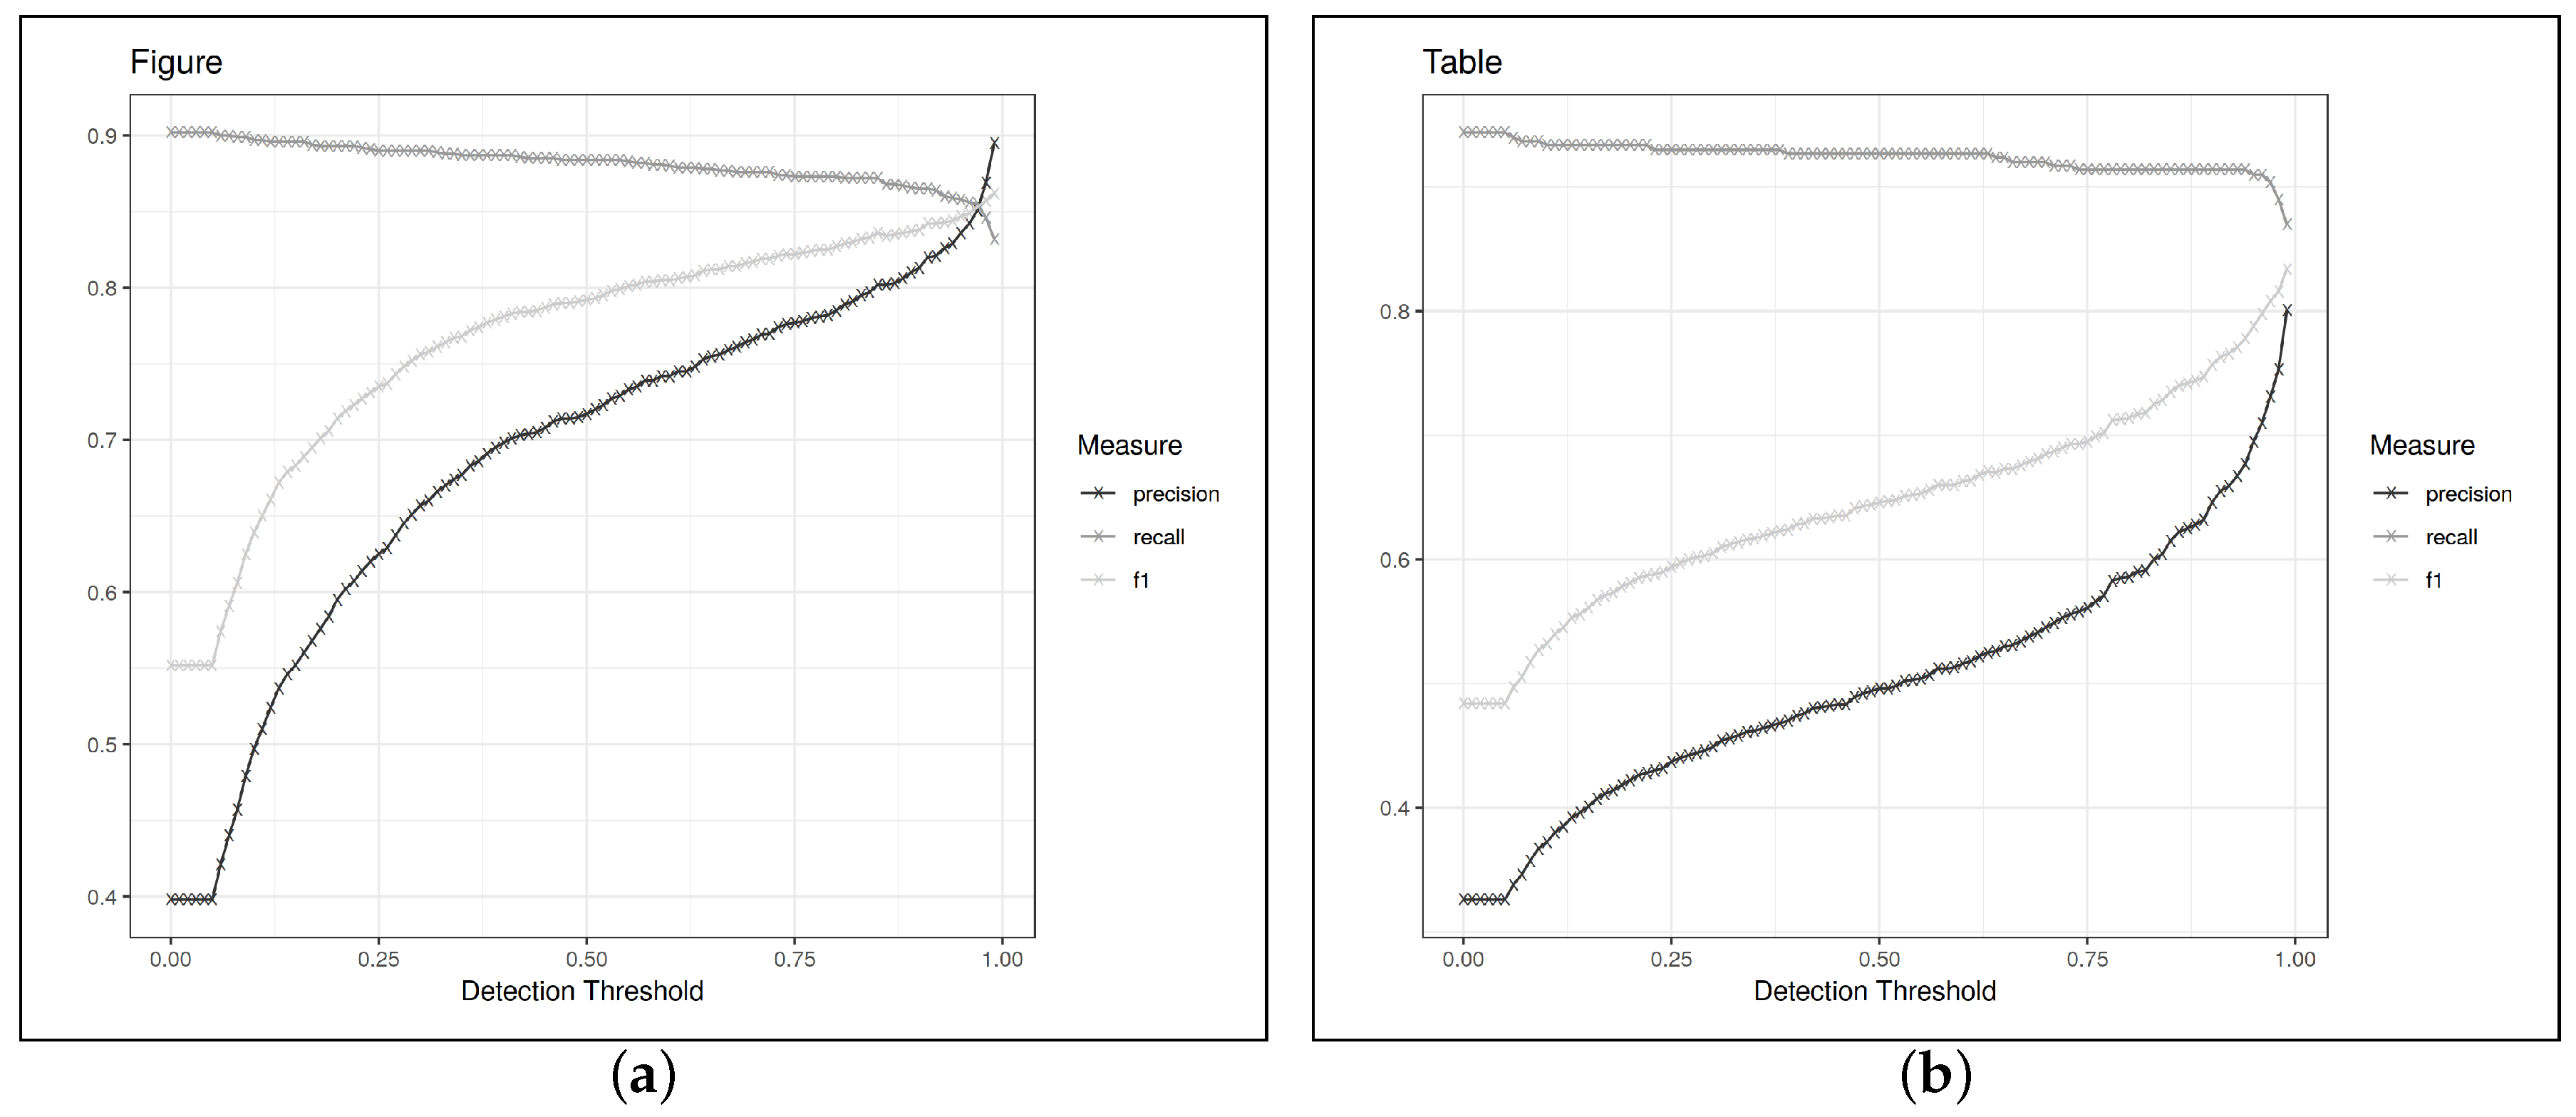
Figure 6.
Evaluation scores over different values of the confidence threshold. We can see that recall is almost constant in the interval [0, 97] and then sharply decreases. However, precision steadily increases. We therefore choose a value of roughly 0.97 for the confidence threshold, though the value is slightly different for the two different types of detected elements. (a) Figures; (b) Tables.

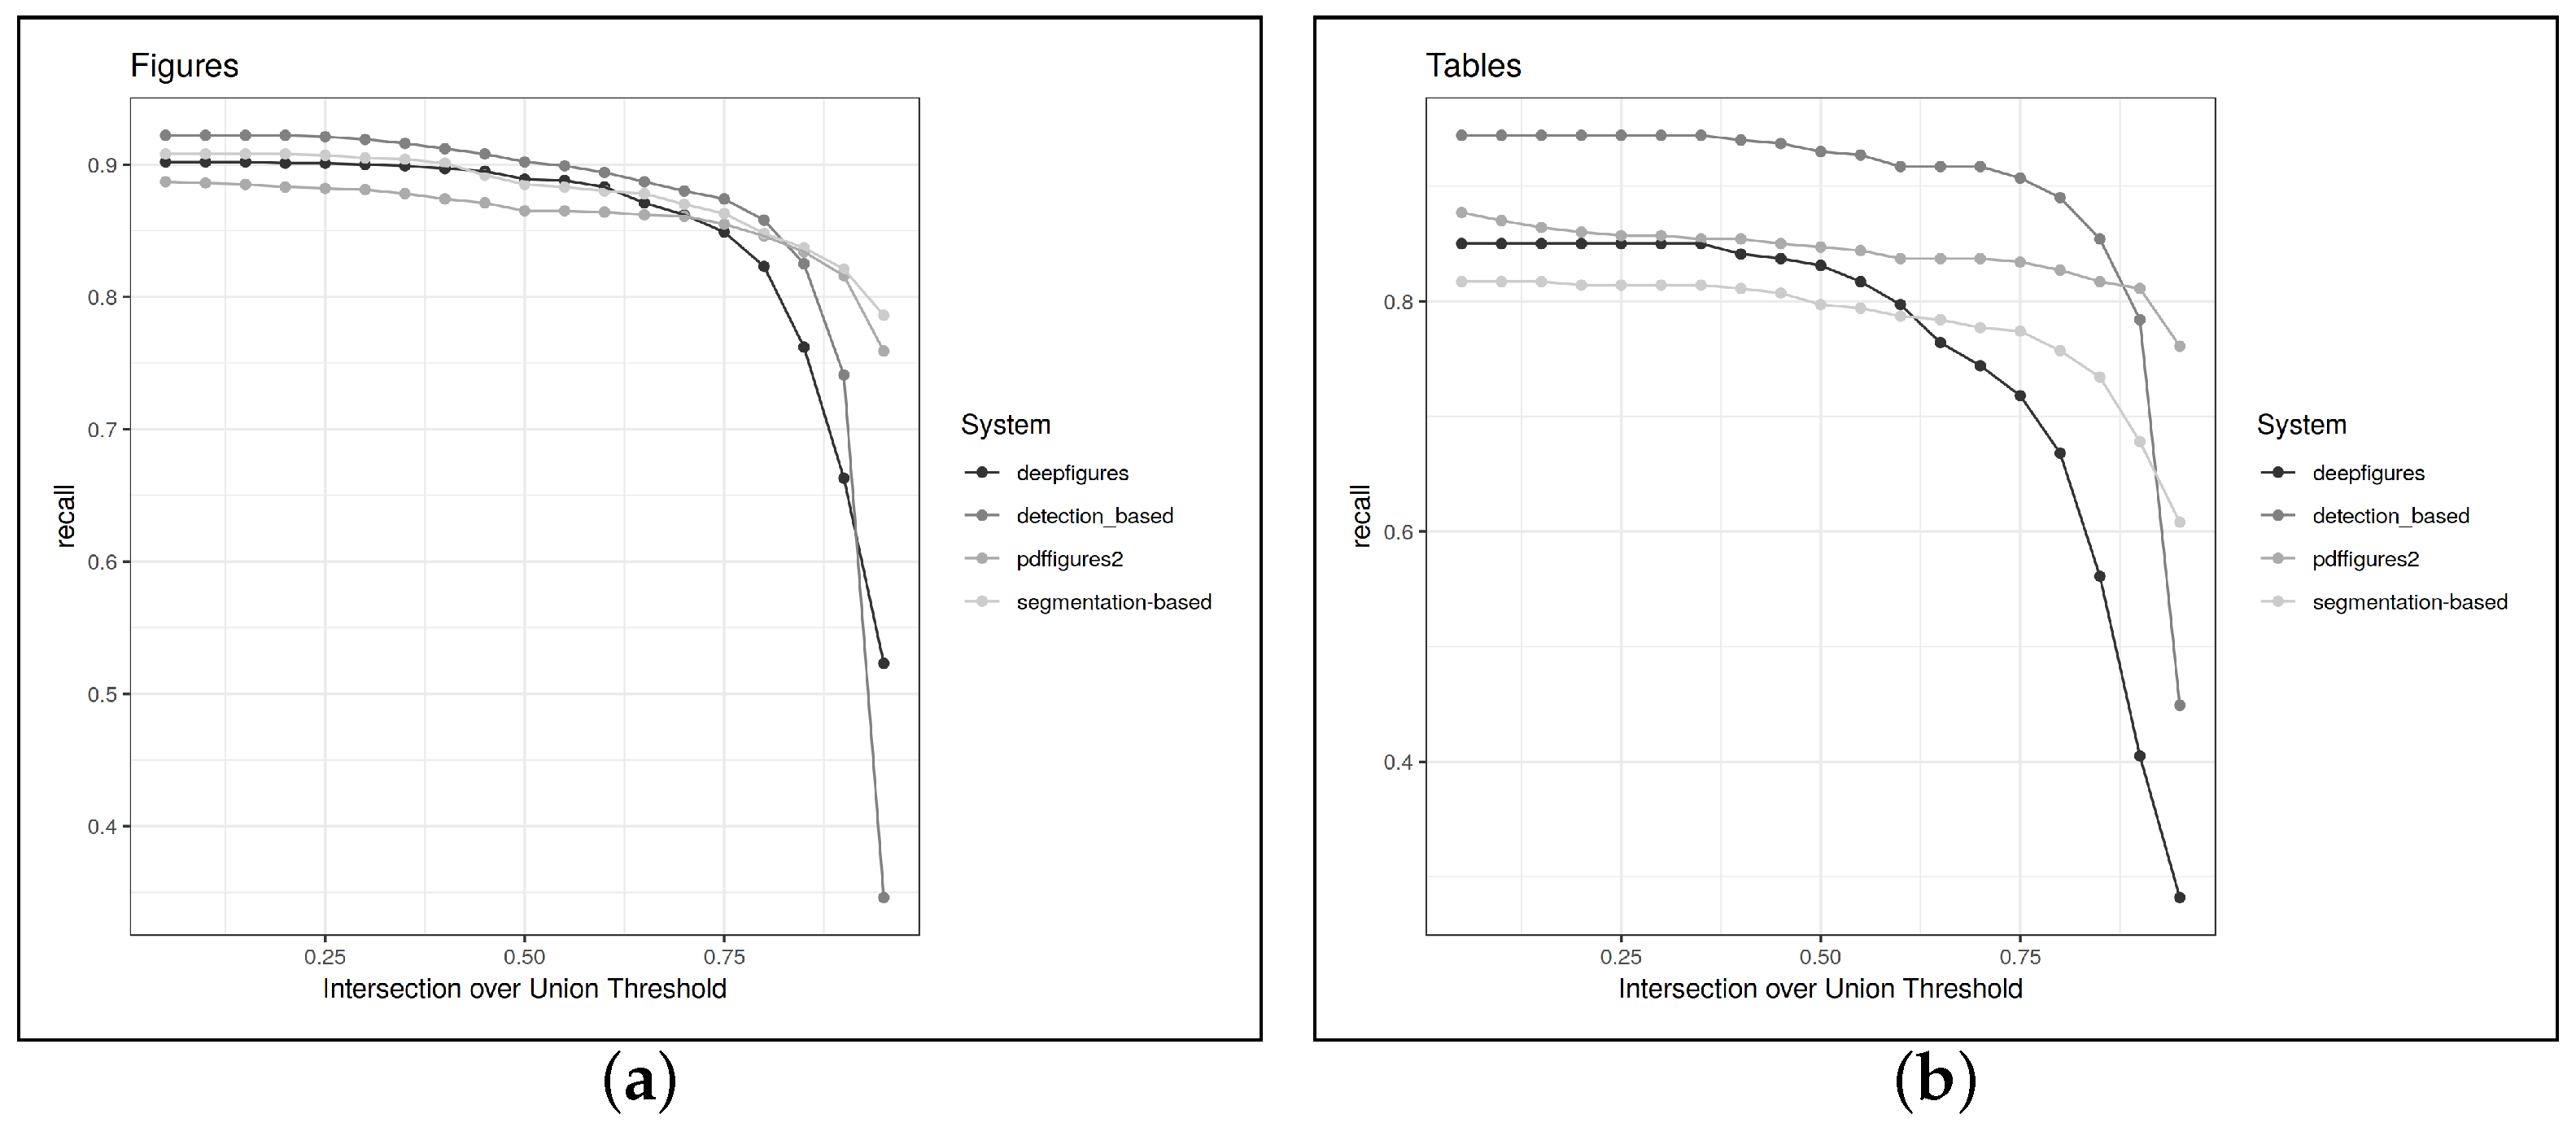
Figure 7.
Recall over different values for the correctness threshold. We can see that the segmentation-based system is similar to PDFFigures2 in that almost all of its detections are localized very precisely. Both, the object detection-based system and DeepFigures tend to detect many document elements, but are not as precisely. (a) Figures; (b) Tables.

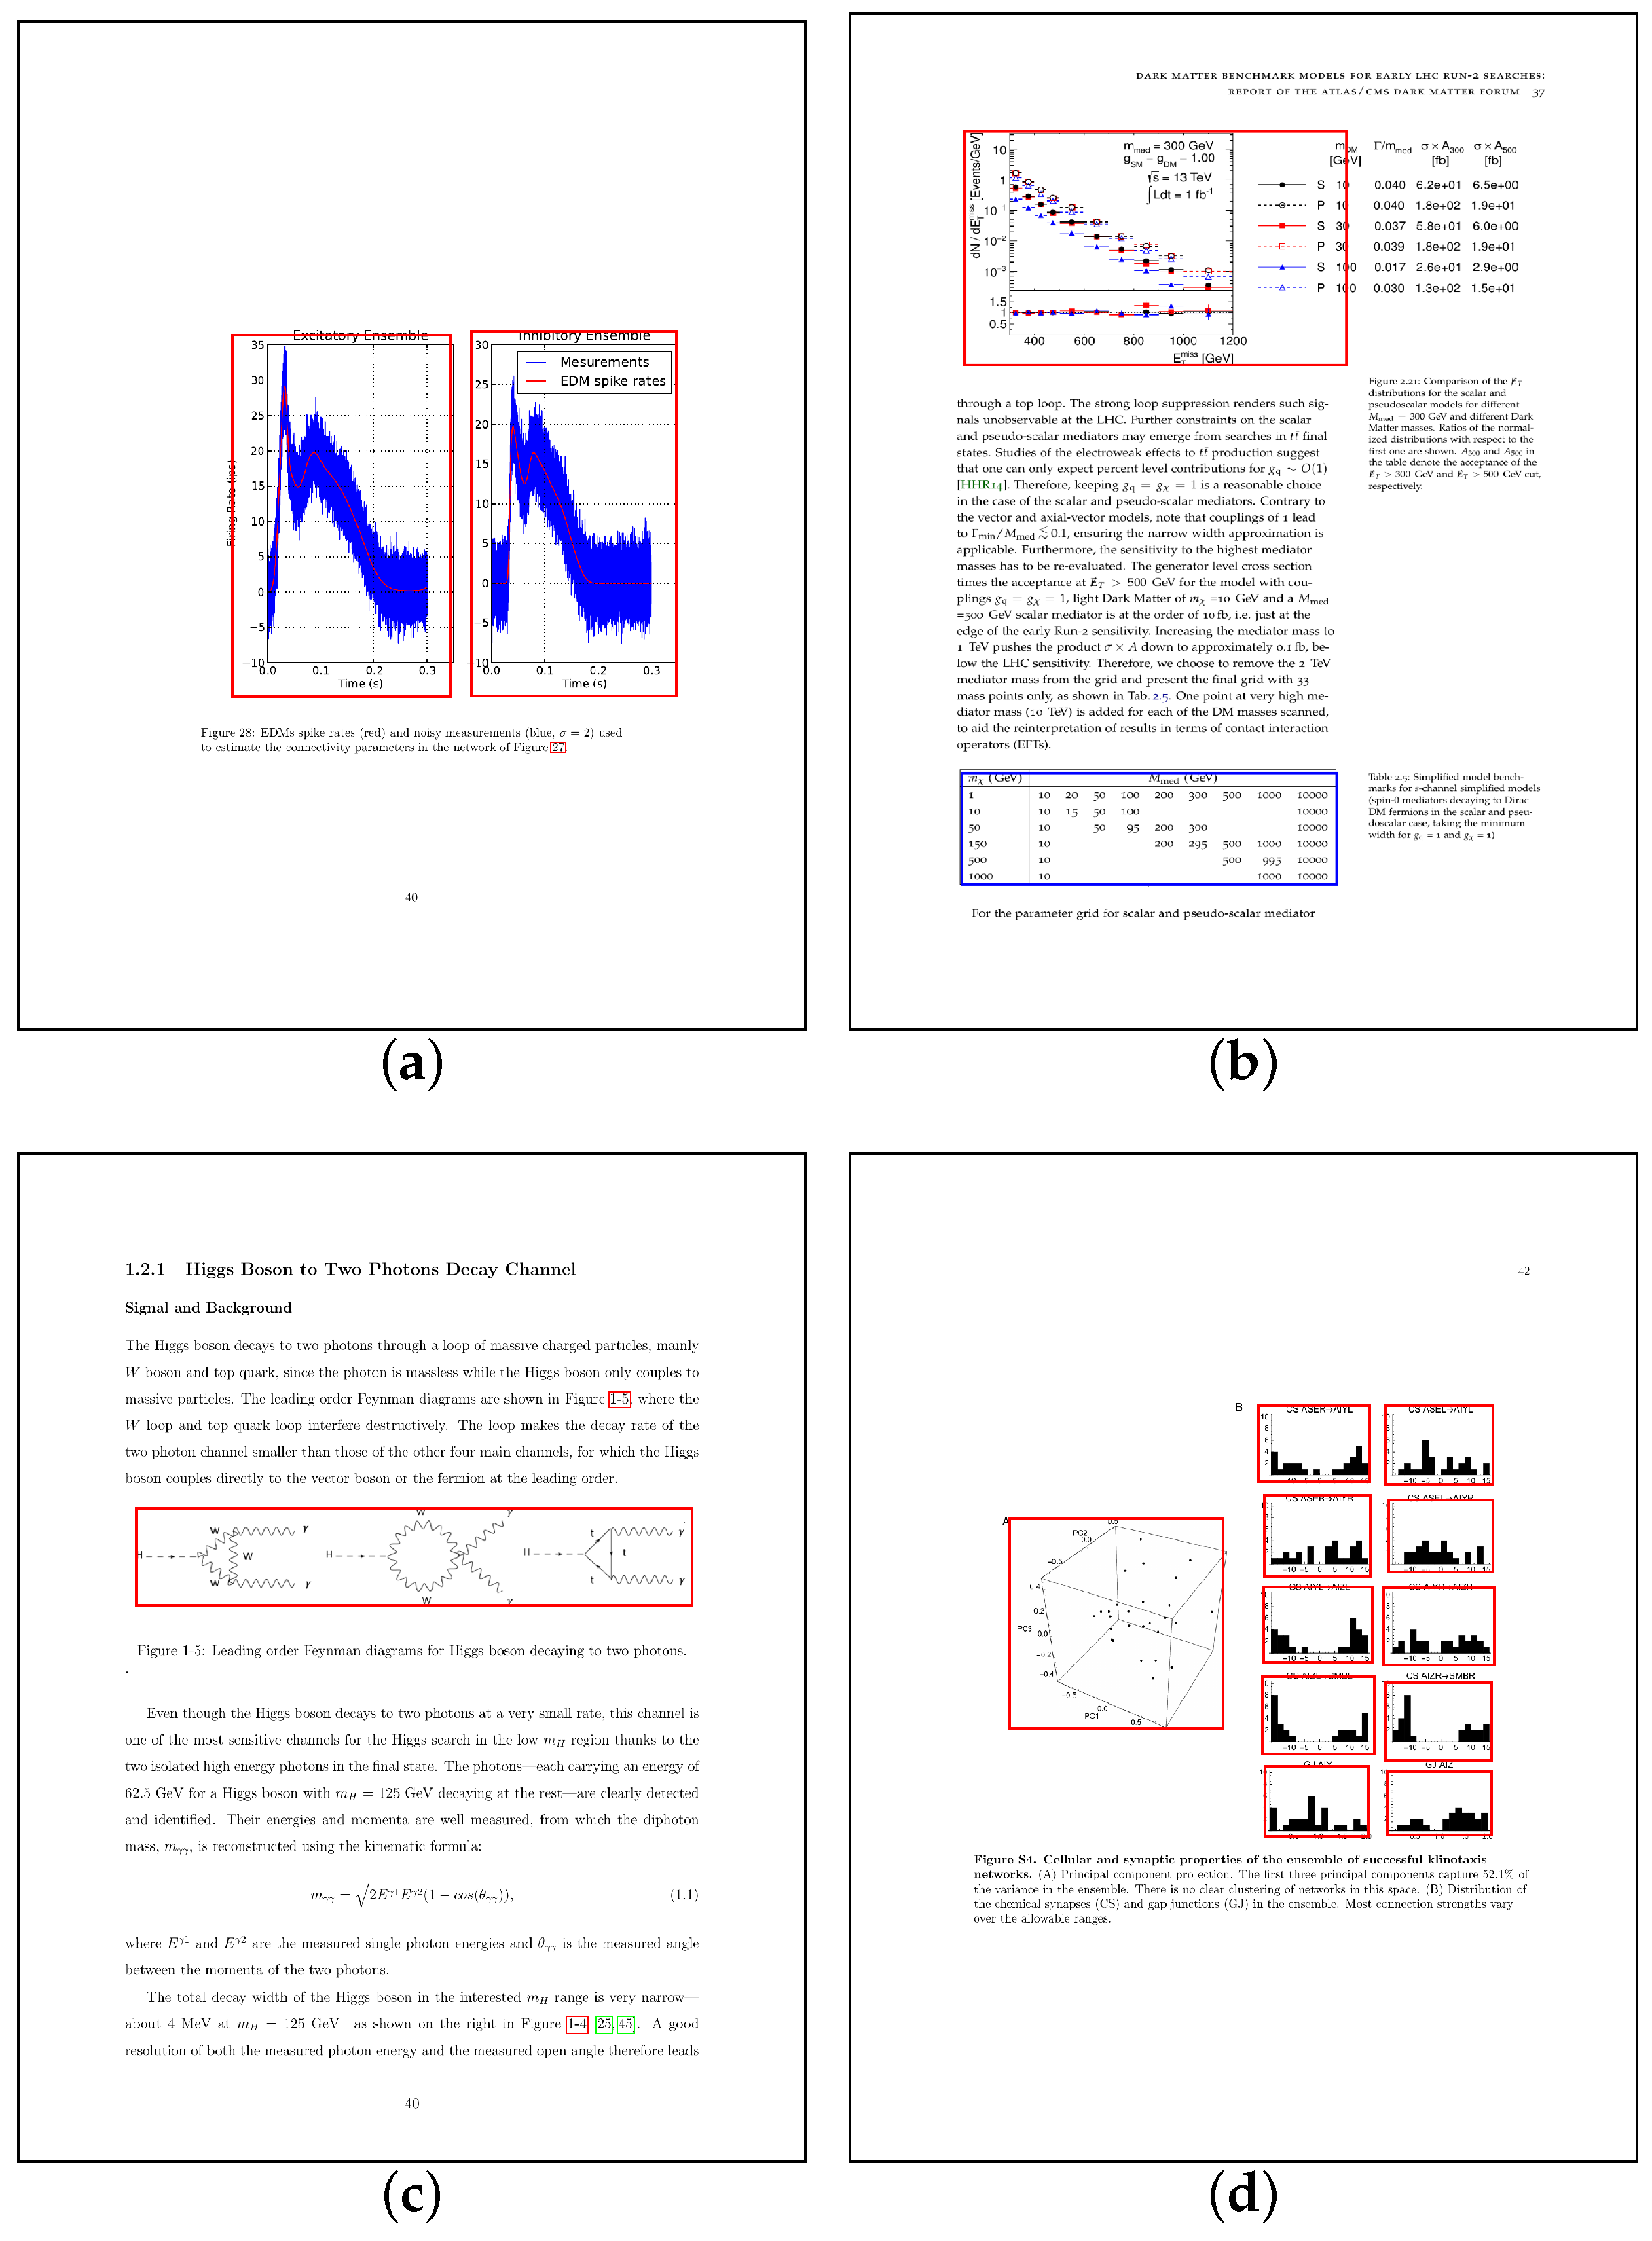
Figure 8.
Failure cases of the object detection-based system on the Mixed-Large corpus. (a) two figures; (b) additional text; (c) merged figures; (d) wrong locations.
Figure 8.
Failure cases of the object detection-based system on the Mixed-Large corpus. (a) two figures; (b) additional text; (c) merged figures; (d) wrong locations.

Figure 9.
Confusion matrix with respect to the classification performed when detecting document elements. The overall accuracy of the classification is 89.5%.
Figure 9.
Confusion matrix with respect to the classification performed when detecting document elements. The overall accuracy of the classification is 89.5%.


Table 1.
Composition of the corpus. We split the corpus up into canonical training and test sets document-wise because some documents contain several very similar figures and table styles. These portions of the corpus are referred to as Mixed-Large-Train and Mixed-Large-Test respectively.
Table 1.
Composition of the corpus. We split the corpus up into canonical training and test sets document-wise because some documents contain several very similar figures and table styles. These portions of the corpus are referred to as Mixed-Large-Train and Mixed-Large-Test respectively.
| Category | Mixed-Large Train | Mixed-Large Test | ||
|---|---|---|---|---|
| Pages | Documents | Pages | Documents | |
| SocArxiv | 3632 | 140 | 1501 | 59 |
| ChemRxiv | 2561 | 138 | 1114 | 59 |
| BioRxiv | 4114 | 140 | 1704 | 60 |
| ArXiv High-Energy Physics (Experiment) | 1262 | 70 | 856 | 30 |
| ArXiv Materials Science | 978 | 70 | 332 | 30 |
| ArXiv Quantitative Biology | 1242 | 70 | 803 | 30 |
| ArXiv Computer Vision | 944 | 70 | 535 | 30 |
| ArXiv Datastructures and Algorithms | 1589 | 70 | 616 | 30 |
| Company Annual Reports | 5791 | 35 | 2065 | 15 |
| sum | 22,113 | 803 | 9526 | 343 |
Table 2.
Results of running the evaluation on the CS-Large corpus. Note that the very good results reported for PDFFigures2 by Clark et al. [4] could apparently not be reproduced by Siegel et al. [5].
| System | Figures | Tables | ||||
|---|---|---|---|---|---|---|
| Precision | Recall | F1 | Precision | Recall | F1 | |
| PDFFigures2 [4] | 0.936 | 0.897 | 0.916 | 0.932 | 0.918 | 0.925 |
| PDFFigures2 [5] | – | – | 0.879 | – | – | – |
| PDFFigures2 (Repr) | 0.935 | 0.846 | 0.889 | 0.940 | 0.827 | 0.880 |
| DeepFigures [5] | – | – | 0.849 | – | – | – |
| DeepFigures (Repr) | 0.911 | 0.823 | 0.865 | 0.779 | 0.668 | 0.719 |
| Segmentation Based (Ours) | 0.825 | 0.848 | 0.837 | 0.781 | 0.757 | 0.769 |
| Detection Based (Ours) | 0.836 | 0.858 | 0.847 | 0.653 | 0.890 | 0.816 |
Table 3.
Results of running the evaluation on Mixed-Large-Test when presupposing the caption-oriented definition system.
Table 3.
Results of running the evaluation on Mixed-Large-Test when presupposing the caption-oriented definition system.
| Figures | Tables | |||||
|---|---|---|---|---|---|---|
| Precision | Recall | F1 | Precision | Recall | F1 | |
| PDFFigures2 | 0.897 | 0.562 | 0.686 | 0.819 | 0.158 | 0.265 |
| DeepFigures | 0.948 | 0.658 | 0.777 | 0.816 | 0.163 | 0.272 |
| Object Detection-based (Ours) | 0.825 | 0.86 | 0.842 | 0.786 | 0.932 | 0.853 |
Table 4.
Results of running the Evaluation on Mixed-Large-Test when presupposing the semantic-oriented definition system.
Table 4.
Results of running the Evaluation on Mixed-Large-Test when presupposing the semantic-oriented definition system.
| Figures | Tables | |||||
|---|---|---|---|---|---|---|
| Precision | Recall | F1 | Precision | Recall | F1 | |
| PDFFigures2 | 0.437 | 0.129 | 0.199 | 0.819 | 0.157 | 0.264 |
| DeepFigures | 0.481 | 0.154 | 0.233 | 0.816 | 0.162 | 0.270 |
| Segmentation-based (Ours) | 0.617 | 0.598 | 0.607 | 0.721 | 0.585 | 0.607 |
| Object Detection-based (Ours) | 0.727 | 0.800 | 0.762 | 0.796 | 0.934 | 0.860 |
© 2019 by the authors. Licensee MDPI, Basel, Switzerland. This article is an open access article distributed under the terms and conditions of the Creative Commons Attribution (CC BY) license (http://creativecommons.org/licenses/by/4.0/).
Share and Cite
MDPI and ACS Style
Hansen, M.; Pomp, A.; Erki, K.; Meisen, T. Data-Driven Recognition and Extraction of PDF Document Elements. Technologies 2019, 7, 65. https://0-doi-org.brum.beds.ac.uk/10.3390/technologies7030065
AMA Style
Hansen M, Pomp A, Erki K, Meisen T. Data-Driven Recognition and Extraction of PDF Document Elements. Technologies. 2019; 7(3):65. https://0-doi-org.brum.beds.ac.uk/10.3390/technologies7030065
Chicago/Turabian StyleHansen, Matthias, André Pomp, Kemal Erki, and Tobias Meisen. 2019. "Data-Driven Recognition and Extraction of PDF Document Elements" Technologies 7, no. 3: 65. https://0-doi-org.brum.beds.ac.uk/10.3390/technologies7030065
Note that from the first issue of 2016, this journal uses article numbers instead of page numbers. See further details here.