Article

Engineering Tests to Evaluate the Feasibility of an Emerging Solar Pavement Technology for Public Roads and Highways

1
Department of Electrical and Computer Engineering, Marquette University, Milwaukee, WI 53233, USA
2
Department of Civil, Construction and Environmental Engineering, Marquette University, Milwaukee, WI 53233, USA
3
Solar Roadways® Incorporated, N 3rd Ave, Sandpoint, ID 83864, USA
*
Author to whom correspondence should be addressed.
Submission received: 1 November 2019 / Revised: 16 January 2020 / Accepted: 17 January 2020 / Published: 21 January 2020

Abstract

:
Concrete and asphalt are the primary materials used to construct roadways for motor vehicles, paths for pedestrians and bicyclists, and runways for aircraft. Solar Roadways®, Inc. (SR) proposed a novel solar pavement technology (i.e., solar road panels (SRP)) as an alternative material and energy source. SR performed load, traction, and impact testing to use SRPs in non-critical applications like parking lots. To use SRP in public roads, engineering tests including freeze/thaw, moisture absorption, heavy vehicle, and shear testing were accomplished on “SR3” prototypes. Testing was performed at Marquette University in the Engineering Materials and Structural Testing Laboratory and the SR Pilot Project area. Moisture absorption and freeze/thaw tests showed “SR3” resistant to extreme weather and moisture environments. Heavy vehicle testing revealed no physical damage to the “SR3” after approximately 989,457 equivalent single axle loads were continuously rolled over a prototype pavement. Shear testing was conducted to investigate “SR3” laminate structure properties. In all cases, electrical failure was defined when “SR3” photovoltaic voltage dropped to zero volts. The maximum shear stress and applied torque for “SR3”’ (S/N’s Paver 1, 002B, 007C, and 004B) were 1756 kPa, 1835 kPa, 1643 kPa, 2023 kPa; and 121.2 kN·m, 131.3 kN·m, 117.6 kN·m, 144.8 kN·m, respectively. In addition, the “SR3” “heartbeat” light emitting diode (LED) remained operational (i.e., indicates computer bus traffic) in all phases of shear testing. Overall, the results show “SR3” prototypes to be robust, resilient, and functional when subjected to “real-world” test conditions.

1. Introduction

The importance of energy security cannot be understated with today’s global economy and the need for increased national security. For sustainable development and to reduce carbon emission renewable energy is becoming very widespread. Research and commercial implementation for harvesting electrical energy from the ambient environment has be done by different techniques, such as piezoelectric, thermoelectric and photovoltaics [1]. Among all these solar photovoltaic (PV) is a promising technology for its high-power density, around 1000 kW/m2. For every doubling of module shipment in terms of MWp (mega watt peak, a solar power measure in photovoltaic (PV) industry to describe a unit’s nominal power), there is 22.5% decrease in selling price [2]. In addition, cell efficiency of solar PV systems is increasing significantly [3,4]. These factors make the PV system one of the most desirable and suitable choices for a renewable energy source. Traditional photovoltaic based renewable energy systems require large swaths of land be dedicated to power generation and must be first cleared of vegetation. The loss of wild habitat and the presence of the panels and human activity may have deleterious effects upon wildlife that are not yet fully understood. As a solution to this problem, it is possible to use the roadways (roadside lands and road pavements) for harvesting solar energy. Additionally, solar PV system are decentralized. Decentralized power production and microgrids are far more secure and sustainable methods of power production as compared to any centralized power source, even centralized solar arrays.
Shekhar et al. studied the economic viability of dedicated solar (roadside solar infrastructure, not solar pavements) powered light emitting diode (LED) lighting in roadways [5]. According to their study, solar PV based systems provide 13% lower power consumption but 37% higher installation cost than current non-LED lighting. However as estimated by international technology roadmap for photovoltaic (ITRPV), when the module cost falls below 1 USD/Wp, overall installation cost will be significantly reduced [2] There have been several practical studies done on solar-powered roadside units such as road surveillance systems, traffic signal systems etc. [6,7,8,9]. Using infrastructure integrated PV (IIPV) to power roadway loads (road surveillance systems, traffic signal systems, roadside lights etc.) will minimize grid dependence along with reduction in distribution losses and requirements for copper [5,10]. However, the above-mentioned roadway energy harvesting technologies (including roadside solar PV system) are mostly thermal solar and/or have low power capabilities. To meet the power need for sustainable electrification of public transport systems, large scale PV systems are needed [11]. This will require greater land area than current infrastructure integrated PV (IIPV) systems.
Roadways are major civil structures for transportation. Transportation systems use 20–25% of the world’s total energy production and are one of the prime sources of CO2 emission. There is increasing demand to compensate for this environmental damage. Research is ongoing to harness green energy from pavements themselves. Road surfaces absorb approximately 40 MJ/m2 of solar radiation energy per day on average in summertime [12,13]. In addition to that a significant part of the energy released by vehicles is transferred to pavements mechanically. Approximately 15–21% of the energy produced by a vehicle is transferred to the vehicle’s wheels [14,15], which indicates a significant amount of energy released by vehicles in the form of heat is transferred to the pavements without being used. These are sources of energy, which can be converted to electricity or other forms of energy, such as thermal energy [16,17]. There have been several studies done on pavements as solar heat collectors [18,19,20]. Piezoelectric technology has been implemented on roadways pavement to harness energy from vehicle vibration [21,22,23]. Furthermore, the potential of roadway pavement- based PV system is highly recognized [24]. Researchers from the Korea Institute of Construction Technology (KICT), investigated the possibility of harvesting solar energy by embedding solar cells in pavement infrastructure [25]. They reported that current thin film PV cells are not suitable to be used in pavement because of premature corrosion and wear due to mechanical load and environmental conditions. This indicates the need for a new of solar cell design to overcome these problems. Northmore et al. (2012) at Waterloo University use laminated, tempered, and textured glass to strengthen solar panel to put it in pavement applications [26].
The first implementation of PV cells in pavements (i.e., SR1) in the U.S was done by Solar Roadways®, Incorporated (SRI) [27]. In 2012 SRI improved the design and replaced the upper layer of the road pavement (i.e., SR2) [27]. SRI used engineered solar panels that can support traffic loads and produce electrical energy. Each panel has area 0.37 m2 and can produce 36 W. SRI then added LEDs to the prototype for illuminating road edge striping for improved safety while driving at night. To prevent ice/snow accumulation in winter/cold climates, SRI added a heating element (like the defrosting wire in the rear window of cars) on the surface of the module. Solar roadway “SR” can be thought of as an intelligent highway system that is equipped with microprocessor-based controller unit that can activate the LED lights and facilitate wireless communications. The upper layer of the prototype was patented in 2014 [28]. Brusaw stated that the conversion efficiency of the overall system was 11.2% [27].
In late 2014, a 70 m long cycling lane was covered with photovoltaic materials and opened to the public. The solar bike path generated 3000 kWh of electricity in the first six months of operation which is enough to power a single household for a year [29]. In December 2016, a one-kilometer road covered with resin-coated solar panels was opened for traffic in the French town of Tourouvre for generating electricity [30]. Shekhar et al. theoretically analyzed the operational challenges and performance parameters of infrastructure integrated photovoltaic (IIPV) bike paths, based on the experience of a pioneering 70-m solar bike path installed in the Netherlands [5,29]. They predicted that an energy yield of 85–90 kWh/m2 can be achieved in the specific site in Netherlands, although the measured data for yield is 78 kWh/m2 (SolaRoad, Nov. 2018). Model limitations, irradiance prediction error, unaccounted dynamic, and operational shutdown losses are expected factors for this discrepancy. With better technology such as using monocrystalline (MC) solar cells 142 kWh/m2 yields can be reached. They also concluded that this yield is location specific; for example, in Chicago, IL, USA the predicted yields are 139 and 193 kWh/m2 for polycrystalline and mono crystalline solar cell respectively.
Dezfooli et al. tested the feasibility of solar pavements as a sustainable source of electrical energy [31]. They tested two prototypes: one is entitled “solar panel” (solar cell embedded in rubber and Plexiglas) and other one is entitled as “solar pavements” (solar cell embedded between two porous rubber layers). Solar pavements show more than 13% higher skid resistance than solar panels both in wet and dry conditions. Placing a solar cell in a solar panel structure (between a transparent polycarbonate sheet and rubber) and solar pavement (between two rubber layers, top layer is porous) reduced power conversion efficiency (PCE) by 26% and 50% respectively in comparison with the reference cell. Adding a flexible rubber layer (solar pavement) made the system more resistant to structural failure (rutting and fatigues) while reducing the PCE value by 40%. It is worth mentioning some of the limitations of the above-mentioned works. For example, Dezfooli et al. have done flexural bending but not shear testing [31]. They reported that their prototype solar panel can withstand only 600 kPa for 60 s. But for practical roadway application the load will be much greater. Additionally, they tested their prototypes for only a few thousand load cycles for rutting and fatigue tests whereas millions of load testing cycles are required to meet typical roadway standards.
In this study we have conducted engineering tests to evaluate the feasibility of an emerging solar pavement technology for public roads and highways. Concrete and asphalt are the primary materials used to construct roadways for motor vehicles, bike paths for pedestrians and bicyclists, and runways for aircraft. Solar Roadways®, Inc. in Sandpoint, ID, proposed a novel solar pavement technology as an alternative roadway material and sustainable energy source. SR has been performing research on solar pavement technology since 2009. “SR3” is the unique and patented third generation of their solar pavement prototype. As mentioned above, there is a scarcity of research performed on solar pavement technology for roadway applications. At this point there is no defined test methodology or framework to test the performance of this new technology. Therefore, studies on new test methodologies, test fixtures, and testing technological advancement are critically needed. Solar Roadways®, Inc performed load testing, traction testing, and impact resistance testing to use their prototype in some non-critical applications such as driveways, parking lots, sidewalks, bike paths, etc. To use the prototype on public roads civil engineering testing is needed such as freeze/thaw cycling, moisture conditioning, heavy vehicle loading and shear testing. This study is a continuation of the research of Solar Roadways Solar Roadways®, Inc (SR). Combined with SR’s previous tests, this paper will give a framework (design of the test fixture and testing methodology) for engineering tests on solar pavement technologies. The purpose of the four engineering tests performed in this study are summarized below:
  • To investigate the mechanical and operational robustness of solar road panels (SRPs) in wet conditions, moisture conditioning test was conducted.
  • To assess mechanical and electrical functionality in real word conditions, the SRPs were exposed to repetitive cycling of temperature extremes.
  • To assess structural robustness (rutting, fatigue, fracture) of the SRPs under repetitive loading (as roadways are subjected to repetitive vehicle loads) heavy vehicle simulation (HVS) tests were conducted.
  • Shear testing was performed to determine the shear strength of the SRP composite and to evaluate the unit’s performance under vehicle deceleration.
The above four tests were performed on Solar Roadways “SR3” prototype panels or solar road panels (SRP). Testing was performed on the Marquette University (MU) campus in the Engineering Materials and Structural Testing Laboratory (EMSTL) and the SR Pilot Project area. Detailed results of the first three tests have already been published [32]. The remaining sections of this paper present the materials and prototypes (Section 2), a brief review of the first three engineering tests (Section 3 and Section 4), a detailed account of shear testing (Section 5), and the conclusions (Section 6) and acknowledgements.

2. Materials and Prototypes

In this project, prototype solar panels were manufactured by Solar Roadways®, Inc. using a proprietary process [27]. For pavement applications the solar pavement was expected to meet the following requirements, as described by Solar Roadway, Inc. in Sandpoint, ID [27]:
  • Capable of generating its own power from solar PV, solar thermal or vehicle vibration.
  • Facilitate the transferring, storing and distributing the generated power efficiently.
  • Be constructed of recycled or other sustainable materials.
  • Be modular in design so that damaged or worn section can be replaced quickly and easily.
  • Withstand repetitive heavy traffic loading and be structurally durable.
  • Meet or exceed safety standards of existing pavement systems.
  • Mitigate water runoff through either permeability or designed retention and filtration.
  • Be cost effective, i.e., the benefits of power generation and water runoff mitigation over the operational life outweigh its initial cost.
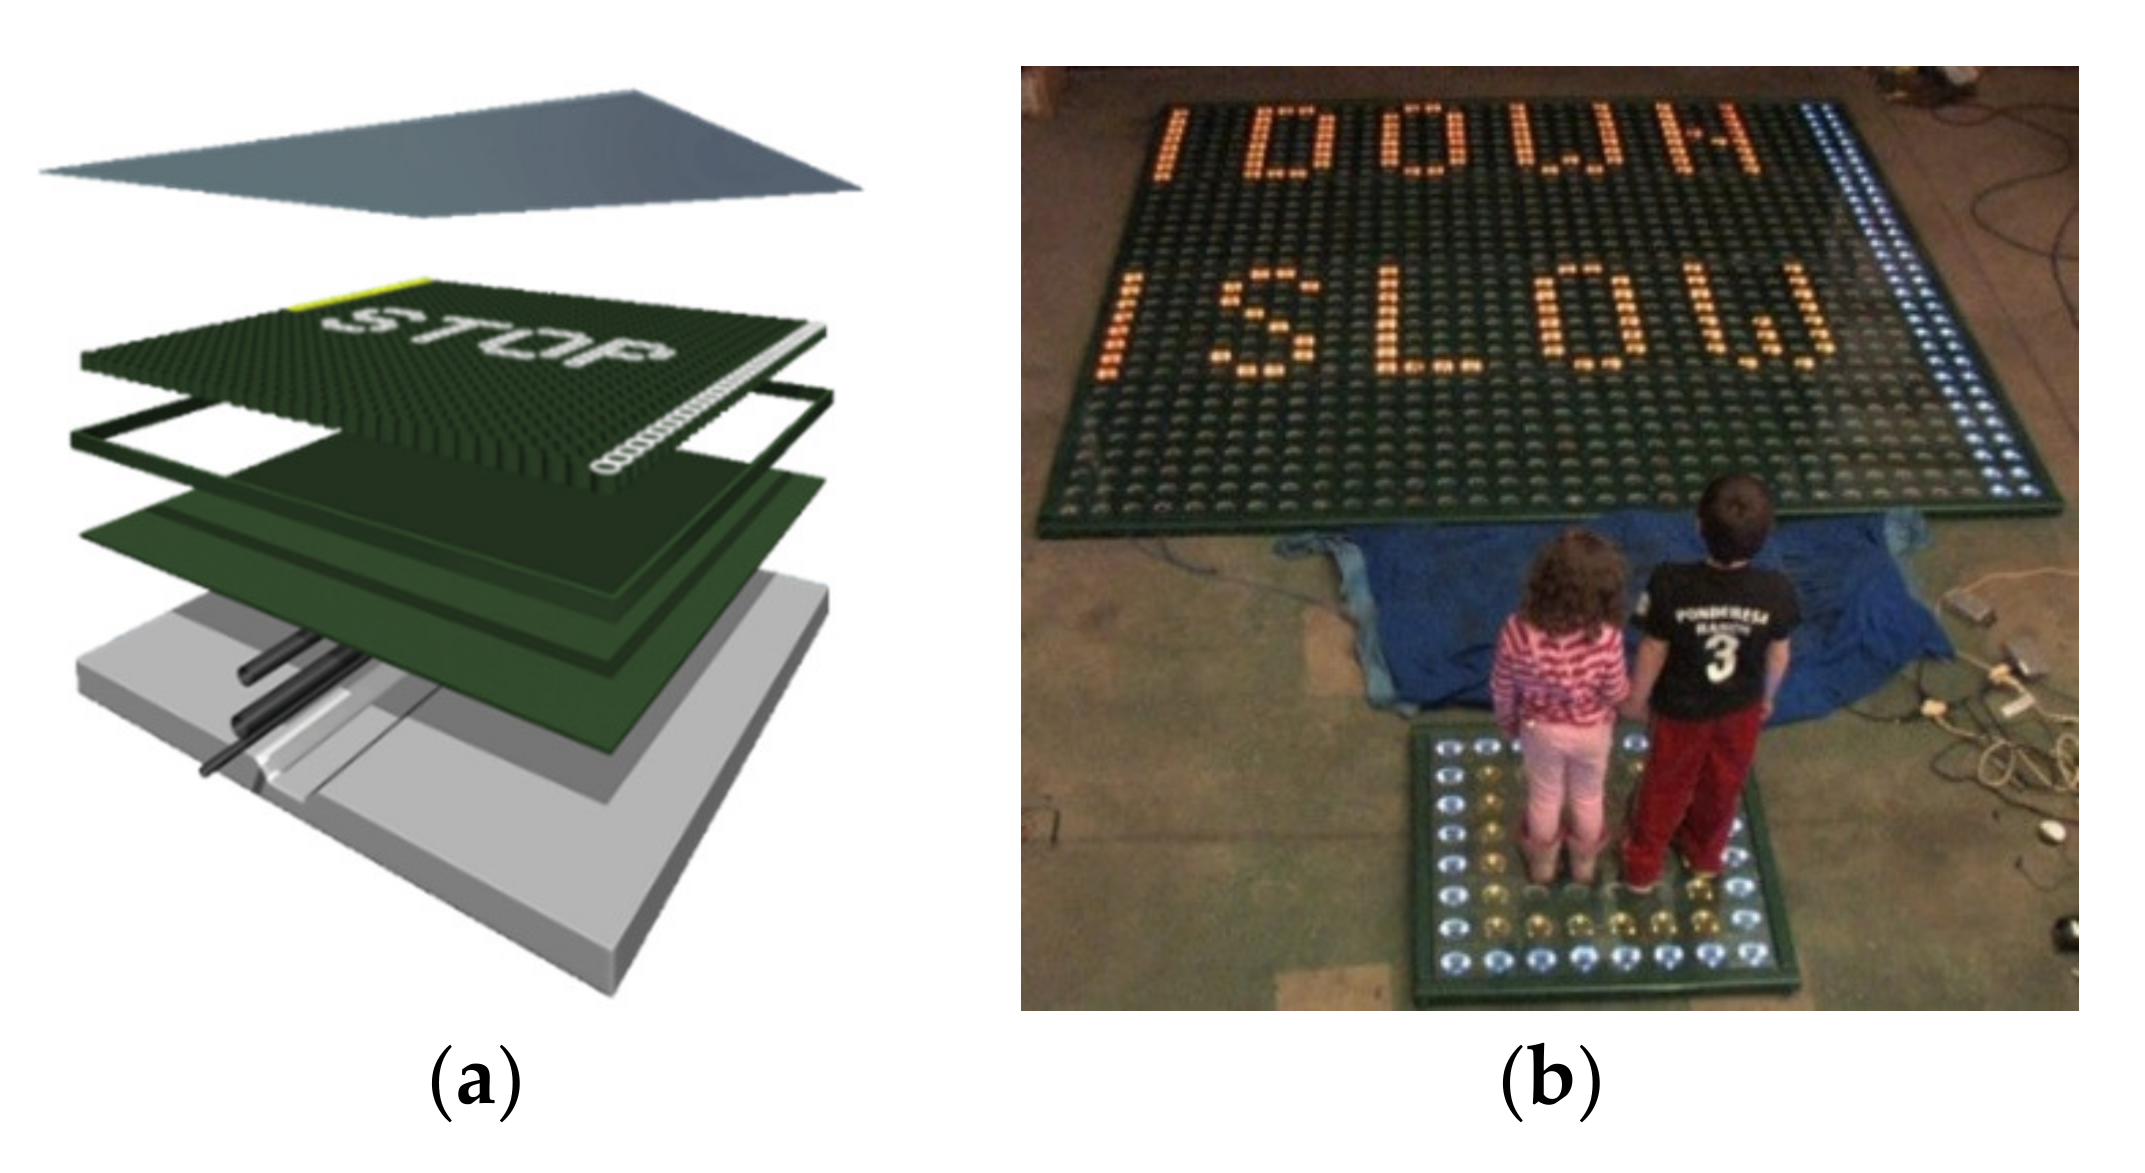
In the first prototype, “SR1” Solar Roadways®, Inc constructed a 3.66 m × 3.66 m (13.38 m2) panel array shown in Figure 1 below. To make a solar panel that could withstand the abuse of fully-loaded tractor trailers, a protective case had to be created to protect the sensitive solar cells and electronics inside. Additionally, the surface of this case had to be transparent to allow the sunlight to reach the solar cells inside. SRI decided to use glass for the surface according to the recommendation of Penn State’s Materials Research Institute and the University of Dayton’s Research Institute (Brusaw, 2016). Unlike plastic, the optical properties of glass are stable against solarization (long-term darkening) and other UV induced mechanisms of material degradation. Float glass was recommended due to its widespread commercial availability and relatively low cost. Float glass comes in different forms, one of which is soda Lyme glass that contains iron particles. The amount of iron content affects the transmittance (ability to pass sunlight) of the glass, so a low-iron glass was selected. The SR1 also contained LED and microprocessor circuitry. The SR1 was designed around a 32 × 32 array of LED cells. Each cell contains three white and three yellow LEDs to simulate road line paint configurations.
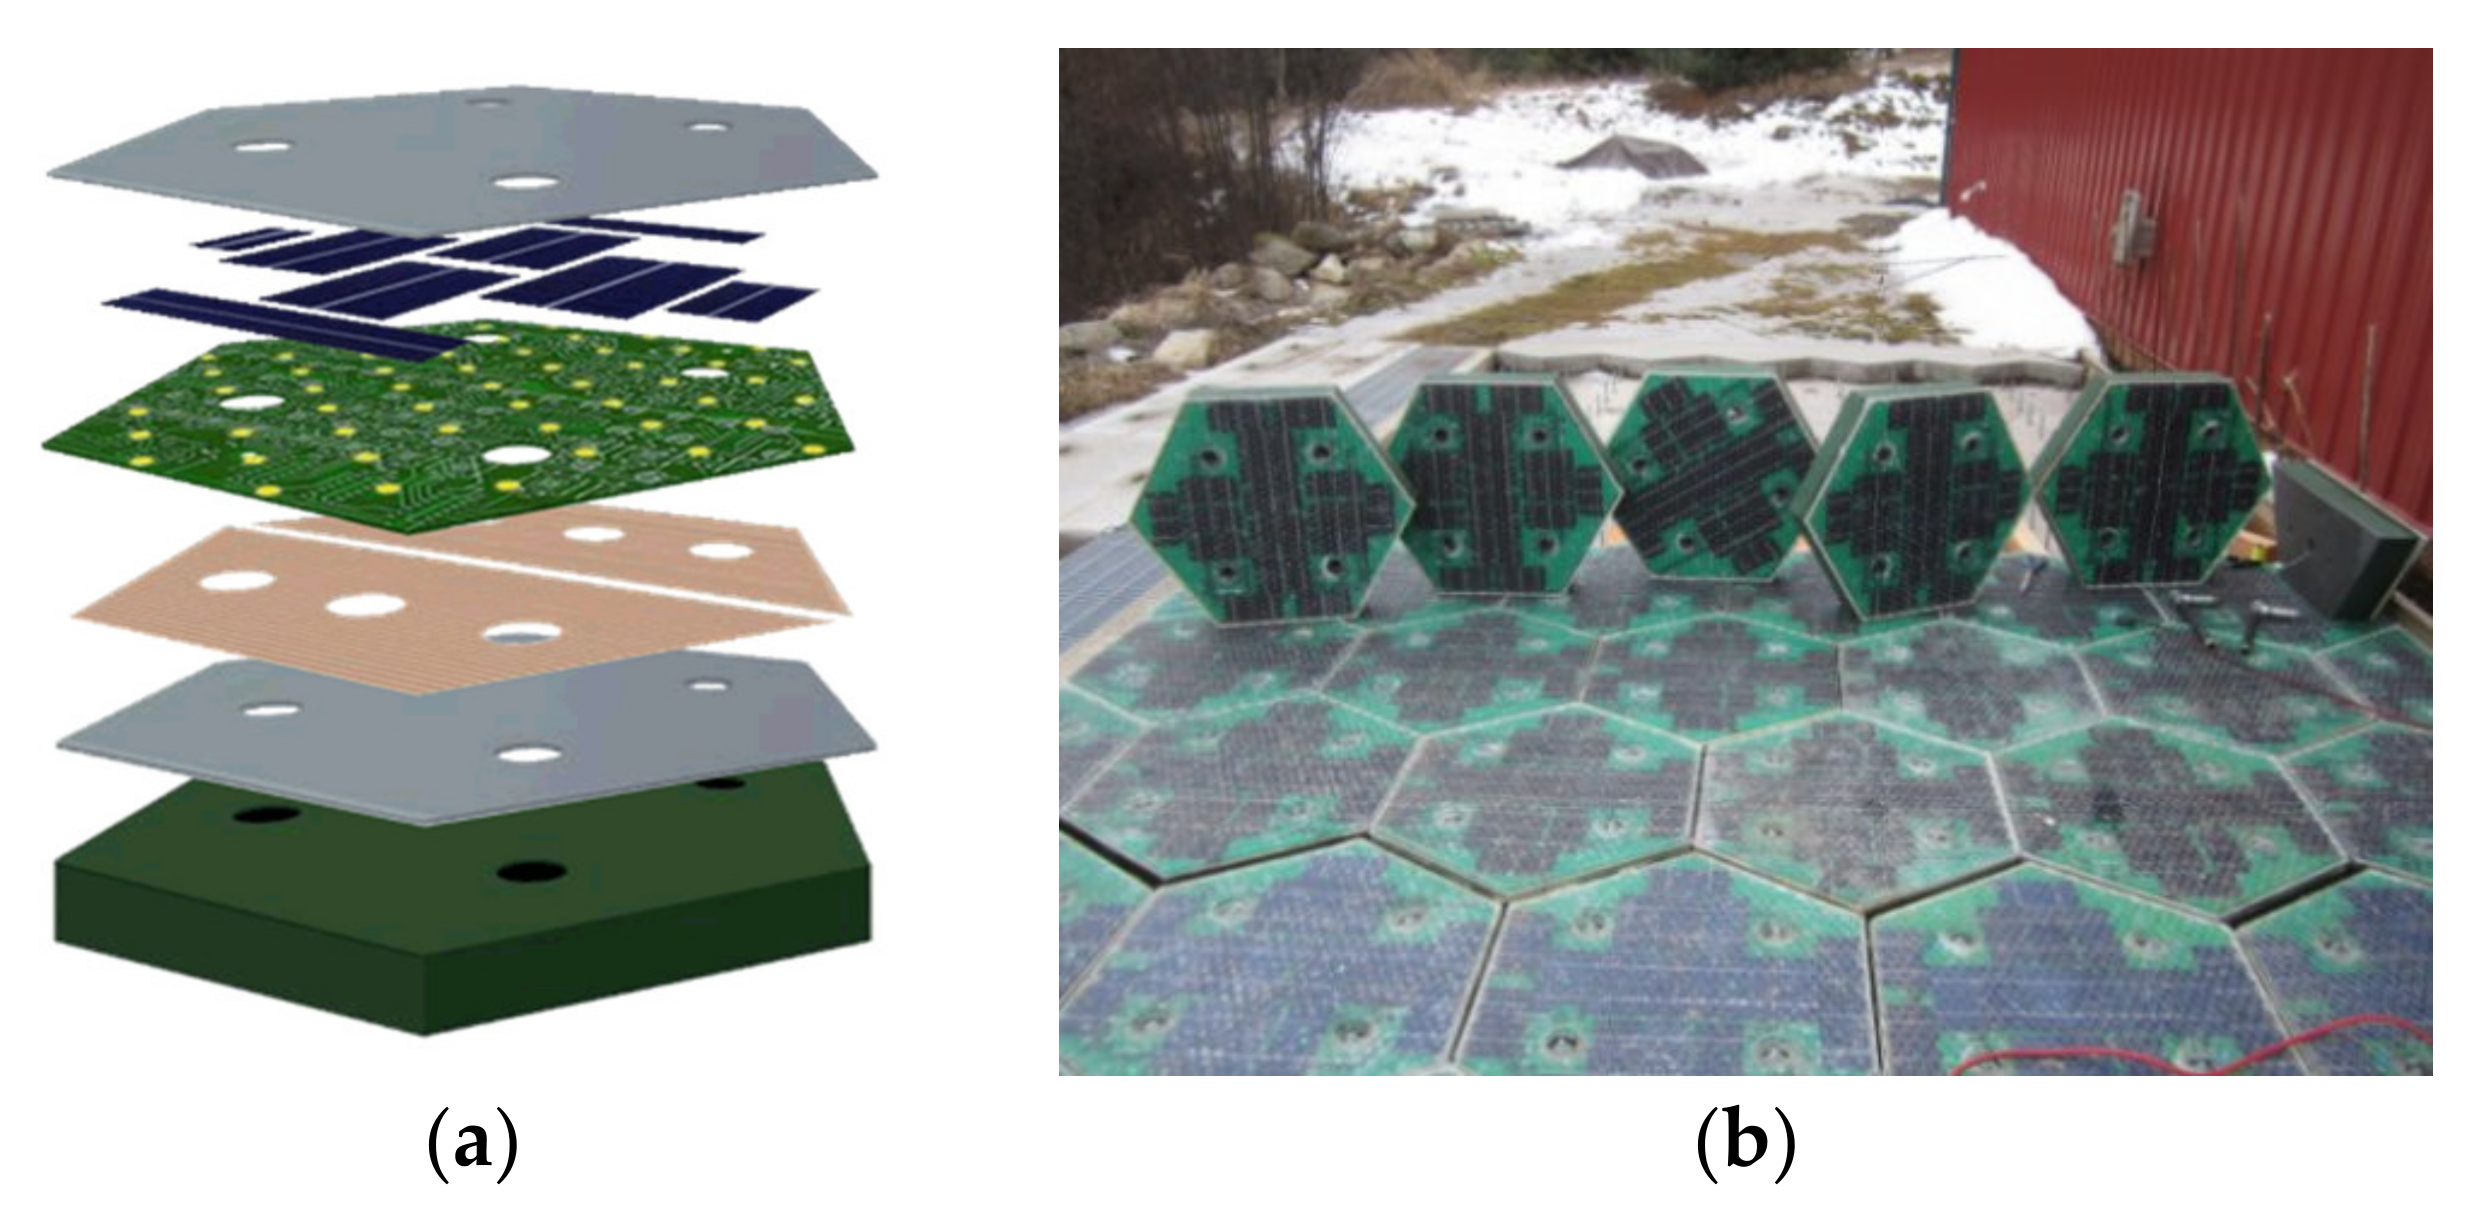
The phase 1 prototype was never exposed to any civil engineering tests. It was not known whether the glass used in solar pavement could withstand the load abuse of a fully loaded semi-truck. The surface of the glass needs to be textured to prevent vehicles from sliding on a wet surface while maintaining good solar transmission characteristics. In phase 2 SRI built a proof of concept parking lot with solar pavement and conducted civil engineering tests that included: (1) load testing; (2) traction testing; and (3) impact resistance testing. In Phase 2 SRI developed a new design, “SR2”, (see Figure 2). The SR1 prototypes were impractical in size (3.66 m × 3.66 m), extremely heavy and difficult to transport. Additionally, the square shape made the panels not suitable for curved paths a or hilly terrain. “SR2” panels are hexagonal in shape, with a four squares foot area. The weight of the panel is 49.90 kg, which makes it easier to transport. The small hexagon shape also allowed SR2 to accommodate curves and hills. In this design they used heated glass (purchased from Aliso Viejo, California), that has been in the rear windows of cars since at least the 1970′s. The load tests conducted by SR shows that SR panels can withstand a static load of 113,398 kg which is over three times weight of a fully loaded semi-truck (36,287.39 Kg). SRI verified the load testing capabilities using 3D Finite element methods (FEM). The British Pendulum test was used to analyze the traction properties of the glass. The results of traction testing showed that the surface of the “SR2” was enough to allow a passenger vehicle traveling 64.37 kmph to come to a complete stop in the required distance. This result is sufficient for use in a parking lot environment. For the highway, however, the SR2 textured front glass was improved and traction test showed the samples exceeded the desired skid distance numbers. According to the tester, asphalt with these skid numbers qualifies for vehicles traveling at a mean speed of 128.75 kmph on a wet surface. It was also observed that 52,397 Wh of power can be generated from the output of four hexagon SRPs over a six-month period in a typical test location.
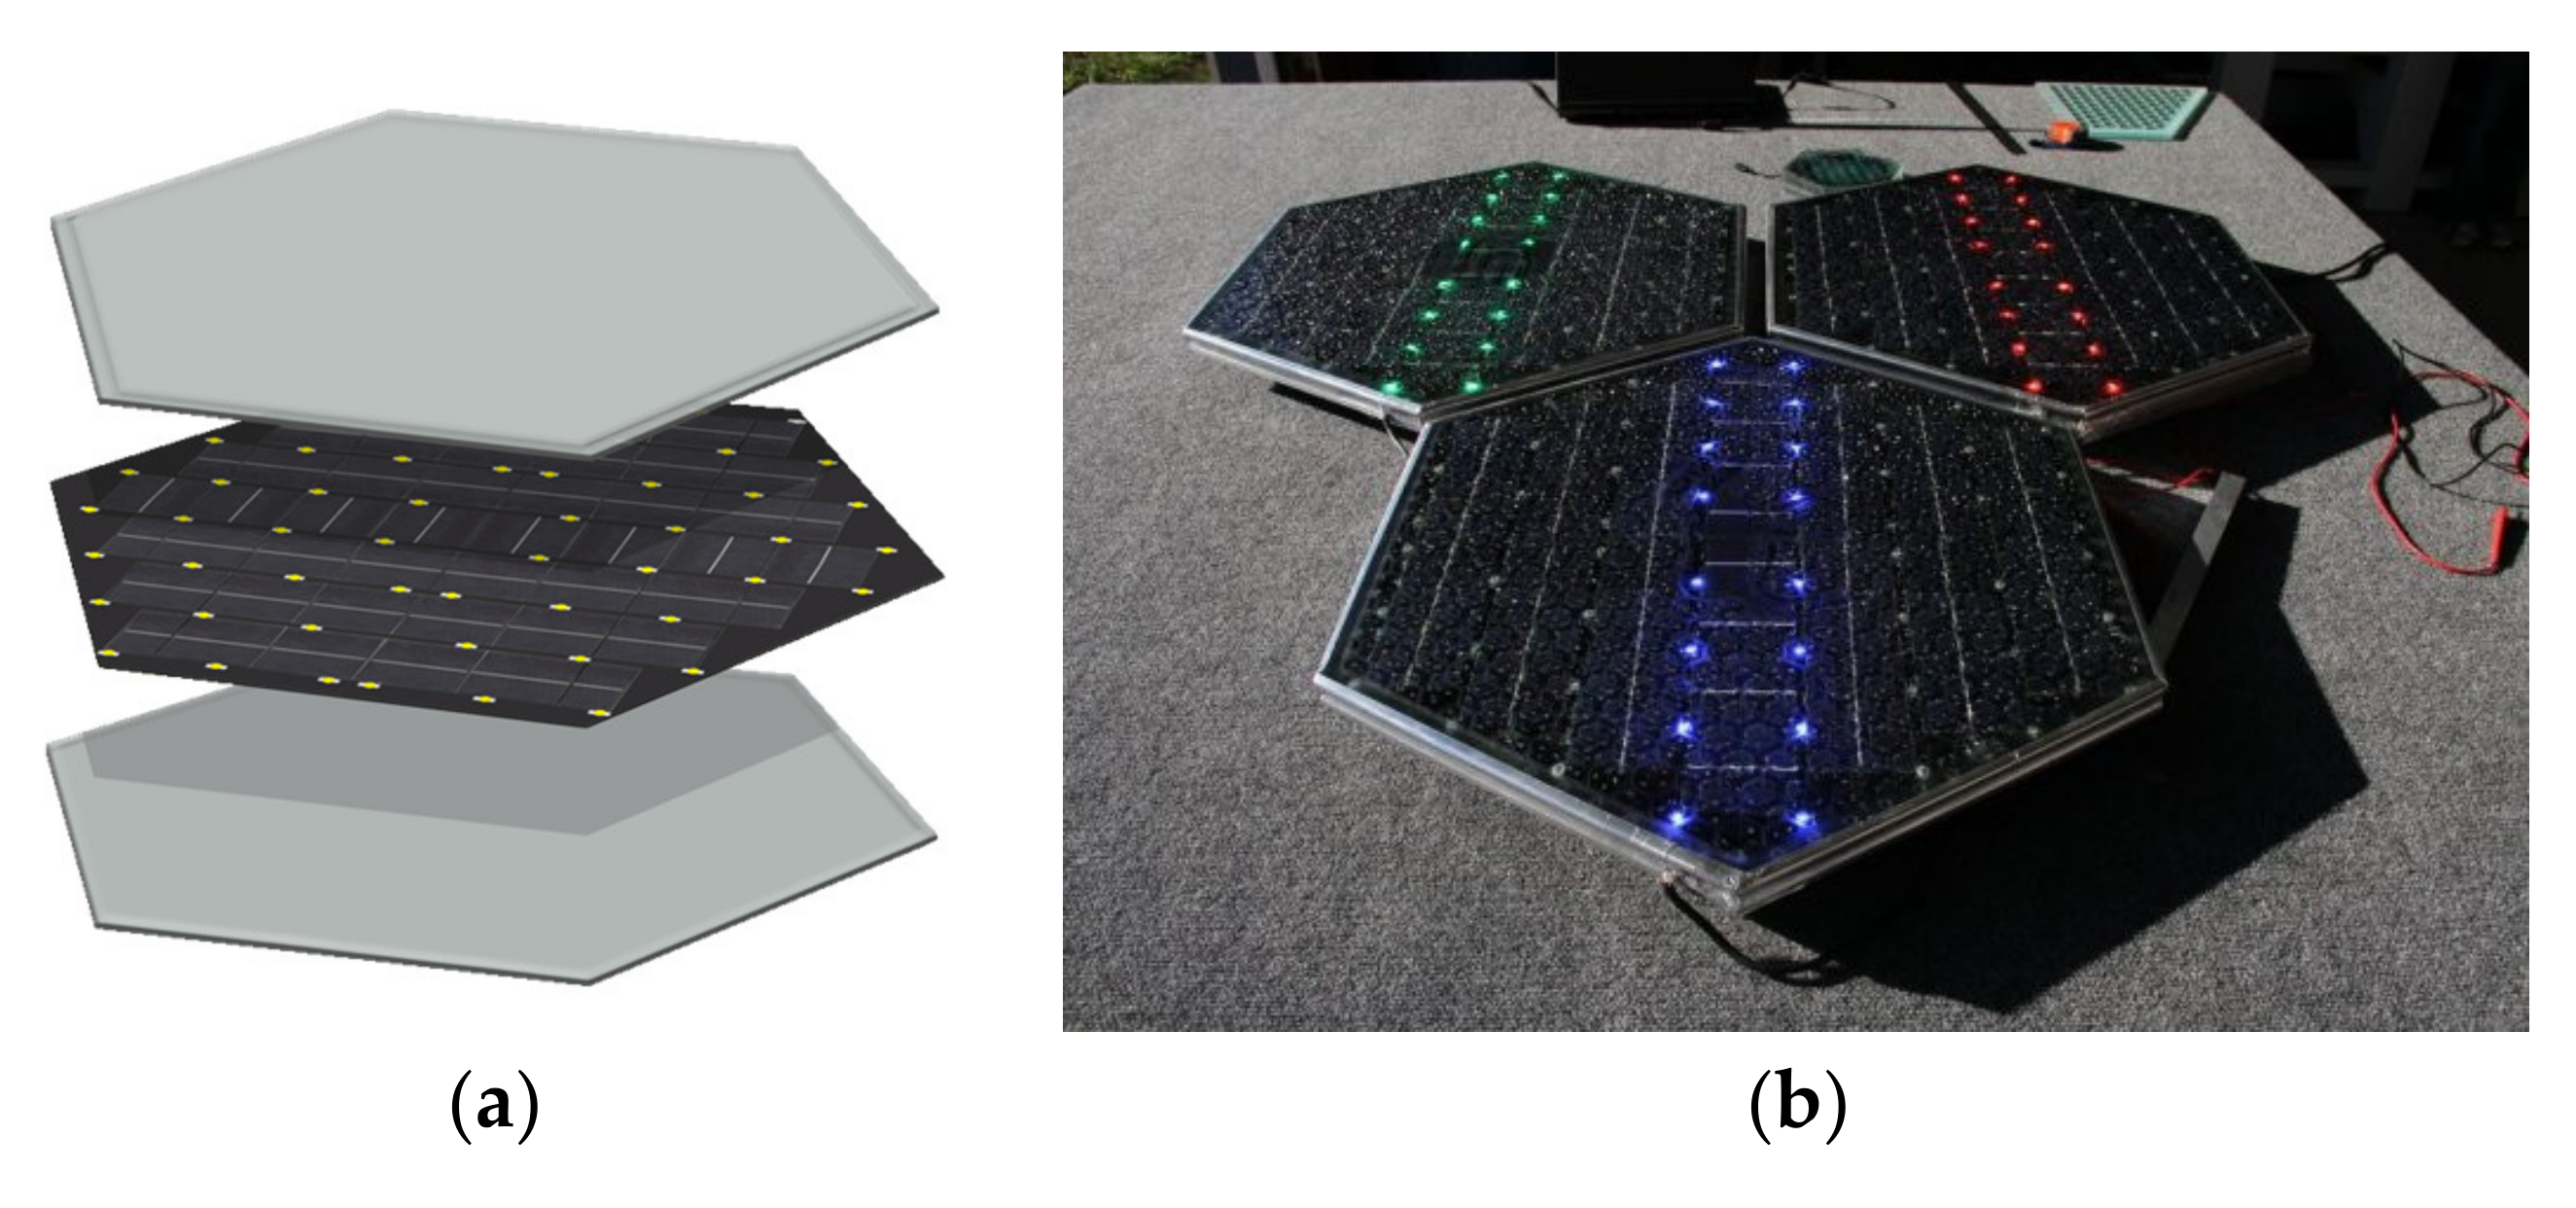
The “SR2” prototype has mounting holes, which reduces 31% of coverage area. In the “SR3” (see Figure 3) prototype SRI used edge connectors instead of mounting holes, which increases mounting area by 25%. Furthermore, the panel’s output increased by 12 W from 36 W to 48 W. The edge connector also aids in ease of installation. The “SR3” uses higher intensity LED’s that are more visible in bright light.
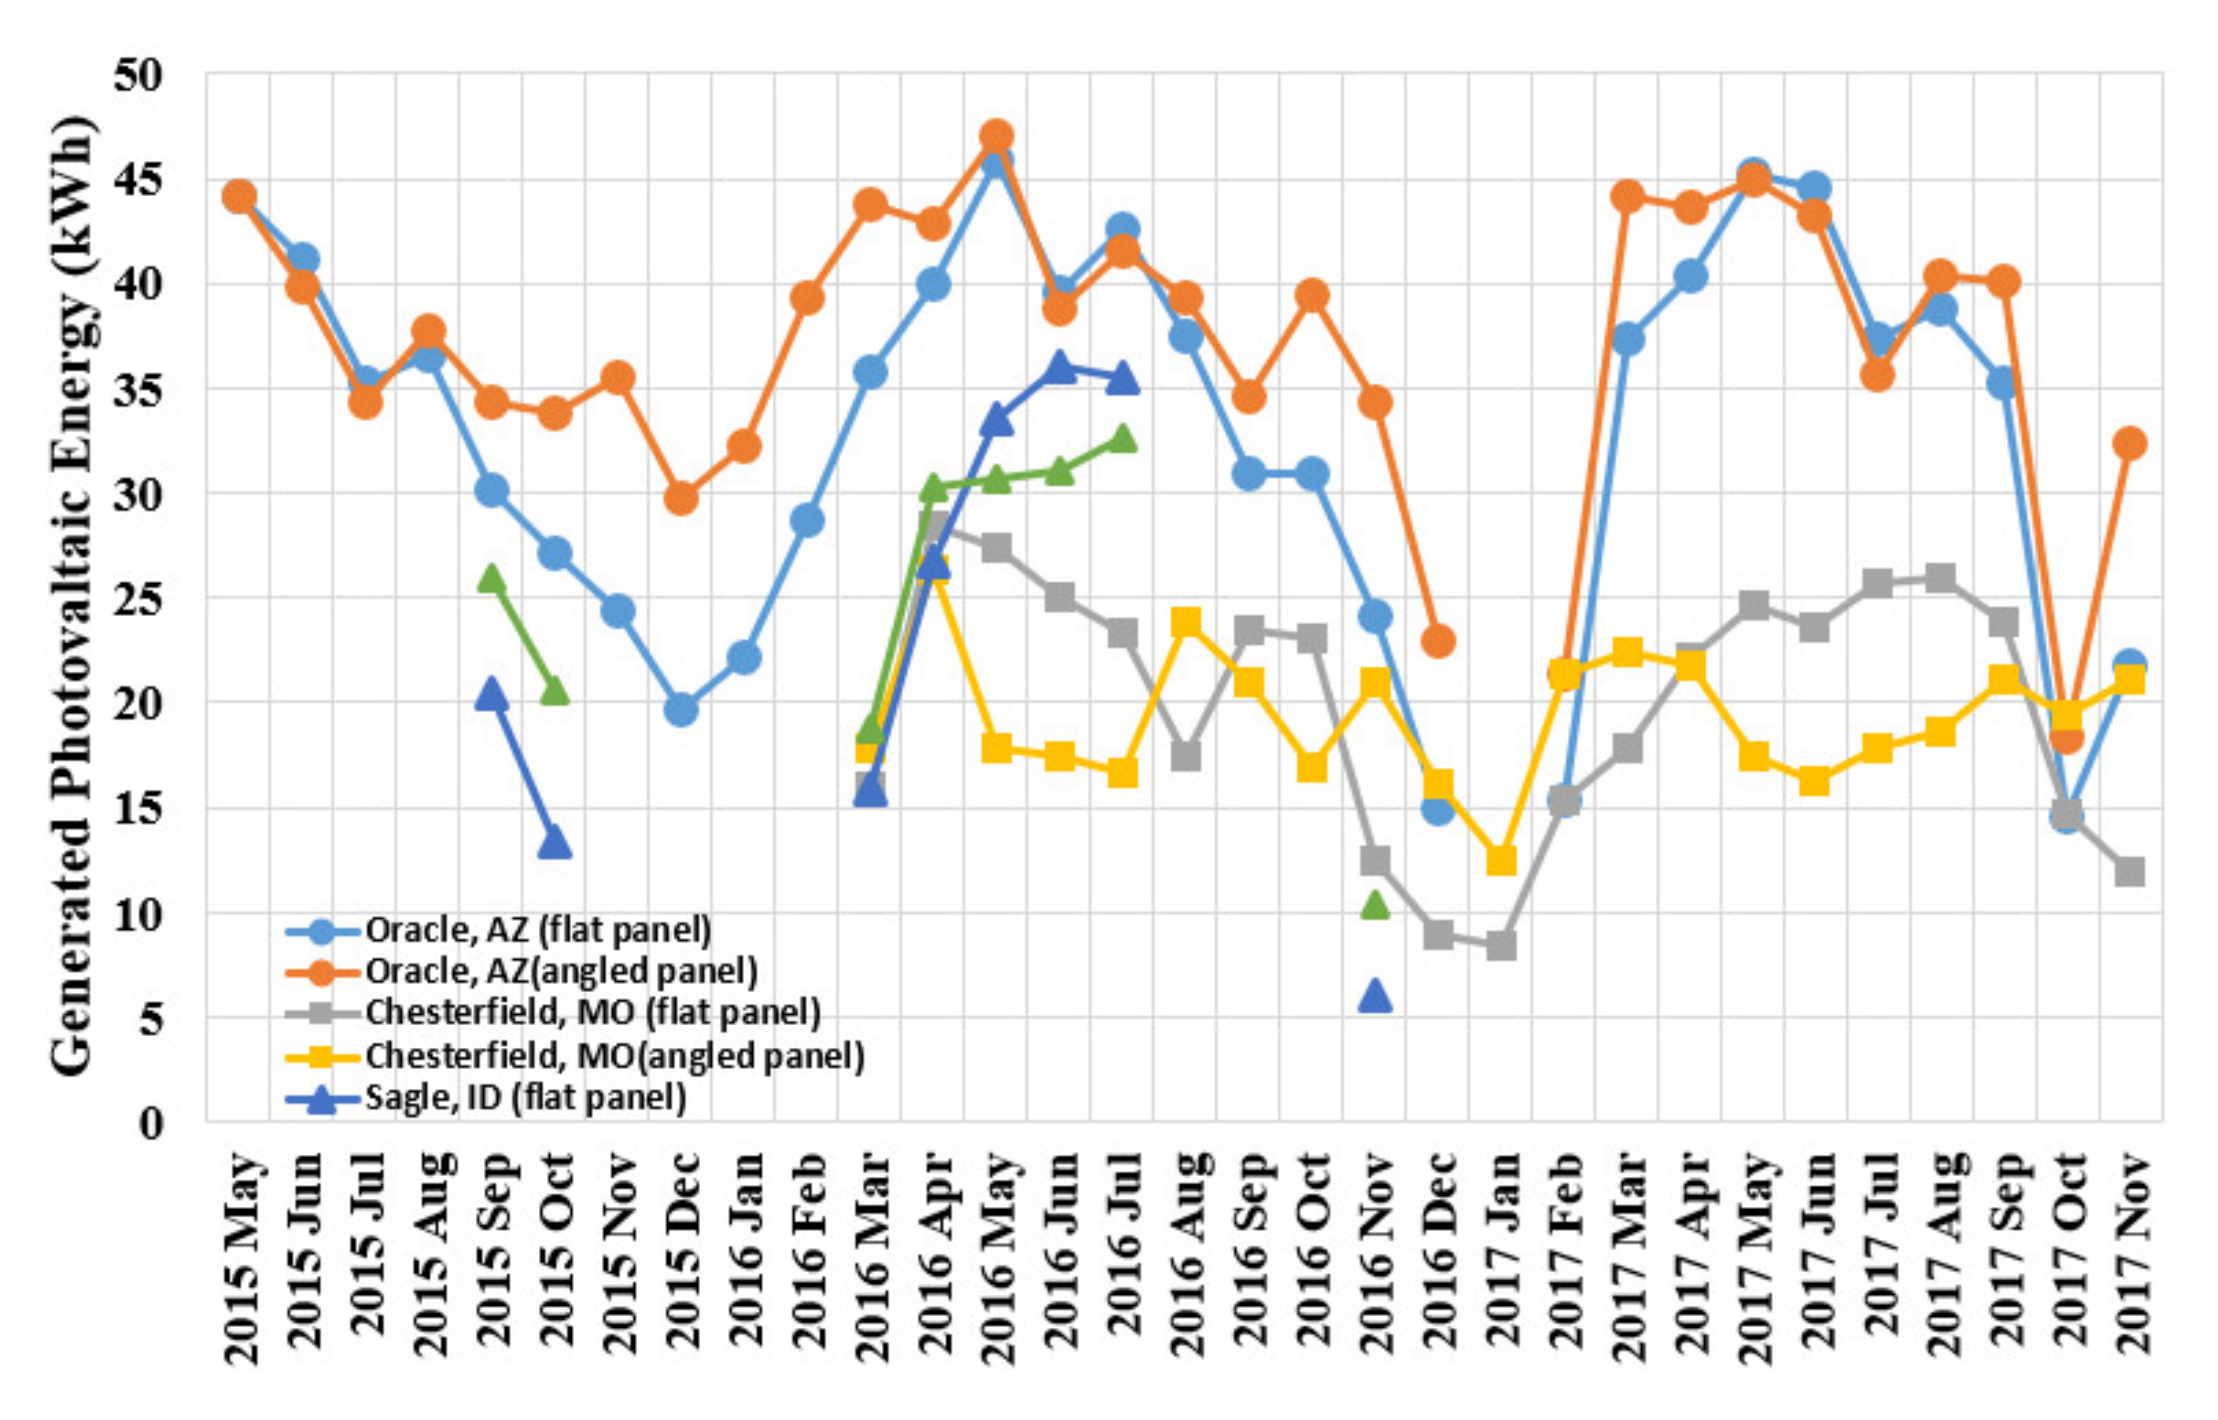
The main purpose of the SRPs is electricity generation. Solar Roadway Inc. collected some energy harvesting data for solar panel at three different latitudes in USA, (i.e., Oracle, AZ (Latitude 32°34′47.38" N); Chesterfield, MO (38°38′27.81" N); Sagle, ID (48°13′49.38" N). SRI used commercially available solar panels. Since the pavement panel will be flat unlike roof top panels, SRI collected two types of data: one keeping the panels flat, the other with the panel placed at optimal angle. 250 W solar panels were used in the Oracle, AZ and Chesterfield, MO sites, whereas in Sagle, ID site 220 W panels were used. Figure 4 shows all harvesting data from May 2015 to November 2017. Earlier Solar Roadways have conducted power generation capabilities of their “SR2” solar road panel prototypes. Four of these hexagonal panels can produce 52.397 KWh energy over six-month periods as recorded in micro-inverter. A 12 feet wide lane can accommodate 15,840 panels per lane mile. Therefore, the estimated energy production is 414.984 MWh per year per lane mile. This is estimated for a 69% coverage area. However, for “SR3” prototype cell coverage is near 100%. In that case the energy output will be 601.426 MWh per year per lane mile. Estimated energy consumption for LEDs is 601.426 MWh per year per lane mile, if they are on 100% of the time (which is very unlikely). Similarly, the microprocessor section will consume 106.311 MWh per year per lane mile assuming they are active 100% of the time. Subtracting these consumptions net energy production is 302.51 MWh per year per lane mile, which can serve the electricity need of 30 residential utility customers per lane mile. For 100% (as in the case of SR3 prototype) coverage, this number will increase to 43 customers. Therefore, a two-lane road in a rural area can provides off grid electricity for 86 homes along the Canadian border. Moving to the southern part of the country this number increases.

3. Environmental Testing

3.1. Moisture Conditioning Test

To investigate the mechanical and operational robustness of SRPs in wet conditions, moisture conditioning test were conducted. The top glass surface of the SRPs are an impermeable surface, so moisture has a very limited effect. This test was conducted mainly to measure the effect on the exposed polymer layer between the impermeable glass plates. The ASTM Active Standard D570-98(2010) e1, “Standard Test Method for Water Absorption of Plastics”, was used to evaluate the effects of water absorption or humidity exposure of the polymer layer [33]. The test has two primary objectives, first to measure the amount of absorbed water by the polymer material, and second, to measure the change or degradation of electrical, mechanical, dimensional properties and appearance of the polymer layer. The experimental setup is shown in Figure 5. Three SRPs were submersed in a 300-gallon steel tank. The water level was one inch above the panels and all SRP’s experienced same amount of water pressure. To protect the electrical connection, the wire and plug attached to the panel were above the water line during testing. The pavers were exposed to moisture conditioning as follows: (1) a 24-h test, (2) a seven-day period, (3) two 14-day periods. Before conducting each test, the panels were base line tested (initial electrical properties and weight). The pavers were submerged for the required time period(s), removed from the water tank, dried with a lint-free towel, weighed, and then moved for electrical testing (i.e., LED functionality). Once electrical testing was complete, the pavers were again weighed and placed back into the water tanks to begin the next test cycle. Moisture testing was continued for a total of 36 days.
Moisture absorption affects the water content of the polymer and is directly related to electrical conductivity, mechanical strength, dimension, and physical appearance. The amount of absorption depends greatly on the type of water exposure (i.e., immersion or exposure to high humidity), the shape, and the properties of the polymer. The moisture testing was conducted on full-size SRPs not small test samples as described in the ASTM Active Standard. The weight measurement setup (resolution 9.07 gm) is shown in Figure 5b. After the 24-h test no gain in weight was recorded. However, after a seven-day test, one panel (serial number 3A) showed 9.07 gm weight gain. Based on this result, two 14-day trials were accomplished, resulting in all three-panels gaining 18.14 gm.
After the initial 14-day test one panel (serial number 3A) failed electrical testing. This cannot be attributed directly to the increase in moisture content since, for other two panels the LEDs were operational in each pre and post moisture test periods. To find the root cause of the observed failure Solar Roadway Inc. (SRI) conducted an in-depth investigation and found that a corroded wire was the cause of the failure. At the SRI facility photovoltaic tests were performed on the moisture tested panels. All three panels generated the expected amount of power (ranges 24.5 W to 26.7 W). In conclusion, the moisture conditioning testing resulted in essentially no measurable weight gain using a 45.36 kg load cell with 9.07 gm resolution. The SRPs tested in the EMSTL at MU campus met or exceeded the moisture conditioning duration test standards described in ASTM D570-98(2010) e1.

3.2. Freeze/Thaw Cycling

Roadways are exposed to extreme weather conditions throughout the year. Roadway materials fail, in part, due to temperature extremes. The SRPs consist of laminate material sandwiched between glass layers. These two materials have different coefficients of thermal expansion (CTE). This factor can have detrimental effect on the SRPs mechanical and electrical functionalities in real word conditions. In our test we exposed our panels to repetitive cycling of temperature extremes. We modelled our unique testing after ASTM Active Standard C1645/C1645 M, “Standard Test Method for Freeze-thaw and De-icing Salt Durability of Solid Concrete Interlocking Paving Units” [34,35].
The experimental setup for Freeze/Thaw Cycling was similar to the moisture testing setup. Prior to testing, six SRPs were tested to assess the initial conditions (weight and electrical functionality). Three panels were placed in a 1135.62 liter tank containing fresh water, three panels were placed in a separate tank containing a 3% NaCl solution to simulate de-icing chemical conditions. Both tubs were placed in an ESPEC environmental chamber programmed to alternate between −20 °C and 50 °C over 48-h intervals. This approximate five-day period constituted one test cycle. At the end of each test cycle, the SRPs were removed from the water tanks, dried with a lint-free towel, weighed, inspected for breaches in the physical structure, and then electrically tested. The weighing apparatus was the same used, in the moisture conditioning test. Once electrical testing was complete, the pavers were placed back into the water tanks to begin the next test cycle. The entire test consisted of 10 freeze/thaw cycles. Upon completion of the 10 cycles, the panels exhibited no weight gain within the 9.07 gm resolution of the scale used. No physical defects or damage was noted and. In all cases the LEDs were operational in each of the freeze/thaw test cycles.

4. Heavy Vehicle Simulation (HVS)

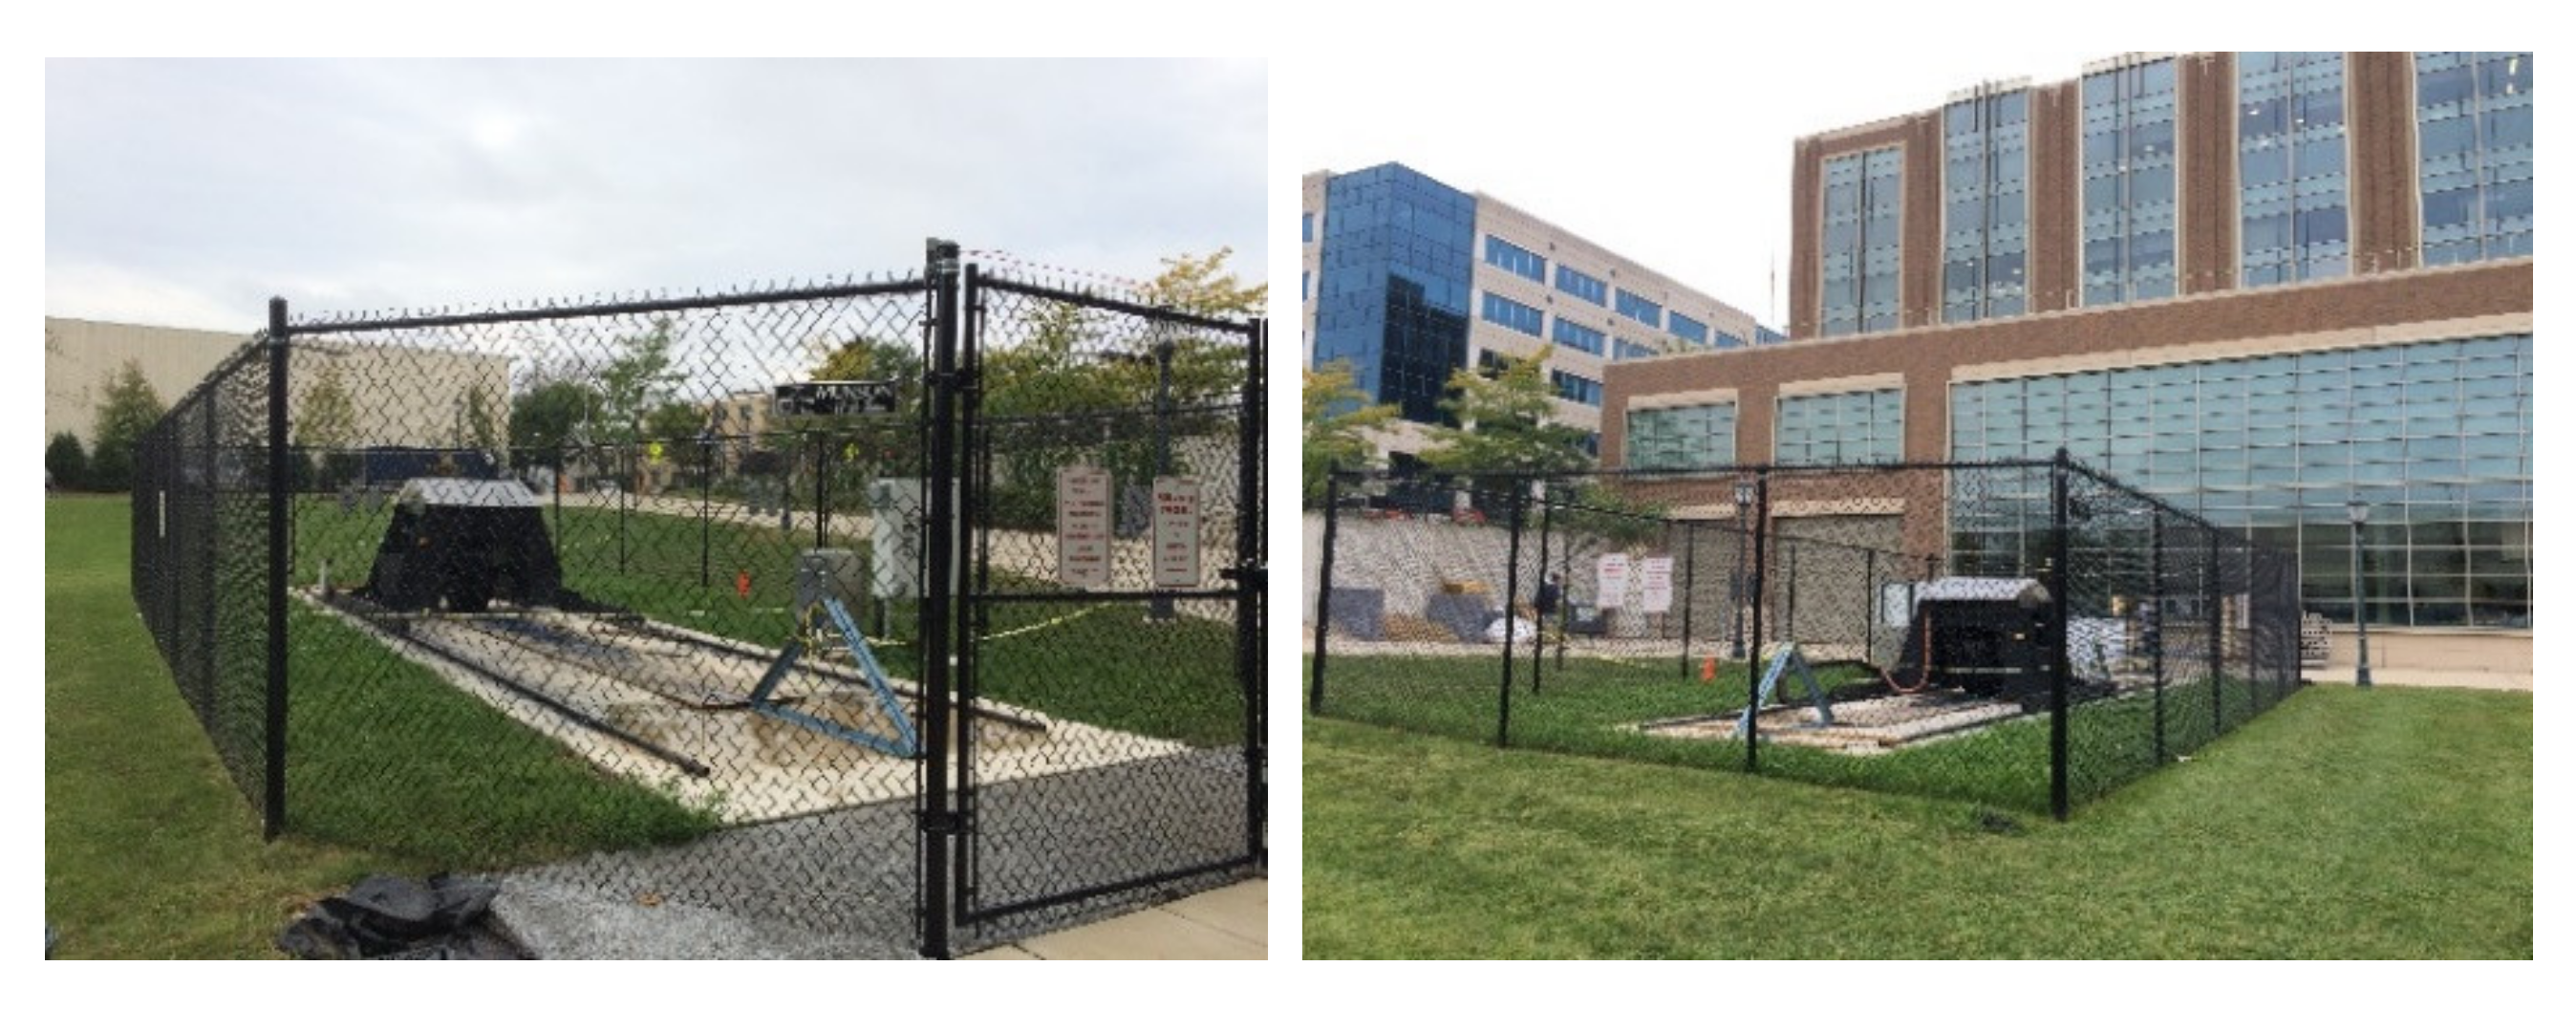
Roadway pavement are subjected to continuous vehicle load. Due to vehicle load and repetitive load cycling pavement material failure occurs, for example rutting and fatigue in asphalt pavements. Rutting refers to the permanent deformation of the roadway material in the vehicle wheel paths. This commonly occurs due to repetitive load cycling on a flexible pavement at elevated pavement temperature. With the SRI panels, there is far less chance of rutting as we are using hard tempered glass. Fatigue is the failure of pavement structure due to repetitive flexural bending. Under repetitive vehicle loading the strength of the pavement material is reduced and eventually fatigue failure occurs. As mentioned before the SRPs consist of laminate material sandwiched between two glass layers. The glass and polymer have different compressive strengths, hardness’s and elastic properties. To evaluate the SRP mechanical properties and electrical functionality in real-world conditions, the heavy vehicle simulation (HVS) test was performed. The test was conducted in the SR Pilot Project area located on the south side of Engineering Hall; Marquette University Campus as shown in Figure 6. Limited electrical testing was accomplished to verify paver operation before and during HVS testing and consisted of verifying LED operations.
HVS testing was planned based on a load of 40 kN (9000 lbs.) super single test wheel load making one million, bi-directional passes at slow speeds of (3–5 mph) along the centerline of the SRPs (i.e., without wheel wander). This test (heavy vehicle simulation (HVS)) was intended to evaluate system performance under extreme loading conditions (i.e., heavy wheel loads traveling at slow speeds) according to the equivalent single axle loading (ESAL) concept developed by the American Association of State Highway Transportation Officials (AASHTO). The slow rate of travel represents the worst case in terms of damage to the panel. Testing was accomplished with the SRP grid installed on the surface of a doweled, jointed plain concrete pavement (JPCP) composed of a 25.4 cm concrete slab over a 15.24 cm crushed aggregate base layer over a silty-clay subgrade. The HVS test rig was earth grounded via the side rails to avoid static electricity concerns associated with the dry winter season.
Although the test was initially designed for 40 kN load, the actual wheel load for HVS testing was 42.22 kN. The wheel speed was 0.57 m/s, the relative damage induced by these loading variables was analyzed. According to the equivalent single axle loading (ESAL) concept developed by the American Association of State Highway Transportation Officials (AASHTO). Based on the fourth power approximation for equivalent loadings, a 42.22 kN single wheel load can be approximately 1.241 times (i.e., (42.22/40)4 = 1.24 ESALs) more damaging than the 40 kN wheel load. Furthermore, allowable ESALs on concrete pavements are inversely related to the static modulus of sub grade reaction k-value. When used in the context of the AASHTO concrete pavement design, converting from wheel loads traveling at highway speeds to creep speeds may be simulated by a 50% reduction in the design subgrade k-value. Comparing allowable ESALs over a range of design subgrade k-values yields a speed related damage factor of approximately 1.25, i.e., the slowly moving wheel loads are approximately 1.25 times more damaging than loads traveling at highway speeds. Combining the noted load and speed effects, each pass of the HVS can be equated to approximately 1.55 ESALs (i.e., 1.24 × 1.25 = 1.551).
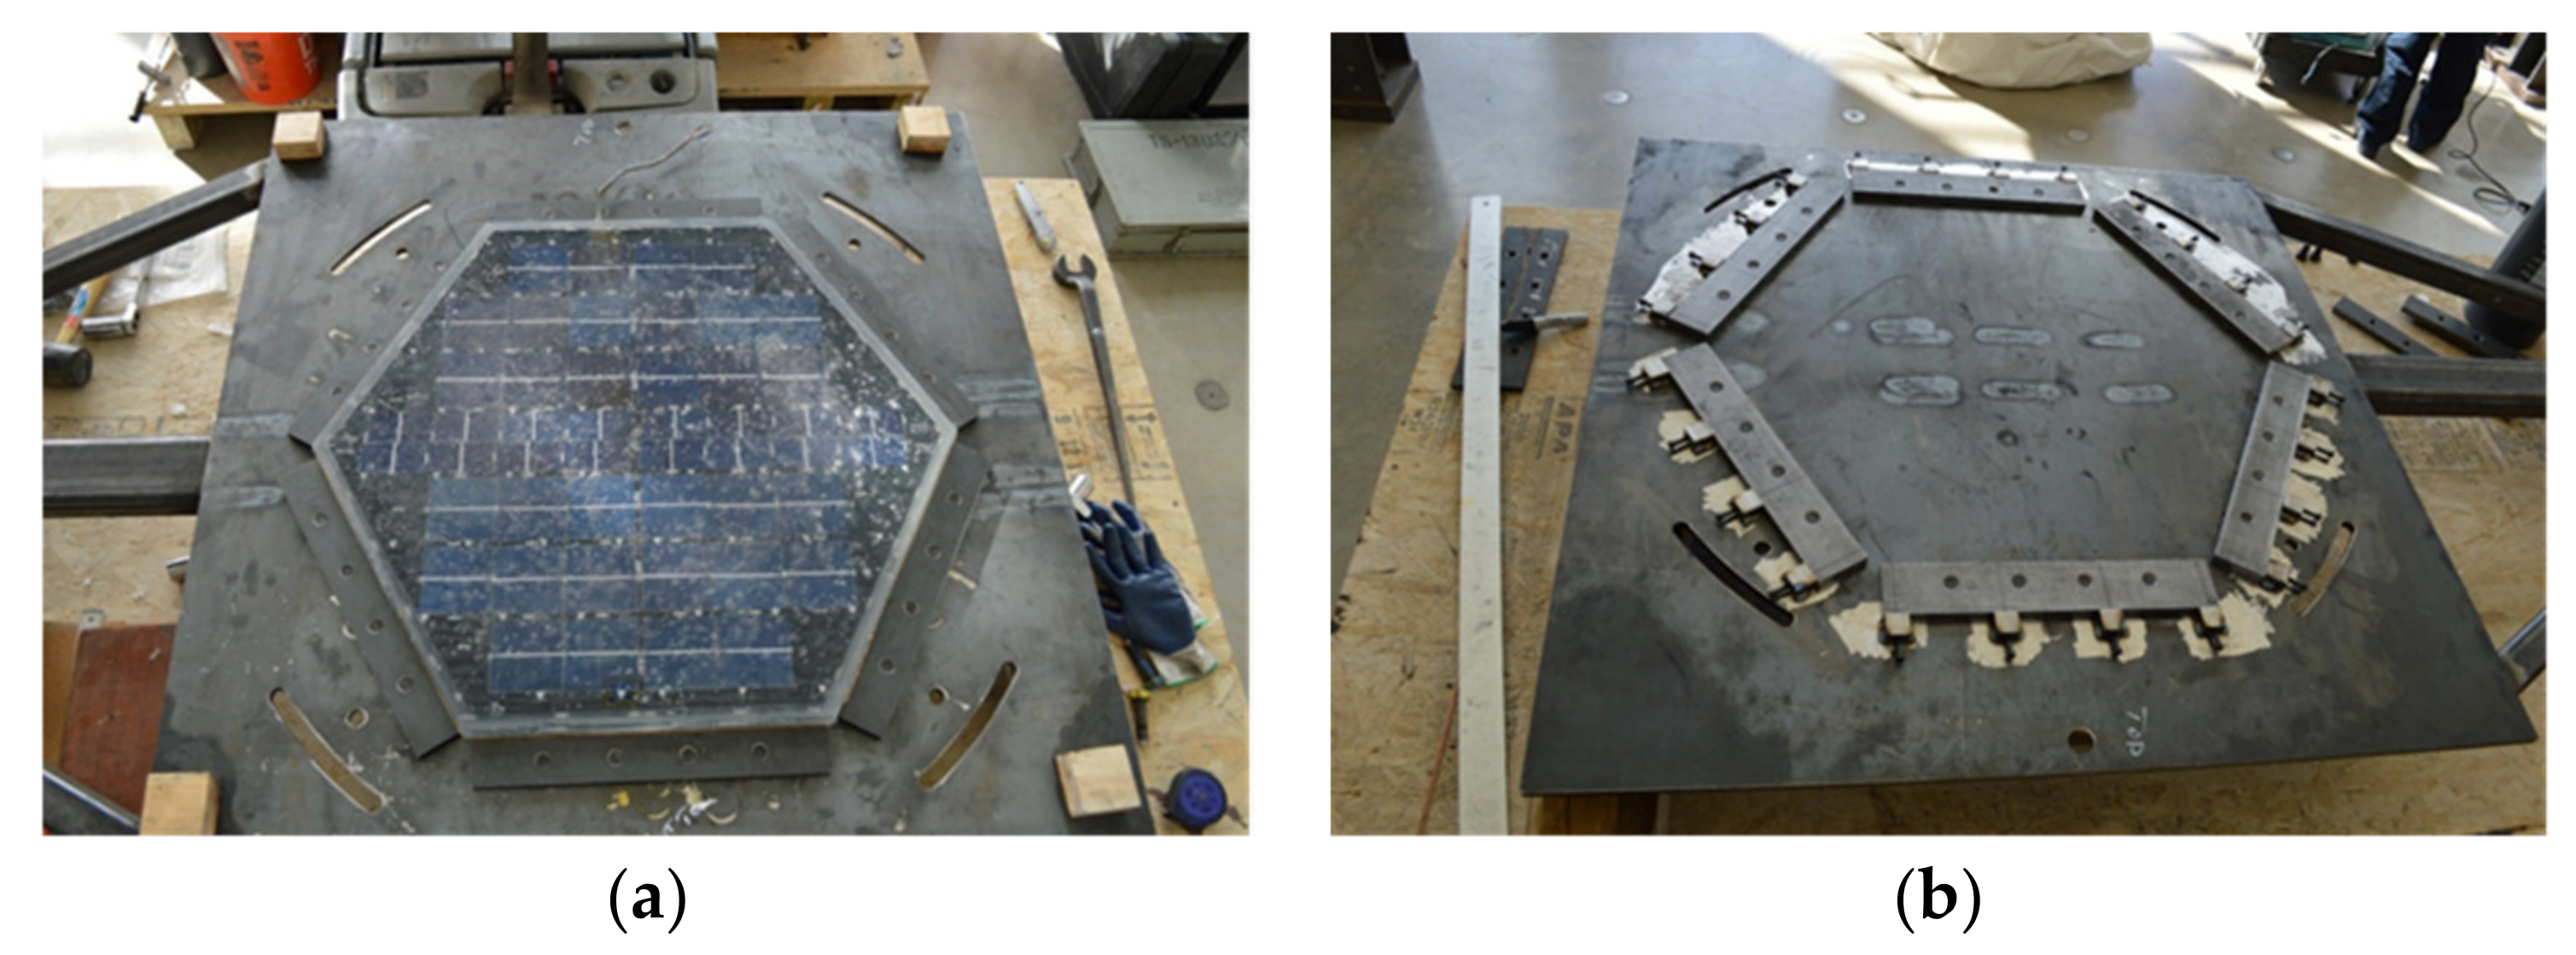
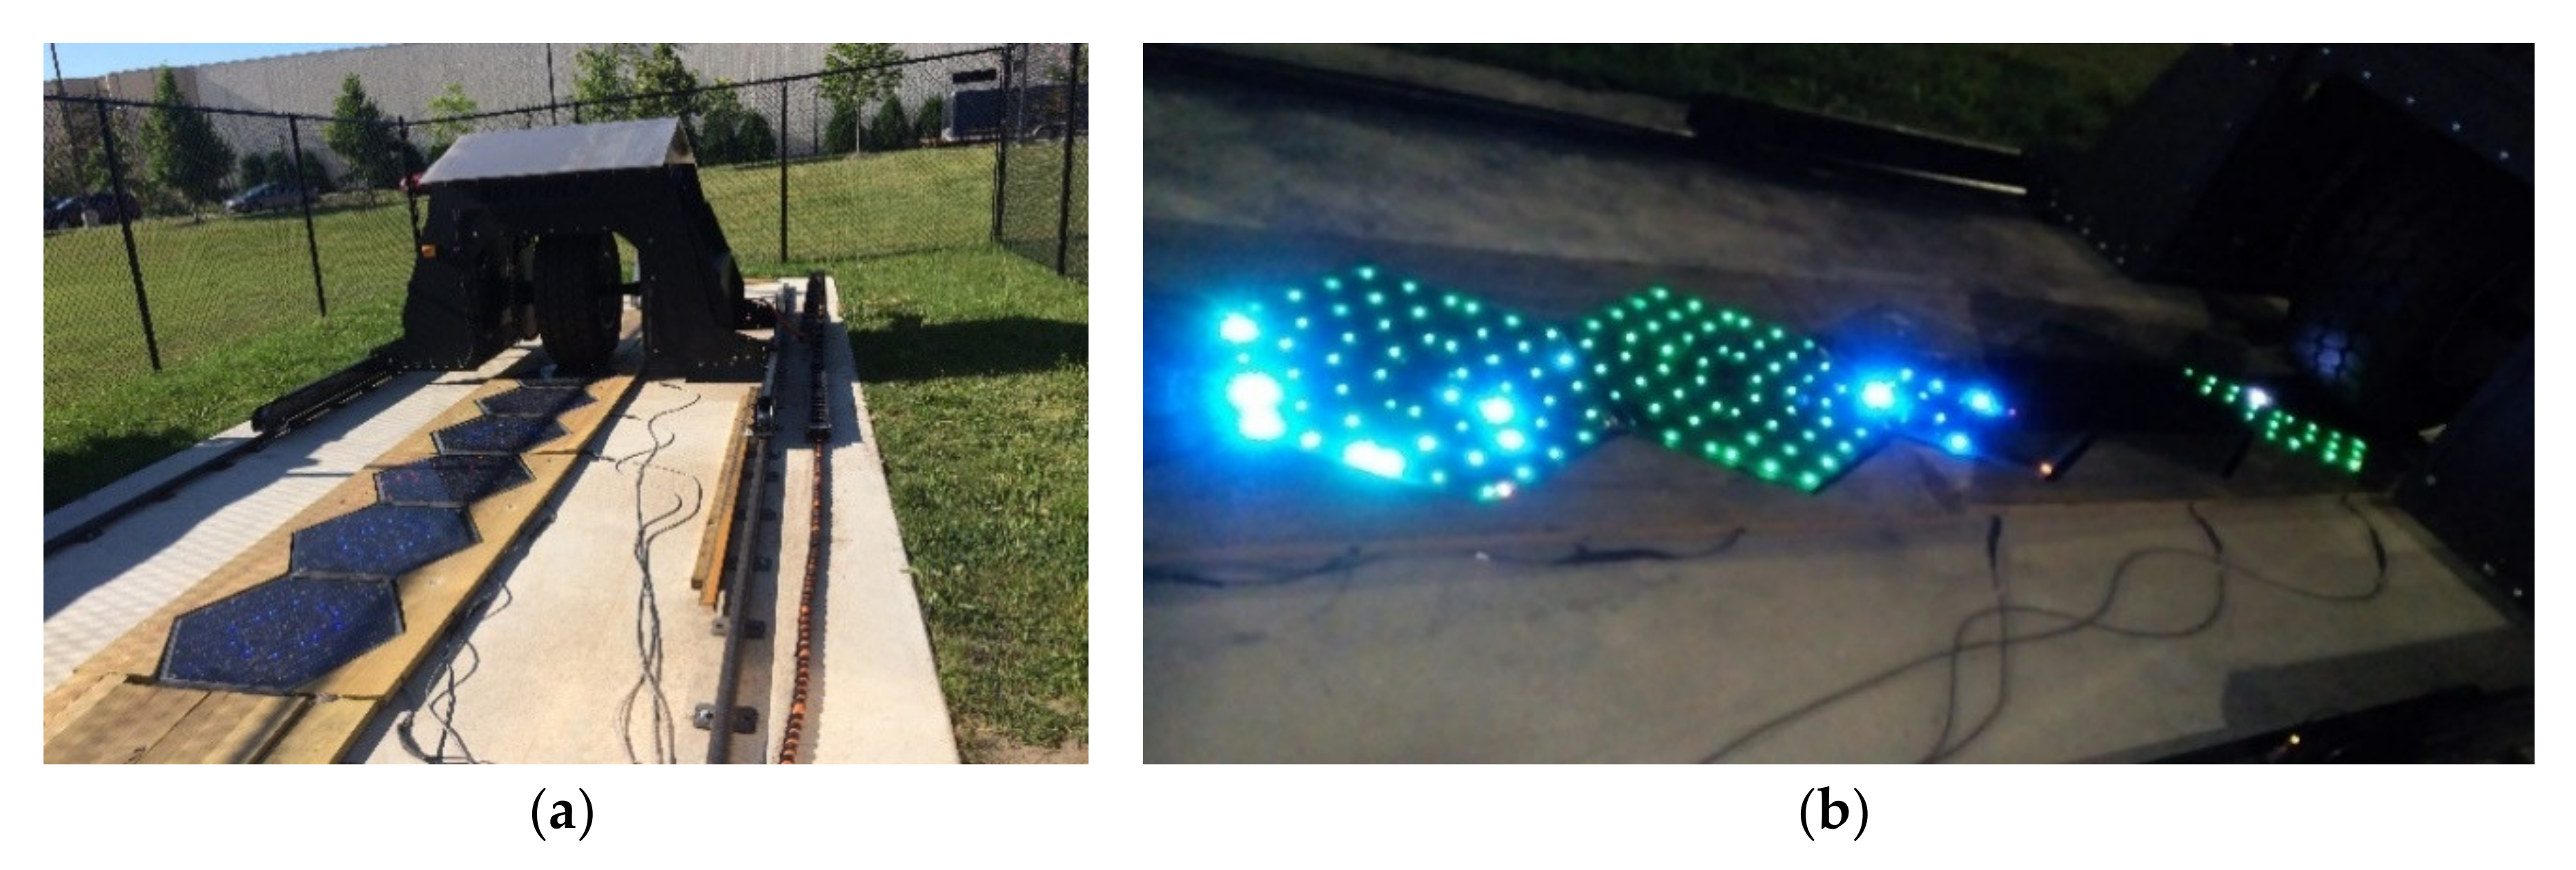
Six SRPs with serial number 015A-015F were used for the HVS testing. A wooden structure was fabricated to keep the panels in place while the rolling load passed over them. The test begun on 9 July and ended on 30 September 2018. No physical damage on any of the SRPs was observed at the test conclusion. There was no cracking or rutting on the top or bottom glass. The laminated polymer layer showed no deformation. The LEDs in all six panel were operational prior to the test. However, during the test LED functionality degraded gradually. At the end of the test, the LEDs in two pavers (serial number 015A and 015E) were not operational. LEDs on another two pavers (serial number 015B and 0015C) were operational but ended in random pattern within two hours of powering on or color reset. Approximately one-third of the LEDs in pavers 015D and 015F remained operational. LED status at the beginning and near the end of the test is depicted in Figure 7.
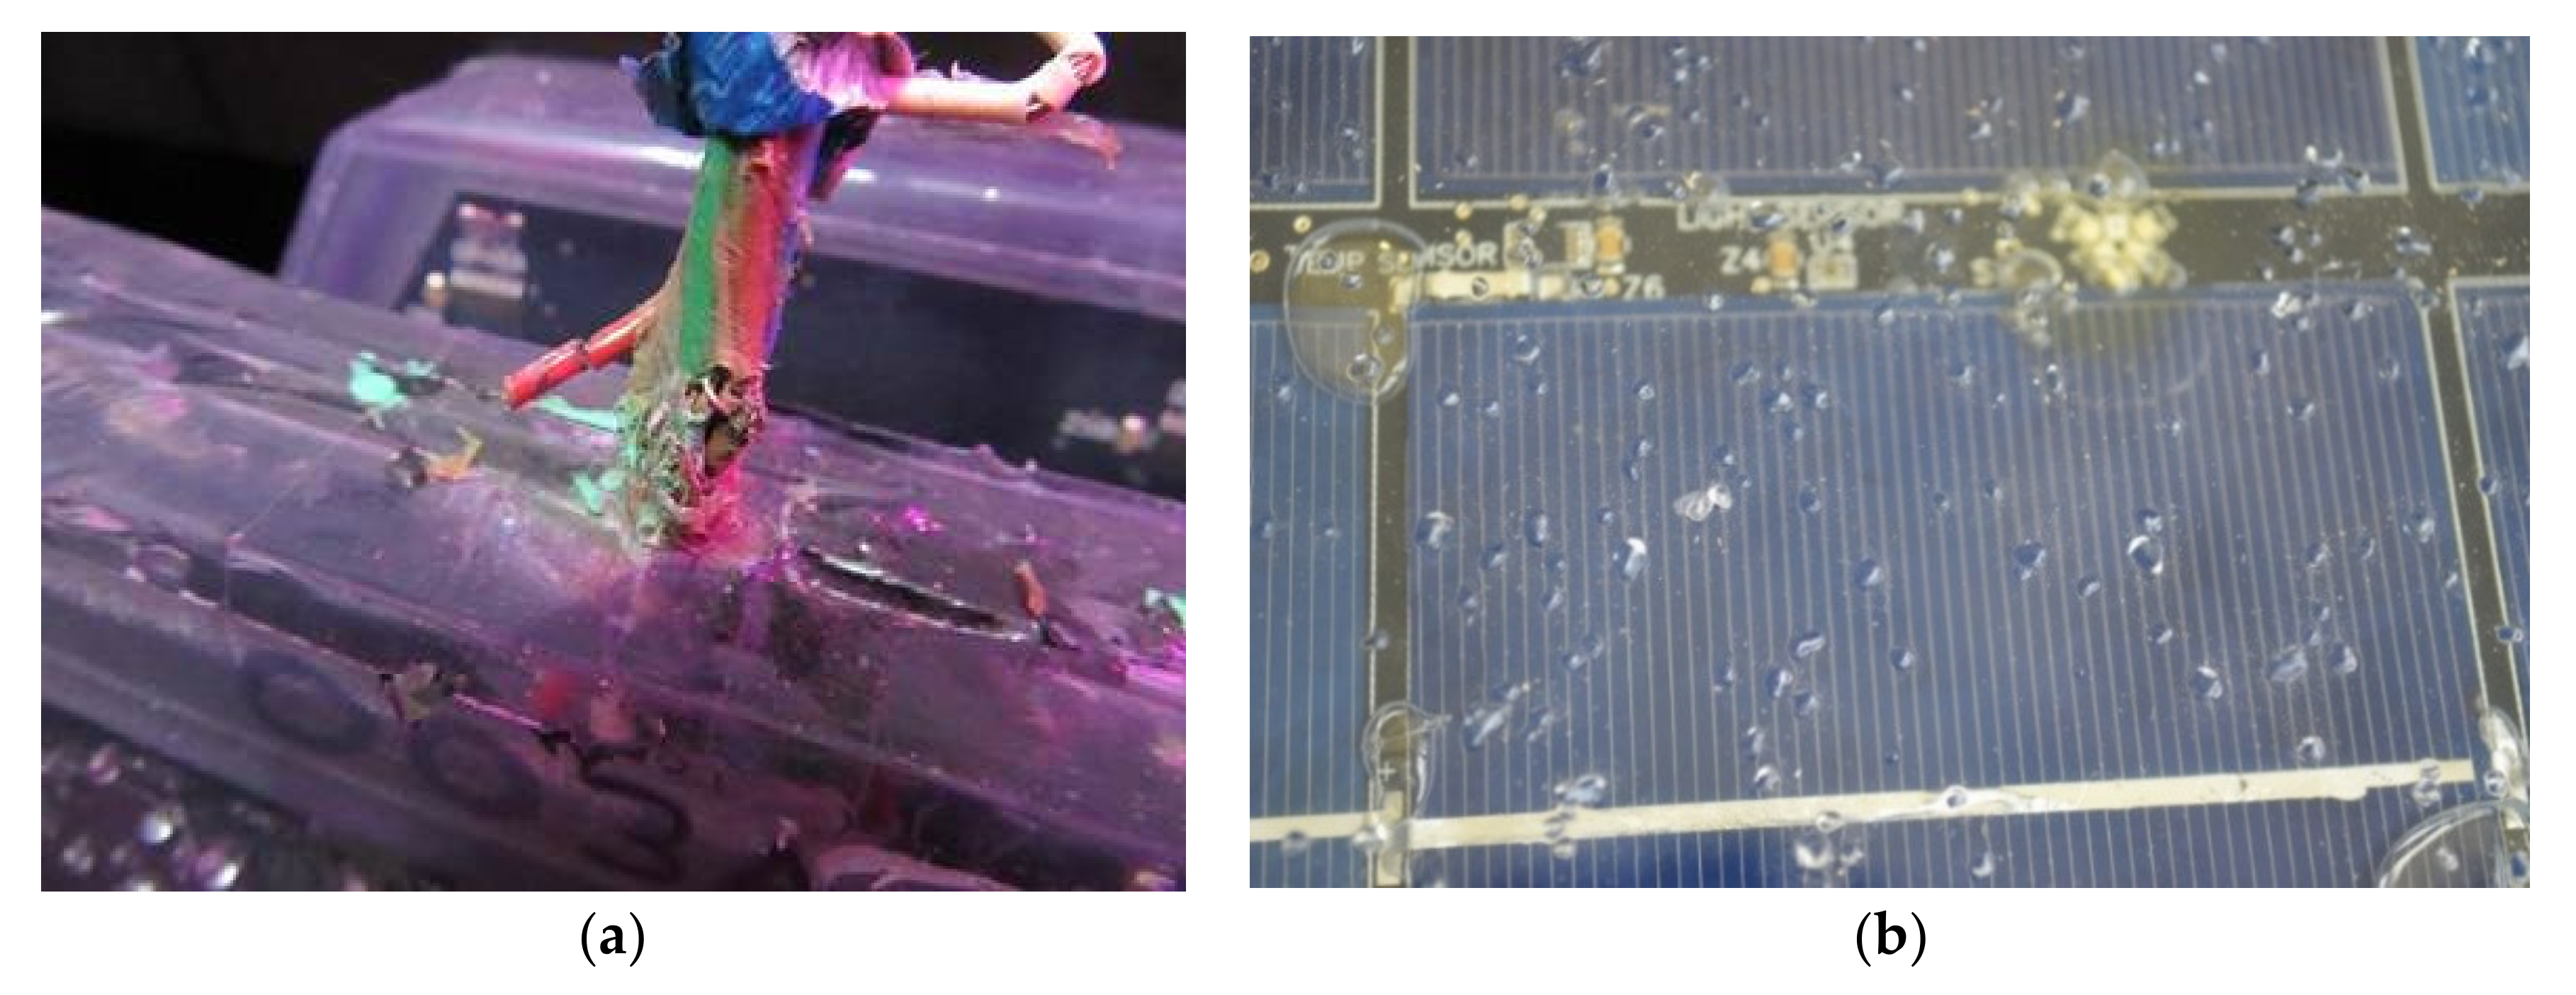
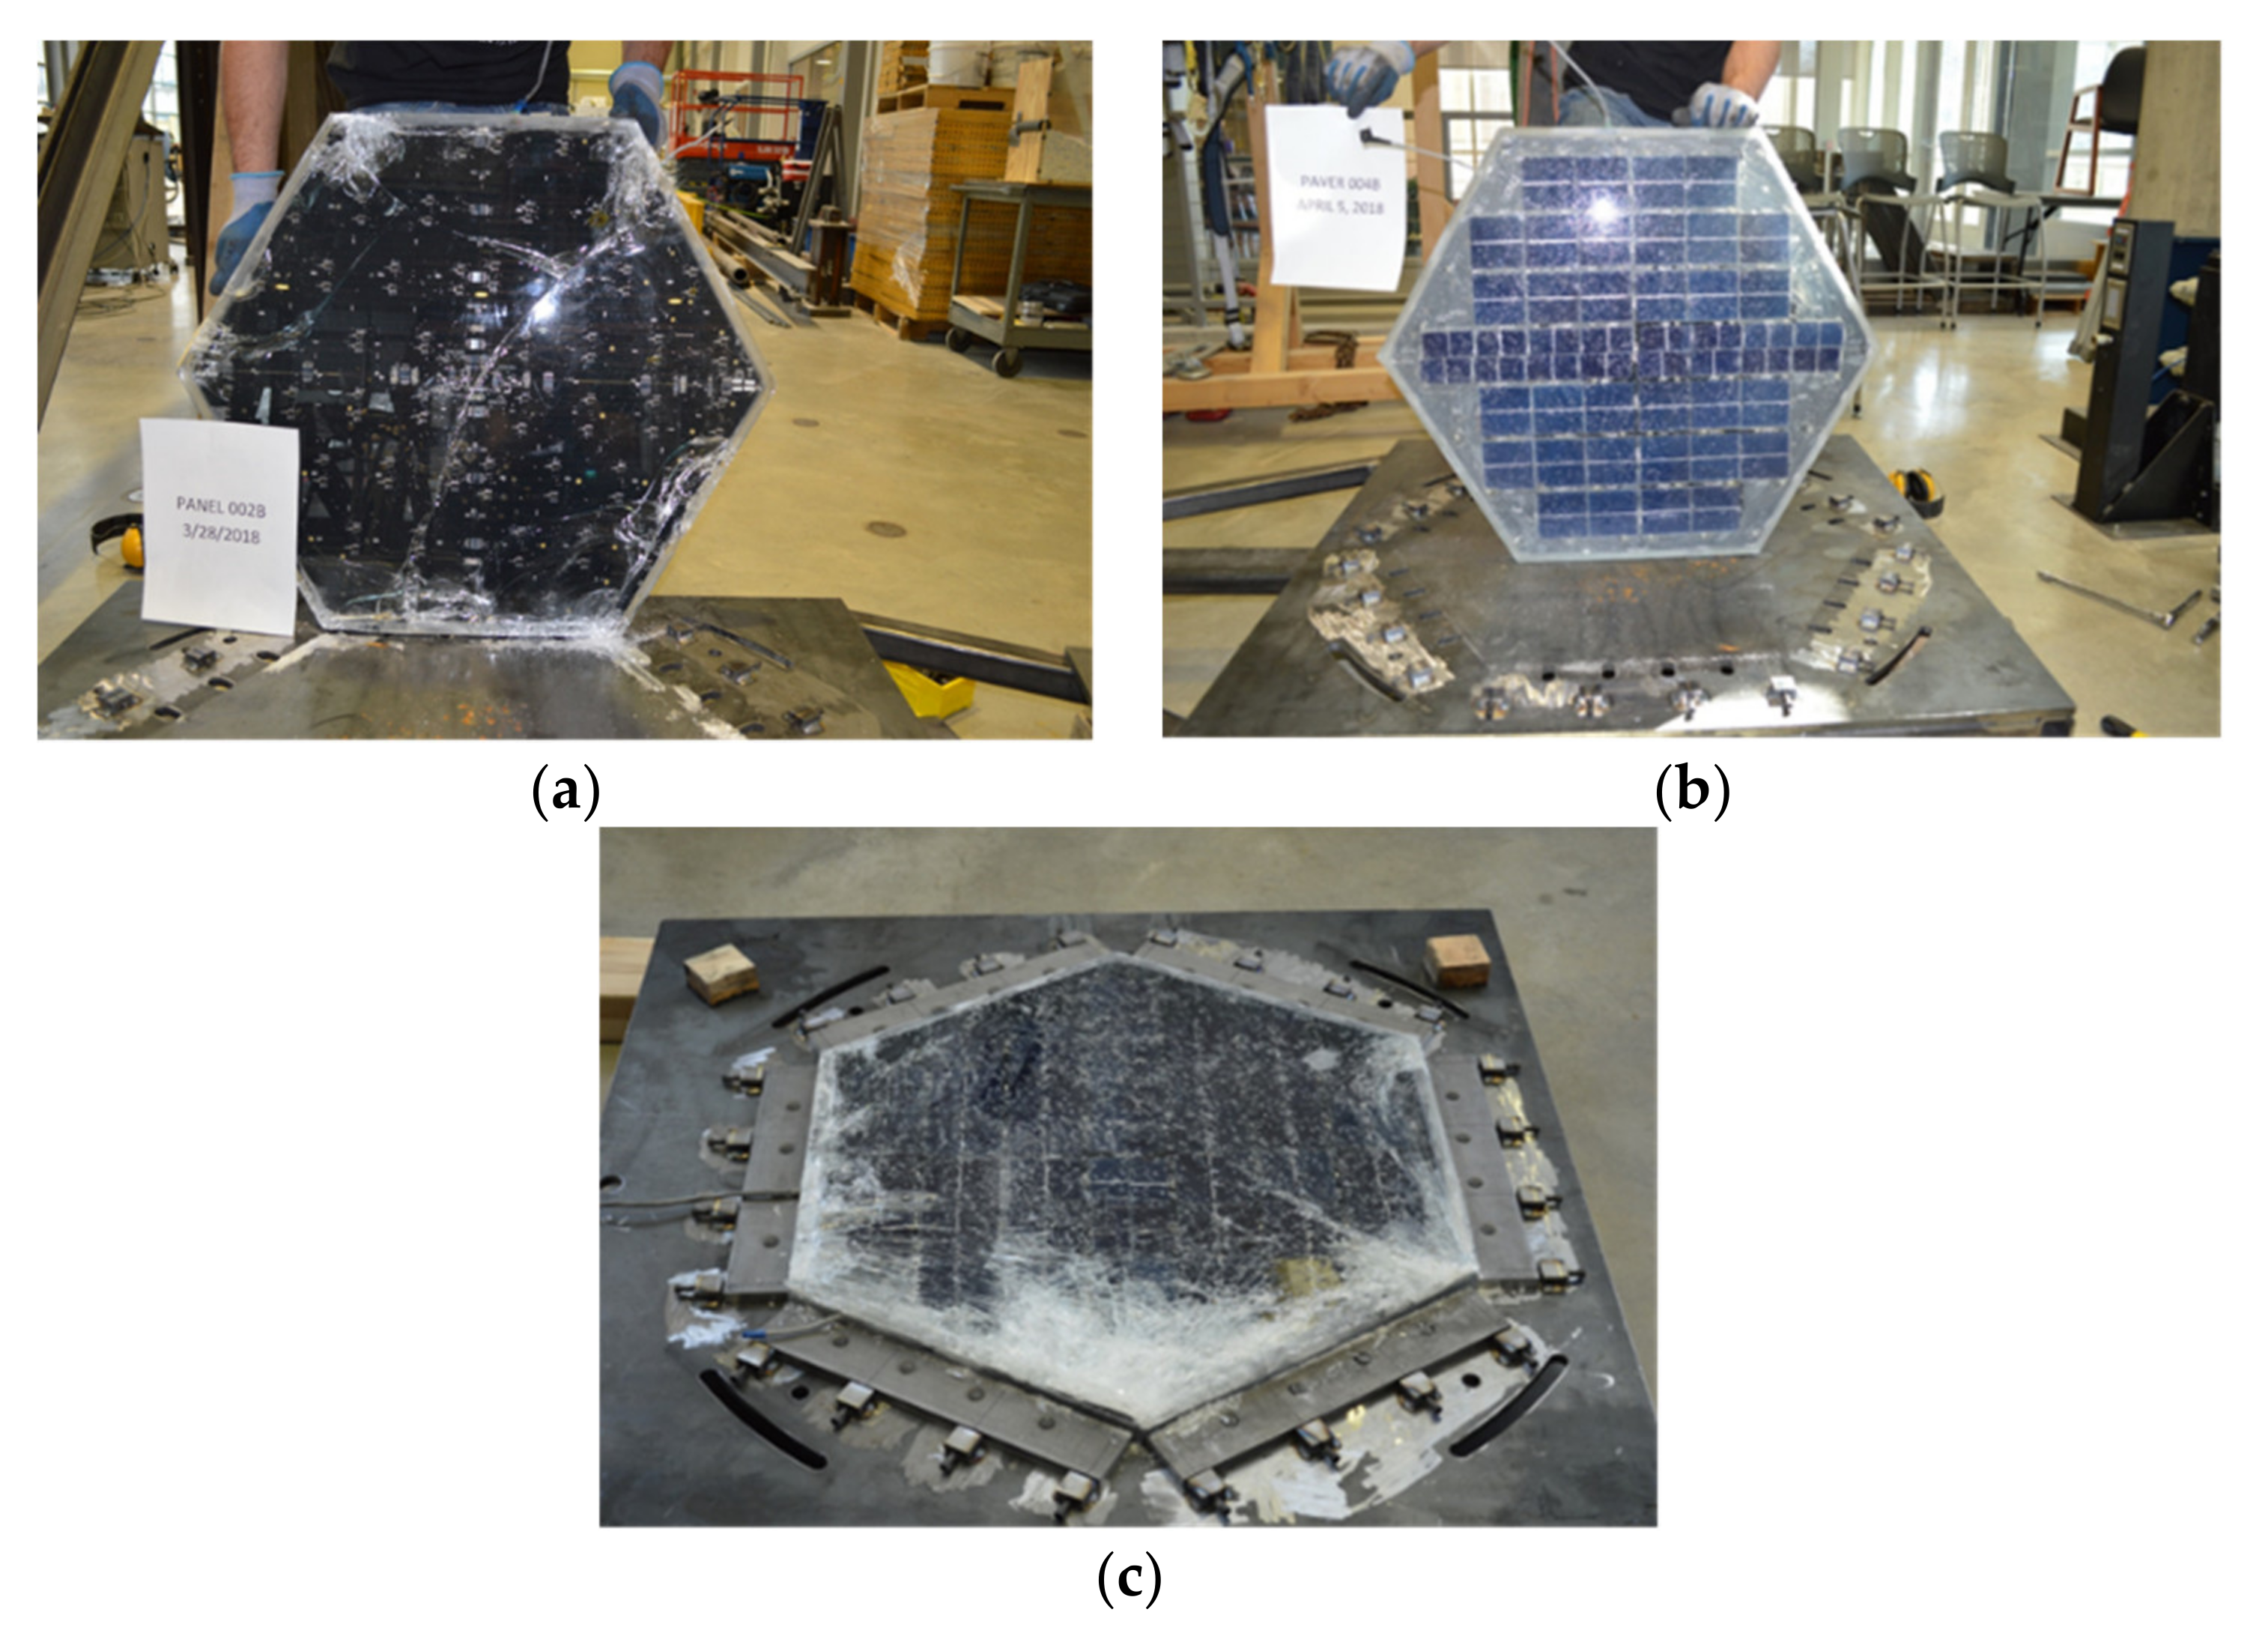
The degradation of the LED performance is not due to repeated loading. It was attributed to the process uncertainty during SRP manufacturing as shown in Figure 8a, for example (i.e., cracked internal PV cells, internal in-polymer “bubble” formations, variances in the external “etched” surface grip/traction features, etc.). In addition, the continuous outdoor operation may have allowed moisture ingress from cracked wire shields as also observed in moisture test, as shown in Figure 8b.

5. Shear Testing

Based on the layered structure and size of the SRPs, tensile shear testing described in ASTM Active Standard D4255/D4255-15a, “Standard Test Method for In-Plane Shear Properties of Polymer Matrix Composite Materials by the Rail Shear Method” [36] was not possible due to the difficulty in attaching required fixture points to the SRPs. Preliminary shear testing described in ASTM D143-14 “Standard Test Methods for Small Clear Specimens of Timber” [37] was accomplished using a sample of the materials used in the SRPs shear test sample, to evaluate the ability of each material layer to resist shear forces introduced by an external compressive force as shown in Figure 9. The results of the preliminary shear test revealed that approximately 5.8 × 10³ kN would be needed to plane shear test a full-sized SRP. Based on this, the team designed a rotational shear test fixture described in test methodology.

5.1. Test Methodology

To test the SRPs a rotational shear fixture was specially designed to shear the hexagonal panels through a maximum rotation of 0.148 radians (8.48°) with a maximum moment of 219.6 kN∙m. The system was designed to utilize an material testing system (MTS) 36-kip (160.1 kN) actuator with a 25.4 cm stroke (±12.7 cm) to find the max stress required to rotationally shear the SRPs. Figure 10 illustrates how the SRP shear test was conducted at Marquette University’s Engineering Materials and Structural Testing Laboratory (EMSTL).
The test fixture is shown in Figure 11. The fixture consists of a fixed back plate constructed of 1.27 cm steel plate reinforced by 5.08 cm x 5.08 cm steel tube welded to the perimeter connected to both the laboratory’s strong floor and strong wall (Figure 11a), and a front plate that is free to rotate (Figure 11b).
The paver is held in place by steel plates that act as grips which attach to the front and back plates of the fixture. The grips extend approximately 90% of each glass plate depth (1.27 cm). The glass strength was far greater than anticipated based on the preliminary small-scale shear tests performed on similar materials prior to the full-scale paver tests. As a result, the grips were re-designed after the first shear test to have an increased height as well as providing “roller” supports along the outside grip face to greatly reduce the unbraced length. Figure 12a shows the front half of the fixture with an SRP held in the original steel grips. Figure 12b shows the front half of the fixture with the reinforced grips.
The front panel of the fixture was attached to the MTS hydraulic actuator by means of a pin connection at the end of a 1.37 m arm that allowed the necessary rotational shear force to develop.
The pavers were loaded at a rate of 0.64 cm/min by moving the actuator up, rotating the “front” half of the fixture counter clockwise when viewed from the angle in Figure 13, pavers were loaded until physical failure occurred, which was expected to include shattering of the glass, delamination of the paver, or electrical failure of the solar elements. Pavers were loaded until physical failure occurred in the case(s) of pavers 002B, 007C and 004B. Paver 1, the first paver tested, was loaded until electrical failure of the PV solar cells was detected. For pavers 002B, 007C, 004B, load, actuator displacement, and PV solar voltage output data were collected at 5 Hz. For Paver 1, only load and actuator displacement were recorded, also at 5 Hz.
The test fixture was run through over 17.78 cm of actuator displacement without a paver in place several times to establish the frictional resistance of the system and to ensure there was no off-axis binding occurring over the entire planned test deflection. As the plot in Figure 14 shows, the weight of the fixture and the frictional component is relatively constant up to a fixture deflection of approximately +10.16 cm (absolute value) at which point a significant increase in load develops indicating the actuator was no longer moving orthogonally with respect to the fixture arm and binding occurred. This data set shows the maximum test span available to be 17.78 cm or 0.13 radians opposed to the design maximum of 0.148 radians.

5.2. Test Results

Paver 1 was the first specimen tested. The load vs. actuator deflection for Paver 1 is shown in Figure 15. The applied load was significantly greater than anticipated and as a result, the fixture grips (1.27 cm A36 steel) deformed. This deformation allowed the panel to experience a decreased load compared to what the panel would have experienced had the grips stayed rigid and not deformed during the test. The test was stopped at an actuator deflection of +10.16 cm, our previously determined maximum testing deflection of the fixture. After the Paver 1 test, the fixture was disassembled, and the steel grips were re-designed and manufactured as previously discussed in test methodology.
Pavers 002B, 004B, and 007C were all tested using the redesigned, stiffened grips. In addition to load and actuator deflections, the pavers’ solar cell output voltage was collected by the MTS control software and plotted along with the load-deflection curves.
As can be seen from the load-displacement plots, these three panels behaved very similarly, both in terms of the slope of the load-deflection curve and the maximum loads reached before failure. Pavers 002B and 007C failed due to one of the glass panels rupturing and paver 004B failed by delamination of the middle substrate elastomeric material.
Pavers 002B and 004B show solar cell output voltage going to zero at approximately 2.54 cm of actuator deflection; Paver 007C’s solar cell output went to zero after approximately 3.56 cm of actuator deflection. Figure 16 the load vs. actuator displacement and solar cell output voltage plots for Panels 002B, 004B, and 007C. Table 1 summaries the maximum shear stress and torque experienced by the pavers.
Paver 004B’s test was continued after electrical failure occurred and after peak load dropped off significantly to better understand cases where the glass panels did not fail but the middle substrate material failed or delaminated. The test was aborted after approximately 11.43 cm of actuator deflection (relative). The SRP LEDs were tested before and after each test. In addition, the “heartbeat” LED and PV solar voltage were monitored during each test. In all cases, the SRP LEDs were operational pre and post-test and the “heartbeat” LED operated properly during each shear test showing functionality of the circuit board throughout testing. Figure 17 shows the picture of the paver panels after the failures occurred.
We have calculated the standard error of mean (SEM) and relative standard error (percentage of mean) from Table 1. SEM for maximum shear stress is 39.95 kPa which is 4.4% of the mean. Furthermore, SEM for maximum Torque is 6.09 kN·m which is 4.73% of the mean. Both errors lie within ±5% of mean values.

6. Conclusions

Four different tests were conducted to assess the feasibility of SRPs as a replacement roadway material with the added benefit of generating electric power. Specifically, we tested mechanical properties this unique pavement material in submerged water environments, under extreme temperature conditions, under dynamic loading conditions and by applying shear stress. Moisture conditioning and freeze/thaw test showed that weather extremes don’t have a significant adverse effect on the SRPs. In heavy vehicle testing we found no physical damage in SRPs after approximately 989, 457 ESAL’s. The data collected at Marquette University’s EMSTL showed the SRPs to be resistant to deformation under shear loading. The SRPs shear test results could not be compared directly to published ASTM standards due to the unique nature and/or geometry of the SRPs. The failure mechanism of the SRPs, except for Paver 0004B, is consistent with testing performed at Lund University, Sweden on glass joints using silicones with a thickness of 6 mm. The study showed that fractures initiated within the silicone along the edges and at corners often at local defects in the silicone-glass interface during small scale tests [38]. Based on the first paver test (Panel 1), the steel grips were redesigned to stiffen the fixture and facilitate a mechanical failure of the SRPs. All the pavers failed electrically when the PV signal dropped to zero volts showing a failure of the solar elements. In all cases, the SRP “heartbeat” LED was functional pre, post, and during each shear test showing a functioning circuit board throughout the testing process. Due to the unique nature of the SRPs and the materials used to manufacture them, no direct comparison to concrete, asphalt, or other plastic materials can be made but the minimum shear stress found to fail a panel physically was 1643 kPa. Critical shear stress values found at Lund University on 6 mm silicone joints ranged from 0.9–2.5 MPa which spans the experimental range of 1.6–2.0 MPa for the SRPs [38]. We observed some anomalies in the LED functionalities. All these are attributed to the process uncertainty and defect during SRP manufacturing. In conclusion, the results of all the four tests show current SRPs to be robust, resilient, and functional when subject to “real-world” test conditions.

Author Contributions

Conceptualization, R.A.C.J. and S.B.; methodology, R.A.C.J. and D.N.; writing—original draft preparation, M.M. and J.H.T.; writing—review and editing, R.A.C.J. and D.N.; supervision, R.A.C.J. and D.N; project administration, R.A.C.J.; funding acquisition, S.B. and R.A.C.J. All authors have read and agreed to the published version of the manuscript.

Funding

This research was funded by Solar Roadways, Inc. based on their Phase IIb SBIR grant from the DoT.

Acknowledgments

We thank Marquette University’s Opus College of Engineering Discovery Learning Center for shop support, Justin Johnson for welding services, Adam Walker for Shear testing support, James Crovetti for HVS testing expertise, Ashish Mishra for HVS support, and Mohammad Shakhawat Hossain for researching references.

Conflicts of Interest

The authors declare no conflicts of interest.

References

  1. Cook-Chennault, A.K.; Thambi, N.; Sastry, A.M. Powering MEMS portable devices—A review of non-regenerative and regenerative power supply systems with special emphasis on piezoelectric energy harvesting systems. Smart Mater. Struct. 2008, 17, 43001. [Google Scholar] [CrossRef] [Green Version]
  2. International Technology Roadmap for Photovoltaic (ITRPV). 2017. Available online: http://www.itrpv.net/Reports/Downloads (accessed on 10 July 2018).
  3. Battaglia, C.; Cuevas, A.; De Wolf, S. High-efficiency crystalline silicon solar cells: Status and perspectives. Energy Environ. Sci. 2016, 9, 1552–1576. [Google Scholar] [CrossRef] [Green Version]
  4. Yoshikawa, K.; Kawasaki, H.; Yoshida, W.; Irie, T.; Konishi, K.; Nakano, K.; Uto, T.; Adachi, D.; Kanematsu, M.; Uzu, H.; et al. Silicon heterojunction solar cell with interdigitated back contacts for a photoconversion efficiency over 26%. Nat. Energy 2017, 2, 17032. [Google Scholar] [CrossRef]
  5. Shekhar, A.; Kumaravel, V.K.; Klerks, S.; De Wit, S.; Venugopal, P.; Narayan, N.; Bauer, P.; Isabella, O.; Zeman, M. Harvesting Roadway Solar Energy—Performance of the Installed Infrastructure Integrated PV Bike Path. IEEE J. Photovolt. 2018, 8, 1066–1073. [Google Scholar] [CrossRef]
  6. Celik, T.; Kusetogullari, H. Solar-powered automated road surveillance system for speed violation detection. IEEE Trans. Ind. Electron. 2010, 57, 3216–3227. [Google Scholar] [CrossRef]
  7. Diong, B. Justification and conceptual design of solar-powered traffic signal systems. In Proceedings of the 2014 International Conference on Renewable Energy Research and Application (ICRERA), Milwaukee, WI, USA, 19–22 October 2014; pp. 595–600. [Google Scholar]
  8. Vageesh, D.C.; Patra, M.; Murthy, C.S.R. Joint placement and sleep scheduling of grid-connected solar powered road side units in vehicular networks. In Proceedings of the 2014 12th International Symposium on Modeling and Optimization in Mobile, Ad Hoc, and Wireless Networks (WiOpt), Hammamet, Tunisia, 12–16 May 2014; pp. 534–540. [Google Scholar]
  9. Ali, Q.I. Event driven duty cycling: An efficient power management scheme for a solar-energy harvested road side unit. IET Electr. Syst. Transp. 2016, 6, 222–235. [Google Scholar] [CrossRef]
  10. Rajab, Z.; Khalil, A.; Amhamed, M.; Asheibi, A. Economic feasibility of solar powered street lighting system in Libya. In Proceedings of the 2017 8th International Renewable Energy Congress (IREC), Amman, Jordan, 21–23 March 2017; pp. 1–6. [Google Scholar]
  11. Naik, M.B.; Kumar, P.; Majhi, S. Small-scale solar plants coupled with smart public transport system and its coordination with the grid. IET Electr. Syst. Transp. 2016, 7, 135–144. [Google Scholar] [CrossRef]
  12. Zhou, Z.; Hu, S.; Zhang, X.; Zuo, J. Characteristics and application of road absorbing solar energy. Front. Energy 2013, 7, 525–534. [Google Scholar] [CrossRef]
  13. Hall, M.R.; Dehdezi, P.K.; Dawson, A.R.; Grenfell, J.; Isola, R. Influence of the thermophysical properties of pavement materials on the evolution of temperature depth profiles in different climatic regions. J. Mater. Civ. Eng. 2011, 24, 32–47. [Google Scholar] [CrossRef]
  14. Hendrowati, W.; Guntur, H.L.; Sutantra, I.N. Design, Modeling and Analysis of Implementing a Multilayer Piezoelectric Vibration Energy Harvesting Mechanism in the Vehicle Suspension. Engineering 2012, 4, 728–738. [Google Scholar] [CrossRef] [Green Version]
  15. IEA (International Energy Agency). Technology Roadmap: Fuel Economy of Road Vehicles; International Energy Agency: Paris, France, 2012; Available online: http://www.iea.org/publications/freepublications/publication/Fuel_Economy_2012_WEB.pdf (accessed on 9 October 2019).
  16. Andriopoulou, S. A Review on Energy Harvesting from Roads; KTH: Stockholm, Sweden, 2012. [Google Scholar]
  17. Duarte, F.; Ferreira, A. Energy harvesting on road pavements: State of the art. Proc. Inst. Civ. Eng.-Energy 2016, 169, 79–90. [Google Scholar] [CrossRef]
  18. Tu, Y.-P.; Li, J.; Guan, C.-S. Heat Transfer Analysis of Asphalt Concrete Pavement Based on Snow Melting. In Proceedings of the 2010 International Conference on Electrical and Control Engineering, Wuhan, China, 25–27 June 2010; pp. 3795–3798. [Google Scholar]
  19. Shaopeng, W.; Mingyu, C.; Jizhe, Z. Laboratory investigation into thermal response of asphalt pavements as solar collector by application of small-scale slabs. Appl. Therm. Eng. 2011, 31, 1582–1587. [Google Scholar] [CrossRef]
  20. Larsson, O.; Thelandersson, S. Estimating extreme values of thermal gradients in concrete structures. Mater. Struct. 2011, 44, 1491–1500. [Google Scholar] [CrossRef]
  21. Zhao, H.; Yu, J.; Ling, J. Finite element analysis of Cymbal piezoelectric transducers for harvesting energy from asphalt pavement. J. Ceram. Soc. Jpn. 2010, 118, 909–915. [Google Scholar] [CrossRef] [Green Version]
  22. Abramovich, H.; Milgrom, C.; Harash, E.; Azulay, L.E.; Amit, U.; Klein, G. Piezoelectric-Based Weight in Motion System and Method for Moving Vehicles. International Patent Application PCT/IL2011/000741, Patent WO2012038955 A1, 29 March 2012. [Google Scholar]
  23. Xiong, H.; Wang, L.; Wang, D.; Druta, C. Piezoelectric energy harvesting from traffic induced deformation of pavements. Int. J. Pavement Res. Technol. 2012, 5, 333–337. [Google Scholar]
  24. Pool, R. Sunshine highways. Eng. Technol. 2011, 6, 54–57. [Google Scholar] [CrossRef]
  25. Lee, K.W.; Correia, A.J. A Pilot Study for Investigation of Novel Methods to Harvest Solar Energy from Asphalt Pavements; Final Report for Korea Institute of Construction Technology (KICT): Kingston, RI, USA, 2010. [Google Scholar]
  26. Northmore, A.B.; Tighe, S. Developing innovative roads using solar technologies. In Proceedings of the 2012 Annual Conference of the Canadian Society for Civil Engineering, Edmonton, AB, Canada, 6–9 June 2012; Volume 2, pp. 1348–1355. [Google Scholar]
  27. Brusaw, S. Solar Roadways, Specifics. Available online: http://www.solarroadways.com/home/specifics (accessed on 25 February 2016).
  28. Brusaw, S.; Brusaw, J. Solar Roadway Panel. Design Patent USD712822S, 9 September 2014. [Google Scholar]
  29. SolaRoad. Available online: www.solaroad.nl (accessed on 25 November 2018).
  30. Pultarova, T. News Briefing: Energy-Welcome to the world’s first solar road. Eng. Technol. 2017, 12, 10. [Google Scholar] [CrossRef]
  31. Dezfooli, A.S.; Nejad, F.M.; Zakeri, H.; Kazemifard, S. Solar pavement: A new emerging technology. Sol. Energy 2017, 149, 272–284. [Google Scholar] [CrossRef]
  32. Coutu, R.A., Jr.; Newman, D.; Crovetti, J.; Mishra, A.K.; Munna, M.; Delbridge-Ramos, A.; Brusaw, J.; Brusaw, S. Testing Photovoltaic Pavers for Roadway Applications. Sustain. Environ. 2019, 4, 86. [Google Scholar] [CrossRef]
  33. ASTM Standard D570-98(2010) e1. (2014). Standard Test Method for Water Absorption of Plastics. ASTM International, West Conshohocken, PA. Available online: http://www.astm.org (accessed on 9 October 2019).
  34. ASTM Standard C1645/C1645-15, Standard Test Method for Freeze-Thaw and De-Icing Salt Durability of Solid Concrete Interlocking Paving Units; ASTM International: West Conshohocken, PA, USA, 2010.
  35. Wright, P.; Ashford, N. Transportation Engineering: Planning and Design, 4th ed.; John Wiley & Sons, Inc.: Hoboken, NJ, USA, 1998. [Google Scholar]
  36. ASTM Standard D4255/4255M-01, Standard Test Method for In-Plane Shear Properties of Polymer Matrix Composite Materials by the Rail Shear Method; ASTM International: West Conshohocken, PA, USA, 2010. [CrossRef]
  37. ASTM Standard D143-14, Standard Test Methods for Small Clear Specimens of Timber; ASTM International: West Conshohocken, PA, USA, 2014. [CrossRef]
  38. Larsson, O. Shear Capacity in Adhesieve Glass-Joints. Master’s Thesis, Lund Universit, Lund, Sweden, 2008. [Google Scholar]
Figure 1. SR1 prototype: (a) schematic drawing; (b) actual panel (Brusaw, 2016).
Technologies 08 00009 g001
Figure 2. SR2 prototype; (a) schematic drawing; (b) actual panel (Brusaw, 2016).
Technologies 08 00009 g002
Figure 3. SR1 prototype; (a) schematic drawing; (b) actual panel (Brusaw, 2016).
Technologies 08 00009 g003
Figure 4. Energy harvesting data for three different locations.
Technologies 08 00009 g004
Figure 5. Moisture conditioning duration testing: (a) single 1135.62 litter aluminum container used during the SRP moisture conditioning duration testing. The paver electrical connectors were fixed above the waterline during testing; (b) test apparatus for weighing the solar road panels (SRPs) before and after each moisture conditioning test.
Technologies 08 00009 g005
Figure 6. Heavy vehicle simulation (HVS) test facility located at Marquette University.
Technologies 08 00009 g006
Figure 7. Light emitting diode status (a) on 9 July 2018 (serial number 015A-015F depicted from front to back) and (b) on 18 September 2018 (S/N’s 015A-015F depicted from left to right).
Technologies 08 00009 g007
Figure 8. (a) Photograph revealing cord damage on panel; (b) example panel variations due to manufacturing process (i.e., internal in-polymer “bubble” formation).
Technologies 08 00009 g008
Figure 9. Test jig and sample for preliminary compressive load shear testing.
Technologies 08 00009 g009
Figure 10. Schematic drawing of “SR3” shear testing.
Technologies 08 00009 g010
Figure 11. Computer-aided design (CAD) model of rotational shear fixture for the “SR3” pavers; (a) shown in the Engineering Materials and Structural Testing Laboratory (EMSTL); (b) the fixture only.
Technologies 08 00009 g011
Figure 12. (a) Front of test fixture with original steel grips and a paver installed; (b) front of test fixture with reinforced grips.
Technologies 08 00009 g012
Figure 13. Shear test fixture with “SR3” paver installed in EMSTL.
Technologies 08 00009 g013
Figure 14. Empty fixture load vs. actuator deflection.
Technologies 08 00009 g014
Figure 15. Load vs. actuator deflection Paver 1.
Technologies 08 00009 g015
Figure 16. Load vs. actuator deflection with voltage output for (a) Paver 002B; (b) Paver 004B; and (c) Paver 007C (our material testing system (MTS) actuators are calibrated to within ±1.0% over the full range of both load and displacement.
Technologies 08 00009 g016
Figure 17. Post-test failure mode; (a) Paver 002B, (b) Paver 004B, and (c) Paver 007C.
Technologies 08 00009 g017
Table 1. Shear test data.
Paver I.D.Shear Stress Maximum, kPaTorque Maximum, kN·m
Paver 11756121.2
002B1835131.3
004B2023144.8
007C1643117.6

