1. Introduction
The combustion of fuels containing sulfur produces sulfur dioxide, which is liable to a series of air pollution events. Human exposure to sulfur dioxide in the ambient air has been related to respiratory system diseases and even lung cancer [
1]. Therefore, in 2006 the U.S. Environmental Protection Agency (EPA) reduced the allowable sulfur levels in liquid fuels. The gasoline sulfur limit was reduced to 30 ppm, while the diesel fuel sulfur limit was reduced to 15 ppm [
2]. With time, EPA regulations became more stringent. However, the existing desulfurization technologies failed to reduce the sulfur level of gasoline or diesel fuel to less than 10 ppm [
1,
3].
Various methods such as adsorption desulfurization (ADS) [
3], biodesulfurization (BDS) [
4], extraction desulfurization (EDS) and oxidative desulfurization (ODS) have been reported for the removal of sulfur compounds from fuels [
1,
5,
6]. Hydrodesulfurization (HDS) is the most popular and effective sulfur removing technology in refineries. However, the production of ultra-low sulfur fuels requires a large volume of catalyst [
7]. Adsorptive desulfurization can provide low sulfur fuel for fuel cells and catalyst beds. Many technologies have diverged from HDS to produce low sulfur products; however, sorption, catalytic oxidation, and evaporation show the most potential among them [
8]. Oxidative desulfurization (ODS) is an alternative technique for adsorptive sulfur removal. Normally an oxidative reagent is used in combination with the catalyst to oxidize the sulfur. In recent years, several kinds of ODS systems were developed successfully such as H
2O
2 organic matrixes, H
2O
2/Ti-modified zeolites, H
2O
2/polyoxometalates (POMs), H
2O
2/ionic liquid, H
2O
2/polyoxometalate-based ionic liquid, WO3/TiO
2 and CeO
2/TiO
2 [
9,
10]. The oxidation products are generally removed by an extraction process using solvents. Recently Ullah et al. reported on the adsorptive removal of benzothiophene (BT) from liquid fuel using a highly porous metal-organic framework based on a bicomponent zirconium (IV) benzene-tricarboxylate Zr (BTC), and its post-synthetically modified hybrid form with dodeca-tungstophosphoric acid (HPW/Zr(BTC) [
11]. Additionally, different microorganisms have been used to remove sulfur. Both aerobic and anaerobic microorganisms prove to be effective desulfurization agents while maintaining aliphatic and aromatic content in the fuel [
12]. Raj et al. investigated the effect of temperature, time and mass ratio for extractive desulfurization [
13].
The objective of the present study is to identify an adsorbent that selectively removes sulfur from transportation fuels. The candidate adsorbents contain nickel, zinc, and zirconia. Five different types of adsorbents have been examined. Identical support of magnesium and aluminium hydroxides (hydrotalcites) was used for each of these adsorbents in order to determine the influence of the main component (Ni, Zn and ZrO
2). Nickel is relatively inexpensive and has previously shown to be more promising for sulfur removal [
14]. Sulfur molecules from liquid fuels are adsorbed by direct interaction. Zinc oxide (ZnO), a highly active component used to remove sulfur species from refinery liquids [
15]. Zirconium is used as an efficient adsorbent for the desulfurization because of its moderate surface area, bifunctional properties of acid and base [
14]. The addition of nickel on ZnO and ZrO
2 is an innovative approach that takes advantage of the selectivity of Ni towards S-species and the high adsorptive capacity of ZnO and ZrO
2 support. It changes the nature of the active metal sites and increases the sulfur removing capacity of the adsorbent. Therefore, the current study compares different types of adsorbents in order to pave the way to remove sulfur to ultra-low levels by the selective adsorption of sulfur from liquid fuels.
2. Materials and Methods
Five modified hydrotalcite adsorbents were prepared by the combination of Mg, Al, Ni, Zn, and ZrO2. The first adsorbent is the combination of Mg: Al: Ni in the approximate molar ratio of 4:1:3. It is a highly active nickel adsorbent supported on magnesium and aluminium. Increasing the capacity of a nickel adsorbent is highly beneficial, as nickel adsorbents are very effective at removing sulfur compounds. It is believed that the addition of some substance to the fuel can help increase the capacity of the nickel adsorbent. The second adsorbent is the combination of Mg: Al: Zn in the approximate molar ratio of 4:1:3. The third adsorbent is prepared with the combination of Mg: Al: Ni: Zn in the approximate molar ratio of 4:1:3:3. The fourth one is Mg: Al: ZrO2 in the molar ratio of 4:1:7. The fifth adsorbent is Mg: Al: ZrO2: Ni in the mole ratio 4:1:7:3. All the adsorbents are prepared by the co-precipitation method. They are used for adsorption of thiophene (in n-pentane) and dibenzothiophene at ambient temperature and pressure. A model fuel consisting of 50 ml of n-pentane (C5H12) and thiophene (100 ppm) was prepared, and adsorption experiments were performed under ambient conditions. The physicochemical characterizations of the fresh adsorbents such as structure, component, bond, elements, and composition were conducted using X-ray diffraction (XRD), Raman spectroscopy, Fourier-transform infrared spectroscopy (FTIR), energy dispersive X-Ray analysis (EDAX), scanning electron microscopy (SEM), X-ray photoelectron spectroscopy (XPS) and thermogravimetric analysis (TGA). The sulfur concentration in the mixture was monitored by UV-Vis spectrophotometry. Finally, the thiophene removal efficiency of the five adsorbents were compared. In addition, qualitative studies using XPS were performed to investigate the sulfur removal efficiency and adsorptive nature of adsorbents on dibenzothiophene.
2.1. Adsorbent Preparation
Five hydrotalcites with Mg: Al ratio 3:1 were prepared by the co-precipitation method. In this method, two solutions, A and B, were added at the same rate 50 ml h−1 to a beaker containing 100 ml of deionized water while stirring.
Solution A was prepared by mixing an equimolar solution of Mg and Al metal nitrates (200 ml) in the 3:1 molar ratio [
16]. For making the adsorbent, Mg and Al metal nitrates were used as supporting metals and Zn, Ni, Zr were used as active metal. To make Ni adsorbent, Mg: Al: Ni molar ratio were used as 4:1:3. For making Zn adsorbent, Mg: Al: Zn molar ratio were used as 4:1:3. For making Zn and Ni combined adsorbent, Mg: Al: Ni: Zn molar ratio were used as 4:1:3:3. Zr adsorbent was prepared by maintaining Mg: Al: Zr molar ratio 4:1:7. Lastly, Ni and Zr adsorbent were prepared by maintaining Mg: Al: Ni: Zr molar ratio 4:1:3:7.
Solution B was prepared by dissolving 14 g sodium hydroxide (0.35 mol) and 15.9 g sodium carbonate (0.15 mol) in 200 ml deionized water. The pH of the suspensions was around 10. The precipitates were aged at 75 °C for 18 h in a dryer. The resulting product was filtered, washed thoroughly with deionized water until the filtrate showed no presence of NaOH, and subsequently dried at 95 °C for 24 hours. Part of the samples was heated at 450 °C for 12 h in a furnace for further calcinations and catalytic activity study.
2.2. Model Fuels using Thiophene (in Pentane) and Dibenzothiophene
Model fuels were used in some of the adsorbent testing to determine the selectivity of the adsorbent towards certain compounds. The model fuel consisted of pentane (C5H12) and thiophene, an organosulfur compound with the chemical formula C4H4S. The composition was 50 ml of pentane and 5 microliters of thiophene. It contained 100 ppm of thiophene in 50 ml of pentane. The sulfur compounds found in the model fuel contained highly substituted sulfur compounds, which tended to be more difficult to remove due to the steric hindrance around the sulfur atom. For making the calibration curve, five different concentrations of thiophene and pentane solution (20 ppm, 15 ppm, 10 ppm, 5 ppm, 0 ppm) were prepared. In addition, for the adsorbent performance testing, five different concentrations (100 ppm, 50 ppm, 25 ppm, 12 ppm, 6 ppm of thiophene in pentane solution) were prepared. A five-point calibration curve was made in order to retain the quality of analysis. For more accuracy and to understand the error, the response at each concentration was repeated to obtain the error bar from the responses. Additionally, the adsorbents were mixed with the dibenzothiophene for a qualitative study using the XPS. Percentages of sulfur removal capacity by the five adsorbents were measured by these five different concentrations (100 ppm, 50 ppm, 25 ppm, 12 ppm, 6 ppm of thiophene (in pentane solution) and dibenzothiophene.
2.3. Characterization Techniques
The powder X-ray diffraction (XRD) experiment of the sample was performed by the Bruker AXS D8 Discover diffractometer with GADDS (General Area Detector Diffraction System, Bruker Corporation, Billerica, MA, USA); operated by a Cu-Kα radiation source and filtered with a graphite monochromator (l = 1.5406 A˚). A HI STAR two-dimensional multi-wire area detector was used. All the samples were first ground to make very fine particle powder. The X-ray beam was 40 kV and 40 mA power. The incident ω angle was 5°. A laser system was used to ensure the alignment of the sample position on the instrument. XRD scans were recorded from 5° to 77° for 2θ with a 0.050° step-width and 180 step times. Further, the crystal sizes of different adsorbents were determined by Scherrer equation (L = kλ/(FWHM)Cosθ) with dimensionless shape factor, k = 0.94 and x-ray wavelength, λ = 1.5406 A˚. The full width at half maximum (FWHM) was determined using OriginPro software (version 9.0, Northampton, MA, USA). The multiple peak fit function was used in the case of nonlinear curve fitting.
Fourier-transform infrared spectroscopy (FTIR) spectra were recorded on a BRUKER TENSOR 27 FTIR Spectrometer (Bruker Corporation, Billerica, MA, USA). This machine works in the range of 400–4000 cm−1 wave number. In order to minimize the amount of bound water, the samples were kept in an air-tight container at room temperature until measurement, however, the possibility of water absorption from the atmosphere is not entirely excluded.
Hitachi S-3400N scanning electron microscope (SEM), (Hitachi, Ltd., Tokyo, Japan) was used to investigate the morphology and the composition of the adsorbents. Automatic beam axis alignment functions like auto beam setting and auto axial alignment were used. For this experiment, high SE resolution of 10 nm at 3 KV and 5-axis motorized stage with high tilt (−20 to +90 degree) and allowance for tall samples up to 80 mm high were used.
The sample’s thermal stability was studied by the thermogravimetric analysis (TGA) by the TGA instrument (Netzsch, STA 449C Jupiter, and TA Instruments SDT Q-600, Erich NETZSCH GmbH & Co. Holding KG, Selb, Germany). All the samples were heated from 25 to 1200 °C, and an airflow rate of 60 mL min−1 was maintained. The heating rate was 20 °C min−1. Differential scanning calorimetry (DSC) (Netzsch, STA 449C, and TA Instruments SDT Q-600, Erich NETZSCH GmbH & Co. Holding KG, Selb, Germany) measurements were carried out by maintaining the nitrogen flow rate of about 60 mL min−1.
The Raman spectra of the sample were measured using Perkin Elmer, RAMAN FLEX 400 Raman spectrometer (Perkin Elmer, Waltham, MA, USA). This machine probes in the spectral range from 230 cm−1 to 3,500 cm−1 Raman shift.
The UV visible measurements were performed on a Varian Cary 50 Version 3 UV Visible Spectrometer (Agilent Technologies, Santa Clara, CA, USA) coupled with the potentiostat for applying electrochemical potentials. To study the evolution, the difference between the maximum peak absorbance at a particular wavelength (λ
max), and the absorbance at the initial scanning wavelength (λ
0) was accounted and plotted vs. time [
17].
3. Result and Discussions
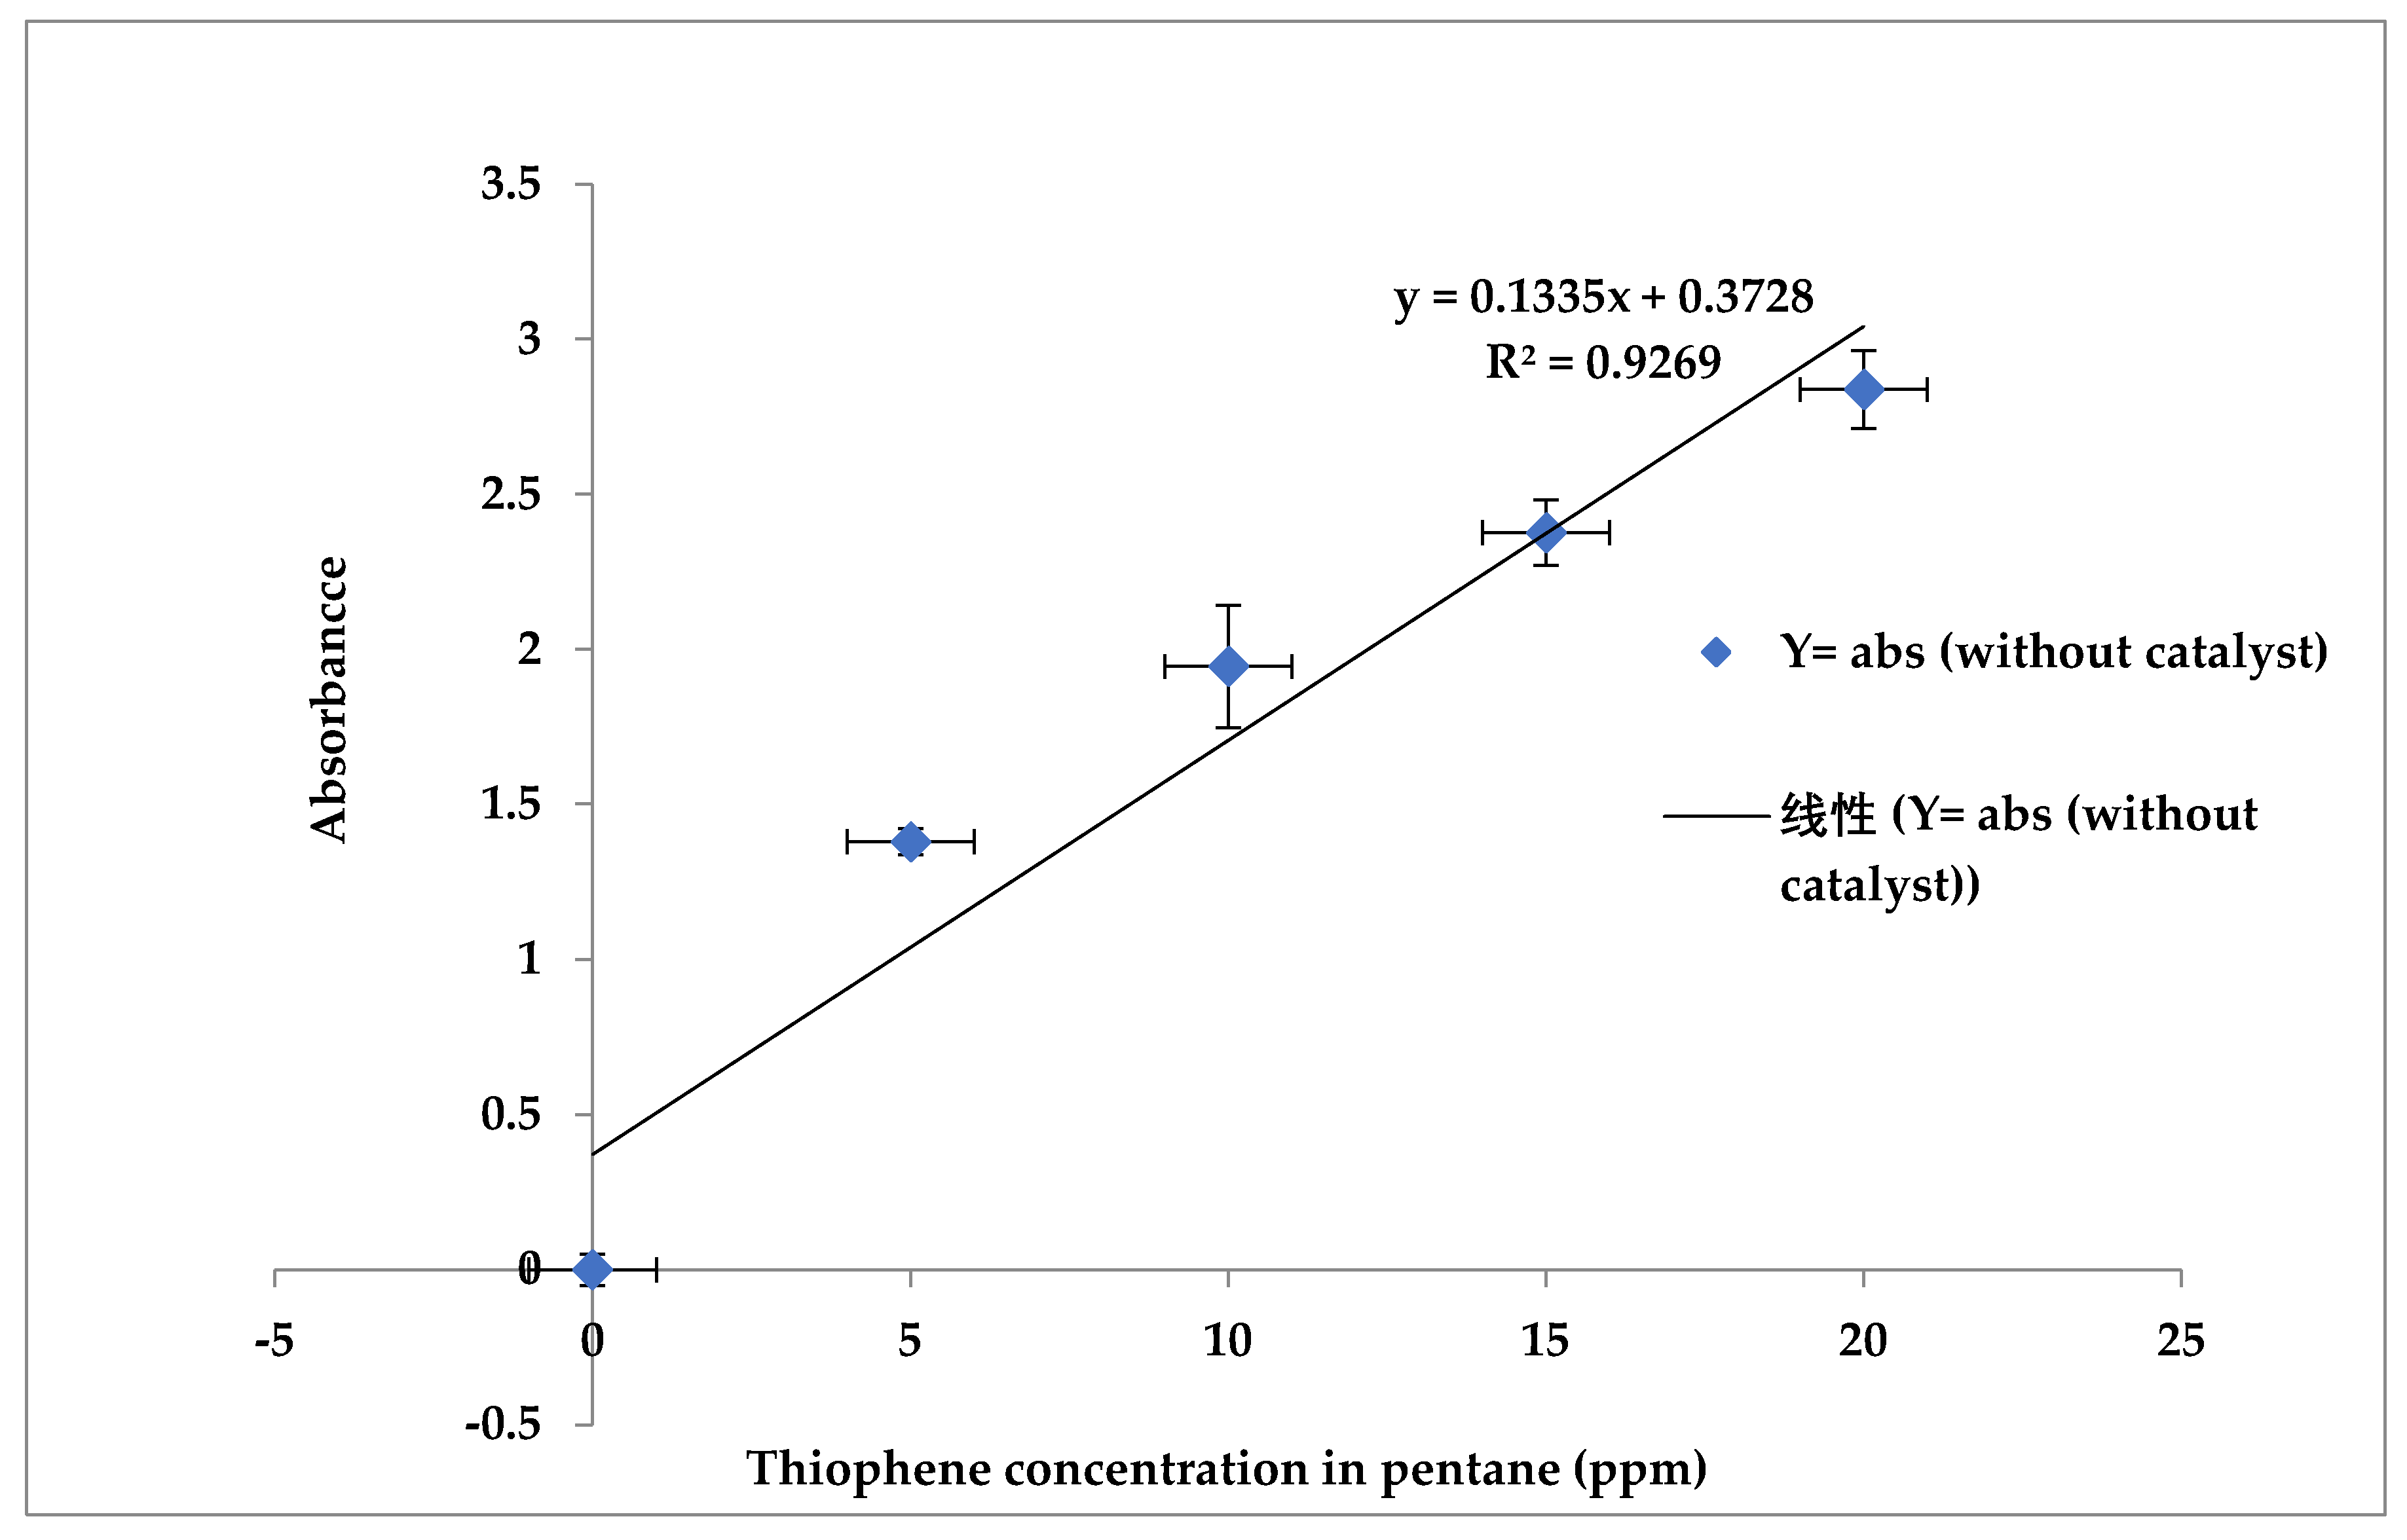
From the UV spectroscopy, pure pentane absorbance value of 0.564 at the 230 nm wavelength was determined. For every 20 ppm, 15 ppm, 10 ppm, 5 ppm concentration of thiophene in 50 ml pentane was measured at the 230 nm wavelength and then pure pentane value was subtracted from the measured value to determine the thiophene concentration. The absolute values for different thiophene concentrations are shown in
Figure 1. The calibration curve and equation are used to calculate the thiophene concentration in pentane after using the adsorbent.
3.1. XRD Analysis of the Adsorbents
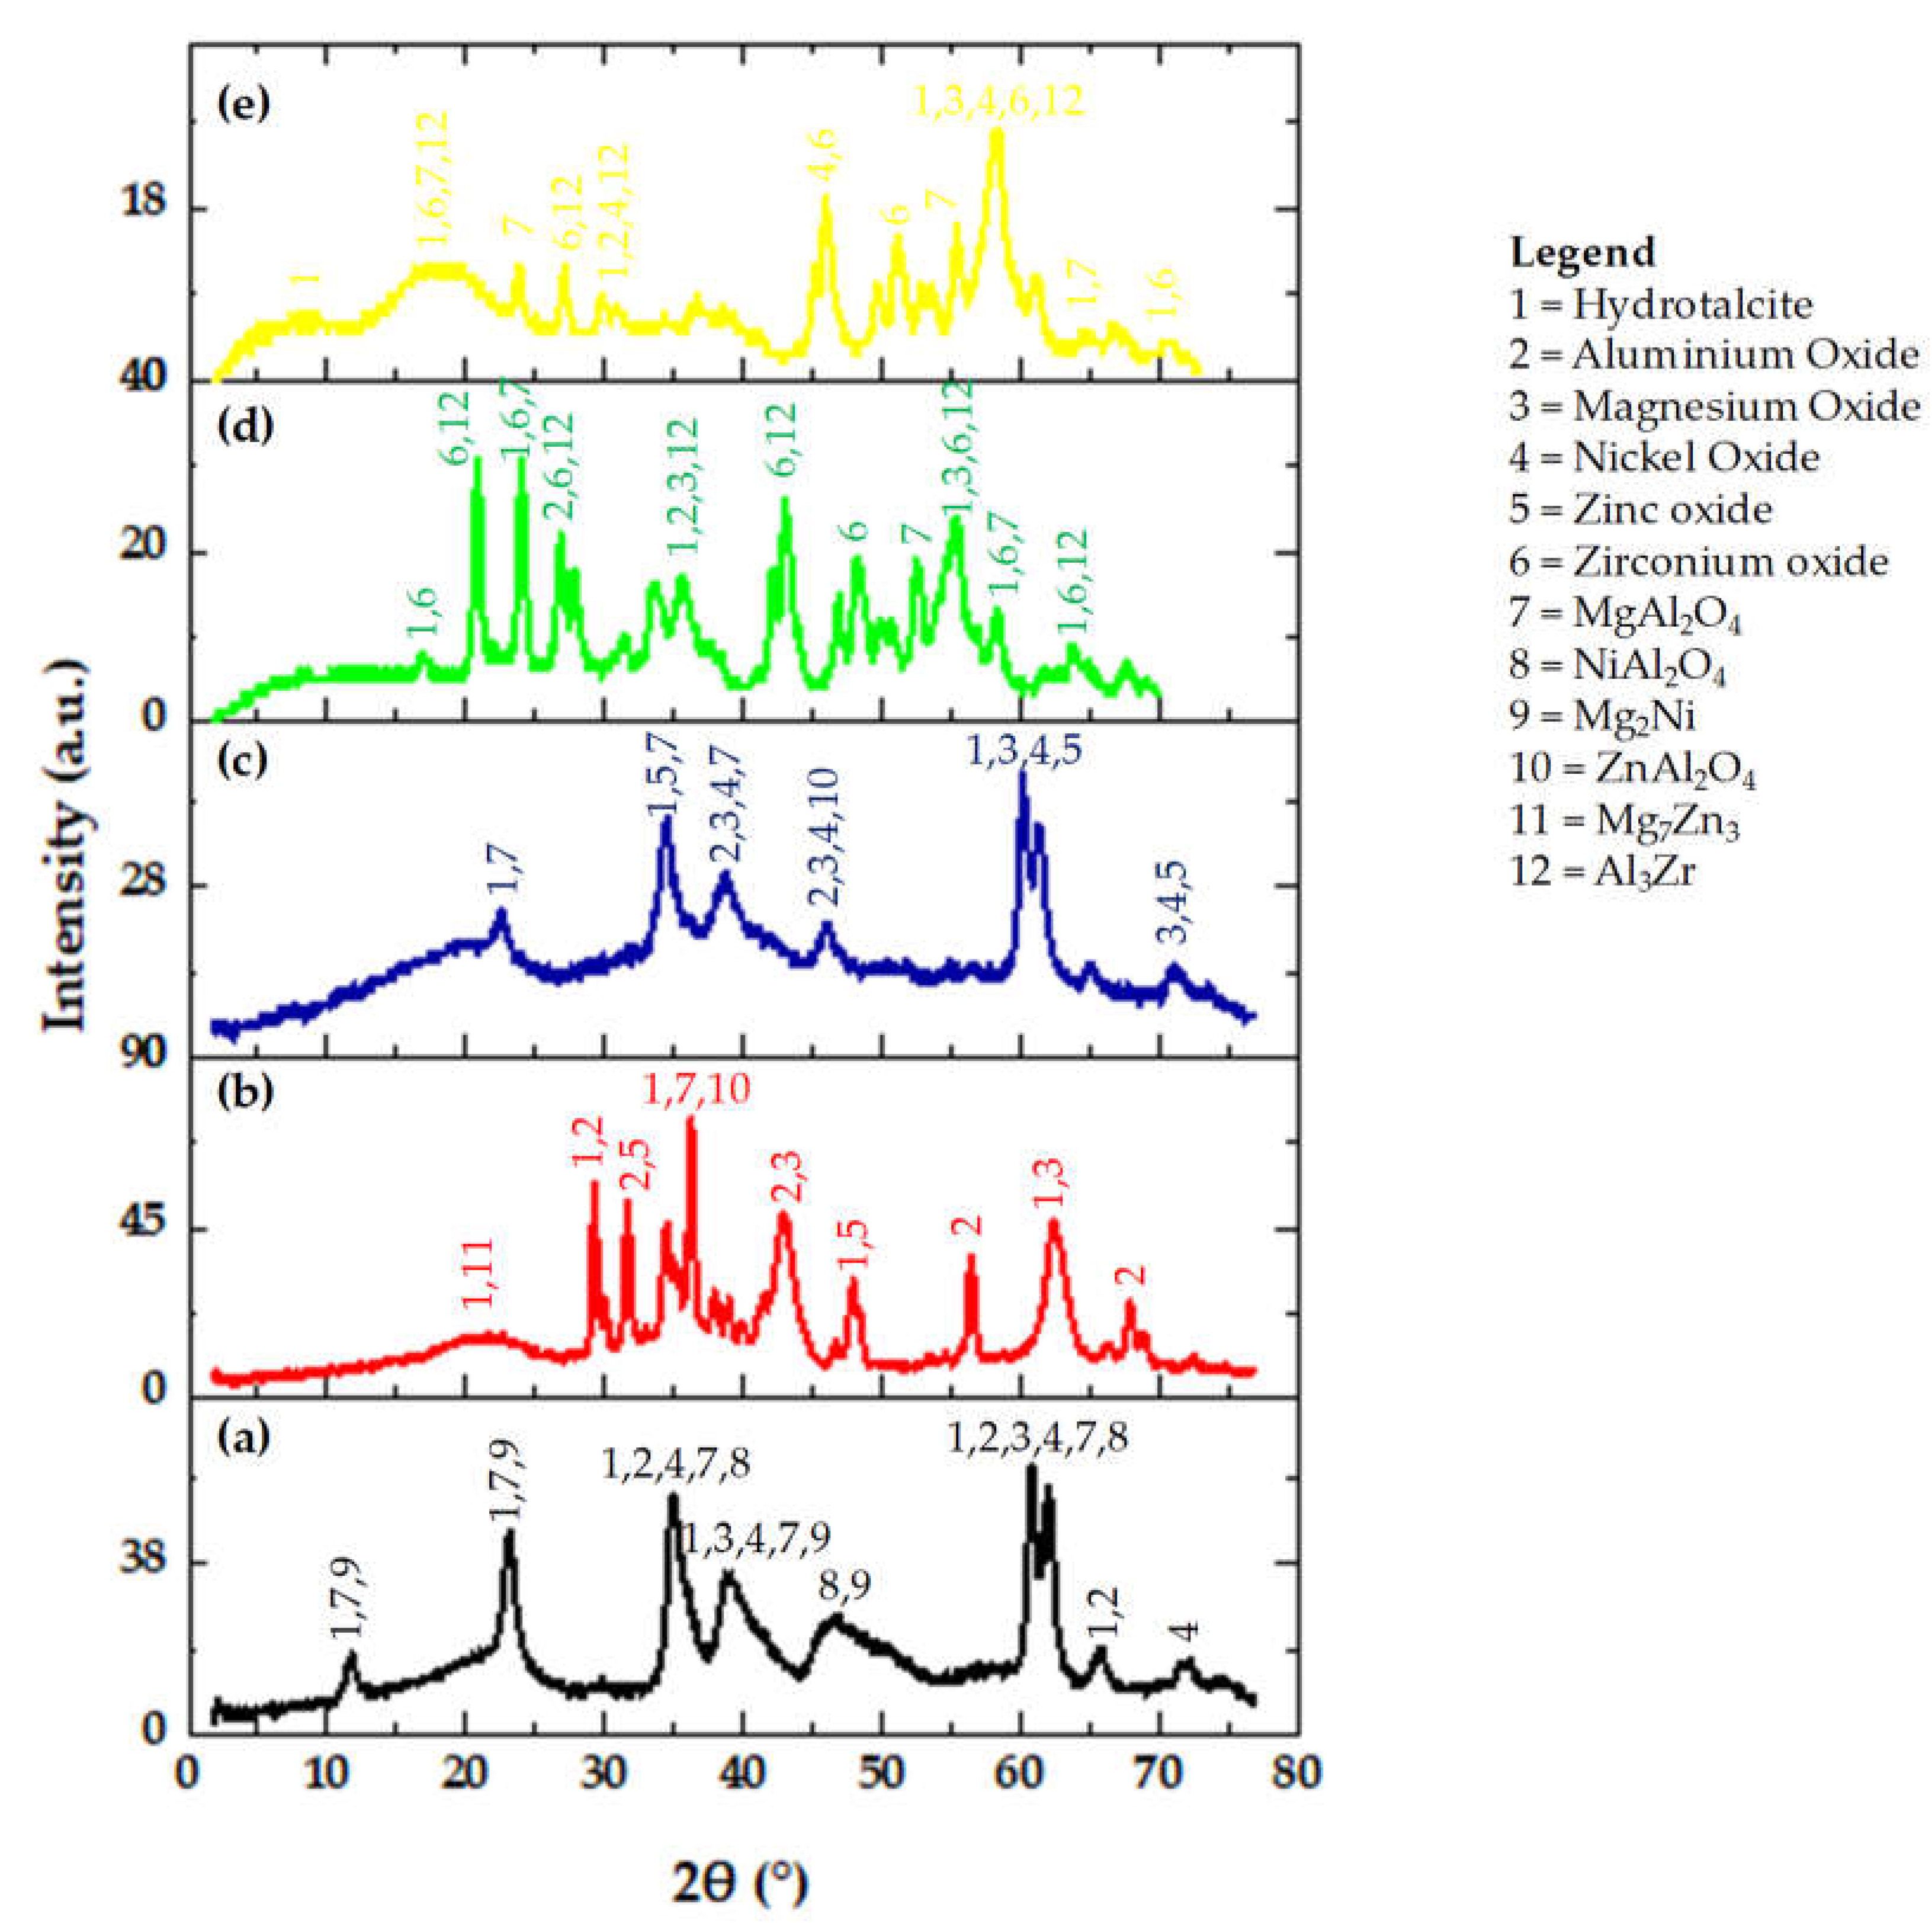
Figure 2a–e shows the X-ray diffractogram of the five adsorbents. From
Figure 2a, it is clear that there has been the presence of hydrotalcite in the Ni adsorbent. Hydrotalcite peaks were found at 11.35°, 22.4°, 34.34°, 38.49°, 61.72°, 65.41° 2-theta angles.
Figure 2a shows the presence of aluminium oxide, magnesium oxide, nickel oxide, magnesium aluminates, nickel aluminates, and magnesium nickel. Moreover, the formation of the hydrotalcite in the samples indicates the presence of carbonate in the interlayer of hydrotalcite. Hydrotalcite peaks are also observed at the same 2-theta angles for the Zn adsorbent (
Figure 2b) indicating the presence of aluminium oxide, magnesium oxide, zinc oxide, magnesium aluminates, zinc aluminates, and magnesium zinc etc. Hydrotalcite peaks were found at 22.4°, 34.34°, 61.72°, 71.6° 2-theta angle (JCPDS file no. 14-0191) for the Ni and Zn adsorbent (
Figure 2c). The XRD patterns of Zr, and Zr and Ni (
Figure 2d,e) indicate the presence of zirconia majorly in the form of the metastable tetragonal phase and minorly in the form of the monoclinic phase [
18]. Generally, the tetragonal phase of zirconia can be stabilized by incorporating the promoters into the zirconia lattice. It is well known that the tetragonal phase of Zr is more active in catalysis [
14]. The average crystalline sizes were calculated as 9.1 ± 2.8 nm for Ni adsorbent, 14.0 ± 3.9 nm for Zn adsorbent, 14.9 ± 7.6 nm for Ni and Zn adsorbent, 12.5 ± 1.0 nm for Zr adsorbent, 16.0 ± 7.5 nm for Zr and Ni adsorbent. The peak centers and corresponding FWHM are presented in the
Supplementary Materials (Table S1).
Overall, the XRD patterns show both sharp peaks and broad humped peaks, as are presented by the
Figure 2a–e, which indicate that the adsorbent materials are partially crystalline and partially amorphous.
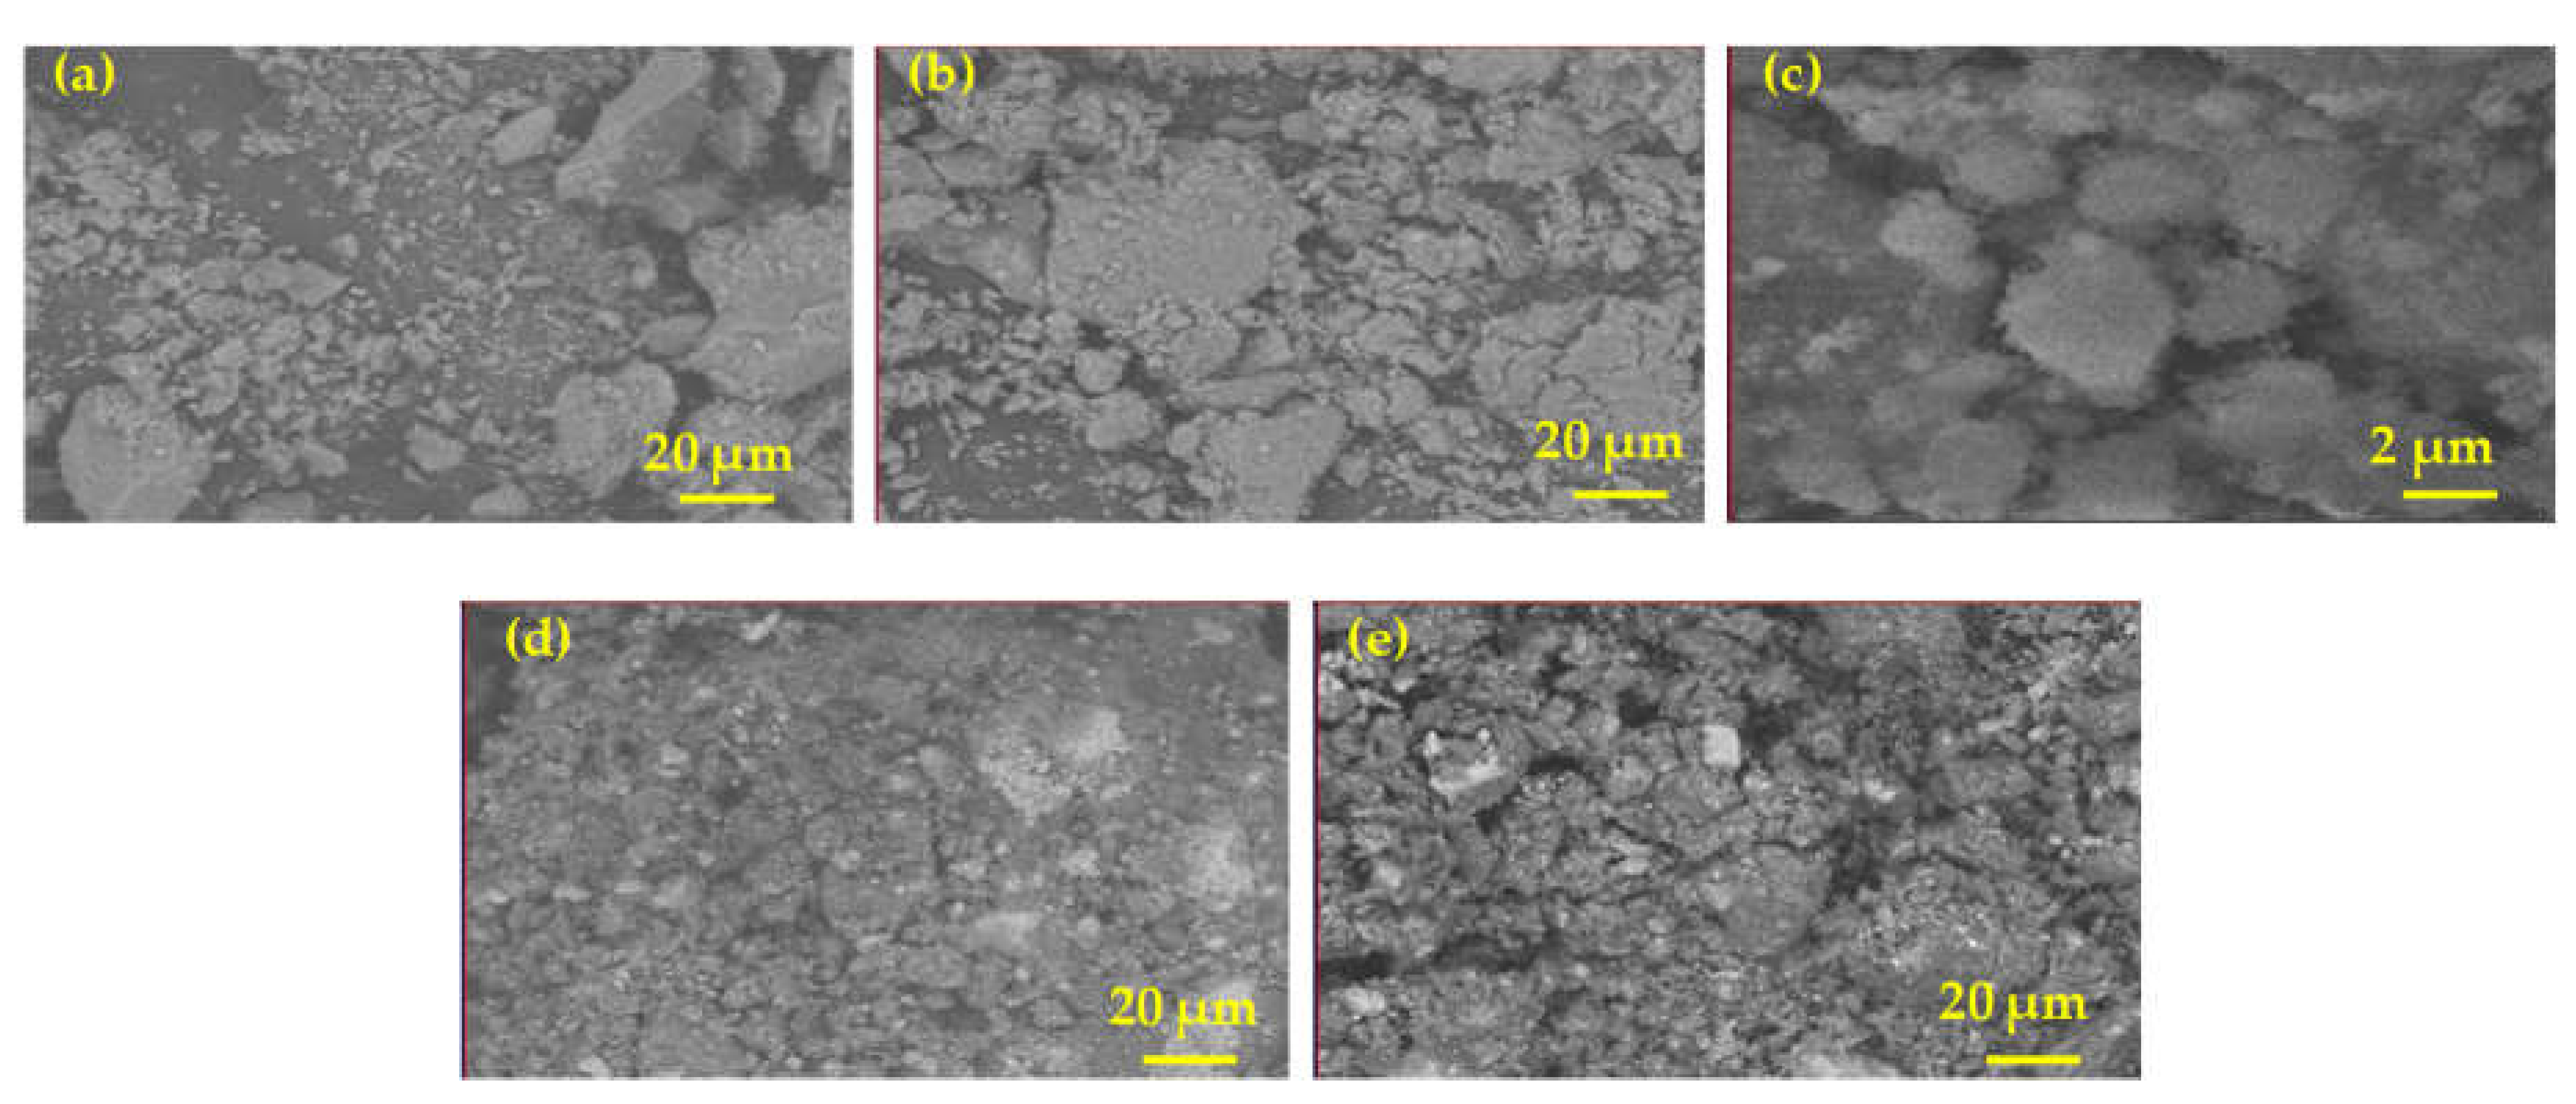
3.2. SEM Analysis of the Adsorbents
The SEM images of the adsorbents are shown in
Figure 3a–e. These figures show the surface texture of the adsorbents. The micrographs reveal that the materials have definite crystalline structures and suggest that no deformation of the metal oxides occurred during the preparation. Hydrotalcite is frequently reported as the substituted form of brucite [Mg(OH)
2] with the related hexagonal crystal shape. For instance, Brady et al. reported a hexagonal/rhombohedral crystal shape for the hydrotalcite [
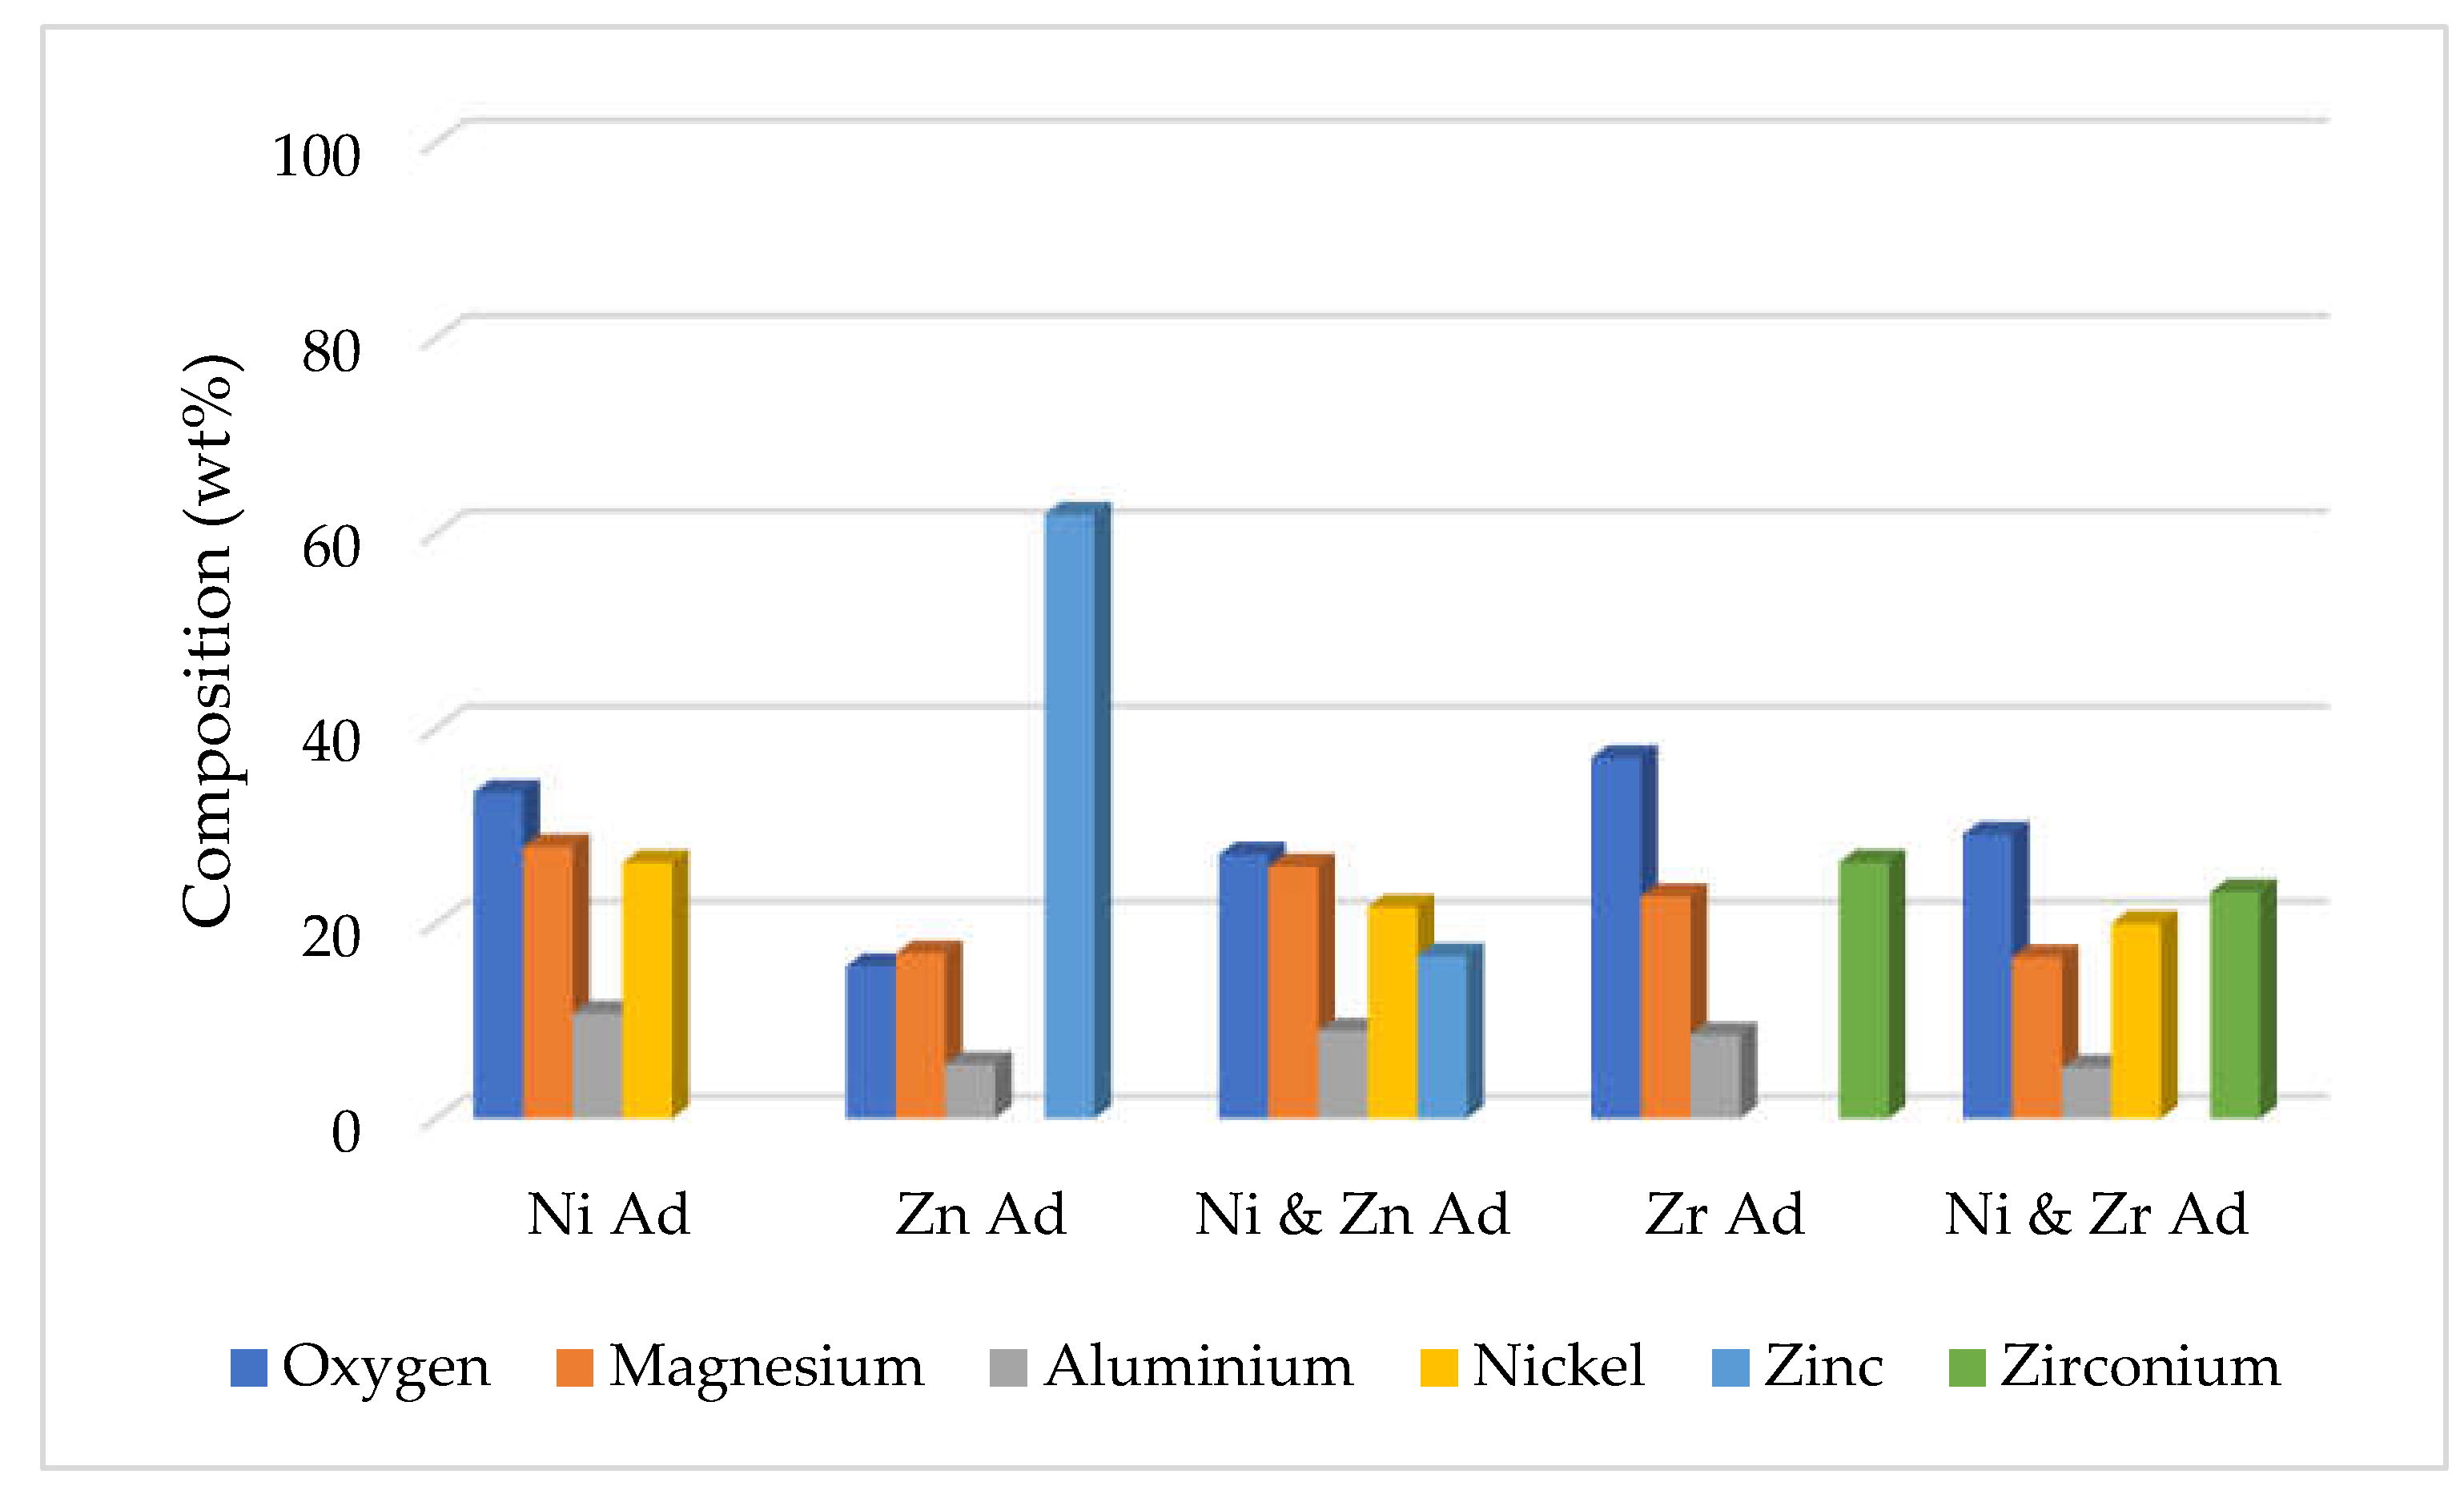
19]. In addition, our support materials; magnesium and aluminium interlocked with the active materials such as nickel and zinc that lead to a definite crystal shape and an increase in the adsorbent volume. The elemental composition of the five calcined adsorbents from EDAX analyses are presented in wt% in
Figure 4. This figure clearly shows the relative abundance of elements in the adsorbent. Additionally, the elements and their corresponding atomic percentage (at. %) are presented in the
Supplementary Materials (Table S2).
3.3. FTIR Analysis of the Adsorbents
When compared to the infrared spectrum of the sample and hydrotalcite reference materials, a number of similarities, as well as some differences, are observed. For the Ni adsorbent, the metal-hydroxide peaks present in the hydroxyl stretching region (3000 cm−1–4000 cm−1) are similar to the bands found in the hydrotalcite materials. The formation of a number of C-O stretches that either correlates with carbonate or oxalate appears at 1700 cm−1 and 1400 cm−1. The expected peaks for carbonate in hydrotalcite are 1640 cm−1, 1365 cm−1, and 1313 cm−1. However, it is difficult to accurately determine the bands of carbonate or oxalate in this range because of the similarities of carbonate and oxalate stretches due to the carbon-oxygen stretching vibrations.
The Zn adsorbent shows the metal-oxide and metal-hydroxide vibration between 3000 cm
−1 to 3500 cm
−1 wavenumbers [
20]. There is a close correlation between the sample and reported peaks in the 1350 cm
−1–1380 cm
−1 range which ascribed to the carbonate antisymmetric increase, which indicates the hydrotalcite has carbonate between the layers.
At the Ni-Zn adsorbent the presence of water stretching bands at 1700 cm−1 is clear. This presence is mostly due to the existence of a water bridging mode at 3401 cm−1 in the hydroxyl stretching region. The presence of a number of C-O stretches that also associate with carbonate or oxalate comes out at 1700 cm−1 and 1400 cm−1. The probable peaks for carbonate in hydrotalcite are 1640 cm−1, 1365 cm−1, and 1313 cm−1.
Zirconium adsorbent corresponds to the stretching vibration νOH at the broad bands ranging between 3000 and 3400 cm−1. This indicates the presence of both free and hydrogen-bonded OH groups on the sample. The peak in the region at 1620 cm−1 is given to the δHOH of quasi-free H3O+ group. The presence of the sharp band at 1620 cm−1 is due to the residual presence at the surface and is typically zirconia and water connected. Bands around 700–500 cm−1 correspond to Zr–O2–Zr asymmetric and the formation of ZrO2 phases is confirmed by the Zr–O stretching modes.
3.4. Raman Analysis of the Five Adsorbents
Table 2 presents the peak list of the Raman spectroscopy carried out on the adsorbent samples (the recorded spectra are presented by
Figure S2 in the Supplementary Materials). The spectra of carbonate intercalate hydrotalcite with the hydrotalcite show the correlation between the modified hydrotalcite and the reference hydrotalcite. In addition, the spectra show clear proof of the presence of carbonate in the adsorbents. This corroborates with the absence of the peaks that are associated with the free sodium carbonate as presented by powder XRD pattern in
Figure 2 (cf. vide supra). These results further confirm that the carbonate is successfully intercalated into the interlayer spaces of the hydrotalcite.
For the Ni adsorbent in the hydroxyl stretching region (3000–4000 cm
−1) there is some variation between the carbonate intercalated hydrotalcite and the reference hydrotalcite. The first of these variations are in the metal hydroxide bands, which shifted to lower wavenumbers, which is evocative to a variation in the chemical environment because of the presence of carbonate [
22,
23].
For the Zn adsorbent, there is some peak at higher wavenumbers for the metal hydroxide stretching vibrations which take place at 3389 cm
−1 and 3200 cm
−1 as reported previously [
24]. In addition, there is a peak for the interlayer water/water-carbonate bridging mode at 3239 cm
−1. For this atom, this is the indication of some control of freedom due to hydrogen bonding (which is seen around 200 cm
−1). The aluminium hydroxide deformation at 999 cm
−1 is at the same wavenumber as reported in the literature. This indicates that the metal-oxygen and metal hydroxide bonds form in a similar way as those in the other hydrotalcites reported before [
24].
For the Ni-Zn adsorbent some differences are observed between the carbonate intercalated modified hydrotalcite and the hydrotalcite in the hydroxyl stretching region (3000–3500 cm
−1). The first difference is in the metal hydroxide bands, which shifted to lower wavenumbers. It indicates the difference in the chemical environment, due to the presence of carbonate. This twist is caused by the presence of the carbonate anions in the structure of the material. There is a band present at 950 cm
−1, which is a carbon-oxygen bond in the carbonate anions. The expected carbonate peak appeared at 1750 cm
−1 instead of 1660 cm
−1. This difference in peak position is due to the presence of carbonate anions, which is opposing to the carbonate anions within the interlayer. Furthermore, there is a peak visible at 200 cm
−1, which disperses as a metal-oxygen band [
24], and there is also a band at 100 cm
−1, which is likely a hydrogen bonding band [
24]. The presence of these peaks suggests that there is a little dissimilarity between the metal cation layers of the carbonate and modified hydrotalcites.
For the Zr adsorbent, there is some peak at higher wavenumbers for the metal hydroxide stretching vibrations, which take place at 3289 cm
−1 and 3239 cm
−1 as reported in the literature [
24]. Furthermore, there is also a peak for the interlayer water/water-carbonate bridging mode at 3239 cm
−1. For this atom, this indicates some control of freedom for these atoms due to hydrogen bonding (which is observed around 100 cm
−1). This is an indication of the metal-oxygen and metal hydroxide bonds forming in a similar way like the other reported hydrotalcites [
24].
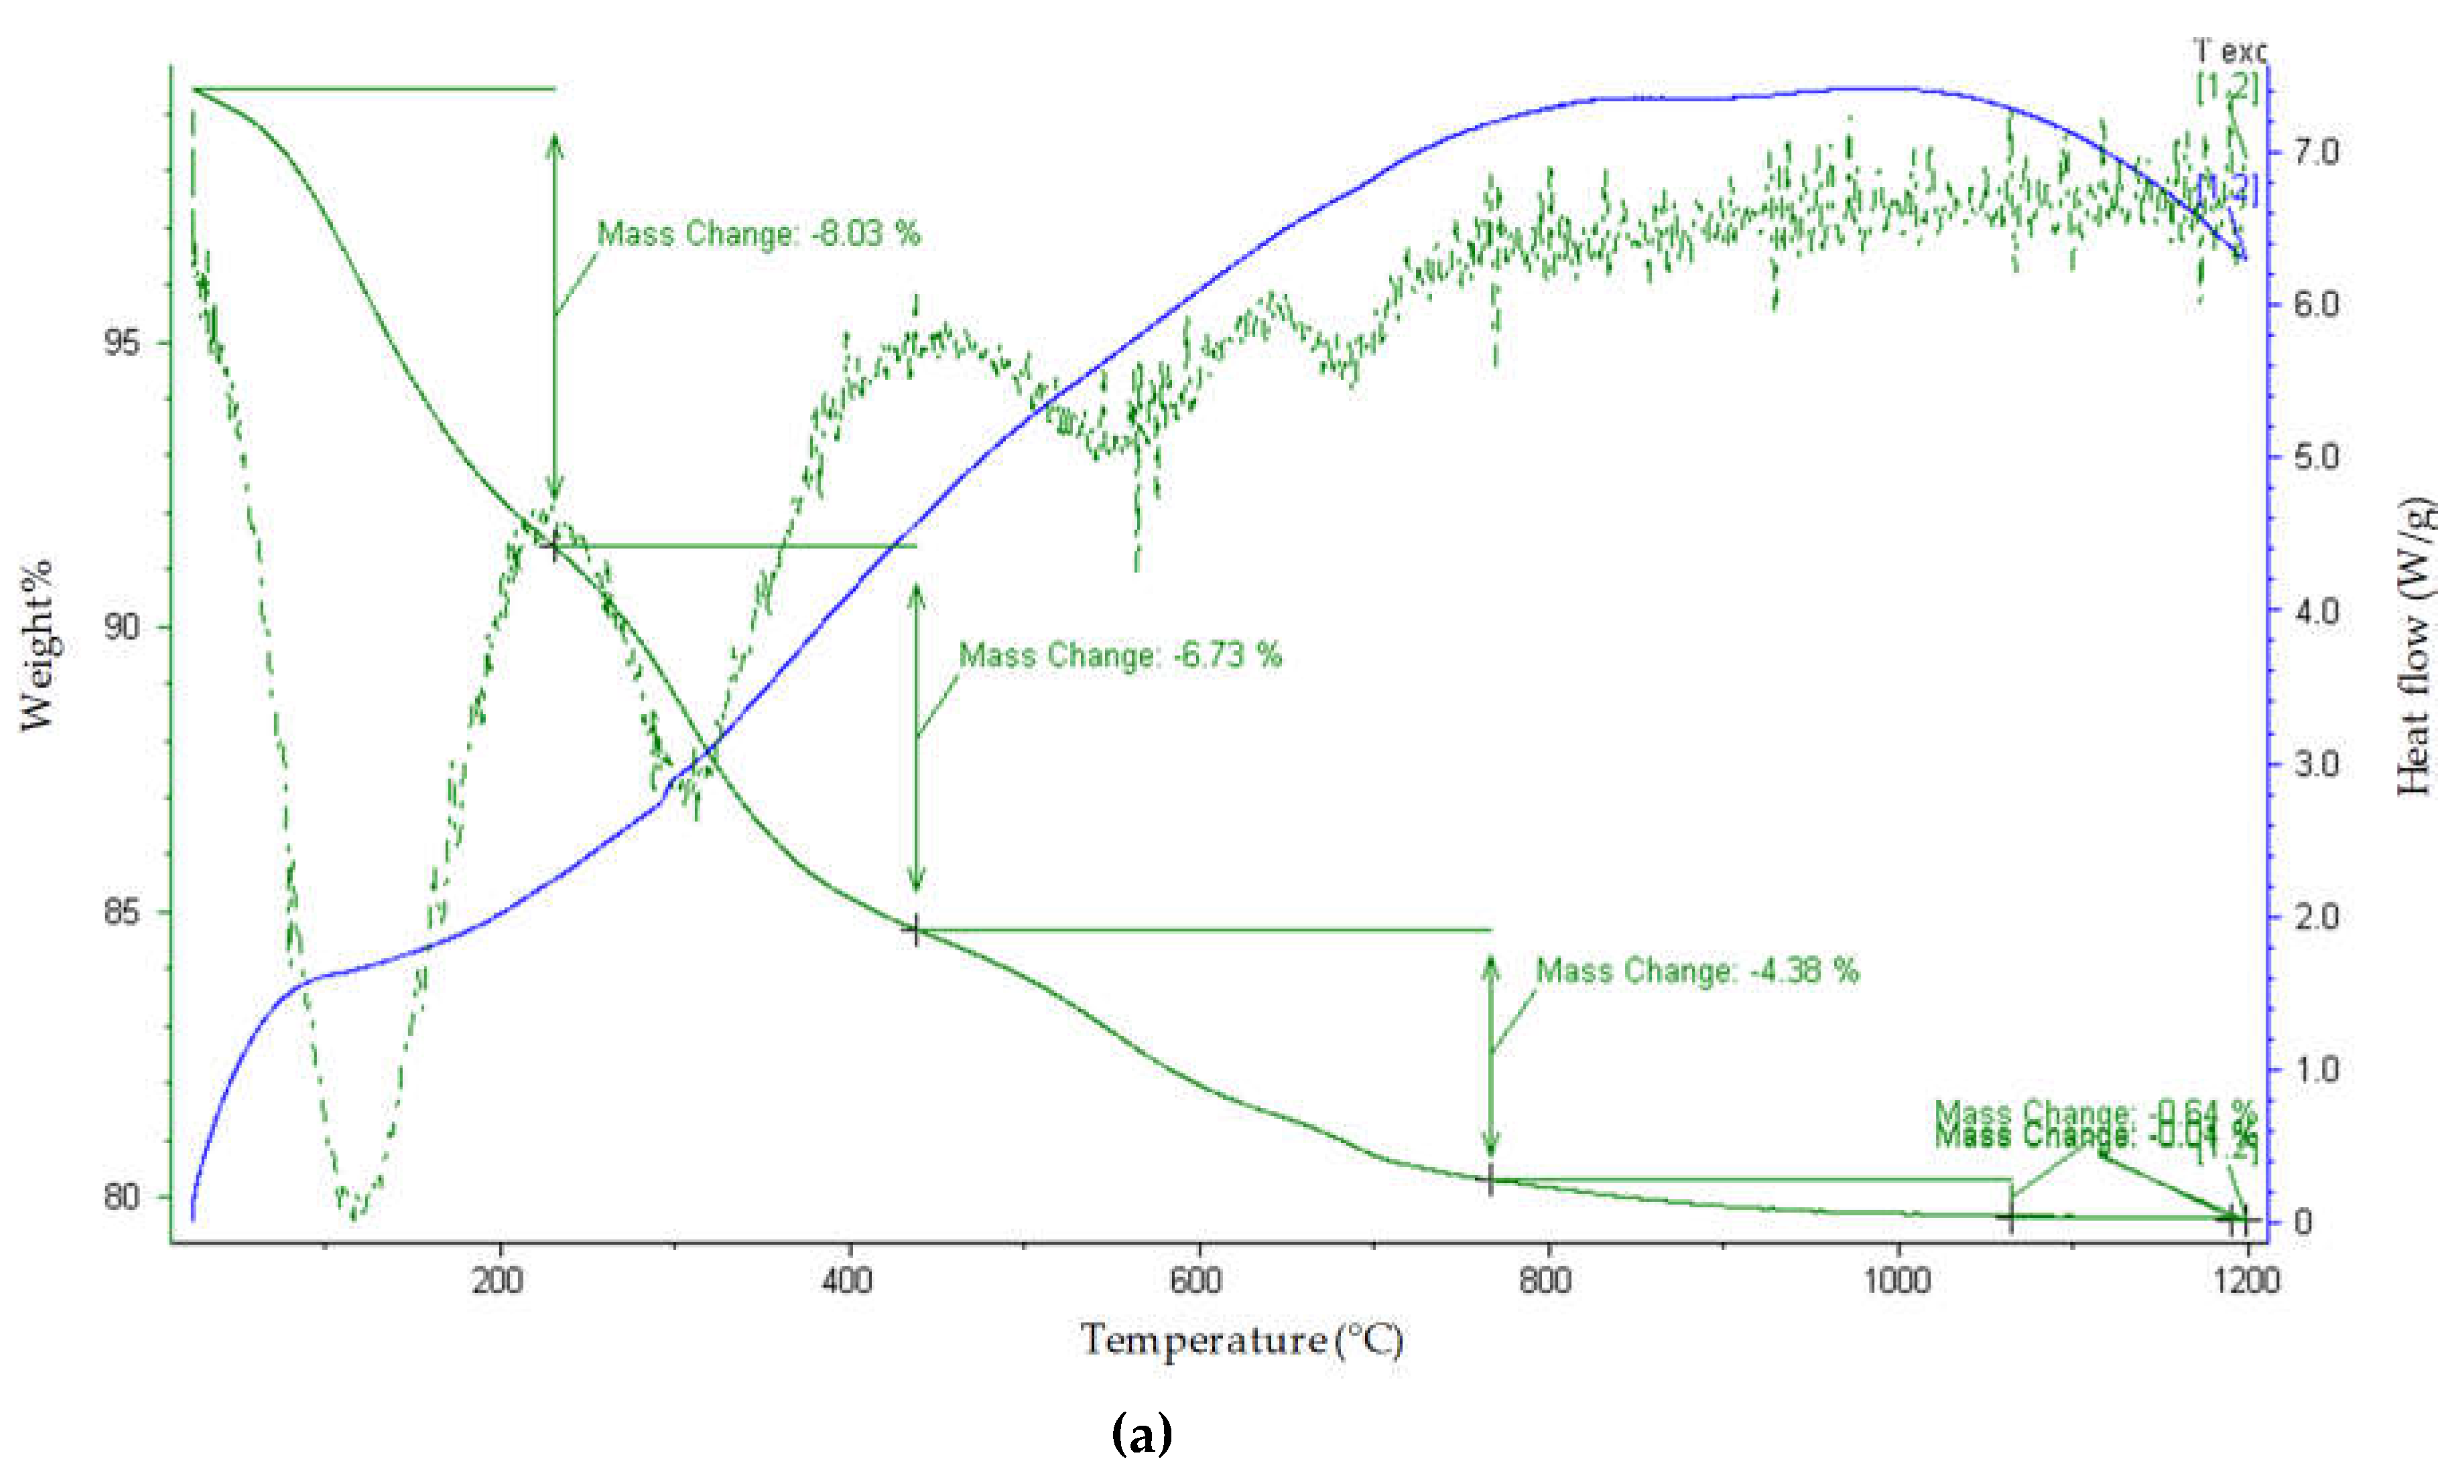
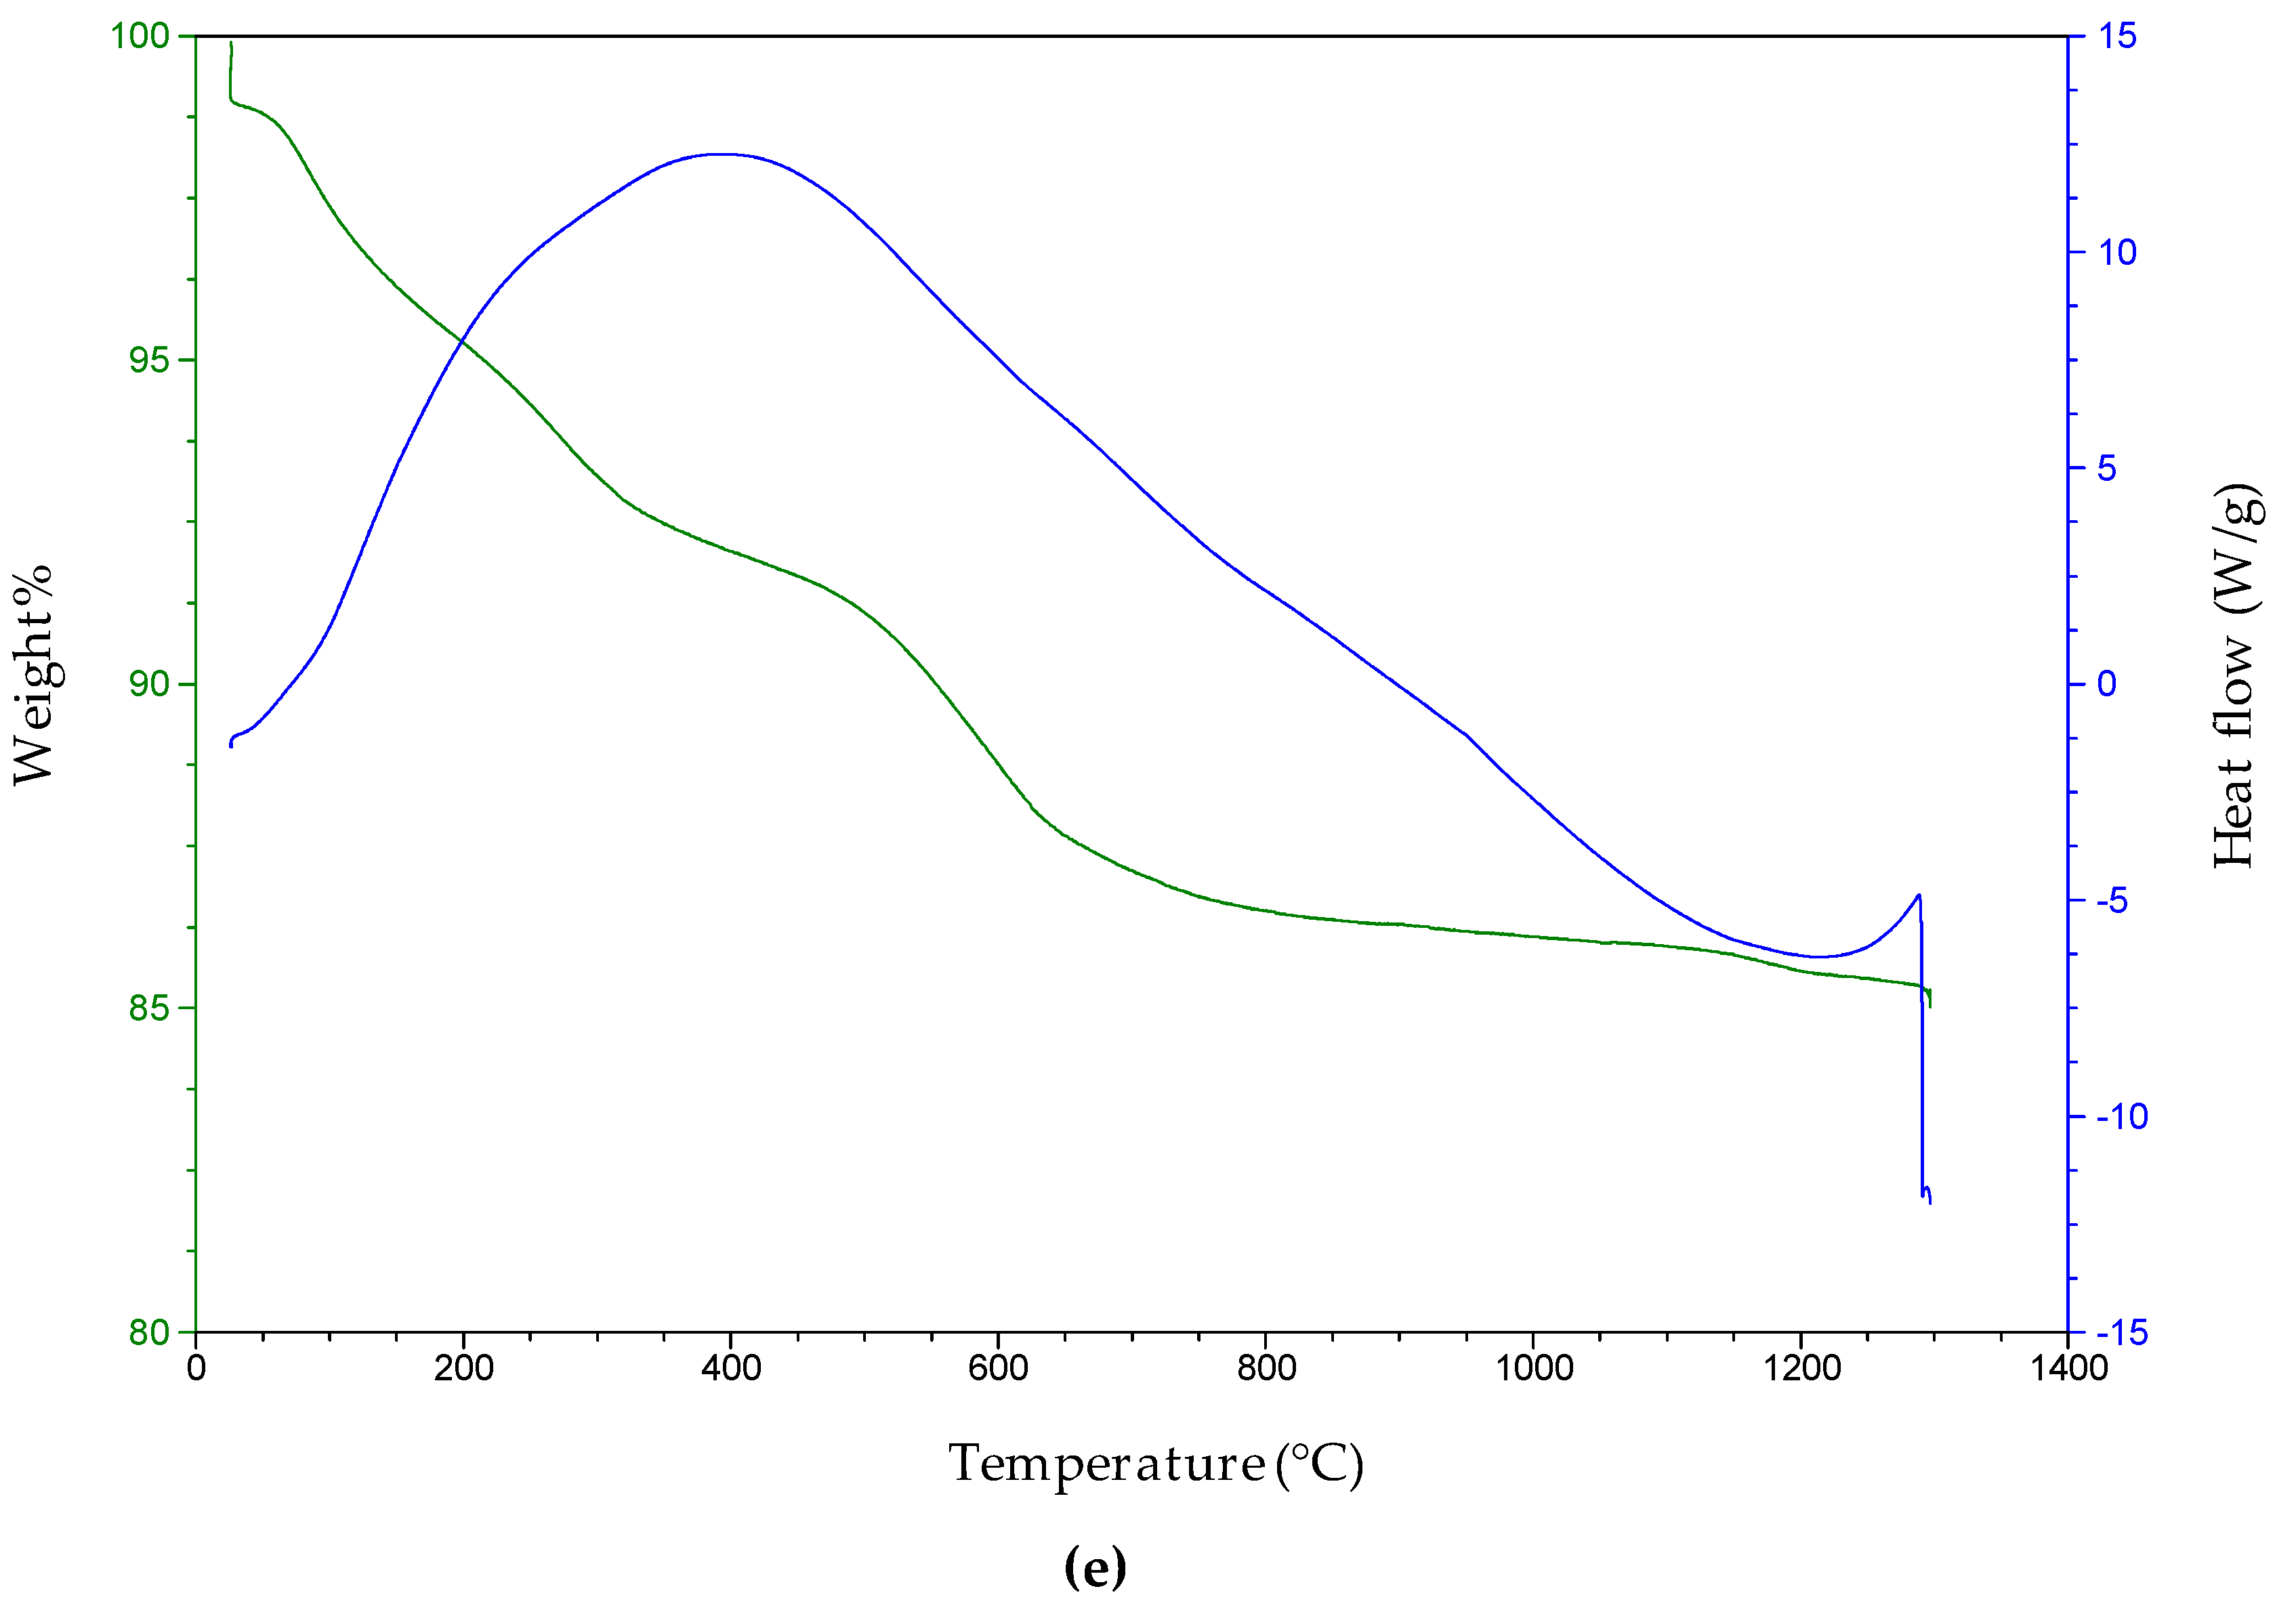
3.5. TGA and DSC Analyses of the Five Adsorbents
The thermogravimetric study of the Ni adsorbent shows a number of features (
Figure 5a–e). The weight loss has been observed to take place in four steps; loosely bound water, tightly bound water, dehydroxylation, and decarbonization. The first weight loss is a mass loss step around 110 °C, which is due to the loss of loosely bound surface water. The large proportion of the mass loss indicates that this sample also has a large portion of tightly bound water molecules when analyzed, though it is calcined to 450 °C. The 6.73% mass loss around 400 °C is due to the loss of water molecules that are most tightly bound to the hydrotalcite and in the interlayer spaces. There are a number of simultaneous dehydroxylation steps occurring around 400 °C. At around 750 °C, weight loss is due to the loss of carbon monoxide and water from the sample, indicating simultaneous dehydroxylation and decarbonization. The mass loss at 1050 °C indicates the completion of the decarbonization step. The percentage mass loss and the calculated decomposition steps are shown in
Table 3.
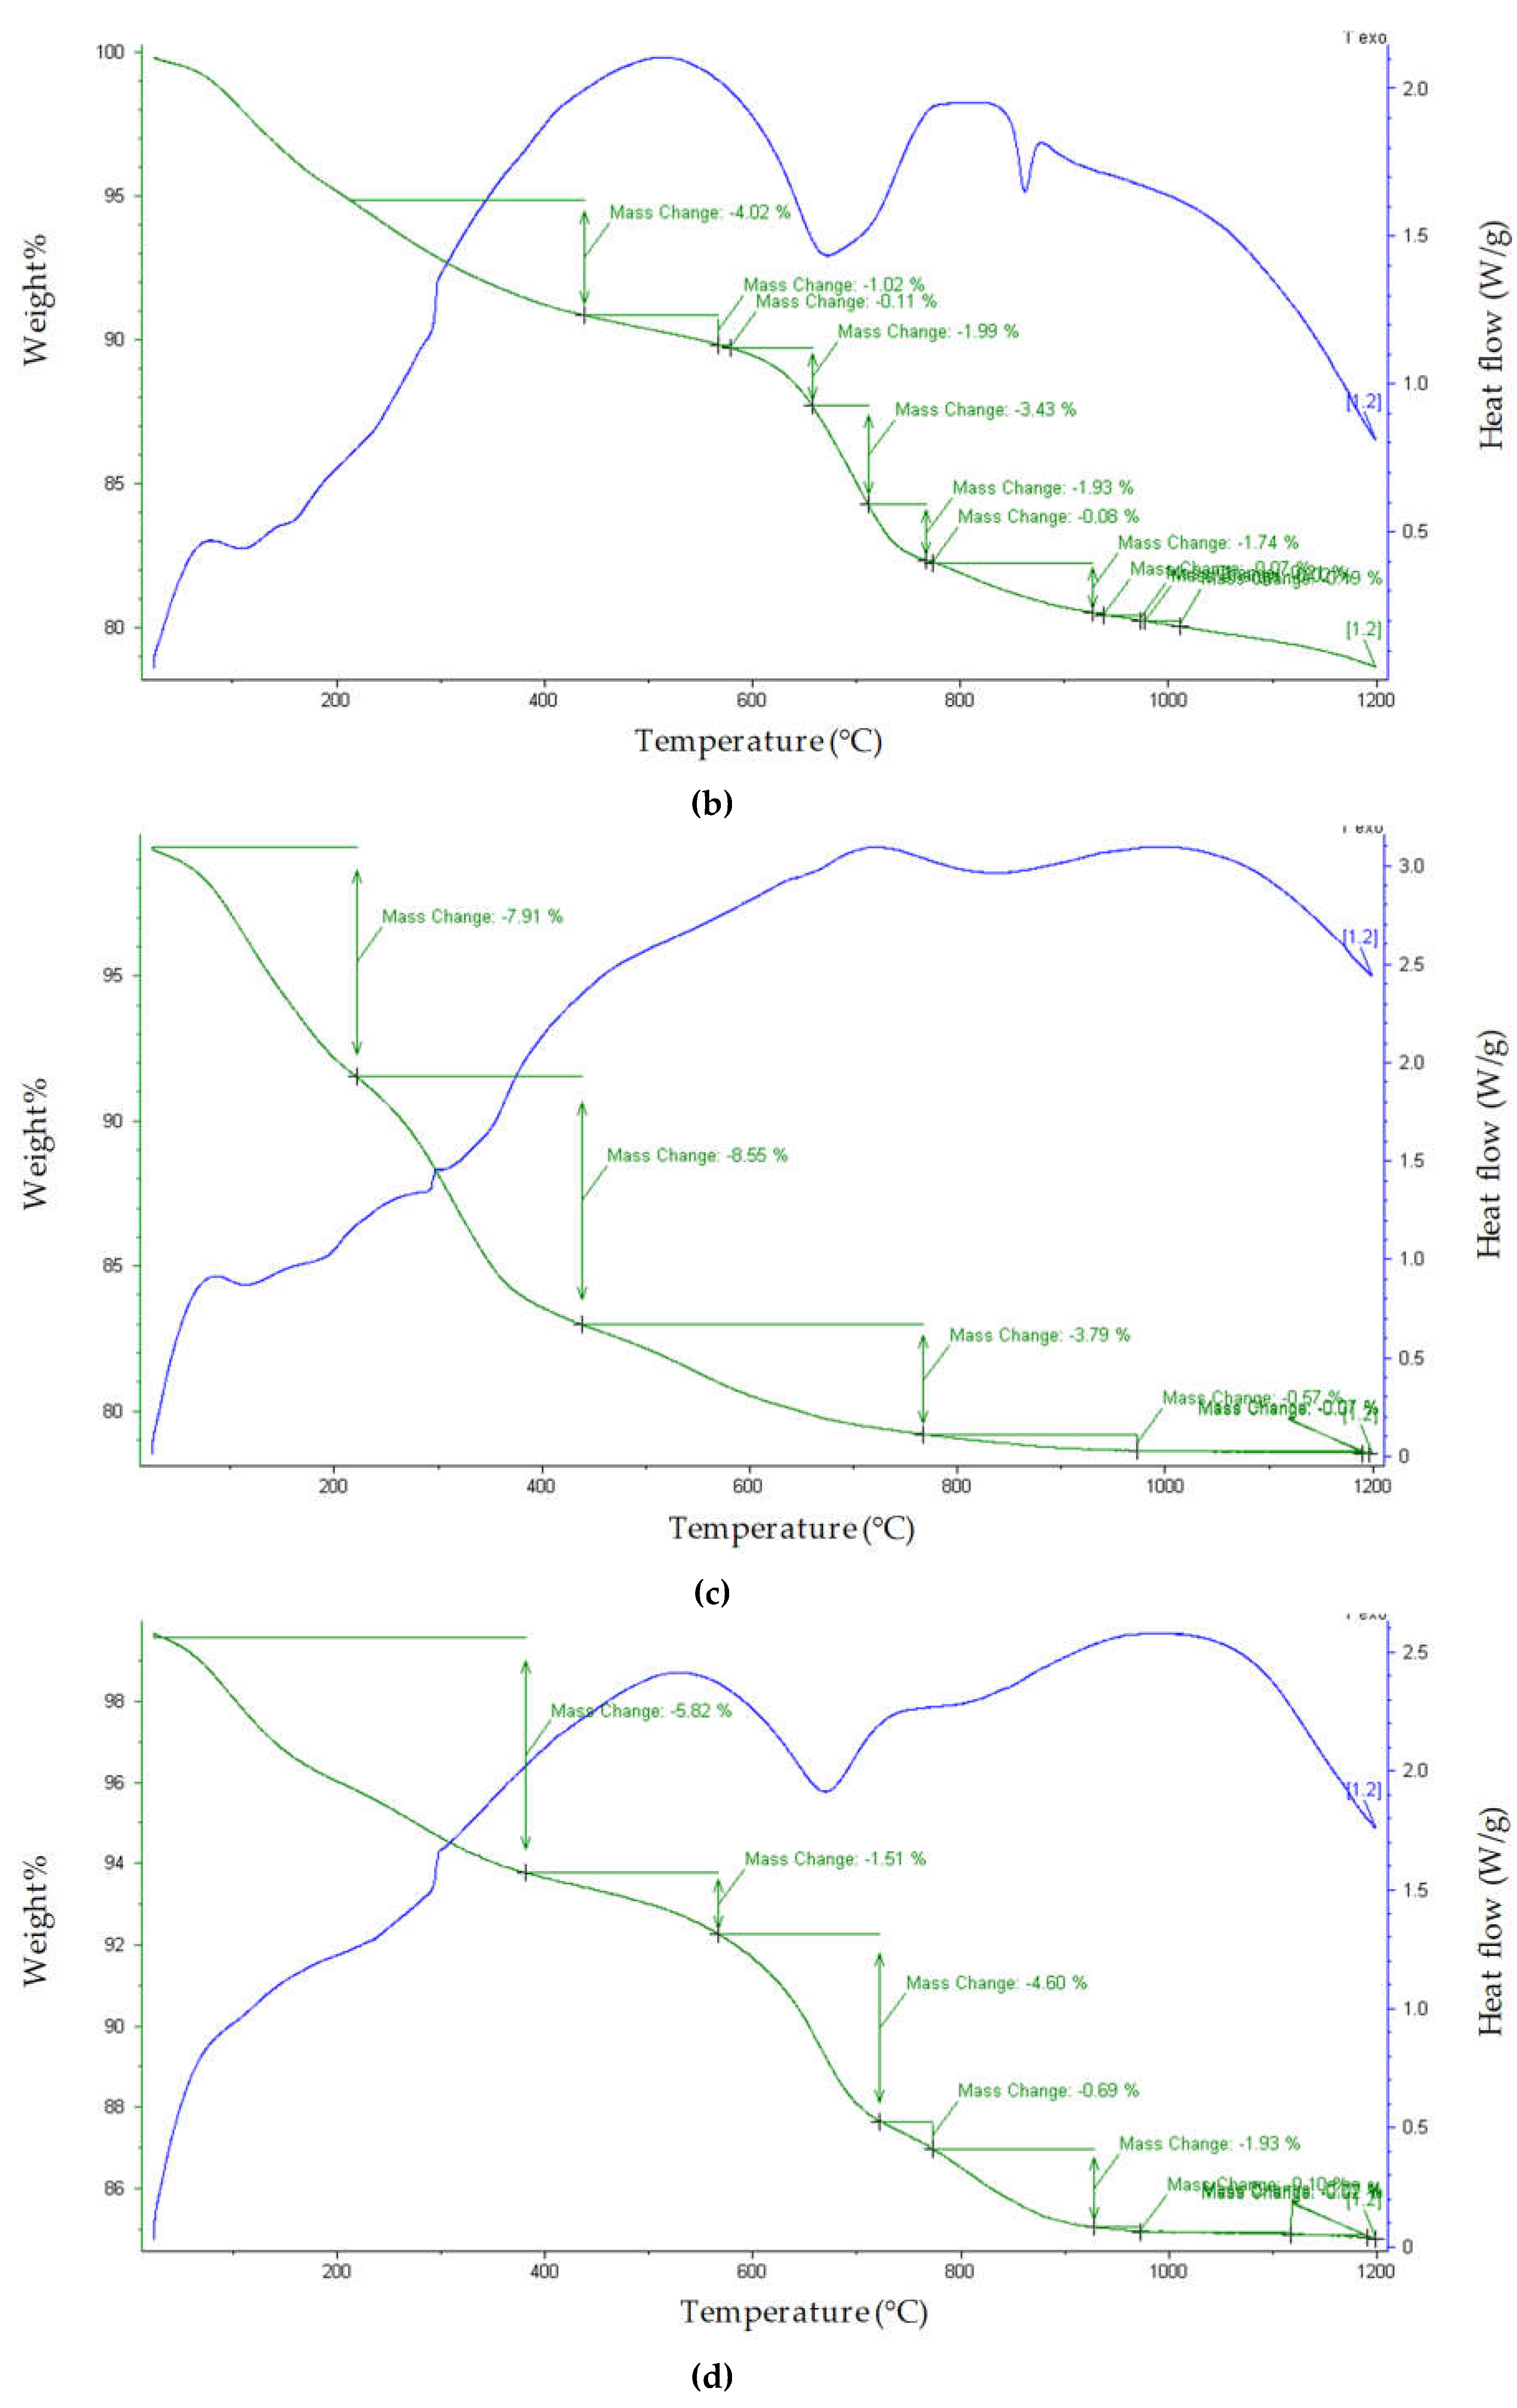
For the Zn adsorbent, from the TGA data in
Figure 5b, the decomposition steps are the loss of some interlayer water up to 200 °C. The next decomposition step takes place at 280 °C. The first of these steps is the loss of the last interlayer water by the relocation of the brucite-like layer. This is followed by the change in the structure of the material by the partial dehydroxylation of the brucite layer and the partial merging of the carbonate group into the structure. The third decomposition step around 400 °C signals the end of the dehydroxylation, followed by the finishing point of decarbonization, which finishes around 750 °C [
20]. The final dehydroxylation of the products to form a mixed metal solid solution occurs at almost 950 °C.
For the Ni and Zn adsorbent (
Figure 5c), the 8.55 % mass loss around 400 °C corresponds to the loss of water molecules that are most tightly bound to the hydrotalcite and formed in the interlayer spaces. The weight loss around 750 °C corresponds to the loss of carbon monoxide and water from the sample and indicates a simultaneous dehydroxylation and decarbonization. The mass loss finishes at 950 °C, which completes the decarbonization step.
At the Zr adsorbent (
Figure 5d) the next decomposition step takes place at 600 °C. The first of these is the loss of the last interlayer water through the relocation of the brucite-like layer. This is followed by the change in the structure of the material by the partial dehydroxylation of the brucite layer and the partial merging of the carbonate group into the structure. The third decomposition step occurs around 600 °C, which is the end of the dehydroxylation followed by the finishing point of decarbonization, which finishes around 700 °C [
20]. The final dehydroxylation of the products to form a mixed metal solid solution occurs at almost 900 °C.
According to the mass losses recorded from the TGA for the Ni and Zr adsorbent, it is clear that there are major mass losses occurring in the sample. These are for the loosely bound water, tightly bound water, dehydroxylation, and decarbonization. The figure also shows an exothermic reaction, and the sample is gradually degraded. The sample is heated to 1200 °C, whereas the major decomposition occurs up to 600 °C.
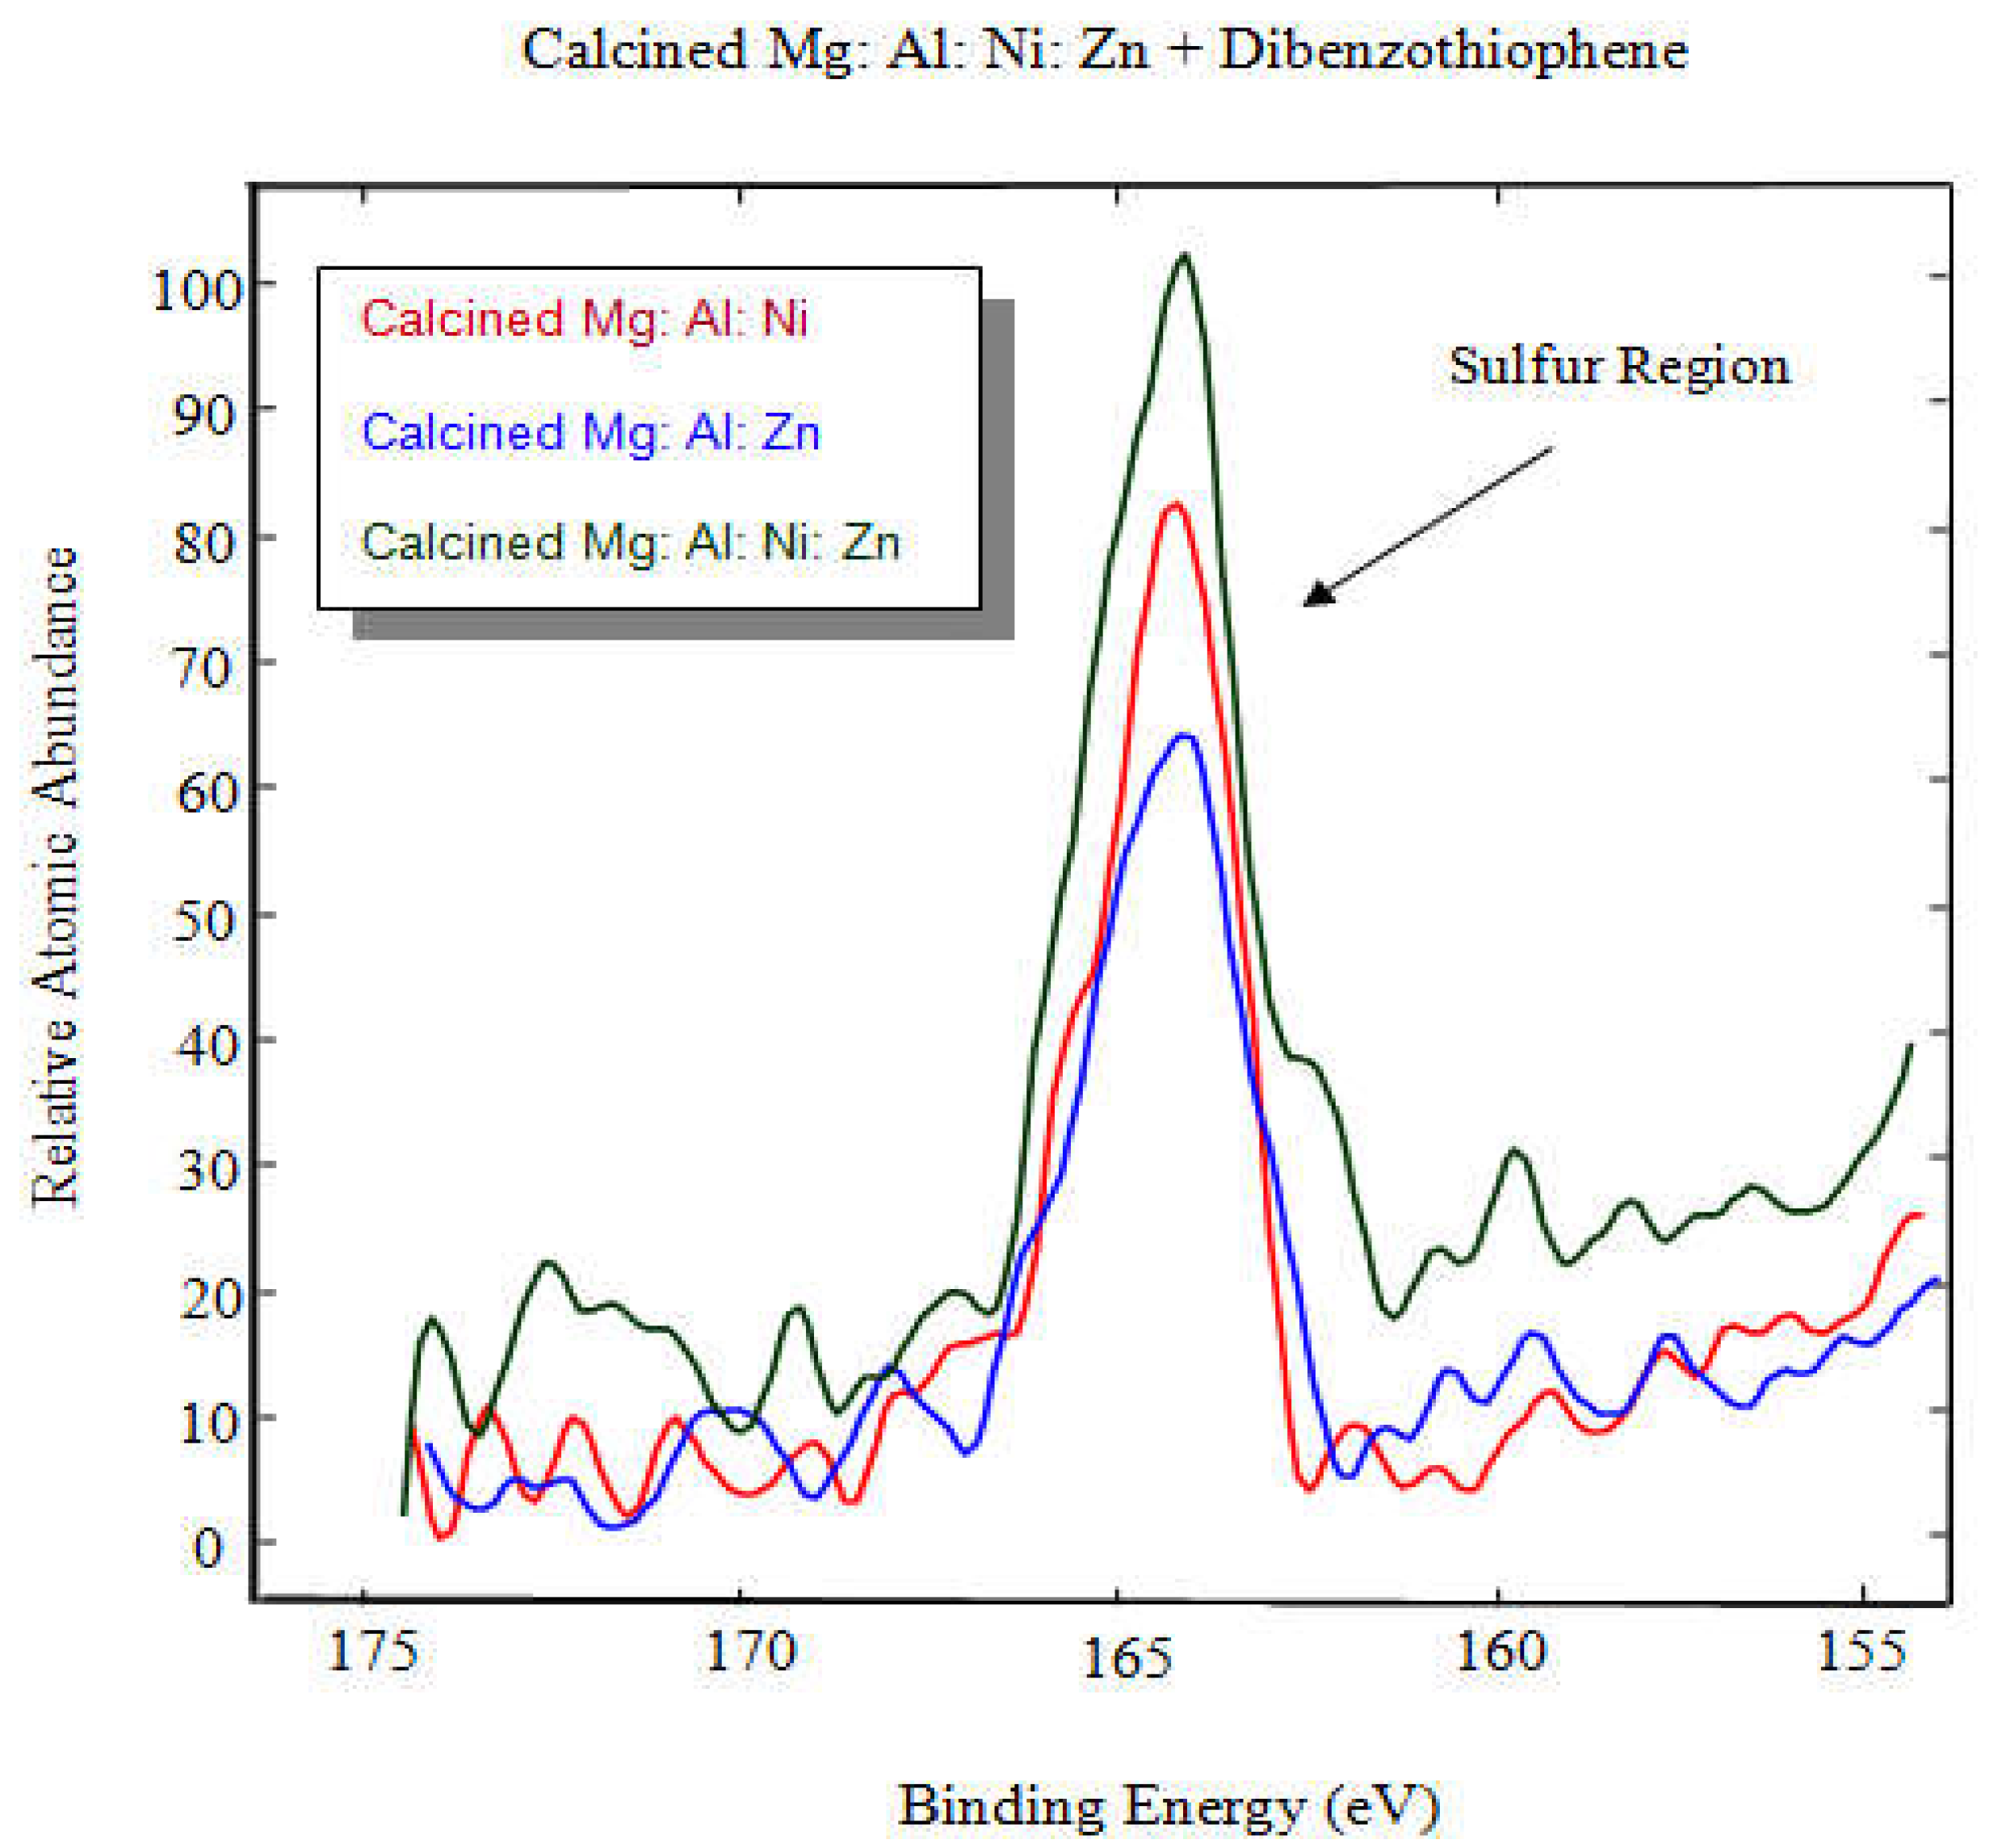
3.6. XPS Analysis of the Three Adsorbents
The three adsorbents were mixed with the dibenzothiophene. Then the samples were tested by the XPS to check the bonding between the sulfur molecule and the adsorbents.
Figure 6 below shows the clear evidence of bonding between sulfur molecule and the adsorbents.
Table 4 shows percentages of relative abundances of species from XPS. It shows clear evidence that sulfur is observed on substrates immersed in dibenzothiophene, irrespective of the formulation of the hydrotalcites preparations. Substrates with nickel showed increased sulfur content over that without nickel: Mg: Al: Ni: ≡ 1.57%, Mg: Al: Ni: Zn ≡ 1.48%, Mg: Al: Zn: ≡ 0.87%.
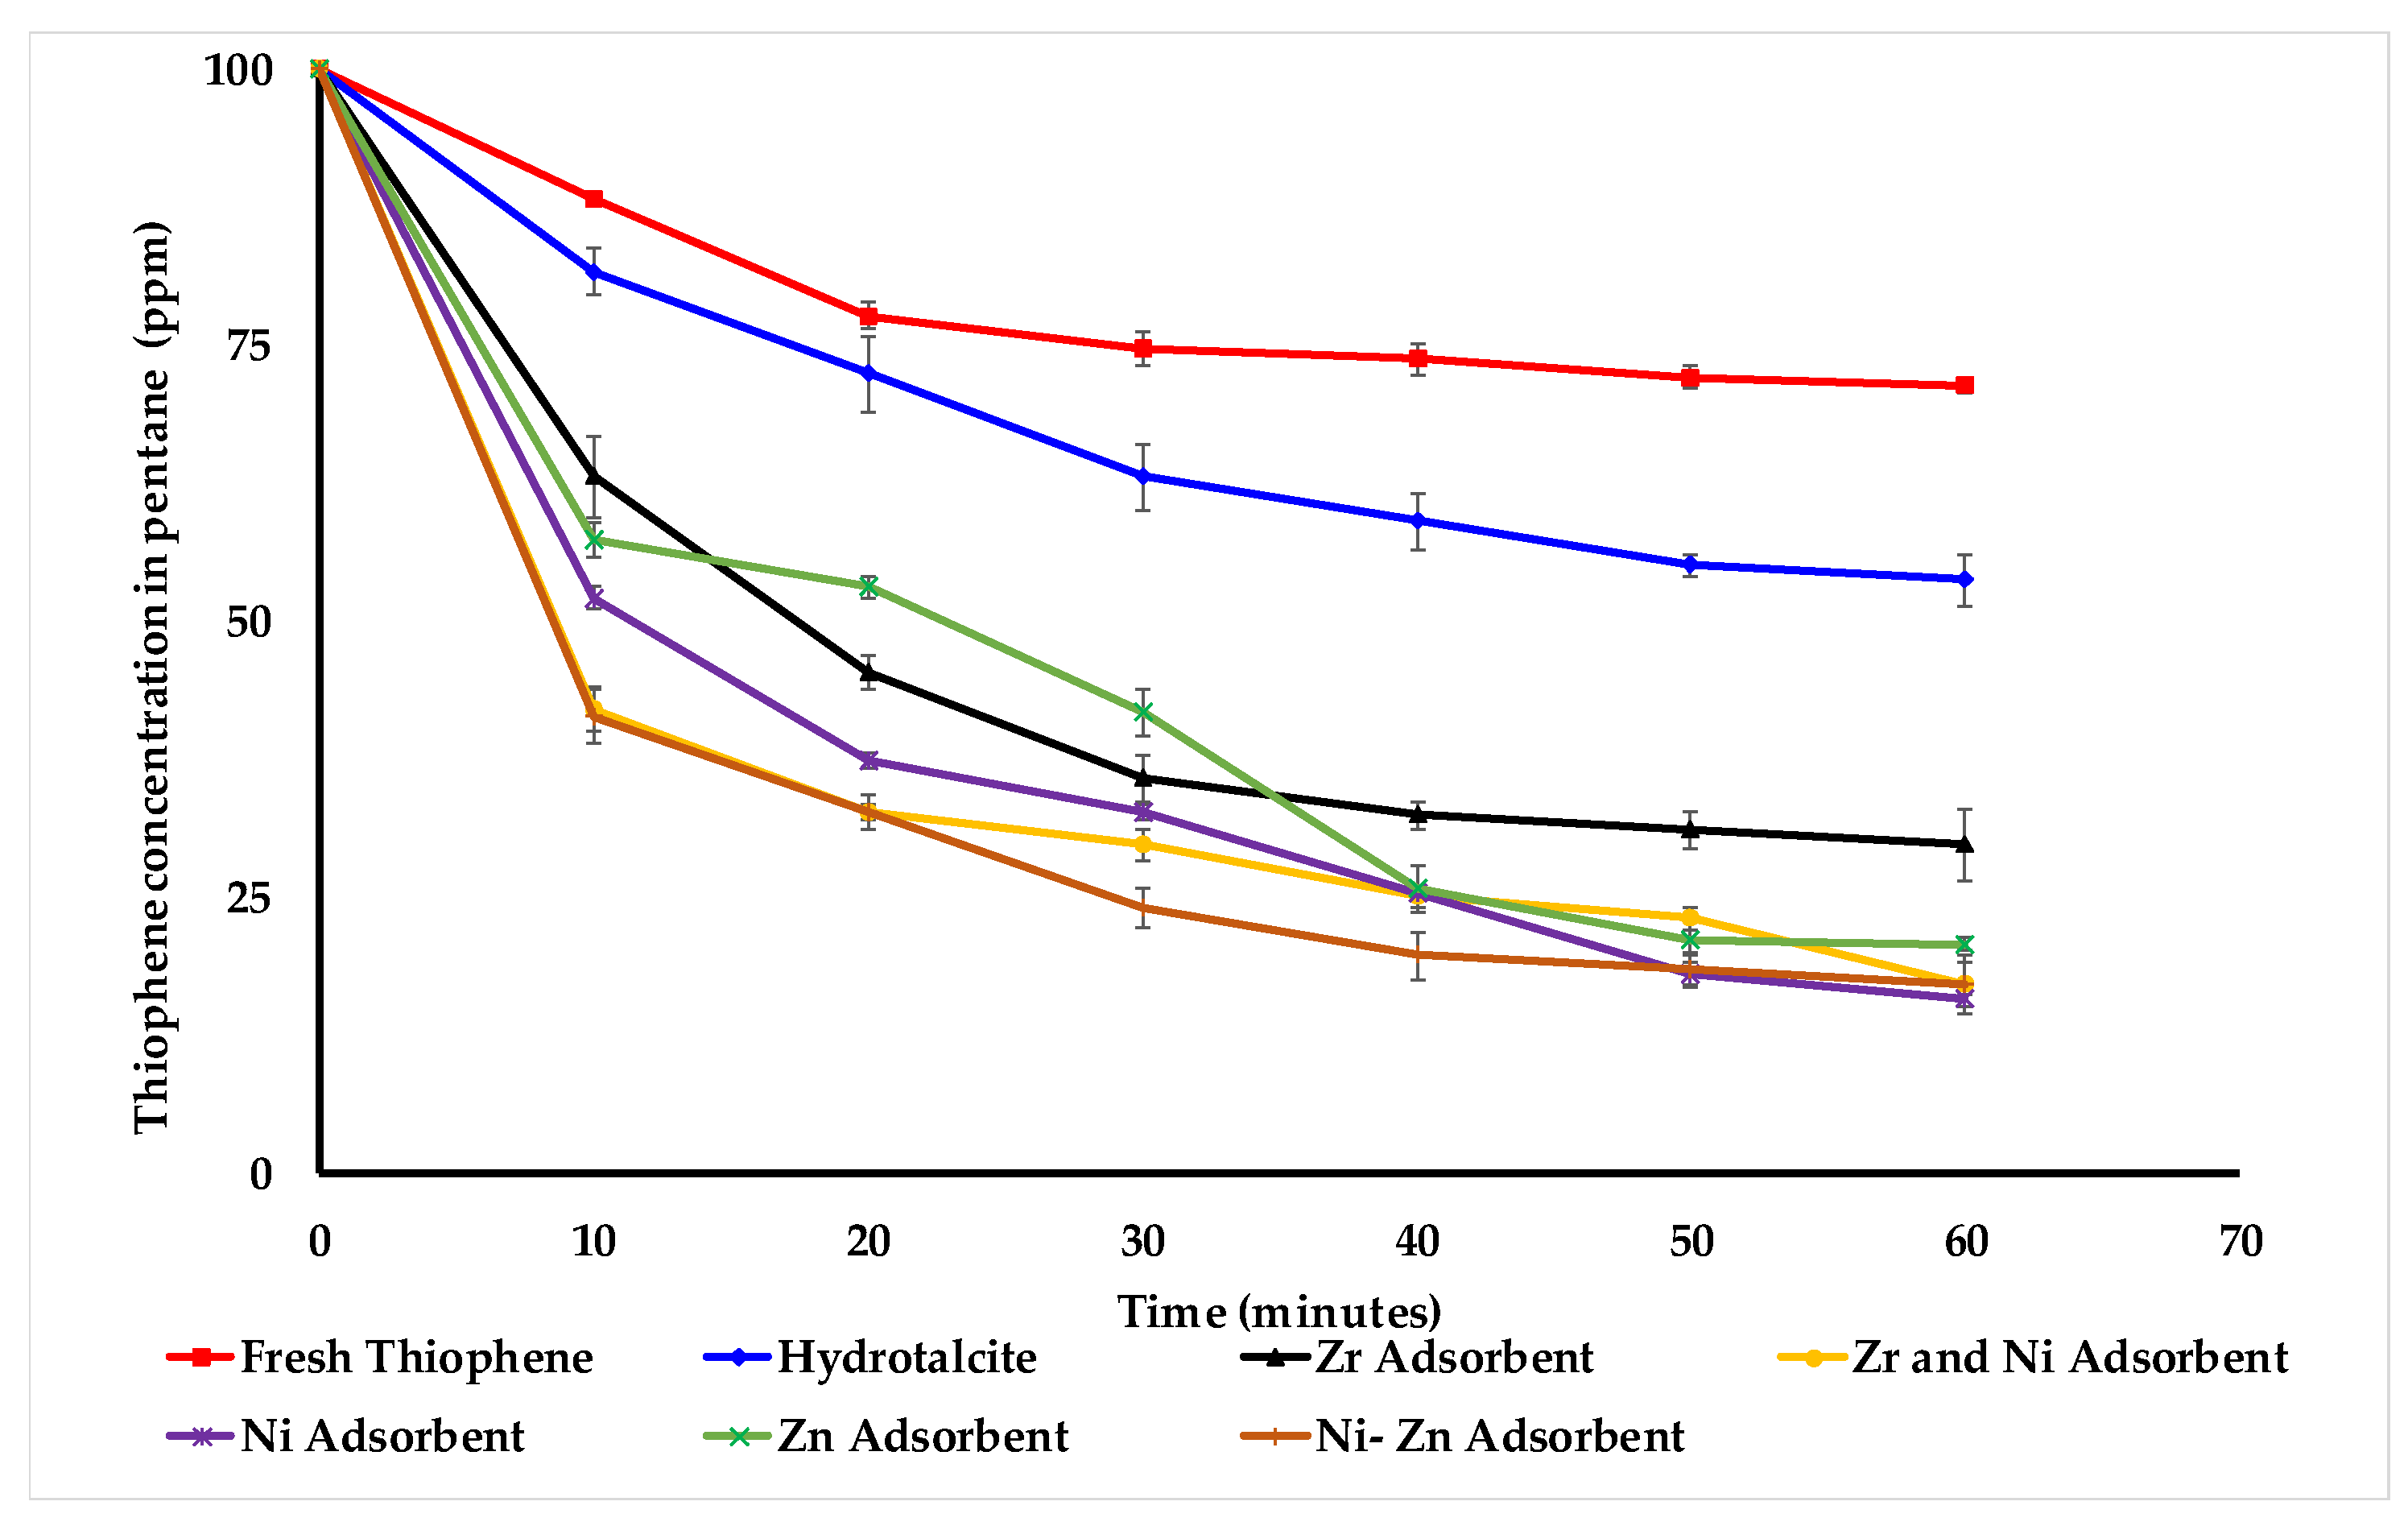
3.7. Performance Comparison of All Five Types of Adsorbents
Five different types of adsorbents were examined. Each of these adsorbents has the same support of magnesium and aluminium; therefore, an influence specific to the main component is determined.
Figure 7 shows that, after an hour, fresh thiophene reaches 71 ppm, and when hydrotalcite without any metal is used. The zirconia adsorbent reacts slowly in comparison to the other four adsorbents. On the other hand, nickel-based adsorbents react more quickly compared to the other three adsorbents. As shown in
Figure 7, all five adsorbents work within an hour until the thiophene concentration in the pentane becomes almost constant. It turns out that the deposition of nickel on zirconia is an innovative approach that takes advantage of the selectivity of Ni towards S-species and the high adsorptive capacity of zirconia support. It is observed that adding zirconia into the adsorbent structure increase the sulfur removal capacity. Possibly, the added zirconia changes the nature of the active metal sites into the structure and increases its sulfur removal capacity.
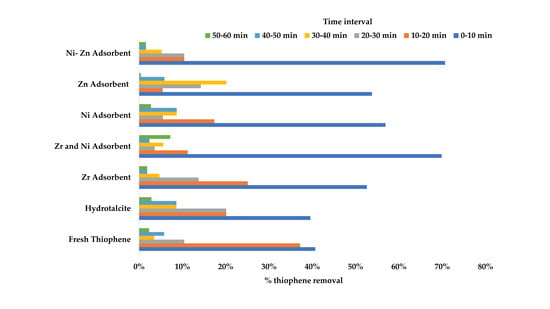
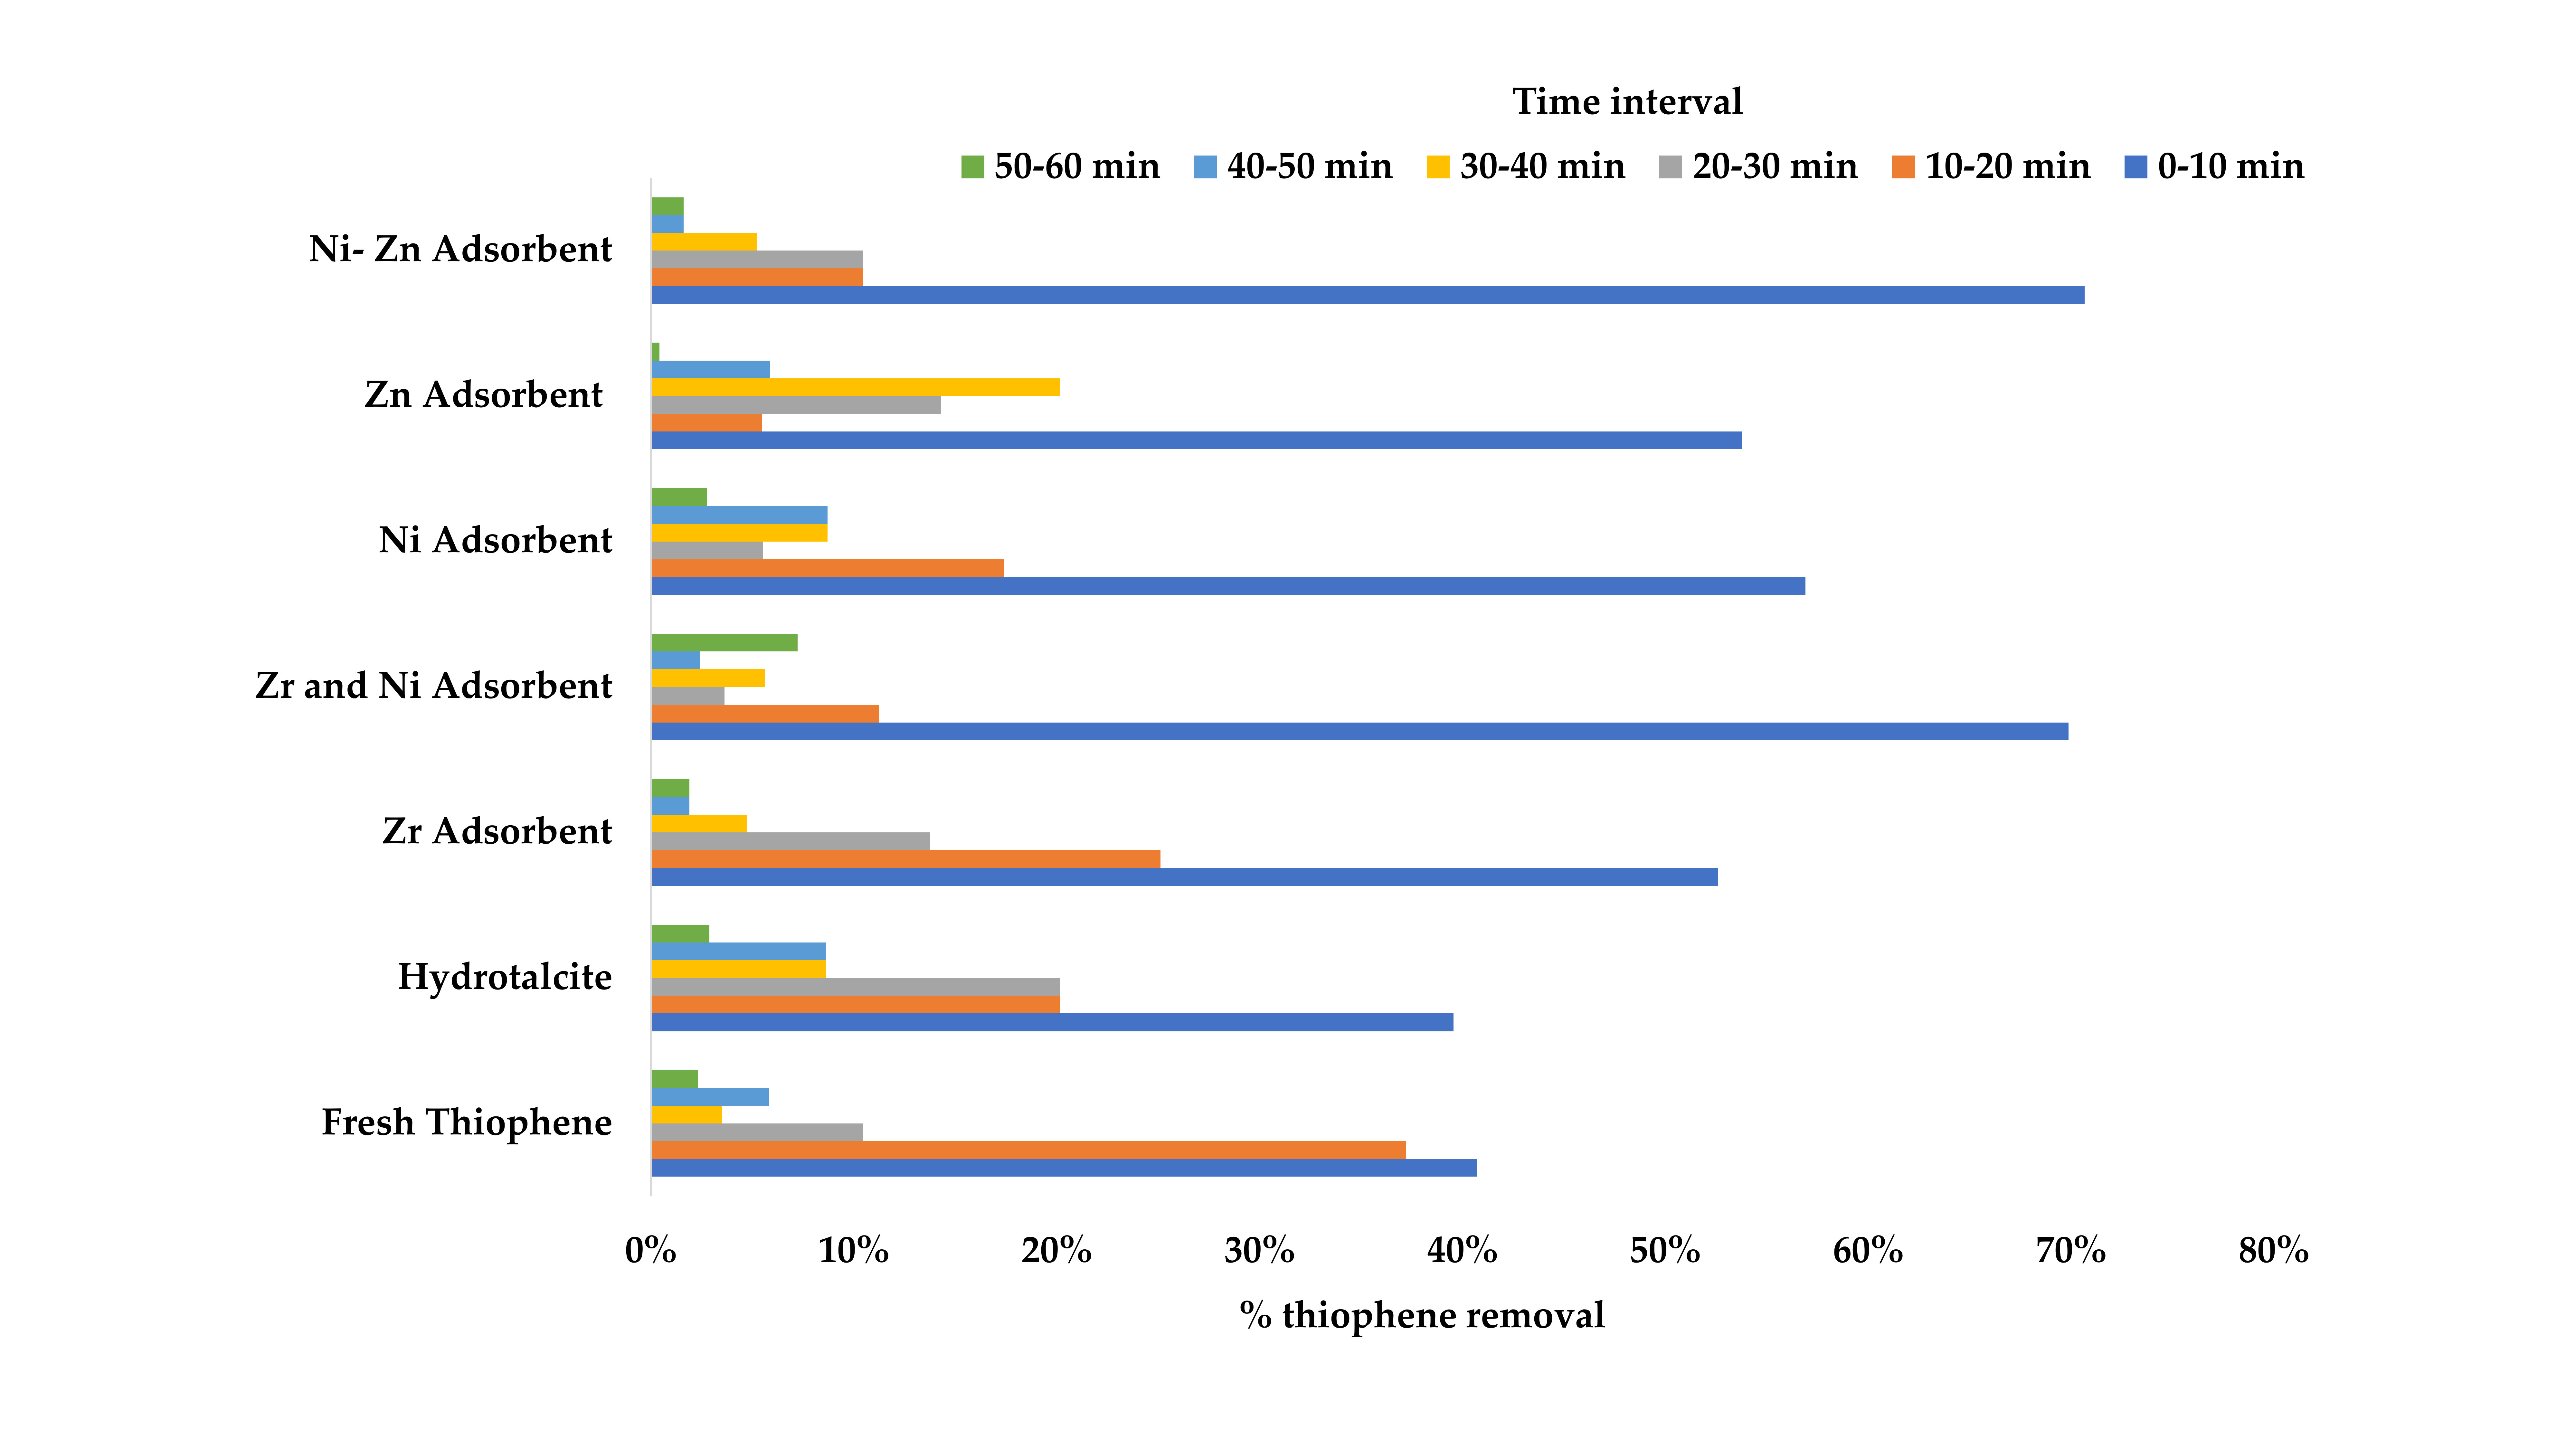
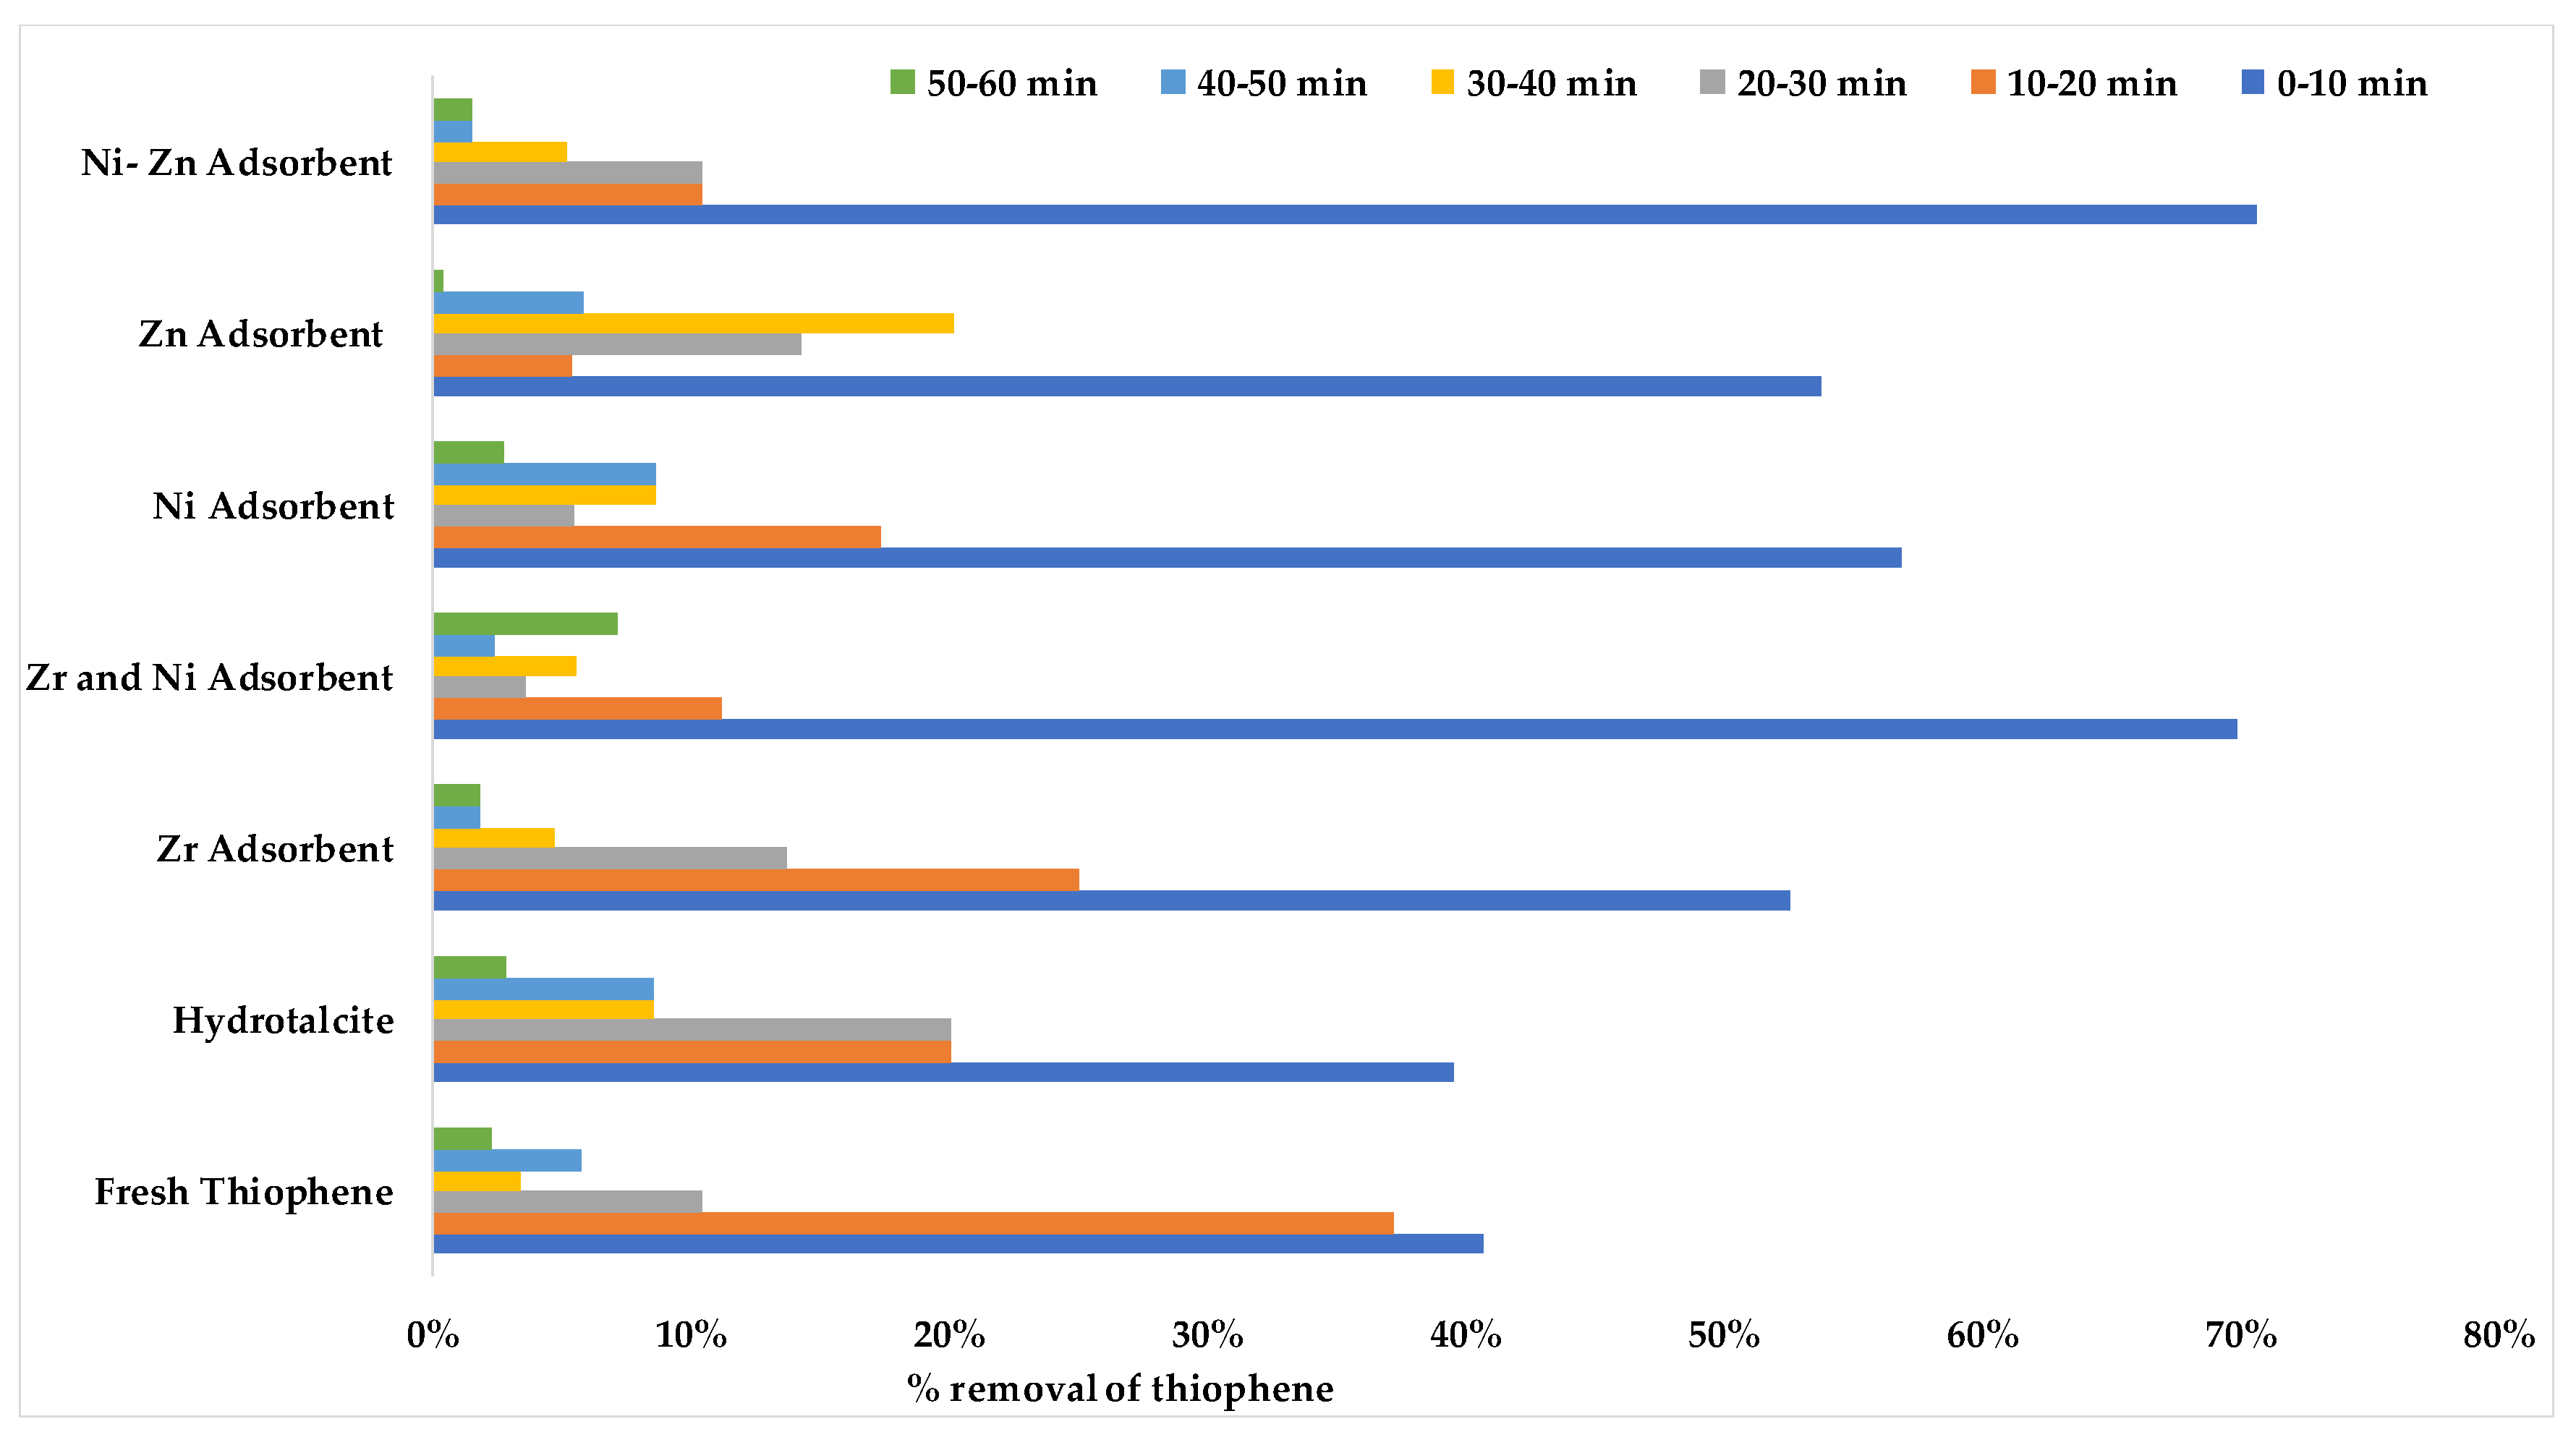
Figure 8 shows the percent removal of thiophene with respect to different time interval. It is evident that for all the adsorbents the maximum percentage of the removal occurred in the 0–10 min interval. It is also worth noting that more than 70% removal for both NiO-ZrO
2, and NiO-ZnO was obtained in the first 10 min. This finding can be used to investigate the reaction kinetics in future studies.
4. Conclusions
In the current study, we prepared hydrotalcite by the co-precipitation method and characterized using various analytical techniques. The analysis matches the typical behavior of hydrotalcites of the same composition reported in the literature. From the analysis of the modified hydrotalcites, it can be concluded that carbonate was successfully intercalated into the structure of hydrotalcite using co-precipitation methods. It was also evidenced that there is an intermediate structure for carbonate intercalated hydrotalcite. X-ray diffractograms showed the formation of hydrotalcites in the synthesized materials, while EDAX analysis confirmed the expected elemental ratio present in the modified hydrotalcite adsorbents. We further confirmed the presence of ZnO, NiO, and zirconia on the respective adsorbents. FTIR and Raman spectroscopy showed the presence of carbonate and water in the adsorbents. The removal efficiency of thiophene (100 ppm) from the model fuel containing n-pentane by the five adsorbents was in between 70%–85%. However, only NiO-ZrO2 adsorbent could remove thiophene from 100 ppm to a 15-ppm level. The thiophene removing capacity of NiO-ZrO2, and NiO-ZnO adsorbents is superior to the other three absorbents (ZnO, NiO, and ZrO2). NiO-ZnO is a well-known adsorbent, however, the adsorption capacity of NiO-ZrO2 presented in this work can an have potential advantages over other adsorbents including the former one. Additionally, XPS showed clear evidence of the retention of sulfur from dibenzothiophene when interacted with the NiO-ZnO, NiO, and ZnO containing modified hydrotalcite adsorbents. Our results also indicated that the deposition of nickel on zirconia changed the nature of the active metal sites into the structure that successfully increased the sulfur removal capacity of the adsorbents.

 ,
, 


