Review

Validity and Reliability of Physiological Data in Applied Settings Measured by Wearable Technology: A Rapid Systematic Review

1
Department of Kinesiology and Nutrition Sciences, University of Nevada, Las Vegas, NV 89154, USA
2
School of Medicine, Tulane University, New Orleans, LA 70118, USA
*
Author to whom correspondence should be addressed.
Submission received: 12 October 2020 / Revised: 17 November 2020 / Accepted: 19 November 2020 / Published: 24 November 2020
(This article belongs to the Special Issue Wearable Technologies II)

Abstract

:
The purpose of this review was to evaluate the current state of the literature and to identify the types of study designs, wearable devices, statistical tests, and exercise modes used in validation and reliability studies conducted in applied settings/outdoor environments. This was performed according to the Preferred Reporting Items for Systematic Reviews and Meta-Analysis (PRISMA) guidelines. We identified nine articles that fit our inclusion criteria, eight of which tested for validity and one tested for reliability. The studies tested 28 different devices with exercise modalities of running, walking, cycling, and hiking. While there were no universally common analytical techniques used to measure accuracy or validity, correlative measures were used in 88% of studies, mean absolute percentage error (MAPE) in 75%, and Bland–Altman plots in 63%. Intra-class correlation was used to determine reliability. There were not any universally common thresholds to determine validity, however, of the studies that used MAPE and correlation, there were only five devices that had a MAPE of < 10% and a correlation value of > 0.7. Overall, the current review establishes the need for greater testing in applied settings when validating wearables. Researchers should seek to incorporate multiple intensities, populations, and modalities into their study designs while utilizing appropriate analytical techniques to measure and determine validity and reliability.

1. Introduction

Advances in technology have allowed researchers to learn how the body reacts to the stresses placed upon it through sport, physical activity, and exercise. Laboratory technology has advanced from early direct calorimeters, to whole-room open-circuit indirect calorimeter, to Douglas Bags, then pedometers, metabolic carts, portable metabolic systems, and other means designed to measure physiological metrics during exercising [1,2]. Technologies like Douglas Bags and portable metabolic systems have been revolutionary to the field of exercise physiology, allowing research to be performed in applied settings. This has enabled researchers to take the athletes or participants into the field to measure the physiological responses to the stresses of exercise. Wearables and fitness trackers are the natural progression to this technology, with the added benefit of reduced cost and increased prevalence. With the popularity of wearable technology increasing year over year, there are unique opportunities and insights now available. As these fitness trackers are meant to be worn by the general public, continuously, they provide a wealth of new data, previously unavailable to sport and exercise scientists, public health and wellness experts, and medical professionals. A total of 722 million connected wearable devices existed, worldwide, in 2019 [3]. The potential of this technology can revolutionize exercise physiology research, allowing researchers to ask more detailed and granular questions, and achieve a level of data acquisition that was previously out of reach [4].
Despite the potential of wearable technology to influence physiology research, there remains a need to ensure accuracy and reliability through independent research. Consumer devices have developed the ability to measure or estimate a range of physiological metrics, including heart rate variability, stress, pulse oximetry, lactate threshold, calorie consumption, and electromyography. This provides an advantage to future research potential as they will enable researchers to gain a deeper understanding of the body. However, we are currently limited in our use of these technologies without the independent validation of these devices. Unfortunately, independent validation has not kept pace with industry offerings, with companies producing and releasing devices faster than researchers can test for validity and reliability [5,6]. Whether the device produces valid estimates or measures is a matter of great concern to consumers and researchers desiring to utilize this technology. As the demand for accurate wearable technology has increased, independent validation has increased too, but at different rates [7,8]. The issue of determining validity is also compounded by the novelty of the field, and widely established validity criteria have not been determined. The statistical tests performed by researchers are also widely varied, and at times, inappropriate, indiscriminate, and unable to determine the validity of the device being tested. Standardized analytical methods have been suggested [9,10], and progress has been made, as of late, to remedy the deficiency in proper statistical tests.
There have been a number of reviews or analyses performed on wearable technology on topics such as wearable technology in sports and performance [11,12], its influence on human behavior [13,14,15,16], in medicine [17], and its use in elderly populations [18,19], among many others [20,21,22,23,24,25,26]. There has yet to be a review, to our knowledge, that has focused on studies validating the devices in applied or field-based settings. As discussed earlier, the role of these portable wearable devices is to measure physiological metrics in real-world applications, yet there is a clear gap in the research validating devices in applied settings. Therefore, the purpose of this review is to evaluate the current state of the literature and to identify the types of study designs, wearable devices, statistical tests, and exercise modes used in validation and reliability studies conducted in applied settings/outdoor environments.

2. Materials and Methods

This review was conducted in accordance with the Preferred Reporting Items for Systematic Reviews and Meta-Analysis (PRISMA) guidelines [27]. According to Sutton et al. [28] this review would be defined as a rapid review due to the limitations listed in the discussion. The review protocol has been published previously in accordance with the PRISMA guidelines [29].

2.1. Inclusion Criteria

For an article to be included, it had to satisfy six requirements: (1) have an exercise component, (2) utilize wearable technology to provide physiological measures, (3) include a statistical measure of validity or reliability, (4) be conducted outdoors, (5) be available in English, and (6) be published after 2010. For the purposes of this review, we adopted the American College of Sports Medicine definition of exercise, “Exercise is a type of [physical activity] consisting of planned, structured, and repetitive bodily movement done to improve and/or maintain one or more components of physical fitness” [30], if the study did not include a form of exercise that met this definition, it was not included. Wearable technology was defined as any wearable technological device capable of returning any physical or physiological metric to the user. Physiological measures were defined as any measurable physiological process occurring within the body, which would include measures such as heart rate, energy expenditure, and lactate threshold, but would exclude physical measurements such as step count, distance, cadence, and repetitions. The timeline of 2010 as well as from more recently was chosen because prior to 2010, wearable technology was much less sophisticated than what is seen today, which has developed into devices capable of measuring or estimating more complex physiological variables. The purpose was to represent the current state of the technology, and due to the rapid evolution of this technology, anything prior to 2010 is antiquated and too different from the devices being released today.

2.2. Search Strategy

Researchers performed three phases of screening, and teams of two independent reviewers performed all searches and reviews. First, the researchers identified all relevant articles by title screening only; second, eligibility was determined by abstract screening; and finally, full-article screening was performed. Any inconsistencies in eligible literature within teams was rectified by a third researcher. Reviewers exported the references into the citation manager of their choice (RefWorks or Endnote), then sent their completed list as an excel spreadsheet (exported from the citation manager) to the third researcher for the compilation and determination of final eligibility to resolve any inconsistencies. If eligibility could not be determined from the text, reviewers contacted the author by email to clarify; there were no instances where the author could not be contacted for clarification.
Google Scholar was used as the search database, and the single search string which utilized keywords and Boolean operators was: “Running OR Walking OR Biking OR Cycling OR Swimming OR Rowing OR Hiking OR Triathlon OR Exercise + Activity Trackers OR Fitness Trackers OR Wearable Technology OR Wearables + Validity OR Reliability OR outdoors OR field” (see Table 1).

2.3. Data Extraction

Teams of two independent reviewers extracted relevant data from each study into an excel spreadsheet, including information such as the number of subjects, information on the wearable device being tested, statistical measures to determine validity, outdoor location, as well as exercise format and intensity. Any inconsistencies were resolved between the reviewers on that team.

2.4. Risk of Bias Assessment
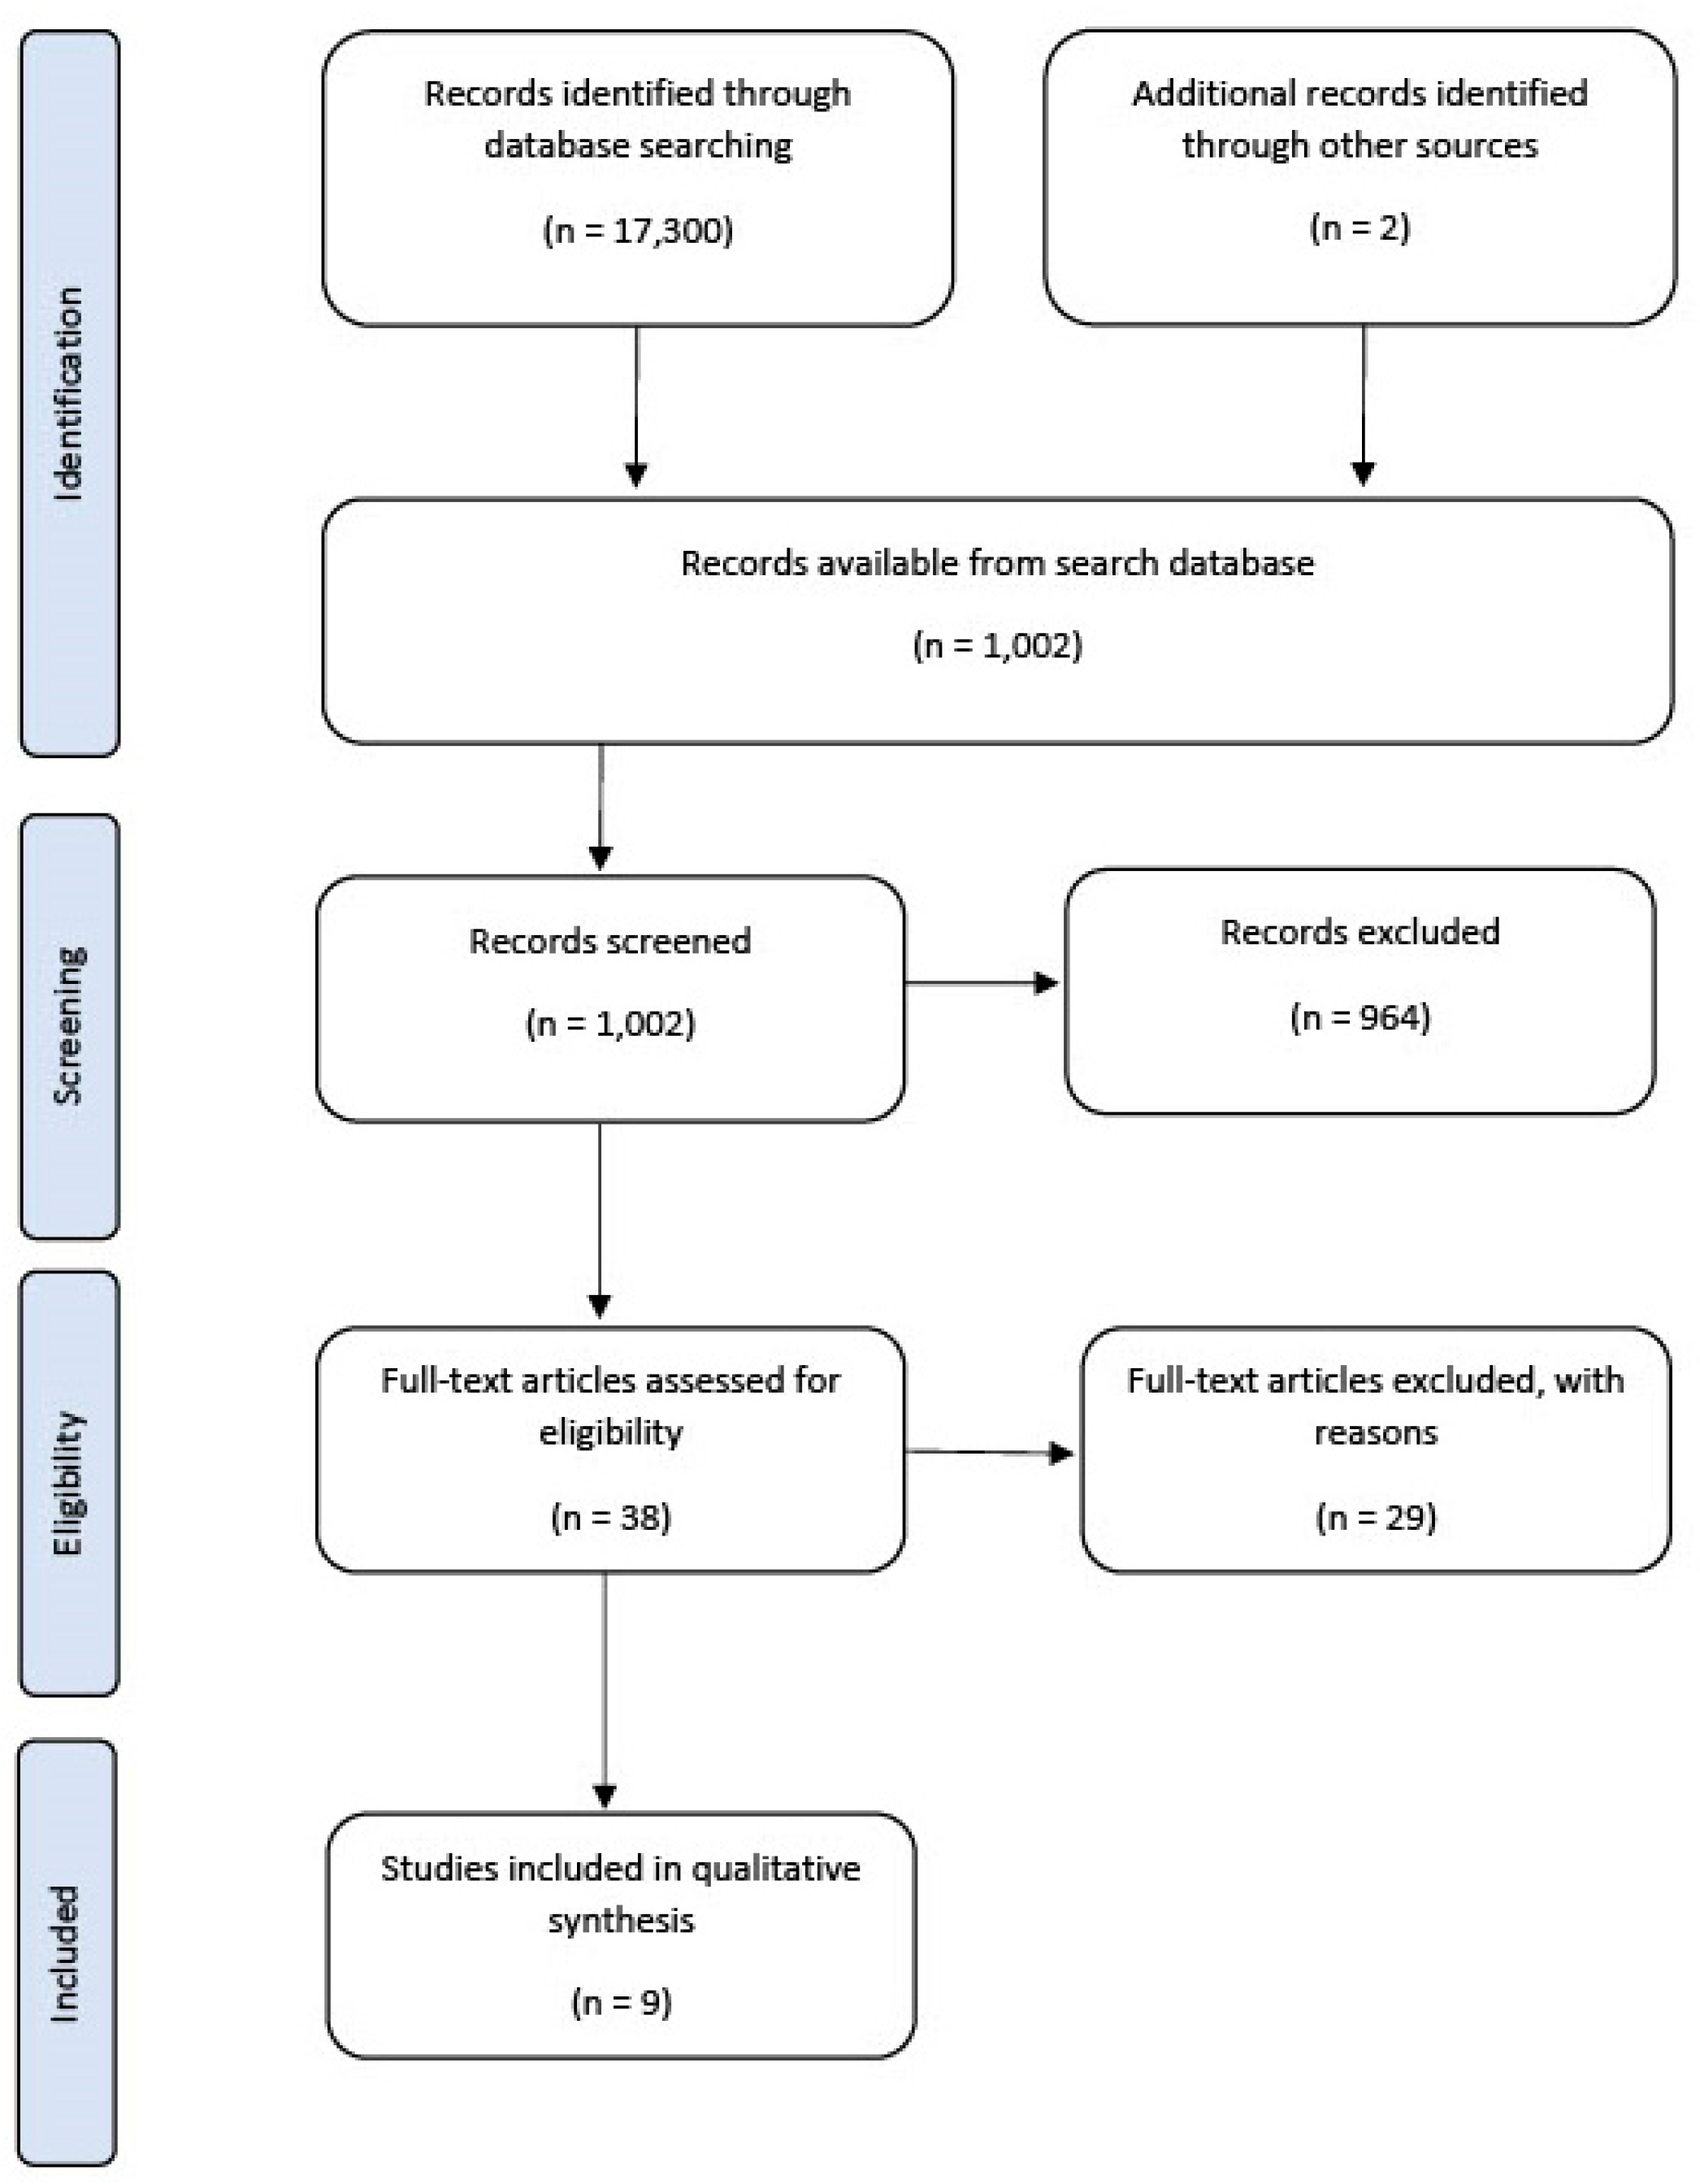
The Cochrane Risk of Bias Tool 2.0 (ROB 2.0) was used to assess the methodological quality of the individual studies and the risk of bias [31]. Teams of two researchers collaborated to fill out the assessment tool for each study.

3. Results

The search string resulted in 17,300 articles. During the screening process, it became known to the researchers that Google Scholar does not allow users to go past 100 pages (1000 articles). Therefore, while the search produced 17,300 results, 1000 results were evaluated for inclusion. This limitation was not known prior to choosing Google Scholar as the database, but due to the popularity of Google Scholar, (82% of academic knowledge seekers start their research with Google Scholar) [32], the size of Google Scholar [33], and the scope of the rapid review being performed, we determined that this would be a sufficient assortment of articles for the current rapid review.
There was a total of 157 articles after title screening, 38 articles after abstract screening, and a total of nine articles that met the criteria for inclusion after full-article screening, [34,35,36,37,38,39,40,41,42] (see Figure 1 and Table 2).

3.1. Exercise Mode

The studies reviewed utilized several exercise modalities to test for validity or reliability, including walking or hiking [34,36,41,42], running or trail running [34,37,38,39,40,41,42], and cycling [41] (See “Exercise Modality” column in Table 3, Table 4 and Table 5). These activities were performed under various intensities and durations.
Duration was reported as both distance (km) and time (min). The average reported running distance was 2.2 ± 1.3 km, while the average walking distance was 2.1 ± 1.4 km. Distance was not reported for cycling exercise [41]. Six articles [34,35,37,38,40,42] reported time as their measure of duration with Navalta et al. [37] and Adamakis [34] both reporting duration and time. Adamakis reported a timed duration for two different exercise protocols, walking and running (which were each factored into the average separately). Among the articles that reported time as their measurement, an average of 25.1 min was spent performing the study-specific protocols.
The intensities under which the participants performed the activities were primarily described as a generalized, self-selected pace. Carrier et al. [35] was among the articles that described a self-selected pace for their participants but included a stipulation that the pace be maintained above 70% of the subject’s maximal heart rate. This was in accordance with the guidelines of the wearable technology utilized to estimate aerobic capacity. Other exercise intensity descriptions by authors included Wahl et al. [40], who described in their protocol as an outdoor run that needed to be maintained at a speed of 10.1 km/h, and Zanetti et al. [42], who described the exercise as a specific, intermittent intensity that would simulate the intensity of running/exercising in a rugby match as their exercise protocol.

3.2. Study Design

With respect to the study design employed by the investigations meeting the criteria for inclusion in this rapid review, the data extracted were participant characteristics, types of statistical analyses, criterion measures used, and physiological variables tested.
The number of participants utilized for determining the validity and reliability of wearable devices in an outdoor/applied setting ranged from n = 1 to n = 44 (n = 19.6 ± 12 participants, reported as mean ± SD). Only 56% (5/9) of studies had over 20 participants. Seventy-seven percent of studies (7/9) tested both male (n = 11 ± 6) and female (n = 9 ± 7) participants. Participants in all investigations were overwhelmingly younger, with an average mean age of 27 ± 5 years. Without exception, the participants were screened to be healthy and free of illness. Four investigations (57%) required participants to have a state of chronic activity level. The studies reviewed for this paper all included information on the biological sex, age, weight, and height of the participants, as is commonly reported, with Parak et al. [38] also reporting body mass index (BMI), Wahl et al. [40] and Zanetti et al. [42] both reporting body fat percentage, Xie et al. [41] reporting weekly physical activity, and Carrier et al. [35] reporting weekly average run distance.
One investigation evaluated wearable device reliability, and the remaining reported validity compared to a criterion measure [36] (See “Reliability/Validity Measure” column in Table 3, Table 4 and Table 5). Reliability was determined using the intraclass correlation coefficient (ICC) and measures were considered reliable if the ICC was greater than 0.70 with an accompanying p-value less than 0.05. Considering validity measurements, 88% (7/8) of studies used multiple indicators of agreement. Four investigations [34,35,41,42] reported two measures of validity, while three studies [37,38,40] utilized four statistical tests or more for agreement. Among the statistical tests, correlative measures (Pearson, ICC, Spearman, Lin’s concordance correlation coefficient (CCC)) were employed in 88% (7/8) of studies with established thresholds for considering a device valid either using statistical significance (p < 0.05) or a predefined definition (r > 0.70). Mean absolute percent error (MAPE) was used in 75% (6/8) of studies with a threshold of lower than 10% being considered valid in two studies, and thresholds not reported in the methodology in the remaining four investigations. The typical error of the estimate (TEE) or mean absolute error (MAE) was employed in four investigations with effect size calculations used to determine the validity thresholds in one study and thresholds not reported in the remaining three investigations. Bland–Altman plots were utilized in 63% (5/8) of investigations.
The single investigation that determined reliability in an outdoor setting evaluated pulmonary variables (respiratory rate, maximal respiratory rate), cardiovascular variables (heart rate, maximal heart rate), and energy expenditure [36]. The majority of studies aimed at determining wearable device validity obtained energy expenditure estimates (80%, 6/8) (See Table 3). The criterion equipment utilized were portable metabolic analyzers that were validated against laboratory-based systems [43,44,45] Cosmed K4b2 (COSMED, Rome, Italy) (67%, 4/6), Metalyzer 3b (Cortex Medical, Leipzig, Germany) (17%, 1/6), and Metamax 3b (Cortex Medical, Leipzig, Germany) (17%, 1/6). Three investigations (38%, 3/8) determined a heart rate agreement [37,39,41] with the valid and reliable Polar heart rate monitors [46,47] utilized as the criterion in two studies [37,39], and manual palpation utilized in the other [41] (See Table 4). Two investigations determined the validity of a wearable device to return accurate maximal aerobic capacity (VO2max) (25%, 2/8) [35,38], while one investigation determined the validity for ventilatory rate (17%, 1/6) and pulmonary ventilation (17%, 1/6) (39) (See Table 5). The criterion measure employed for these variables was a portable metabolic cart (Metalyzer 3b, Cosmed K4b2) or laboratory metabolic cart (Parvo Medics TrueMax, Sandy, UT, USA).

3.3. Wearable Device

From all studies reviewed, a total of 28 consumer devices tested and no novel devices were used (a total list of devices can be found in Table 2). In studies with multiple devices being tested [34,37,40,41], the order in which they were placed on the wrist/forearm were randomized. Of the devices tested only one was biometric clothing (Hexoskin), one ring (Motiv Ring), one forearm (Scosche Rhythm+), one earbud (Jabra Elite Sport Earbuds), and 24 were wrist-worn devices (see Table 2).

3.4. Device Validity

Device validity was determined for several different physiological metrics, including energy expenditure, heart rate, ventilation rate, VO2max, and minute ventilation.

3.4.1. Estimated Energy Expenditure

As shown in Table 3, the energy expenditure estimations from wearable technology devices continued to have low agreement with criterion portable metabolic units when this measure was obtained in an outdoor environment. Of the twenty-three different wearable devices evaluated in the literature to meet inclusion in the present rapid review, none were considered to return acceptable validity measures for exercise occurring in a natural setting, according to the authors of the original studies. Additionally, no investigations reported reliability measures for estimated energy expenditure outdoors.

3.4.2. Heart Rate

Heart rate measures depend largely on the device type and outdoor location utilized. The Hexoskin smart shirt displayed poor reliability (36) and validity (39) when utilized in trail situations (hiking and trail running). Similarly, every photoplethysmography-based device evaluated during trail running returned heart rate values that were not deemed acceptable by the authors (37). On the other hand, with the exception of the Xiaomi Mi Band 2, wrist worn devices returned acceptable agreement when compared to palpated heart rate measurements when participants ran and walked around a track or rode a fixed path [41] (see Table 4).

3.4.3. Other Physiological Variables

One investigation evaluated the ability of wearable technology devices to return acceptable validity measures for the estimated physiological variables of ventilation rate, and minute ventilation [39], while two evaluated VO2max [35.38]. The Hexoskin biometric shirt displayed acceptable agreement for ventilation rate but not minute ventilation [39] in a trail environment. The PulseOn monitor and Garmin fenix 3 provided acceptable validity for estimating the maximal aerobic capacity when participants ran on an outdoor track [35,38] (see Table 5). No reliability data were available for these variables in an outdoor setting.

3.5. Outdoor Location/Environment

Of the studies reviewed, various outdoor locations were chosen and are as follows: outdoor trails (4/9) [34,36,37,39], paved track (3/9) [35,38,41], free-living conditions [40], and a rugby field (1/9) [42]. All studies had varying descriptions of the environment. Of the studies reviewed, Adamakis [34], Montes et al. [36], Navalta et al. [37], and Tanner et al. [39] were the only studies to mention grade or elevation, with Adamakis taking place at a 49-acre park on a path with both wooden and paved surfaces with no increase or decrease in grade. Montes noted the starting elevation for both days, where day one was recorded at 5446 feet above sea level, and day two was recorded as 5757 feet above sea level at the trailhead, which then rose to 6443 feet above sea level at a 17.6% grade. The trail names were not mentioned, however, a grading system was defined for both trails as a class I, Yosemite Decimal System (YDS). Navalta et al. took place at three separate locations: McCullough Hills Trail, Henderson, NV, with an elevation change of 58 m, Three Peaks Trail, Cedar City, UT, at 55 m, and Bristlecone Trail, Mt. Charleston, NV, at 104 m. Navalta et al. were also the only study that included graphs and explanations of the elevation gain and drop along the trail path. The Tanner et al. study took place at Three Peaks Recreation Area, Cedar City, with a starting elevation of 5385 feet above sea level with a rise of 56 feet.
Parak et al. [38] and Tanner et al. [39] were the only studies to mention temperature whereas Tanner et al.’s was measured at 26.2–32.3 °C. Parak et al. did not give a specific temperature but listed stipulations for conducting testing, since testing took place in the winter months. The stipulations were no rain or snow, and a temperature above −10 °C.
The study by Zanetti et al. [42] took place on a rugby pitch to simulate game aspects, but no other information about climate or environment was given. Wahl et al. [40] also did not describe the environment of their outdoor running route. Xie et al. [41] used a standard 400 m track for part of the testing, though they did not describe their predetermined outdoor cycling route.
Environment was not explicitly described for every study and/or session, but inferences could be made by the geographical location of each study. Adamakis (Athens, Greece), Montes et al. (United States), Navalta et al. (Las Vegas, NV), Parak et al. (Finland), Carrier et al. (Utah), Tanner et al. (Cedar City, UT, USA), Wahl et al. (Germany), Xie et al. (China), and Zanetti et al. (Australia).

3.6. Risk of Bias

The risk of bias and methodological quality of the studies included in the present review were assessed using the Cochrane Risk of Bias Assessment Tool (ROB 2.0) [31]. The assessment tool uses five domains to evaluate the quality of the study and the individual risk of bias (1. randomization process, 2. deviations from intended interventions, 3. missing outcome data, 4. measurement of the outcome, 5. selection of the reported result), which produces an overall bias result in the form of “Low risk”, “Some concerns”/unclear risk of bias, and “High risk”, as seen in Table 6. All the studies had at least “Some concerns” for bias due to the randomization procedures being irrelevant to validation-type study designs. One study had a high risk of bias due to the sample size of one (n = 1) (34).

4. Discussion

The purpose of this rapid systematic review was to evaluate the current state of the literature and to identify the types of study designs, wearable devices, statistical tests, and exercise formats used in studies conducted in applied settings/outdoor environments. According to our findings, the present volume of literature validating wearable technology in applied settings is small compared to the larger body of wearable technology validation literature. We believe that determining the validity and reliability of wearable technology devices in applied settings is important, (1) for consumers to have confidence in the measurements that are being generated, (2) for coaches, practitioners, and athletes to have accurate and reliable physiological data available, and (3) for researchers who wish to conduct investigations in applied settings utilizing these devices. Our findings indicate two main themes that should be considered when investigators intend to conduct validity or reliability testing on wearable devices in outdoor settings. Each theme will be discussed in further detail below, including considerations for study design, and for the analytical techniques utilized.

4.1. Study Design

Out of the nine papers that were included, only one paper analyzed the reliability of the device [36]. Reliability is an important aspect in determining the effectiveness of wearable technology and researchers should design validation and reliability studies to remedy this deficiency. This limitation has been noted in other systematic reviews specific to wearable technology for tracking physical activity [5,48]. The current findings, again, highlight the need for study designs to account for device reliability.
A difficulty in outdoor validation is designing robust and complex training or testing protocols, and authors should aim to design more rigorous and purposive studies to improve the level of testing, similar to what would be found in laboratory-based studies. These may include utilizing different intensities, modalities, environments, populations, and collection times, to name a few. Wearable technology purports to measure physiological variables in a range of different exercises, however, running, walking, and biking are the main exercise modalities evaluated, and there remains a need to validate these devices using other modes of exercise. The Consumer Technology Association recommends at least 5 min of data collection during trials obtaining heart rate [49], however, that may still be insufficient. The average collection time for the studies included in this review was 25.1 min. Researchers should also try to account for a range of body compositions, BMI, age, biological sex, skin type, etc., as the Consumer Technology Association also recommends [49]. Of the studies reviewed, only one [38] reported BMI (although all reported height and weight, so the BMI could be calculated), two [40,42] reported body fat percentage, and none reported skin types (although not all authors used devices with photoplethysmography or near-infrared sensors that could be impacted by the skin type). The Consumer Technology Association has also recommended that at least twenty participants be utilized [49,50,51], and only 56% (5/9) of studies met this guideline.
These consumer devices are primarily going to be used at self-selected paces, consequently, it is important to have a self-selected pace as a condition of the validity testing; however, researchers should also make an effort to incorporate different intensities of exercise, as these devices are intended to be used throughout the spectrum of exercise intensity. The studies included in the current review used a self-selected pace in seven of the nine studies.
Researchers should also seek to validate the devices in a range of environments, including different altitudes, temperatures, humidity levels, etc., whenever reasonable. When reporting the results of the studies, researchers should also include information about the testing environment under which the devices were utilized. The studies for the current review reported a range of environmental factors, such as the testing surface, geographical region, temperature range, altitude, and grade. Designing studies to test under these different conditions and circumstances will provide better resolution, for both the consumer and the researcher, as to the unique circumstances and intensities in which each device may be considered valid.

4.2. Analytical Techniques, Validity Criteria, and Quality Assessment

According to Welk et al. [10], 87% of the activity monitoring validation literature uses correlation coefficients and 52% use MAPE. From the studies included in the present review, the use of multiple statistical tests was performed in 88% of the validation studies. We recommend that researchers looking to validate a device perform at least three analyses to assess validity, 1. some type of correlation test (Pearson, Spearman, ICC, CCC), 2. MAPE, and 3. Bland–Altman plots with 95% limits of agreement. MAE or root mean square error (RMSE) can also be useful as they are in the same units of the device measurement [52,53,54], and some authors have seen fit to perform mean comparisons using standard hypothesis testing methods (t-test, ANOVA) with a “flipped” alpha level to determine accuracy [10]. While this type of analysis can be useful in determining whether the device tends to overestimate or underestimate, compared to the criterion measure, these tests were designed to determine whether a difference exists, and a lack of a significant difference is not the same as accuracy or validity. Therefore, statistical analyses using MAPE, correlation, and Bland–Altman plots should also be performed.
As discussed earlier, there is no widely accepted criteria to determine validity, and it varies between authors, journals, and reviewers. Of the six studies that utilized MAPE as a criterion for validity determination, a threshold of <10% was established for the validity threshold in two of them, with the other four did not report a threshold. TEE or MAE was utilized in four investigations with one study utilizing effect size calculation to determine validity, while the other three did not establish thresholds for TEE or MAE. Five out of eight validation studies utilized Bland–Altman plots, although there has not been a quantitative measure developed to establish thresholds associated with Bland-Altman plots. Correlative measures were highly common, and performed in 8/9 studies evaluated, with a minimum threshold for correlation values being >0.7 and a maximum threshold of >0.9. While acceptable analyses are beginning to emerge, there remains the need to establish universally acceptable validity criteria. As there is not even agreed upon criteria to measure accuracy and validity, accepted thresholds to determine validity have even less consensus. As the purpose of validation studies is to answer the question of whether a device is valid, thresholds to answer that question are essential. While specific use cases of the devices may influence whether a given validity threshold would be acceptable to certain populations (research, professional and collegiate athletics, consumer use, etc.), it is, nevertheless, important to establish appropriate thresholds to determine when devices may be considered valid.
The deficiency of proper analytical methods extends to the evaluation of the quality of the articles, as is evidenced in the lack of appropriate “Risk of Bias” assessment tools for a review such as this one. While some systematic reviews for validation literature will use a common risk of bias tools like the Cochrane [31] or Joanna Briggs Institute [55] assessment tools [56], others have simply chosen not to perform a risk of bias assessment [11]. While the Cochrane tool was used in the current review, there is a need to develop an assessment tool more appropriate to the study designs used in the validation of wearable technology.
Beyond establishing appropriate measurement criteria, thresholds, and a proper risk of bias tool for validation studies, there is no easy way for practitioners, researchers, athletes or consumers to determine whether a device is valid, and under what circumstances it may be valid without combing through, potentially, hundreds of peer-reviewed articles. This is time-consuming and difficult for anyone to do, and even more unlikely for athletes or consumers to do, as they may not have access to certain articles or journals. There is a need for an easily accessible, independent database to succinctly characterize which devices may be used in specific scenarios, based on the independent, peer-reviewed validation literature. This would be helpful for anyone seeking to use wearable technology, from consumers using it for recreational fitness purposes to academics and professionals conducting high-level research. As the capabilities of these devices to measure more physiological metrics inevitably improve, the need for independent research will continue to increase. In addition to adding new activities, manufacturers should also seek to continually improve the list of physiological variables that the devices can measure.

4.3. Limitations

A limitation of the current review is that Google Scholar does not allow the user to go past page 100 (1000 search results). This was not known to the researchers prior to starting the review, however, due to the popularity of Google Scholar (as stated earlier, 82% of academics start their research using Google Scholar) [32], the decision was made to move forward despite this limitation. The major reason this review has been labeled a “rapid review”, was due to the search abilities associated with using Google Scholar.

5. Conclusions

The purpose of this review was to evaluate the current state of the literature and to identify the types of study designs, wearable devices, statistical tests, and exercise modes used in validation and reliability studies conducted in applied settings/outdoor environments. As a result, we identified nine studies that fit our inclusion criteria and reflected the current state of the literature. The main findings included 28 wearable devices with exercise modalities in outdoor environments being: running, walking, cycling, hiking, and trail running. There were not any universally common analytical techniques used to determine validity, however, correlative measures were used in 88% of the studies, mean absolute percentage error (MAPE) was used in 75%, and Bland–Altman plots were used in 63%. The devices that had an MAPE lower than 10% and a correlation value of greater than 0.7 in any measured variable were: Garmin Vivosmart (Energy Expenditure), Garmin Vivoactive (Energy Expenditure), Suunto Spartan Sport w/HRM (HR), Garmin fenix 3 HR (VO2max), and the PulseOn (VO2max).
Overall, the current review established the need for greater testing in outdoor or applied settings when validating wearable technology. Researchers should seek to incorporate multiple intensities, populations, and exercise modalities into their study designs while utilizing appropriate analytical techniques to determine validity and reliability. The results of these studies will have even greater relevance when validated in the field or in applied settings. Researchers who perform the validation of these devices enable others to confidently use these devices to drive training, health, and wellness decisions, as well as to enable the use of these devices in future research.

Funding

This research received no external funding

Conflicts of Interest

The authors declare no conflict of interest.

References

  1. Archiza, B.; Welch, J.F.; Sheel, A.W. Classical experiments in whole-body metabolism: Closed-circuit respirometry. Eur. J. Appl. Physiol. 2017, 117, 1929–1937. [Google Scholar] [CrossRef]
  2. Schoffelen, P.F.M.; Plasqui, G. Classical experiments in whole-body metabolism: Open-circuit respirometry—diluted flow chamber, hood, or facemask systems. Eur. J. Appl. Physiol. 2017, 118, 33–49. [Google Scholar] [CrossRef] [Green Version]
  3. Statista. Available online: https://0-www-statista-com.brum.beds.ac.uk/statistics/487291/global-connected-wearable-devices/ (accessed on 6 October 2020).
  4. Wright, S.P.; Brown, T.S.H.; Collier, S.R.; Sandberg, K. How consumer physical activity monitors could transform human physiology research. Am. J. Physiol. Integr. Comp. Physiol. 2017, 312, R358–R367. [Google Scholar] [CrossRef] [PubMed]
  5. BUNN, J.A.; Navalta, J.W.; Fountaine, C.J.; REECE, J.D. Current state of commercial wearable technology in physical activity monitoring 2015–2017. Int. J. Exerc. Sci. 2018, 11, 503. [Google Scholar] [PubMed]
  6. Knowles, B.; Smith-Renner, A.; Poursabzi-Sangdeh, F.; Lu, D.; Alabi, H. Uncertainty in current and future health wearables. Commun. ACM 2018, 61, 62–67. [Google Scholar] [CrossRef]
  7. Curcin, V.; Silva, P.A.; Guisado-Fernandez, E.; Loncar-Turukalo, T.; Zdravevski, E.; Da Silva, J.M.; Chouvarda, I.; Trajkovik, V. Literature on Wearable Technology for Connected Health: Scoping Review of Research Trends, Advances, and Barriers. J. Med. Internet Res. 2019, 21, e14017. [Google Scholar] [CrossRef]
  8. Piwek, L.; Ellis, D.A.; Andrews, S.; Joinson, A. The Rise of Consumer Health Wearables: Promises and Barriers. PLoS Med. 2016, 13, e1001953. [Google Scholar] [CrossRef] [PubMed]
  9. Düking, P.; Fuss, F.K.; Holmberg, H.-C.; Sperlich, B. Recommendations for Assessment of the Reliability, Sensitivity, and Validity of Data Provided by Wearable Sensors Designed for Monitoring Physical Activity. JMIR mHealth uHealth 2018, 6, e102. [Google Scholar] [CrossRef] [PubMed]
  10. Welk, G.J.; Bai, Y.; Lee, J.-M.; Godino, J.; Saint-Maurice, P.F.; Carr, L. Standardizing Analytic Methods and Reporting in Activity Monitor Validation Studies. Med. Sci. Sports Exerc. 2019, 51, 1767–1780. [Google Scholar] [CrossRef]
  11. Adesida, Y.; Papi, E.; McGregor, A. Exploring the Role of Wearable Technology in Sport Kinematics and Kinetics: A Systematic Review. Sensors 2019, 19, 1597. [Google Scholar] [CrossRef] [Green Version]
  12. Camomilla, V.; Bergamini, E.; Fantozzi, S.; Vannozzi, G. Trends Supporting the In-Field Use of Wearable Inertial Sensors for Sport Performance Evaluation: A Systematic Review. Sensors 2018, 18, 873. [Google Scholar] [CrossRef] [PubMed] [Green Version]
  13. Brickwood, K.-J.; Watson, G.; O’Brien, J.; Williams, A.D. Consumer-Based Wearable Activity Trackers Increase Physical Activity Participation: Systematic Review and Meta-Analysis. JMIR mHealth uHealth 2019, 7, e11819. [Google Scholar] [CrossRef] [PubMed]
  14. Coughlin, S.S.; Stewart, J. Use of consumer wearable devices to promote physical activity: A review of health intervention studies. J. Environ. Health Sci. 2016, 2, 1–6. [Google Scholar] [CrossRef] [PubMed]
  15. Mercer, K.; Li, M.; Giangregorio, L.M.; Burns, C.M.; Grindrod, K. Behavior Change Techniques Present in Wearable Activity Trackers: A Critical Analysis. JMIR mHealth uHealth 2016, 4, e40. [Google Scholar] [CrossRef] [PubMed] [Green Version]
  16. Bisson, A.N.S.; Lachman, M.E. Behavior Change with Fitness Technology in Sedentary Adults: A Review of the Evidence for Increasing Physical Activity. Front. Public Health 2017, 4, 289. [Google Scholar] [CrossRef] [Green Version]
  17. Iqbal, M.H.; Aydin, A.; Brunckhorst, O.; Dasgupta, P.; Ahmed, K. A review of wearable technology in medicine. J. R. Soc. Med. 2016, 109, 372–380. [Google Scholar] [CrossRef]
  18. Straiton, N.; Alharbi, M.; Bauman, A.; Neubeck, L.; Gullick, J.; Bhindi, R.; Gallagher, R. The validity and reliability of consumer-grade activity trackers in older, community-dwelling adults: A systematic review. Maturitas 2018, 112, 85–93. [Google Scholar] [CrossRef] [Green Version]
  19. Tedesco, S.; Barton, J.; O’Flynn, B. A Review of Activity Trackers for Senior Citizens: Research Perspectives, Commercial Landscape and the Role of the Insurance Industry. Sensors 2017, 17, 1277. [Google Scholar] [CrossRef] [Green Version]
  20. Khakurel, J.; Melkas, H.; Porras, J. Tapping into the wearable device revolution in the work environment: A systematic review. Inf. Technol. People 2018, 31, 791–818. [Google Scholar] [CrossRef] [Green Version]
  21. Kumari, P.; Mathew, L.; Syal, P. Increasing trend of wearables and multimodal interface for human activity monitoring: A review. Biosens. Bioelectron. 2017, 90, 298–307. [Google Scholar] [CrossRef]
  22. Lewis, Z.H.; Lyons, E.J.; Jarvis, J.M.; Baillargeon, J. Using an electronic activity monitor system as an intervention modality: A systematic review. BMC Public Health 2015, 15, 1–15. [Google Scholar] [CrossRef] [PubMed] [Green Version]
  23. Mahloko, L.; Adebesin, F. A Systematic Literature Review of the Factors that Influence the Accuracy of Consumer Wearable Health Device Data. In Responsible Design, Implementation and Use of Information and Communication Technology; Springer: Berlin, Germany, 2020; pp. 96–107. [Google Scholar]
  24. Sanders, J.P.; Loveday, A.; Pearson, N.; Edwardson, C.L.; Yates, T.; Biddle, S.J.H.; Esliger, D.W.; Lyden, K.; Miner, A. Devices for Self-Monitoring Sedentary Time or Physical Activity: A Scoping Review. J. Med. Internet Res. 2016, 18, e90. [Google Scholar] [CrossRef] [PubMed] [Green Version]
  25. Shin, G.; Jarrahi, M.H.; Fei, Y.; Karami, A.; Gafinowitz, N.; Byun, A.; Lu, X. Wearable activity trackers, accuracy, adoption, acceptance and health impact: A systematic literature review. J. Biomed. Inform. 2019, 93, 103153. [Google Scholar] [CrossRef] [PubMed]
  26. O’Driscoll, R.; Turicchi, J.; Beaulieu, K.; Scott, S.; Matu, J.; Deighton, K.; Finlayson, G.; Stubbs, J. How well do activity monitors estimate energy expenditure? A systematic review and meta-analysis of the validity of current technologies. Br. J. Sports Med. 2018, 54, 332–340. [Google Scholar] [CrossRef]
  27. Moher, D.; Liberati, A.; Tetzlaff, J.; Altman, D.G. Prisma Group Preferred reporting items for systematic reviews and meta-analyses: The PRISMA statement. PLoS Med. 2009, 6, e1000097. [Google Scholar] [CrossRef] [Green Version]
  28. Sutton, A.; Clowes, M.; Preston, L.; Booth, A. Meeting the review family: Exploring review types and associated information retrieval requirements. Health. Inf. Libr. J. 2019, 36, 202–222. [Google Scholar] [CrossRef]
  29. Barrios, B.; Carrier, B.; Jolley, B.; Davis, D.W.; Sertic, J.; Navalta, J.W. Establishing a Methodology for Conducting a Rapid Review on Wearable Technology Reliability and Validity in Applied Settings. Top. Exerc. Sci. Kinesiol. 2020, 1, 8. [Google Scholar]
  30. Dwyer, G.B.; Davis, S.E. ACSM’s Health-Related Physical Fitness Assessment Manual; Lippincott Williams & Wilkins: Philadelphia, PA, USA, 2005. [Google Scholar]
  31. Higgins, J.P.T.; Altman, D.G.; Gøtzsche, P.C.; Jüni, P.; Moher, D.; Oxman, A.D.; Savović, J.; Schulz, K.F.; Weeks, L.; Sterne, J.A.C.; et al. The Cochrane Collaboration’s tool for assessing risk of bias in randomised trials. BMJ 2011, 343, d5928. [Google Scholar] [CrossRef] [Green Version]
  32. Du, J.T.; Evans, N. Academic Users’ Information Searching on Research Topics: Characteristics of Research Tasks and Search Strategies. J. Acad. Libr. 2011, 37, 299–306. [Google Scholar] [CrossRef]
  33. Gusenbauer, M. Google Scholar to overshadow them all? Comparing the sizes of 12 academic search engines and bibliographic databases. Scientometrics 2019, 118, 177–214. [Google Scholar] [CrossRef] [Green Version]
  34. Adamakis, M. Comparing the Validity of a GPS Monitor and a Smartphone Application to Measure Physical Activity. J. Mob. Technol. Med. 2017, 6, 28–38. [Google Scholar] [CrossRef] [Green Version]
  35. Carrier, B.; Creer, A.; Williams, L.R.; Holmes, T.M.; Jolley, B.D.; Dahl, S.; Weber, E.; Standifird, T. Validation of Garmin Fenix 3 HR Fitness Tracker Biomechanics and Metabolics (VO2max). J. Meas. Phys. Behav. 2020, 1–7. [Google Scholar] [CrossRef]
  36. Montes, J.; Stone, T.M.; Manning, J.W.; McCune, D.; Tacad, D.K.; Young, J.C.; DeBeliso, M.; Navalta, J.W. Using Hexoskin Wearable Technology to Obtain Body Metrics During Trail Hiking. Int. J. Exerc. Sci. 2015, 8, 425–430. [Google Scholar] [PubMed]
  37. Navalta, J.W.; Montes, J.; Bodell, N.G.; Salatto, R.W.; Manning, J.W.; DeBeliso, M. Concurrent heart rate validity of wearable technology devices during trail running. PLoS ONE 2020, 15, e0238569. [Google Scholar] [CrossRef]
  38. Parak, J.; Uuskoski, M.; Machek, J.; Korhonen, I. Estimating Heart Rate, Energy Expenditure, and Physical Performance with a Wrist Photoplethysmographic Device During Running. JMIR mHealth uHealth 2017, 5, e97. [Google Scholar] [CrossRef]
  39. Tanner, E.A.; Montes, J.; Manning, J.W.; Taylor, J.E.; DeBeliso, M.; Young, J.C.; Navalta, J.W. Validation of Hexoskin biometric shirt to COSMED K4 b2 metabolic unit in adults during trail running. Sports Technol. 2015, 8, 118–123. [Google Scholar] [CrossRef]
  40. Wahl, Y.; Düking, P.; Droszez, A.; Wahl, P.; Mester, J. Criterion-Validity of Commercially Available Physical Activity Tracker to Estimate Step Count, Covered Distance and Energy Expenditure during Sports Conditions. Front. Physiol. 2017, 8, 725. [Google Scholar] [CrossRef]
  41. Xie, J.; Wen, D.; Liang, L.; Jia, Y.; Gao, L.; Lei, J. Evaluating the Validity of Current Mainstream Wearable Devices in Fitness Tracking Under Various Physical Activities: Comparative Study. JMIR mHealth uHealth 2018, 6, e94. [Google Scholar] [CrossRef] [Green Version]
  42. Zanetti, S.; Pumpa, K.L.; Wheeler, K.W.; Pyne, D.B. Validity of the SenseWear Armband to Assess Energy Expenditure During Intermittent Exercise and Recovery in Rugby Union Players. J. Strength Cond. Res. 2014, 28, 1090–1095. [Google Scholar] [CrossRef]
  43. Schrack, J.A.; Simonsick, E.M.; Ferrucci, L. Comparison of the Cosmed K4b2 Portable Metabolic System in Measuring Steady-State Walking Energy Expenditure. PLoS ONE 2010, 5, e9292. [Google Scholar] [CrossRef] [Green Version]
  44. Meyer, T.; Georg, T.; Becker, C.; Kindermann, W. Reliability of Gas Exchange Measurements from Two Different Spiroergometry Systems. Int. J. Sports Med. 2001, 22, 593–597. [Google Scholar] [CrossRef] [PubMed]
  45. Macfarlane, D.J.; Wong, P. Validity, reliability and stability of the portable Cortex Metamax 3B gas analysis system. Eur. J. Appl. Physiol. 2012, 112, 2539–2547. [Google Scholar] [CrossRef] [PubMed] [Green Version]
  46. Bouts, A.M.; Brackman, L.; Martin, E.; Subasic, A.M.; Potkanowicz, E.S. The Accuracy and Validity of iOS-Based Heart Rate Apps During Moderate to High Intensity Exercise. Int. J. Exerc. Sci. 2018, 11, 533–540. [Google Scholar] [PubMed]
  47. Montes, J.; Navalta, J.W. Reliability of the Polar T31 Uncoded Heart Rate Monitor in Free Motion and Treadmill Activities. Int. J. Exerc. Sci. 2019, 12, 69–76. [Google Scholar] [PubMed]
  48. Evenson, K.R.; Goto, M.M.; Furberg, R.D. Systematic review of the validity and reliability of consumer-wearable activity trackers. Int. J. Behav. Nutr. Phys. Act. 2015, 12, 1–22. [Google Scholar] [CrossRef] [Green Version]
  49. Consumer Technology Association. Physical Activity Monitoring for Heart Rate, ANSI/CTA-2065; Consumer Technology Association: Hopewell, VA, USA, 2018. [Google Scholar]
  50. Consumer Technology Association. ANSI/CTA Standard Intensity Metrics: Physical Activity Monitoring; Consumer Technology Association: Hopewell, VA, USA, 2020. [Google Scholar]
  51. Consumer Technology Association. Physical Activity Monitoring for Step Counting, ANSI/CTA-2056; Consumer Technology Association: Hopewell, VA, USA, 2016. [Google Scholar]
  52. Claes, J.; Buys, R.; Avila, A.; Finlay, D.; Kennedy, A.; Guldenring, D.; Budts, W.; Cornelissen, V.A. Validity of heart rate measurements by the Garmin Forerunner 225 at different walking intensities. J. Med. Eng. Technol. 2017, 41, 480–485. [Google Scholar] [CrossRef]
  53. Floegel, T.A.; Florez-Pregonero, A.; Hekler, E.B.; Buman, M.P. Validation of Consumer-Based Hip and Wrist Activity Monitors in Older Adults with Varied Ambulatory Abilities. J. Gerontol. Ser. A Boil. Sci. Med. Sci. 2017, 72, 229–236. [Google Scholar] [CrossRef] [Green Version]
  54. Nelson, B.W.; Allen, N.B. Accuracy of Consumer Wearable Heart Rate Measurement During an Ecologically Valid 24-Hour Period: Intraindividual Validation Study. JMIR mHealth uHealth 2019, 7, e10828. [Google Scholar] [CrossRef]
  55. Tufanaru, C.; Munn, Z.; Stephenson, M.; Aromataris, E. Fixed or random effects meta-analysis? Common methodological issues in systematic reviews of effectiveness. Int. J. Evid.-Based Health 2015, 13, 196–207. [Google Scholar] [CrossRef] [Green Version]
  56. Lynch, C.; Bird, S.; Lythgo, N.; Selva-Raj, I. Changing the Physical Activity Behavior of Adults with Fitness Trackers: A Systematic Review and Meta-Analysis. Am. J. Health Promot. 2019, 34, 418–430. [Google Scholar] [CrossRef]
Figure 1. Flow diagram detailing the article screening and selection process.
Technologies 08 00070 g001
Table 1. Required components with the accompanying search terms utilized.
Exercise FormatTechnology TermStatistical MeasureNatural Environment
BikingActivity TrackersReliabilityField
CyclingFitness TrackersValidityOutdoors
ExerciseWearables
HikingWearable Technology
Rowing
Running
Swimming
Triathlon
Walking
Table 2. Devices used by the author, location of use and company information.
AuthorDeviceCompany InformationLocation
Adamakis (2017)Garmin Forerunner 310XT with Chest HR MonitorGarmin Ltd., Olathe, KS, USAWrist and Chest
Carrier et al. (2020)Garmin fēnix 3 HR + Chest HRMGarmin Ltd., Olathe, KS, USAWrist
Montes et al. (2015)Hexoskin Biometric ShirtCarré Technologies Inc., Montreal, QC, CanadaTorso
Navalta et al. (2020)Garmin fēnix 5Garmin Ltd., Olathe, KS, USAWrist
Navalta et al. (2020)Jabra Elite Sport EarbudsJabra, Copenhagen, DenmarkEars
Navalta et al. (2020)Motiv RingMotiv Inc., San Francisco, CA, USAHand
Navalta et al. (2020)Scosche Rhythm+ Forearm BandScosche Industries Inc., Oxnard, CA, USAForearm
Navalta et al. (2020)Suunto Spartan Sport Watch + Chest HRMSuunto Oy, Vantaa, FinlandWrist and Chest
Parak et al. (2017)PulseOnPulseOn, Espoo, FinlandWrist
Tanner et al. (2016)Hexoskin Biometric ShirtCarré Technologies Inc., Montreal, QC, CanadaTorso
Wahl et al. (2017)BodyMedia Sensewear MFBodyMedia Inc., Pittsburgh, PA, USAUpper Arm
Wahl et al. (2017)Beurer AS80Beurer GmbH, Ulm, GermanyWrist
Wahl et al. (2017)Polar LoopPolar Corp., Worcester, Massachusetts, USAWrist
Wahl et al. (2017)Garmin VivofitGarmin Ltd., Olathe, KS, USAWrist
Wahl et al. (2017)Garmin VivosmartGarmin Ltd., Olathe, KS, USAWrist
Wahl et al. (2017)Garmin VivoactiveGarmin Ltd., Olathe, KS, USAWrist
Wahl et al. (2017)Garmin Forerunner 920XTGarmin Ltd., Olathe, KS, USAWrist
Wahl et al. (2017)Fitbit ChargeFitbit Inc., San Francisco, CA, USAWrist
Wahl et al. (2017)Fitbit Charge HRFitbit Inc., San Francisco, CA, USAWrist
Wahl et al. (2017)Xiaomi Mi BandXiaomi Corp., Beijing, ChinaWrist
Wahl et al. (2017)Withings Pulse OxWithings SACA, Issy Les Moulineaux, FranceWrist
Xie et al. (2018)Apple Watch 2Apple Inc., Cupertino, CA, USAWrist
Xie et al. (2018)Samsung Gear S3Samsung Electronics Co., Ltd., Seoul, South KoreaWrist
Xie et al. (2018)Jawbone Up 3Jawbone Inc., Beverly Hills, CA, USAWrist
Xie et al. (2018)Fitbit SurgeFitbit Inc., San Francisco, CA, USAWrist
Xie et al. (2018)Huawei Talk Band B3Huawei Technologies Co., Ltd., Longgang District, Shenzhen, ChinaWrist
Xie et al. (2018)Xiaomi Mi Band 2Xiaomi Corp., Beijing, ChinaWrist
Zanetti et al. (2014)BodyMedia SenseWear Mini ArmbandBodyMedia Inc., Pittsburgh, PA, USAWrist
Table 3. Estimated energy expenditure validity of wearable devices in an outdoor setting. r = Pearson correlation coefficient, MAPE = mean absolute percentage error, MAE = mean absolute error, TE = typical error, ICC = intraclass correlation coefficient, LoA = levels of agreement. Values for MAPE are shown as originally reported by the authors.
AuthorWearable DeviceExercise ModalityValidity Measure
Adamakis (2017)Garmin Forerunner 310XTWalkingMAPE = 17.39%
Adamakis (2017)Garmin Forerunner 310XTRunningMAPE = 17.32%
Parak et al. (2017)PulseOnRunningBias: −11.93+13.99, MAE = 13.05, MAPE = 16.5%, r = 0.77
Tanner et al. (2016)Hexoskin Biometric ShirtTrail Runningr = −0.058
Wahl et al. (2017)Bodymedia Sensewear MFRunningMAPE = −20.8%, ICC = 0.43, TE = 21.8, LoA = 9.7 to −103.6
Wahl et al. (2017)Polar LoopRunningMAPE = 22.1%, ICC = −0.18, TE = 71.4, LoA = 163.0 to −94.8
Wahl et al. (2017)Beurer AS80RunningMAPE = −48.4%, ICC = −0.04, TE = 56.8, LoA = 1.3 to −216.9
Wahl et al. (2017)Garmin VivofitRunningMAPE = −20.2%, ICC = 0.56, TE = 14.3, LoA = −1.9 to −86.6
Wahl et al. (2017)Garmin VivosmartRunningMAPE = −1.5%, ICC = 0.82, TE = 13.6, LoA = 59.0 to −66.8
Wahl et al. (2017)Garmin VivoactiveRunningMAPE = −4.5%, ICC = 0.91, TE = 5.4, LoA = 24.3 to −46.2
Wahl et al. (2017)Garmin Forerunner 920 XTRunningMAPE = −21.2%, ICC = 0.34, TE = 31.9, LoA = 29.3 to −124.5
Wahl et al. (2017)Fitbit ChargeRunningMAPE = −4.5%, ICC = 0.64, TE = 18.6, LoA = 46.2 to −75.6
Wahl et al. (2017)Fitbit Charge HRRunningMAPE = −12.0%, ICC = 0.53, TE = 24.4, LoA = 40.2 to −99.5
Wahl et al. (2017)Withings Pulse Ox (Hip)RunningMAPE = −5.5%, ICC = 0.21, TE = 52.0, LoA = 97.3 to −132.2
Wahl et al. (2017)Withings Pulse Ox (Wrist)RunningMAPE = −4.5%, ICC = 0.22, TE = 50.0, LoA = 91.7 to −130.4
Xie et al. (2018)Jawbone Up3Running, Walking, CyclingMAPE = 28%
Xie et al. (2018)Huawei Talk Band B3Running, Walking, CyclingMAPE = 32%
Xie et al. (2018)Samsung Gear S3Running, Walking, CyclingMAPE = 38%
Xie et al. (2018)Xiaomi Mi Band 2Running, Walking, CyclingMAPE = 40%
Xie et al. (2018)Apple Watch 2Running, Walking, CyclingMAPE = 49%
Xie et al. (2018)Fitbit SurgeRunning, Walking, CyclingMAPE = 67%
Zanetti et al. (2014)BodyMedia SenseWear Mini ArmbandRugby Intermittent Exercise Testr = 0.55
Table 4. Heart rate reliability and the validity of wearable devices in an outdoor applied setting. CCC = Lin’s concordance correlation coefficient.
AuthorWearable DeviceExercise ModalityReliability/Validity Measure
Montes et al. (2015)Hexoskin Smart Shirt (reliability)Hiking (Average Heart Rate)ICC = 0.73
Montes et al. (2015)Hexoskin Smart Shirt (reliability)Hiking (Maximal Heart Rate)ICC = 0.68
Navalta et al. (2020)Garmin Fenix 5Trail RunningMAPE = 13.5%, MAE = 20.8 bpm, CCC = 0.316, ICC = 0.415
Navalta et al. (2020)Jabra Elite SportTrail RunningMAPE = 21.3%, MAE = 30.0 bpm, CCC = 0.384, ICC = 0.395
Navalta et al. (2020)Motiv RingTrail RunningMAPE = 15.9%, MAE = 25.1 bpm, CCC = 0.293, ICC = 0.287
Navalta et al. (2020)Scosche Rhythm+Trail RunningMAPE = 5.6%, MAE = 7.3 bpm, CCC = 0.780, ICC = 0.120
Navalta et al. (2020)Suunto Spartan Sport w/HRMTrail RunningMAPE = 1.9%, MAE = 2.9 bpm, CCC = 0.955, ICC = 0.955
Tanner et al. (2016)Hexoskin Smart ShirtTrail Runningr = −0.012 to 0.354
Xie et al. (2018)Samsung Gear S3Running, Walking, CyclingMAPE = 4%
Xie et al. (2018)Apple Watch 2Running, Walking, CyclingMAPE = 7%
Xie et al. (2018)Fitbit SurgeRunning, Walking, CyclingMAPE = 8%
Xie et al. (2018)Xiaomi Mi Band 2Running, Walking, CyclingMAPE = 12%
Table 5. Validity of wearable devices in an outdoor setting, evaluating various physiological measures.
AuthorPhysiological VariableWearable DeviceExercise ModalityValidity Measure
Carrier et al. (2020)VO2maxGarmin fenix 3 HRRunningMAPE = 8.05%, r = 0.917
Parak et al. (2017)VO2maxPulseOnRunning−1.07+2.75, MAE = 2.39, MAPE = 5.2%, r = 0.86
Tanner et al. (2016)Ventilation RateHexoskinTrail Runningr = 0.678 to 0.937
Tanner et al. (2016)Minute VentilationHexoskinTrail Runningr = −0.020 to 0.146
Table 6. Cochrane Risk of Bias Assessment tool output used to assess the quality and the risk of bias of all studies included in this review.
Author (Year)Randomization ProcessDeviations from Intended InterventionsMissing Outcome DataMeasurement of the OutcomeSelection of the Reported ResultOverall Technologies 08 00070 i001 Low risk
Technologies 08 00070 i002 Some concerns
Technologies 08 00070 i003 High risk
Zanetti et al. 2014 Technologies 08 00070 i002 Technologies 08 00070 i001 Technologies 08 00070 i001 Technologies 08 00070 i002 Technologies 08 00070 i001 Technologies 08 00070 i004
Montes et al. 2015 Technologies 08 00070 i002 Technologies 08 00070 i001 Technologies 08 00070 i001 Technologies 08 00070 i002 Technologies 08 00070 i001 Technologies 08 00070 i004
Tanner et al. 2016 Technologies 08 00070 i002 Technologies 08 00070 i001 Technologies 08 00070 i001 Technologies 08 00070 i002 Technologies 08 00070 i001 Technologies 08 00070 i004
Parak et al. 2017 Technologies 08 00070 i002 Technologies 08 00070 i001 Technologies 08 00070 i001 Technologies 08 00070 i002 Technologies 08 00070 i001 Technologies 08 00070 i004
Adamakis 2017 Technologies 08 00070 i002 Technologies 08 00070 i001 Technologies 08 00070 i001 Technologies 08 00070 i003 Technologies 08 00070 i001 Technologies 08 00070 i003
Whal et al. 2017 Technologies 08 00070 i002 Technologies 08 00070 i001 Technologies 08 00070 i001 Technologies 08 00070 i002 Technologies 08 00070 i001 Technologies 08 00070 i004
Xie et al. 2018 Technologies 08 00070 i002 Technologies 08 00070 i001 Technologies 08 00070 i001 Technologies 08 00070 i002 Technologies 08 00070 i001 Technologies 08 00070 i004
Carrier et al. 2020 Technologies 08 00070 i002 Technologies 08 00070 i001 Technologies 08 00070 i001 Technologies 08 00070 i002 Technologies 08 00070 i001 Technologies 08 00070 i004
Navalta et al. 2020 Technologies 08 00070 i002 Technologies 08 00070 i001 Technologies 08 00070 i001 Technologies 08 00070 i002 Technologies 08 00070 i001 Technologies 08 00070 i004
Publisher’s Note: MDPI stays neutral with regard to jurisdictional claims in published maps and institutional affiliations.

