1. Introduction
Customer Experience (CX), since its introduction as a concept [
1,
2,
3,
4], has evolved as a key differentiation strategy element across industries, especially in mature markets with low product differentiation opportunities. Traditional sectors like banks, retail stores, hotels, telecom operators as well as modern digital world corporations recognize the role of CX as part of their commercial success. CX is closely related to customer loyalty management and is measured using survey-based metrics aiming to capture the overall customer satisfaction, purchase or recommendation intention [
1]. As more and more companies are adopting CX excellence strategies, customers receive a higher quality of experience, which further raises the bar of CX competition. In such a competitive environment, CX analytics is a topic that attracts the attention of the industry, especially focusing on methods that lead to actionable insights.
The cornerstone of a CX strategy implementation program is the metric used to measure the performance of both the company and its market competitors. The Net Promoter Score (NPS) [
5] is a metric that, according to some studies, is associated with customer loyalty [
5,
6] and is widely used across industries as confirmed by CX professionals, without missing some objections on this metric as is described in
Section 2. The NPS is measured through regular market research surveys, which are conducted at a frequency ranging from monthly to an annual basis. In such a survey, NPS is derived based on a question in which customers are asked to rate the likelihood of recommending the company’s products and/or services to their friends or colleagues. Apart from the NPS question, such a survey also includes questions related to the customer satisfaction score on experience attributes, i.e., key areas of the interaction between the customer and the company that may influence the NPS (e.g., product attributes, like tariff plan, service quality, billing and touchpoint experiences, such as website, call center, mobile app). Moreover, the common practice in CX surveys is to include responses from a sample of customers related to all competing companies in the market, thus giving crucial information about the company’s position against competition.
The results obtained from the NPS surveys allow primarily for the monitoring of the NPS and CX attribute satisfaction score trends for all market players. Such an analysis reveals areas of strong and weak performance, which trigger companies to take corrective actions. These actions are included in the plan of the CX program of a company and refer to operational improvements (e.g., reduce the waiting time in the call center, or the response time of the company webpage), “customer journey” redesign (i.e., design of the interaction steps between the customer and the company like bill payment via the mobile app), or innovation (e.g., push customers to fully digitalized transactions). These actions require certain company investment and for that reason, it is of prime importance for companies to rank the role of CX attributes in driving the overall NPS.
The problem of CX attribute prioritization is addressed by the so-called NPS key drivers’ analysis, which aims at revealing the association between NPS and the experience attribute satisfaction scores [
7]. Apparently, NPS drivers’ analysis can be further extended by taking into account sector or company specific factors (e.g., geographical location, customer demographics, macroeconomic factors) or experience attribute specific performance measures (e.g., the call center waiting time, website abandoned transactions). For example, telecommunication operators also consider NPS analysis for their services, exploiting the framework of Quality of Experience (QoE) Key Performance Indicators (KPIs) in order to identify specific service attributes that need to be improved so as to sustain user engagement [
8].
Despite the increased interest in the topic, the NPS key drivers’ analysis still faces several challenges. According to the related literature, that linear regression for customer satisfaction drivers’ analysis is characterized by an
R-square in the order of 0.4–0.6 [
9,
10,
11]. Moreover, according to the results of one of our earliest previous work [
12] on NPS survey data, an accuracy metric in the order of 50–60% is achieved based on both multiple linear and logistic regression. This finding indicates that either the applied regression models do not capture the way that CX attributes contribute to the overall NPS KPI or that NPS KPI does not only depend on the CX attributes but also on unidentified factors, which could be perception or emotion related attributes. The novelty of the current paper is that it utilizes a classification method and a variety of widely used machine learning (ML) algorithms to investigate their ability to capture the relation between the CX attributes and the NPS KPI.
2. Related Work and Paper Contribution
2.1. Works on Net Promoter Score-NPS
The issue of NPS key drivers’ analysis, described in the introduction, is addressed using primarily statistical regression, for example, Multiple Linear Regression. However, the NPS key drivers’ analysis is a classification problem, since both the NPS and the CX attribute satisfaction scores are categorical parameters (i.e., integers between 0 and 10 that the surveyed customers provide). For that reason, logistic regression and, in particular, Ordered Logit, is considered to be a more appropriate model for NPS drivers’ analysis [
7,
13,
14,
15]. There is a number of issues related to these regression models, including the limited accuracy, the collinearity occurring between attributes, the need to handle missing values (e.g., responders may not provide scores for all attributes leading to a high percentage of partially filled data records), the counter-intuitive negative coefficients that may occur, etc. It should be noted that the accuracy of key driver analysis may affect the ability of a company to take CX related decisions. In particular, companies use key drivers’ analysis so as to decide on how to allocate its investment in specific CX attributes so as to maximize the impact on NPS. Moreover, key driver analysis is also used as a tool for what-if analysis so as to assess the impact of a change in CX attribute satisfaction to the overall company NPS. This is an essential step in the process that companies follow so as to assess the impact of CX projects and decide on their prioritization.
One of the methods used to mitigate the low statistical fit issue is the application of Grouped Regression. According to this approach, it is investigated whether there are subgroups of customers characterized by a common NPS scoring process [
13]. For that reason, different regression models are developed for each defined group aiming at achieving a deeper understanding of the NPS drivers. Two different approaches may be followed for the definition of the subgroups; (i) customer classification (e.g., as defined in the next section: promoters, passives, detractors) or (ii) following some unsupervised method of classification, where customers are divided into subgroups based on statistical criteria [
7,
14]. However, it appears that this approach does not resolve the issue of limited accuracy. Moreover, one of the possible drawbacks of this method is that a high number of subgroups may cause regression over-fitting due to the reduced number of samples per subgroup and in practice to results of limited statistical value.
Another practice that has been adopted is to include in the survey the option of free comments from the responders, allowing for the application of advanced sentiment analytics and including machine learning techniques [
16]. However, in this case, only a portion of the responders provide comments. Furthermore, it is not certain whether a short comment covers the entire range of experience of the issues of a responder or is limited to a recent event as a highlight. Very recently, machine learning methods have been employed to estimate customers’ experience in specific types of applications. For instance, in [
17], the experience gained in a shopping mall is described, while [
18,
19], examine and automated customer issue resolution method for cellular communication networks. Finally, in [
12], a novel classification method for customer experience survey analysis is proposed.
2.2. Limitations of NPS
The main advantage of the Net Promoter Score (NPS) is that it is a single customer metric to measure customers’ loyalty. However, many researchers object that NPS is the “single most reliable indicator of a company’s ability to grow.” In particular, Keiningham et al. [
20] reject this argument since single metrics alone cannot predict customer loyalty and consequently are unlikely to deliver actions to managers. In addition, the work of [
21] doubts the efficiency of the NPS, based on a practitioner’s perspective and principles of social science and marketing methodology, as an efficient approach to customer loyalty because recommendations alone are unable to drive business success. For example, customers could give high NPS scores (promoters), but a firm could lose a percentage of its customer base. This is also verified in [
22] where a detailed description of potential negative implications of the NPS on customer experience can be proved based on real-world data. This work employs a big data approach to assessing and predicting customer loyalty in a B2B context.
These limitations are taken into account in our research by modifying the NPS proposing a bias index to improve customers’ loyalty description. The proposed NPS bias seems to improve the results compared to using the conventional NPS score. In addition, we apply novel machine learning algorithms, including deep learning tools, to intelligently analyze these data so as to improve customer experience and the results obtained. This is the main innovation of this work, i.e., the application of novel machine learning algorithms along with the introduction of bias dimension to the NPS index.
2.3. Our Contribution
In this paper, we address the problem of NPS key drivers’ analysis in a two-step approach. In the first step, a customer classification method is employed, which offers an insight into the NPS scoring process. The novel classification, called “NPS bias”, proved to be quite efficient and significantly improved the statistical performance based on logistic regression (accuracy 70–85%, F1-score > 70%). The efficiency of the method was verified using data from multiple NPS survey samples from the telecommunications market. These results indicate that the proposed method improves the performance of the NPS key drivers’ analysis, which in turn could increase the reliability of the associated company decisions.
In the second step, widely used supervised ML algorithms are employed for the classification process [
23,
24,
25]. For example, neural network-based classifiers schemes can be applied to categorize the data [
26] exploiting highly non-linear schemes. An interesting idea in this case is the ability of the network to automatically adapt its performance to the user needs using a retrainable structure [
27] and its application to user profile modeling [
28]. Other schemes apply on-line learning processes for estimating user’s profile [
29], including on-line spectral clustering schemes [
30,
31]. Another interesting concept is the use of the Successive Geometric Transformations Model (SGTM) like neural structures [
32]. This, in fact, is a new method for solving the multiple linear regression task via a linear polynomial as a constructive formula. This linear non-iterative computational intelligence tool is used for identification of polynomial coefficients [
33]. Applications of these models to medical insurance has been applied [
34]. One of the problems in building reliable machine learning algorithms for NPS drivers’ analysis is the limited number of available samples, since NPS surveys are performed in the best case scenario on a monthly basis, while in some cases only annual surveys are conducted on a rather limited sample of customers. To handle the classification challenge, the results of the first step are being exploited so as to build a generator of realistic survey data. This approach allows for the development of training data for the machine learning algorithms covering a wide range of realistic scenarios. Finally, the performance of the ML algorithms is presented for both the original NPS key drivers’ analysis problem and the proposed “NPS bias” classification problem.
The paper is organized as follows:
Section 3 provides an overview of the NPS methodology.
Section 4 provides the first step of the NPS key drivers’ analysis based on the proposed customer classification based on “NPS bias”.
Section 5 provides the relevant analysis based on machine learning classification methods [
24,
35].
Section 7 provides a thorough overall analysis of the results of the proposed method. Finally,
Section 8 provides the conclusions and the future research steps.
3. Net Promoter Score Survey
As mentioned in the introduction, NPS is widely accepted as one of the most commonly used CX measurement framework across industries. The methodology requires regular customer surveys (also called Voice of the Customer) based on a questionnaire addressing the following:
NPS question [
5]: “How likely are you to recommend [company x] to your friends or colleagues?” The response is provided in the range of 0 (definitely no) to 10 (definitely yes).
Satisfaction scores (from 0 or 1 to 10) for a set of CX attributes like product experience (service quality, network coverage, tariff plan, billing, etc.), Touchpoint experience (e.g., call center, website, mobile app, shops), customer lifecycle milestones (e.g., contract renewal), etc. Some surveys also include brand image related attributes (e.g., trust, innovation)
Apparently, a responder, depending on his/her experience, may not answer a question (e.g., a responder does not visit shops or does not experience a service like roaming in mobile telecoms). In this context, an NPS survey will include partially filled responses.
NPS methodology then considers three groups of survey responders depending on the range of their Net Promoter Score (see
Table 1). This classification is supported by studies [
5] indicating that Promoters are more loyal and more likely to purchase products and services vs. Detractors.
The NPS KPI of a company can then be defined as the difference between the percentage of promoters and detractors in the relevant survey:
where,
,
and
are the number of promoters, detractors and the total number of survey responders, respectively. Based on the above definition, the NPS KPI for a company may range from −100 (every customer is a detractor) to +100 (every customer is a promoter).
NPS Survey Analysis
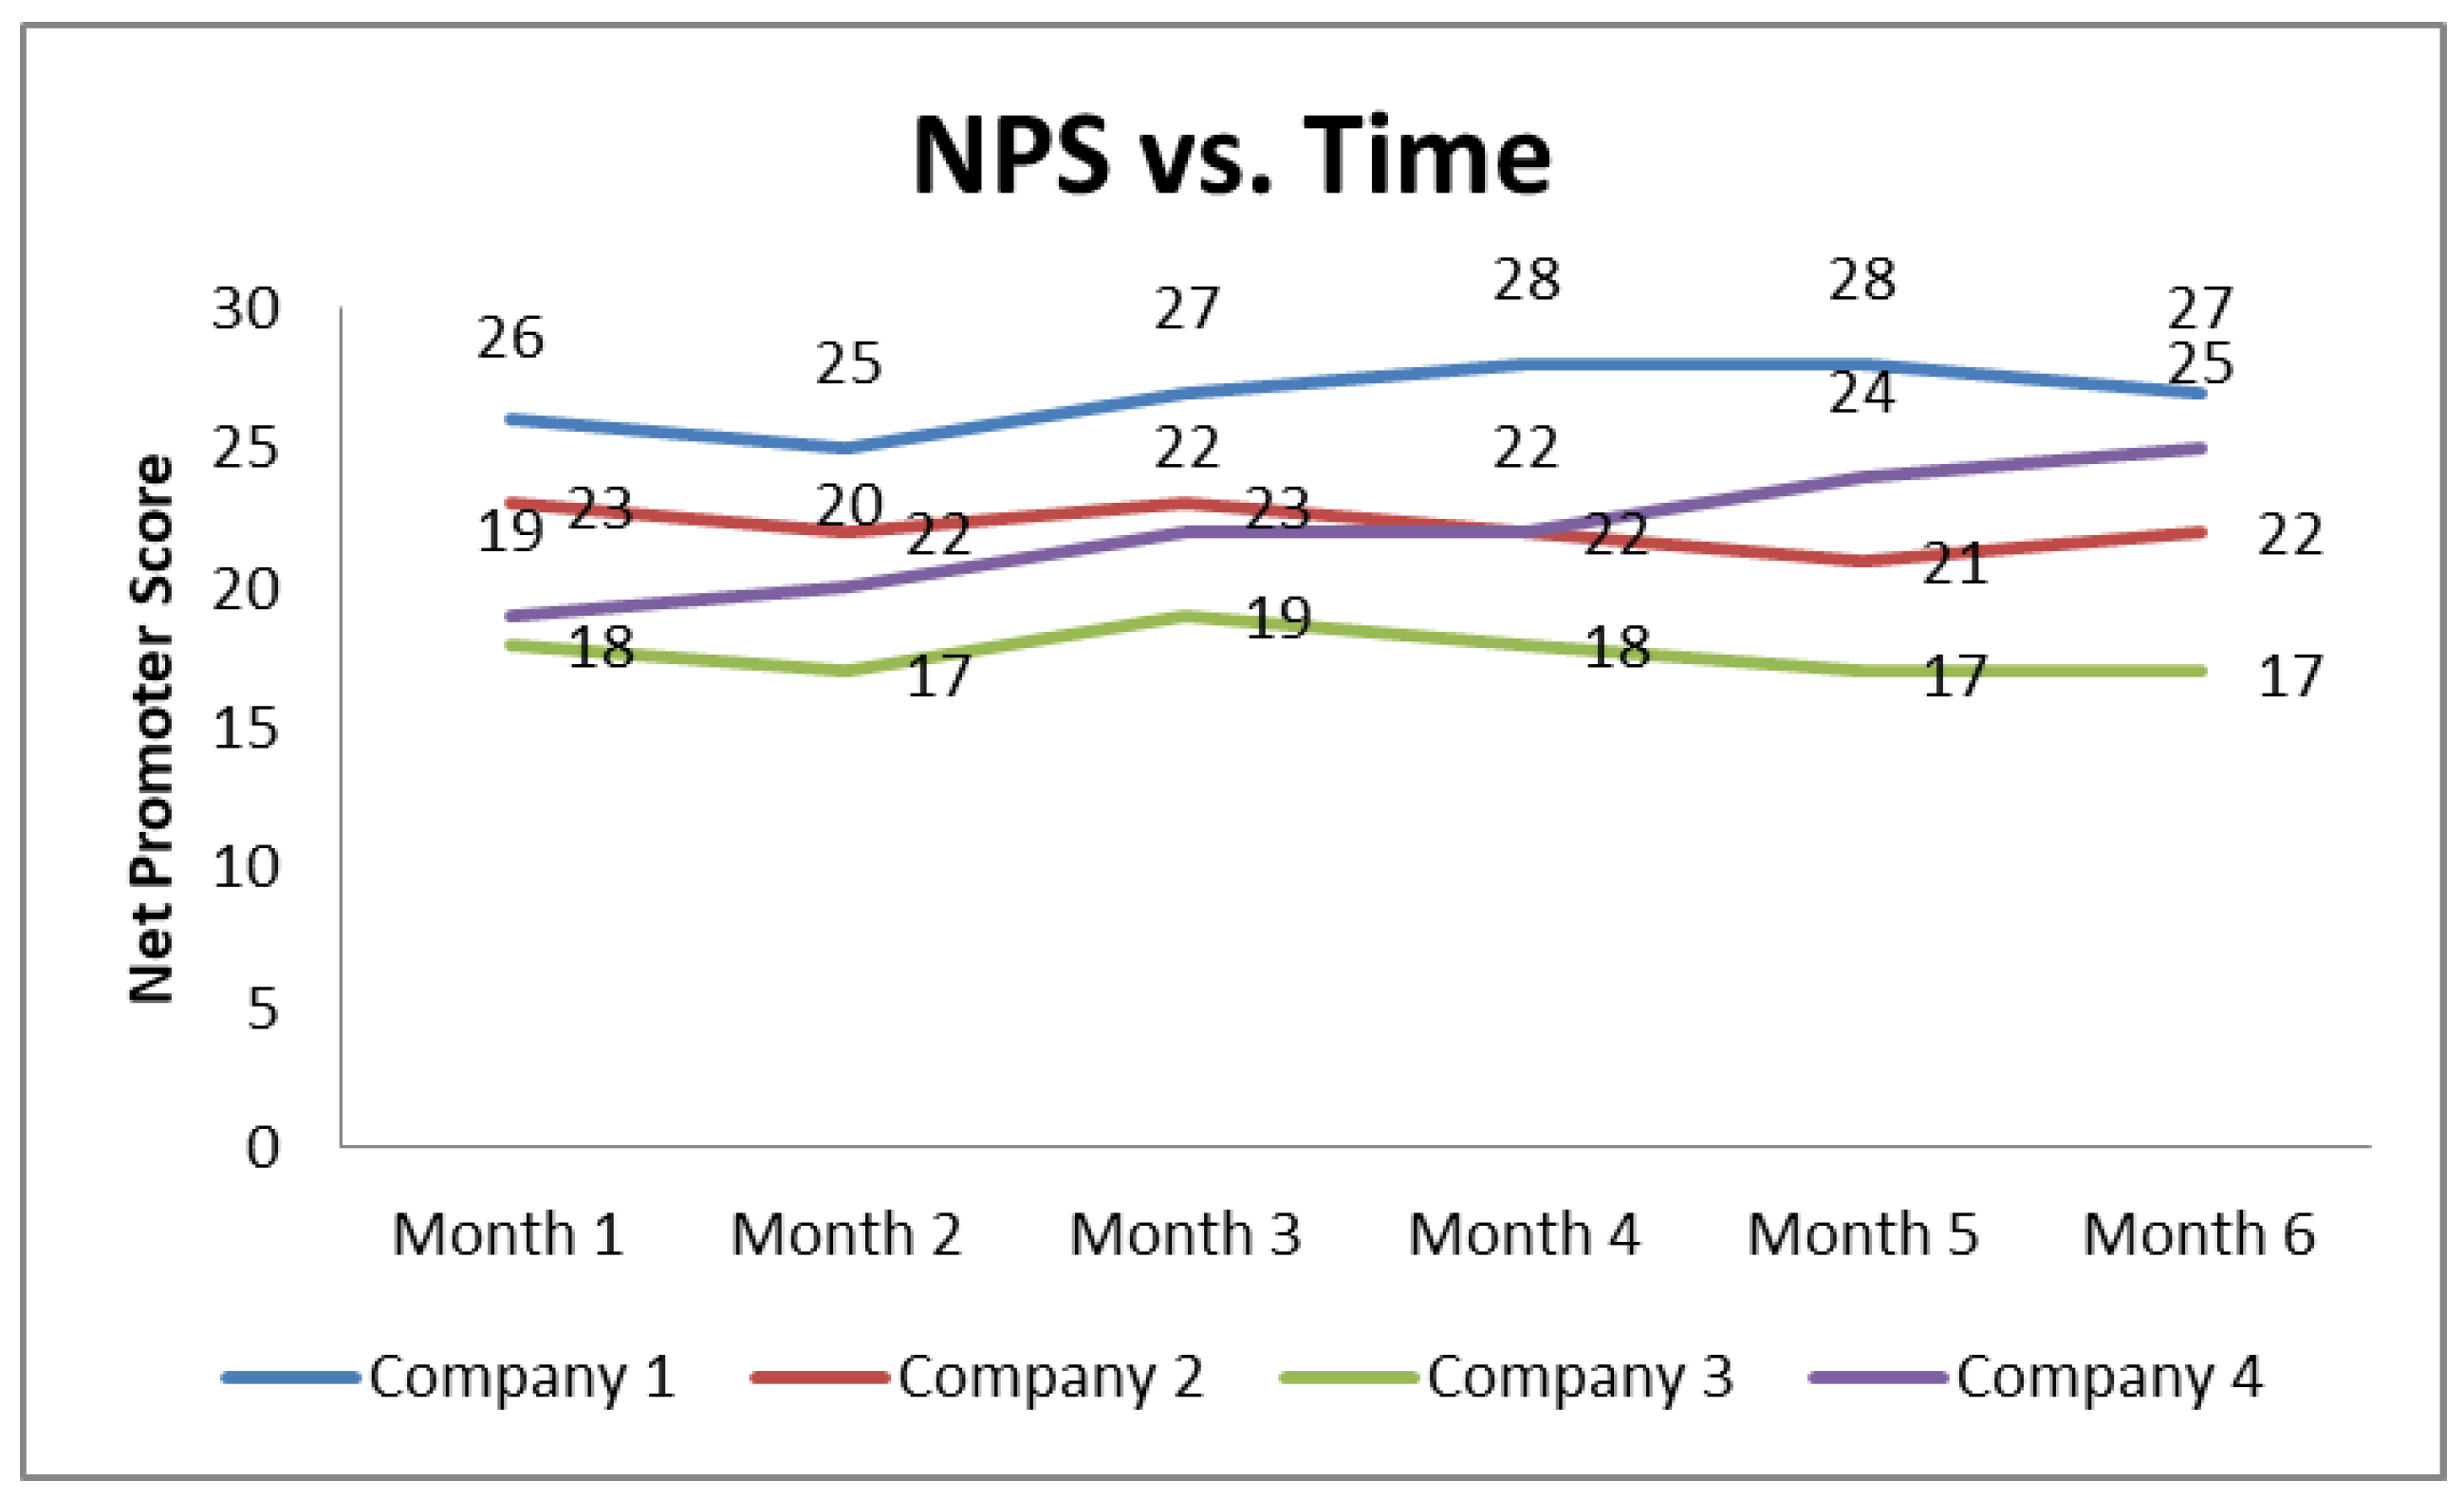
The primary NPS survey analysis refers to the comparison of the NPS trends (see
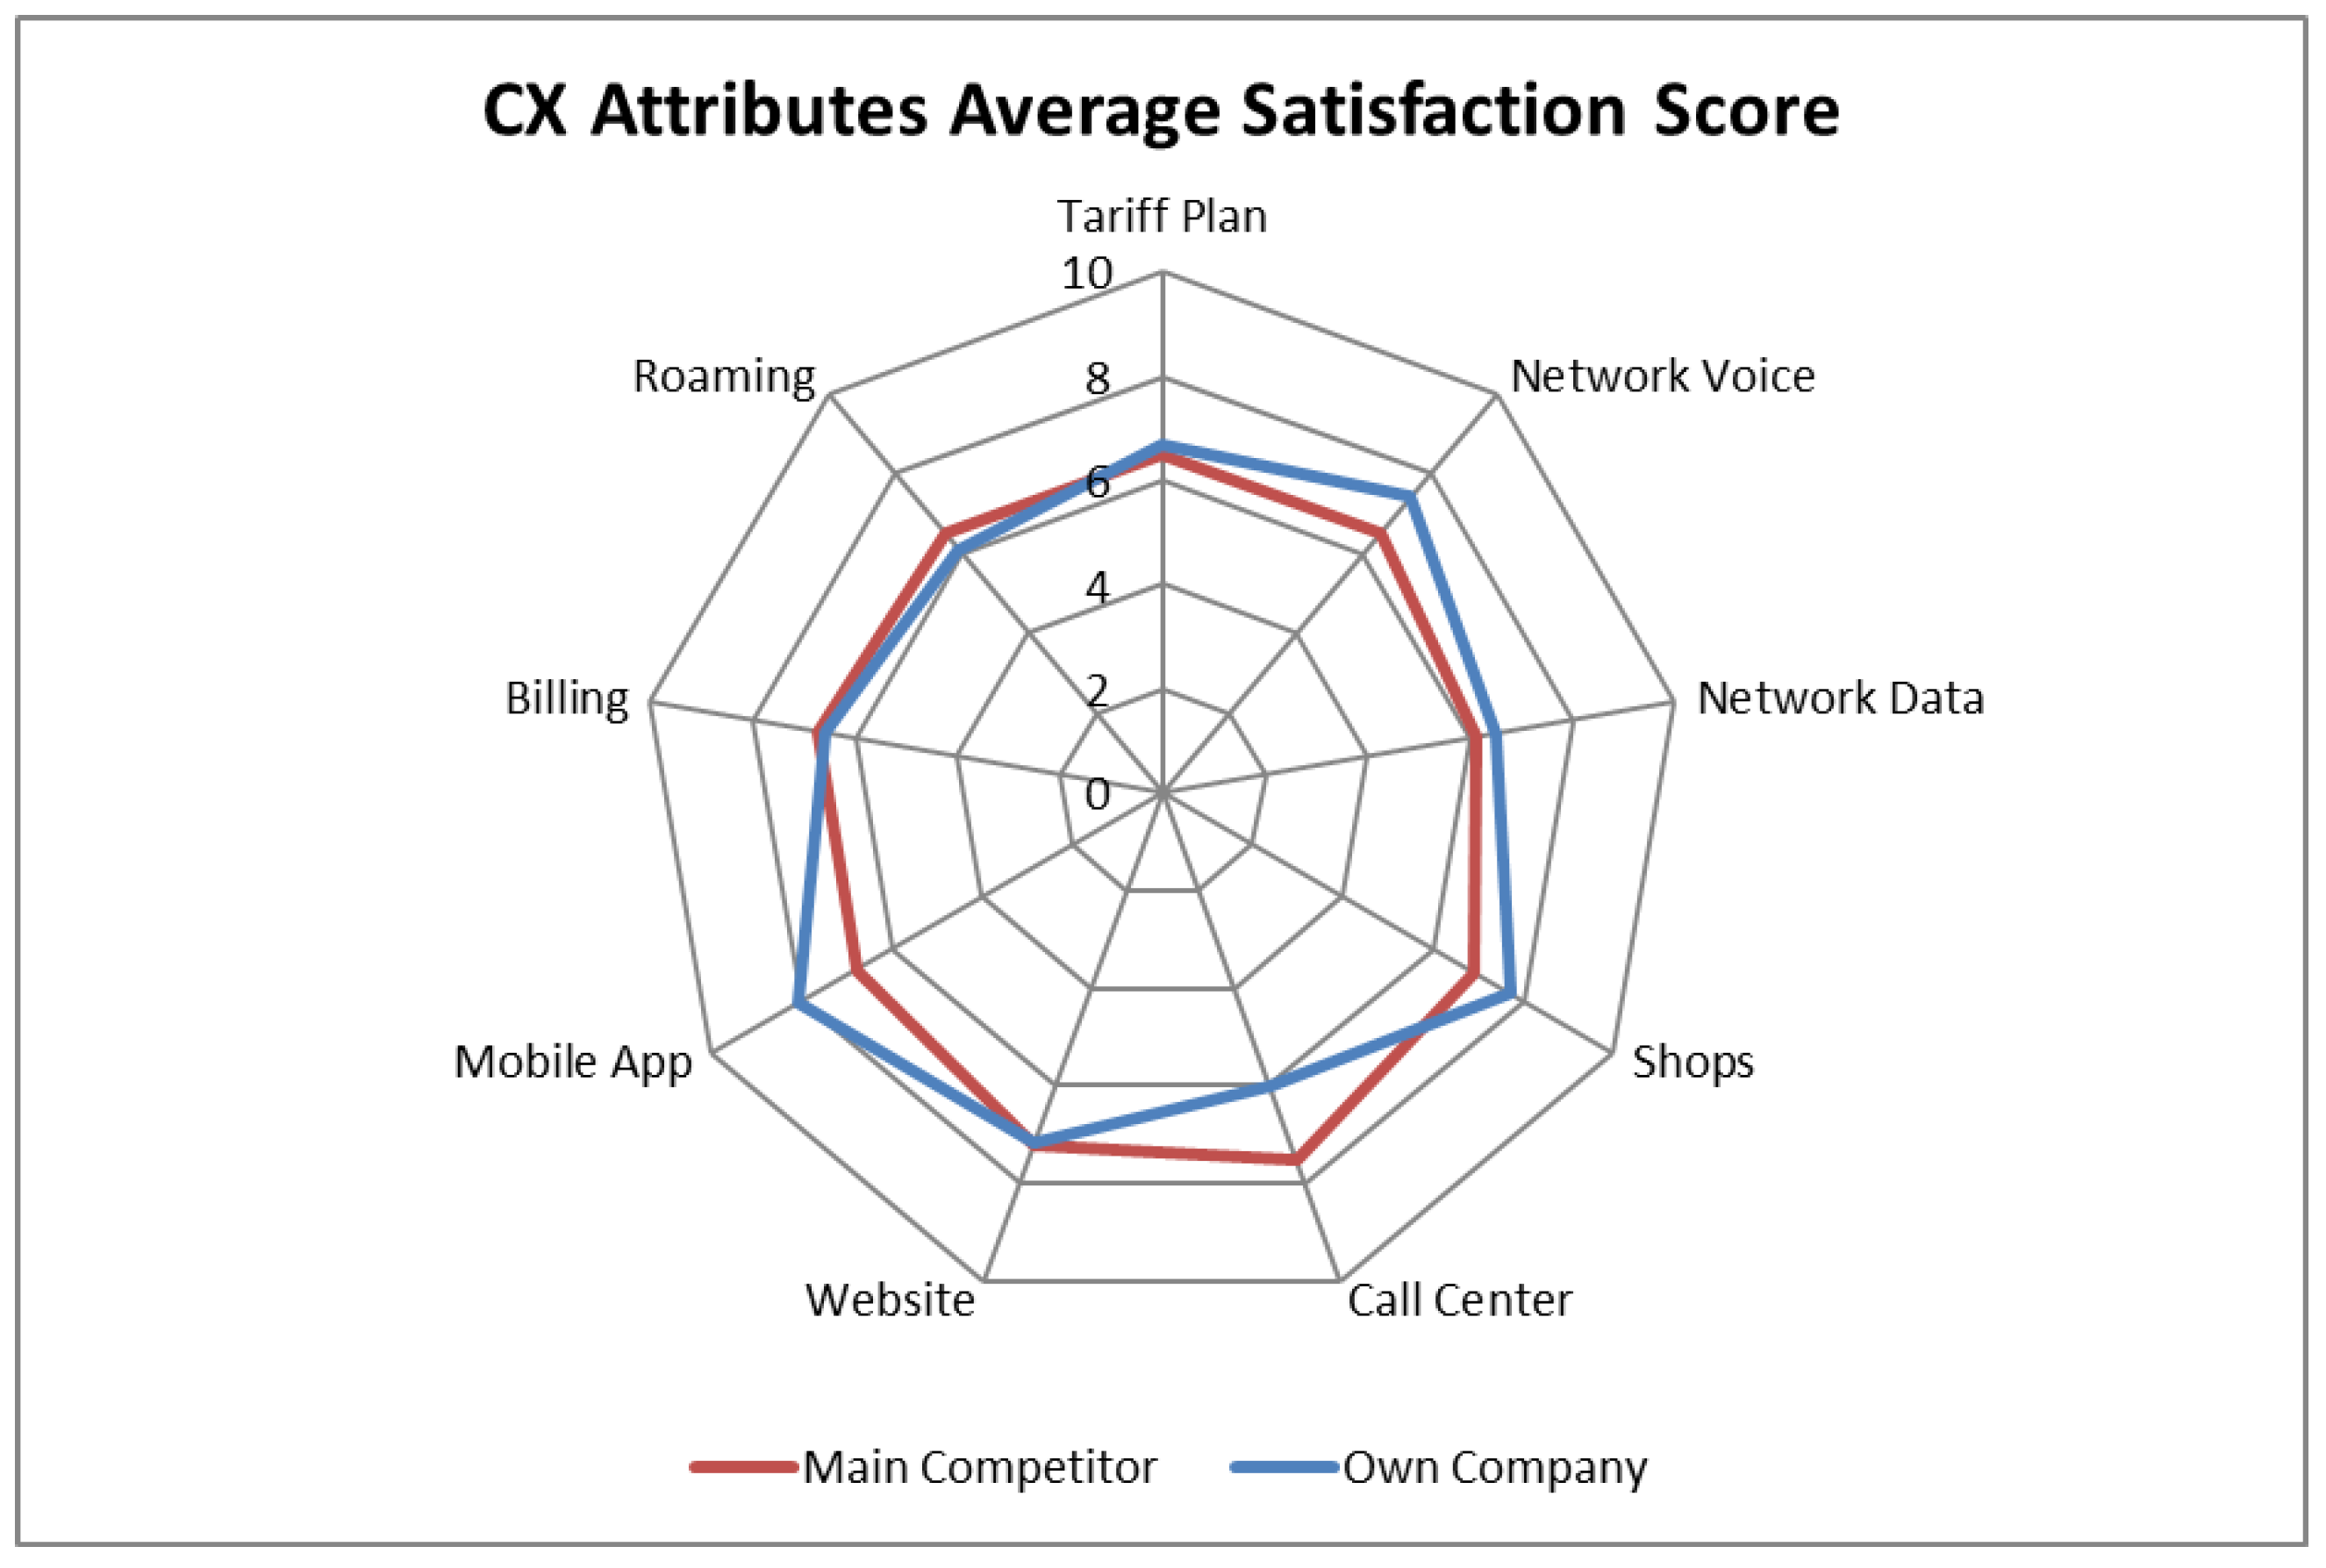
Figure 1) and the satisfaction score performance compared to the competition (see
Figure 2).
Figure 1 and
Figure 2 present indicative results from a set of real NPS survey data processing from the Greek telecommunication market (for confidentiality purposes, random bias has been applied to the actual data). In the example of
Figure 1, it appears that company 1 is the market leader, company 4 follows a CX improvement strategy while companies 2 and 3 probably focus on maintaining their NPS levels.
Figure 2 presents the CX attributes’ performance for companies 1 and 2 where it is evident that company 1 is exceeding company 2 in the performance of key attributes like Network Coverage and Network Data while company 2 has some strong areas like call center and roaming. As it can be seen such an analysis allows for a clear understanding of the competitive position of a company in the area of CX and monitoring of the relevant trends. The next question that a company has to answer is, which attributes have the highest improvement priority, and which will assist the company to adopt the optimal strategy in order to maximize the NPS? This problem is addressed by the NPS key drivers’ analysis.
The NPS key drivers’ analysis is typically based on statistical regression models [
6,
7,
36,
37,
38,
39] applied to the relevant customer survey data. Such models consider NPS as the dependent variable and the customer satisfaction scores on the CX attributes as the independent variables.
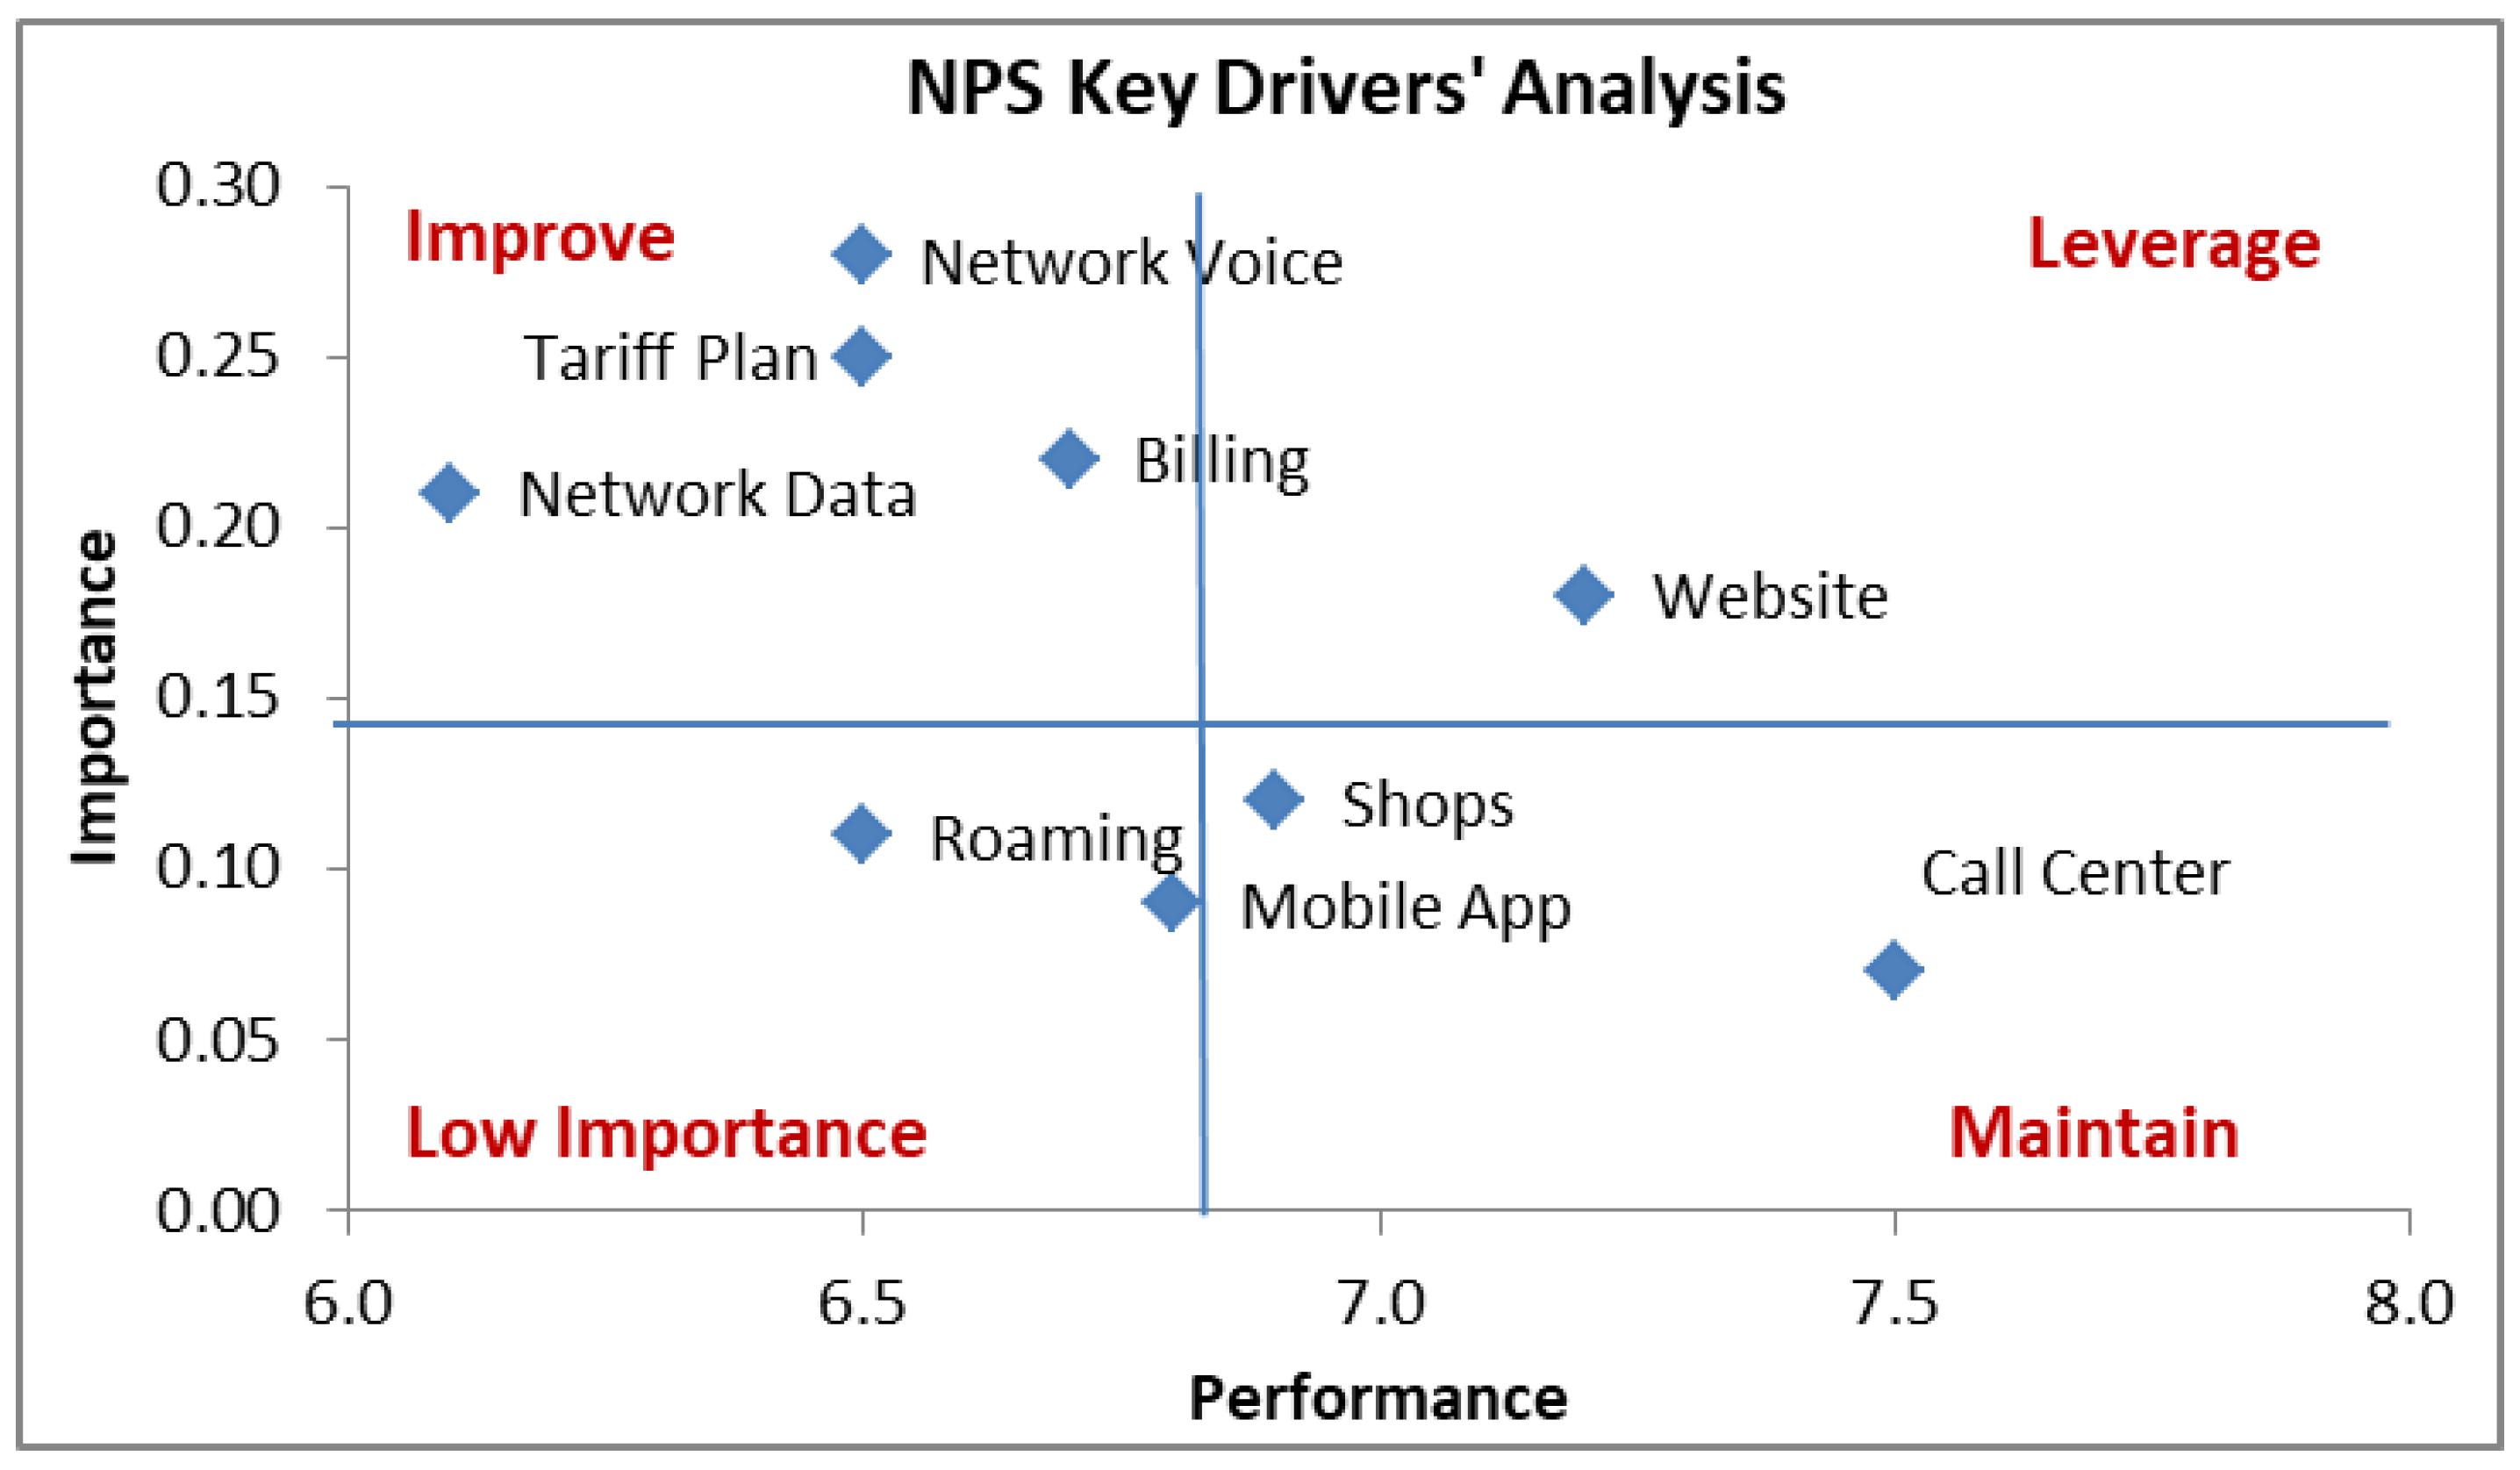
Figure 3 provides an example presentation of the resulting NPS key drivers’ analysis where x-axis “Performance” corresponds to the average satisfaction score of each attribute and y-axis “Importance” corresponds to the regression model coefficient of each attribute or depending on the approach followed an appropriate importance indicator (e.g., Shapley value method [
40]). The representation of
Figure 3 is commonly used for business decision making [
41,
42,
43,
44,
45]. As it can be seen from the example of
Figure 3 it is feasible for a company to decide on the type of action to follow for each CX attribute depending on the quadrant it belongs to: (a) improve, (b) leverage (i.e., exploit as a competitive advantage), (c) maintain or (d) not important for action (monitor). In the example of
Figure 3 it is evident that the attributes that require improvement for the specific company refer to: network voice, network data, tariff and billing.
As mentioned in the related work overview, a wide variety of regression models have been considered for NPS key drivers’ analysis. However, most regression models exhibit a limited statistical accuracy (e.g., Accuracy in the order of 50–60% and F1-score in the order of 55–70%, as shown by indicative results in
Section 4).
This fact has triggered the research presented in this paper, as the key challenge related to the low statistical accuracy of the regression models may be attributed either to limitation of the modeling approach or to the fact that there are additional attributes not included in the surveys that explain the way customers provide their NPS score.
4. NPS Bias Classification
According to the related literature [
12], a common method to address the issue of low NPS drivers’ statistical fit is to consider subgroups of responders with common scoring patterns. This concept of customer classification into subgroups is investigated in the current paper through the definition of a new metric called “NPS bias”, which is defined for each responder of the NPS survey as follows:
where,
the NPS of responder
k,
, the mean value of the responder satisfaction score for all CX attributes. Note that the above definition also applies for partially filled survey responses and in this context, the classification can be performed without the prior use of missing data imputation methods.
Based on the above definition, customers are classified according to
Table 2.
The classification of NPS bias can be codified as a label (e.g., 1 for negatively and 2 for positively Biased customers). The scope of the analysis is to consider this label as an additional independent parameter in the NPS classification problem aiming at the improvement of the regression model accuracy. Since the definition of NPS bias requires the knowledge of NPS per responder, the classification aims primarily on improving descriptive NPS analytics. NPS key driver analysis belongs to this category of problems, i.e., given the knowledge of NPS and the CX attributes, the problem aims at the identification of the NPS drivers.
4.1. Datasets Available for NPS Bias Analysis
To analyze the NPS Bias classification, a set of data from NPS surveys performed in the Greek mobile telecommunication market were exploited. The surveys were targeted to a postpay market segment and included 9 CX attributes: (i) Tariff Plan, (ii) Network Voice, (iii) Network Data, (iv) Billing, (v) Call Center, (vi) Shops, (vii) Website, (viii) Mobile App, (ix) Roaming. The available datasets refer to 24 consecutive monthly surveys with approximately 450 samples each. For confidentiality reasons, the surveys were fully blinded in terms of the attributes names and operators for which the results referred to, since the focus of the analysis is the algorithm performance rather than specific market performance.
It should be noted here that the relevant data were collected and processed in a fully anonymized manner and in full compliance with the relevant regulation framework for the protection of the private data and the associated ethics’ principles related to data processing [
46].
4.2. Distribution Analysis of the NPS Bias Catergories
The first topic investigated in this paper is whether NPS and NPS bias are independent parameters. To achieve this, the classification mix of each survey (see example
Table 3) was considered as a contingency matrix and the Chi-square test of independence was applied (see example
Table 4). The null hypothesis in this case is that the mix of promoters, passives, detractors vs. the relevant mix of positively, negatively biased customers is random. The Chi-square test in all cases indicated that the null hypothesis could be rejected (see example of
Table 4), clearly indicating that an NPS bias distribution pattern may represent a characteristic of NPS surveys.
4.3. Regression Analysis of the NPS Bias Classes
The second topic investigated in this paper was whether NPS Bias classes share a common NPS scoring process. To this end, separate regression models were developed for each customer subgroup. Without limiting the options of regression modeling that can be applied, logistic regression was used at this stage of our study.
Appendix A provides the confusion matrix and the metrics used to assess the model performance (accuracy, precision, recall and F1-score).
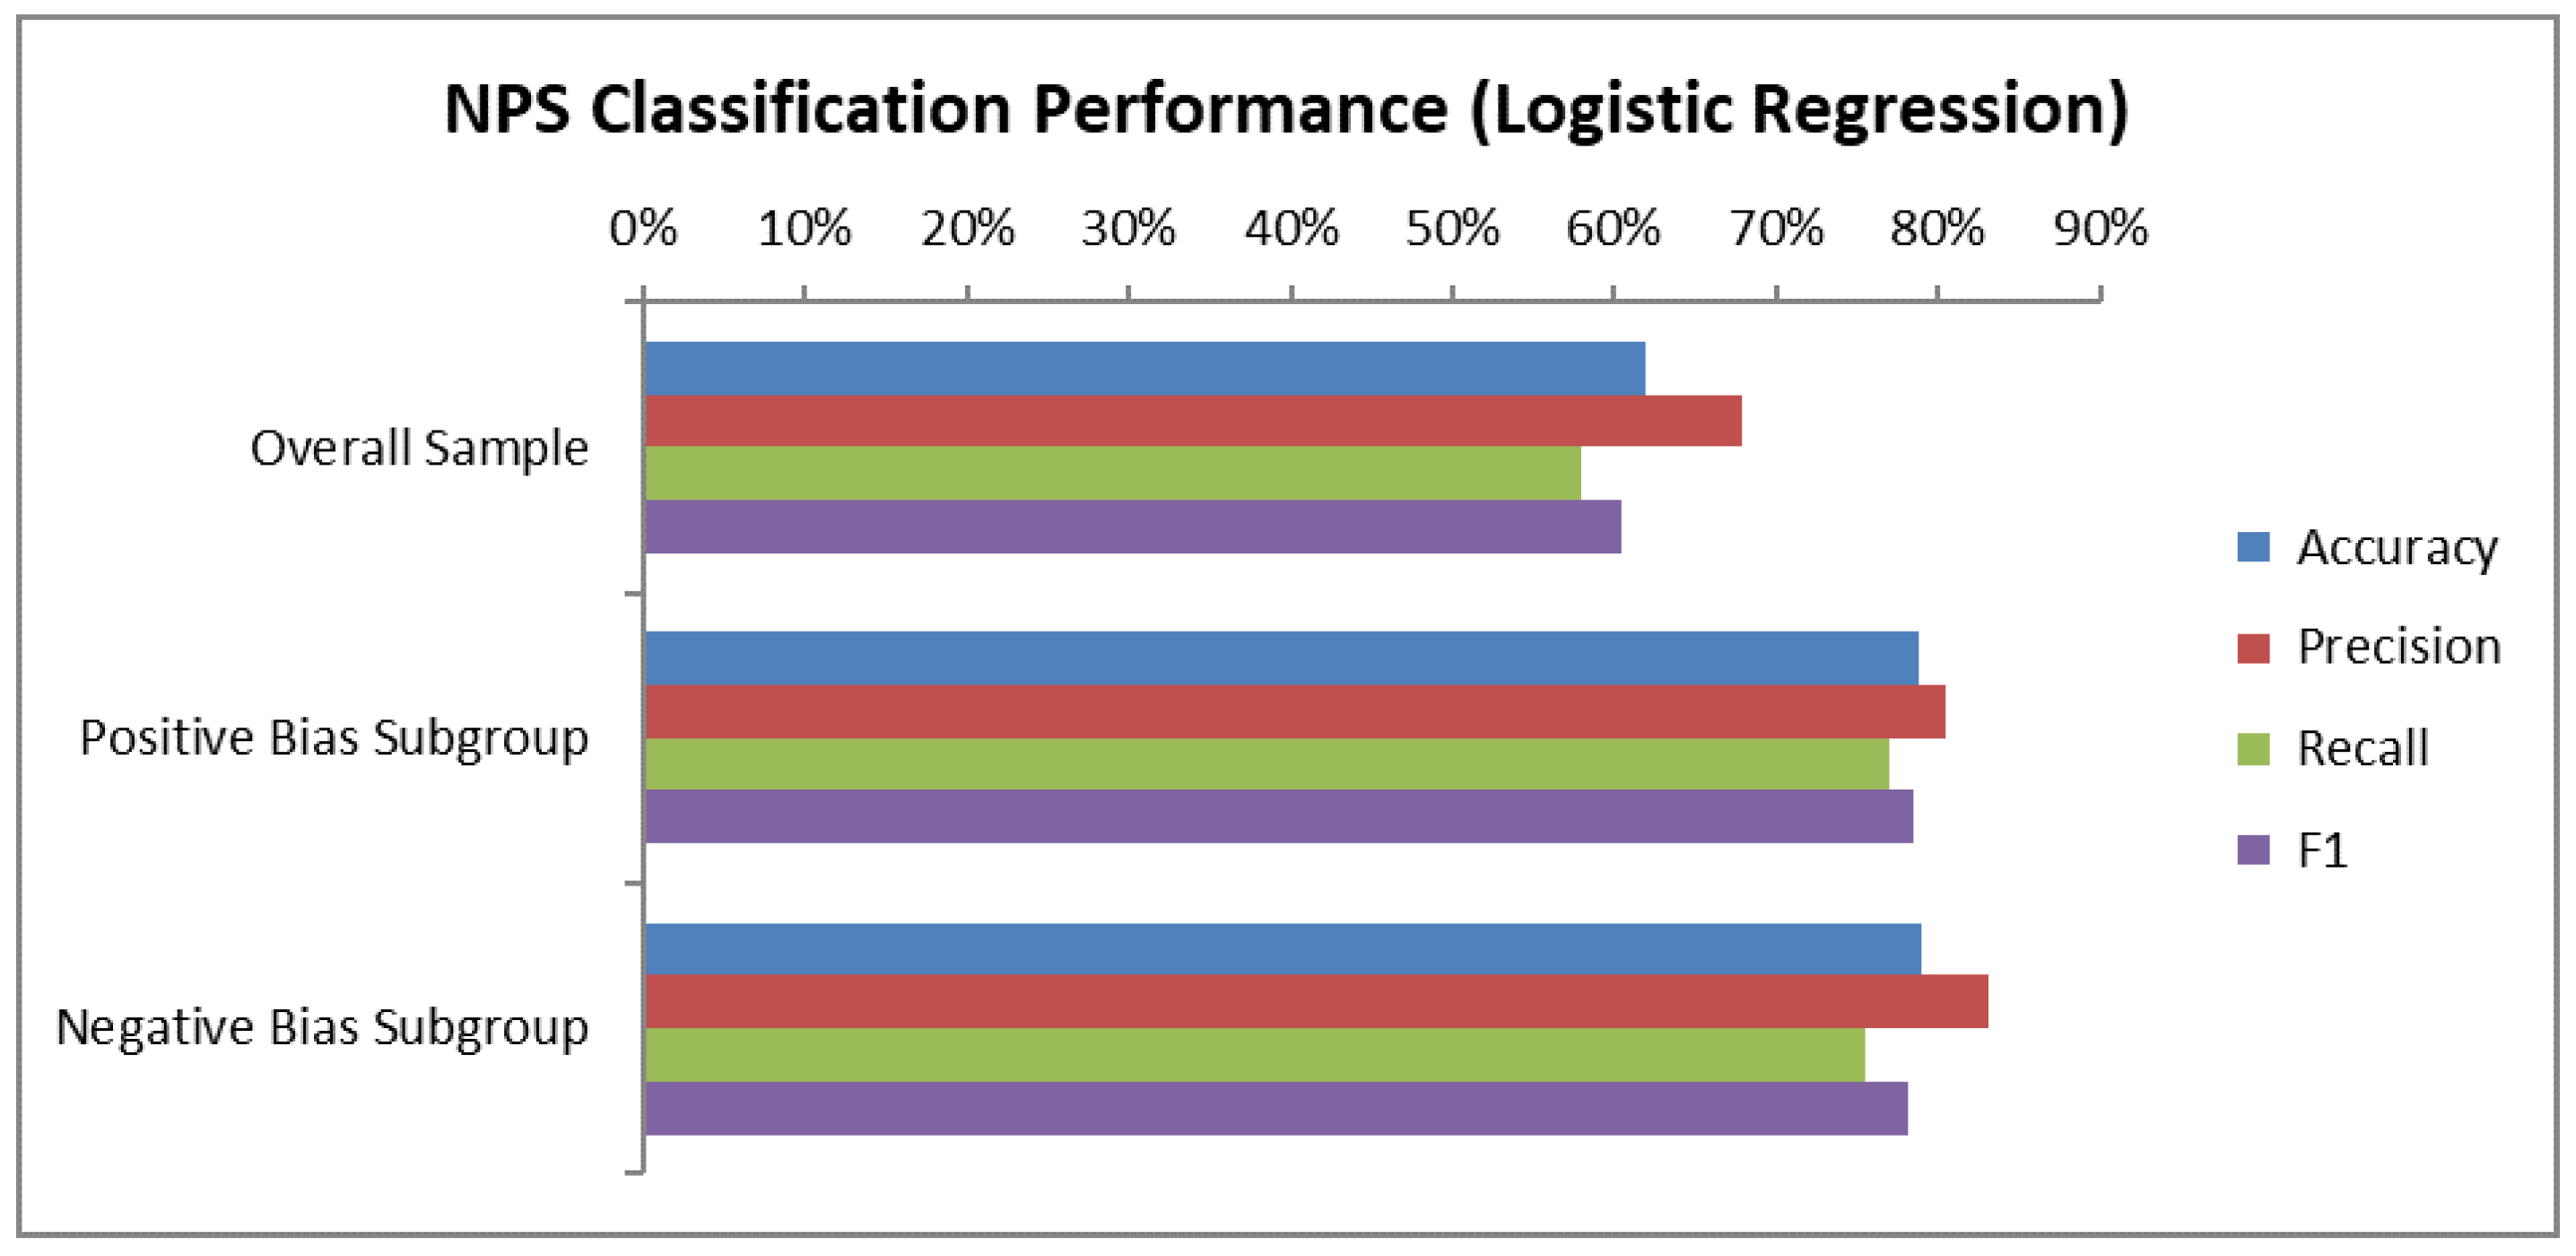
The results of this analysis are presented in
Figure 4 where the performance metrics (Accuracy and F1-score) are compared for the NPS analysis without the bias classification and the performance achieved for the subgroups defined based on NPS bias (i.e., positively and negatively biased). The presented results correspond to the average metric score achieved based on the 24 monthly NPS survey data samples. The Variance Inflation Factor (VIF) results indicated no significant issue of multicollinearity.
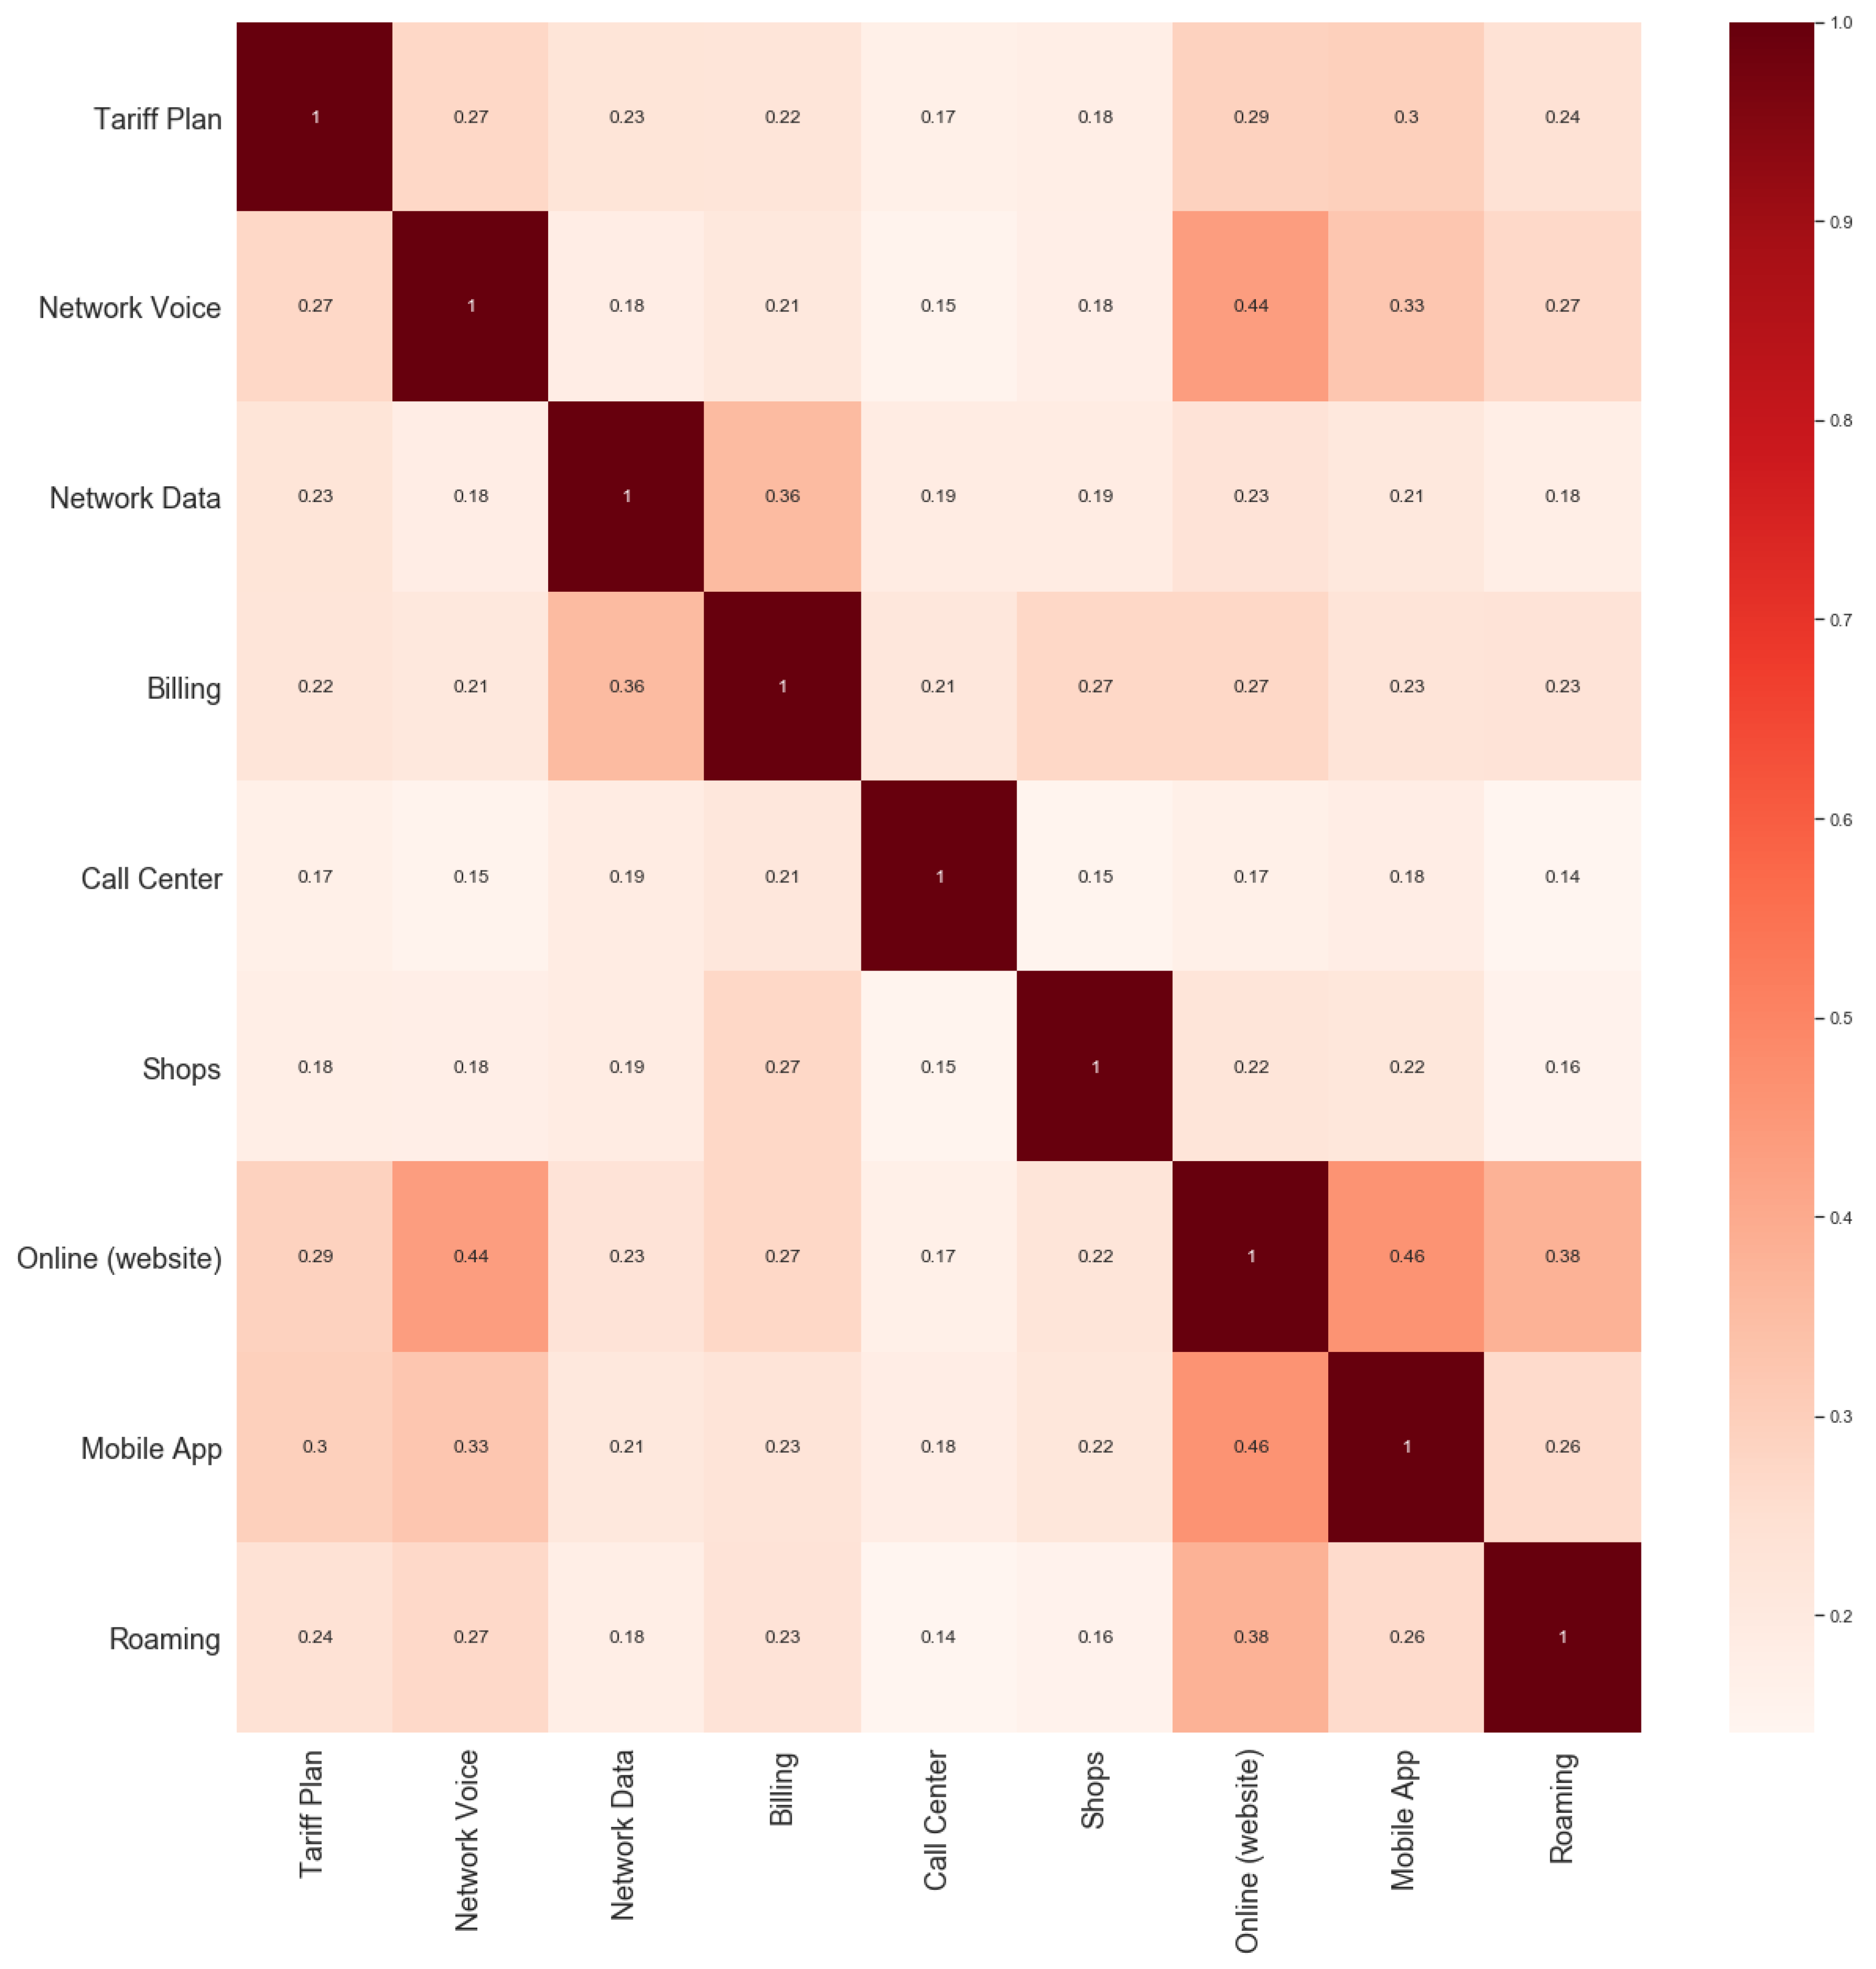
Figure 5 provides the correlation coefficients between the adopted attributes. Moreover, to ensure that the observed results are not an effect of overfitting, the analysis was performed in three-month rolling samples where 20% of the samples were reserved for cross-validation of the regression model.
As it can be observed in
Figure 4, positively and negatively biased subgroups exhibit Accuracy and F1-score in the range of 70–80%, substantially higher compared to the respective values for NPS analysis without bias classification (in the order of 60%).
The analysis confirms the fact that positively and negatively biased customers share, to a certain degree, a common NPS scoring process. This fact can be exploited to derive more accurate business insights, as shown in the following section.
4.4. NPS Drivers’ Analysis Based on NPS Bias
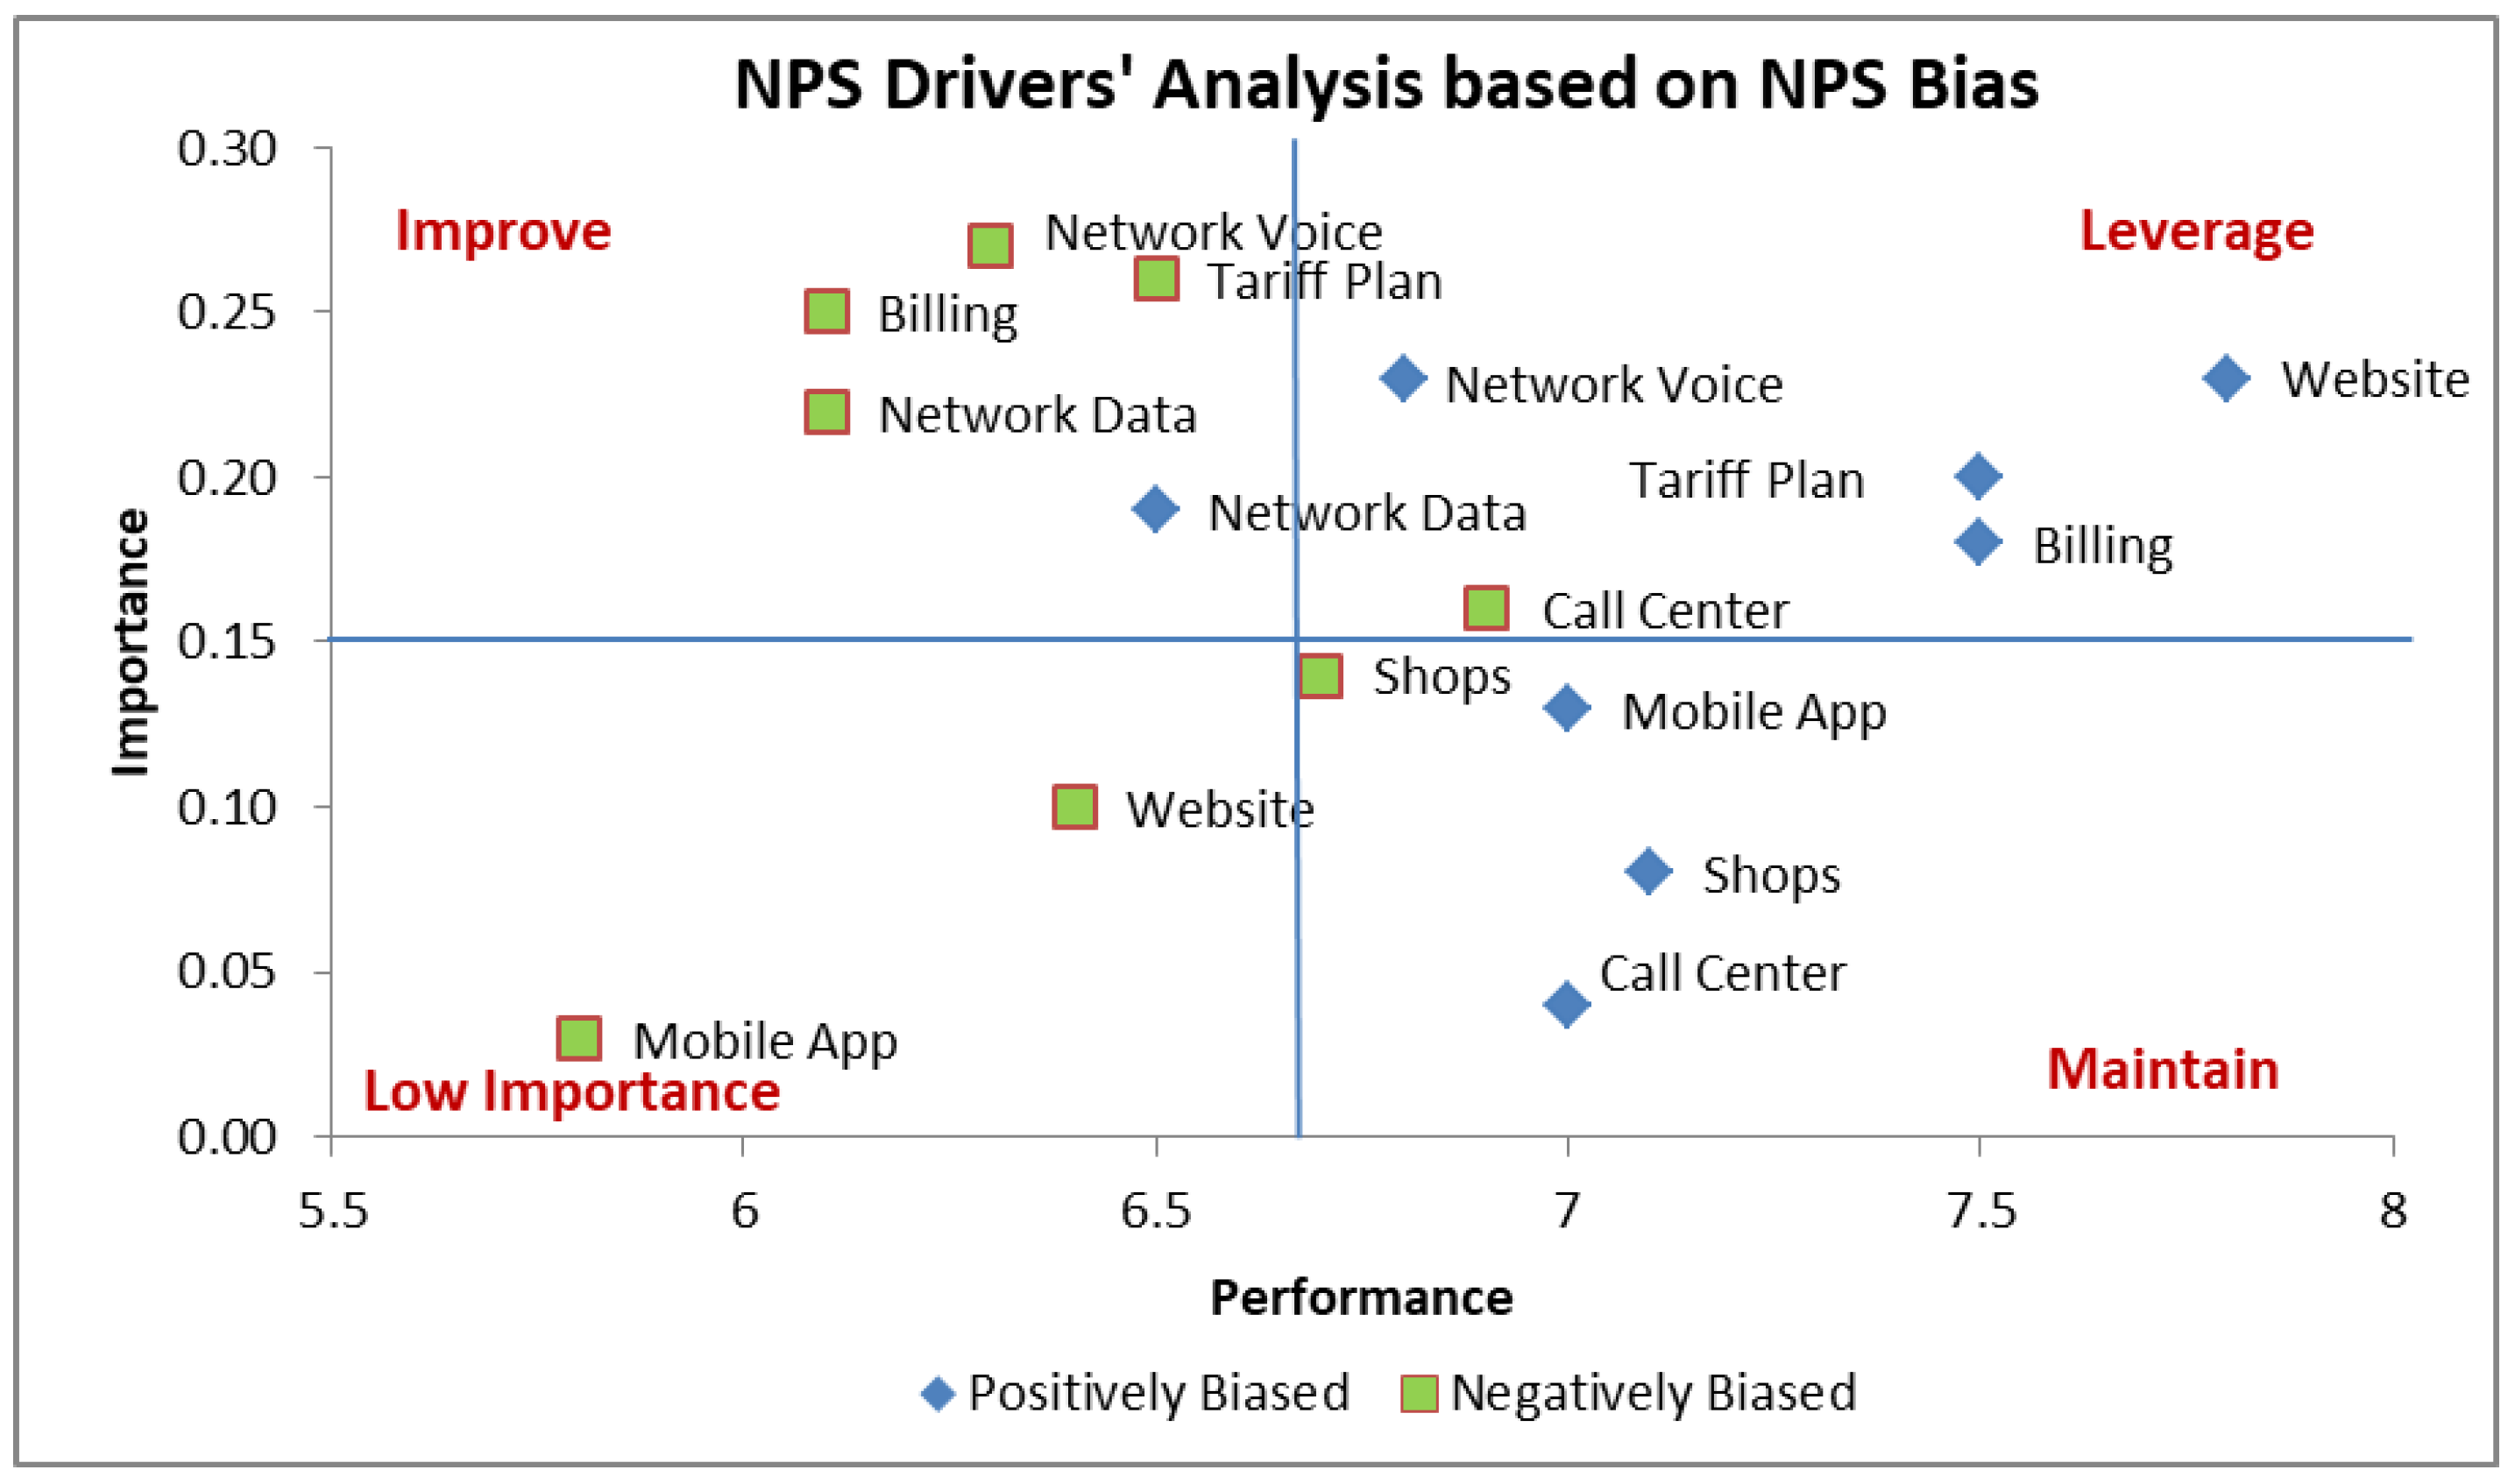
Based on the results achieved via the NPS Bias classification, it is now possible to apply the NPS key drivers’ analysis separately for positively and negatively biased customers. Indicative results of this analysis are presented in
Figure 6. The primary target of this analysis is to derive more accurate conclusions on the NPS drivers. Such results may support companies in their effort to focus and prioritize its CX action plans.
A closer inspection of
Figure 6 reveals that for some CX attributes both the positively and negatively biased customers points belong to the same quadrant. In such cases a company should take the proper actions to satisfy the entire customer base. For example, Network Data appears to be an attribute for improvement for both positively and negatively biased customers, which means that the mobile operator should consider actions like increasing the network data speed in network areas with significant data traffic demand.
On the other hand, the proposed method reveals CX attributes for which the positively and negatively biased points belong to different quadrants. This implies that a company may apply different and targeted actions to the different customer subgroups. In the example of
Figure 6, Billing is an attribute for improvement for the negatively biased customers and an attribute of satisfactory performance (leverage quadrant) for the positively biased customers. Therefore, in this example the operator should take CX improvement measures for the negatively biased customers. Such an approach requires further and deeper analysis from the company side to identify the issues that cause dissatisfaction, for example, through customer complaints analysis. An example improvement action would be to communicate with customers that have complained about their bill so as to verify whether the issue of the customer has been resolved in the next billing cycle.
It should also be noted that this approach increases the cost efficiency of the company CX action plan as the increased focus on specific customer subgroups reduces the required cost for fixing the detected issues.
5. Machine Learning Algorithms for CX Classification
As presented in previous sections, the NPS survey analysis faces significant challenges, such as the number and temporal variability of the attributes that are considered in the NPS scoring process. It should be noted that most CX attributes may vary over time, regarding their importance and performance, thus changing their influence on NPS. Machine learning (ML) techniques seem to be a promising solution to meet these challenges. However, the limited amount of available data could be a major obstacle, given that the training step of the ML algorithms requires a dataset of considerable size. In the best case scenario, NPS surveys are performed on a monthly basis, whereas many companies conduct surveys every 6 or even 12 months.
In this section, we apply several ML algorithms to determine the relation between the NPS bias and CX attributes from the telecommunication sector. In order to tackle the data availability issue, a data generator is exploited to create a realistic NPS survey dataset, based on the key statistical parameters of the original sample, such as mean value, standard deviation and correlation matrix. In the data generation process, both the identified patterns of a mix between NPS bias classification and NPS classification (see
Table 3) and the fact that NPS bias classification corresponds to the common NPS scoring process, are considered. The following sections briefly present the ML algorithms, as well as the results of the proposed methods.
5.1. Problem Formulation
The ordinal regression problem consists of predicting the label
y of an input vector
x, where
and
, i.e.,
x is in K-dimensional input space and
y a label of
Q different values.
Q labels form categories or groups of patterns and the objective is to find a classification rule or function
to predict the categories of the NPS index, given a training set of
N points,
In this paper, we consider the problem of the NPS class prediction, as defined in
Table 1, i.e.,
Q labels correspond to Promoters (
), Passives (
) and Detractors (
). Regarding the
K-dimensional input we consider two options: (a)
corresponds to the satisfaction score (0–10) on CX attribute
i, for example, network, tariff, and billing, and (b) the input set apart from the CX attributes’ satisfaction scores also includes the NPS bias classification index (1 for positively biased, 2 for negatively biased customers).
5.2. Machine Learning Algorithms
We have scrutinized the effectiveness of a series of well-known classifiers that have been used in this paper for the customers identification from the questionnaire answers. In this section, the investigated classification techniques are briefly described.
5.2.1. Decision Trees
Decision tree learning is one of the predictive modeling approaches used in statistics, data mining and machine learning [
47]. It uses a decision tree to go from observations about an item to conclusions about the item’s target value (represented in the leaves) [
48]. In these tree structures, “leaves” represent class labels (i.e., the lables
) and “branches” represent conjunctions of features that lead to those class labels. Decision trees where the target variable can take continuous values, typically real numbers, are called regression trees.
Table 5 contains the decision trees parameters that we used in the current paper.
5.2.2. k-Nearest Neighbors
The -nearest neighbors (k-NN) algorithm is a non-parametric method used for classification [
49,
50], applied for solving many classification problems [
51]. A majority vote of its neighbors classifies an object, with the object being assigned to the class most common among its
k-nearest neighbors; it is, therefore, a type of instance-based learning, where the function is only approximated locally and all computation is deferred until classification. Often a fuzzy variation of the k-NN algorithm is used [
52].
Table 6 presents the main parameters of the method applied in this paper.
5.2.3. Support Vector Machines
Support vector machines (SVM) are supervised learning models with associated learning algorithms [
53,
54,
55]. That is, SVM requires a training set, like
D in our case. Then, each input is marked to belong to one or the other of two categories and the SVM training algorithm builds a model that assigns each new incoming example to one category or the other, making it a non-probabilistic binary linear classifier. In other words, an SVM model is a representation of the examples as points in space, mapped so that the examples of the separate categories are divided by a clear margin that is as wide as possible. The parameters of the SVM method are presented in
Table 7.
5.2.4. Random Forest (RF)
The random forest classifier consists of a combination of tree classifiers where each of them is generated using a random vector sampled independently from the input vector, and each tree casts a unit vote for the most popular class to classify an input vector [
56].
Table 8 contains the parameters of the RF classifier used in the current work.
5.2.5. Artificial Neural Networks (ANNs)
Artificial Neural Networks are highly non-linear classifiers with many applications to extensive domains [
27]. Their structures try to resemble how human brains work with neurons and synapses. In particular, an ANN consists of one input layer that receives as data the input signals, one or more hidden layers of neurons that process these data under a non-linear way and one output layer that yields the final classification outcome. Each neuron sums the input signals under a weighted (parametrize) way and then passes them to a non-linear activation functions [
57].
The activation functions actually non-linearly transforms the input signals to the outputs and they consist of function bases, if they are increasing, bounded and almost satisfy the continuity property (through the Kolmogorov Theorem [
58]). Especially, their significance in modeling time-varying signals is of particular interest [
59].
In our implementation, an ANN with one input, one hidden and one output layer is employed.
Table 9 indicates the specific parameters of our ANN. The RelU function is adopted as activation for the input and hidden layers, while the softmax for the output layer. This is due to the fact that these activation functions seem to work better than other approaches as is proven through the deep learning paradigm [
25]. The ANN parameters are presented in
Table 9.
5.2.6. Convolutional Neural Networks (CNNs)
CNNs exploit machine learning paradigms on deep structures. It firstly extracts a set of appropriate features from the raw data, by applying convolutions on the input signals propagating them into deep layers while at the last layer a classification is carried out to assign the input data into classes but on the use of the deep features identified by the convolutional layers. CNNs utilize trainable filters and pooling operations on their input resulting in a hierarchy of increasingly complex features [
25,
60,
61]. Convolutional layers consist of a rectangular grid of neurons (filters), each of which takes inputs from rectangular sections of the previous layer. Each convolution layer is followed by a pooling layer in which subsamples block-wise the output of the precedent convolutional layer and produce a scalar output for each block. Formally, if we denote the
k-th output of a given convolutional layer as
in which the filters are determined by the weights
and bias
, then the
is obtained as:
where
x stands for the input (KPIs values) of the convolutional layer, and indices
i and
j correspond to the location of the input where the filter is applied. The star symbol
stands for the convolution operator and
is a non-linear function.
Table 10 provides the paramaters of the CNN method.
5.2.7. Naïve Bayes
Naïve Bayes classifiers are a family of probabilistic classifiers based on applying Bayes’ theorem with strong independence assumptions between the features. These classifiers are highly scalable, requiring a number of parameters linear in the number of variables (features/predictors) in a learning problem [
62]. Maximum-likelihood training can be done by evaluating a closed-form expression, which takes linear time, rather than by expensive iterative approximation as used for many other types of classifiers.
5.2.8. Logistic Regression
Logistic regression is a statistical model that in its basic form uses a logistic function to model a binary dependent variable [
63]. Mathematically, a binary logistic model has a dependent variable with two possible values, such as pass/fail, which is represented by an indicator variable, where the two values are labeled 0 and 1. The defining characteristic of the logistic model is that increasing one of the independent variables multiplicatively scales the odds of the given outcome at a constant rate, with each independent variable having its own parameter.
Table 11 provides the main logistic regression parameters.
5.3. Applied Dataset
For our experiments, we took as a basis an extended set of realistic data generated in accordance to the pattern characteristics identified via the NPS bias analysis. In particular, we have enriched the available dataset of real data (
Section 4.1) with the production of a set of realistic randomized data reaching a total of 10,800 surveys as an input to our experiments. These surveys included the NPS class label (Promoter, Passive, Detractor) and 9 CX attributes (Tariff Plan, Network Voice, Network Data, Billing, Call Center, Shops, Website, Mobile App, and Roaming) with values from 0–10, as explained in
Section 3. Moreover, a second version of the datasets included not only the NPS class and the CX attributes, but also a classification based on an NPS bias metric (1 for positively biased and 2 for negatively biased cases). This extended dataset allows for the investigation of the machine learning algorithms’ performance in the case that NPS bias is provided as an additional input. These parameters were the features that we used to feed the different machine learning neural networks. In our dataset, out of the total of 10,800 survey entries, there were 3769 promoters, 4072 passives and 2959 detractors.
5.4. Experimental Results
The current section presents the results obtained from each method. The data were normalized and split into Training, Validation and Test sets using 80:10:10 splits. We train a set of machine learning models to estimate the NPS customer class (Promoter, Passive, Detractor) from a subset of CX attributes. The proposed methodology involved data selection, dimensionality reduction, and samplers–classifiers combinatory approaches. As such, all the above fields were investigated in terms of their impact on the NPS class identification problem. Their performance was quantified by using traditional performance measures as accuracy, precision, recall, and F1 score (
Appendix A) based on the adopted well-known machine learning algorithms described in
Section 5.2. Python scikit-learn and Tensorflow/Keras libraries are used for data processing, model development and performance evaluation. The hyperparameters of the ML methods are provided in
Section 5.2.
Since our data are signals of relatively low dimensions, the computational cost for executing the machine learning algorithms (i.e., testing cost) is almost negligible and can be implemented in real-time. In addition, the highest computational cost for training is of the Artificial Neural Network (ANN) structure and of the Convolutional Neural Networks (CNN). In particular, the computational cost for training the ANN is about 49 ms and for the CNN about 110 ms. Both costs have been estimated on a laptop of Intel i7 processor and of 16 GB memory. These costs are, in fact, the heaviest load of our machine learning algorithms.
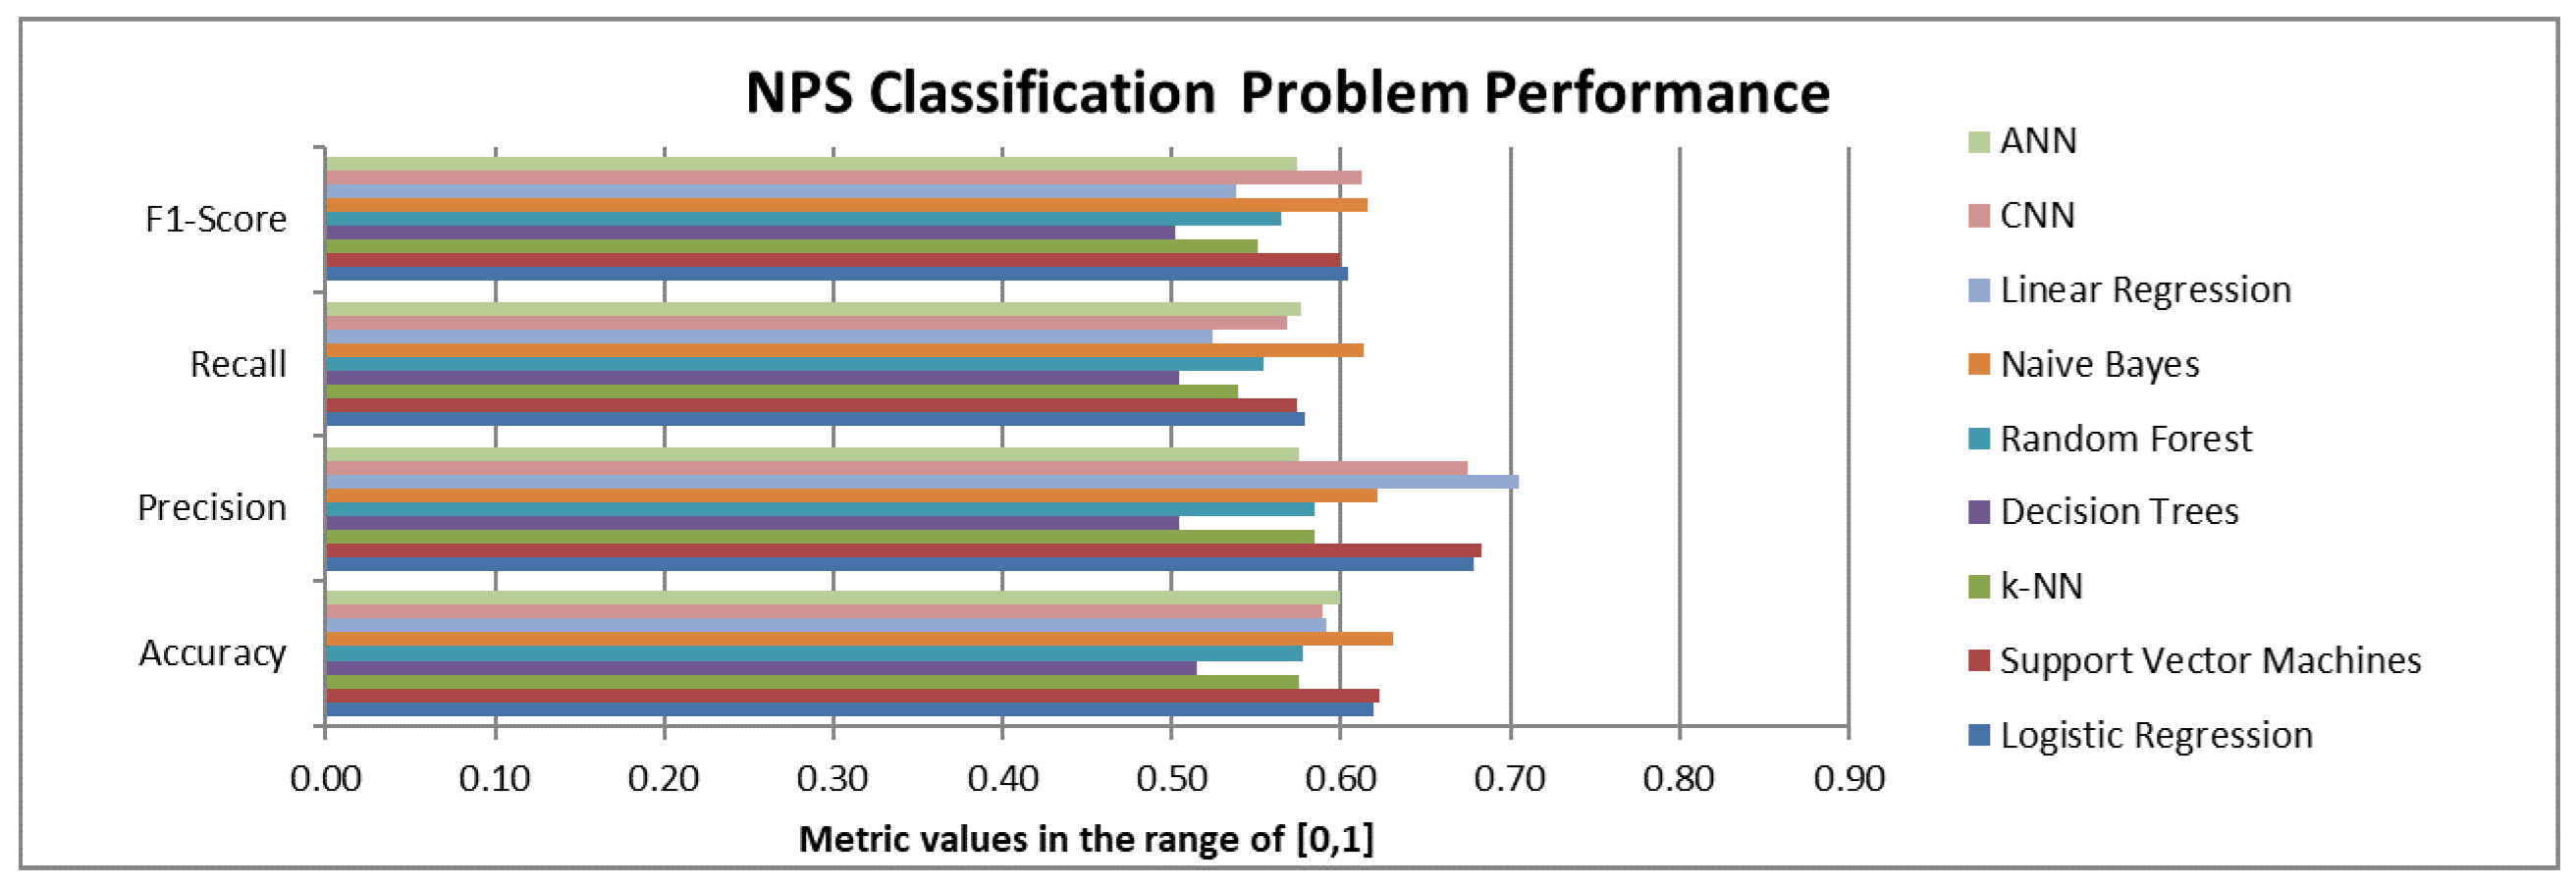
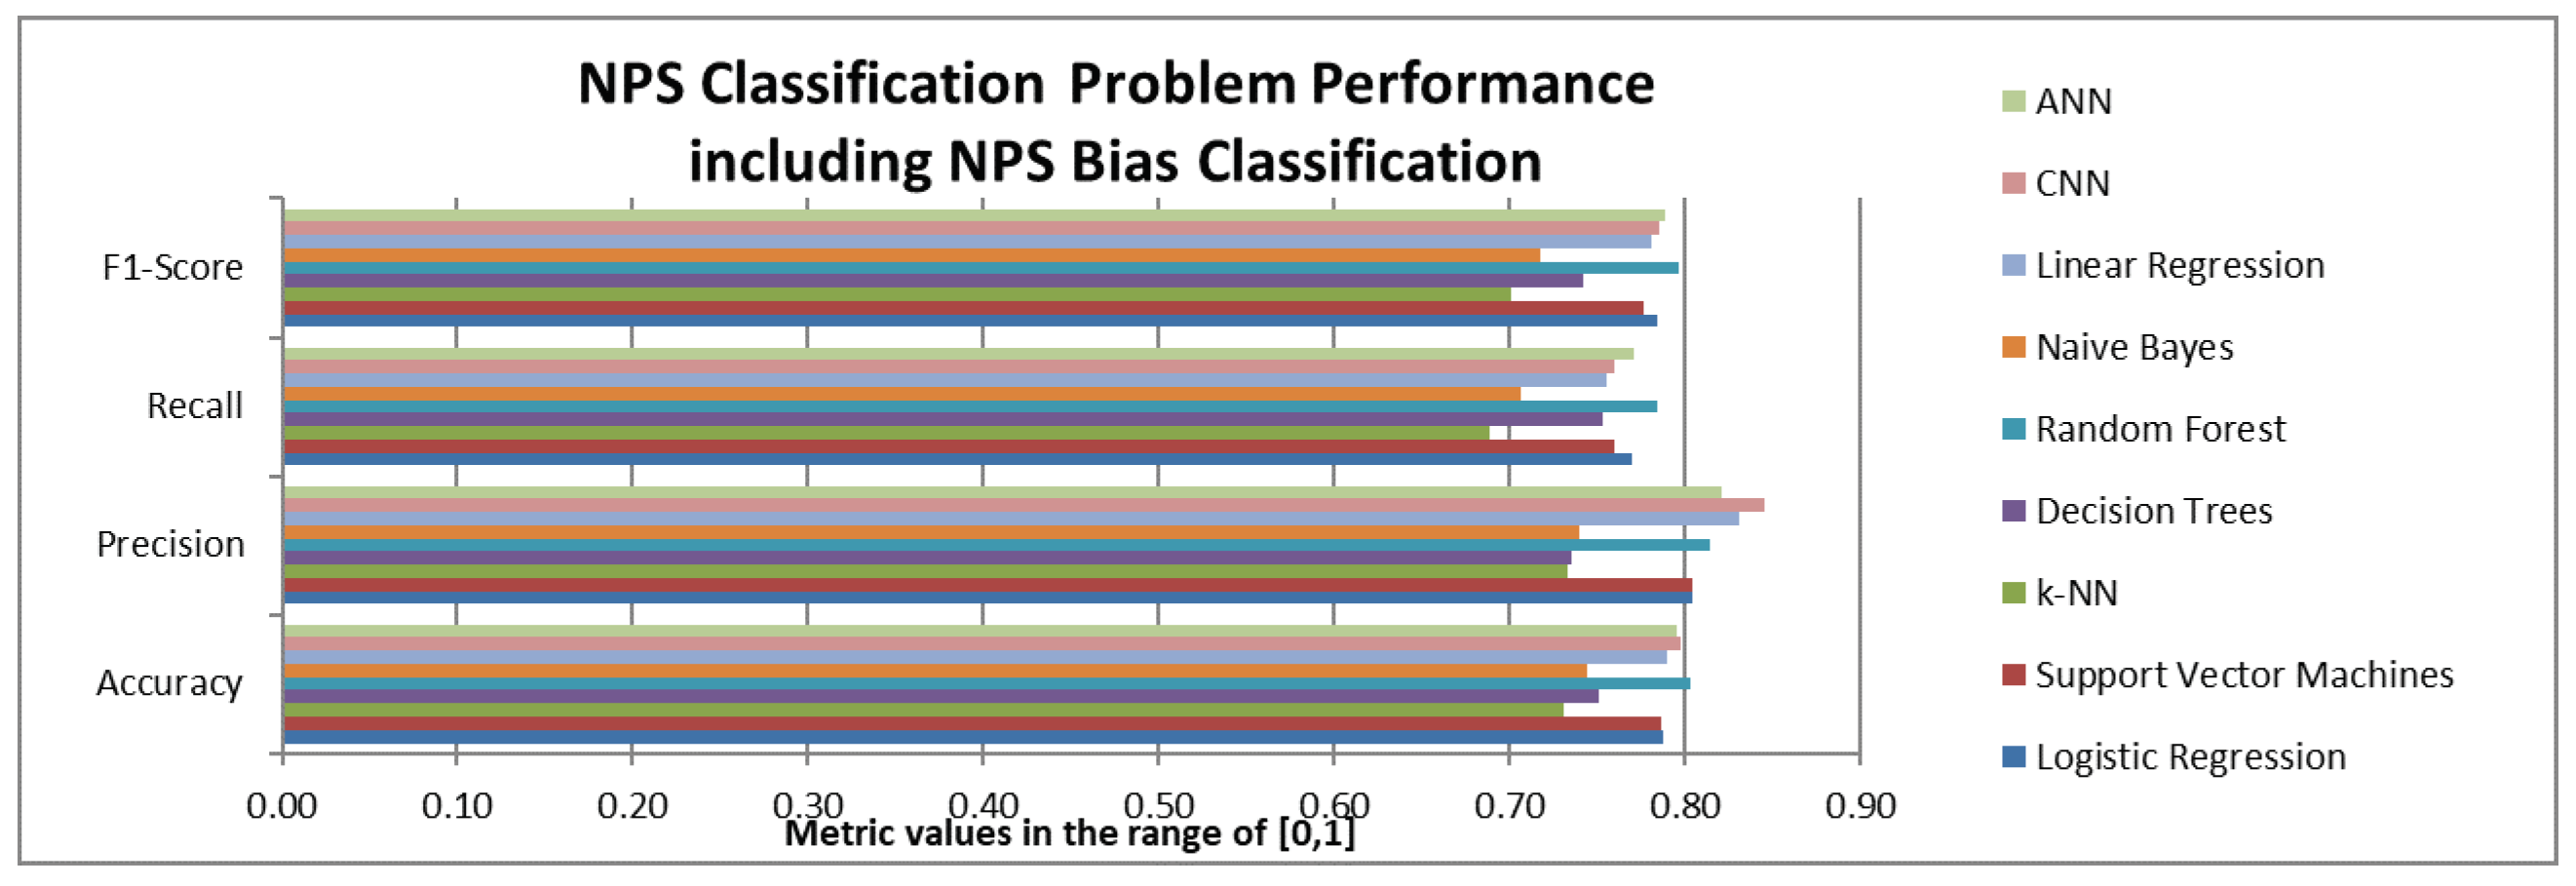
Two different versions of the machine learning algorithms were applied based on the two versions of the available datasets: (a) the first version aimed at the prediction of the NPS class (Promoter, Passive, Detractor) using as input the satisfaction scores on the 9 CX attributes and (b) the second version aimed at the prediction of the NPS class using as input both the satisfaction scores on the 9 CX attributes and the NPS bias. The results for these versions are presented in
Figure 7 and
Figure 8, respectively.
As we can see from
Figure 7, if we do not consider the NPS bias information, Naïve Bayes and CNN, followed by SVM and logistic regression, are the best performing models in terms of F1-score.
Figure 8 indicates that in the case that NPS bias information becomes available, random forest ANNs and CNNs followed by linear regression, SVM and logistic regression posted the best results overall.
It should be noted that the NPS Bias significantly improves the performance of all the examined ML methods. As we can see by the comparison of
Figure 7 and
Figure 8, this improvement is reflected in all the performance metrics, thus confirming the results observed in the initial analysis, which was based on the exploitation of monthly data using logistic regression (
Section 4).
6. Personal Data Protection Rules and Ethical Issues
A major aspect of this research is how to protect the personal data of the participants, implying that our work should be carried out under strict ethical standards, for example, in relation to protecting humans’ data and their privacy, confidentiality and consent. Towards this, three main actions should be taken into account. The first concerns the written consensus of participants to allow for processing their personal data and information. The second deals with the secure storage, processing and management of these data and the third with the lawful basis in exploiting data from third sources.
Written Consensus Forms: Regarding data received by humans, a written consensus of the subjects is always required when transferring personal individualized information from the subjects to the analysts. Children and vulnerable subjects are excluded since they are not able to give consensus. Thus, only adults who are able to give consensus will allow to share their data. Participation in data sharing is totally voluntary and no participant shall be coerced into taking part in such process. Participants have the right to decline taking part in this sharing process at any given moment without giving any reason or explanation and even after giving their consent. Participants are informed that dropping out of the study at any time, for any reason, will not have any penalization or negative effects on them. Before participants give their consent they receive clear and unambiguous information in their own language on the terms of the research study. For example, the subjects are informed about: (a) what the validation study is about, (b) who is carrying out this validation, (c) the funding scheme, (d) any potential benefit to individuals or groups, (e) what they will have to do, (f) duration of the experiment, (g) what the experiment/pilot/test findings will be used for, (h) what personal information will be collected and stored, (i) what is the revocation process in case the participant wants to delete all the stored data referred to him/her at any time.
Data Management: As far as the management of the data, these are stored and held securely as per legal, ethical and good practice requirements. That is, databases used would be password protected and separation of humans’ identifiable master list held separate from the research database, which would use numbered subject codes. We give special attention to the confidentiality of data storage and processing. We commit to implementing all appropriate technical and organizational measures necessary in order to protect potential personal data against accidental or unlawful destruction or accidental loss, alteration, unauthorized disclosure or access, and against all other unlawful forms of processing, taking into account the particularity of the performed processing operations. Personal data are stored securely on a password-protected computer or an encrypted hard-drive kept in secure premises, only used for the purpose for which they were collected and deletion immediately after that purpose is fulfilled. Any access is granted only to authorized partners for data handling. Furthermore, access to information or data input (even change) will also be restricted only to authorized users to ensure their confidentiality and reserved only for those partners that collect and provide data. In general, the following principles are followed:
Personal data of participants are strictly held confidential at any time of the research;
No personal data are centrally stored. In addition, data are scrambled where possible and abstracted and/or anonymized in a way that does not affect the final project outcome;
No collected data are utilized outside the scope of this research or for any other secondary use.
Secondary Use of Data: Finally, in the case that we further process previously collected personal data, an explicit confirmation that we have the lawful basis for the data processing and that the appropriate technical and organizational measures are in place to safeguard the rights of the data subjects is included.
7. Discussion
The findings from the experiments we conducted in this paper could be summarized in the following:
- (a)
A set of scenarios was tested by changing the mix of random and real data in the training data set. The results indicated that the contribution of randomly generated data led to similar results (in terms of the metrics presented in
Figure 7 and
Figure 8). Although the incorporation of the randomly generated data eliminated the potential overfitting effects, it did not increase the achieved performance of the models tested. To this end, the next research step in this direction will be to further enhance the random data generator through the application of Generative Adversarial Networks (GANs) [
39].
- (b)
The comparative analysis of all the examined models indicated that despite the differences observed in the performance metrics, at this stage we cannot identify a single model as the one with dominant performance for NPS classification analysis. It appears that linear and logistic regression exhibit similar performance with other ML algorithms.
- (c)
The introduction of the NPS bias label delivers substantial improvement in the performance metrics of all the tested algorithms. The proposed method provides fertile ground for the better understanding of the NPS key drivers, which in turn will allow to apply targeted actions based on separate analysis of positively and negatively biased customers, as described in
Section 3. The next research step in this case will be to verify whether the statistical results of this paper are associated with causality. This can be achieved through the comparison of the key drivers’ analysis results with the free comments that the surveyed customers are asked to provide (sentiment analysis).
8. Conclusions
The paper addresses the issue of NPS key drivers’ analysis following a two-step approach. In the first step, a novel classification of customers based on “NPS bias” definition is proposed. This classification, which is valid for descriptive analysis, leads to the identification of two sub-groups of customers (namely the positively and negatively biased customers). The new classification allows for the employment of the same NPS scoring process and seems to have an improved performance in terms of accuracy and F1-score, compared to the original NPS analysis. The paper also provides an example of how the proposed method can support the prioritization of CX actions based on logistic regression and a set of monthly NPS survey data.
In the second step of the analysis, the revealed NPS scoring pattern is exploited so as to create a generator of realistic NPS survey data. This is vital for investigating the application of ML algorithms as a means for a more accurate NPS survey analysis. Several state-of-the-art ML algorithms are considered for addressing the issue of NPS class prediction. It should be noted that the ML algorithms are applied on two datasets: the first one includes only the CX attributes satisfaction score, while the second one also incorporates the “NPS bias” label as an additional input. The results indicate that the performance of certain ML algorithms, such as CNNs, ANNs and random forests, is quite satisfactory in most performance metrics. The result analysis also confirms that the “NPS bias” classification leads to substantially improved performance, which was observed in the first step using logistic regression.
Finally, the paper results strongly indicate that the proposed “NPS bias” classification is a valid descriptive analytics method for supporting business decision making. For the telecommunication sector, this decision making could include several attributes, such as tariff policy and billing, customers’ satisfaction, on-line (e-)services, and mobile (m-)services. Moreover, the experimental results helped the authors to identify the next research steps in this topic. These steps include the investigation of methods like GANs for the random generation of data and the application of sentiment analysis on the free comments that surveyed customers provide, so as to verify the causality of the NPS bias classification analysis. Another important issue is the use of a multi-dimensional index instead of a single metric such as the NPS for identifying the customers’ experience. This index can further increase the performance but it may increase the complexity as well.
Author Contributions
Conceptualization, I.R., G.K., A.D., N.D. and I.M.; Investigation, I.R., I.G., G.K. and I.M.; Methodology, I.R., I.G., G.K., A.D., N.D. and I.M.; Software, I.G.; Supervision, A.D. and N.D.; Visualization, I.G. and I.M.; Writing—original draft, I.R. and G.K.; Writing—review & editing, A.D., N.D. and I.M. All authors have read and agreed to the published version of the manuscript.
Funding
This research has been co-financed by the European Union and Greek national funds through the Operational Program Competitiveness, Entrepreneurship and Innovation, under the call RESEARCH—CREATE—INNOVATE (project name: CxPress “An Innovative Toolkit for the Analysis of Customer’s Experience”, project number: T1EDK-05063).
Acknowledgments
The authors would like to thank the Greek office for management and implementation of actions in the fields of Research, Technological Development and Innovation under the Greek Ministry of Development and Investments of the Hellenic Republic for their support to this research through the CxPress project (project number: T1EDK-05063).
Conflicts of Interest
The authors declare no conflict of interest.
Appendix A. Performance Metrics
Appendix A.1. Confusion Matrix
In the NPS classification problem, the applied machine learning algorithms predict the class label, either with success or with misclassification of some non-detects as detects. The outputs of a binary classification problem are typically used to form the table of confusion, which is a
matrix that reports the number of true positives (TP), false positives (FP), false negatives (FN), and true negatives (TN). Given these values we are able to calculate various performance metrics regarding the algorithm detection performance. In the NPS classification problem, however, we have three classes; Promoters, Passives and Detractors. For that reason, we need to apply performance metrics for a
mutli-class confusion matrix [
64] (see
Table A1).
Each row of the matrix represents the instances in a predicted class, while each column represents the instances in an actual class, or vice versa. The confusion matrix shows the ways in which the classification model is “confused” when it makes predictions. It can give insight not only into the errors being made by a classifier, but more importantly the type of the resulting errors.
Table A1.
The NPS classification confusion matrix.
Table A1.
The NPS classification confusion matrix.
| | | Actual Class |
|---|
| | | Detractors | Passives | Promoters |
|---|
| Predicted-Class | Detractors | | | |
| Passives | | | |
| Promoters | | | |
Appendix A.1.1. Accuracy
Accuracy measures the model’s overall performance in correctly identifying all classes. This metric is valid for both binary and multi-class classification. The accuracy formula stands as follows:
Apparently, we want the accuracy score to be as high as possible, but it is important to note that accuracy may not always be the best metric to use, especially in cases of a dataset that has imbalanced data. This happens when the distribution of data is not equal across all classes.
Appendix A.1.2. Precision and Recall
Precision, also called positive predictive value, is the fraction of relevant instances among the retrieved ones, while recall, known also as sensitivity, is the fraction of the total amount of relevant instances that were actually retrieved. Both these metrics, precision and recall, are therefore based on an understanding and measure of relevance.
In a binary classification problem, precision is defined as the ratio of true positives to the total positive predictions (i.e., true positives plus false positives).
In the NPS multi-class confusion matrix the Precision metric can be defined in two basic ways called “macro” and “micro” in a Python scikit-learn module [
65]:
When a model identifies an observation as a positive, this metric measures the performance of the model by correctly identifying the true positive from the false positive. This is a very robust matrix metric for multi-class classification and the unbalanced data. The closer the precision value to 1, the better the model.
The recall metric, in a binary classification problem, is defined as the ratio of true positive predictions to the total number of actual positive class instances (i.e., true positive plus false negative instances). In the NPS multi-class confusion matrix the recall metric can be defined in two basic ways called “macro” and “micro” in the Python scikit-learn module [
65]:
This metric measures a model’s performance in identifying the true positive out of the total positive cases. The closer the recall value to 1, the better the model. As is the case with the precision metric, this metric is a very robust matrix for multi-class classification and the unbalanced data.
Note that in the current paper the “macro” option of metrics’ calculation has been exploited.
Appendix A.1.3. F1-Score
The F1-Score metric is a measure of a test’s accuracy. It considers both precision and recall metrics of the particular test. In particular, the F1-Score is defined as the weighted harmonic mean of the test’s precision and recall metrics:
The F1-Score reaches the best value, meaning perfect precision and recall, at the value of 1. The worst F1-Score, which means lowest precision and lowest recall, would be a value of 0. Moreover, having an imbalance between precision and recall, such a high precision and low recall, can give us an extremely accurate model, but classifies difficult data incorrectly. We want the F1-Score to be as high as possible for the best performance of our model.
References
- Bolton, R.N.; Drew, J.H. A Multistage Model of Customers’ Assessments of Service Quality and Value. J. Consum. Res. 1991, 17, 375–384. [Google Scholar] [CrossRef]
- Aksoy, L.; Buoye, A.; Aksoy, P.; Larivière, B.; Keiningham, T.L. A cross-national investigation of the satisfaction and loyalty linkage for mobile telecommunications services across eight countries. J. Interact. Mark. 2013, 27, 74–82. [Google Scholar] [CrossRef]
- Ismail, A.R.; Melewar, T.C.; Lim, L.; Woodside, A. Customer experiences with brands: Literature review and research directions. Mark. Rev. 2011, 11, 205–225. [Google Scholar] [CrossRef] [Green Version]
- Gentile, C.; Spiller, N.; Noci, G. How to Sustain the Customer Experience: An Overview of Experience Components that Co-create Value With the Customer. Eur. Manag. J. 2007, 25, 395–410. [Google Scholar] [CrossRef]
- Reichheld, F.F. The one number you need to grow. Harv. Bus. Rev. 2003, 81, 46–55. [Google Scholar]
- Reichheld, F. The Ultimate Question: Driving Good Profits and True Growth, 1st ed.; Harvard Business School Press: Boston, MA, USA, 2006. [Google Scholar]
- Jeske, D.R.; Callanan, T.P.; Guo, L. Identification of Key Drivers of Net Promoter Score Using a Statistical Classification Model. In Efficient Decision Support Systems—Practice and Challenges From Current to Future; IntechOpen: London, UK, 2011. [Google Scholar] [CrossRef] [Green Version]
- Ickin, S.; Ahmed, J.; Johnsson, A.; Gustafsson, J. On Network Performance Indicators for Network Promoter Score Estimation. In Proceedings of the 2019 Eleventh International Conference on Quality of Multimedia Experience (QoMEX), Berlin, Germany, 5–7 June 2019; pp. 1–3. [Google Scholar] [CrossRef]
- Dastane, O.; Fazlin, I. Re-Investigating Key Factors of Customer Satisfaction Affecting Customer Retention for Fast Food Industry. Int. J. Manag. Account. Econ. 2017, 4, 379–400. [Google Scholar]
- Ban, H.J.; Choi, H.; Choi, E.K.; Lee, S.; Kim, H.S. Investigating Key Attributes in Experience and Satisfaction of Hotel Customer Using Online Review Data. Sustainability 2019, 11, 6570. [Google Scholar] [CrossRef] [Green Version]
- Raspor Janković, S.; Gligora Marković, M.; Brnad, A. Relationship Between Attribute And Overall Customer Satisfaction: A Case Study Of Online Banking Services. Zb. Veleučilišta Rijeci 2014, 2, 1–12. [Google Scholar]
- Rallis, I.; Markoulidakis, I.; Georgoulas, I.; Kopsiaftis, G. A novel classification method for customer experience survey analysis. In Proceedings of the 13th ACM International Conference on PErvasive Technologies Related to Assistive Environments, Corfu, Greece, 30 June–3 July 2020; pp. 1–9. [Google Scholar]
- Lalonde, S.M.; Company, E.K. Key Driver Analysis Using Latent Class Regression; Survey Research Methods Section; American Statistical Association: Alexandria, VA, USA, 1996; pp. 474–478. [Google Scholar]
- Larson, A.; Goungetas, B. Modeling the drivers of Net Promoter Score. Quirks Med. 2013, 20131008. Available online: https://www.quirks.com/articles/modeling-the-drivers-of-net-promoter-score (accessed on 30 November 2020).
- Reno, R.; Tuason, N.; Rayner, B. Multicollinearity and Sparse Data in Key Driver Analysis. 2013. Available online: https://www.predictiveanalyticsworld.com/sanfrancisco/2013/pdf/Day2_1550_Reno_Tuason_Rayner.pdf (accessed on 30 November 2020).
- Rose, S.; Sreejith, R.; Senthil, S. Social Media Data Analytics to Improve the Customer Services: The Case of Fast-Food Companies. Int. J. Recent Technol. Eng. 2019, 8, 6359–6366. [Google Scholar] [CrossRef]
- Miao, Y. A Machine-Learning Based Store Layout Strategy in Shopping Mall. In Proceedings of the International Conference on Machine Learning and Big Data Analytics for IoT Security and Privacy, Shanghai, China, 6–8 November 2020; pp. 170–176. [Google Scholar]
- Sheoran, A.; Fahmy, S.; Osinski, M.; Peng, C.; Ribeiro, B.; Wang, J. Experience: Towards automated customer issue resolution in cellular networks. In Proceedings of the 26th Annual International Conference on Mobile Computing and Networking, London, UK, 21–25 September 2020; pp. 1–13. [Google Scholar]
- Al-Mashraie, M.; Chung, S.H.; Jeon, H.W. Customer switching behavior analysis in the telecommunication industry via push-pull-mooring framework: A machine learning approach. Comput. Ind. Eng. 2020, 106476. [Google Scholar] [CrossRef]
- Keiningham, T.L.; Cooil, B.; Andreassen, T.W.; Aksoy, L. A longitudinal examination of net promoter and firm revenue growth. J. Mark. 2007, 71, 39–51. [Google Scholar] [CrossRef] [Green Version]
- Grisaffe, D.B. Questions about the ultimate question: Conceptual considerations in evaluating Reichheld’s net promoter score (NPS). J. Consum. Satisf. Dissatisf. Complain. Behav. 2007, 20, 36. [Google Scholar]
- Zaki, M.; Kandeil, D.; Neely, A.; McColl-Kennedy, J.R. The fallacy of the net promoter score: Customer loyalty predictive model. Camb. Serv. Alliance 2016, 10, 1–25. [Google Scholar]
- Karamolegkos, P.N.; Patrikakis, C.Z.; Doulamis, N.D.; Tragos, E.Z. User—Profile based Communities Assessment using Clustering Methods. In Proceedings of the 2007 IEEE 18th International Symposium on Personal, Indoor and Mobile Radio Communications, Athens, Greece, 3–7 September 2007; pp. 1–6. [Google Scholar] [CrossRef]
- Voulodimos, A.S.; Patrikakis, C.Z.; Karamolegkos, P.N.; Doulamis, A.D.; Sardis, E.S. Employing clustering algorithms to create user groups for personalized context aware services provision. In Proceedings of the 2011 ACM Workshop on Social and Behavioural Networked Media Access, Scottsdale, AZ, USA, 1 December 2001; Association for Computing Machinery: New York, NY, USA, 2011; pp. 33–38. [Google Scholar] [CrossRef]
- Voulodimos, A.; Doulamis, N.; Doulamis, A.; Protopapadakis, E. Deep Learning for Computer Vision: A Brief Review. Comput. Intell. Neurosci. 2018, 2018, 1–13. [Google Scholar] [CrossRef]
- Taneja, A.; Arora, A. Modeling user preferences using neural networks and tensor factorization model. Int. J. Inf. Manag. 2019, 45, 132–148. [Google Scholar] [CrossRef]
- Doulamis, A.D.; Doulamis, N.D.; Kollias, S.D. On-line retrainable neural networks: Improving the performance of neural networks in image analysis problems. IEEE Trans. Neural Netw. 2000, 11, 137–155. [Google Scholar] [CrossRef]
- Doulamis, N.; Dragonas, J.; Doulamis, A.; Miaoulis, G.; Plemenos, D. Machine learning and pattern analysis methods for profiling in a declarative collaorative framework. In Intelligent Computer Graphics 2009; Springer: Berlin/Heidelberg, Germany, 2009; pp. 189–206. [Google Scholar]
- Yiakoumettis, C.; Doulamis, N.; Miaoulis, G.; Ghazanfarpour, D. Active learning of user’s preferences estimation towards a personalized 3D navigation of geo-referenced scenes. GeoInformatica 2014, 18, 27–62. [Google Scholar] [CrossRef]
- Lad, S.; Parikh, D. Interactively guiding semi-supervised clustering via attribute-based explanations. In Proceedings of the European Conference on Computer Vision, Zurich, Switzerland, 6–12 September 2014; pp. 333–349. [Google Scholar]
- Doulamis, N.; Yiakoumettis, C.; Miaoulis, G. On-line spectral learning in exploring 3D large scale geo-referred scenes. In Proceedings of the Euro-Mediterranean Conference, Limassol, Cyprus, 29 October–3 November 2012; pp. 109–118. [Google Scholar]
- Izonin, I.; Tkachenko, R.; Kryvinska, N.; Tkachenko, P.; Gregušml, M. Multiple Linear Regression based on Coefficients Identification using Non-Iterative SGTM Neural-Like Structure. In Proceedings of the International Work-Conference on Artificial Neural Networks, Gran Canaria, Spain, 12–14 June 2019; pp. 467–479. [Google Scholar]
- Vitynskyi, P.; Tkachenko, R.; Izonin, I.; Kutucu, H. Hybridization of the SGTM neural-like structure through inputs polynomial extension. In Proceedings of the 2018 IEEE Second International Conference on Data Stream Mining &Processing (DSMP), Lviv, Ukraine, 21–25 August 2018; pp. 386–391. [Google Scholar]
- Tkachenko, R.; Izonin, I.; Kryvinska, N.; Chopyak, V.; Lotoshynska, N.; Danylyuk, D. Piecewise-Linear Approach for Medical Insurance Costs Prediction Using SGTM Neural-Like Structure. In Proceedings of the 1st International Workshop on Informatics & Data-Driven Medicine (IDDM 2018), Lviv, Ukraine, 28–30 November 2018; pp. 170–179. [Google Scholar]
- Karamolegkos, P.N.; Patrikakis, C.Z.; Doulamis, N.D.; Vlacheas, P.T.; Nikolakopoulos, I.G. An evaluation study of clustering algorithms in the scope of user communities assessment. Comput. Math. Appl. 2009, 58, 1498–1519. [Google Scholar] [CrossRef] [Green Version]
- Conklin, M.; Powaga, K.; Lipovetsky, S. Customer satisfaction analysis: Identification of key drivers. Eur. J. Oper. Res. 2004, 154, 819–827. [Google Scholar] [CrossRef]
- LaLonde, S. A Demonstration of Various Models Used in a Key Driver Analysis; 2016; p. 17. Available online: https://www.lexjansen.com/mwsug/2016/AA/MWSUG-2016-AA23.pdf (accessed on 30 November 2020).
- Magidson, J. Correlated Component Regression: A Prediction/Classification Methodology for Possibly Many Features; American Statistical Association: Alexandria, VA, USA, 2010; pp. 4372–4386. [Google Scholar]
- Goodfellow, I.; Pouget-Abadie, J.; Mirza, M.; Xu, B.; Warde-Farley, D.; Ozair, S.; Courville, A.; Bengio, Y. Generative adversarial nets. In Advances in Neural Information Processing Systems; Ghahramani, Z., Welling, M., Cortes, C., Lawrence, N., Weinberger, K.Q., Eds.; Curran Associates, Inc.: Red Hook, NY, USA, 2014; Volume 27, pp. 2672–2680. [Google Scholar]
- Lipovetsky, S.; Conklin, M. Analysis of regression in game theory approach. Appl. Stoch. Model. Bus. Ind. 2001, 17, 319–330. [Google Scholar] [CrossRef]
- Tontini, G.; Picolo, J.D.; Silveira, A. Which incremental innovations should we offer? Comparing importance–performance analysis with improvement-gaps analysis. Total. Qual. Manag. Bus. Excell. 2014, 25, 705–719. [Google Scholar] [CrossRef]
- John, A. Martilla.; James, J.C. Importance-Performance Analysis - John A. Martilla, John C. James, 1977. J. Mark. 1977, 41, 77–79. [Google Scholar]
- Bacon, D.R. A Comparison of Approaches to Importance-Performance Analysis. Int. J. Mark. Res. 2003, 45, 1–15. [Google Scholar] [CrossRef]
- Slack, N. The Importance-Performance Matrix as a Determinant of Improvement Priority. Int. J. Oper. Prod. Manag. 1994, 14, 59–75. [Google Scholar] [CrossRef]
- Deng, J.; Pierskalla, C.D. Linking Importance–Performance Analysis, Satisfaction, and Loyalty: A Study of Savannah, GA. Sustainability 2018, 10, 704. [Google Scholar] [CrossRef] [Green Version]
- European Parliament, Council of the European Union. Regulation (EU) 2016/679 of the European Parliament and of the Council of 27 April 2016 on the Protection of Natural Persons with Regard to the Processing of Personal Data and on the Free Movement of Such Data, and Repealing Directive 95/46/EC (General Data Protection Regulation). Technical Report. 2016. Available online: https://eur-lex.europa.eu/legal-content/EN/TXT/PDF/?uri=CELEX:32016R0679 (accessed on 30 November 2020).
- Quinlan, J.R. Induction of decision trees. Mach. Learn. 1986, 1, 81–106. [Google Scholar] [CrossRef] [Green Version]
- Rokach, L.; Maimon, O.Z. Data Mining with Decision Trees: Theory and Applications; World Scientific: Singapore, 2008; Volume 69. [Google Scholar]
- Bhatia, N.; Vandana. Survey of Nearest Neighbor Techniques. arXiv 2010, arXiv:1007.0085. [Google Scholar]
- Murphy, K.P. Machine Learning: A Probabilistic Perspective; MIT Press: Cambridge, MA, USA, 2012. [Google Scholar]
- Protopapadakis, E.; Voulodimos, A.; Doulamis, A.; Camarinopoulos, S.; Doulamis, N.; Miaoulis, G. Dance pose identification from motion capture data: A comparison of classifiers. Technologies 2018, 6, 31. [Google Scholar] [CrossRef] [Green Version]
- Keller, J.M.; Gray, M.R.; Givens, J.A. A fuzzy k-nearest neighbor algorithm. IEEE Trans. Syst. Man Cybern. 1985, 4, 580–585. [Google Scholar] [CrossRef]
- Basak, D.; Srimanta, P.; Patranabis, D.C. Support Vector Regression. Neural Inf. Process.-Lett. Rev. 2007, 11, 203–224. [Google Scholar]
- Abe, S. Support Vector Machines for Pattern Classification, 2nd ed.; Advances in Computer Vision and Pattern Recognition; Springer: London, UK, 2010. [Google Scholar] [CrossRef]
- Kopsiaftis, G.; Protopapadakis, E.; Voulodimos, A.; Doulamis, N.; Mantoglou, A. Gaussian Process Regression Tuned by Bayesian Optimization for Seawater Intrusion Prediction. Comput. Intell. Neurosci. 2019, 2019, 2859429. [Google Scholar] [CrossRef] [PubMed]
- Pal, M. Random forest classifier for remote sensing classification. Int. J. Remote Sens. 2005, 26, 217–222. [Google Scholar] [CrossRef]
- Haykin, S. Neural Networks: A Comprehensive Foundation; Prentice-Hall Inc.: Upper Anhe, NJ, USA, 2007. [Google Scholar]
- Hecht-Nielsen, R. Kolmogorov’s mapping neural network existence theorem. In Proceedings of the International Conference on Neural Networks, San Diego, CA, USA, 21–24 June 1987; IEEE Press: New York, NY, USA, 1987; Volume 3, pp. 11–14. [Google Scholar]
- Doulamis, N.; Doulamis, A.; Varvarigou, T. Adaptable neural networks for modeling recursive non-linear systems. In Proceedings of the 2002 14th International Conference on Digital Signal Processing, DSP 2002 (Cat. No. 02TH8628), Santorini, Greece, 1–3 July 2002; Volume 2, pp. 1191–1194. [Google Scholar]
- Protopapadakis, E.; Voulodimos, A.; Doulamis, A. On the Impact of Labeled Sample Selection in Semisupervised Learning for Complex Visual Recognition Tasks. Complexity 2018, 2018, 1–11. [Google Scholar] [CrossRef]
- Doulamis, A.; Doulamis, N.; Protopapadakis, E.; Voulodimos, A. Combined Convolutional Neural Networks and Fuzzy Spectral Clustering for Real Time Crack Detection in Tunnels. In Proceedings of the 2018 25th IEEE International Conference on Image Processing (ICIP), Athens, Greece, 7–10 October 2018; pp. 4153–4157. [Google Scholar] [CrossRef]
- Haouari, B.; Amor, N.B.; Elouedi, Z.; Mellouli, K. Naïve possibilistic network classifiers. Fuzzy Sets Syst. 2009, 160, 3224–3238. [Google Scholar] [CrossRef]
- Hosmer, D.W., Jr.; Lemeshow, S.; Sturdivant, R.X. Applied Logistic Regression; John Wiley & Sons: Hoboken, NJ, USA, 2013; Volume 398. [Google Scholar]
- Freitas, C.O.A.; de Carvalho, J.M.; Oliveira, J.; Aires, S.B.K.; Sabourin, R. Confusion Matrix Disagreement for Multiple Classifiers. In Progress in Pattern Recognition, Image Analysis and Applications; Lecture Notes in Computer Science; Rueda, L., Mery, D., Kittler, J., Eds.; Springer: Berlin/Heidelberg, Germany, 2007; pp. 387–396. [Google Scholar] [CrossRef]
- Pedregosa, F.; Varoquaux, G.; Gramfort, A.; Michel, V.; Thirion, B.; Grisel, O.; Blondel, M.; Prettenhofer, P.; Weiss, R.; Dubourg, V.; et al. Scikit-learn: Machine Learning in Python. J. Mach. Learn. Res. 2011, 12, 2825–2830. [Google Scholar]
| Publisher’s Note: MDPI stays neutral with regard to jurisdictional claims in published maps and institutional affiliations. |
© 2020 by the authors. Licensee MDPI, Basel, Switzerland. This article is an open access article distributed under the terms and conditions of the Creative Commons Attribution (CC BY) license (http://creativecommons.org/licenses/by/4.0/).


 ,
, 


