
Comparison of iPad Pro®’s LiDAR and TrueDepth Capabilities with an Industrial 3D Scanning Solution


1
Fraunhofer Research Institution for Additive Manufacturing Technologies IAPT, 21029 Hamburg, Germany
2
School of Mechanical Engineering, Hamburg University of Technology TUHH, 21073 Hamburg, Germany
3
Institute of Laser and System Technologies, Hamburg University of Technology TUHH, 21073 Hamburg, Germany
*
Author to whom correspondence should be addressed.
Technologies 2021, 9(2), 25; https://0-doi-org.brum.beds.ac.uk/10.3390/technologies9020025
Submission received: 14 February 2021
/
Revised: 26 March 2021
/
Accepted: 3 April 2021
/
Published: 7 April 2021
Abstract
:Today’s smart devices come equipped with powerful hard- and software-enabling professional use cases. The latest hardware by Apple utilizes LiDAR and TrueDepth, which offer the capability of 3D scanning. Devices equipped with these camera systems allow manufacturers to obtain 3D data from their customers at low costs, which potentially enables time-efficient mass customization and product differentiation strategies. However, the utilization is limited by the scanning accuracy. To determine the potential application of LiDAR and TrueDepth as a 3D scanning solution, in this paper an evaluation was performed. For this purpose, different Lego bricks were scanned with the technologies and an industrial 3D scanner. The results were compared according to shape and position tolerances. Even though the industrial 3D scanner consistently delivered more accurate results, the accuracy of the smart device technologies may already be sufficient, depending on the application.
1. Introduction
To ensure the future competitiveness of manufacturing companies, it is necessary to face constantly changing customer requirements and market turbulence. Consequently, a shortening of the product development cycle is constantly pursued in order to adapt to the dynamic market efficiently and quickly [1]. Manufacturers today tend to adopt product differentiation strategies and more customer-centric approaches to remain competitive. Hence, mass customization and product diversification are one of the most commonly implemented business models. As part of the digital transformation and Industry 4.0, these objectives are being realized. Additive manufacturing technologies offer high potential for individualization at low cost in a short period of time [2]. Cost-effective and high-quality mass customization requires technological resources such as reverse engineering and 3D scanning. Currently, smartphones and tablets can be utilized as 3D scanners as well [3]. This lowers the entry barrier for both private users and industrial users to digitize objects. While the customer only needs to be provided with the hardware, the manufacturer can realize the product design by means of reverse engineering (RE). This means that the basic scanning can be performed by customers themselves so that the manufacturer can offer them a product tailored to their needs. An example for this is the business model of the company HEXR, which produces custom-fit bike helmets with additive manufacturing. In order to scan the shape of the customers’ heads, a smartphone application and a fitting cap are needed. The application uses the standard smartphone camera and the random texture of the fitting cap to model the shape of the head [4]. However, with LiDAR and TrueDepth technologies included in the newest devices by Apple, even more enhanced possibilities to digitize real objects are offered.
Ref. [5] defines the processes of designing, manufacturing, assembling and maintaining products and systems as engineering and divides it into two different types. While forward engineering implies the process of the approach from a highly abstracted idea to the physical implementation of a system, RE refers to already existing objects. Thereby, an existing part, subassembly or product without drawings and documentations is duplicated. Furthermore, RE is a process to obtain a 3-dimensional computer model from an existing object through measurements without consideration of functionalities. This process is also known as Computer Aided Reverse Engineering (CARE), which involves the steps of data collection, mesh construction and surface fitting [6]. For data collection, different hardware can be used, whereas mesh construction and surface fitting focus mainly on software solutions. The hardware is divided into noncontact and contact-based methods, which can be used for data acquisition [7].
When the highest scan accuracy is required, coordinate measuring machines (CMM) can be used. These are based on the principle of contact by measuring the surface to be tested with a probe. Due to the high precision manufacturing processes and built-in reference standards, CMMs provide the highest accuracy in inspection processes [6]. In addition, the results are independent of the reflection rate of a surface. Limited operating space is a point of emphasis because the object needs to be accessed and touched by the probe. The amount of contact points determines the accuracy. Therefore, the process can get time-consuming by inspecting complex structures as well as unknown shapes [6,7,8].
An alternative to this procedure is the noncontact method, in which no physical contact to the surface is needed. Noncontact methods are subdivided into different scan technologies including photogrammetry, structured light and Time of Flight (ToF). Those techniques are used by a variety of scanning systems with different capabilities and limitations [7,9]. Based on the field of application, it is important to select a suitable scanner that meets the requirements. Besides a relatively short processing time, noncontact 3D scanners cost much less compared to a CMM [8]. In addition, a high point cloud density of some 3D scanners can be used to measure complex and deep features with high accuracy. Thereby, the point density is defined by the quantity of emitted points and the obtained measured values. As a result, a higher point density provides more measured values for the same scan area [10]. Portable scanners are also becoming increasingly interesting for the manufacturing industry.
The scanning method Structured Light is based on the principle of triangulation, while incident laser lines are projected onto the object to be scanned. A common industrial 3D scanner is the Artec Space Spider, which uses structured light as scan technology. The Artec Space Spider uses a blue LED with a narrow wavelength, which allows better filtering of interference from ambient light [11]. From the narrowband of laser stripes with known angular width, many points of the stripe are reflected by the surface. These points are detected by a charge-coupled device (CCD) sensor and transformed to 3D coordinates via the triangulation principle [8]. In total, the Artec Space Spider uses three cameras at various angles and depths. In the center of the device, an RGB camera is installed surrounded by LED flash light to capture textures without the need for special light setup. Thereby the Artec Space Spider is advertised with a pinpoint accuracy of 0.05 mm and 3D resolution of 0.1 mm [11].
Recent developments of commercial devices such as smartphones and tablets have shown that in addition to photogrammetry, scanning is also feasible with LiDAR (light detection and ranging) and TrueDepth. LiDAR includes ToF measurements, which determine the time it takes for an object, particle or wave to travel a distance. Therefore, LiDAR emits a pulse or modulated light signal and measures the time difference in the returning wavefront [12]. TrueDepth uses vertical-cavity surface-emitting laser (VCSEL) technology and consists of a traditional camera, an infrared camera, a proximity sensor and a dot projector as well as a flood illuminator. The system is named and patented by Apple. The dot projector emits more than 30,000 points of infrared light, which are reflected on the surfaces. Consequently, the infrared camera picks up these light dots again and the pattern is analyzed by software to create a depth map. Using this depth map, a mathematical model is generated by machine learning algorithms [9,13,14,15].
In iOS, the operating system of Apple’s smartphones and tablets, TrueDepth is mainly used for 3D face authentication and recognition, while LiDAR enables new features for Augmented Reality by accelerating plane detection. To scan objects, it is therefore necessary to install an additional application. Heges is such an iOS application that exploits TrueDepth and LiDAR. The authors of [16] evaluated different smartphone applications, showing that Heges has one of the finest 3D resolutions (0.5 mm). The application can be used to scan objects and export scans as STL and polygon (PLY) files, while colors can also be captured. In contrast to other applications, Heges is also not limited to scan faces only. In addition, a screen sharing function facilitates scanning, and a one-time payment allows unlimited export of these scan files [16]. Apple itself does not specify the accuracy of the respective technologies or hardware.
While the hardware and the software of the device determine the scan accuracy internally, there are also external factors influencing scan quality. A literature research has shown that factors are reflectance, shape and color of the object as well as surface texture and ambient lightning. In addition, the distance between object and scanner, scanning strategy and scanning movements influences scan quality [7,8,9,17]. During post-processing, the meshing and surface fitting have also shown influences [17]. Depending on the scan accuracy, different fields of applications can be exploited.
To determine the potential use of LiDAR and TrueDepth included in the recent iPad Pro and iPhone 12 Pro lineup as a 3D scanner, this study was conducted. For the evaluation, an iPad Pro (2020) [3] was used and was compared to the industrial Artec Space Spider Handheld 3D Scanner [11]. Therefore, different Lego bricks were scanned and compared via the software GOM Inspect. The aim of this study was to determine the scan accuracy of LiDAR and TrueDepth as 3D scanning technique.
2. Materials and Methods
The procedure of this study is shown in Figure 1 and can be divided into three steps:
- (1)
- Scanning
- (2)
- Measurement
- (3)
- Comparison
2.1. Scanning
The first step is to scan an object. Thereby, it is important to control the factors that influence the scan quality and only modify the factors that should be analyzed. In this study, the factors to be analyzed are the influence of different colors and shape tolerances. The following influencing factors were determined and kept constant by the choice of experiment:
- Material-specific reflectance: all objects are made from the same material
- Surface texture of the underground: constant
- Scanner distance: constant with 300 mm
- Scanning angle: constant with 65°
- Lighting conditions: scanner placed identically in the same environment
- Scanning speed: one rotation of the object per minute
- Relative movements: no movement of the scanning devices
- Post-processing (point cloud, spline, surface model,): same
- Software settings (resolution etc.): same settings
Hence Lego bricks, produced within a tolerance of 10 µm, are suitable for the following research due to high manufacturing accuracy and differences in shape and color [18]. According to the shape tolerances—straightness, flatness, roundness and cylindricity—bricks were selected for the examination as shown in Table 1. Besides the shape, the profile will be evaluated by comparing a profile of a surface, profile of a line and the position of features in relation to the real object. Additionally, the colors white, orange, red, green, black and turquoise were chosen for the investigation of color impact.
To control influencing factors, the following setup was chosen: one object was placed on a rotary table with an irregular surface texture, which increases the object tracking due to the high-contrast color design. Radially the scanning devices were stationary-mounted with a constant distance of 300 mm to the middle of the table (object). To control the scanning speed, the table, including the irregular surface texture and the object, was rotated one full rotation per minute. One scanner was activated for one minute scanning the object in 360°. After a scan, the process was repeated analogously with the next scanning technology before the next object was placed. This ensured that the placement of the Lego brick was always the same for each scan technology and each scanning session. In total, each object was scanned by each scan technology three times. All three sensors were aligned so that a scan angle of 65° was set with respect to the surface. For TrueDepth, the iPad was laid flat on its display on a stand, because it is a front-facing sensor. In addition, the device had to be rotated 180°.
To ensure the same post-processing, the automatic meshing in Artec Studio 15 was used every time. For the scans with Heges, the files were exported as stereolithography files (*.STL) and cleaned in MeshLab the same way.
2.2. Measurement
The digital microscope Keyence VHX-5000 was used to obtain the actual geometry of an object using the optical metrology with 200× magnification. Based on those measurements, the bricks were reconstructed in Autodesk Inventor 2020 and saved as inventor part files (*.ipt). The scanned meshes and designed components were imported in GOM Inspect Suite 2020. This Software offers a wide range of inspection tools with high accuracy and a low standard deviation, as tests performed by [21] showed.
2.3. Comparison
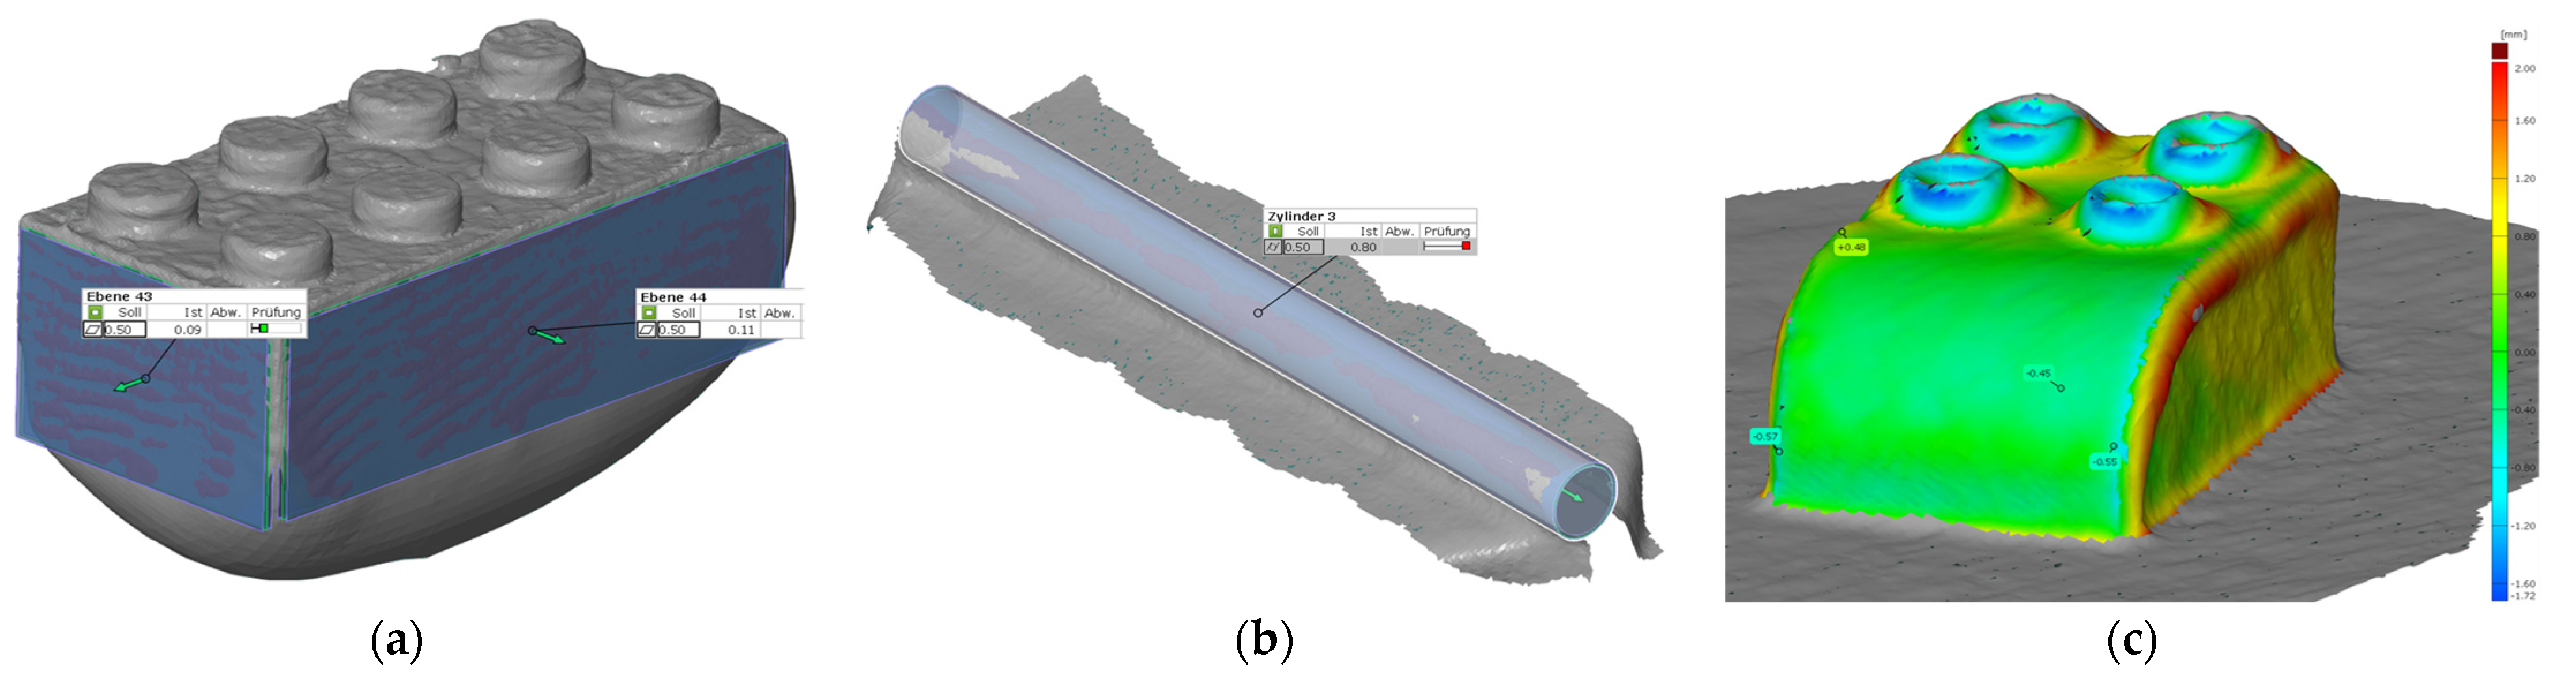
The generated meshes were examined for deviations in mm as absolute values as shown in Figure 2. While the color influence was investigated by a flatness test (a), shape tolerances were examined with inspection tools from GOM Inspect (b). In this analysis no relation between features was considered. To compare the size, form and orientation of scanned surfaces based on datum references, a target-actual comparison was established (c). Therefore, the scanned Lego bricks were aligned with the reconstructed one in GOM Inspect. Then, the deviation between the scanned mesh to the constructed part was determined. For the profile of a line the edge of a curved surface was used.
3. Results
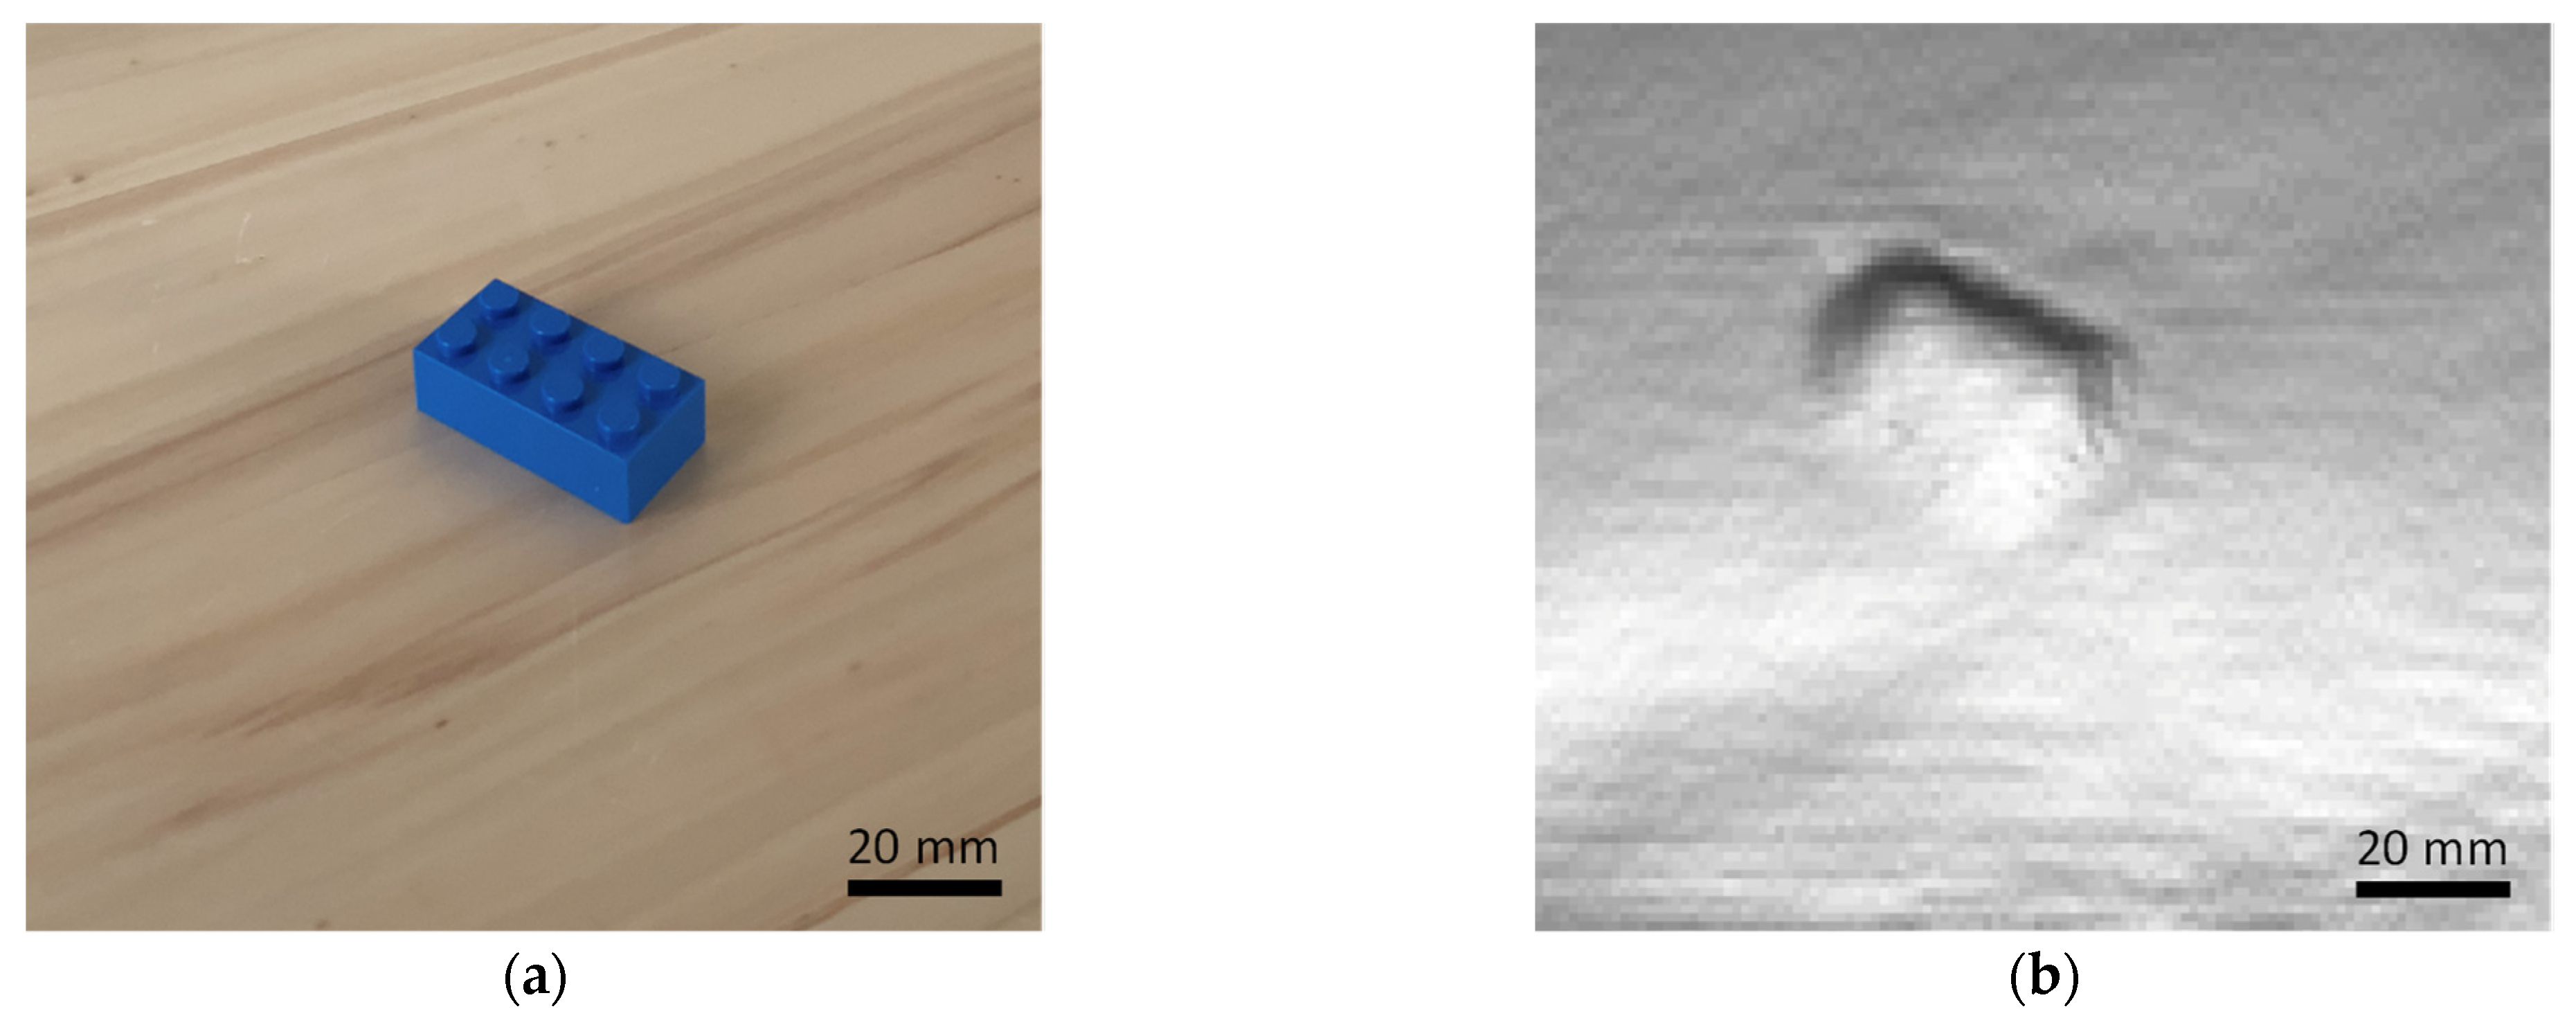
Table A1, Table A2, Table A3, Table A4, Table A5 and Table A6 (in Appendix A) list the determined values, whereby the data are subdivided according to factors and scanning technologies. Furthermore, the tables lists the three determined values, the mean and standard deviation as well as the variance. It was found that LiDAR as a scanning technique on the iPad Pro was not applicable for scanning small objects such as a Lego brick. Figure 3 shows that the generated mesh was not accurate enough for an evaluation. Consequently, the LiDAR scanning technique was not listed in the following results.
3.1. Impact of Color
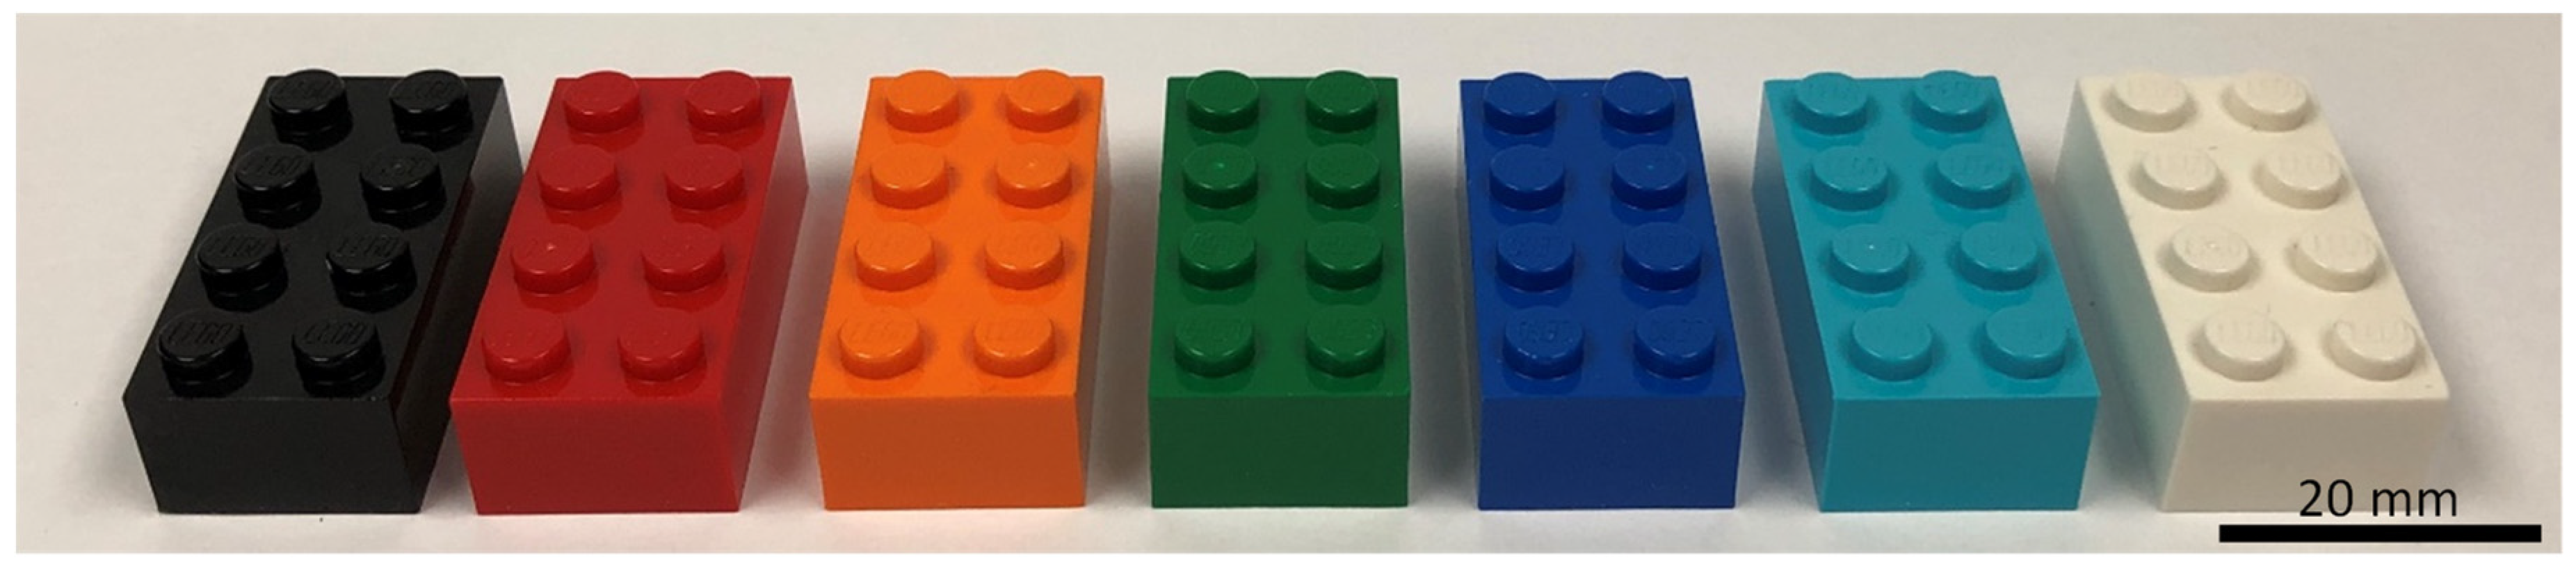
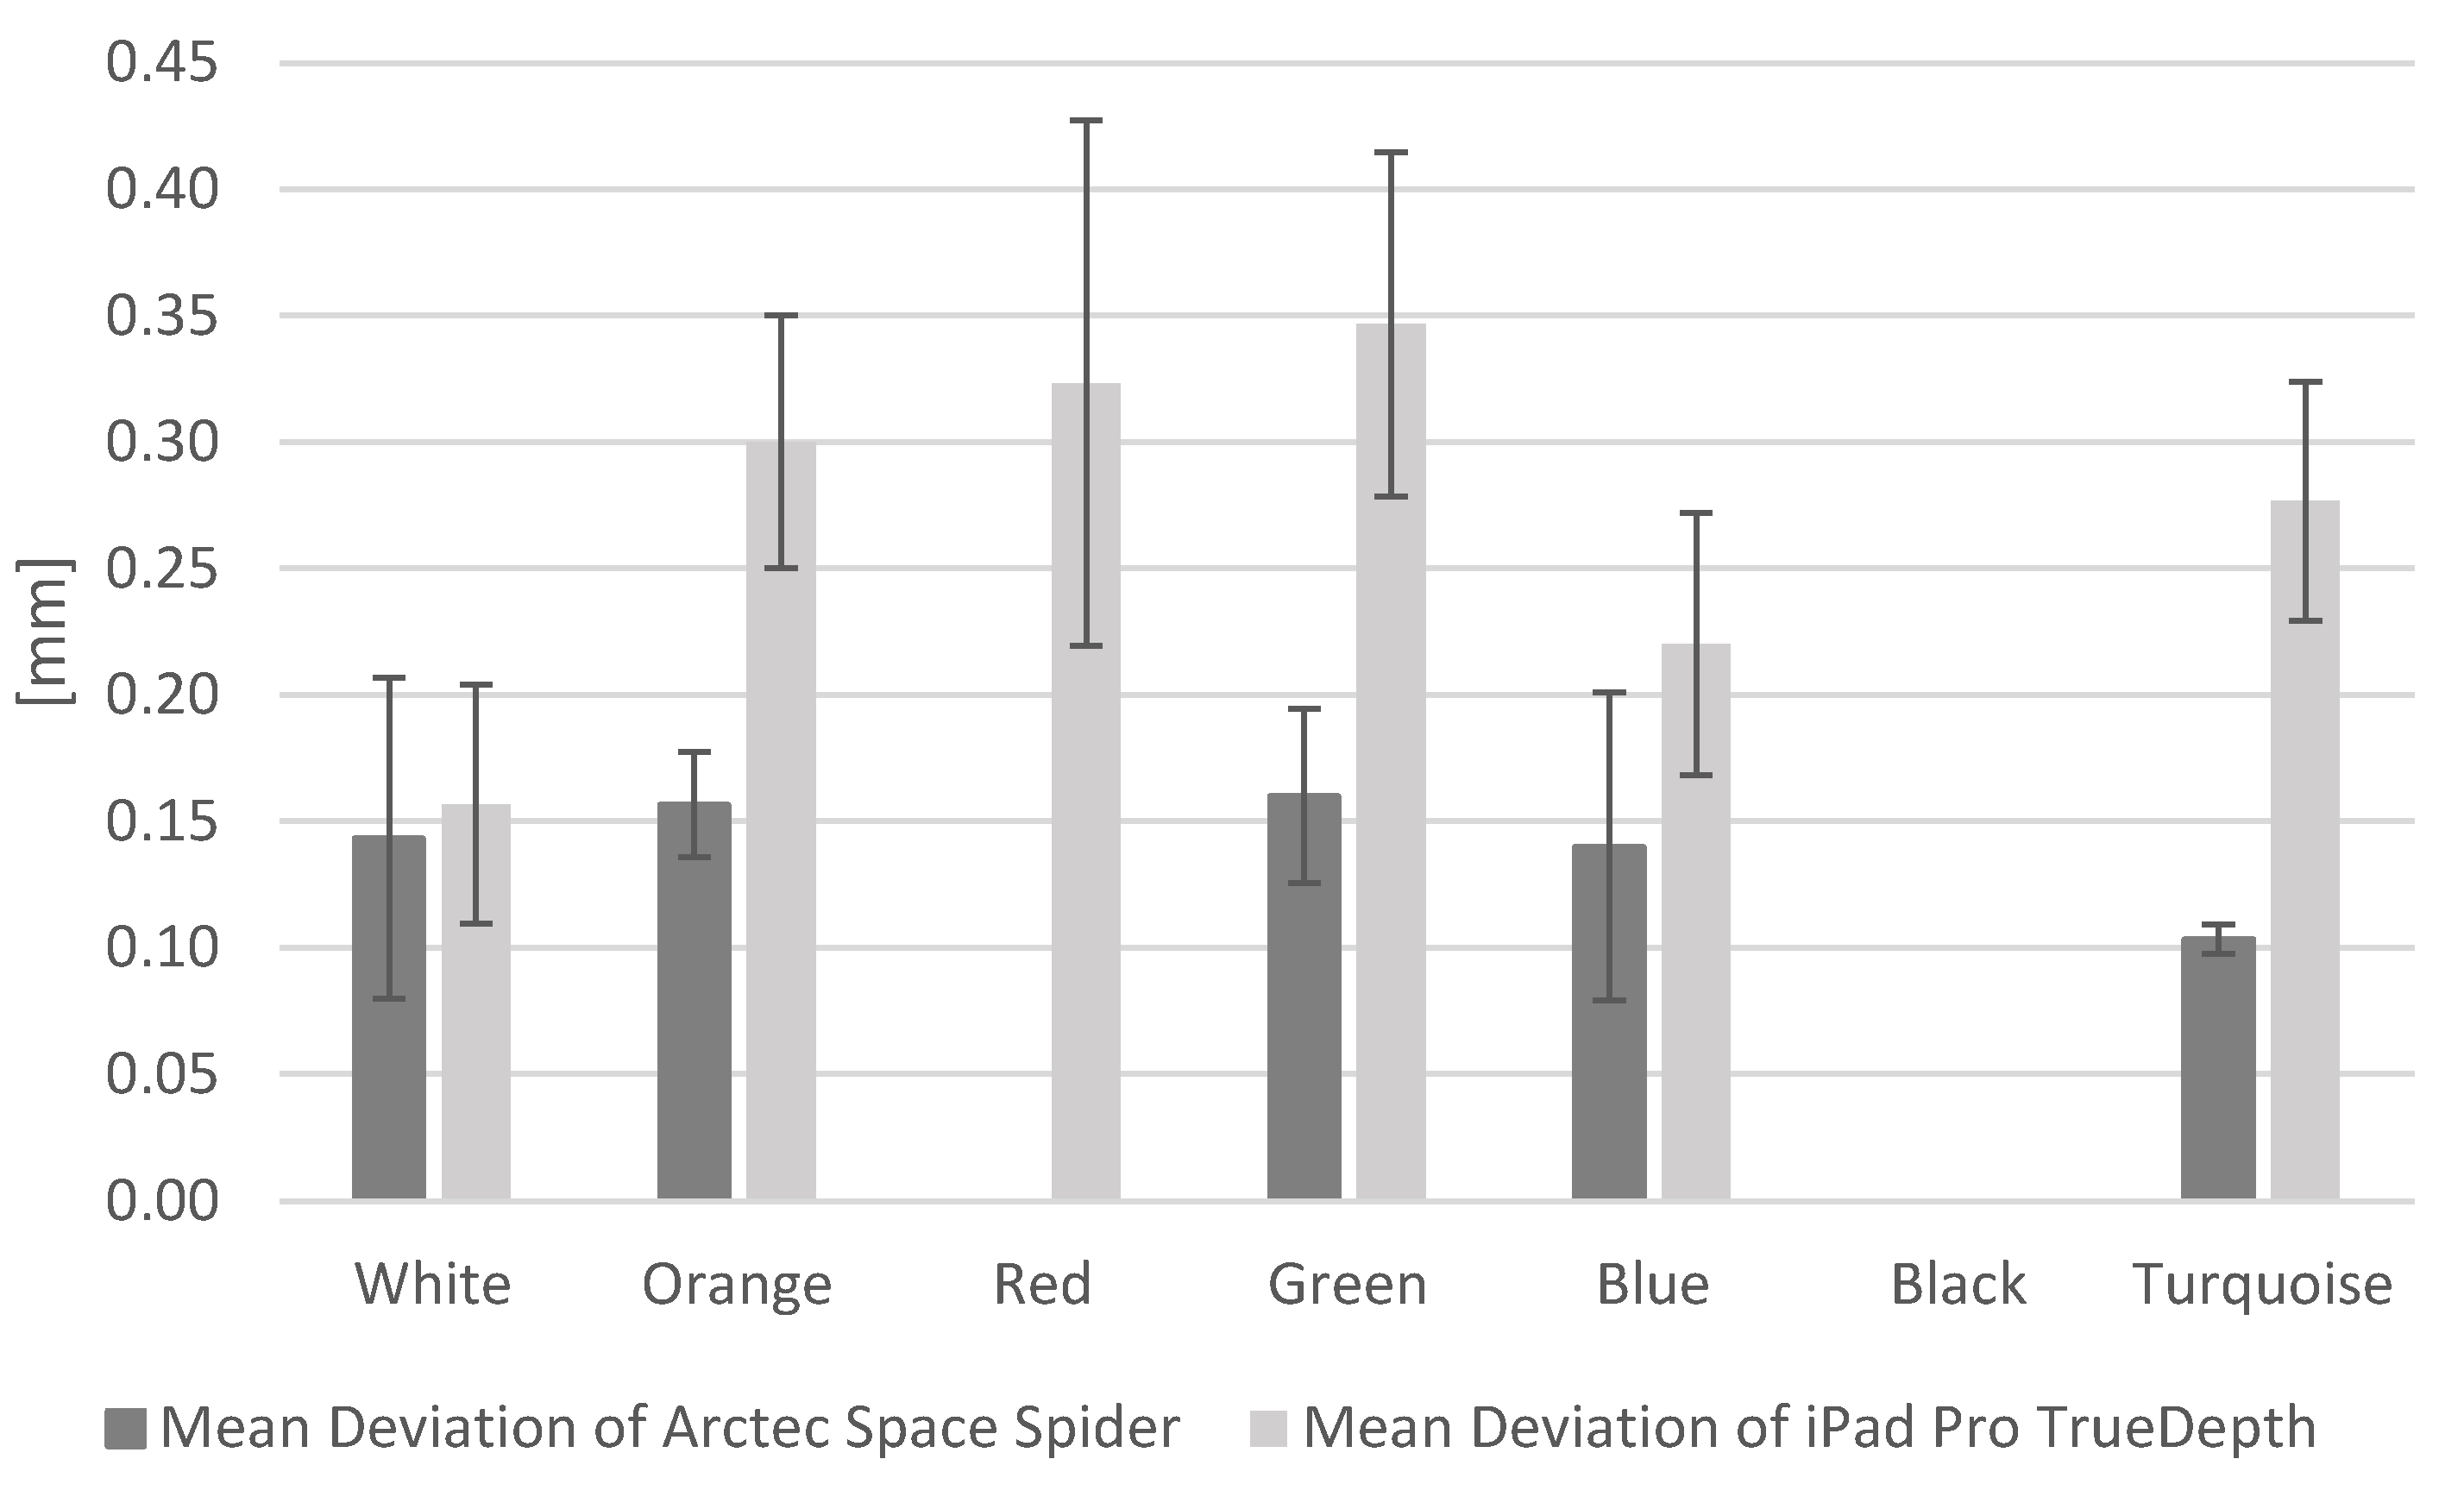
The first factor to be modified is the color provided by seven different-colored Lego bricks, which are shown in Figure 4. Under both scan techniques, the white, blue, and turquoise Lego bricks were scanned with the highest flatness represented by the smallest deviations. The smallest deviation between the two scanning techniques was shown by the white brick.
The results of the experiment are shown in Figure 5. Thereby, the average deviation of 0.14 mm (Artec Space Spider) was very similar to 0.16 mm (TrueDepth). In contrast, the green and red Lego brick using TrueDepth showed the greatest deviations with 0.35 mm and 0.32 mm. Using the Artec Space Spider and the iPad Pro TrueDepth camera, it was not possible to track or scan the black Lego brick. The red Lego brick could also not be scanned with the Artec Space Spider but with TrueDepth, where the highest standard deviation of 0.104 mm was obtained. In all three cases, the Lego brick was not even displayed on the screen, making scanning impossible. The data obtained can be found in Table A1 and Table A2 in Appendix A.
3.2. Scanning Accuracy
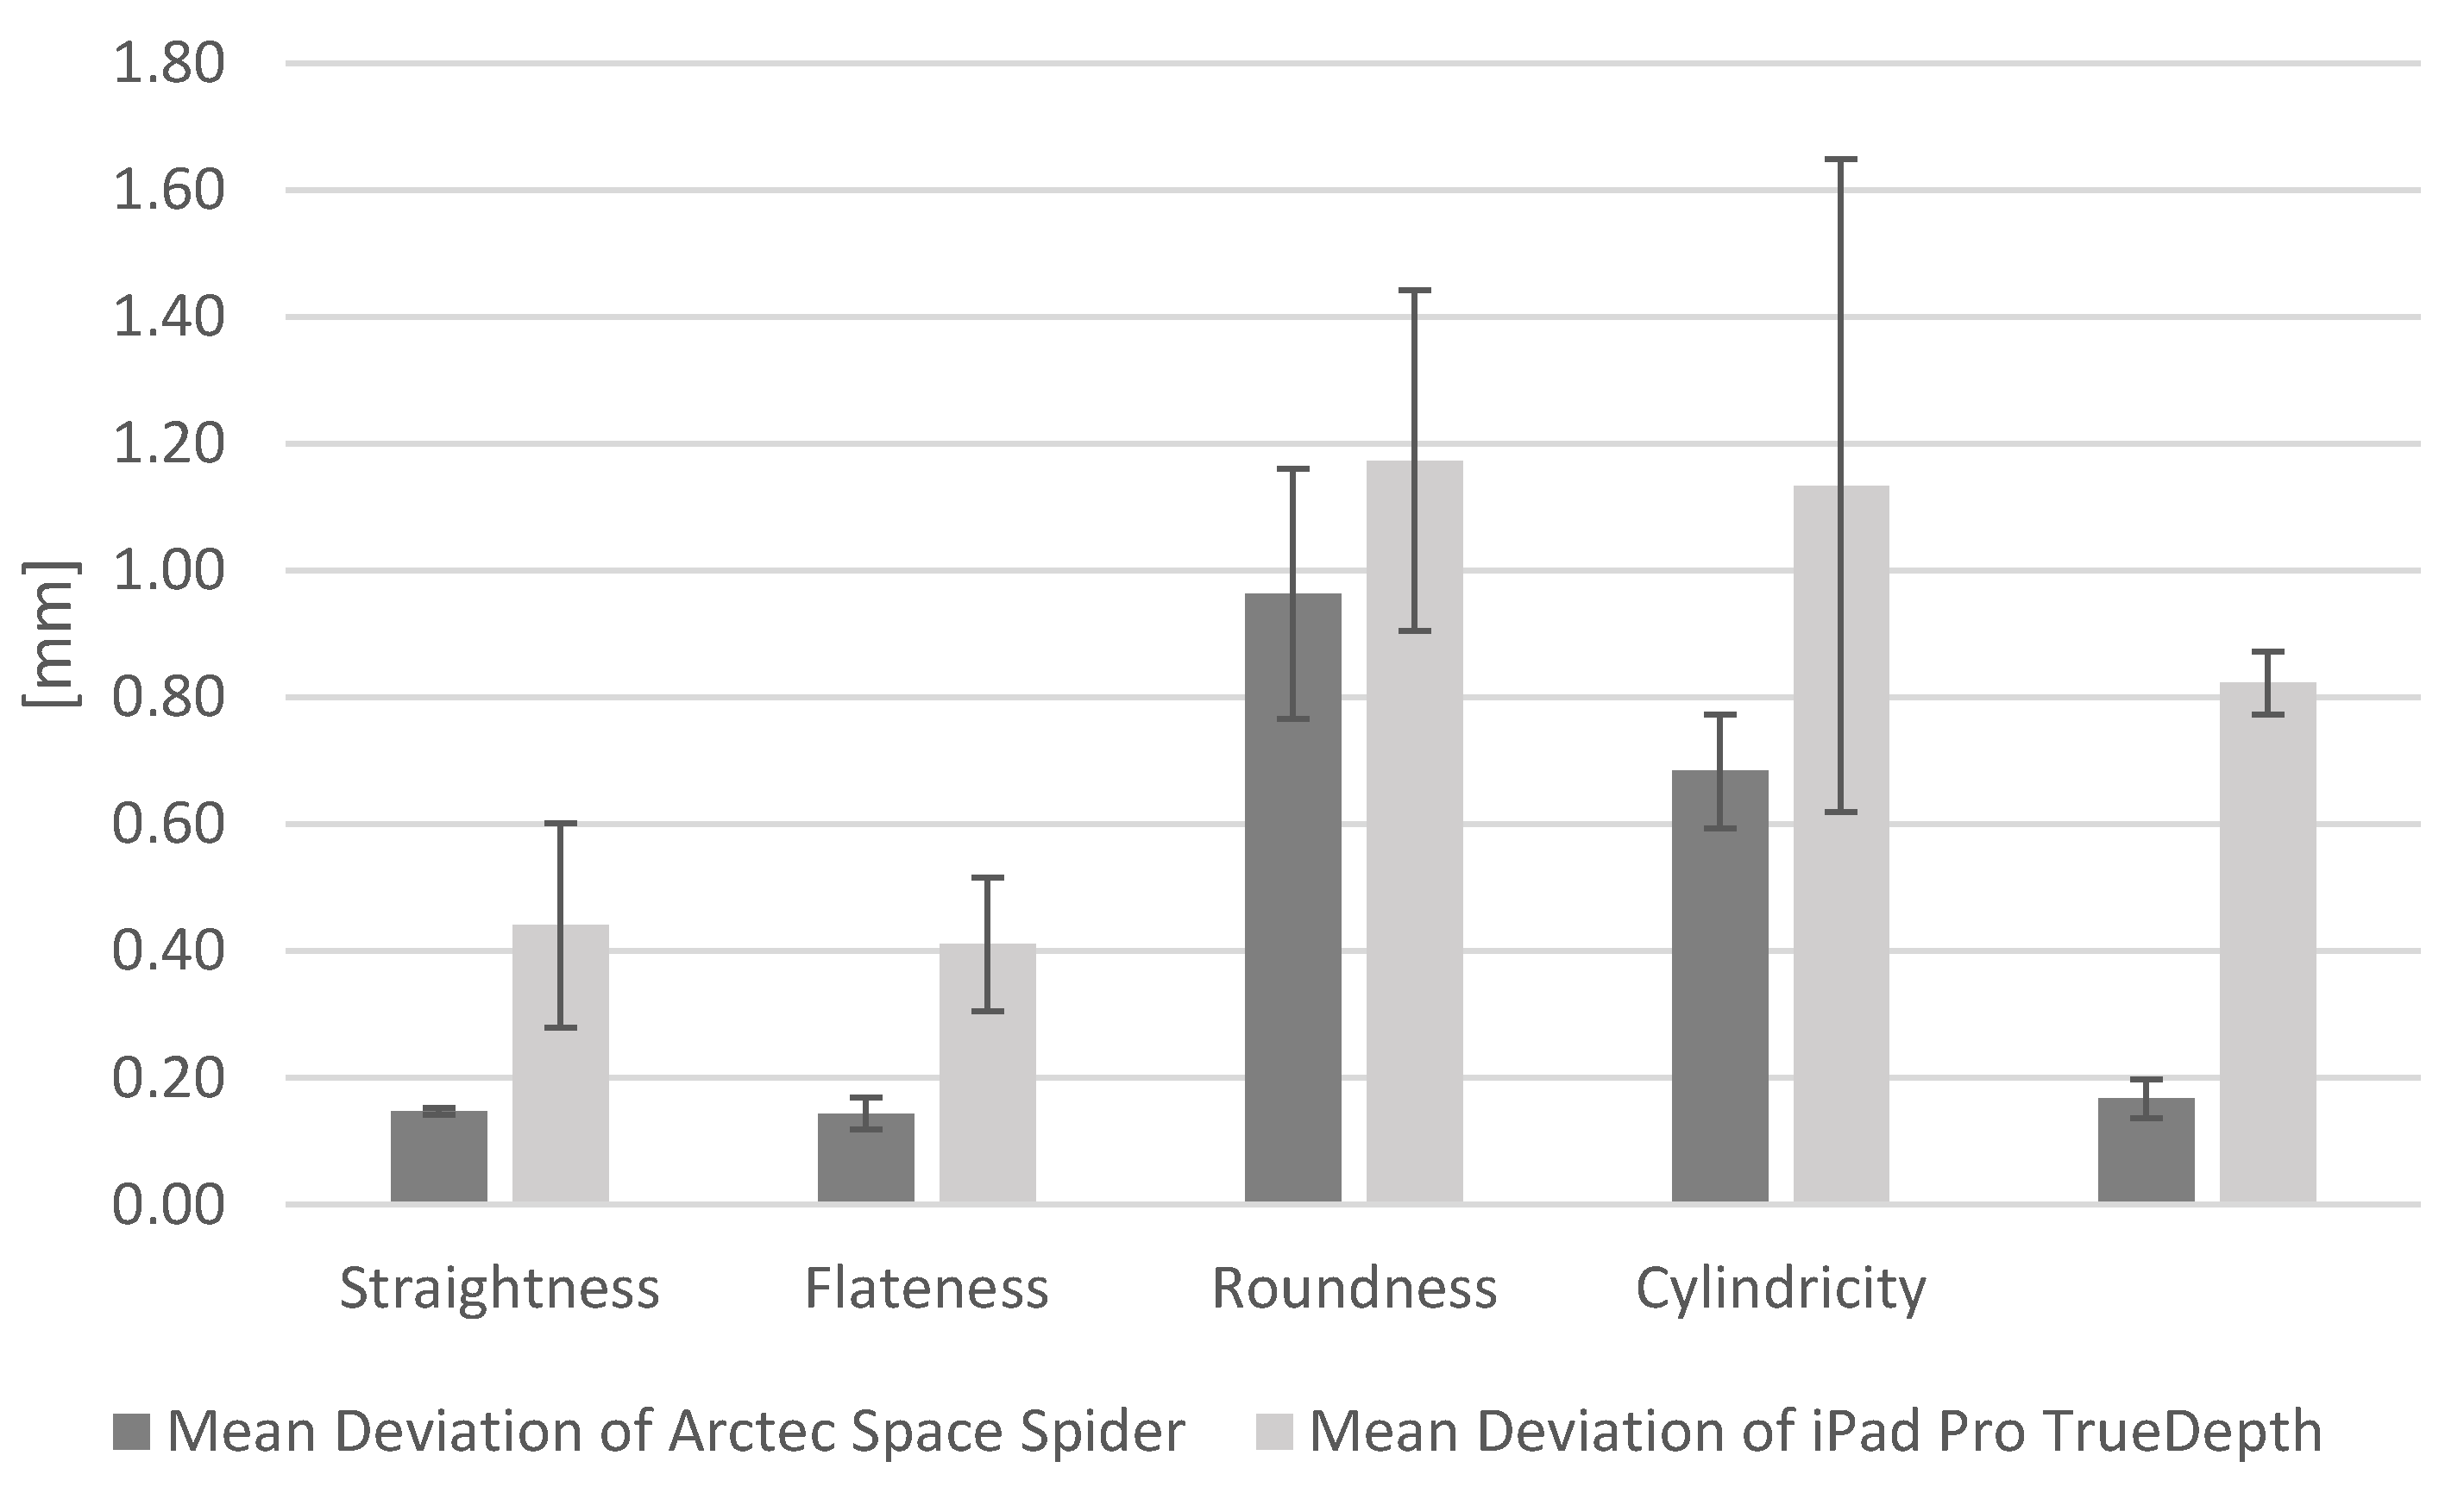
The scanning accuracy was determined in two different ways as summarized in Figure 6 and Figure 7. Figure 6 provides the results of shape tolerances, while Figure 7 shows the results of the target-actual comparison. Objects scanned by the Artec Space Spider showed similar accuracy in straightness (0.15 mm in average), flatness (0.14 mm in average), and cylindricity (0.17 mm in average), whereby roundness had much greater deviations (0.96 mm in average). The best results using TrueDepth were achieved in straightness (0.44 mm in average) and flatness (0.41 mm in average), and the highest deviations in cylindricity (0.82 mm in average) and roundness (1.17 mm in average). The standard deviation varied from 0.006 mm to 0.197 mm for the Artec Space Spider and 0.049 mm to 0.268 mm for TrueDepth. The data obtained can be found in Table A3 and Table A4 in Appendix A.
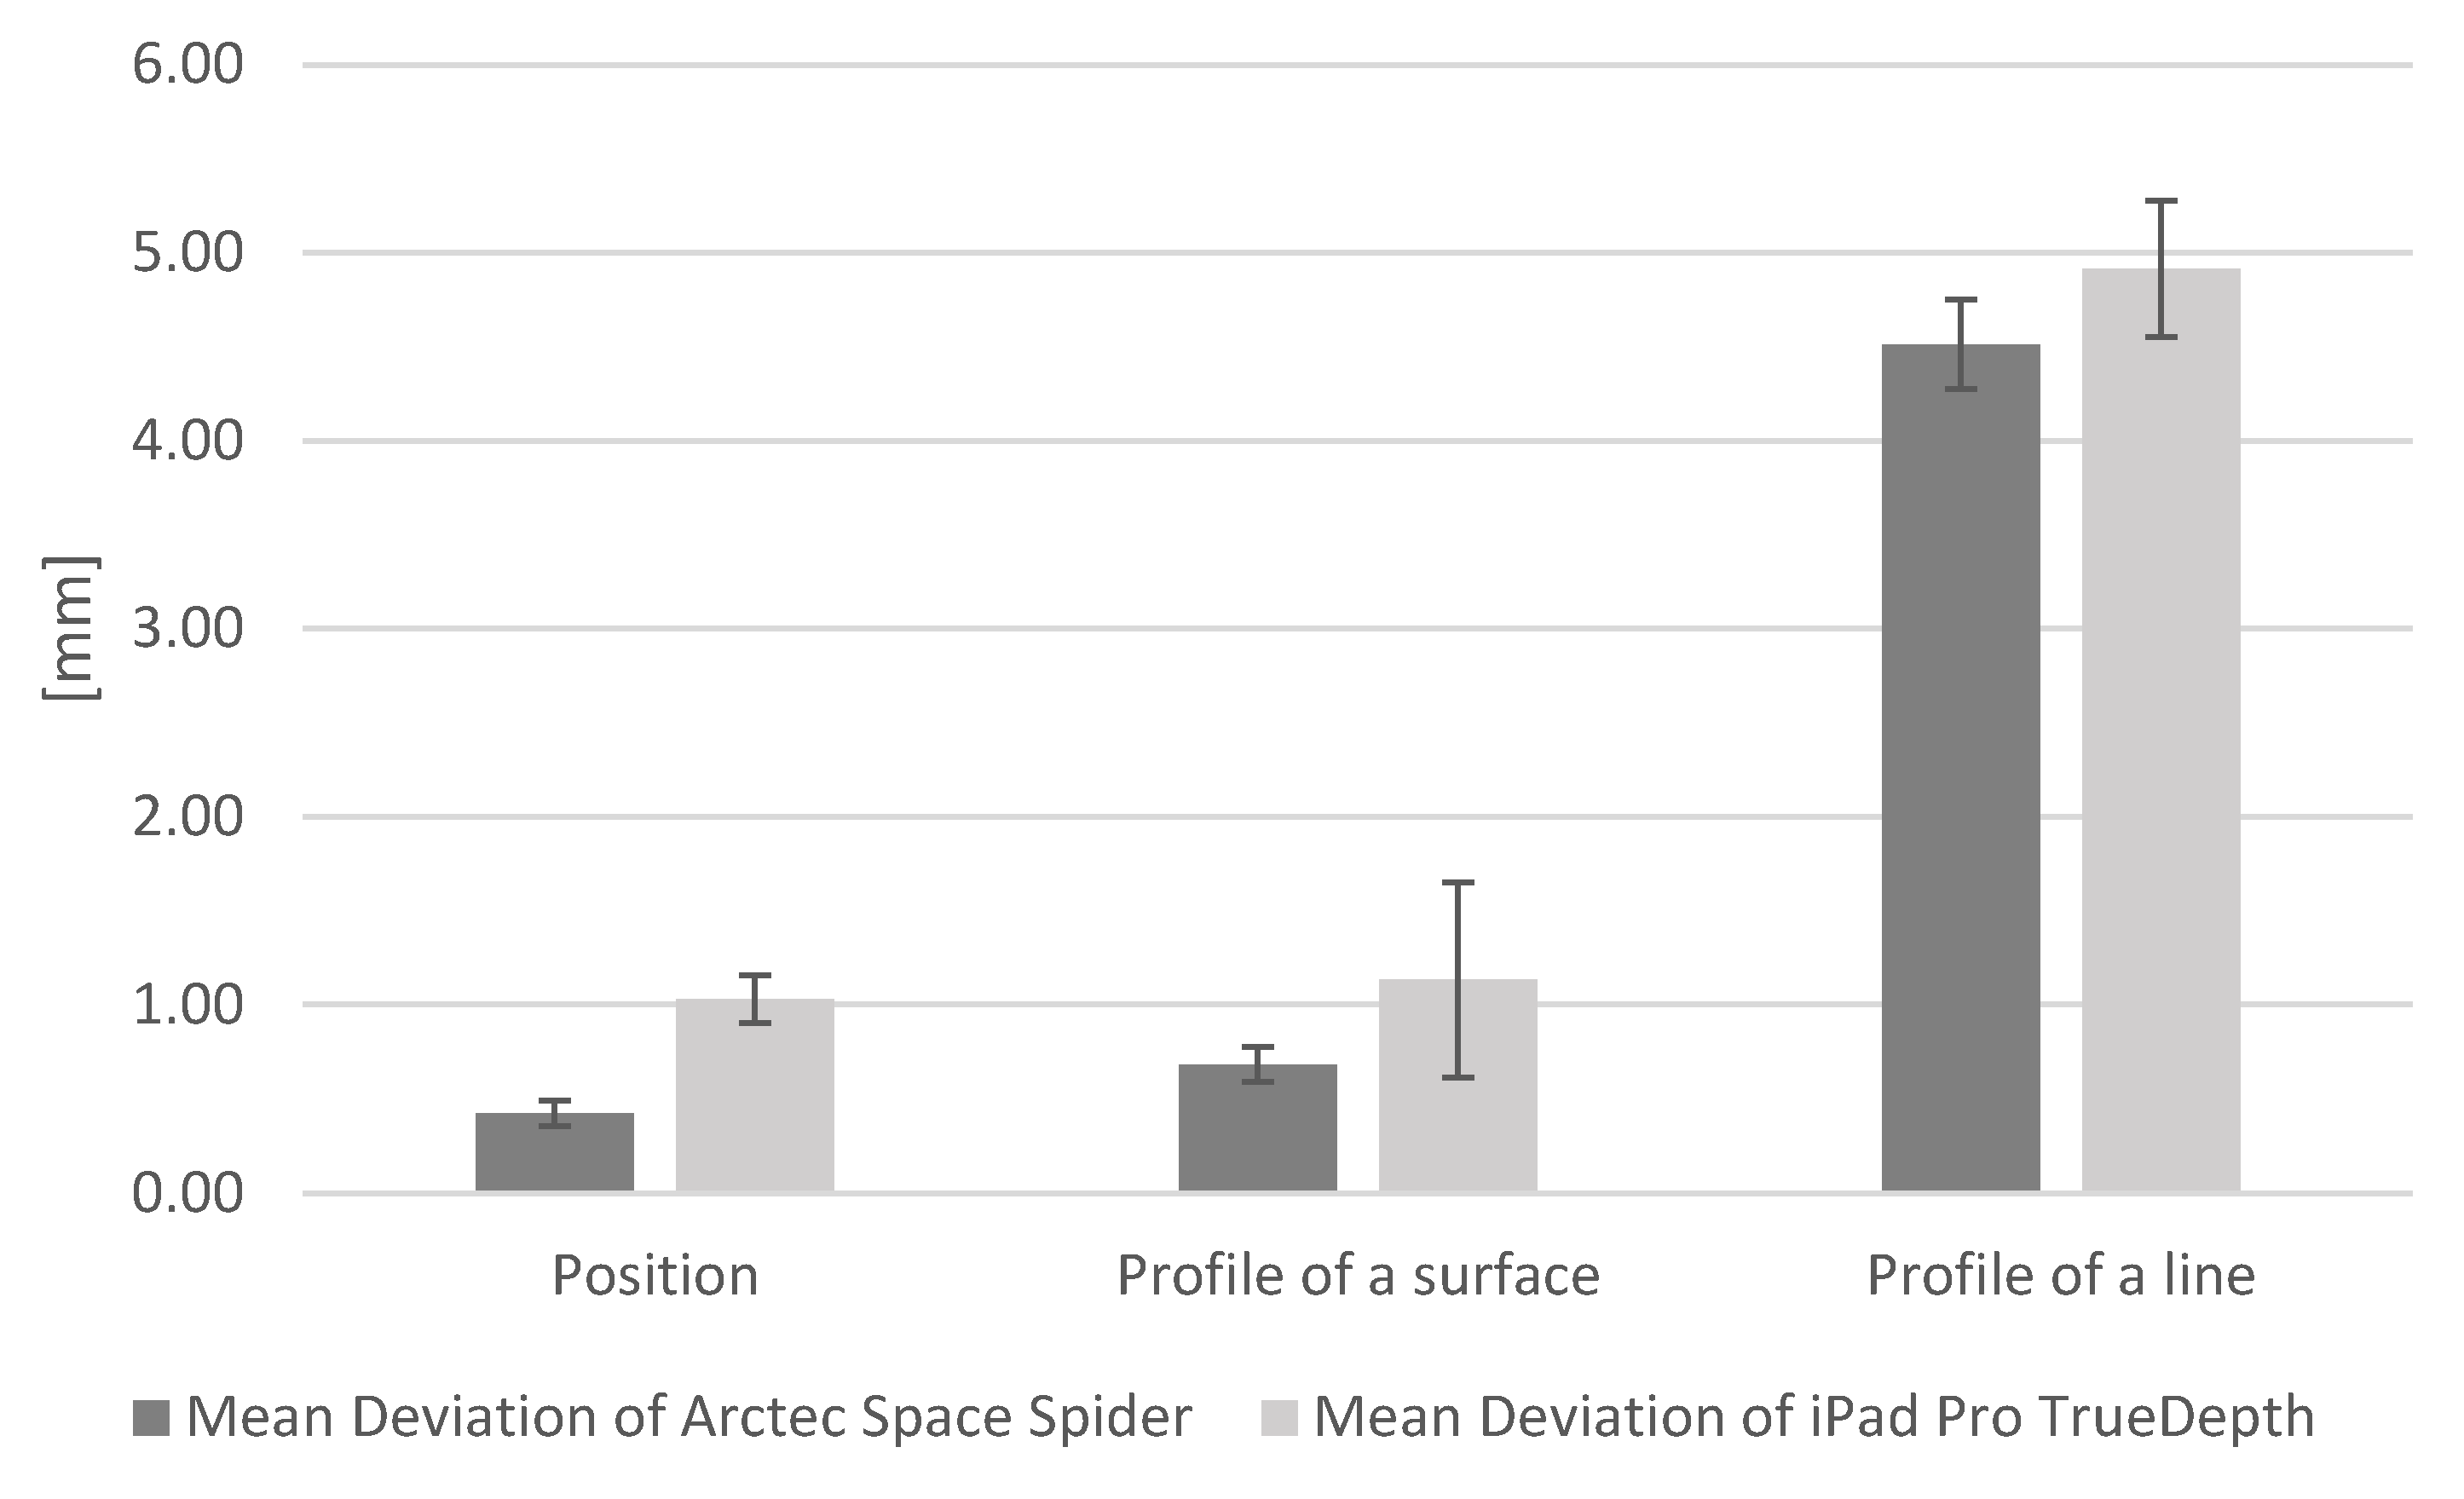
During the evaluation of the target-actual performance comparison, the geometric characteristic position showed the smallest deviations. However, the results of the TrueDepth scans (1.03 mm in average) were more than twice as high as those of the Artec Space Spider (0.43 mm in average), as shown in Figure 7. When scanning a profile of a surface, a mesh with higher deviations was generated (0.68 mm in average for Artec Space Spider and 1.13 mm in average for iPad Pro). Nevertheless, the highest overall values of deviations were determined during the examination based on the profile of a line (4.51 mm in average for Artec Space Spider and 4.92 mm in average for iPad Pro). The data obtained can be found in Table A5 and Table A6 in Appendix A.
4. Discussion
In this study, an iPad Pro (2020) was used as a 3D scanner to evaluate the accuracy of the built-in LiDAR and TrueDepth technologies in comparison to an industrial 3D scanning system. Therefore, Heges was chosen as the application offering one of the finest scan resolutions (0.5 mm). As scan objects, Lego bricks of different shapes were used. By scanning the same objects simultaneously with the industrial 3D scanner Artec Space Spider, the results were then analyzed and compared in GOM Inspect.
Based on a literature research, there are different kinds of measuring methods, presenting processes to determine the scanning accuracy [7,8,9,17]. The VDI 2634, for instance, defines a process for the verification of optical 3D measuring systems. However, this method is for 3D scanners using triangulation, whereas LiDAR is based on ToF and TrueDepth on VCSEL technology. Since there is no official method to determine the scanning accuracy, this study evaluates the scanning accuracy due to shape tolerances.
The LiDAR technology proved to be impractical for scanning small objects such as Lego bricks. For this reason, no results could be obtained to determine the accuracy. LiDAR is based on the ToF technique, which makes it possible to measure the time differential in the returning wavefront independently of scene textures. Therefore, full frame real-time depth estimates are possible [12]. In addition, the data are contaminated with random systematic measurement errors. A method for improving the depth map is superresolution. Therefore, a high-resolution RGB camera is combined with a depth camera. An algorithm is used to combine those two images [12,15]. So far (iOS 14), Apple does not provide the raw LiDAR depth data for additional applications on an iOS device. Instead, the LiDAR depth data is merged with the accompanying color (RGB) data using AI to create a depth map. Furthermore, the mesh of the depth map consists of coarse meshed triangles. In effect, LiDAR might be used to assist Augmented Reality or to scan large objects, for example, rooms, but it is not applicable to scan small objects such as Lego bricks. The depth image detected with TrueDepth shows a much finer mesh. Thereby, the dots of the infrared pattern are more closely arranged with each other than emitted dots with LiDAR are. As a result, TrueDepth is much more suitable for scanning small objects.
4.1. Impact of Color
By evaluating the flatness of different-colored Lego bricks, it can be demonstrated that color has an influence on the surface quality of the generated CAD models, using TrueDepth and the Artec Space Spider. In total, the objects scanned via TrueDepth show less accurate surfaces than objects scanned by the industrial scanner. However, no measurement exceeds the set accuracy of 0.5 mm in the application. Thus, the results are satisfying. Nevertheless, it is important to include the influencing factor color when high-precision scans are required. Black-colored surfaces, for example, were not able to be scanned. Black objects absorb visible light, but in the near infrared from about 1 μm it reflects the radiation. The TrueDepth camera uses infrared sensors that capture light in the wavelength range of 800 nm to 1300 nm to achieve pattern-based depth mapping. Therefore, the black object absorbs and reflects a high proportion of infrared emitted by TrueDepth and the object cannot be scanned. The same applies to the Artec Space Spider, whose blue structured light pattern is absorbed. In addition, the red brick showed the highest deviation of 0.044 mm scanned by TrueDepth, while the Artec Space Spider was not even able to track the object at all. Due to the blue light LED illumination of the Artec Space Spider, red is not visible for the scanner because the light gets highly absorbed. At the same time. the highest standard deviation of 0.104 mm was achieved by scanning the red brick with the TrueDepth technology.
This case shows how much influence disturbances can have. Disturbance variables could be environmental, which have not been eliminated yet, or the post-process could have a large influence. Thus, further experiments could show the influence of meshing and surface fitting. When scanning dark surfaces, antiglare spray or ambient light might improve the scan quality [7,8]. Since the blue and white objects obtained the highest accuracy with both scan technologies, those colors were chosen to determine the scanning accuracy.
4.2. Scanning Accuracy
The scanning accuracy determines the potential use of a 3D scanner and thus fields of applications. In order to make a generally valid statement about the scan accuracy of arbitrarily formed objects, shape tolerances were evaluated.
Although the objects scanned by Artec Space Spider showed small deviations for straightness, flatness and cylindricity, these shape tolerances have a great influence on the scanning accuracy with TrueDepth. When considering straightness and flatness, four of six measurements had deviations of more than 0.5 mm. In fact, the set parameter of 0.5 mm accuracy was therefore not fulfilled. However, the high standard deviation of 0.161 mm (straightness) and 0.105 mm (flatness) showed the potential of more accurate CAD models. Thereby, it was observed that both the scan strategy and the scan movements can lead to much more accurate results. For example, it was found that two rotations of the scanned object actually improved the scanning accuracy. In comparison to the Artec Space Spider one can assume that hardware and software are further developed by producing more repeatable results. In fact, this can be observed by evaluating cylindricity. When using TrueDepth, the live stream of capturing the Lego brick geometry showed that the object was lost and was captured again several times during one scan. This led to greater deviations of the generated mesh. Analogously, the same effect can be observed when testing roundness. Thereby, the Artec Space Spider showed greater deviations as well.
Even though the CAD models have certain shape tolerances, the accuracy of the size, form, and orientation were not verified. Therefore, the target-actual comparison has to be analyzed. Especially in this analysis, the highest deviations were found. Considering the position and profile of a surface, the ratio of deviations between the Artec Space Spider and TrueDepth showed similar behavior. The scans taken with TrueDepth were almost twice as high as those of the Artec Space Spider. It is worth mentioning that the most accurate CAD model generated by Heges had a more accurate surface than the CAD model of Artec Space Spider. Notable were deviations of 4.51 mm (Artec Space Spider) and 4.92 mm (TrueDepth) in average by inspecting the profile of a line. However, the highest deviations were formed by small deviating areas. Also, in those cases the standard deviations were very high leading to the conclusion that more accurate scans can be achieved.
5. Conclusions
Manufacturers today tend to adopt product differentiation strategies and more customer-centric approaches to ensure future competitiveness. Mass customization and product diversification are key parts of these trends that require new hardware and software solutions. In this context, RE provides a method to individualize a product in a cost- and time-efficient way. In this case, the customer must be provided with hardware for 3D scanning. The LiDAR and TrueDepth technologies included in the newest devices by Apple offer such a deployment. However, the scanning accuracy determines the potential application and possible use cases. In this work, we have highlighted the potential of a smartphone and tablet as a cost-efficient 3D scanner. Additionally, we have pointed out influencing factors during 3D scanning. Based on the color influence as well as shape and position tolerances, we evaluated the scanning accuracy of an iPad Pro with the LiDAR and TrueDepth camera and compared it with an industrial 3D scanner, the Artec Space Spider. In principle, the industrial scanner should still be preferred if it is available. The advantage of smart devices, however, is that they are widely distributed among potential customers. Although scanned objects obtained with the iPad Pro had higher deviations than objects scanned by the Artec Space Spider, the iPad Pro offers a way to scan at lower costs. However, certain color ranges do not pick up well. Specifically, black tends to be filtered out. Use of a coating can mitigate this. In a scenario in which a customer is preparing the scans, this seems to be impractical, though. Depending on the use case, it must be evaluated whether the scanning accuracy of an iPad Pro meets the requirements. In addition, more accurate CAD models can be achieved through a specific and adaptive scanning strategy. In addition, asymmetric and detailed objects can lead to more accurate CAD models. Due to the fact that the TrueDepth sensor is front-facing, it is currently suitable for scanning objects only to a limited extent. Scanning objects is made difficult due to the location of the sensor and the handling required as a result. Instead, it can be used to design products that are tailored to the customer’s head, for example. The integrated LiDAR scanner would provide a way out. However, the available accuracy is not yet sufficient for the manufacturing of customized products due to the low mesh resolution. A new iteration of integrated sensor technology or a software update granting more access to developers may provide a remedy here. Future work will show how the technologies perform under different lighting conditions and how different scan strategies or scan times affect the accuracy.
Author Contributions
Conceptualization, M.V. and A.R.; methodology, M.V.; validation, A.R. and M.V.; formal analysis, A.R.; investigation, M.V. and A.R.; resources, C.E.; data curation, A.R.; writing—original draft preparation, M.V. and A.R.; writing—review and editing, M.V.; visualization, M.V. and A.R.; supervision, C.E.; project administration, M.V.; funding acquisition, C.E. All authors have read and agreed to the published version of the manuscript.
Funding
This research received no external funding.
Institutional Review Board Statement
Not applicable.
Informed Consent Statement
Not applicable.
Data Availability Statement
Data sharing not applicable. Information provided by Marek Simonik (Developer Heges) is contained within this article.
Acknowledgments
Many thanks are given to Marek Simonik, developer of the Heges iOS application. He provided us with detailed information on the functionality of his application and the limitations of software and hardware.
Conflicts of Interest
The authors declare no conflict of interest.
Appendix A

Table A1.
Determined flatness values of seven different colored Lego bricks scanned by Artec Space Spider.
Table A1.
Determined flatness values of seven different colored Lego bricks scanned by Artec Space Spider.
| Artec Space Spider with Blue Light Technology 1 | ||||||
|---|---|---|---|---|---|---|
| Brick Color | Value 1 | Value 2 | Value 3 | Mean | Standard Deviation | Variance |
| White | 0.18 | 0.07 | 0.18 | 0.14 | 0.064 | 0.004 |
| Orange | 0.14 | 0.15 | 0.18 | 0.16 | 0.021 | 0.000 |
| Red | N/A 2 | N/A 2 | N/A 2 | - | - | - |
| Green | 0.14 | 0.20 | 0.14 | 0.16 | 0.035 | 0.001 |
| Blue | 0.21 | 0.11 | 0.10 | 0.14 | 0.061 | 0.004 |
| Black | N/A 2 | N/A 2 | N/A 2 | - | - | - |
| Turquoise | 0.10 | 0.11 | 0.10 | 0.10 | 0.006 | 0.000 |
1 All values are in mm. 2 Scanner could not track and scan that object.
Table A2.
Determined flatness values of seven different colored Lego bricks scanned by iPad Pro (2020) using TrueDepth.
Table A2.
Determined flatness values of seven different colored Lego bricks scanned by iPad Pro (2020) using TrueDepth.
| iPad Pro 2020 with TrueDepth Camera 1 | ||||||
|---|---|---|---|---|---|---|
| Brick Color | Value 1 | Value 2 | Value 3 | Mean | Standard Deviation | Variance |
| White | 0.12 | 0.21 | 0.14 | 0.16 | 0.047 | 0.002 |
| Orange | 0.25 | 0.35 | 0.30 | 0.30 | 0.050 | 0.003 |
| Red | 0.24 | 0.44 | 0.29 | 0.32 | 0.104 | 0.011 |
| Green | 0.37 | 0.40 | 0.27 | 0.35 | 0.068 | 0.005 |
| Blue | 0.19 | 0.28 | 0.19 | 0.22 | 0.052 | 0.003 |
| Black | N/A 2 | N/A 2 | N/A 2 | - | - | - |
| Turquoise | 0.24 | 0.33 | 0.26 | 0.28 | 0.047 | 0.002 |
1 All values are in mm. 2 Scanner could not track and scan that object.
Table A3.
Determined form tolerance values of different Lego bricks scanned by Artec Space Spider.
| Artec Space Spider with Blue Light Technology 1 | ||||||
|---|---|---|---|---|---|---|
| Form Tolerance | Value 1 | Value 2 | Value 3 | Mean | Standard Deviation | Variance |
| Straightness | 0.15 | 0.14 | 0.15 | 0.15 | 0.006 | 0.000 |
| Flatness | 0.12 | 0.17 | 0.14 | 0.14 | 0.025 | 0.001 |
| Roundness | 1.19 | 0.87 | 0.83 | 0.96 | 0.197 | 0.039 |
| Cylindricity | 0.20 | 0.14 | 0.16 | 0.17 | 0.031 | 0.001 |
1 All values are in mm.
Table A4.
Determined form tolerance values of different Lego bricks scanned by the iPad Pro (2020) using TrueDepth.
Table A4.
Determined form tolerance values of different Lego bricks scanned by the iPad Pro (2020) using TrueDepth.
| iPad Pro 2020 with TrueDepth Camera 1 | ||||||
|---|---|---|---|---|---|---|
| Form Tolerance | Value 1 | Value 2 | Value 3 | Mean | Standard Deviation | Variance |
| Straightness | 0.42 | 0.29 | 0.61 | 0.44 | 0.161 | 0.026 |
| Flatness | 0.42 | 0.30 | 0.51 | 0.41 | 0.105 | 0.011 |
| Circularity | 0.87 | 1.27 | 1.38 | 1.17 | 0.268 | 0.072 |
| Cylindricity | 0.79 | 0.88 | 0.80 | 0.82 | 0.049 | 0.002 |
1 All values are in mm.
Table A5.
Determined position and profile tolerance values of different Lego bricks scanned by Artec Space Spider.
Table A5.
Determined position and profile tolerance values of different Lego bricks scanned by Artec Space Spider.
| Artec Space Spider with Blue Light Technology 1 | ||||||
|---|---|---|---|---|---|---|
| Target-Actual Comparison | Value 1 | Value 2 | Value 3 | Mean | Standard Deviation | Variance |
| Position | 0.50 | 0.37 | 0.41 | 0.43 | 0.067 | 0.004 |
| Profile of a surface | 0.60 | 0.78 | 0.67 | 0.68 | 0.091 | 0.008 |
| Profile of a line | 4.63 | 4.24 | 4.67 | 4.51 | 0.238 | 0.056 |
1 All values are in mm.
Table A6.
Determined position and profile tolerance values of different Lego bricks scanned by the iPad Pro (2020) using TrueDepth.
Table A6.
Determined position and profile tolerance values of different Lego bricks scanned by the iPad Pro (2020) using TrueDepth.
| iPad Pro 2020 with TrueDepth Camera 1 | ||||||
|---|---|---|---|---|---|---|
| Target-Actual Comparison | Value 1 | Value 2 | Value 3 | Mean | Standard Deviation | Variance |
| Position | 1.10 | 0.88 | 1.10 | 1.03 | 0.127 | 0.016 |
| Profile of a surface | 1.25 | 1.58 | 0.57 | 1.13 | 0.515 | 0.265 |
| Profile of a line | 4.51 | 5.04 | 5.20 | 4.92 | 0.361 | 0.130 |
1 All values are in mm.
References
- Martínez-Olvera, C.; Mora-Vargas, J. A Comprehensive Framework for the Analysis of Industry 4.0 Value Domains. Sustainability 2019, 11, 2960. [Google Scholar] [CrossRef] [Green Version]
- Fathi, M.; Ghobakhloo, M. Enabling Mass Customization and Manufacturing Sustainability in Industry 4.0 Context: A Novel Heuristic Algorithm for in-Plant Material Supply Optimization. Sustainability 2020, 12, 6669. [Google Scholar] [CrossRef]
- Apple Inc. iPad Pro. 2020. Available online: https://www.apple.com/de/ipad-pro/ (accessed on 6 November 2020).
- Hexr. The World’s First Custom Fit Helmet. Available online: https://hexr.com/pages/fitting (accessed on 12 February 2021).
- Raja, V. Introduction to Reverse Engineering. In Reverse Engineering; Raja, V., Fernandes, K.J., Eds.; Springer: London, UK, 2008; pp. 1–9. ISBN 978-1-84628-855-5. [Google Scholar]
- Page, D.; Koschan, A.; Abidi, M. Methodologies and Techniques for Reverse Engineering–The Potential for Automation with 3-D Laser Scanners. In Reverse Engineering; Raja, V., Fernandes, K.J., Eds.; Springer: London, UK, 2008; pp. 11–32. ISBN 978-1-84628-855-5. [Google Scholar]
- Ameen, W.; Al-Ahmari, A.; Hammad Mian, S. Evaluation of Handheld Scanners for Automotive Applications. Appl. Sci. 2018, 8, 217. [Google Scholar] [CrossRef] [Green Version]
- Gerbino, S.; Del Giudice, D.M.; Staiano, G.; Lanzotti, A.; Martorelli, M. On the influence of scanning factors on the laser scanner-based 3D inspection process. Int. J. Adv. Manuf. Technol. 2016, 84, 1787–1799. [Google Scholar] [CrossRef]
- Amornvit, P.; Sanohkan, S. The Accuracy of Digital Face Scans Obtained from 3D Scanners: An In Vitro Study. Int. J. Environ. Res. Public Health 2019, 16, 5061. [Google Scholar] [CrossRef] [PubMed] [Green Version]
- Alexander Duss. Development Capability Profiles of Selected Reverse Engineering Techniques; Stellenbosch University: Stellenbosch, ZA, USA, 2012. [Google Scholar]
- Artec Europe. Artec Space Spider. Available online: https://www.artec3d.com/de/portable-3d-scanners/artec-spider-v2 (accessed on 6 November 2020).
- Schuon, S.; Theobalt, C.; Davis, J.; Thrun, S. High-quality scanning using time-of-flight depth superresolution. In Proceedings of the 2008 IEEE Computer Society Conference on Computer Vision and Pattern Recognition Workshops, Anchorage, AK, USA, 23–28 June 2008; IEEE: Piscataway, NJ, USA, 2008. ISBN 9781424423392. [Google Scholar]
- Alfaro-Santafé, J.; Gómez-Bernal, A.; Lanuza-Cerzócimo, C.; Alfaro-Santafé, J.V.; Pérez-Morcillo, A.; Almenar-Arasanz, A.J. Three-axis measurements with a novel system for 3D plantar foot scanning: iPhone X. Footwear Sci. 2020, 12, 123–131. [Google Scholar] [CrossRef]
- Olade, I.; Liang, H.; Fleming, C. A Review of Multimodal Facial Biometric Authentication Methods in Mobile Devices and Their Application in Head Mounted Displays. In Proceedings of the 2018 IEEE SmartWorld, Ubiquitous Intelligence & Computing, Advanced & Trusted Computing, Scalable Computing & Communications, Cloud & Big Data Computing, Internet of People and Smart City Innovation (SmartWorld/SCALCOM/UIC/ATC/CBDCom/IOP/SCI), Guangzhou, China, 8–12 October 2018; pp. 1997–2004, ISBN 978-1-5386-9380-3. [Google Scholar]
- Carey, N.; Nagpal, R.; Werfel, J. Fast, accurate, small-scale 3D scene capture using a low-cost depth sensor. IEEE Winter Conf. Appl. Comput. Vis. 2017, 2017, 1268–1276. [Google Scholar] [CrossRef] [PubMed] [Green Version]
- Verdaasdonk, R.M.; Liberton, N. The Iphone X as 3D Scanner for Quantitative Photography of Faces for Diagnosis and Treatment Follow-Up (Conference Presentation). In Proceedings of the SPIE 10869, Optics and Biophotonics in Low-Resource Settings V, 1086902, San Francisco, CA, USA, 4 March 2019. [Google Scholar]
- Nermina Zaimovic-Uzunovic, S.L. 10th International Symposium on Measurement and Quality Control (ISMQC 2010): Influences of Surfaces Parameters on Laser 3D Scanning; Curran: Red Hook, NY, USA, 2010; ISBN 978-1-61782-019-9. [Google Scholar]
- The LEGO Group. Company Profile: An Introduction to the LEGO Group. Available online: https://www.lego.com/cdn/cs/aboutus/assets/blt2278c7a21e58e900/LEGOCompanyProfile_2020.pdf (accessed on 6 April 2021).
- Henzold, G. Geometrical Dimensioning and Tolerancing for Design, Manufacturing and Inspection: A Handbook for Geometrical Product Specification Using ISO and ASME Standards, 2nd ed.; Butterworth-Heinemann: Oxford, UK, 2006; ISBN 978-0750667388. [Google Scholar]
- The LEGO Group. Pick a Brick. Available online: https://www.lego.com/de-de/page/static/pick-a-brick (accessed on 6 November 2020).
- Minetola, P.; Iuliano, L.; Calignano, F. A customer oriented methodology for reverse engineering software selection in the computer aided inspection scenario. Comput. Ind. 2015, 67, 54–71. [Google Scholar] [CrossRef]
Figure 1.
Schematic illustration of the procedure to evaluate the accuracy of TrueDepth and light detection and ranging (LiDAR) using an iPad Pro (2020) in comparison to an industrial 3D scanning system.
Figure 1.
Schematic illustration of the procedure to evaluate the accuracy of TrueDepth and light detection and ranging (LiDAR) using an iPad Pro (2020) in comparison to an industrial 3D scanning system.

Figure 2.
Examination of deviation with GOM Inspect Suite 2020: (a) flatness test by a scanned Lego brick with the Artec Space Spider whether colors influence the scan quality scanned; (b) form tolerance analysis of a Lego brick scanned by the TrueDepth camera; (c) target-actual comparison of a Lego brick scanned by the TrueDepth camera for the examination of scan accuracy of a profile on a surface.

Figure 3.
(a) Screenshot of the camera preview of a Lego brick on an iPad Pro (2020); (b) Screenshot of the scanning preview via LiDAR in the same scenario using the Heges App on an iPad Pro (2020).
Figure 3.
(a) Screenshot of the camera preview of a Lego brick on an iPad Pro (2020); (b) Screenshot of the scanning preview via LiDAR in the same scenario using the Heges App on an iPad Pro (2020).

Figure 4.
The seven different colored Lego bricks used in the first experiment: black, red, orange, green, blue, turquoise, and white (left to right).
Figure 4.
The seven different colored Lego bricks used in the first experiment: black, red, orange, green, blue, turquoise, and white (left to right).

Figure 5.
Comparison of the determined flatness values of seven different colored Lego bricks scanned by Artec Space Spider and the iPad Pro (2020) using TrueDepth.
Figure 5.
Comparison of the determined flatness values of seven different colored Lego bricks scanned by Artec Space Spider and the iPad Pro (2020) using TrueDepth.

Figure 6.
Comparison of the determined form tolerance values of different Lego bricks scanned by Artec space spider and the iPad Pro (2020) using TrueDepth.
Figure 6.
Comparison of the determined form tolerance values of different Lego bricks scanned by Artec space spider and the iPad Pro (2020) using TrueDepth.

Figure 7.
Comparison of the determined position and profile tolerance values of different Lego bricks scanned by Artec Space Spider and the iPad Pro (2020) using TrueDepth.
Figure 7.
Comparison of the determined position and profile tolerance values of different Lego bricks scanned by Artec Space Spider and the iPad Pro (2020) using TrueDepth.

Table 1.
Overview of the used Lego bricks for the inspection of geometric characteristics and tolerances [19].
Table 1.
Overview of the used Lego bricks for the inspection of geometric characteristics and tolerances [19].
| Evaluation of Scanned Lego Bricks by Shape Tolerances According to DIN EN ISO 1101 | |||||
|---|---|---|---|---|---|
| Symbol | Geometric Characteristic | Tolerance Type | Lego Brick | Element Number 1 | Control Summary |
 | Straightness | Form (No Relation between Features) |  | 4,181,139/44,237 | Controls form or surfaces of a feature in relation to its own perfect form. |
 | Flatness |  | 300,123/3001 | ||
 | Roundness (Circularity) |  | 6,322,842/98,138 | ||
 | Cylindricity |  | 17,715/87,994 | ||
 | Position | Location |  | 300,123/3001 | Controls size, form and orientation of scanned surfaces based on datum references. |
 | Profile of a surface |  | 230,223 | ||
 | Profile of a line |  | 230,223 | ||
1 Element number of the Lego brick in the Lego online store [20].
Publisher’s Note: MDPI stays neutral with regard to jurisdictional claims in published maps and institutional affiliations. |
© 2021 by the authors. Licensee MDPI, Basel, Switzerland. This article is an open access article distributed under the terms and conditions of the Creative Commons Attribution (CC BY) license (https://creativecommons.org/licenses/by/4.0/).
Share and Cite
MDPI and ACS Style
Vogt, M.; Rips, A.; Emmelmann, C. Comparison of iPad Pro®’s LiDAR and TrueDepth Capabilities with an Industrial 3D Scanning Solution. Technologies 2021, 9, 25. https://0-doi-org.brum.beds.ac.uk/10.3390/technologies9020025
AMA Style
Vogt M, Rips A, Emmelmann C. Comparison of iPad Pro®’s LiDAR and TrueDepth Capabilities with an Industrial 3D Scanning Solution. Technologies. 2021; 9(2):25. https://0-doi-org.brum.beds.ac.uk/10.3390/technologies9020025
Chicago/Turabian StyleVogt, Maximilian, Adrian Rips, and Claus Emmelmann. 2021. "Comparison of iPad Pro®’s LiDAR and TrueDepth Capabilities with an Industrial 3D Scanning Solution" Technologies 9, no. 2: 25. https://0-doi-org.brum.beds.ac.uk/10.3390/technologies9020025
Note that from the first issue of 2016, this journal uses article numbers instead of page numbers. See further details here.