
A Fused Variable by Night Light Images and MODIS Products for Improving Urban Built-Up Area Extraction

1
School of Geography, South China Normal University, Guangzhou 510631, China
2
SCNU Qingyuan Institute of Science and Technology Innovation Co., Ltd., Qingyuan 511517, China
3
Guangdong Normal University Weizhi Information Technology Co., Ltd., Qingyuan 511517, China
4
School of Transportation Engineering, Shenyang Jianzhu University, Shenyang 710075, China
5
Beijing Hanbolin Remote Sensing Mapping Information Engineering Research Institute, Beijing 100080, China
6
School of Transportation Engineering, China University of Mining & Technology, Beijing 100083, China
*
Author to whom correspondence should be addressed.
Technologies 2021, 9(2), 40; https://0-doi-org.brum.beds.ac.uk/10.3390/technologies9020040
Submission received: 6 April 2021
/
Revised: 14 May 2021
/
Accepted: 18 May 2021
/
Published: 25 May 2021
Abstract
:The boundary of urban built-up areas is the baseline data of a city. Rapid and accurate monitoring of urban built-up areas is the prerequisite for the boundary control and the layout of urban spaces. In recent years, the night light satellite sensors have been employed in urban built-up area extraction. However, the existing extraction methods have not fully considered the properties that directly reflect the urban built-up areas, like the land surface temperature. This research first converted multi-source data into a uniform projection, geographic coordinate system and resampling size. Then, a fused variable that integrated the Defense Meteorological Satellite Program/Operational Linescan System (DMSP/OLS) night light images, the Moderate-resolution Imaging Spectroradiometer (MODIS) surface temperature product and the normalized difference vegetation index (NDVI) product was designed to extract the built-up areas. The fusion results showed that the values of the proposed index presented a sharper gradient within a smaller spatial range, compared with the only night light images. The extraction results were tested in both the area sizes and the spatial locations. The proposed index performed better in both accuracies (average error rate 1.10%) and visual perspective. We further discussed the regularity of the optimal thresholds in the final boundary determination. The optimal thresholds of the proposed index were more stable in different cases on the premise of higher accuracies.
1. Introduction
China is now in a period of rapid urbanization [1,2,3], which has an impact on the gravity of different human dynamics [4]. Accurate acquisition of urban built-up areas is an important guidance for China’s urban construction, management and research. The built-up areas also reflect the economic strength and urbanization level of a city [5]. However, the manual method on specifying the boundaries of built-up areas is extremely inefficient and it is not suitable for the rapid urban expansion. The main reason lies in the fact that the process of fast urbanization makes it more difficult to delimitate the urban sprawl. Owing to the multiphase property, the satellite sensors, like Landsat, Worldview and Gao Fen, have been widely employed to extract the urban built-up areas and monitor the change of the city boundary [6,7]. Compared with the remote sensing images acquired during the day, the images acquired by the night light sensors directly reflect the human activities [8,9]. For example, Defense Meteorological Satellite Program/Operational Linescan System (DMSP/OLS) and National Polar-orbiting Partnership/Visible Infrared Imaging Radiometer (NPP/VIIRS) are both frequently used night light sensors [10,11,12,13].
The differences in the brightness of the night light images between urban and rural areas make it possible to extract the spatial ranges of urban built-up areas. A number of studies focused on obtaining the optimal threshold in urban built-up extraction by night light images. The methods of obtaining the optimal threshold can be summarized into three categories: First, in the empirical threshold method, an artificial threshold is set according to the experience, and pixels with the values exceeding this threshold are defined as the built-up areas [14,15,16]. This method is simple, but the results will vary with different situations. Second, the mutation detection method selects the threshold when the city begins to break with the increase of the threshold value [17]. The theoretical premise of this method is that the urban built-up area will maintain a complete geometric shape. However, many cities with “satellite clusters” do not conform to that assumption, which leads to the limitation of the applicability of the mutation threshold method. Third, obtaining the threshold by the auxiliary data, including high-resolution image data [18] and statistical data [19]. High-resolution image data, such as Google Earth and Landsat images, are complicated to operate and have very large data volume. They are suitable for the extraction of built-up areas of specific cities and periods [20]. However, an optimal threshold for one case may not be the same for other cases, which brings difficulties to the threshold determination in built-up area extraction by night light images. In fact, if a kind of data representation can yield a relatively stable optimal threshold for different cases, like different time point, the optimal threshold for one case will be applicable to other cases. The image fusion, that combines the useful information of different data sources, is likely to provide the index with more stable threshold.
Compared with single-source remote sensing images, the multi-source remote sensing images have higher complementarity, including different resolutions and revisit periods [21,22,23,24,25]. By developing the image fusion algorithms, the complementary properties of different data sources can be merged [26,27]. As for the urban built-up area extraction, the recent research has combined night light images with daytime spectral images to enhance the built-up information [28,29,30]. For example, a study constructed a human settlement index (HSI) to extract the residential areas in southern China by combining MODIS NDVI and DMSP data [28]. More concise indices were designed to identify the urban built-up areas by DMSP/OLS and MODIS NDVI product [26]. Other urban studies fused night light images and other images/products for urban area size extraction [31,32], urban spatial-temporal change analysis [33] and the simulation of socio-economic factors [34]. Most studies combined the MODIS products and daytime images with night light images to understand the urban built-up information, but few studies introduced the surface temperature, which is an important characteristic corresponding to the urbanization and heat island effect [35,36]. Urban heat islands occur in the regions with dense population, high building density and high concentration of the industry and commerce, while the heat island intensity of suburbs is low owing to the high vegetation cover rate [36].
This paper contributed to the existing research and combined the DMSP/OLS nighttime light data, MOD13A3 vegetation index product and MOD11A2 surface temperature product [37,38,39] to design a normalized urban built-up area index (NUBAI) for urban built-up area extraction. This research took Shenyang city, Liaoning province, China as the example. The urban built-up areas were then extracted according to the optimal threshold determined by Landsat images for different years. The fluctuation level of the optimal thresholds, the data fusion results in visual perspective and the extraction accuracies were compared, respectively.
2. Study Area and Data
2.1. Study Area
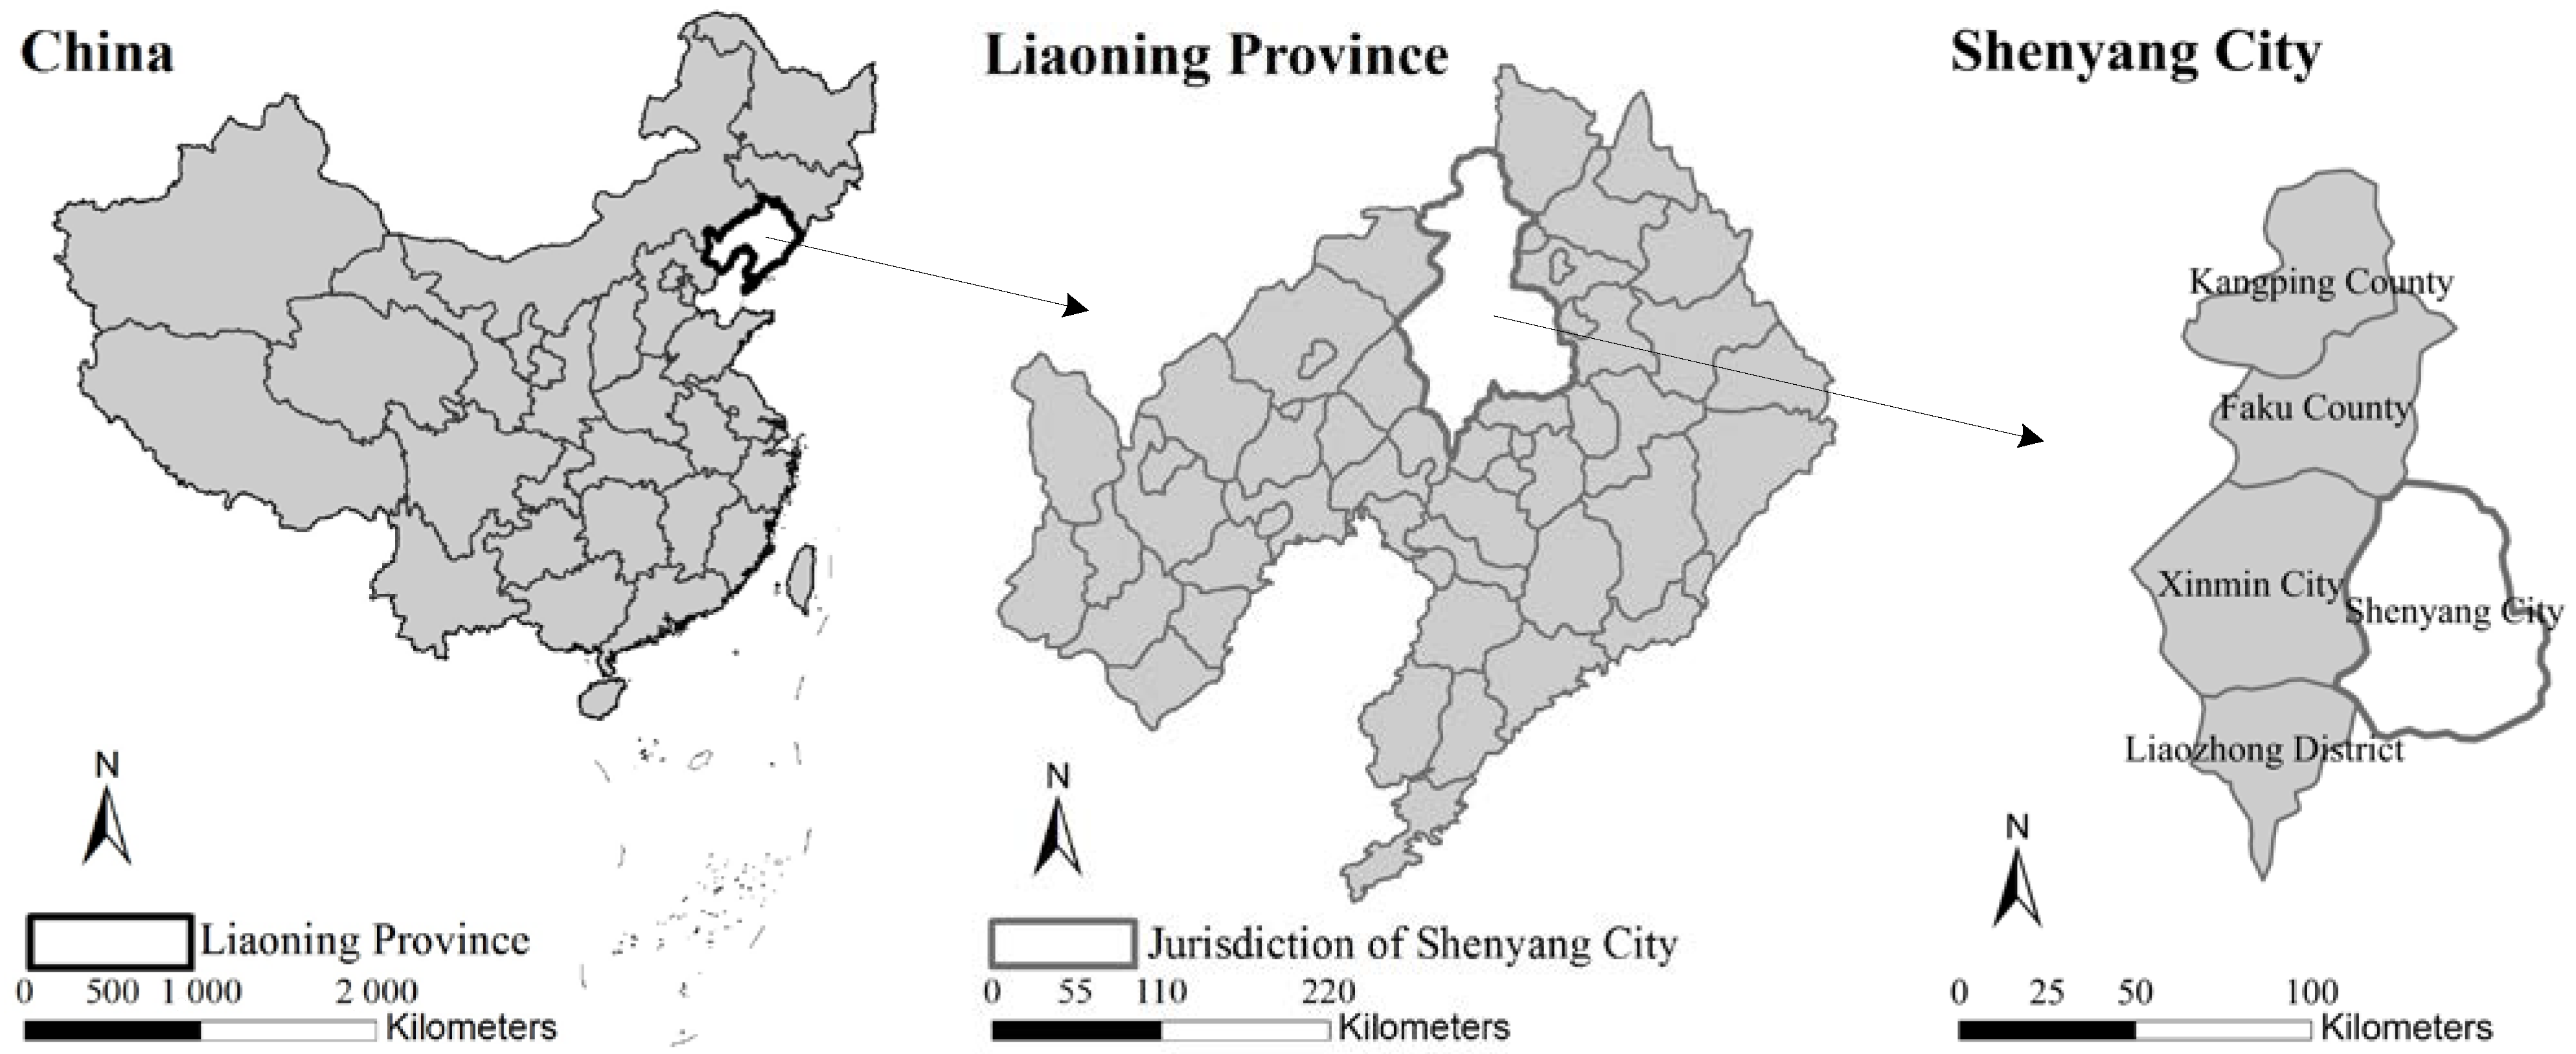
The study area is Shenyang city, the provincial capital of Liaoning province, Northeast China (Figure 1). The geographic location is within 122°25′ to 124°49′ east longitude and 41°11′ to 43°3′ north latitude. The city is 115 km from east to west and 205 km from north to south. The climate type belongs to temperate and semi-humid continental climate. The annual temperature ranges from −35 °C to 36 °C. The average temperature is 8.3 °C. The built-up area is mainly distributed in the middle of the administrative area. The urbanization process in Shenyang was fast during the years 2005 to 2013, and since the year 2013, the urbanization has stabilized. This study took the years 2005 to 2013 as the study period to test the identification of urban built-up areas during fast urbanization. In 2005, the built-up area size was 310 square kilometers. As for 2013, the built-up area size was 455 square kilometers.
2.2. Data
Extraction Areas
(1) Night light images
Since this study took the years from 2005 to 2013 as the time period, we collected the annual DMSP/OLS data from 2005 to 2013 [8]. The values of the images were averaged annually. The spatial resolution of DMSP/OLS is 2400 m. The higher values of the images indicate the brighter light in the night.
(2) MODIS products
This study obtained MOD11A2 daytime surface temperature bands and MOD13A3 data for 2005–2013. MOD11A2 is a surface temperature product that is synthesized every 8 days with a spatial resolution of 1 km, including both the daytime and nighttime surface temperature bands [38,39]. MOD13A3 is a 16 day composite surface vegetation index product with a resolution of 1 km, mainly including normalized vegetation index and enhanced vegetation index [37]. Both MOD11A2 products and MOD13A3 products were acquired at the DOY (day of year) of 213.
(3) Landsat images
Landsat7 Enhanced Thematic Mapper (ETM+) images between the years 2005 and 2012 and Landsat8 Operational Land Imager (OLI) images of 2013 were employed to determine the thresholds of the built-up areas and verify the results. Landsat ETM+ images contain 8 bands. The spatial resolution of band 1–5 and band 7 is 30 m, while the spatial resolutions of band 6 and band 8 are 60 m and 15 m, respectively. Landsat 8 images contain 11 bands. The spatial resolution of bands 1–7 and band 9–11 is 30 m, while the spatial resolution of band 8 is 15 m. Band 10 and band 11 were acquired from the thermal infrared sensor (TIRS) with the spatial resolution of 100 m. The satellite can achieve global coverage every 16 days. The path and row of the images obtained in this study are, respectively, 30–31 and 119.
(4) Statistical data
The statistical data were acquired from “Liaoning Province Statistical Yearbook” (http://data.cnki.net/area/Yearbook/Single/N2011110059?z=D06 access on 24 May 2021). We collated the statistical data of the built-up areas between 2005 and 2013 for 9 years (310 km2, 325 km2, 347 km2, 370 km2, 395 km2, 412 km2, 430 km2, 455 km2 and 455 km2, respectively). These data were recognized as the test data in the built-up area extraction.
3. Methodology
3.1. Data Preprocessing
All data, including MOD13A3, MOD11A2 and DMSP/OLS night light images of the 9 years, were converted into a uniform Albers equal area projection and WGS-84 geographic coordinate system. Besides, the resolution was unified by resampling and the resampling size is 1 km × 1 km.
Since the digital number (DN) values in MOD11A2 indicated the relative values of the brightness temperature, the land surface temperature values of the ground were obtained through the formula operation [40] (Equation (1)):
where LST is the land surface temperature, DN is the gray value of the image pixel and the scale value is 0.02. Then, the result was normalized by Equation (2) to better fuse the multi-source remote sensing data:
where is the normalized LST value; LSTi, LSTmin and LSTmax are the ith pixel’s LST value, the minimum LST value and the maximum LST value, respectively.
For the night light images, the relative invariant target area method was employed to calculate the mathematical relationships between the inter-annual night light images. A power function relative correction model was established to correct the discontinuous and incomparable DMSP lighting data. Due to the high noise in the fitted images, the Gaussian low-pass filtering with a window of 13 × 13 was used to eliminate the effect of the image noise caused by sporadic weak lights. Finally, a continuity correction between different years is carried out from 2005 to 2013 [12]. The rules were as follows:
where , and represent the DN values of the ith pixel of the nighttime light image in the n − 1st year, the nth year and the n + 1st year, respectively.
3.2. Normalized Urban Built-Up Area Index (NUBAI) Considering Surface Temperature and Vegetation Index
This study introduced the surface temperature products in extracting the built-up areas. We integrated night light images, vegetation index products and surface temperature products into an index to improve the extraction of the built-up areas (Equation (4)):
where NL is the normalized night light data, is the normalized real surface temperature data being processed by MOD11A2 and NDVI is the MOD13A3 normalized vegetation index data. NDVI is calculated by Equation (5) [41]:
where NIR is the value of near infrared band and Red is the value of red band.
According to Equation (4), NL, and 1-NDVI have positive correlation with the built-up areas, while 1- NL/2, 1-/2 and 1+NDVI have negative correlation with the built-up areas. That means if a pixel has higher NL and values and a lower NDVI value, the pixel is more likely to be identified as urban built-up area. The index includes not only urban built-up information, but also vegetation features and real surface temperatures. Since NL, and NDVI data are all continuous in space, the spatial details can be better reflected in this index. According to the equation, the combination of the surface temperature and vegetation index reduces the blooming effect which led to the overestimation of the urban areas [18,42].
3.3. Threshold Determination by Reference Data from Landsat Images
In this study, we first calculated NDVI and normalized difference water index (NDWI) for each Landsat image covering the study areas [43,44]. NDWI is calculated by Equation (6):
where Green is the value of green band and NIR is the value of near infrared band. Then, the thresholds were set to mask out the vegetation and water areas for each image by visual interpretation. The remaining areas were mainly the built-up areas and bare land. Since the built-up areas and bare land are not easy to be automatically extracted by Landsat images, we masked out the other land cover types (mainly bare land) by visual interpretation and Google Earth references. We took 0.01 as the step size and set the thresholds for night light images and NUBAI, respectively. The urban built-up area size under each threshold was calculated and the thresholds with the lowest absolute differences between the result and the reference data were selected for each year [19]. Finally, for each pixel, if the values (nightlight data and NUBAI) were higher than the threshold, they were labeled as the urban built-up pixels. We have to mention that this research did not propose a general threshold-based approach because the step-size based method was expected to yield quite accurate thresholds. Instead, we aimed to find the distribution of the thresholds in different periods under different variables. If a variable gives relatively stable thresholds and high accuracies for different cases, it will contribute to the threshold determination and built-up area extraction.
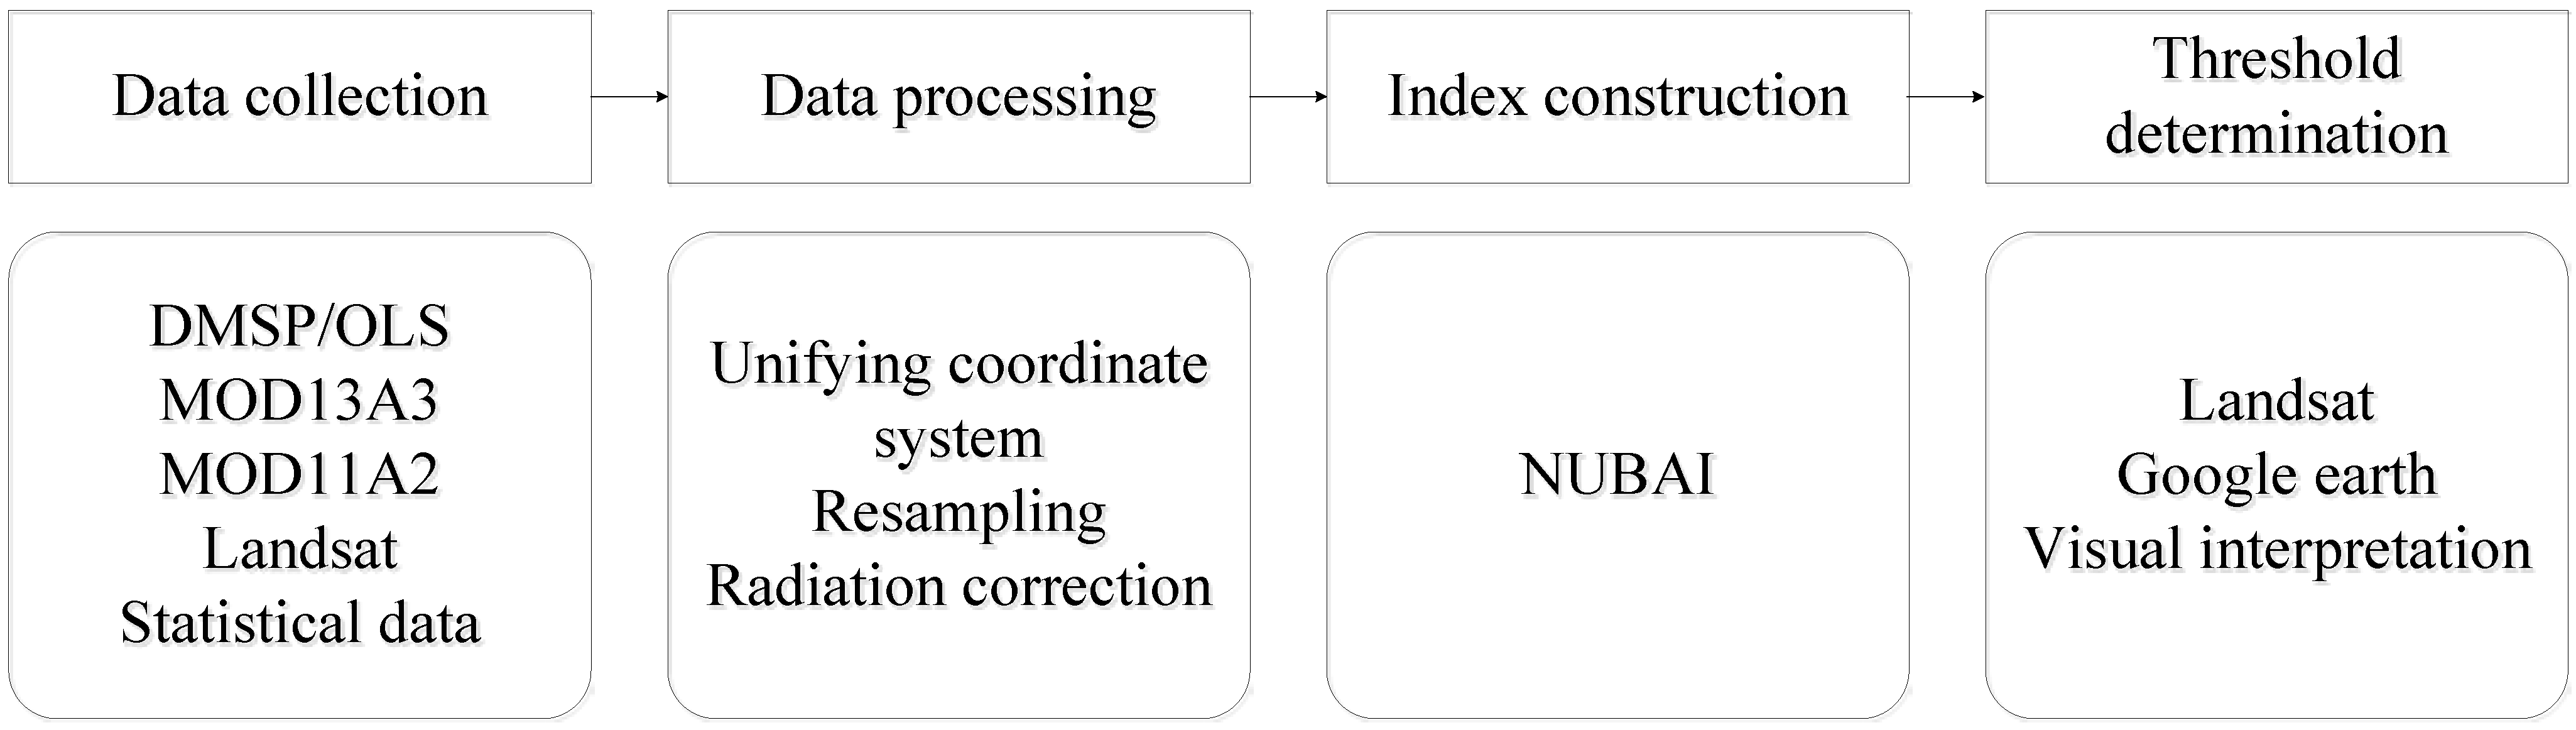
The extraction process is illustrated in Figure 2.
3.4. Accuracy Assessment of Area Sizes and Spatial Locations
This study tested the extraction results of Shenyang built-up areas from 2005 to 2013 in both the area sizes and the spatial locations. The statistical data of urban built-up areas in China statistical yearbook is used to test the area sizes; moreover, we superimposed the extracted results with Landsat images and verified the spatial position by visual interpretation for the year 2005 and 2010.
(1) Area size accuracies
The calculation of the area error in this paper is presented in Equation (7) [45]:
where is the area size of the extracted built-up areas, and is the statistical area size of the built-up areas in the China statistical yearbook.
(2) Spatial location accuracy
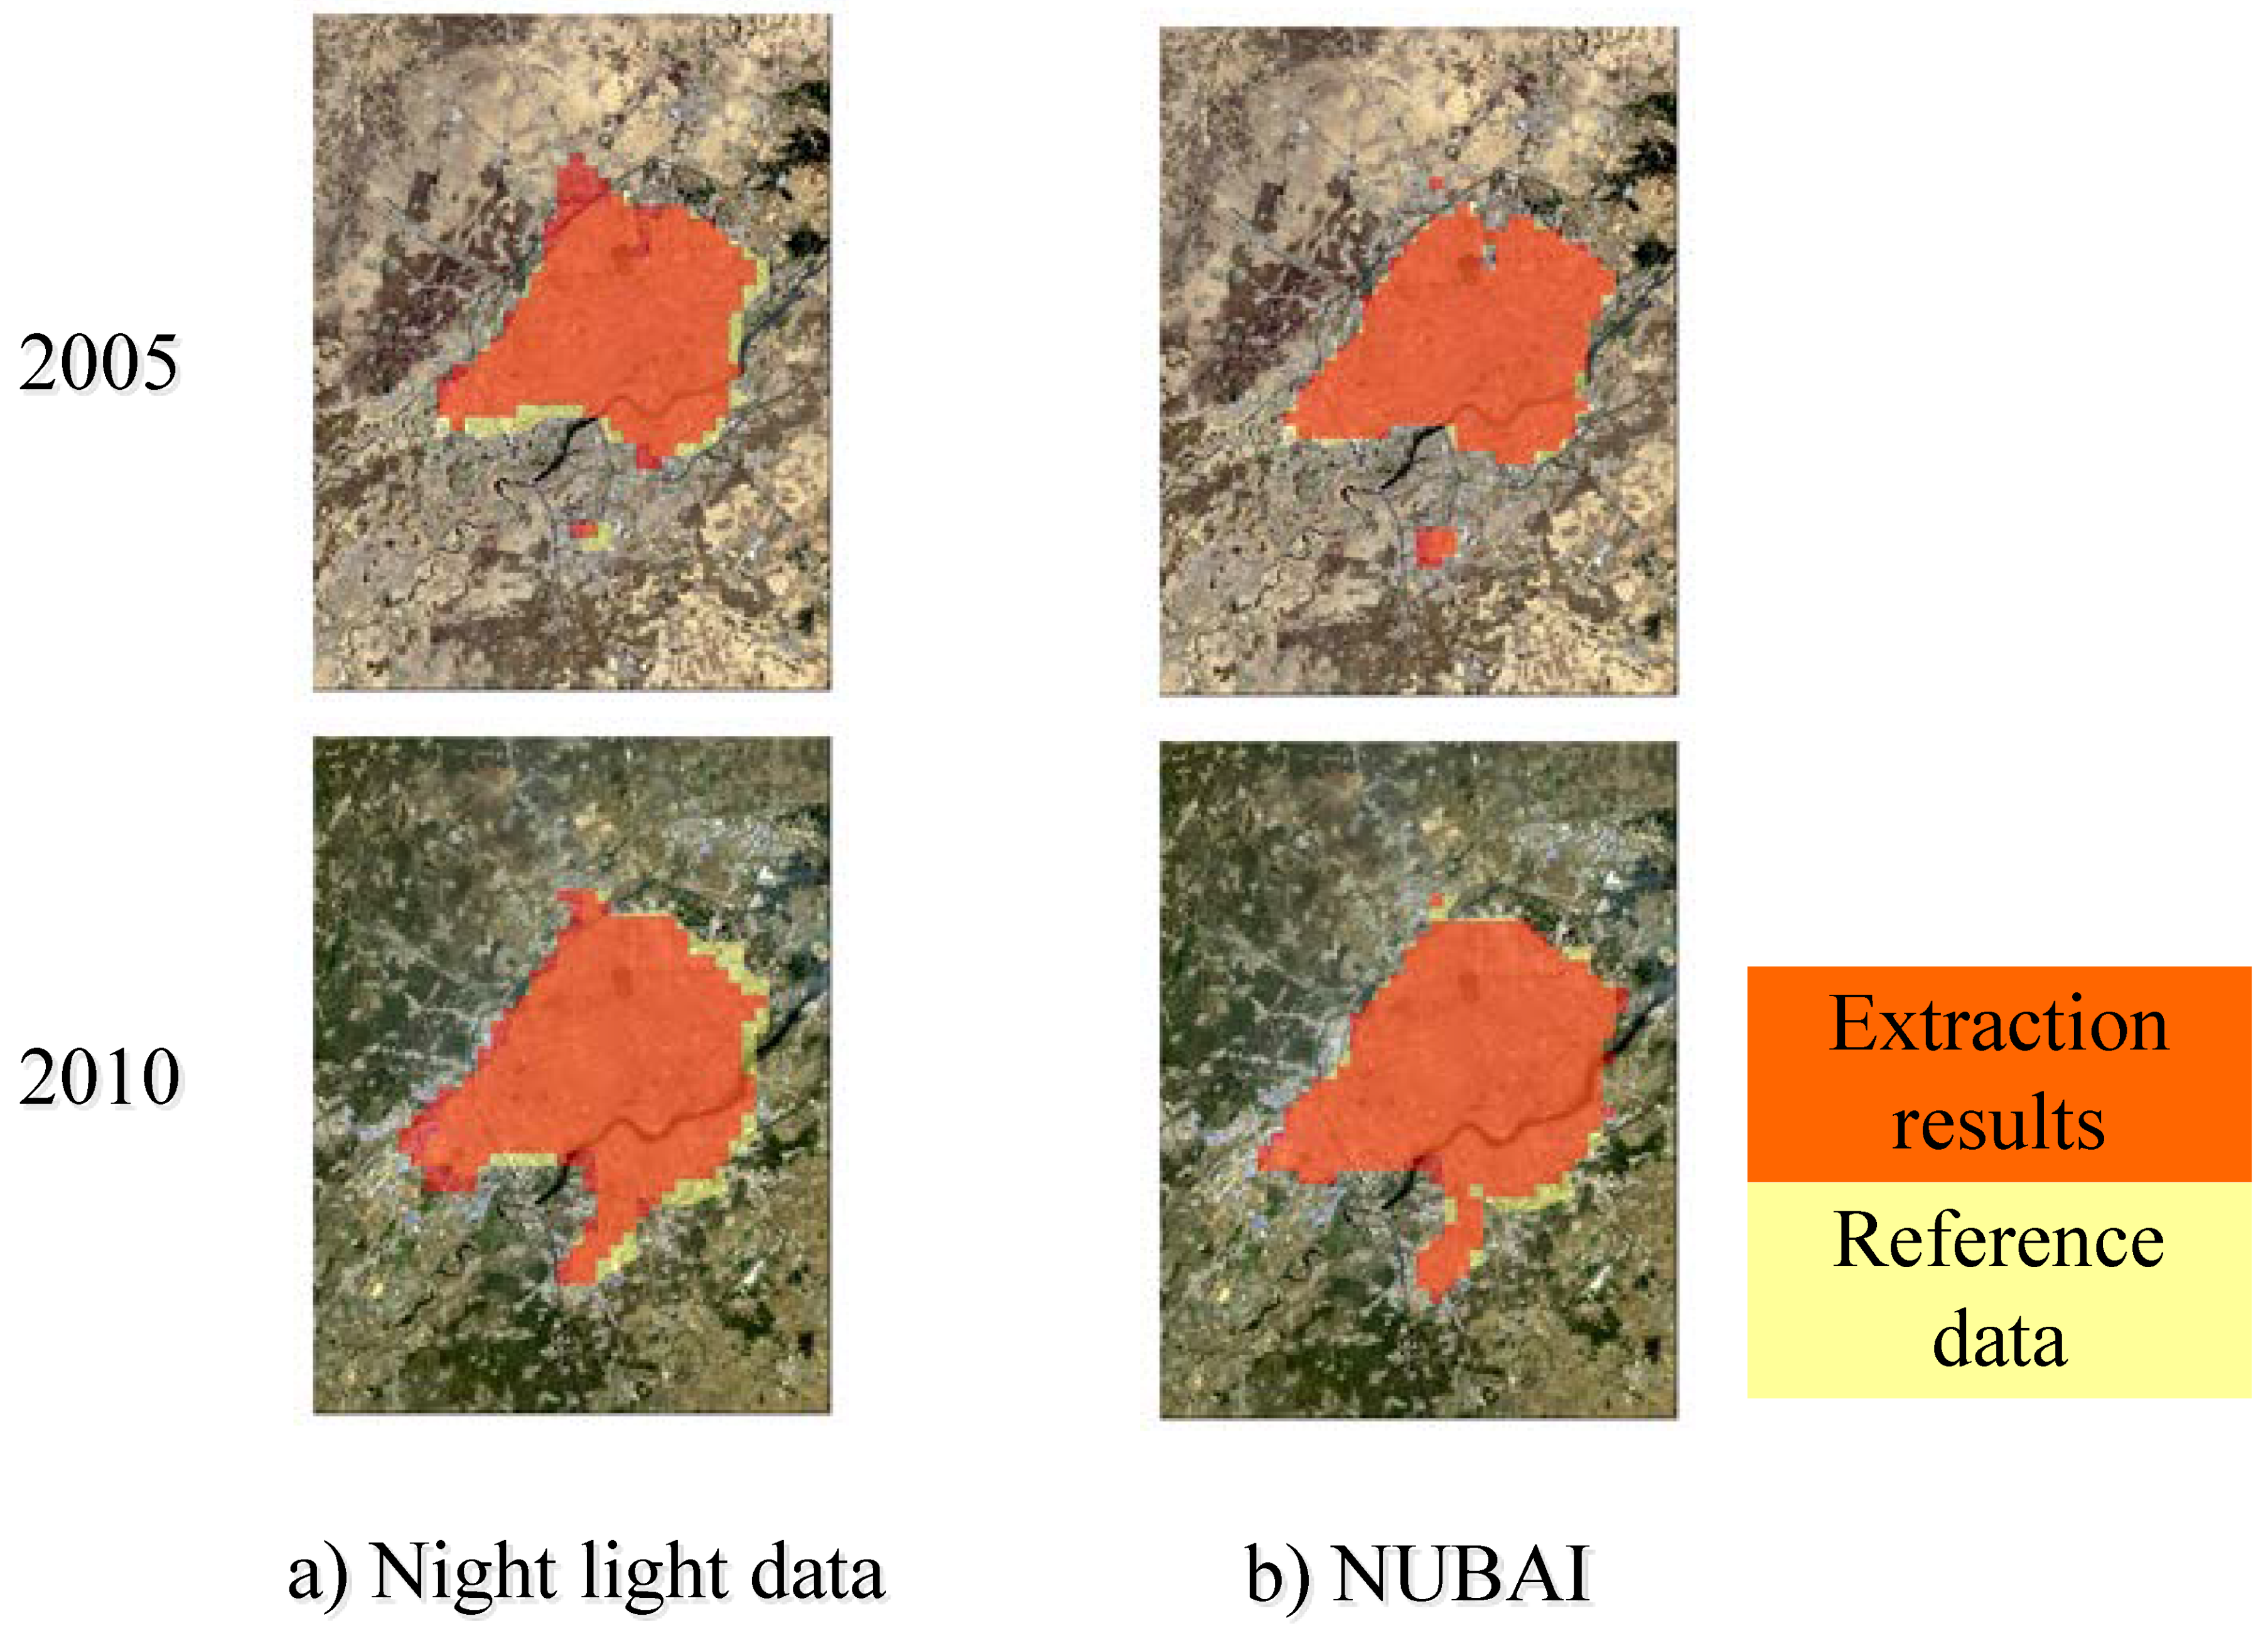
This study superimposed the extracted built-up areas into the Landsat images of the same years for both 2005 and 2010. The built-up areas in Landsat images of each time phase were obtained by manual interpretation, and the results of visual interpretation were recognized as the reference data for the verification of the spatial location [18]. The area sizes of error identification and missing identification were calculated by comparing the extraction results with the actual spatial distributions.
4. Results
4.1. Fusion Results of Multi-Source Remote Sensing Data
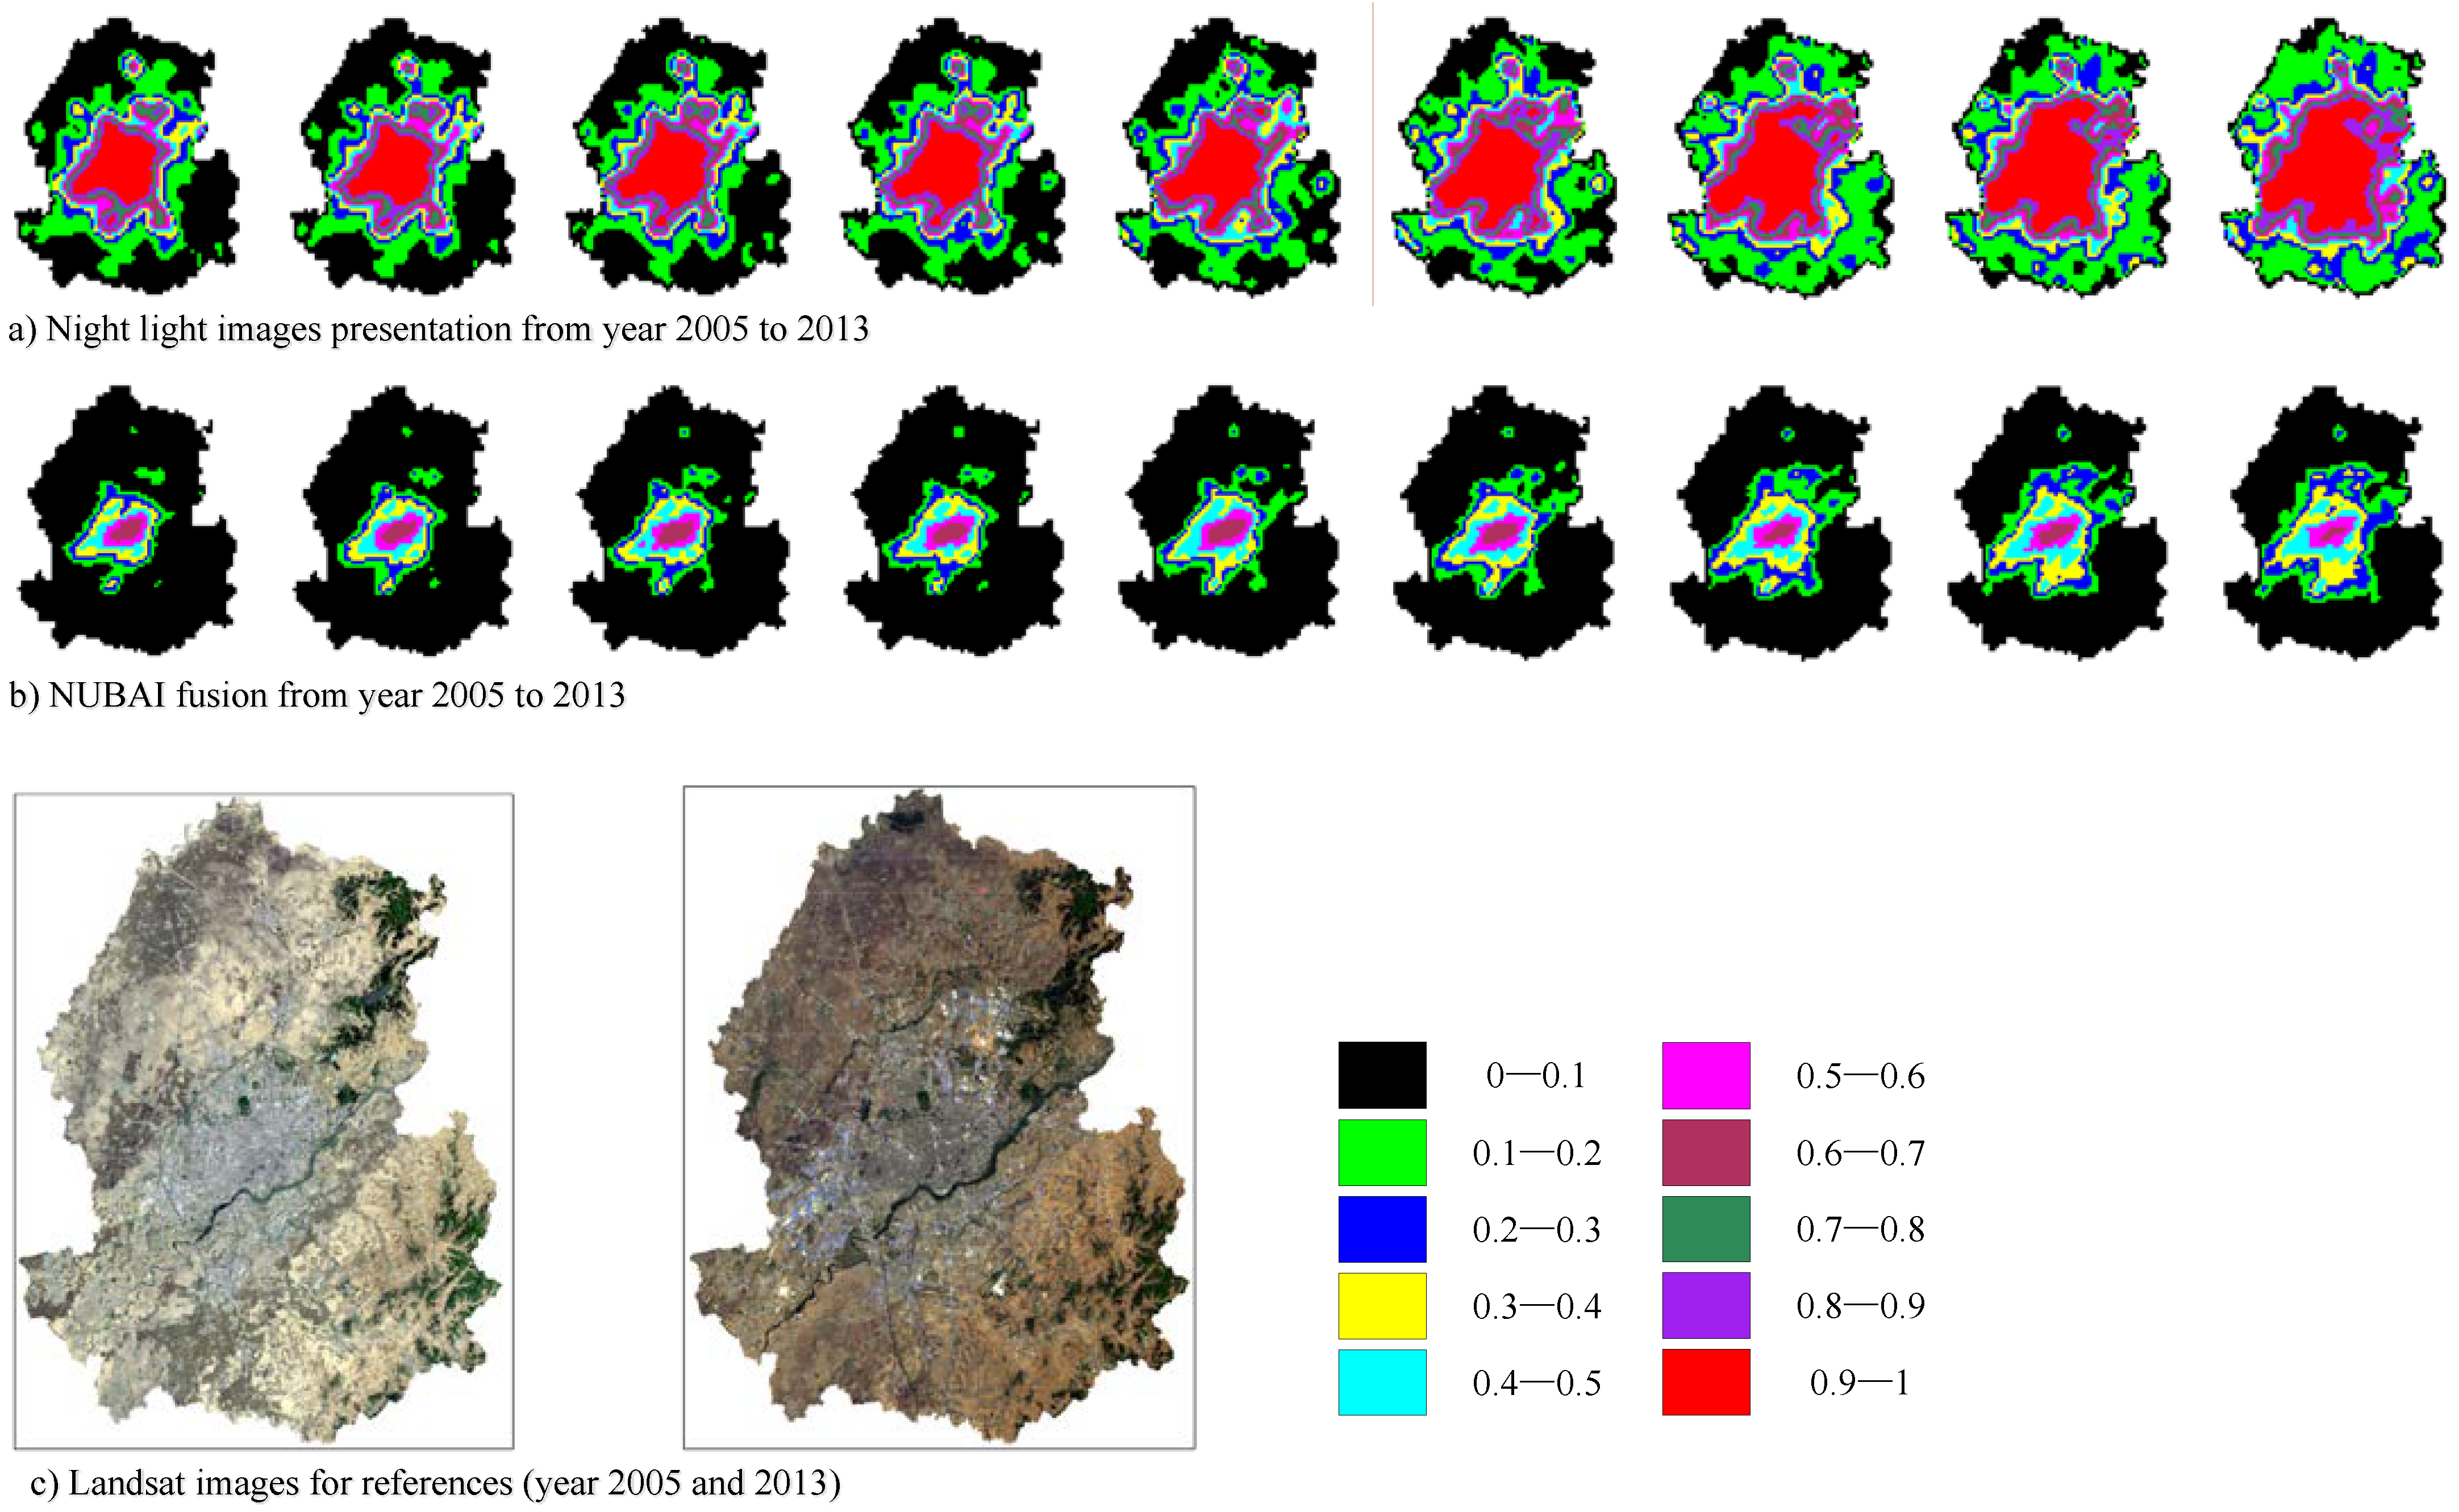
The fusion results of night light images and MODIS data were shown in Figure 3. The results were presented by density slicing with the step of 0.1. Both groups of time-series images reflected the characteristics of urban expansion of Shenyang city from 2005 to 2013. According to the Landsat images of the study area, the fusion results of NUBAI showed that the area of high-brightness region was significantly smaller than that of the only night light images. The low-brightness areas (represented by black color) of NUBAI were almost not the urban areas. While a large number of high-brightness pixels in the night light images belonged to non-urban areas. Specially, the values of NUBAI were evenly distributed in high-brightness regions, while the normalized values of the night light images were mostly concentrated above 0.9. That meant the fused NUBAI variable effectively reduced the blooming effect.
4.2. Extraction Results of Built-up Areas
4.2.1. Extraction Areas
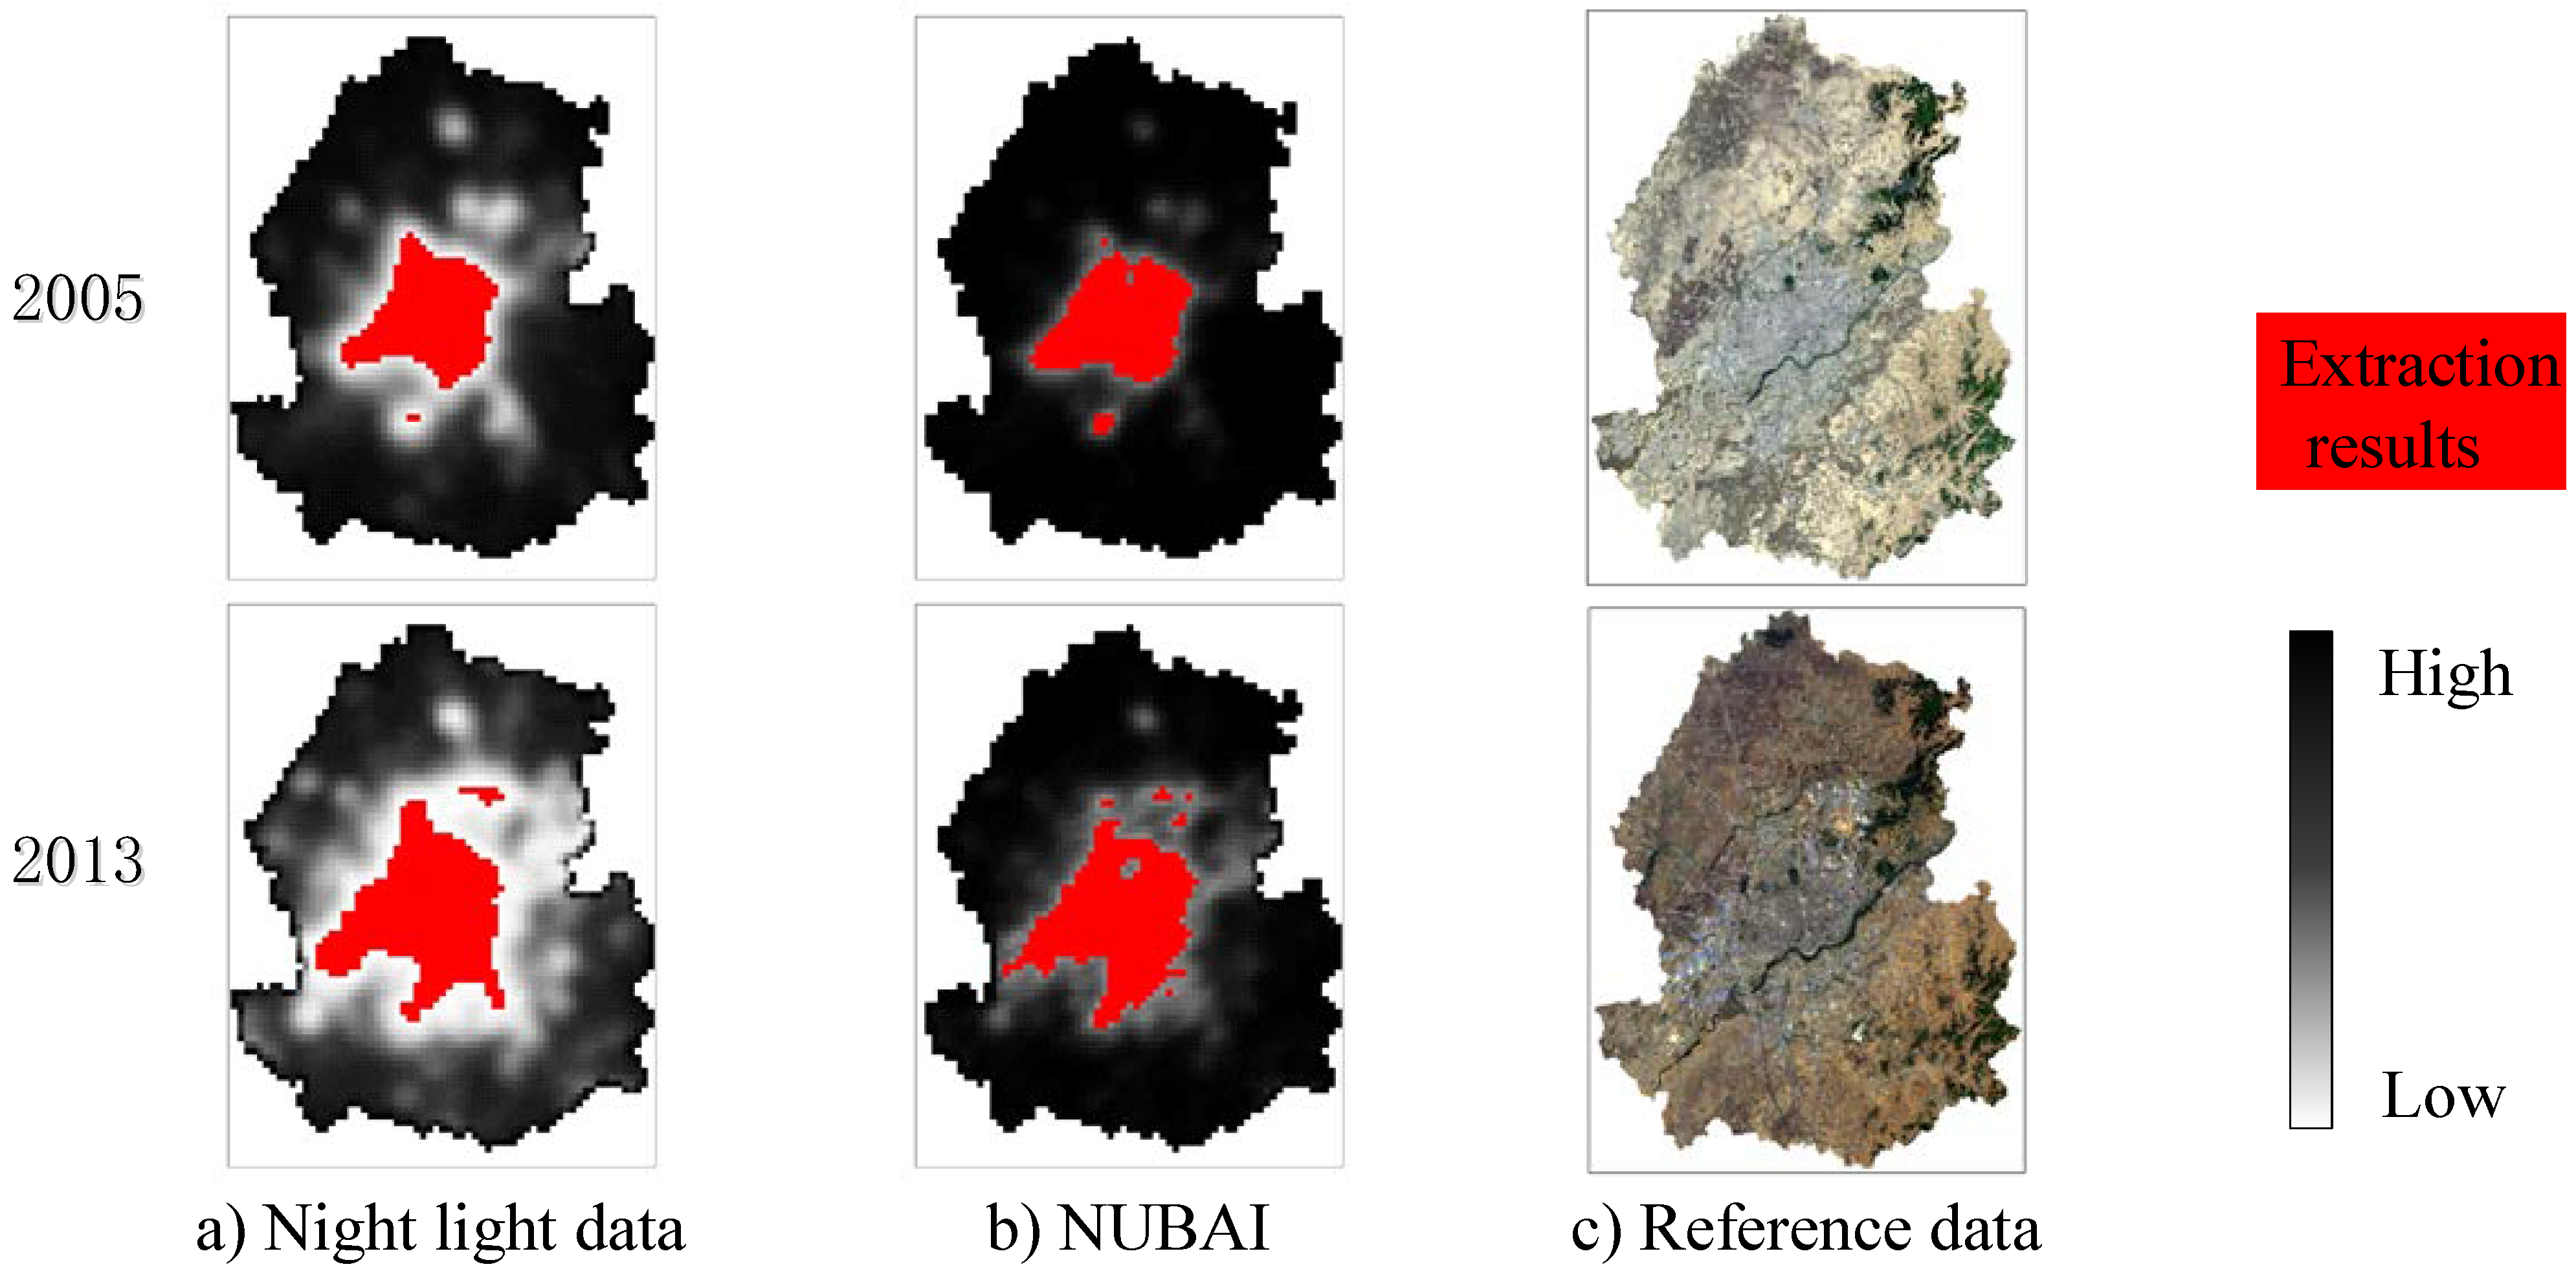
Taking the years 2005 and 2013 as the examples, Figure 4 showed the extraction results of the built-up areas based on both variables (night light data and NUBAI). It was obvious that the extraction results based on night light images were quite different from those based on the fused variables, especially for the urban fringe and sprawl areas. In addition, the results further confirmed that the only night light images were not strong enough to indicate the built-up areas, because values of the areas outside the extracted built-up areas were still high and the brightness was close to that of the built-up areas. While the NUBAI was more indicative, and the contrast between built-up and non-built-up areas was striking.
4.2.2. Accuracy Analysis
(1) Area size accuracies
The area size accuracies were calculated by Equation (7). Table 1 shows the sizes of the extracted urban built-up areas and the error rates for each year.
For most years, NUBAI produces better identification performance. The average absolute extraction error of the only night light images and NUBAI were 4.03% and 1.10%, respectively. Moreover, the variation range of NUBAI’s accuracy was relatively small, while the accuracies by night light data were quite unstable. For example, the area error of year 2012 and 2013 was close to 50 km2 (the error is 10.77%), and that of year 2009 was 15 km2 (the error was 3.80%). As for NUBAI, the maximum value of the area error was 7 km2. The possible reason is that the incorporation of temperature and vegetation information stretched the values of the regions where the values might be concentrated in the night light data. Consequently, a small error in the threshold values will not result in more misidentified pixels by NUBAI.
(2) Spatial location accuracy
Figure 5 presented the visually interpreted reference data (yellow color) and extracted results of the built-up areas (red color). The extraction results based on night light images showed higher deviation, and the consistent rate between the NUBAI extraction results and the reference data was higher. Table 2 showed the omitted and misidentified areas by both variables. In general, NUBAI had better performance and the results by the only night light images had higher error rate and missing rate.
4.3. Optimal Thresholds for Different Periods
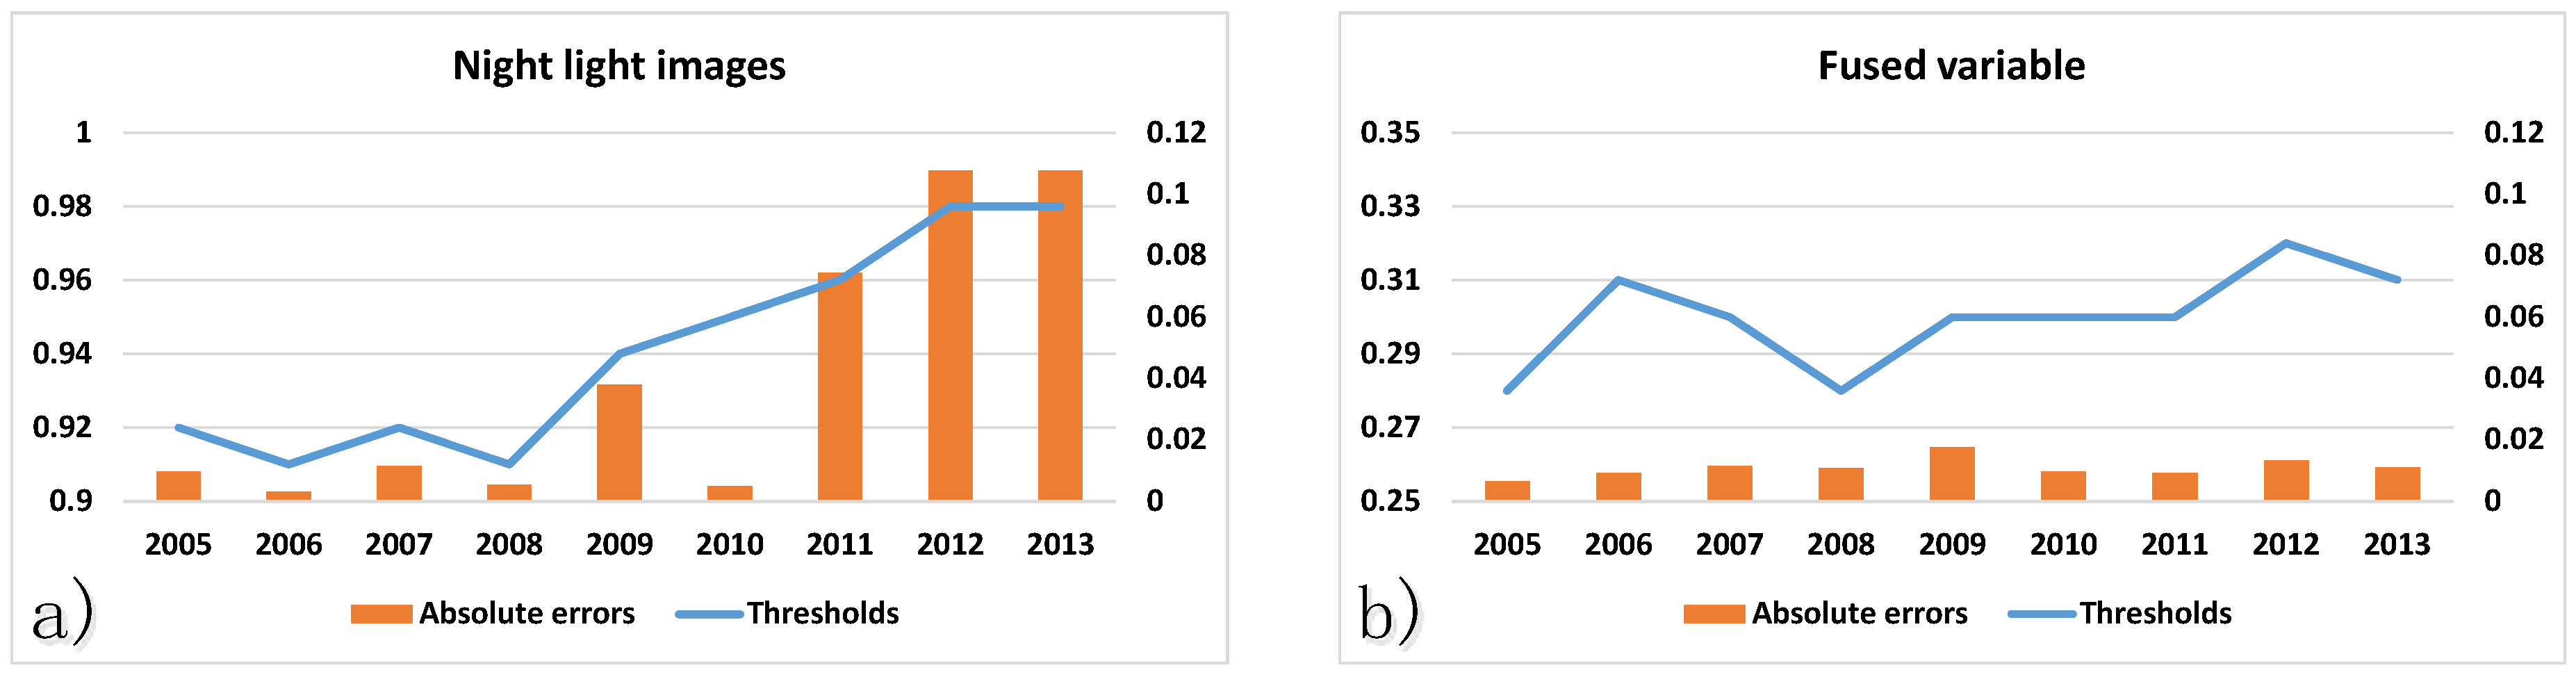
Since this research found the optimal threshold in extracting the built-up areas with the step size of 0.01, the paper reported the optimal thresholds of the only night light images and NUBAI variable for all the 9 years. Figure 6 showed the optimal threshold for each period and the related absolute error. According to the figure, the optimal thresholds of NUBAI were relatively low and stable, which were quite close to 0.30 in all periods. While the threshold fluctuation range of the normalized night light images was larger, the thresholds were very close to the maximum value 1. As the values of night light images were relatively concentrated, a small change of the thresholds yielded a greatly influence on the extraction results. It can be inferred that the optimal thresholds of night light images are likely to produce poor extraction results in certain years, like year 2009, 2012 and 2013.
5. Discussions
5.1. Major Findings from the Experiments
This study built the NUBAI index to extract the urban built-up areas by introducing MODIS surface temperature product and vegetation product. The extraction performance was tested according to the real data of the 9 year area sizes of Shenyang city. According to the above results, the built-up areas extracted by NUBAI proved better effect and the error was lower. Specially, the temperature information is worth of consideration in built-up extraction. Moreover, the incorporation of vegetation index and temperature data produced more stable thresholds (close to 0.30 for all periods).
Here, we discuss the reasons. (1) According to Equation (4), the fusion of vegetation index products and land surface temperature products reduced the likelihood that the greenery outside the city would be identified as the urban built-up areas. That is why the values of NUBAI presented a sharper gradient within a smaller spatial range. (2) Due to the fluctuation of MODIS temperature products and vegetation index products, the values of NUBAI were more stratified. Consequently, the multiple-center property of the city was better presented in NUBAI, which was consistent with the findings in other studies [46,47]. (3) The combination (multiplication) of multiple normalized MODIS products made the distribution of values more dispersed rather than concentrated in the high values (values in the normalized night light images were mostly above 0.90). As a result, the thresholds were lower (all around 0.30), more stable and reliable (the thresholds did not appear where the values were very concentrated, like in the night light images).
Moreover, we evaluate the usability of the fused variable from two aspects. (1) The previous studies focused on finding the optimal thresholds in urban built-up area extraction by night light images [48,49]. We believe that it is also important to explore the indicative variables or indices. Specially, a better index should have a stable optimal threshold for different cases and periods, because it is difficult and time-consuming to extract the optimal threshold for different cases. The proposed variable generated relatively stable thresholds in the extraction of built-up areas, and then thresholds for one period would be appropriate for different periods. Therefore, we believe the proposed variable is expected to be indicative and usable in practice. (2) In this study, the DMSP/OLS night light images, MOD11A2 daytime surface temperature products and MOD13A3 vegetation products were employed to build the fused variable. These data and products are open, and the calculation of NUBAI is relatively simple. That means the index can be fast realized.
5.2. Limitations of This Study
We must mention the limitations of this study. As for the night light images, we only acquired DMSP/OLS data. However, other open data like National Polar-orbiting Partnership/Visible Infrared Imaging Radiometer (NPP/VIIRS) and Luojia 1 night-time light images were not used in this research [11,50,51]. We will consider integrating different data into the designed index in future studies. Moreover, the temporal relationships were not considered in the extraction of built-up areas in this study, like the characteristics of the rapid development of the study area. If a city is under the period of rapid urbanization, the possibility that the built-up areas transform to other land cover types is quite low [1,52].
6. Conclusions
This research integrated DMSP/OLS images, MOD13A3 and MOD11A2 products, and designed a fused variable NUBAI for urban built-up area extraction. Taking Shenyang city as the example, the urban built-up areas from year 2005 to 2013 were extracted by both the night light images and NUBAI. We compared the image fusion results, extraction results and time-series distribution of the optimal thresholds between NUBAI and the only night light images. In general, NUBAI performed better in urban built-up area extraction with higher accuracies (average error rate 1.10%) and more consistent rates with the reference data. Specially, the optimal thresholds by the fused variable were quite stable. It can be concluded that night light images combined with multiple-source data will better extract the built-up areas and the proposed NUBAI was indicative. The possible reasons for the differences of the results were further discussed based on the methodology and the experimental results. The properties of multi-source data led to the improvements. Since the variable was designed by open data and products, the fusion algorithm of the research was a fast and practical method. In future studies, the night light images of multiple sensors should be applied to the designed variable, and the index should be employed to extract the built-up areas of more cities.
Author Contributions
G.Y. is the main author who proposed the basic idea and completed the manuscript. Y.M. provided the useful suggestions on designing the algorithms involved in this study. J.H. helped to complete the experiment. All authors have read and agreed to the published version of the manuscript.
Funding
The work was supported by China Postdoctoral Science Foundation Grant (No. 2019M662949) and Natural Science Foundation of Liaoning Province of China (No. 20180550479).
Institutional Review Board Statement
Not applicable.
Informed Consent Statement
Not applicable.
Data Availability Statement
In this study, the original DMSP/OLS data are available on https://www.ngdc.noaa.gov/eog/dmsp/downloadV4composites.html (accessed on 24 May 2021); the MODIS products are available on https://e4ftl01.cr.usgs.gov/ (accessed on 24 May 2021); the Landsat data are available on https://earthexplorer.usgs.gov/ (accessed on 24 May 2021).
Conflicts of Interest
The authors declared no conflict of interest.
References
- Gu, C.; Hu, L.; Cook, I.G. China’s urbanization in 1949–2015: Processes and driving forces. Chin. Geogr. Sci. 2017, 27, 847–859. [Google Scholar] [CrossRef]
- Ge, M.; Fang, S.; Gong, Y.; Tao, P.; Yang, G.; Gong, W. Understanding the Correlation between Landscape Pattern and Vertical Urban Volume by Time-Series Remote Sensing Data: A Case Study of Melbourne. ISPRS Int. J. Geo-Inf. 2021, 10, 14. [Google Scholar] [CrossRef]
- Zhang, S.; Li, Z.; Ning, X.; Li, L. Gauging the impacts of urbanization on CO2 emissions from the construction industry: Evidence from China. J. Environ. Manag. 2021, 288, 112440. [Google Scholar] [CrossRef]
- Balsa-Barreiro, J.; Li, Y.; Morales, A.; Pentland, A.S. Globalization and the shifting centers of gravity of world’s human dynamics: Implications for sustainability. J. Clean. Prod. 2019, 239. [Google Scholar] [CrossRef]
- Shi, K.; Huang, C.; Yu, B.; Yin, B.; Huang, Y.; Wu, J. Evaluation of NPP-VIIRS night-time light composite data for extracting built-up urban areas. Remote Sens. Lett. 2014, 5, 358–366. [Google Scholar] [CrossRef]
- Ouyang, Z.; Fan, P.; Chen, J. Urban Built-up Areas in Transitional Economies of Southeast Asia: Spatial Extent and Dynamics. Remote Sens. 2016, 8, 819. [Google Scholar] [CrossRef] [Green Version]
- Zhang, Q.; Huang, X.; Zhang, G. Urban Area Extraction by Regional and Line Segment Feature Fusion and Urban Morphology Analysis. Remote Sens. 2017, 9, 663. [Google Scholar] [CrossRef] [Green Version]
- Wei, Y.; Liu, H.; Song, W.; Yu, B.; Xiu, C. Normalization of time series DMSP-OLS nighttime light images for urban growth analysis with Pseudo Invariant Features. Landsc. Urban Plan. 2014, 128, 1–13. [Google Scholar] [CrossRef]
- Ma, T.; Zhou, C.; Pei, T.; Haynie, S.; Fan, J. Quantitative estimation of urbanization dynamics using time series of DMSP/OLS nighttime light data: A comparative case study from China’s cities. Remote Sens. Environ. 2012, 124, 99–107. [Google Scholar] [CrossRef]
- Hu, K.; Qi, K.; Guan, Q.; Wu, C.; Yu, J.; Qing, Y.; Zheng, J.; Wu, H.; Li, X. A Scientometric Visualization Analysis for Night-Time Light Remote Sensing Research from 1991 to 2016. Remote Sens. 2017, 9, 802. [Google Scholar] [CrossRef] [Green Version]
- Li, X.; Li, D.; Xu, H.; Wu, C. Intercalibration between DMSP/OLS and VIIRS night-time light images to evaluate city light dynamics of Syria’s major human settlement during Syrian Civil War. Int. J. Remote Sens. 2017, 38, 5934–5951. [Google Scholar] [CrossRef]
- Liu, Z.; He, C.; Zhang, Q.; Huang, Q.; Yang, Y. Extracting the dynamics of urban expansion in China using DMSP-OLS nighttime light data from 1992 to 2008. Landsc. Urban Plan. 2012, 106, 62–72. [Google Scholar] [CrossRef]
- Wu, J.; He, S.; Peng, J.; Li, W.; Zhong, X. Intercalibration of DMSP-OLS night-time light data by the invariant region method. Int. J. Remote Sens. 2013, 34, 7356–7368. [Google Scholar] [CrossRef]
- Milesi, C.; Elvidge, C.D.; Nemani, R.R.; Running, S.W. Assessing the impact of urban land development on net primary productivity in the southeastern United States. Remote Sens. Environ. 2003, 86, 401–410. [Google Scholar] [CrossRef]
- Sutton, P. Modeling population density with night-time satellite imagery and GIS. Comput. Environ. Urban Syst. 1997, 21, 227–244. [Google Scholar] [CrossRef]
- Sutton, P.; Roberts, D.; Elvidge, C.; Baugh, K. Census from Heaven: An estimate of the global human population using night-time satellite imagery. Int. J. Remote Sens. 2001, 22, 3061–3076. [Google Scholar] [CrossRef]
- Imhoff, M.L.; Lawrence, W.T.; Stutzer, D.C.; Elvidge, C.D. A technique for using composite DMSP/OLS ‘‘city lights’’ satellite data to map urban area. Remote Sens. Environ. 1997, 61, 361–370. [Google Scholar] [CrossRef]
- Henderson, M.; Yeh, E.T.; Gong, P.; Elvidge, C.; Baugh, K. Validation of urban boundaries derived from global night-time satellite imagery. Int. J. Remote Sens. 2003, 24, 595–609. [Google Scholar] [CrossRef]
- He, C.; Shi, P.; Li, J.; Chen, J.; Pan, Y.; Li, J.; Zhuo, L.; Toshiaki, I. Restoring urbanization process in China in the 1990s by using non-radiance calibrated DMSP/OLS nighttime light imagery and statistical data. Chin. Sci. Bull. 2006, 51, 1614–1620. [Google Scholar] [CrossRef]
- Cao, X.; Chen, J.; Imura, H.; Higashi, O. A SVM-based method to extract urban areas from DMSP-OLS and SPOT VGT data. Remote Sens. Environ. 2009, 113, 2205–2209. [Google Scholar] [CrossRef]
- Gao, F.; Masek, J.; Schwaller, M.; Hall, F. On the blending of the Landsat and MODIS surface reflectance: Predicting daily Landsat surface reflectance. IEEE Trans. Geosci. Remote Sens. 2006, 44, 2207–2218. [Google Scholar] [CrossRef]
- Zhu, X.; Chen, J.; Gao, F.; Chen, X.; Masek, J.G. An enhanced spatial and temporal adaptive reflectance fusion model for complex heterogeneous regions. Remote Sens. Environ. 2010, 114, 2610–2623. [Google Scholar] [CrossRef]
- Zhu, X.; Helmer, E.H.; Gao, F.; Liu, D.; Chen, J.; Lefsky, M.A. A flexible spatiotemporal method for fusing satellite images with different resolutions. Remote Sens. Environ. 2016, 172, 165–177. [Google Scholar] [CrossRef]
- Huang, B.; Wang, J.; Song, H.; Fu, D.; Wong, K. Generating High Spatiotemporal Resolution Land Surface Temperature for Urban Heat Island Monitoring. IEEE Geosci. Remote Sens. Lett. 2013, 10, 1011–1015. [Google Scholar] [CrossRef]
- Huang, B.; Song, H. Spatiotemporal Reflectance Fusion via Sparse Representation. IEEE Trans. Geosci. Remote Sens. 2012, 50, 3707–3716. [Google Scholar] [CrossRef]
- Zhang, Q.; Schaaf, C.; Seto, K.C. The Vegetation Adjusted NTL Urban Index: A new approach to reduce saturation and increase variation in nighttime luminosity. Remote Sens. Environ. 2013, 129, 32–41. [Google Scholar] [CrossRef]
- Kuang, W.; Yan, F. Urban structural evolution over a century in Changchun city, Northeast China. J. Geogr. Sci. 2018, 28, 1877–1895. [Google Scholar] [CrossRef]
- Lu, D.; Tian, H.; Zhou, G.; Ge, H. Regional mapping of human settlements in southeastern China with multisensor remotely sensed data. Remote Sens. Environ. 2008, 112, 3668–3679. [Google Scholar] [CrossRef]
- Weng, Q.H.; Lu, D.S.; Schubring, J. Estimation of land surface temperature-vegetation abundance relationship for urban heat island studies. Remote Sens. Environ. 2004, 89, 467–483. [Google Scholar] [CrossRef]
- Small, C. Estimation of urban vegetation abundance by spectral mixture analysis. Int. J. Remote Sens. 2001, 22, 1305–1334. [Google Scholar] [CrossRef]
- Sutton, P.C. A scale-adjusted measure of “Urban sprawl” using nighttime satellite imagery. Remote Sens. Environ. 2003, 86, 353–369. [Google Scholar] [CrossRef]
- Huang, X.; Schneider, A.; Friedl, M.A. Mapping sub-pixel urban expansion in China using MODIS and DMSP/OLS nighttime lights. Remote Sens. Environ. 2016, 175, 92–108. [Google Scholar] [CrossRef]
- Small, C.; Pozzi, F.; Elvidge, C.D. Spatial analysis of global urban extent from DMSP-OLS night lights. Remote Sens. Environ. 2005, 96, 277–291. [Google Scholar] [CrossRef]
- Jiang, L.; He, S.; Cui, Y.; Zhou, H.; Kong, H. Effects of the socio-economic influencing factors on SO2 pollution in Chinese cities: A spatial econometric analysis based on satellite observed data. J. Environ. Manag. 2020, 268. [Google Scholar] [CrossRef] [PubMed]
- Yao, R.; Wang, L.; Huang, X.; Guo, X.; Niu, Z.; Liu, H. Investigation of Urbanization Effects on Land Surface Phenology in Northeast China during 2001–2015. Remote Sens. 2017, 9, 66. [Google Scholar] [CrossRef] [Green Version]
- Xu, Y.; Qin, Z.; Wan, H. Spatial and Temporal Dynamics of Urban Heat Island and Their Relationship with Land Cover Changes in Urbanization Process: A Case Study in Suzhou, China. J. Indian Soc. Remote Sens. 2010, 38, 654–663. [Google Scholar] [CrossRef]
- Zhang, X.; Li, P.; Cai, C. Regional Urban Extent Extraction Using Multi-Sensor Data and One-Class Classification. Remote Sens. 2015, 7, 7671–7694. [Google Scholar] [CrossRef] [Green Version]
- Balcik, F.B. Determining the impact of urban components on land surface temperature of Istanbul by using remote sensing indices. Environ. Monit. Assess. 2014, 186, 859–872. [Google Scholar] [CrossRef] [PubMed]
- Morabito, M.; Crisci, A.; Messeri, A.; Orlandini, S.; Raschi, A.; Maracchi, G.; Munafo, M. The impact of built-up surfaces on land surface temperatures in Italian urban areas. Sci. Total Environ. 2016, 551, 317–326. [Google Scholar] [CrossRef]
- Lo, C.P.; Quattrochi, D.A.; Luvall, J.C. Application of high-resolution thermal infrared remote sensing and GIS to assess the urban heat island effect. Int. J. Remote Sens. 1997, 18, 287–304. [Google Scholar] [CrossRef] [Green Version]
- Carlson, T.N.; Ripley, D.A. On the relation between NDVI, fractional vegetation cover, and leaf area index. Remote Sens. Environ. 1997, 62, 241–252. [Google Scholar] [CrossRef]
- Yang, Y.; He, C.; Zhang, Q.; Han, L.; Du, S. Timely and accurate national-scale mapping of urban land in China using Defense Meteorological Satellite Program’s Operational Linescan System nighttime stable light data. J. Appl. Remote Sens. 2013, 7. [Google Scholar] [CrossRef]
- McFeeters, S.K. The use of the normalized difference water index (NDWI) in the delineation of open water features. Int. J. Remote Sens. 1996, 17, 1425–1432. [Google Scholar] [CrossRef]
- Xu, H. Modification of normalised difference water index (NDWI) to enhance open water features in remotely sensed imagery. Int. J. Remote Sens. 2006, 27, 3025–3033. [Google Scholar] [CrossRef]
- Alberg, A.J.; Park, J.W.; Hager, B.W.; Brock, M.V.; Diener-West, M. The use of “overall accuracy” to evaluate the validity of screening or diagnostic tests. J. Gen. Intern. Med. 2004, 19, 460–465. [Google Scholar] [CrossRef] [Green Version]
- Qin, Z.; Zhang, P. Simulation analysis on spatial pattern of urban population in Shenyang City, China in Late 20th century. Chin. Geogr. Sci. 2011, 21, 110–118. [Google Scholar] [CrossRef]
- Xie, Z.; Ye, X.; Zheng, Z.; Li, D.; Sun, L.; Li, R.; Benya, S. Modeling Polycentric Urbanization Using Multisource Big Geospatial Data. Remote Sens. 2019, 11, 310. [Google Scholar] [CrossRef] [Green Version]
- Li, C.; Duan, P.; Wang, M.; Li, J.; Zhang, B. The Extraction of Built-up Areas in Chinese Mainland Cities Based on the Local Optimal Threshold Method Using NPP-VIIRS Images. J. Indian Soc. Remote Sens. 2021, 49, 233–248. [Google Scholar] [CrossRef]
- Li, K.; Chen, Y. A Genetic Algorithm-Based Urban Cluster Automatic Threshold Method by Combining VIIRS DNB, NDVI, and NDBI to Monitor Urbanization. Remote Sens. 2018, 10, 277. [Google Scholar] [CrossRef] [Green Version]
- Sun, B.; Zhang, Y.; Zhou, Q.; Gao, D. Street-Scale Analysis of Population Exposure to Light Pollution Based on Remote Sensing and Mobile Big Data-Shenzhen City as a Case. Sensors 2020, 20, 2728. [Google Scholar] [CrossRef]
- Zhao, Z.; Cheng, G.; Wang, C.; Wang, S.; Wang, H. City Grade Classification Based on Connectivity Analysis by Luojia I Night-Time Light Images in Henan Province, China. Remote Sens. 2020, 12, 1705. [Google Scholar] [CrossRef]
- Cai, S.; Liu, D.; Sulla-Menashe, D.; Friedl, M.A. Enhancing MODIS land cover product with a spatial-temporal modeling algorithm. Remote Sens. Environ. 2014, 147, 243–255. [Google Scholar] [CrossRef]
Figure 1.
Study area.

Figure 2.
Process of the urban built-up extraction.

Figure 3.
Image fusion results. (a) Night light images; (b) NUBAI fusion results; (c) Landsat images for reference. Values in the night light images and NUBAI were between 0 and 1.
Figure 3.
Image fusion results. (a) Night light images; (b) NUBAI fusion results; (c) Landsat images for reference. Values in the night light images and NUBAI were between 0 and 1.

Figure 4.
Built-up area extraction results by different variables. (a) Night light data; (b) NUBAI; (c) reference data.
Figure 4.
Built-up area extraction results by different variables. (a) Night light data; (b) NUBAI; (c) reference data.

Figure 5.
Verification of the spatial locations. (a) Night light data and (b) NUBAI.

Figure 6.
Optimal thresholds and the related absolute errors for 9 years. (a) By the only night light images and (b) by the fused variable NUBAI. The thresholds are related to the primary axis (left) and the accuracies are related to the secondary axis (right). To compare the degree of the stability of both variables, we set the same length to the axis ranges in two figures, namely 0.9–1 and 0.25–0.35. To compare the extraction effect (absolute error), all the values of the secondary axis are set to the same in two figures.


Table 1.
Error analysis of the area sizes from 2005 to 2013.
| Years | Statistical Area Sizes/km2 | Extraction Results by Night Light Data | Extraction Results by NUBAI | ||
|---|---|---|---|---|---|
| Area Sizes/km2 | Error Rate | Area Sizes/km2 | Error Rate | ||
| 2005 | 310 | 307 | −0.97% | 312 | 0.65% |
| 2006 | 325 | 326 | 0.31% | 322 | −0.92% |
| 2007 | 347 | 351 | 1.15% | 351 | 1.15% |
| 2008 | 370 | 368 | −0.54% | 374 | 1.08% |
| 2009 | 395 | 410 | 3.80% | 388 | −1.77% |
| 2010 | 412 | 410 | −0.49% | 408 | −0.97% |
| 2011 | 430 | 462 | 7.44% | 426 | −0.93% |
| 2012 | 455 | 504 | 10.77% | 449 | −1.32% |
| 2013 | 455 | 504 | 10.77% | 450 | −1.10% |
Table 2.
Statistics of the omitted area sizes and misidentified area sizes.
| Years | Night Light Data | NUBAI | ||
|---|---|---|---|---|
| Omitted/km2 | Misidentified/km2 | Omitted /km2 | Misidentified /km2 | |
| 2005 | 35.00 | 31.91 | 9.82 | 11.73 |
| 2010 | 43.24 | 41.23 | 23.35 | 19.33 |
Publisher’s Note: MDPI stays neutral with regard to jurisdictional claims in published maps and institutional affiliations. |
© 2021 by the authors. Licensee MDPI, Basel, Switzerland. This article is an open access article distributed under the terms and conditions of the Creative Commons Attribution (CC BY) license (https://creativecommons.org/licenses/by/4.0/).
Share and Cite
MDPI and ACS Style
Yang, G.; Ma, Y.; Hu, J. A Fused Variable by Night Light Images and MODIS Products for Improving Urban Built-Up Area Extraction. Technologies 2021, 9, 40. https://0-doi-org.brum.beds.ac.uk/10.3390/technologies9020040
AMA Style
Yang G, Ma Y, Hu J. A Fused Variable by Night Light Images and MODIS Products for Improving Urban Built-Up Area Extraction. Technologies. 2021; 9(2):40. https://0-doi-org.brum.beds.ac.uk/10.3390/technologies9020040
Chicago/Turabian StyleYang, Guang, Yuntao Ma, and Jiaqi Hu. 2021. "A Fused Variable by Night Light Images and MODIS Products for Improving Urban Built-Up Area Extraction" Technologies 9, no. 2: 40. https://0-doi-org.brum.beds.ac.uk/10.3390/technologies9020040
Note that from the first issue of 2016, this journal uses article numbers instead of page numbers. See further details here.