
Open-Source Script for Design and 3D Printing of Porous Structures for Soil Science

 , ,
, ,  , , and
Abstract
:1. Introduction
2. Materials and Methods
2.1. The Need for 3D-Printed Samples in Soil Science
- For the present study, the monolith has a cylindrical shape with a maximum radius of 20 mm and a maximum height of 70 mm (these values can be modified depending on the 3D printer used);
- The porosity of the monolith must be controllable;
- The monolith structure must be an open-cell, i.e., it permits the flow of water;
- The monolith design software (or script) must be open-source in order to make it available to the scientific community and to allow for its evolution;
- The design software (or script) should provide a user-friendly interface for the configuration of the monolith;
- The 3D printer used to produce the monoliths should preferably be open-source;
- The design and fabrication of monoliths must be replicable;
- The materials used for the 3D-printing of monoliths must be non-toxic to plants, fauna, and fungi;
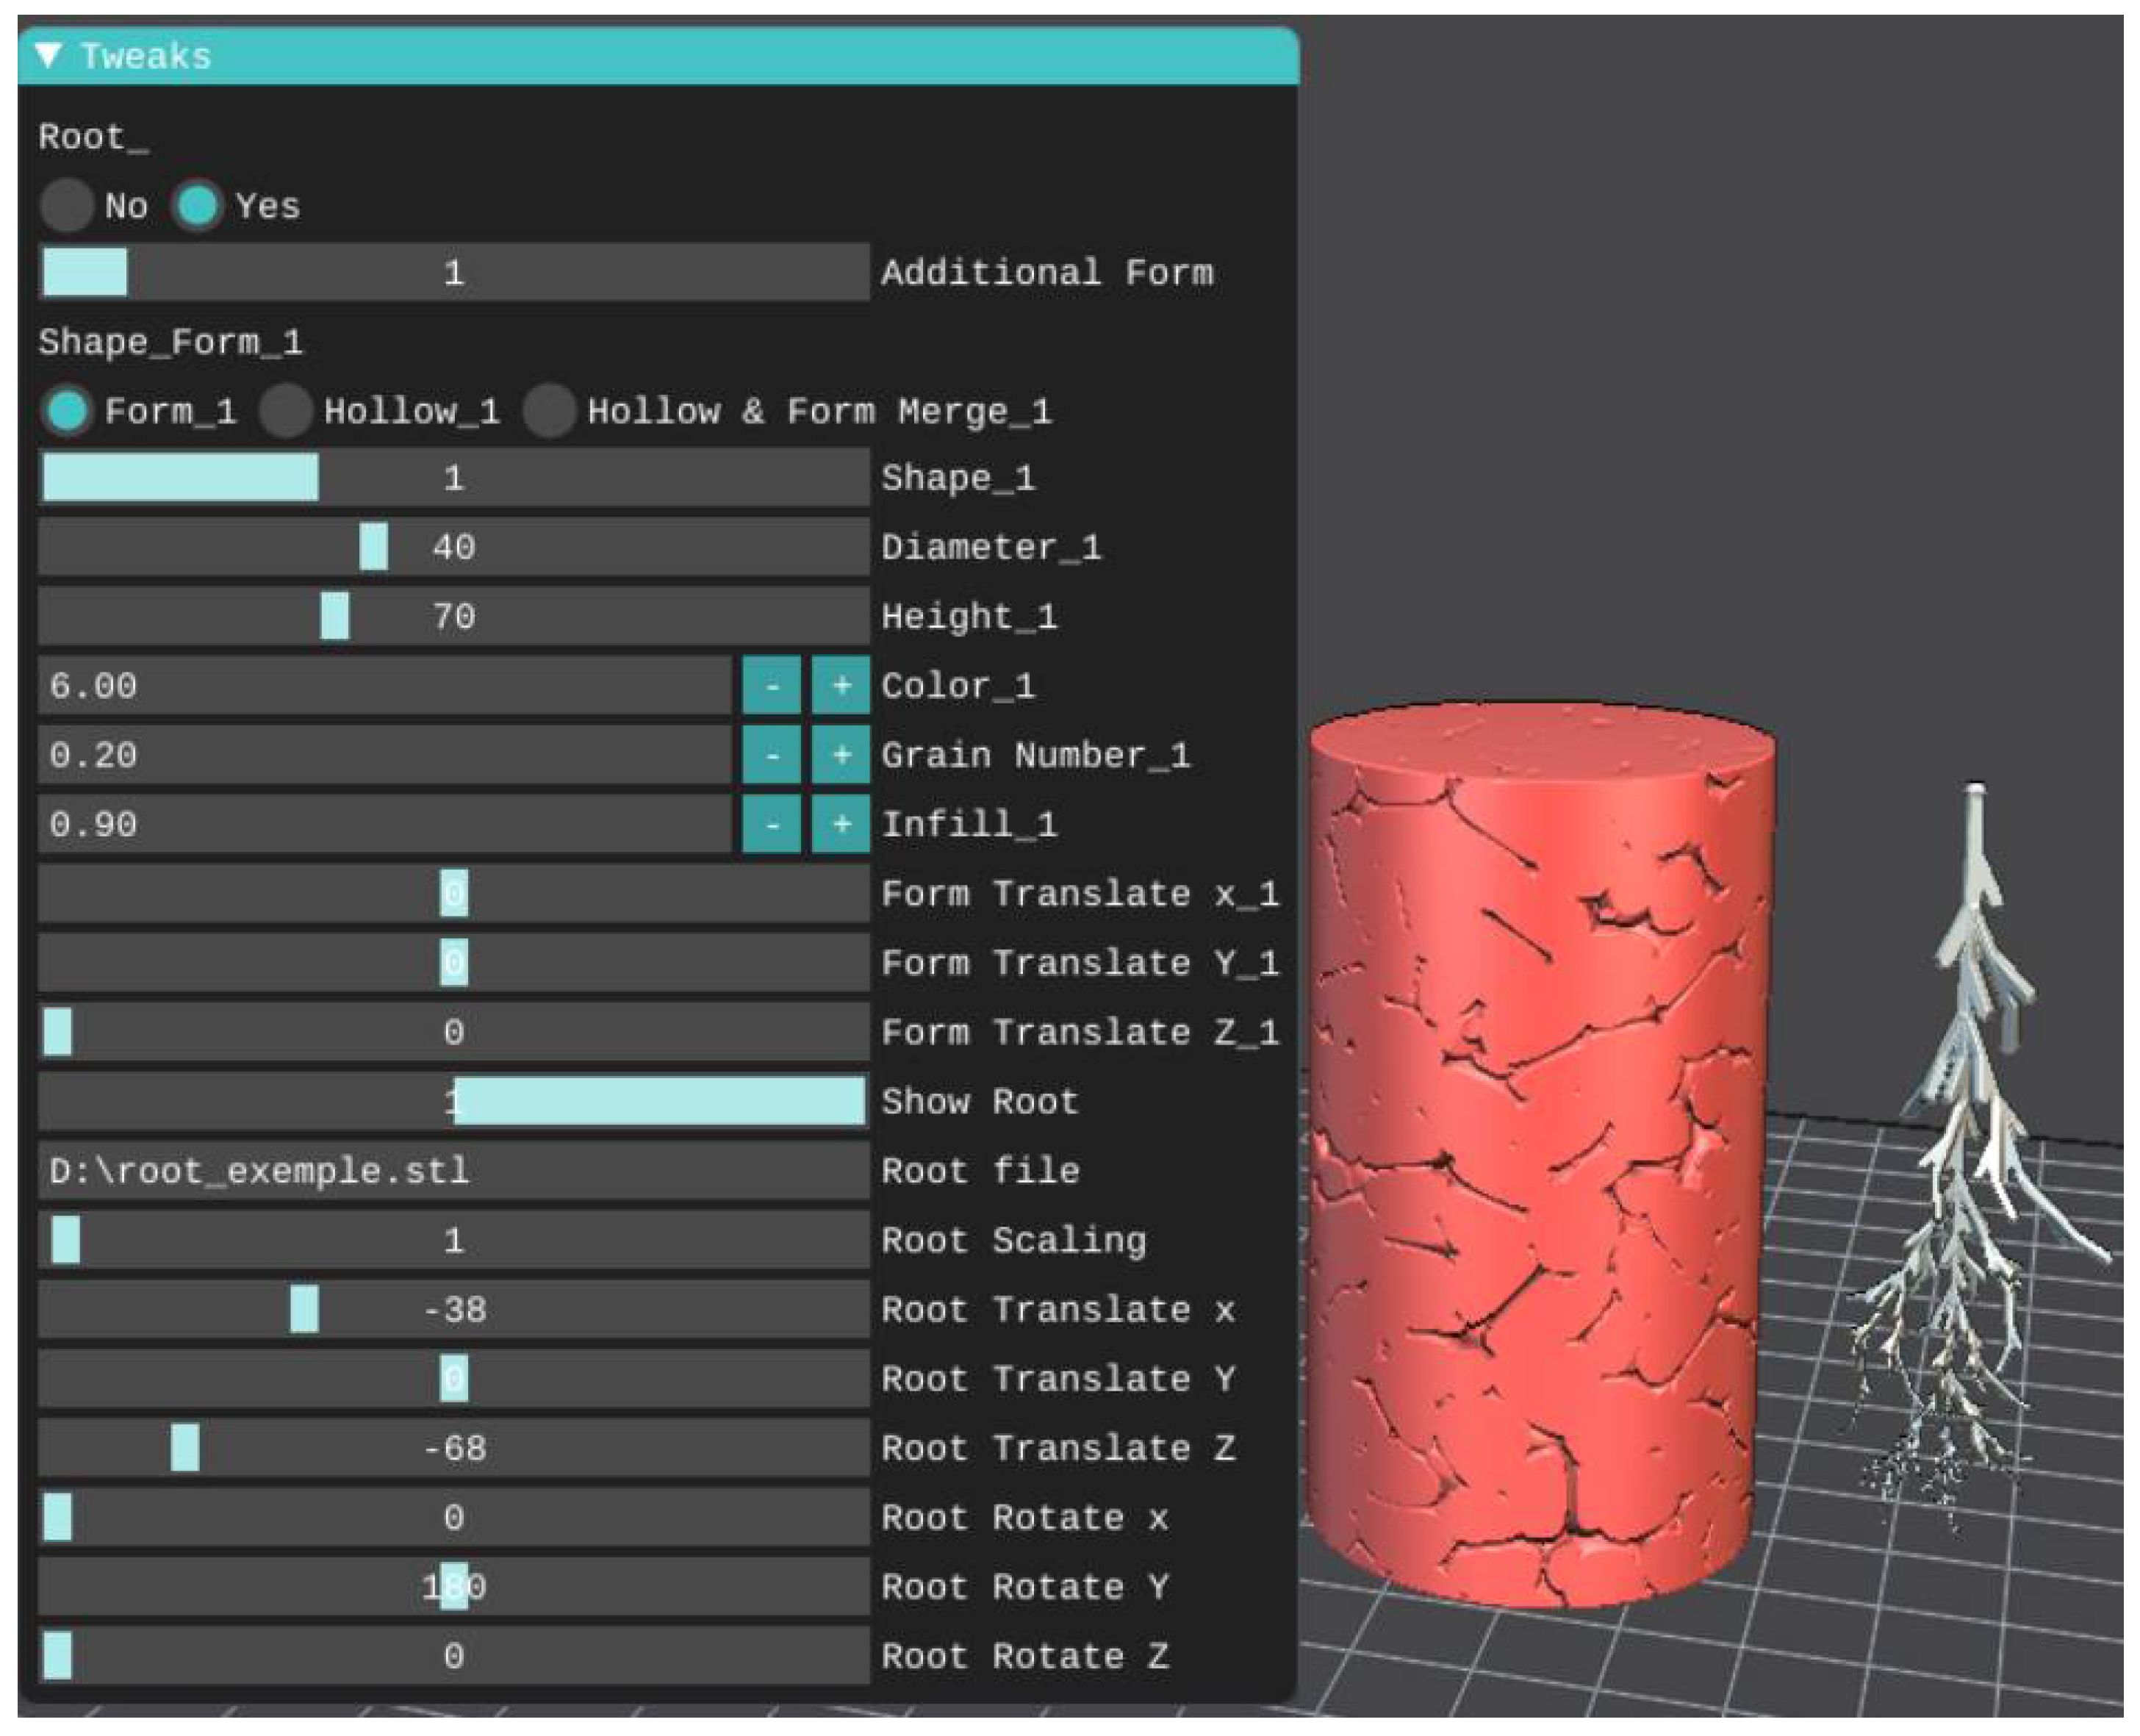
- It is preferable that the script gives the possibility to add a root system to the monolith model (i.e., to create a void root system).
2.2. Script Developement Methodology
2.2.1. Study of Mathematical Models
- Marching cubes is a computer graphics algorithm for extracting a polygonal mesh of an iso-surface from a three-dimensional scalar field. It is widely used to reconstruct a surface from medical X-ray tomography scans and to create an STL file [29]. This algorithm is less adapted to our context because using the STL format will degrade the resolution of the generated structure.
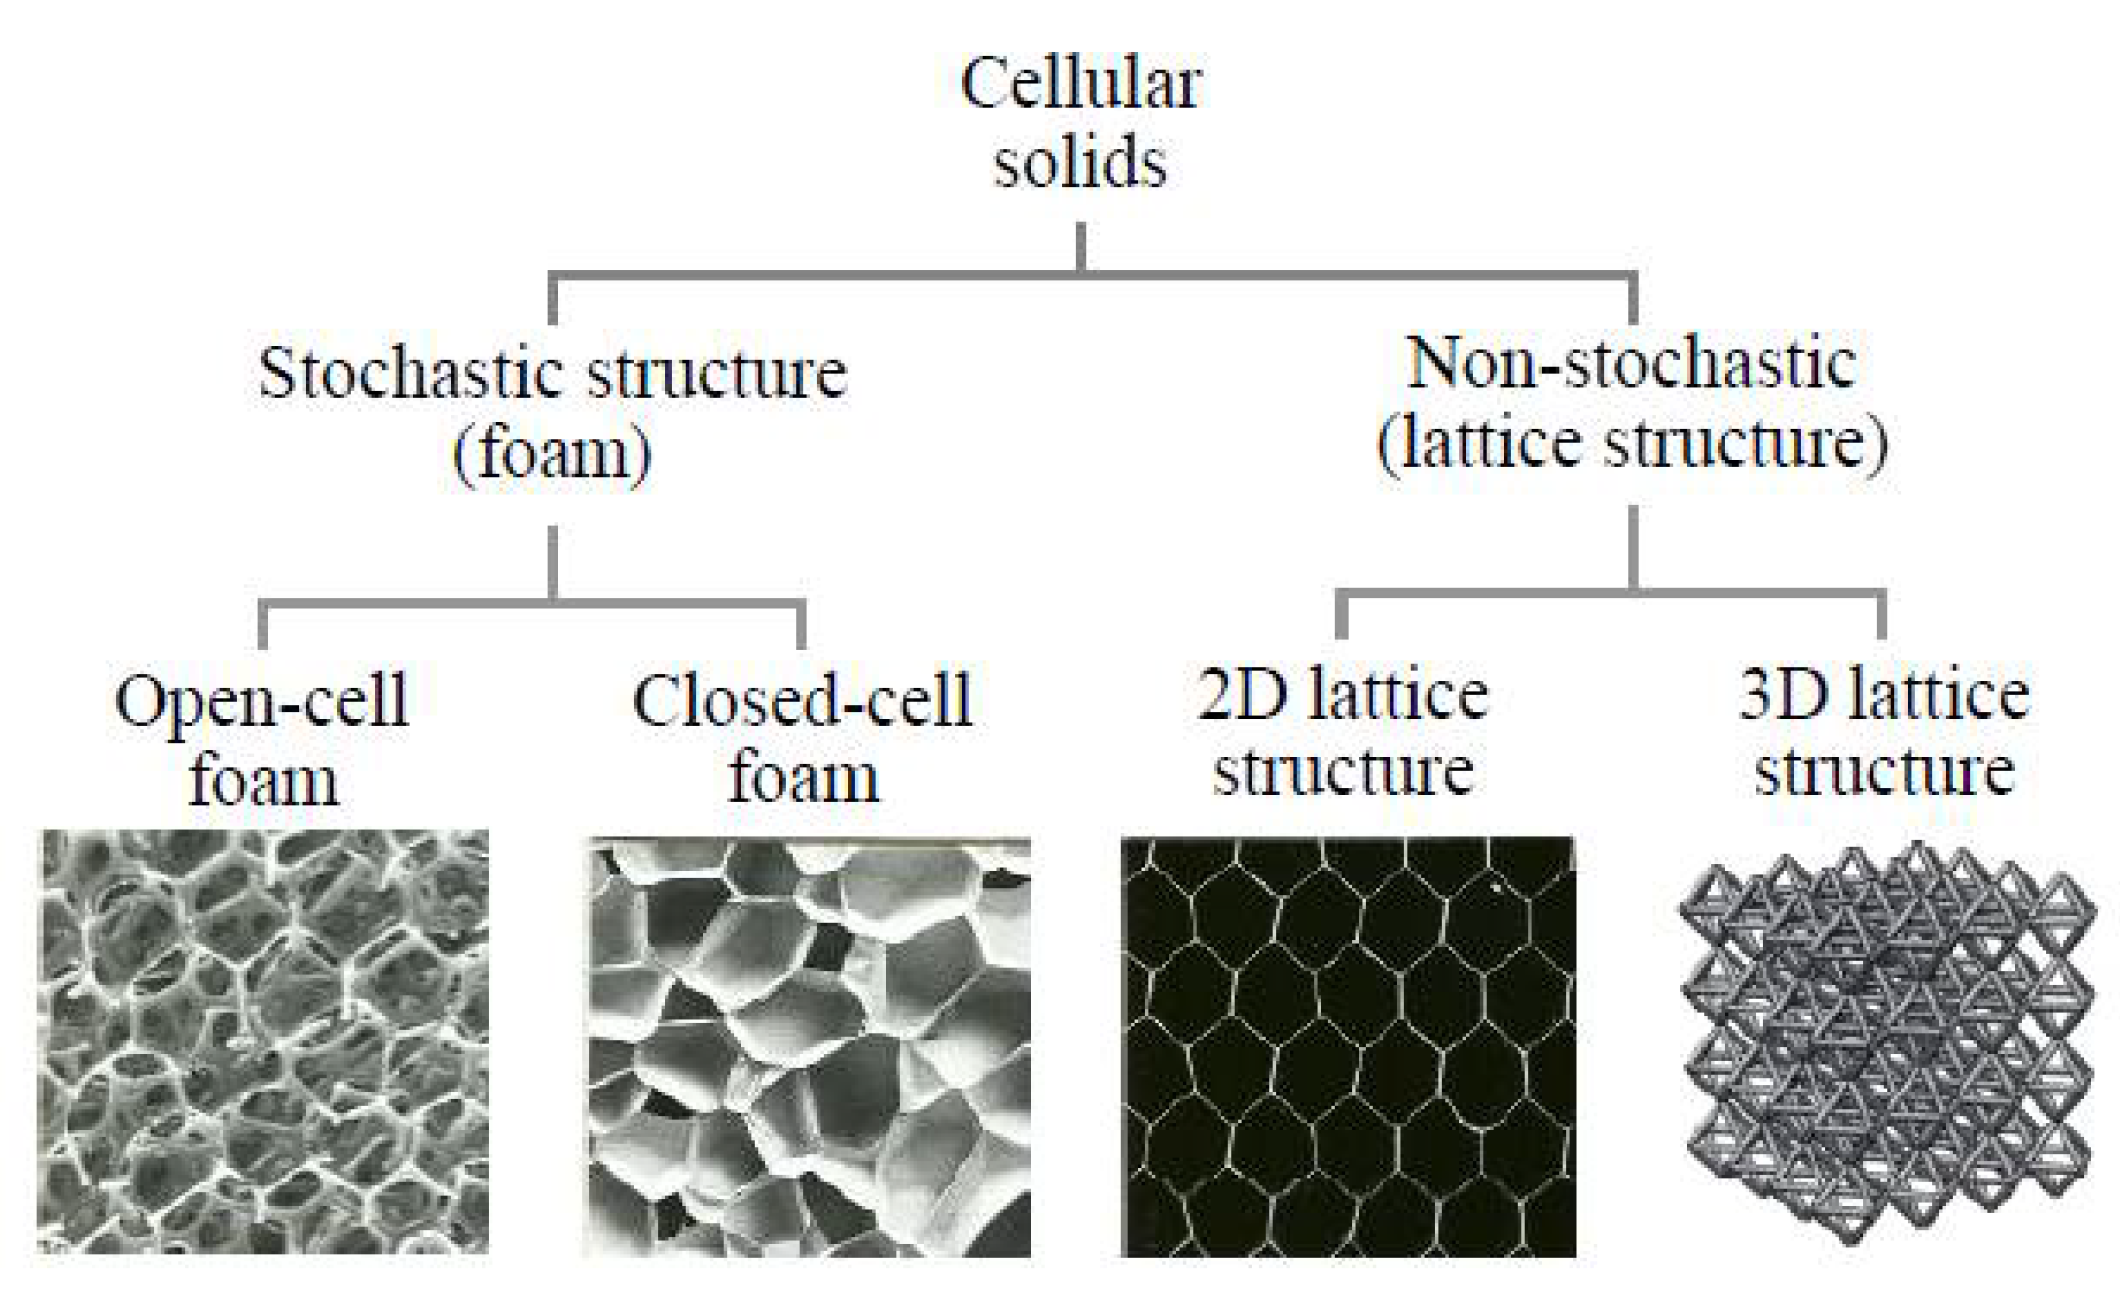
- The generation of lattices—periodic arrays of trusses (geometric patterns)—when combined, yield unique properties [30]. Morphological characteristics of the lattices, such as their orientation, size, and spatial arrangement (random, regular, irregular) can be optimized to improve the mechanical properties and manufacturability. Lattices, however, are more suitable for predefined internal structures and not for random internal structures as in the case of monoliths.
- Generation of a trabecular structure, also called foam structure, is a derivative of the lattice structure. The trabecular network is an open-cell random structure with interconnected voids. The trabecular structure is largely used in the 3D printing of human bones.
- The L-System, or Lindenmayer system, is a common tool in plant architecture modeling that is used for creating root architecture [31]. It will help in creating the required root system in the monolith model as described later
2.2.2. Study of Basic Soil Structures
2.2.3. Selection of the Development Software
2.2.4. Monolith Script Development
2.2.5. Analysis of Digital and 3D-Printed Monoliths
- Intergranular porosity is the ratio of volume of voids to total volume.
- Specific surface is the ratio of the total interface between solid and voids to solid volume. The interface between solid and voids is computed using the Cauchy–Crofton algorithm with C6 connectivity (voxels are considered connected if they have at least a face in common) in the MorphoLibJ package [38].
- The tortuosity is calculated as the ratio of the geodesic distance to the Euclidian distance between the inlet face and the outlet face. The geodesic distance is computed following the methodology described in [38], and the Euclidian distance corresponds to the size of the sample.
- Pore size distribution is computed using the MIP (Mercury Intrusion Porosimetry) simulation algorithm in the XLib package [37]. The MIP simulation algorithm simulates intrusion from one face in a manner similar to how the experimental measurement in MIP is performed.
- Granulometry (or grain size distribution) is computed in two steps. First, the grains are separated using the ‘Disconnect Particles’ algorithm in XLib [39]. Then, their properties are computed using the MorphoLibJ plugin. The particle diameter is obtained from the particle volume using an equivalent sphere approach.
- Hydraulic conductivities are obtained by numerical upscaling. The Stokes equation of flow is solved using the Lattice Boltzmann Method (LBM) [40,41] on the 3D image. Using the average value of the flow rate, permeability (in m2) in the direction orthogonal to the printing slices, can then be obtained. By analogy to the properties commonly used in soil science, permeabilities are then converted to hydraulic conductivities (in m/s).
3. Results
3.1. Analysis of the Digital Monoliths
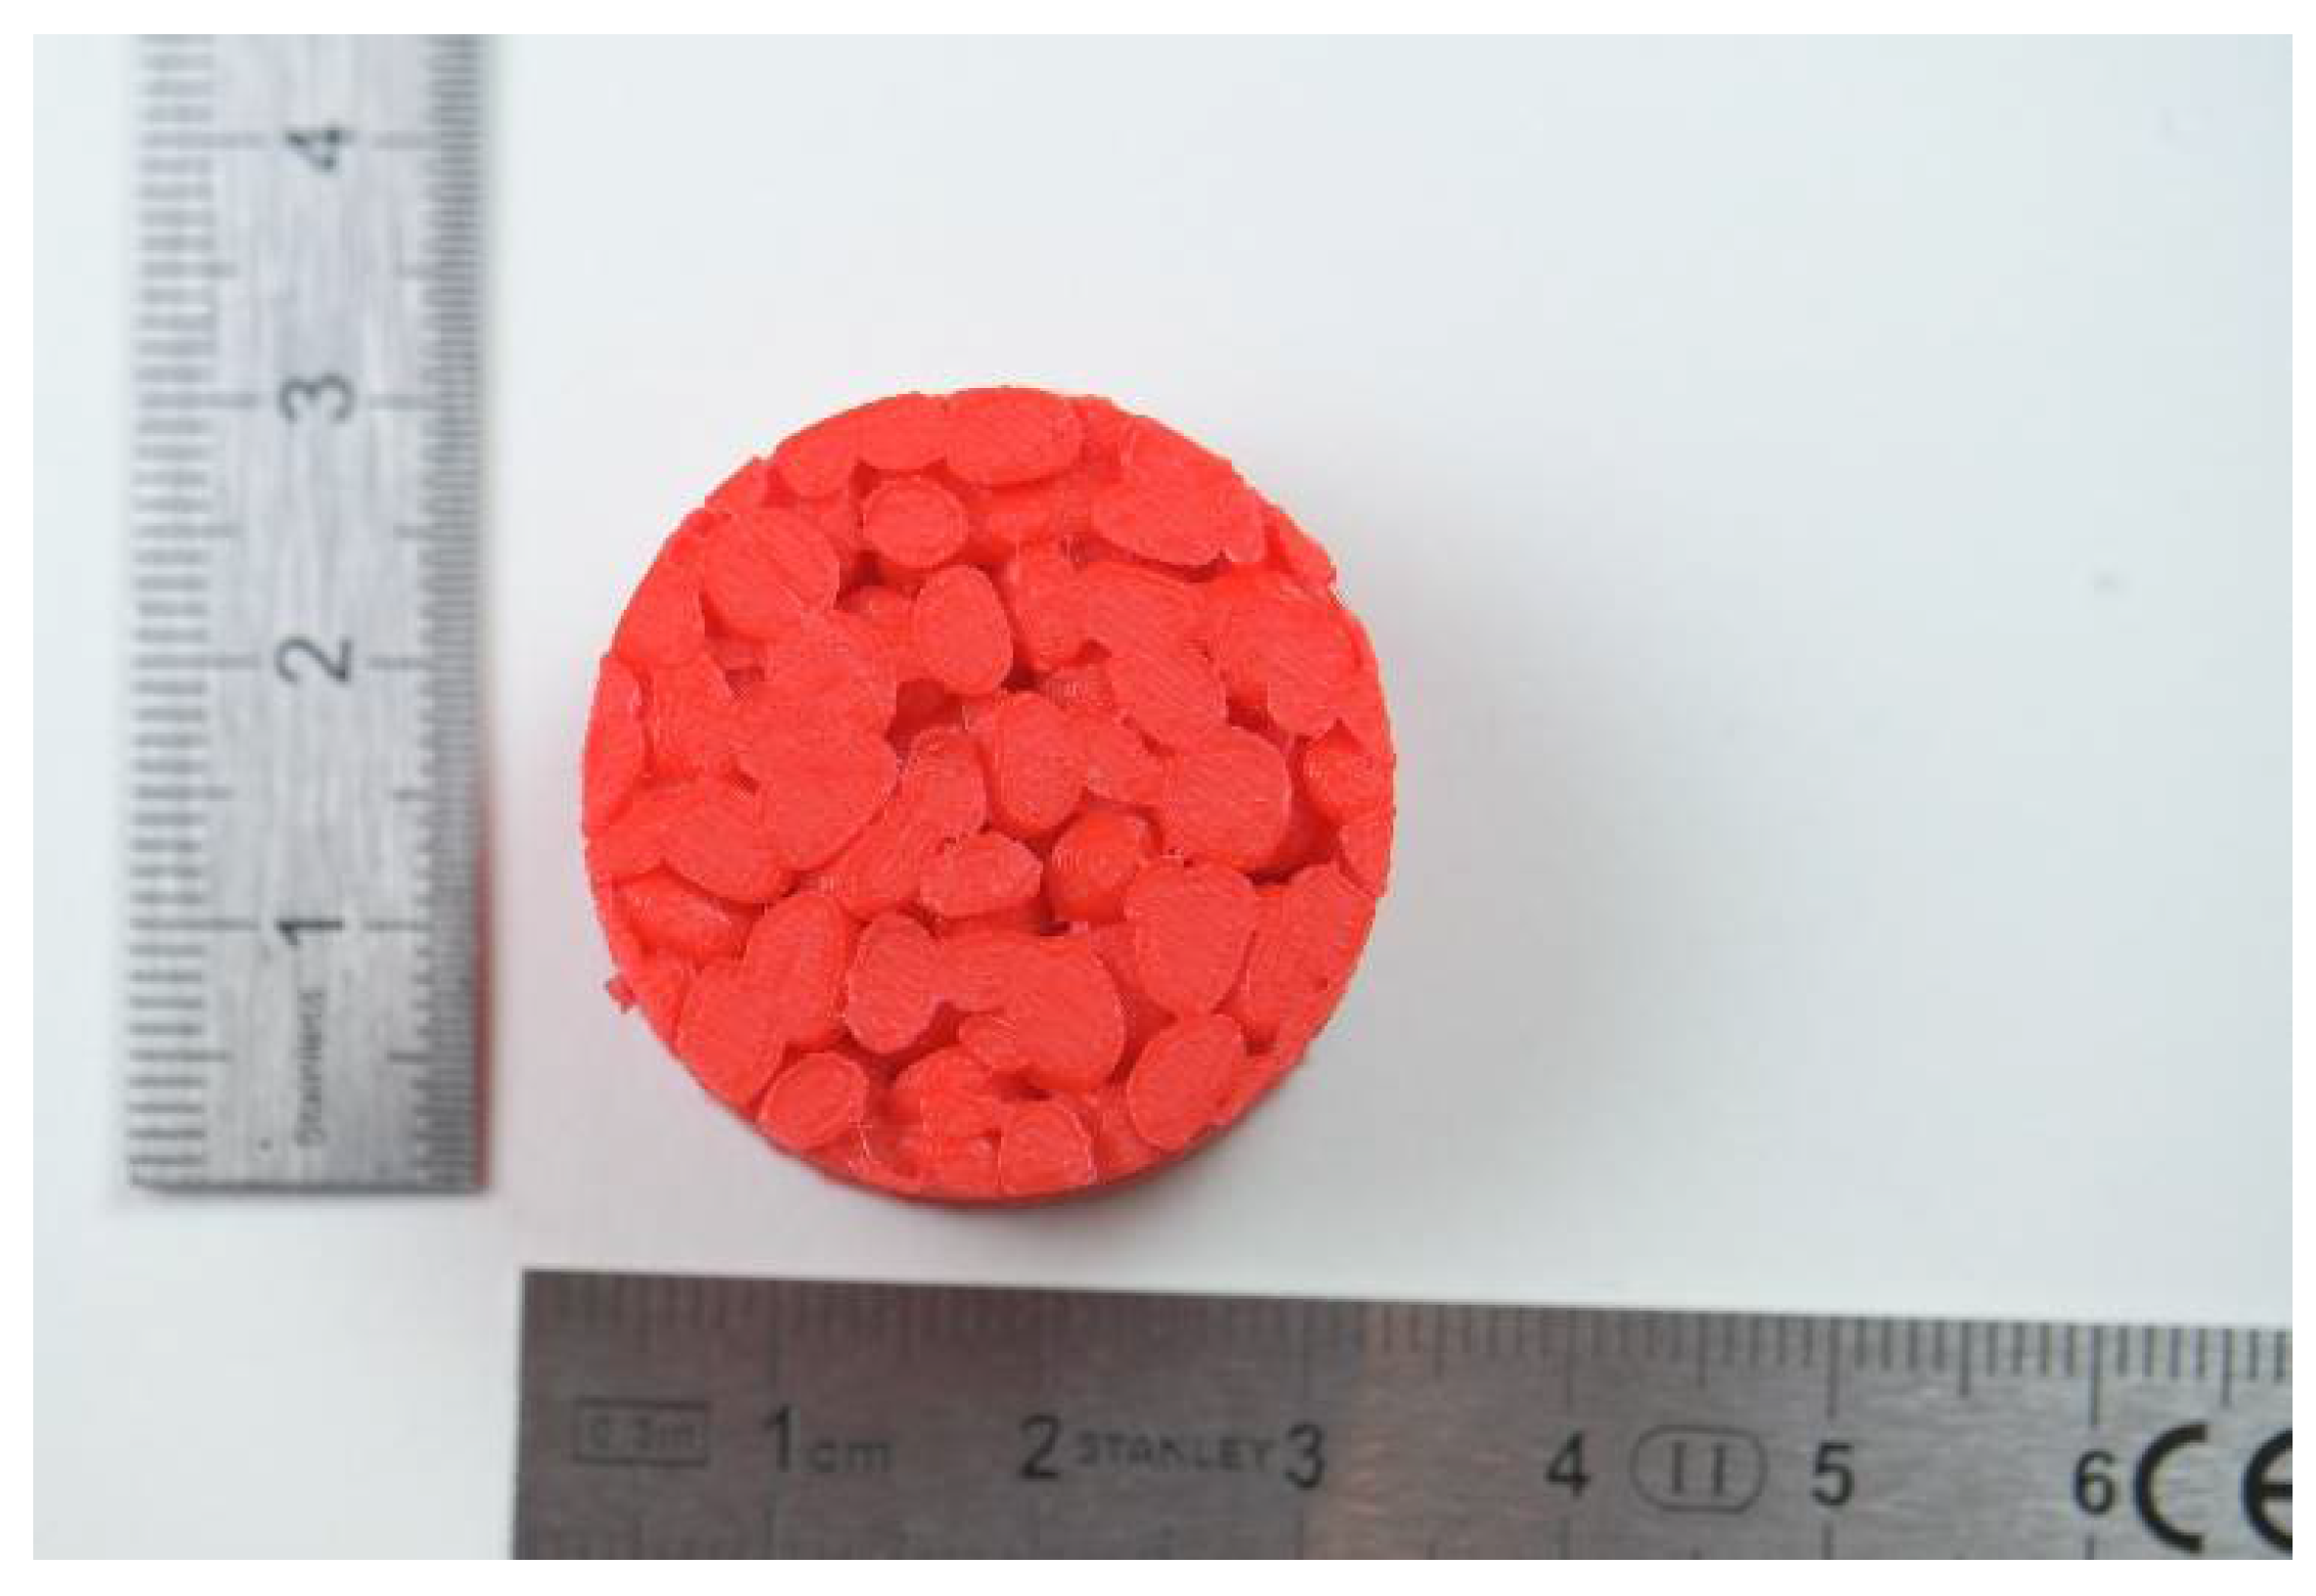
3.2. 3D Printing of the Monoliths
4. Discussion
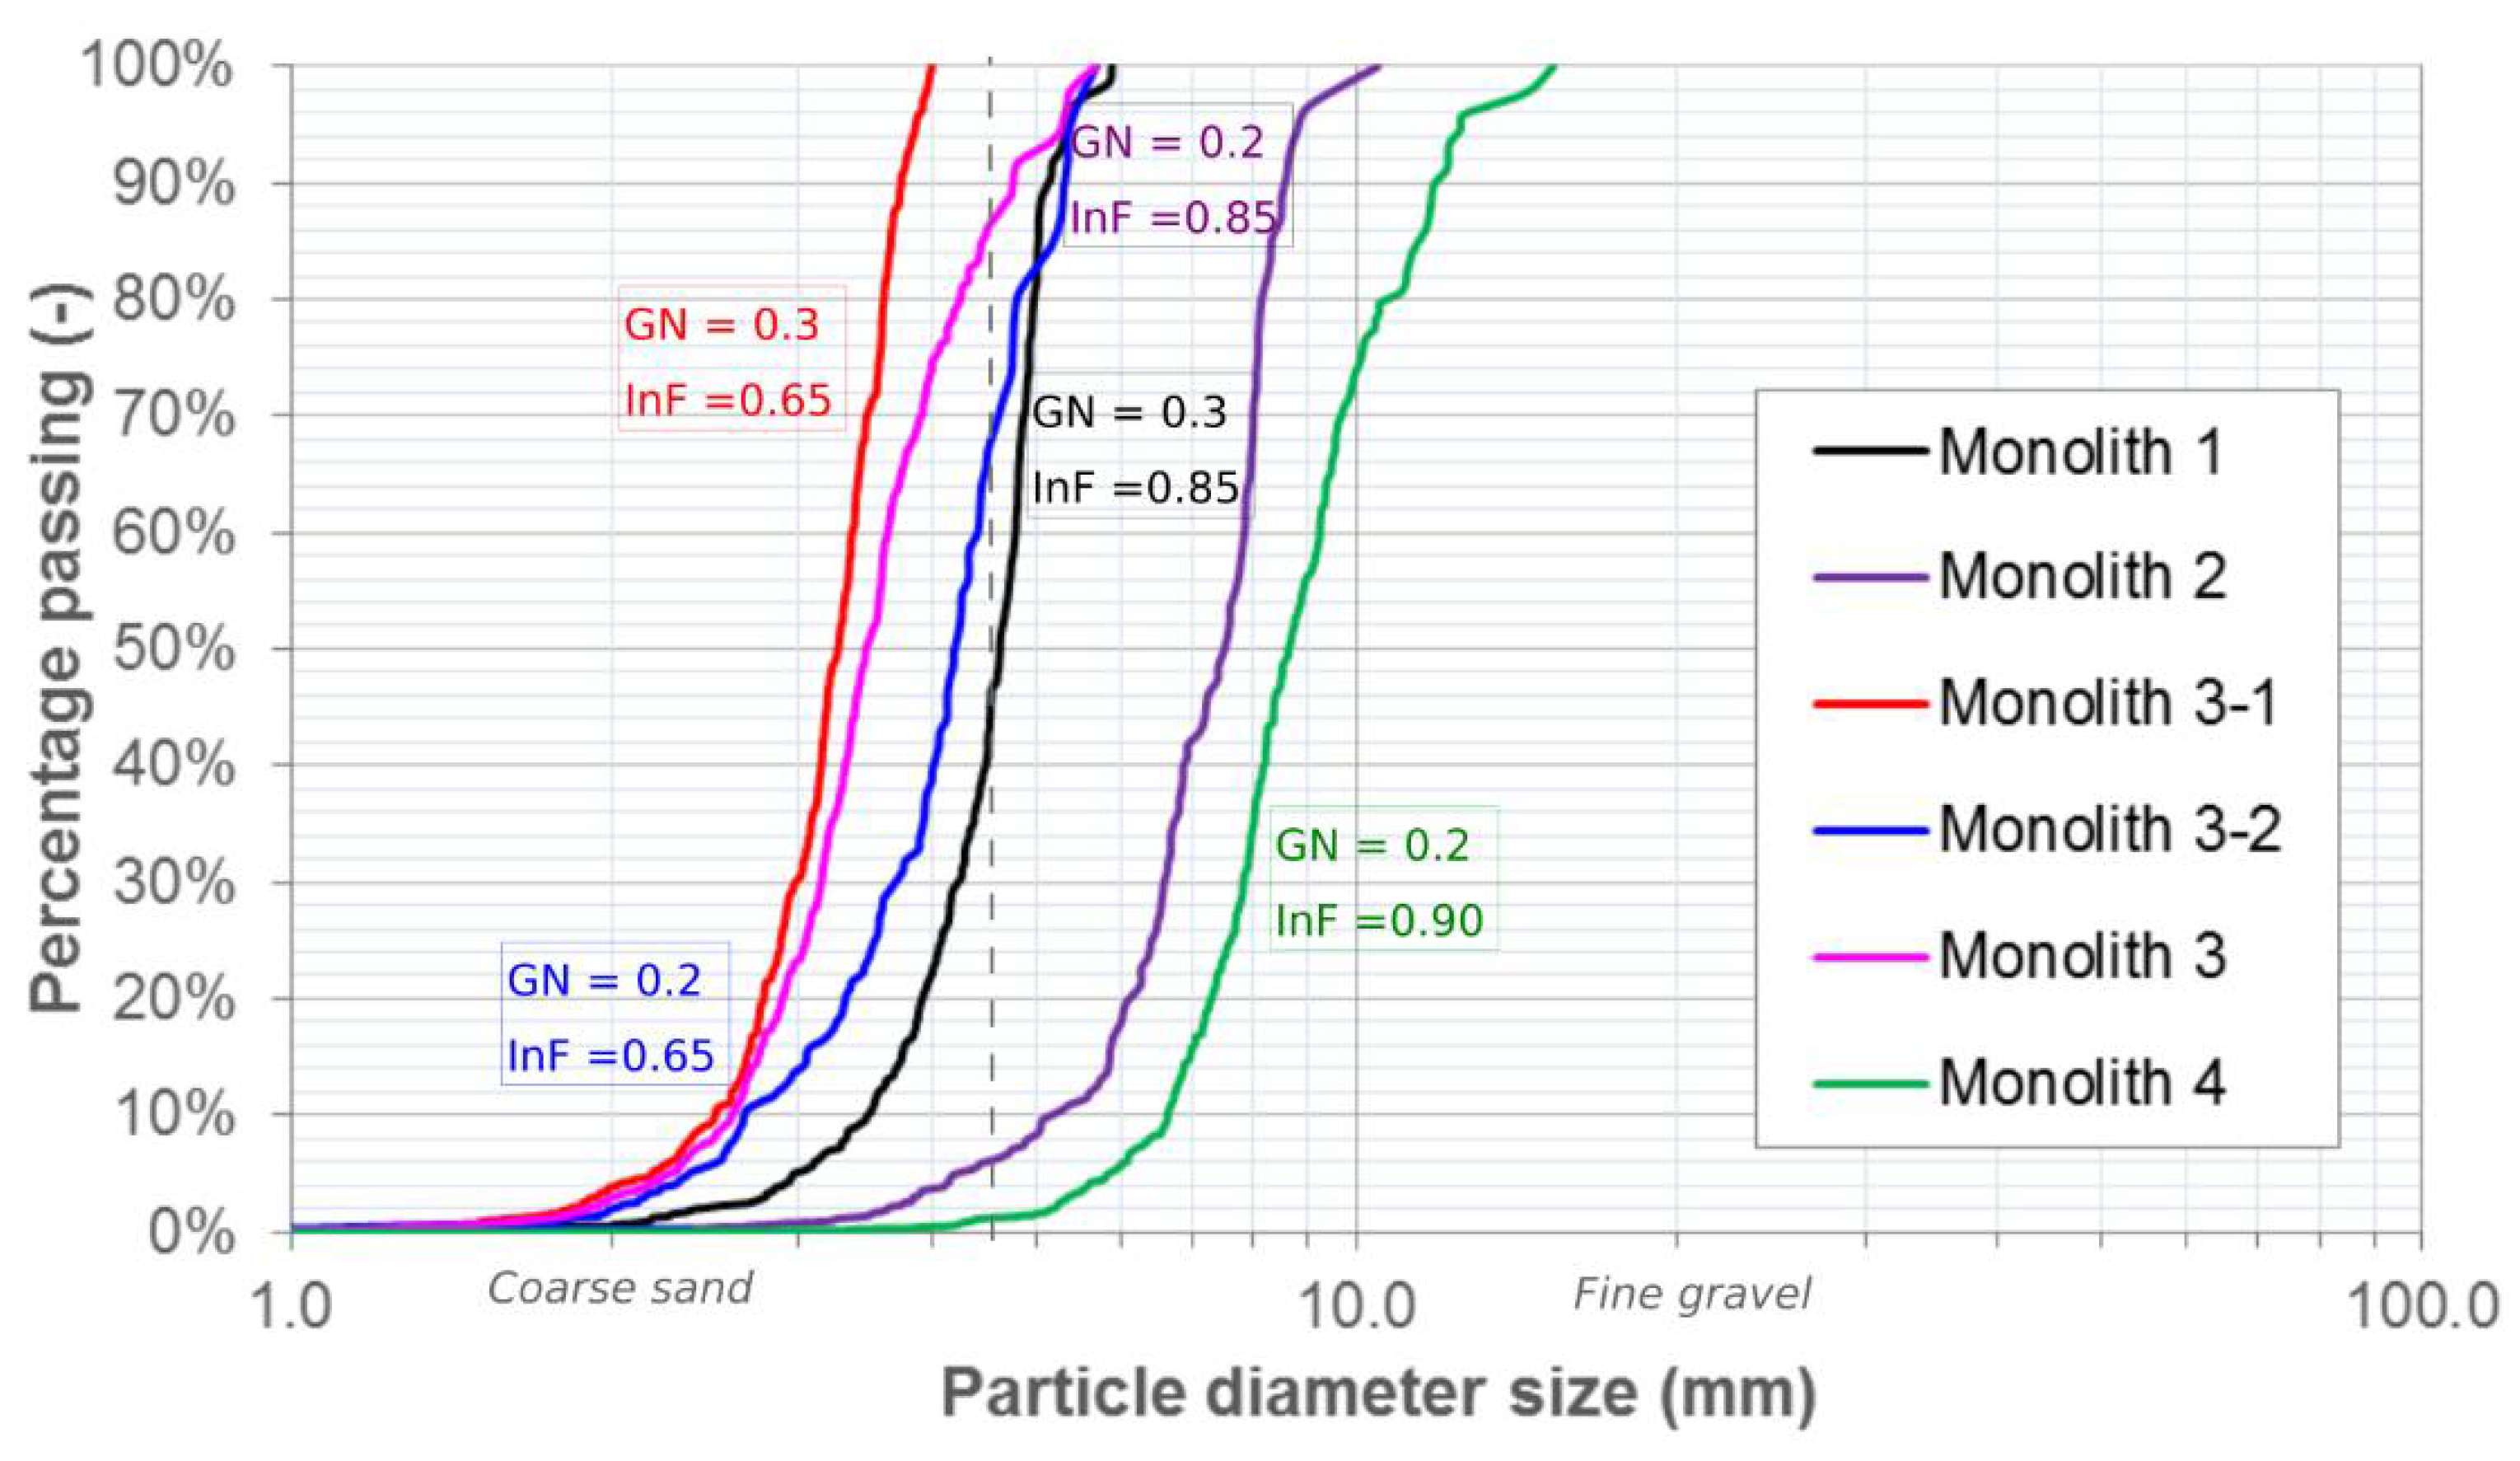
4.1. Granulometry
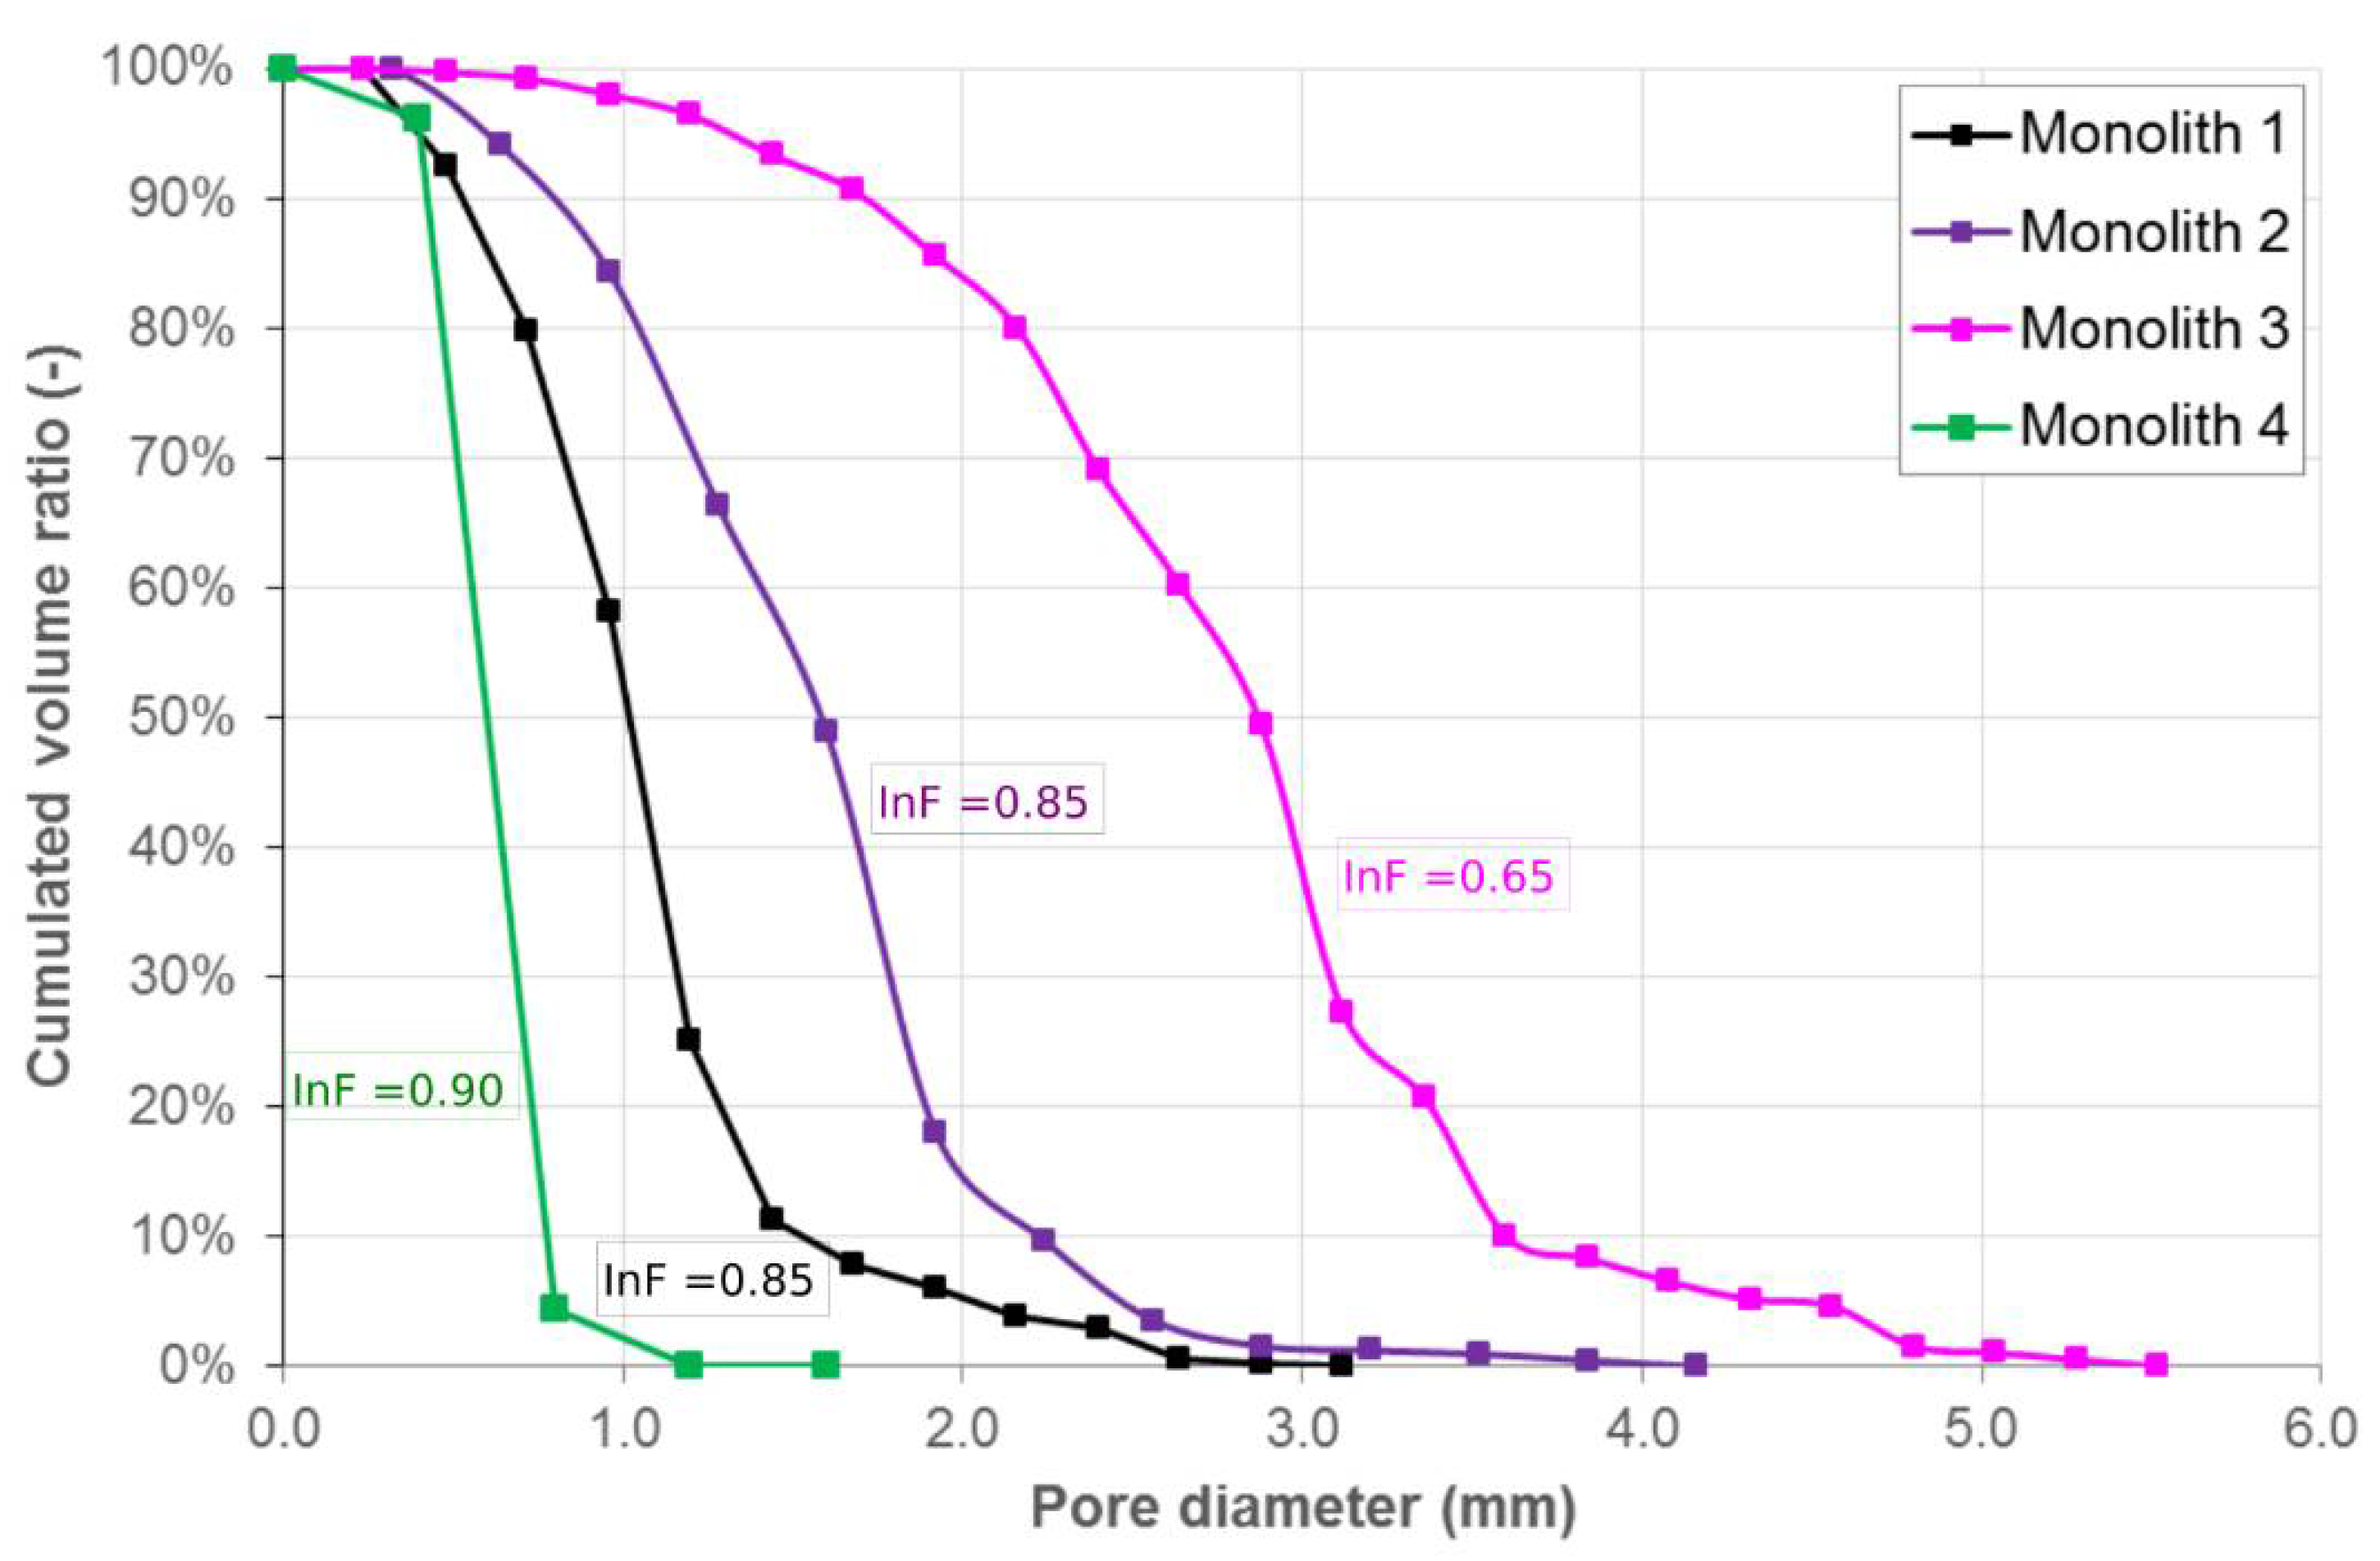
4.2. Pore Size Distribution
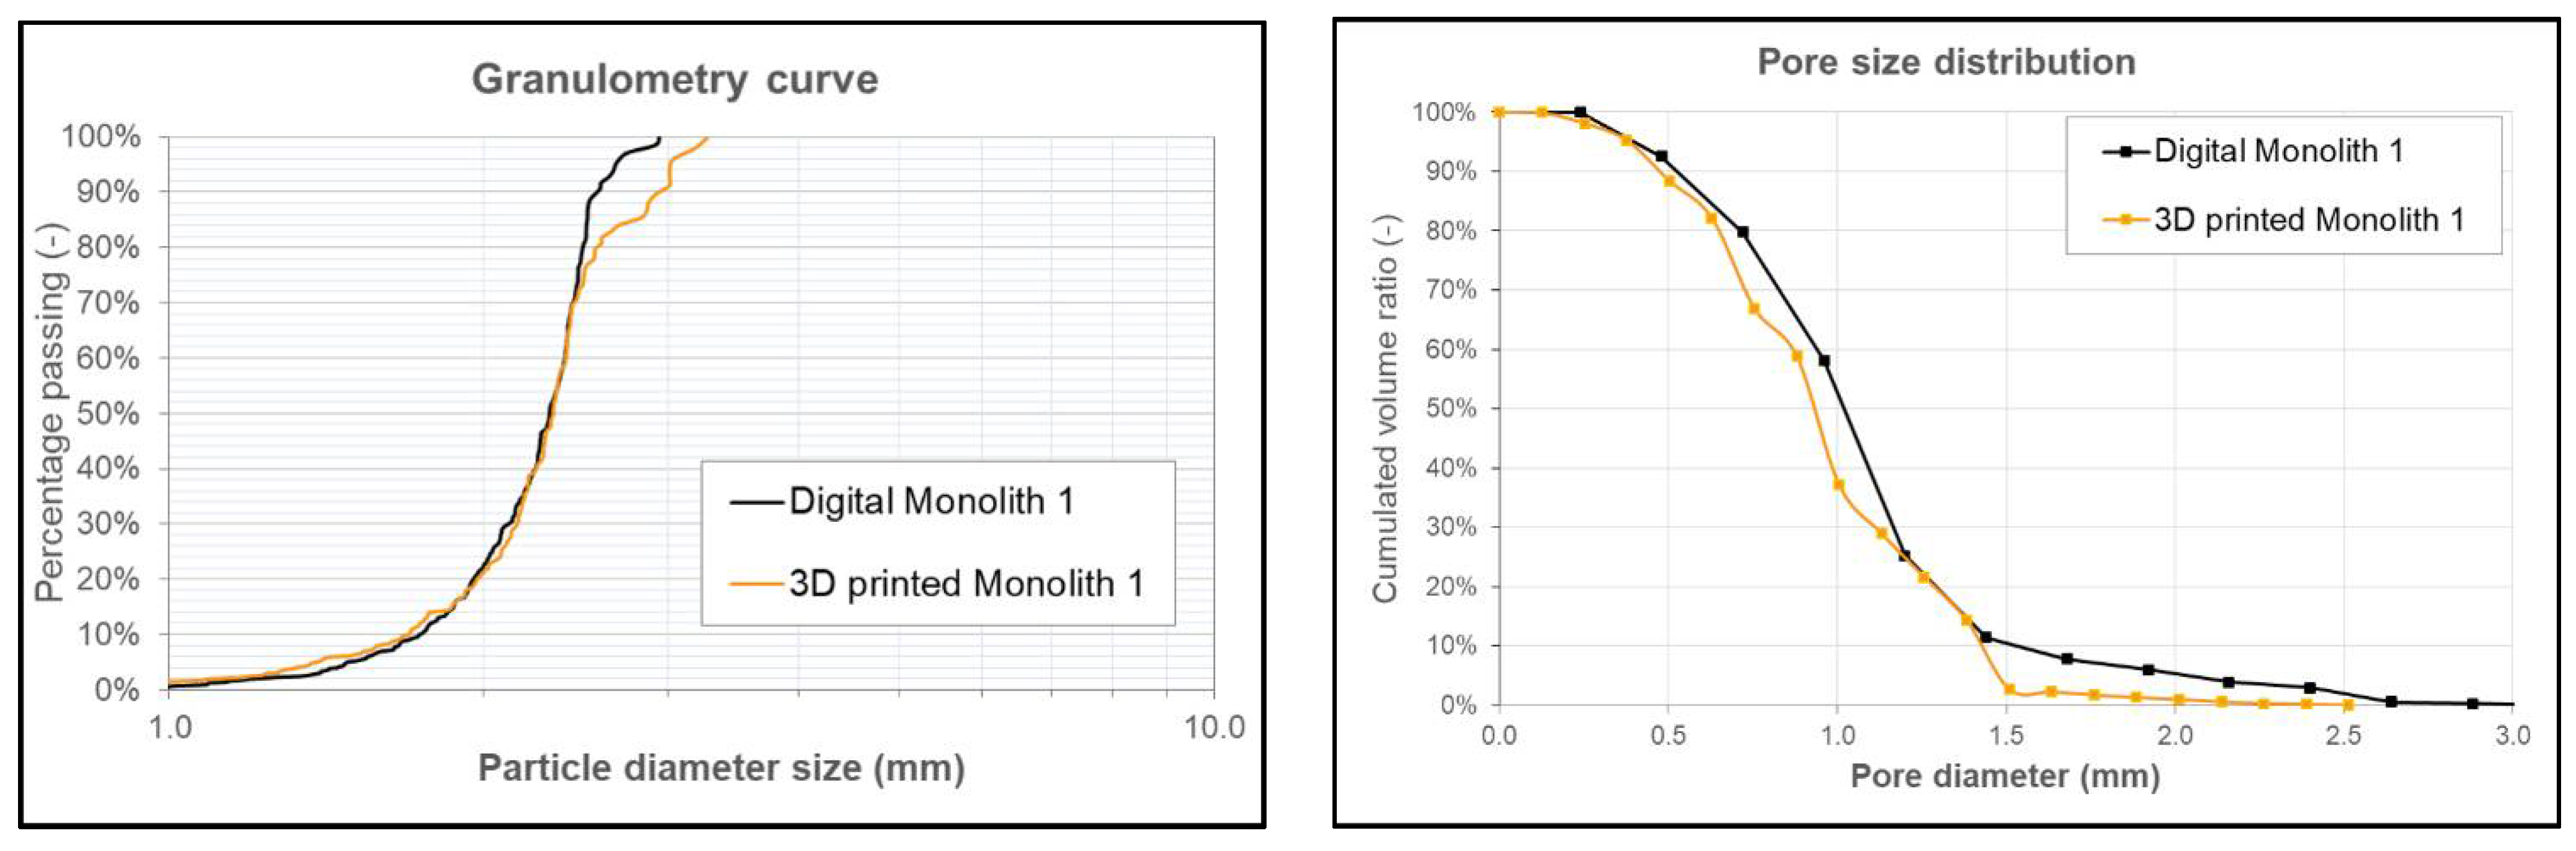
4.3. Comparison with Printed Monolith
5. Conclusions
- The tested model settings allowed the obtainment of materials similar to gravel and coarse sands.
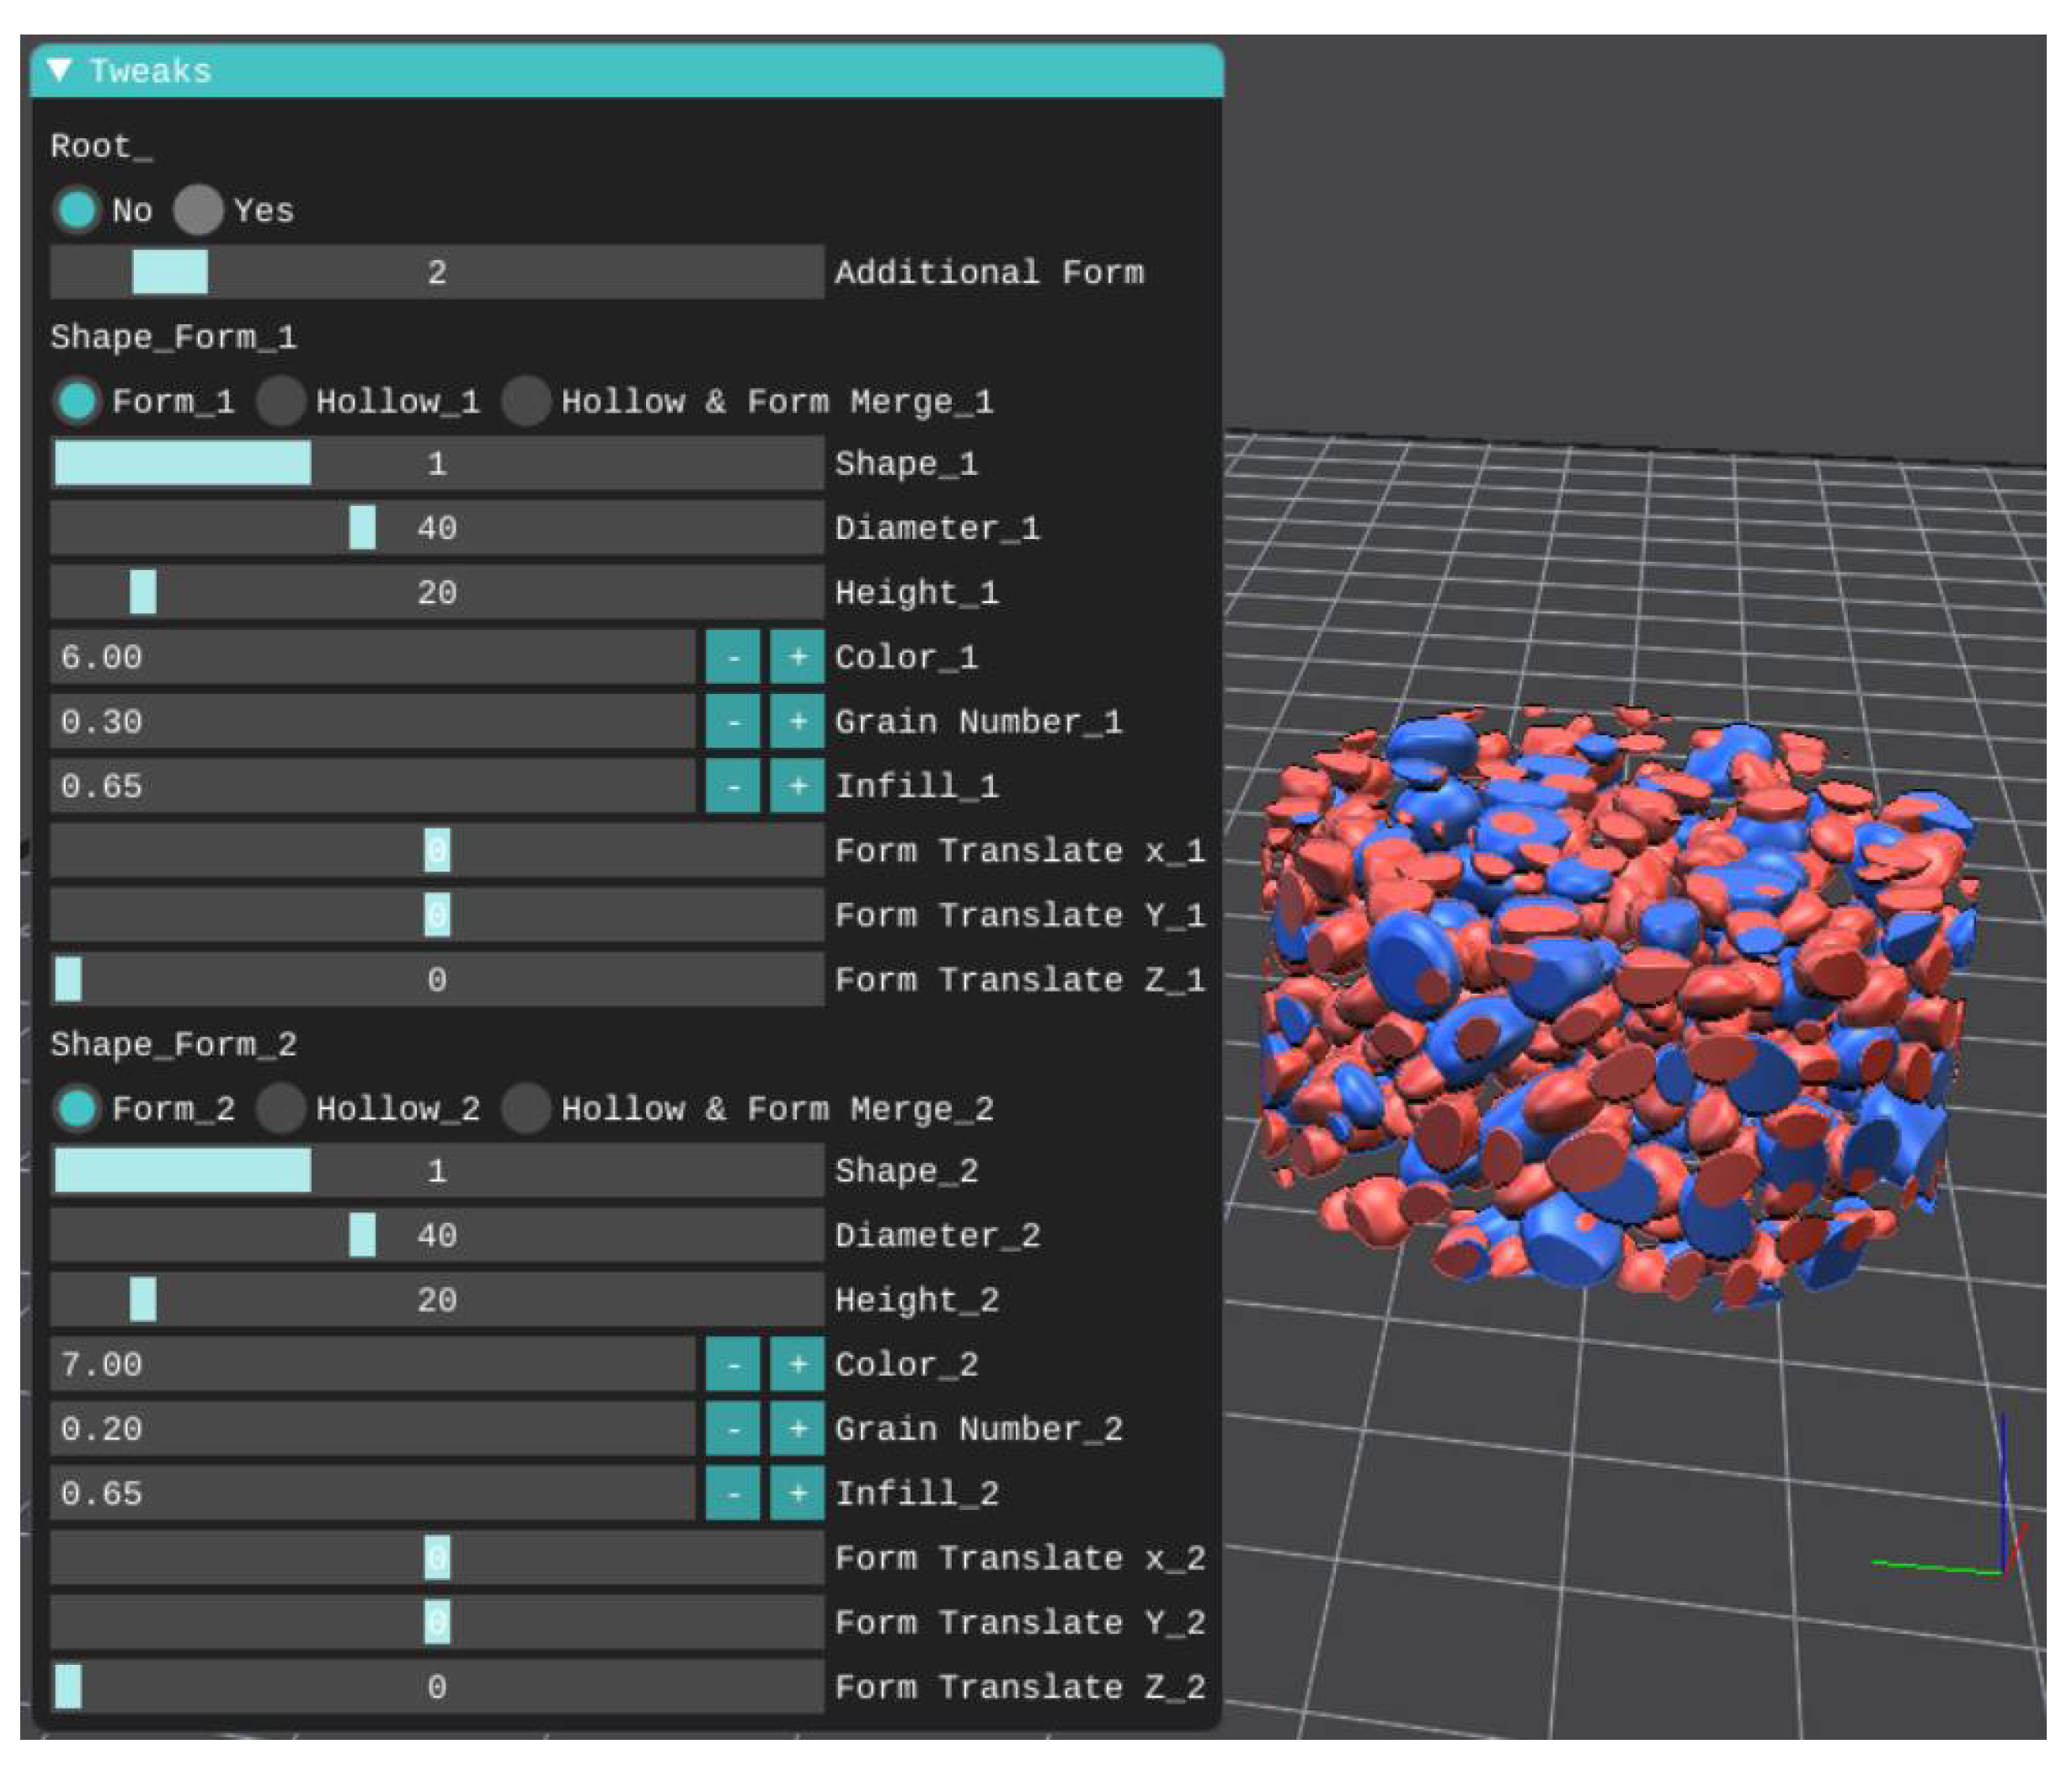
- The “Grain Number” parameter allows to vary the grain size but keeps it small. To obtain a material with a more widespread granulometry, it is possible to use mixes of several sizes.
- The “Infill” parameter also modifies the grain size, at the risk of amplifying/counteracting the effect of the “Grain Number”. This parameter also significantly modifies the total porosity, even to the point of disconnecting the grains from each other, which is not “physical” and requires adjustments to “bridges” for 3D printing. Therefore, it is recommended to not use values that are too low. The pore sizes can be modified by the grain number (via “Grain Number”) but probably also when size mixes are used.
- The morphological and physical properties seem globally consistent. However, when the grains are mostly disconnected from each other, “bridges” must be created for 3D printing in order to obtain a “stable” structure. This will likely generate significant impacts on the porosity and probably on the pore size distribution.
Author Contributions
Funding
Institutional Review Board Statement
Informed Consent Statement
Data Availability Statement
Acknowledgments
Conflicts of Interest
References
- Pearce, J.M. Open-Source Lab: How to Build Your Own Hardware and Reduce Research Costs. 2014. Available online: https://0-linkinghub-elsevier-com.brum.beds.ac.uk/retrieve/pii/C20120072493 (accessed on 14 April 2021).
- Pearce, J.M. Building Research Equipment with Free, Open-Source Hardware. Science 2012, 337, 1303–1304. [Google Scholar] [CrossRef]
- Coakley, M.; Hurt, D.E. 3D Printing in the Laboratory: Maximize Time and Funds with Customized and Open-Source Labware. J. Lab. Autom. 2016, 21, 489–495. [Google Scholar] [CrossRef] [Green Version]
- Baden, T.; Chagas, A.M.; Gage, G.; Marzullo, T.; Prieto-Godino, L.L.; Euler, T. Open Labware: 3-D Printing Your Own Lab Equipment. PLoS Biol. 2015, 13, e1002086. [Google Scholar] [CrossRef]
- Pearce, J.M. Economic savings for scientific free and open source technology: A review. Hardw. X 2020, 8, e00139. Available online: https://0-linkinghub-elsevier-com.brum.beds.ac.uk/retrieve/pii/S2468067220300481 (accessed on 15 April 2021). [CrossRef] [PubMed]
- Vogler, D.; Walsh, S.; Dombrovski, E.; Perras, M. A comparison of tensile failure in 3D-printed and natural sandstone. Eng. Geol. 2017, 226, 221–235. [Google Scholar] [CrossRef]
- Fereshtenejad, S.; Song, J.-J. Fundamental study on applicability of powder-based 3D printer for physical modeling in rock mechanics. Rock Mech. Rock Eng. 2016, 49, 2065–2074. [Google Scholar] [CrossRef]
- Jiang, Q.; Feng, X.; Gong, Y.; Song, L.; Ran, S.; Cui, J. Reverse modelling of natural rock joints using 3D scanning and 3D printing. Comput. Geotech. 2016, 73, 210–220. [Google Scholar] [CrossRef]
- Bodla, K.K.; Garimella, S.V.; Murthy, J.Y. 3D reconstruction and design of porous media from thin sections. Int. J. Heat Mass Transf. 2014, 73, 250–264. [Google Scholar] [CrossRef] [Green Version]
- Liang, T.; Knappett, J.A.; Bengough, A.G.; Ke, Y.X. Small-scale modelling of plant root systems using 3D printing, with applications to investigate the role of vegetation on earthquake-induced landslides. Landslides 2017, 14, 1747–1765. [Google Scholar] [CrossRef] [Green Version]
- Otten, W.; Pajor, R.; Schmidt, S.; Baveye, P.; Hague, R.; Falconer, R.E. Combining X-ray CT and 3D printing technology to produce microcosms with replicable, complex pore geometries. Soil Biol. Biochem. 2012, 51, 53–55. [Google Scholar] [CrossRef] [Green Version]
- Dal Ferro, N.; Morari, F. From Real Soils to 3D-Printed Soils: Reproduction of Complex Pore Network at the Real Size in a Silty-Loam Soil. Soil. Sci. Soc. Am. J. 2015, 79, 1008. Available online: https://dl.sciencesocieties.org/publications/sssaj/abstracts/79/4/1008 (accessed on 4 March 2021). [CrossRef]
- Daly, K.; Keyes, S.; Masum, S.; Roose, T. Image based modeling of nutrient movement in and around the rhizosphere. J. Exp. Bot. 2016, 67, 1059–1070. [Google Scholar] [CrossRef] [PubMed] [Green Version]
- Bacher, M. 3D-Printing of Undisturbed Soil Imaged by X-ray. Master’s Thesis, Swedish University of Agricultural Sciences, Uppsala, Sweden, November 2013. [Google Scholar]
- Ngom, N.F.; Monga, O.; Mohamed, M.M.O.; Garnier, P. 3D shape extraction segmentation and representation of soil microstructures using generalized cylinders. Comput. Geosci. 2012, 39, 50–63. [Google Scholar] [CrossRef]
- Buj-Corral, I.; Bagheri, A.; Petit-Rojo, O. 3D Printing of Porous Scaffolds with Controlled Porosity and Pore Size Values. Materials 2018, 11, 1532. [Google Scholar] [CrossRef]
- Arrieta-Escobar, J.A.; Derrien, D.; Ouvrard, S.; Asadollahi-Yazdi, E.; Hassan, A.; Boly, V.; Tinet, A.-J.; Dignac, M.-F. 3D printing: An emerging opportunity for soil science. Geoderma 2020, 378, 114588. [Google Scholar] [CrossRef]
- Xie, G.; Chen, J.; Neamtiu, I. Towards a better understanding of software evolution: An empirical study on open source software. In Proceedings of the 2009 IEEE International Conference on Software Maintenance, Edmonton, AB, Canada, 20–26 September 2009; pp. 51–60. Available online: http://0-ieeexplore-ieee-org.brum.beds.ac.uk/document/5306356/ (accessed on 6 March 2021).
- Wheeler, D.A. Why Open Source Software/Free Software (OSS/FS, FLOSS, or FOSS)? Look at the Numbers! 2015. Available online: http://dwheeler.com/oss_fs_why.html (accessed on 1 June 2021).
- Comino, S.; Manenti, F.M.; Parisi, M.L. From planning to mature: On the success of open source projects. Res. Policy 2007, 36, 1575–1586. Available online: https://0-linkinghub-elsevier-com.brum.beds.ac.uk/retrieve/pii/S0048733307001709 (accessed on 1 June 2021). [CrossRef]
- De Mendiburu, F.; Simon, R. Agricolae-Ten years of an open source statistical tool for experiments in breeding, agriculture and biology. PeerJ 2015, 3, 1–17. [Google Scholar]
- Mesas-Carrascosa, F.; Santano, D.V.; Meroño, J.; de la Orden, M.S.; García-Ferrer, A. Open source hardware to monitor environmental parameters in precision agriculture. Biosyst. Eng. 2015, 137, 73–83. Available online: https://0-linkinghub-elsevier-com.brum.beds.ac.uk/retrieve/pii/S1537511015001208 (accessed on 10 June 2021). [CrossRef]
- Leroux, C.; Jones, H.; Pichon, L.; Guillaume, S.; Lamour, J.; Taylor, J.; Naud, O.; Crestey, T.; Lablee, J.-L.; Tisseyre, B. GeoFIS: An Open Source, Decision-Support Tool for Precision Agriculture Data. Agriculture 2018, 8, 73. [Google Scholar] [CrossRef] [Green Version]
- Lewis, B.; Smith, I.; Fowler, M.; Licato, J. The robot mafia: A test environment for deceptive robots. In Proceedings of the 28th Modern Artificial Intelligence and Cognitive Science Conference (MAICS), Fort Wayne, IN, USA, 28–29 April 2017; pp. 189–190. [Google Scholar]
- Stočes, M.; Dit, F.; Vaněk, J.; Masner, J.; Pavlík, J. Internet of Things (IoT) in Agriculture—Selected Aspects. Agris Online Pap. Econ. Inform. 2016, 8, 83–88. Available online: https://ageconsearch.umn.edu/record/233969/ (accessed on 13 September 2021). [CrossRef] [Green Version]
- Puri, V.; Nayyar, A.; Raja, L. Agriculture drones: A modern breakthrough in precision agriculture. J. Stat. Manag. Syst. 2017, 20, 507–518. [Google Scholar] [CrossRef]
- IceSL: Advanced Modeling and Slicing for 3D Printing. Available online: https://icesl.loria.fr/ (accessed on 15 June 2021).
- Tao, W.; Leu, M.C. Design of lattice structure for additive manufacturing. In Proceedings of the 2016 International Symposium on Flexible Automation (ISFA), Cleveland, OH, USA, 1–3 August 2016; pp. 325–332. [Google Scholar]
- Masala, G.; Golosio, B.; Oliva, P. An improved Marching Cube algorithm for 3D data segmentation. Comput. Phys. Commun. 2013, 184, 777–782. [Google Scholar] [CrossRef]
- Doubrovski, Z.; Verlinden, J.C.; Geraedts, J.M.P. Optimal Design for Additive Manufacturing: Opportunities and Challenges. In Proceedings of the ASME 2011 International Design Engineering Technical Conferences & Computers and Information in Engineering Conference, Washington, DC, USA, 28–31 August 2011; pp. 635–646. [Google Scholar]
- Leitner, D.; Klepsch, S.; Bodner, G.; Schnepf, A. A dynamic root system growth model based on L-Systems. Plant Soil 2010, 332, 177–192. [Google Scholar] [CrossRef] [Green Version]
- Ogolo, N.A.; Akinboro, O.G.; Inam, J.E.; Akpokere, F.E.; Onyekonwu, M.O. Effect of Grain Size on Porosity Revisited. In Proceedings of the: SPE Nigeria Annual International Conference and Exhibition NAICE, Lagos, Nigeria, 4–6 August 2015. [Google Scholar]
- Zhang, Z.-H.; Li, X.-Y.; Yang, X.; Shi, Y.; Zhang, S.-Y.; Jiang, Z.-Y. Changes in soil properties following shrub encroachment in the semiarid Inner Mongolian grasslands of China. Soil Sci. Plant Nutr. 2020, 66, 369–378. [Google Scholar] [CrossRef]
- Rai, R.K.; Singh, V.P.; Upadhyay, A. Soil Analysis. In Planning and Evaluation of Irrigation Projects; Elsevier: Amsterdam, The Netherlands, 2017; pp. 505–523. Available online: https://0-linkinghub-elsevier-com.brum.beds.ac.uk/retrieve/pii/B9780128117484000170 (accessed on 2 September 2021).
- Vanneste, F.; Goury, O.; Martinez, J.; Lefebvre, S.; Delingette, H.; Duriez, C. Anisotropic Soft Robots Based on 3D Printed Meso-Structured Materials: Design, Modeling by Homogenization and Simulation. IEEE Robot. Autom. Lett. 2020, 5, 2380–2386. Available online: https://0-ieeexplore-ieee-org.brum.beds.ac.uk/document/8972411/ (accessed on 3 July 2021). [CrossRef] [Green Version]
- Lua Programming Language. Available online: http://www.lua.org/ (accessed on 15 July 2021).
- Münch, B.; Holzer, L. Contradicting Geometrical Concepts in Pore Size Analysis Attained with Electron Microscopy and Mercury Intrusion. J. Am. Ceram. Soc. 2008, 91, 4059–4067. [Google Scholar] [CrossRef]
- Legland, D.; Arganda-Carreras, I.; Andrey, P. MorphoLibJ: Integrated library and plugins for mathematical morphology with ImageJ. Bioinformatics 2016, 32, 3532–3534. [Google Scholar] [CrossRef] [Green Version]
- Münch, B.; Gasser, P.; Holzer, L.; Flatt, R. FIB-Nanotomography of Particulate Systems‒Part II: Particle Recognition and Effect of Boundary Truncation. J. Am. Ceram. Soc. 2006, 89, 2586–2595. [Google Scholar] [CrossRef]
- Tinet, A.-J.; Corlay, Q.; Collon, P.; Golfier, F.; Kalo, K. Comparison of various 3D pore space reconstruction methods and implications on transport properties of nanoporous rocks. Adv. Water Resour. 2020, 141, 103615. Available online: https://0-linkinghub-elsevier-com.brum.beds.ac.uk/retrieve/pii/S0309170819312527 (accessed on 16 July 2021). [CrossRef]
- Andrä, H.; Combaret, N.; Dvorkin, J.; Glatt, E.; Han, J.; Kabel, M.; Keehm, Y.; Krzikalla, F.; Lee, M.; Madonna, C.; et al. Digital rock physics benchmarks—Part II: Computing effective properties. Comput. Geosci. 2013, 50, 33–43. Available online: https://0-linkinghub-elsevier-com.brum.beds.ac.uk/retrieve/pii/S0098300412003172 (accessed on 30 August 2021). [CrossRef]
- Raise3D E2. Available online: https://www.raise3d.com/products/e2/ (accessed on 31 August 2021).


| Software | Export STL | Export G-Code | Scripting | Export Images | G-Code Preview |
|---|---|---|---|---|---|
| Blender | × | × | × | ||
| OpenSCAD | × | × | × | ||
| IceSL | × | × | × | × | × |
| Command | Description |
|---|---|
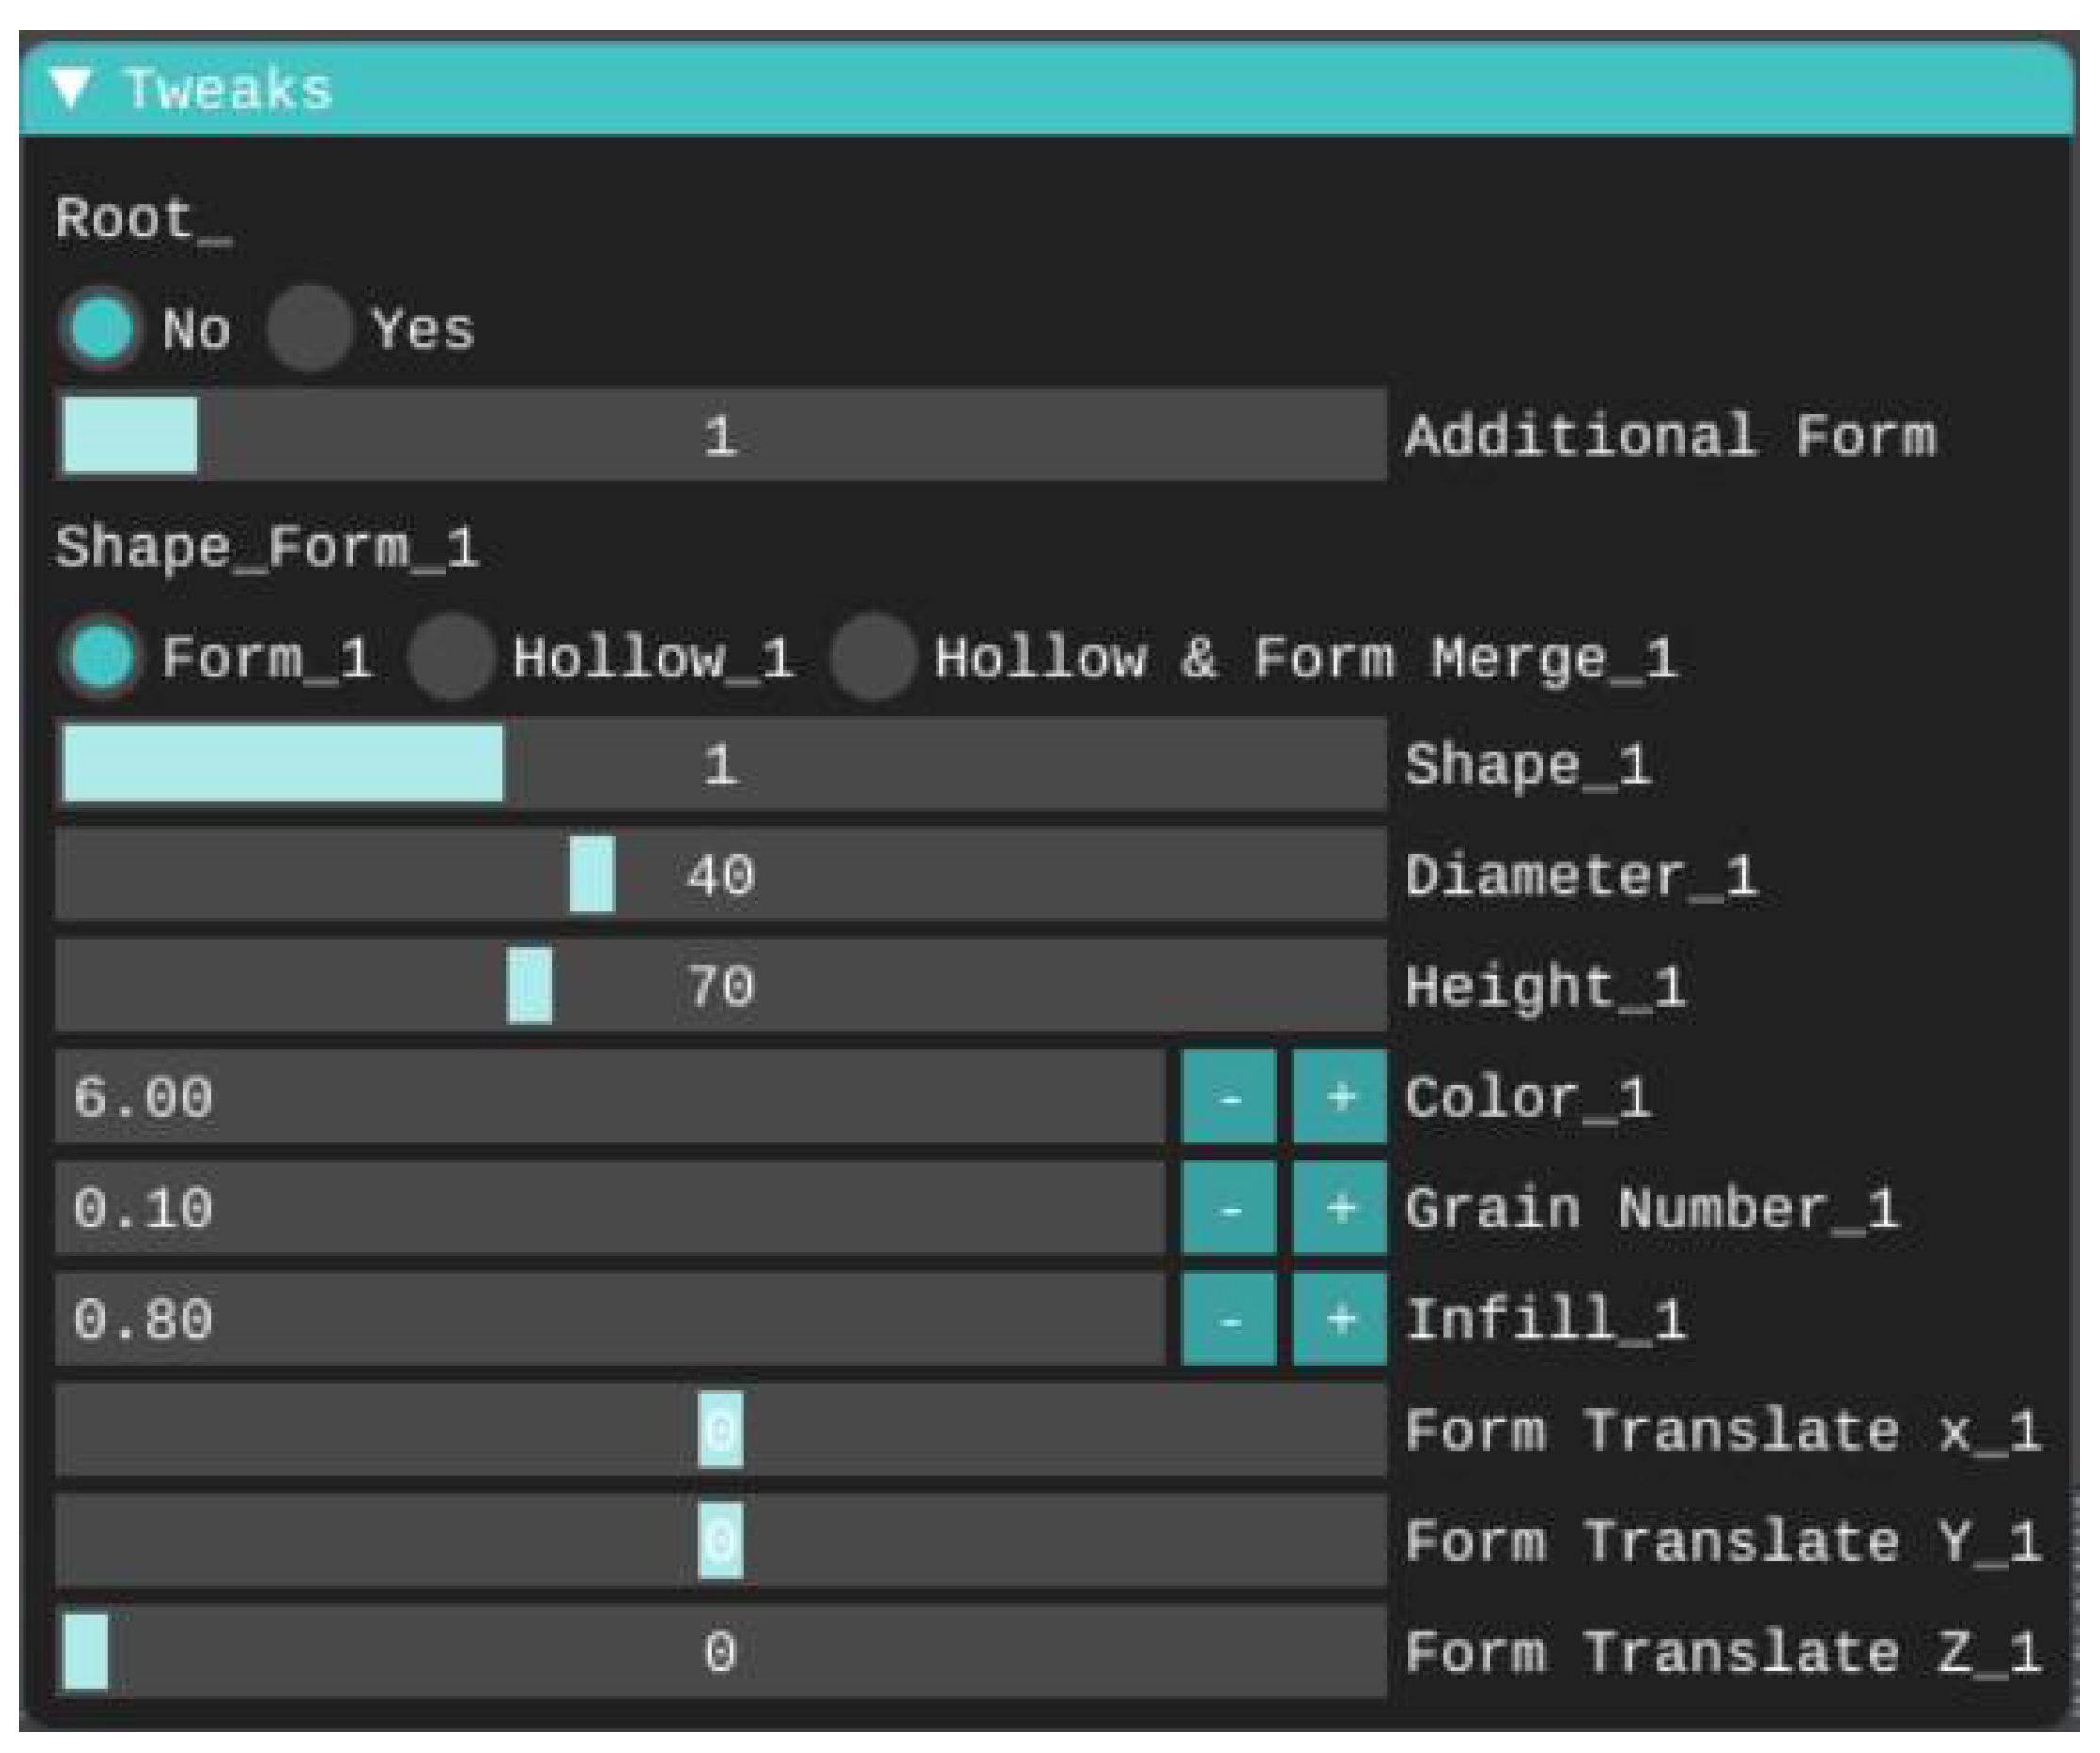
| Additional Form | Allows additional forms in the monolith to mix the grain sizes or to change the parameters of grain on different layers, Form_1 is set by default |
| Shape_Form_1 -> Form_1 | Render monolith porous structure based on a Trabecular model |
| Shape_Form_1 -> Hollow_1 | Render the negative of monolith structure, corresponds to its porous network |
| Shape_Form_1 -> Hollow & Form Merge_1 | Render monolith solid form and its porosity in order to print, for example, the porosity in soluble materials |
| Diameter_1, Height_1, and Color_1 | For each Form in the monolith, set the diameter of the cylinder (mm), the height (mm), and the color |
| Grain Number_1 | Set the number of grains according to their size, the higher the value, the more numerous and smaller are the grains |
| Infill_1 | Set material/void ratio, the bigger the factor the more material filling in the geometry will be, this influences the size of the grains, but not their number and distribution |
| Form Translate X_1, Y_1, Z_1 | To move the Form on the X, Y, or Z-axis, useful for multi-form modeling |
| Root_ -> Yes | To add a root model, as an STL file, to the monolith. The position of the root can be modified and its size can be rescaled |
| Layer thickness (mm) | Nozzle D (mm) | Extrusion Temperature (°C) | Bed Temperature (°C) | Infill (%) | Weight (g) | Printing Time | |
|---|---|---|---|---|---|---|---|
| Monolith 1 | 0.12 | 0.4 | 200 | 45 | 20 | 9.1 | 4 h 38 min |
| Property | Monolith 1 | Monolith 2 | Monolith 3 | Monolith 4 |
|---|---|---|---|---|
| Intergranular porosity | 0.304 | 0.294 | 0.693 | 0.0595 |
| Specific surface [1/mm] | 1.369 | 0.884 | 1.578 | 0.432 |
| Tortuosity | 1.000 | 1.000 | 1.000 | 1.291 |
| Hydraulic conductivity [m/s] | 0.186 | 0.347 | 1.801 | 0.0343 |
| Property | Digital Monolith 1 | 3D-Printed Monolith 1 |
|---|---|---|
| Intergranular porosity | 0.304 | 0.299 |
| Specific surface [1/mm] | 1.369 | 1.471 |
| Tortuosity | 1.000 | 1.049 |
| Hydraulic conductivity [m/s] | 0.186 | 0.182 |
Publisher’s Note: MDPI stays neutral with regard to jurisdictional claims in published maps and institutional affiliations. |
© 2021 by the authors. Licensee MDPI, Basel, Switzerland. This article is an open access article distributed under the terms and conditions of the Creative Commons Attribution (CC BY) license (https://creativecommons.org/licenses/by/4.0/).
Share and Cite
Bedell, R.; Hassan, A.; Tinet, A.-J.; Arrieta-Escobar, J.; Derrien, D.; Dignac, M.-F.; Boly, V.; Ouvrard, S.; Pearce, J.M. Open-Source Script for Design and 3D Printing of Porous Structures for Soil Science. Technologies 2021, 9, 67. https://0-doi-org.brum.beds.ac.uk/10.3390/technologies9030067
Bedell R, Hassan A, Tinet A-J, Arrieta-Escobar J, Derrien D, Dignac M-F, Boly V, Ouvrard S, Pearce JM. Open-Source Script for Design and 3D Printing of Porous Structures for Soil Science. Technologies. 2021; 9(3):67. https://0-doi-org.brum.beds.ac.uk/10.3390/technologies9030067
Chicago/Turabian StyleBedell, Romain, Alaa Hassan, Anne-Julie Tinet, Javier Arrieta-Escobar, Delphine Derrien, Marie-France Dignac, Vincent Boly, Stéphanie Ouvrard, and Joshua M. Pearce. 2021. "Open-Source Script for Design and 3D Printing of Porous Structures for Soil Science" Technologies 9, no. 3: 67. https://0-doi-org.brum.beds.ac.uk/10.3390/technologies9030067