Article

Computation of High-Frequency Sub-National Spatial Consumer Price Indexes Using Web Scraping Techniques

1
Department of Economics, Engineering, Society and Business Organization, University of Tuscia, Via del Paradiso, 01100 Viterbo, Italy
2
Jataware LLC, Washington, DC 20015, USA
*
Author to whom correspondence should be addressed.
Submission received: 15 February 2022 / Revised: 6 April 2022 / Accepted: 10 April 2022 / Published: 14 April 2022

Abstract

:
The development of Information and Communications Technology and digital economies has contributed to changes in the consumption of goods and services in various areas of life, affecting the growing expectations of users in relation to price statistics. Therefore, it is important to provide information on differences in consumer prices across space and over time in a timely manner. Web-scraped data, which is the process of collecting large amounts of data from the web, offer the potential to improve greatly the quality and efficiency of consumer price indices. In this paper, we explore the use of web-scraped data for compiling high-frequency price indexes for groups of products by using the time-interaction-region product model. We computed monthly average prices for five entry-level items according to the Consumer Price Index for All Urban Consumers (CPI-U) classification and tracked their evolution over time in 11 USA cities reported in our dataset. Even if our dataset covers a small percentage of the CPI-U index, results show how web scraping data may provide timely estimates of sub-national SPI evolution and unveil seasonal trends for specific categories.

1. Introduction

During recent years, new technologies and digitalization processes have dramatically increased the potential for data production. The use of Big Data in official statistics has become a major topic of several initiatives, both at national and international levels (Virgillito and Polidoro 2019). Among all the possible types of Big Data sources, the “Internet as a data source” is a highly popular one due to the increased share of consumer electronic sales in total turnover. The web-scraped technique allows the acquisition of information about prices, discounts, availability of the products, and descriptions of goods sold by retailers. An increasing number of National Statistical Institutes (NSIs) have been using online data, which are electronically collected from retailers’ websites, in order to produce new statistical information in a multisource environment, more efficiently and with higher levels of quality (Barcaroli and Scannapieco 2019). The main domains of experimentation are related to price statistics (price collection for airline tickets), job statistics (internet vacancies), consumer sentiment analysis (using social media), and quality improvement of business registers.1
In the context of price statistics, data collection methods have been significantly improved through the use of automated digital data sources, such as web-scraped data from web pages and direct collection from enterprises and government agencies via register and transaction data. This means that the collected information is often more comprehensive, with increased sample sizes and, at the same time, reduced response burden. Therefore, the development of web scraping techniques as tools to capture large amounts of price data proved to be useful for improving official price statistics (see, for example, Mehrhoff 2019; de Haan et al. 2021). Price statistics for groups of products, such as food, or even for the whole economy are important key economic indicators as they represent a fundamental element in many decisions of the economic and private and public agents (OECD et al. 2004).
Several NSIs have introduced web-scraped data into the official Consumer Price Index (CPI) production process. The use of web scraping is common for products for which it is known that online purchases are becoming more and more representative (Eurostat 2020). NSIs started experimenting with the use of web-scraped data for inflation measurement by focusing on specific groups of products, for example, Statistics Netherland focused on air tickets (ten Bosh and Windmeijer 2014), while the Dutch NSI firstly focused on the property market, then considered clothes, which have higher variability in prices due to the lack of standardization in product classification and site organization. Similarly, the Italian NSI used online data for consumer electronics prices and airfares (Polidoro et al. 2015).
Moreover, academic research on the use of online data for producing real-time monitoring of economic activity and price evolution has been rapidly increasing, especially during the COVID pandemic (Jaworski 2021; Juszczak 2021).
Contrastingly, the use of web-scraped data for spatial price comparisons at the national and international levels is quite rare and only a few studies have been carried out (Cavallo and Rigobon 2016; Cavallo et al. 2018). Cavallo et al. (2018) demonstrated that online prices can be used to construct international SPIs and Purchasing Power Parities2 (PPPs) published in real-time, using a closely matched basket of goods and identical methodologies. To the authors’ knowledge, the use of web-scraped data for comparing consumer price levels among geographical areas within a country has not yet been explored.
Nevertheless, sub-national SPIs measuring price level differences across regions are essential for assessing regional disparities in the distribution of real incomes and supporting regional policymaking (Rokicki and Hewings 2019). This is especially true in countries characterized by large territorial differences in prices and quality of products and household characteristics (Majumder and Ray 2020). Although the first official measure of inter-area differences in the cost of living was developed in the 1940s in the US, to date, few countries have produced official indexes of spatial prices or have carried out experiments with this aim (such as the USA, Australia, UK, and Italy). However, no systematic attempts have been made to compile sub-national PPPs on a regular basis, with the exception of the US. This is mainly due to the lack of data that fulfill the requirements of representativeness and comparability that emerge when compiling regional spatial consumer price indices (Biggeri et al. 2017). The main approach for making sub-national price comparisons adopted by NSIs and researchers is based on data collected for the purpose of compiling CPIs. However, the composition of the basket of items that the NSIs track in order to provide CPIs is consistent over time in an area, but it is not always identical (comparable) to the basket of items being followed in another location. Indeed, the construction of sub-national SPIs has been systematically hampered by the considerable costs of conducting surveys, collecting comparable product prices, and processing data (Laureti and Rao 2018). In this context, the use of web-scraped data, together with other sources of data (scanner data, administrative data, ad hoc survey), could be a feasible solution to the difficulties NSIs face in making spatial comparisons of prices across areas.
This paper marks a departure from previous literature on sub-national SPIs by demonstrating the feasibility of using web-scraped data, which are representative of local consumption patterns and comparable on the basis of a set of price-determining characteristics, to compare consumer prices for groups of products at a more disaggregated level on a regular basis by following their evolution over time.
More specifically, following the pioneering work of Cavallo et al. (2018), this paper suggests a method for reconciling consumer price indexes across space and time using web-scraped data by using the time-interaction-region product dummy (TiRPD) model developed by Aizcorbe and Aten (2004) for comparing price levels across countries.
The advantage of using our dataset price data obtained from web scraping is the application of the TiRPD model for estimating sub-national SPIs, as up to now it has not yet been applied at detailed territorial level and instead has mainly been used in international price comparisons (Hill 2004).
Yet, to the authors’ knowledge, no studies have tackled this model in comparing price levels at local level, i.e., across cities in a single country, and have determined that the differences in price levels are statistically significant. This is largely an issue of data availability, as spatially disaggregated data of consumer product price data are difficult to obtain at a sub-national scale and over time.
Due to the fact that the web-scraped data source is gaining increasing importance in official price statistics and the use of web-scraping is common for individual products, for which it is known that online purchases are getting more and more representative (Eurostat 2020), this paper could represent an example of application that can be replicated in other countries and at different geographical scales, providing information on price changes over time and space that are requested by citizens and stakeholders. Comparing price levels across countries and how they change over time is an issue of interest to national governments, firms and households and international organizations. However, this issue has received little attention in the index-number literature due to the lack of suitable data (Aizcorbe and Aten 2004; Hill 2004).
In order to compare online consumer price levels, this paper focuses on the stochastic approach, where uncertainty and statistical ideas play central roles given that index number construction is viewed as a problem of signal extraction from the messages on price changes for different commodities over space (Summers 1973). Clements and Izan (1987), Selvanathan (1989), and Selvanathan and Rao (1994) have emphasized the versatility and usefulness of the stochastic approach, which leads to familiar index-number formulae under certain circumstances (Clements et al. 2006; Diewert 2010). Over the last two decades, there has been a steady increase in research focused on the stochastic approach, which is based on the hedonic approach to price index number construction and the model proposed by Summers (1973), namely the country-product-dummy (CPD) model. This literature is still expanding and in a recent paper, Rao and Hajargasht (2016) developed a CPD-based stochastic approach to international price comparisons by incorporating modern econometric tools, while Montero et al. (2020) proposed a novel method to account for the presence of spatial dependencies in consumer prices and, consequently, in price indexes by imposing penalization conditions on the estimation of traditional CPD models leading to the spatially penalized country-product-dummy model.
In the TiRPD model, the time dimension is introduced into the region-product-dummy (RPD) model, which is the regional version of the CPD. This time-extended RPD specification has the property that in its elementary form, and when the data are complete, cross-country comparisons reduce to those obtained from single-equation RPD estimates, and price comparisons over time reduce to those obtained from a variant of the hedonic regressions used in the price measurement literature.
With the aim of illustrating the potential of the proposed methodology and highlighting the informative results, we estimated the TiRPD model using real online data for the USA obtained from the Grocerybear Project.3 The data used in this paper are a portion of a larger dataset, composed of over 120 million data points, collected every day between January 2017 and May 2018 for over 50,000 unique items in about 750 commercial categories for eleven USA cities: Boise, Honolulu, Houston, Las Vegas, Los Angeles, Orlando, Phoenix, Portland, San Francisco, Seattle, and Washington DC. In our dataset, online data include price and product information that have been automatically collected from websites by software through a process known as web scraping. On the basis of a preliminary analysis of the basket, five group of products, i.e., Apples, Bread, Butter, Cigarettes, and Coffee, have been selected with the aim of strike a balance between comparability and representativeness requirements.
It is worth noting that since 2014, regional price parities (RPPs) and the price-adjusted estimates of regional personal income have become official statistics of the United States BEA and are being published annually (Aten et al. 2014). Nevertheless, having data for every U.S. metropolitan area gives us useful insights into price variation across the country beyond its largest cities on a monthly basis. In the following, we will omit technical details and coding issues on how we built the dataset used for this paper.4 Rather, the aim is to discuss the potential of the method for economics research and stimulate the use of online data for constructing spatial indicators of consumer price differentials.
The remainder of this paper is structured as follows. Section 2 reviews the use of web scraping in price statistics computations, Section 3 describes the dataset used in this work and itdeals with methodological and empirical issues related to the estimation of sub-national SPIs using the time-interaction-region product dummy method at the BH level. In Section 4 we present and discuss the results obtained from our tracked items. Some concluding remarks are drawn in Section 5.

2. Using Online Data for Price Statistics

Purchasing goods and services online has become a common practice among many people around the world (Varma et al. 2020). Over the past ten years, the share of electronic sales to consumers and businesses in total turnover has increased in most EU countries: according to Eurostat (2021), 65% of European Union citizens made at least one online purchase in 2020. According to the United States Census Bureau, e-commerce sales in the third quarter of 2021 accounted for 12.4% of total household expenditure with a 4.4% year-over-year increase.
The COVID-19 crisis accelerated an expansion of e-commerce towards new firms, customers, and types of products (Sharma and Jhamb 2020). This trend has provided customers with access to a significant variety of products from the convenience and safety of their homes (OECD 2020). A recent international survey (UNCTAD 2020) showed that, following the pandemic, more than half of the respondents shop online more frequently than before. Some of these changes in purchasing patterns will likely be of a long-term nature. Therefore, the COVID-19 pandemic highlighted the importance of providing indicators that allow the economic situation to be followed with a much higher frequency than traditional monthly or quarterly indicators (Jaworski 2021). With this aim, it is essential that representative price statistics cover the online purchases and their price movements, regarding both the time and spatial dimension. Statistical research on prices, thus, needs to accommodate the growing share of e-commerce in the overall household consumption budget. A recent body of research contended that the movements of online prices are also representative of offline retail prices dynamics, acknowledging the use of online prices for constructing official CPIs (Harchaoui and Janssen 2018).
Within this new data environment, statistical offices in various countries, including the UK (Breton et al. 2016), the Netherlands (de Haan and Hendriks 2013), Italy (Polidoro et al. 2015), Norway (Nygaard 2015), Germany (Brunner 2014) Romania (Oancea and Necula 2019), and Poland (Macias and Stelmasiak 2019; Jaworski 2021), started to collect data from online retailers and study how to use them for official temporal price index calculation. At the same time, they are becoming aware of the potential issues that may be encountered when using web-scraped data. Several NSIs have being exploring online data to develop cheaper and more efficient data collection practices for official CPI compilation through the use of automatic machine-learning-based tools to deal with massive datasets and new methodologies that are able to handle big data. NSIs may also ask data owners to provide online data directly with open access to an API (application programming interface), thus creating a more solid technical solution as it involves using a database, which is generally more stable compared to a website. The use of web-scraped data mainly relates to specific categories of consumer products, e.g., electronics, housing, and medicine.
Following the creation of the Billion Prices Project at MIT, the largest project focused on web scraping and online prices analysis to date (Cavallo and Rigobon 2016), huge amounts of data are downloaded every day to monitor product prices and calculate price indices by researchers worldwide with different aims. During recent years, data from the web have also been considered for other purposes related to prices of goods and services. The US Bureau of Labor Statistics has undertaken several pilot projects to supplement its traditional field collection of price data with web scraping or retailer API’s (Konny et al. 2019) in the context of motor fuels. The USA Census Bureau is building a tool that automatically scrapes tax revenue collections from websites of state and local governments as opposed to collecting this information with a traditional questionnaire (Dumbacher and Capps 2016), while Statistics Canada (2019) is looking into ways that they can incorporate web scraping to reduce the burden on survey responders. In this stream of literature, Bricongne et al. (2021) scraped data from the UK housing market on a daily basis, building timelier and highly granular indicators from the sellers’ perspective, allowing them to compute innovative indicators of the housing market, such as the number of new posted offers or how prices fluctuated over time for existing offers. Souza et al. (2021) verified the spatial autocorrelation between the mean prices of the housing obtained from web scraping technique in online platforms in the city of Salvador, on the coast of northeast Brazil. Compared to traditional methods of data collection, web scraping offers many advantages, especially in terms of product coverage and frequency of price observations. Alongside prices, it is often possible to acquire information about discounts and product descriptions. On the other hand, products with very low expenditure may be scraped (for example, products that have not been bought recently by consumers), thus implying that unrepresentative products will be included in index compilations. However, given that small shops usually do not have a website with published product prices, one of the main drawbacks of web-scraped data is that they do not cover traditional outlets.
The higher frequency characterizing web-scraped data can be a great advantage for measuring price movement for groups of goods characterized by a high product churn, such as clothing and footwear (Juszczak 2021). The computation of high-frequency price indexes may allow the development of several research applications with a high social and economic impact. However, in spite of its practical attraction, as yet only a few studies have been carried out to explore the use of web-scraped data for spatial consumer price index construction. These kinds of data have been tested for constructing international SPIs with a closely matched set of goods and identical methodologies in a variety of developed and developing countries (Cavallo et al. 2018).
The use of web-scraped data could be a feasible solution to the difficulties NSIs face in making sub-national spatial comparisons of prices. This new source of data offers detailed information for all products sold by the sampled retailers in different geographical areas within a country. However, measuring spatial variability of prices for all of the products purchased by households for consumption and covering all the distributional channels requires price data obtained from multiple sources and outlets, which are representative of local consumption patterns and comparable on the basis of a set of characteristics. Nevertheless, the possibility of producing regional or local SPIs on a regular basis, even if for specific product categories, such as food products, could improve our knowledge of the real economic territorial differentiation within a country. Indeed, over the last few decades, an increasing number of studies have demonstrated the importance of constructing sub-national price indexes for carrying out analyses on inter-area price levels, standards of living, and real income comparisons on topics such as poverty and rural–urban and regional (local) differences (Biggeri et al. 2017; Laureti and Rao 2018). Constructing consumer SPIs within a country plays a crucial role, especially in the case of EU member states where regional economic analyses have become essential due to the implementation of the EU Cohesion Policy, promoting more balanced and sustainable territorial development. In this context, nominal GDP has been conventionally adjusted using a national deflator, which could bias the comparison of regional GDP figures and per-capita income in the presence of spatial price differential (Costa et al. 2019). In countries characterized by large territorial differences in prices and quality of products and household characteristics, it is essential to calculate sub-national SPIs in order to assess inequality in the distribution of real incomes and consumption expenditures.
Although the issue of calculating sub-national SPIs and PPPs has gained prominence over recent decades, only a few countries have produced official sub-national SPIs (for a review on previous literature regarding sub-national SPIs, see Laureti and Polidoro 2022). Here, it is worth noting that the first official measurement on sub-national price was conducted in the USA in the 1940s. In the economic literature, a SPI is often derived through specifying a basket of goods and services and pricing this basket in different localities (Sherwood 1975). Further studies were conducted in the mid-1990s (Kokoski 1991; Kokoski et al. 1999). In the 2000s, the Bureau of Economic Analysis (BEA), first estimated regional price parities for consumption goods and services for 38 metropolitan and urban areas of the USA for 2003 and 2004 (Aten 2005, 2006), then, it compared the average price level of a specific area with the national average price level (Aten et al. 2014). Due to the cost of collecting prices across geographical areas, the SPIs for most countries are produced infrequently (i.e., Italy).
At the official level, in the USA, regional price parities are published annually. The RPPs use only price and expenditure-related survey data that are collected by U.S. federal agencies: the CPI survey data from the BLS and American Community Survey (ACS) data from the Census Bureau. The estimates are published for three sets of geographies: states (including the District of Columbia), state metropolitan and nonmetropolitan portions, and metropolitan statistical areas. Nevertheless, we believe that our experimentation based on the use of web-scraped data for eleven USA cities may provide insights into the consumer price movements for product groups across space and over time.

3. Methods and Data

3.1. Time-Interaction-Region Product Dummy (TiRPD) Models

The process of compiling SPIs is quite complex and is carried out in two stages.5 Firstly, elementary spatial price indexes are computed by aggregating, without using weights, prices of items belonging to a group of similar well-defined goods or services (called Basic Headings, BHs). In the second stage, the elementary PPPs are aggregated using expenditure weights to obtain PPPs for higher-level, aggregates such as consumption, investment, and GDP. Several methods can be used to produce sub-national SPIs (Laureti and Rao 2018). As already mentioned, this paper focuses on the stochastic approach when constructing spatial price indexes at the lowest level of aggregation as it is essential to obtain reliable sub-national SPIs at product group level because they are the foundations of overall comparisons (Hill and Syed 2015). In order to reconcile aggregate SPIs across space and time by using web-scraped data, we suggest using the time-interaction-region product dummy (TiRPD) model, which can be considered a combination of the RPD and TPD models.
Let us assume that we are attempting to make a spatial comparison of prices between M geographical areas (region, provinces, cities, etc.), considering individual products observed in each time period. In the first stage of aggregation of price data at item level, which leads to price comparisons at elementary product group (entry-level items6 or basic heading level), pijt represent price of i-th item in j-th geographical area in time t with i = 1, 2, …, N; j = 1, 2, …, M; t = 1, 2, …, T. For a given period t, the basic statistical model underlying the RPD method can be stated as p i j = S P I j · P i · u i j i = 1, 2, …, N; j = 1, 2, …, M; t = 1, 2, …, T; n represents the number of items in the ELI that are priced in the various areas included in the comparison; S P I j is the spatial price index of the j-th area relative to the other areas within the country; Pi is the “geographical area” average price of the i-th commodity; and uij’s are independently and identically distributed random variables. In this study, these disturbances are assumed to be lognormally distributed. The RPD model can be best described as a hedonic regression model in which the characteristics used are the area and the commodity specifications. By taking natural logs on both sides, price levels are estimated by regressing logarithms of prices on areas and product dummy variables. The model is given for each ELI and area j by:
l n p i j = l n S P I j + l n P i + l n u i j = j = 1 M β j D j + i = 1 n α i D i + υ i j       t i m e   p e r i o d   t = 1 ,   ,   T
where D j is an area dummy variable that takes value equal to 1 if the price observation is from j-th area, D i is a dummy variable that takes value equal to 1 if the price observation is for i-th commodity, and υ i j is normally distributed with a zero mean and a constant variance.
Parameters of this model can be estimated once one of the parameters of the model is set at a specified value. For example, if area 1 is taken as the reference or numeraire region, then π 1 is set at zero and the remaining parameters are estimated. If β ^ j   ( j = 2 , , M   ) are estimated parameters, the SPI for the area j is given by
S P I j R P D = e x p ( β j )
The RPD model produces a transitive set of SPIs, taking into account all the price information in a single step.
The time-product dummy (TPD) and the time dummy hedonic (TDH) methods have been proposed by de Haan (2015) for computing multilateral price indexes using scanner data. The name TPD method was suggested by de Haan and Krsinich (2014) as it adapts Summers’ (1973) multilateral CPD method for spatial comparisons to price comparisons across time. For the time-product dummy (TPD) method, we refer to the specification used by Aizcorbe et al. (2000) applied to time series, as shown in Equation (2):
l n P j t = i = 1 N α i D i t + t = 1 T γ t T i t + μ i t   ,     a r e a   j = 1 , ,   M
where, for each ELI, l n P i t is the log of the price of good i time period t, ( D i t , T i t ) are the dummy variables for good i and time t, respectively, with i = 1 , ,   N and t = 1, …, T. Differences in the coefficients on the time dummies are interpreted as measures of price change over time. By combining model (1) and (2), the TiRPD model can be expressed as follows:
l n P i j t = i = 1 N β i D i j t + t = 1 T j = 1 M δ j t C i j T j t + υ i j t
where, for each ELI, l n P i j t denotes the price of product i in area j at time t (i = 1, 2, …, N; j = 1, 2, …, M; t = 1, …, T). D i j t are dummies for product i in area j at time t. C i j T j t are dummy variables for each combination of area and time period with i = 1, …, N; j = 1, …, M and t = 1, …, T. The sub-national SPI for the area j at time t is given by e x p ( δ j t δ O r l a n d o ,   t = 1 ) . The relative price levels across areas for a time period in the TiRPD are equal to those obtained in the RPDs, and the price changes in the TiRPD are equal to those obtained in the TPD for one area. These relationships are analogous to structuring a Chow test using dummy interaction terms:
δ j t δ k t = β j β k   ( d i f f e r e n c e s   b e t w e e n   a r e a s   j   a n d   k   f o r   t i m e   t ) a n d δ j t δ j s = γ t γ s   d i f f e r e n c e s   b e t w e e n   t i m e   p e r i o d   t   a n d   s   f o r   a r e a   j )
The time-extended RPD specification has the property that in its elementary form, and when the data are complete, cross-country comparisons reduce to those obtained from single-equation RPD estimates, and price comparisons over time reduce to those obtained from a variant of the hedonic regressions used in the price measurement literature. The TiRPD was first proposed by Aizcorbe and Aten (2004), who referred to it as the time interaction-country product dummy method.
We applied this method by considering 16 months (January 2017 to May 2018) in order to monitor the evolution of spatial price differences.

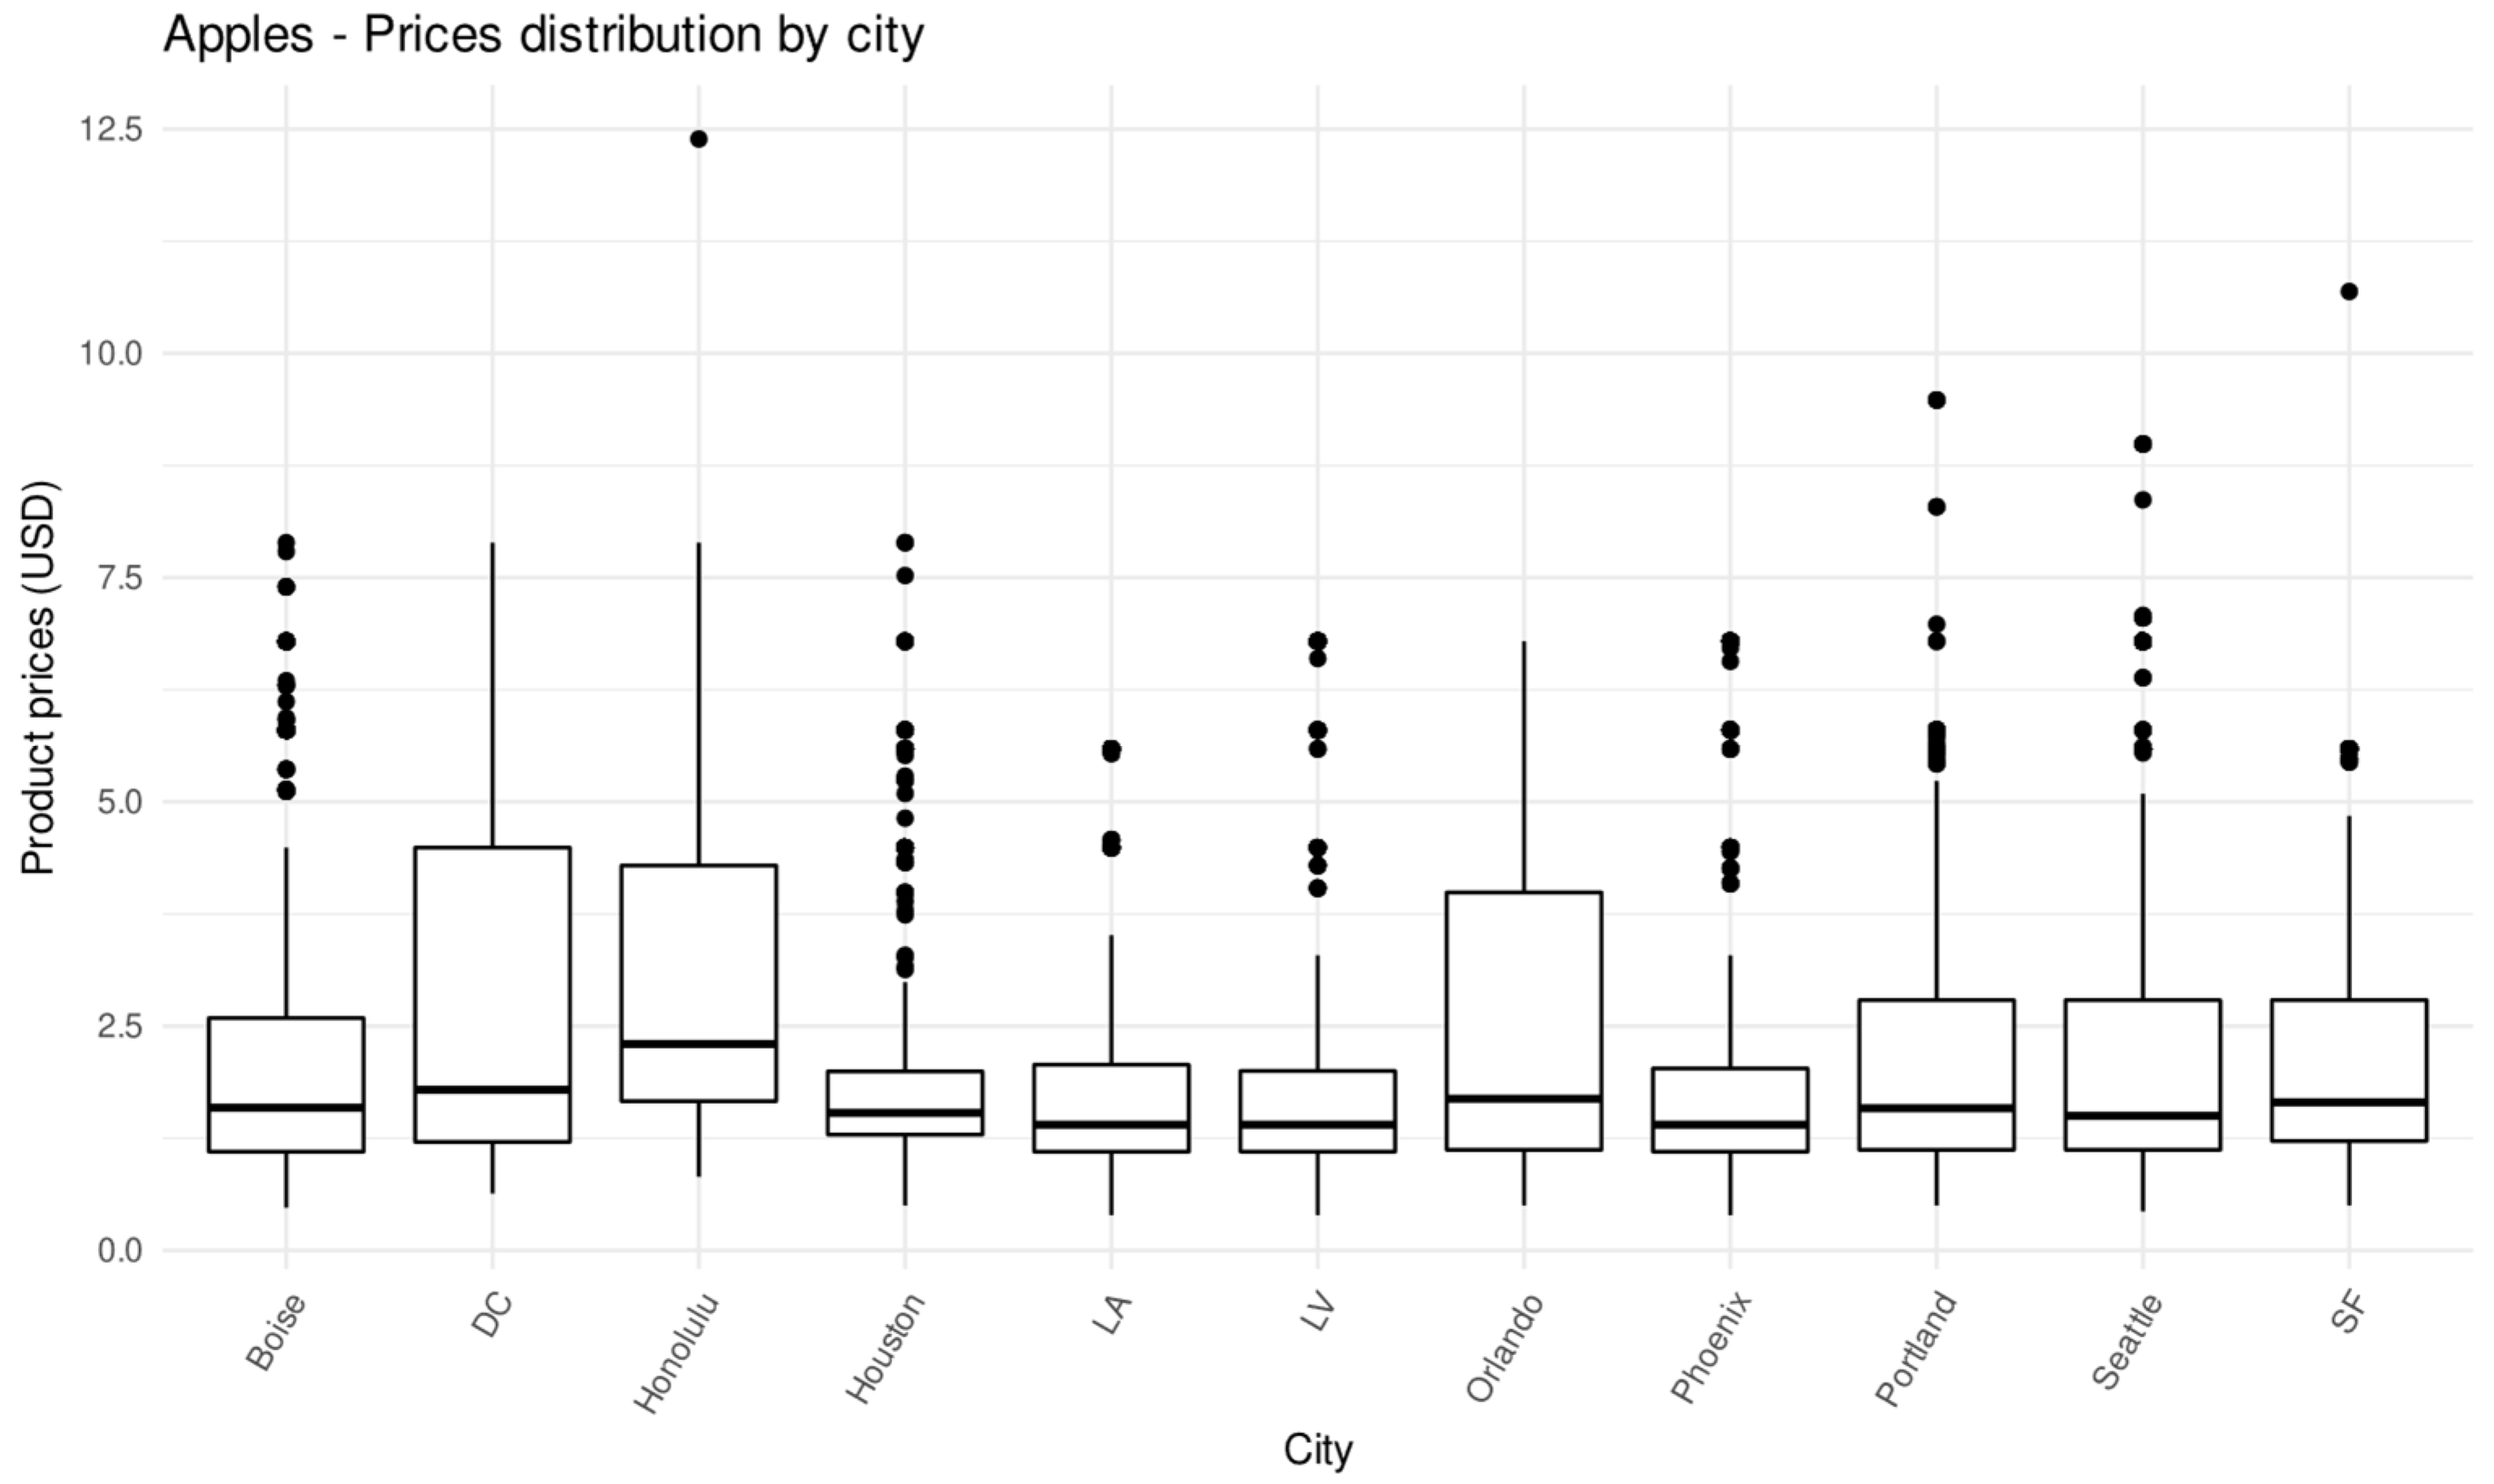
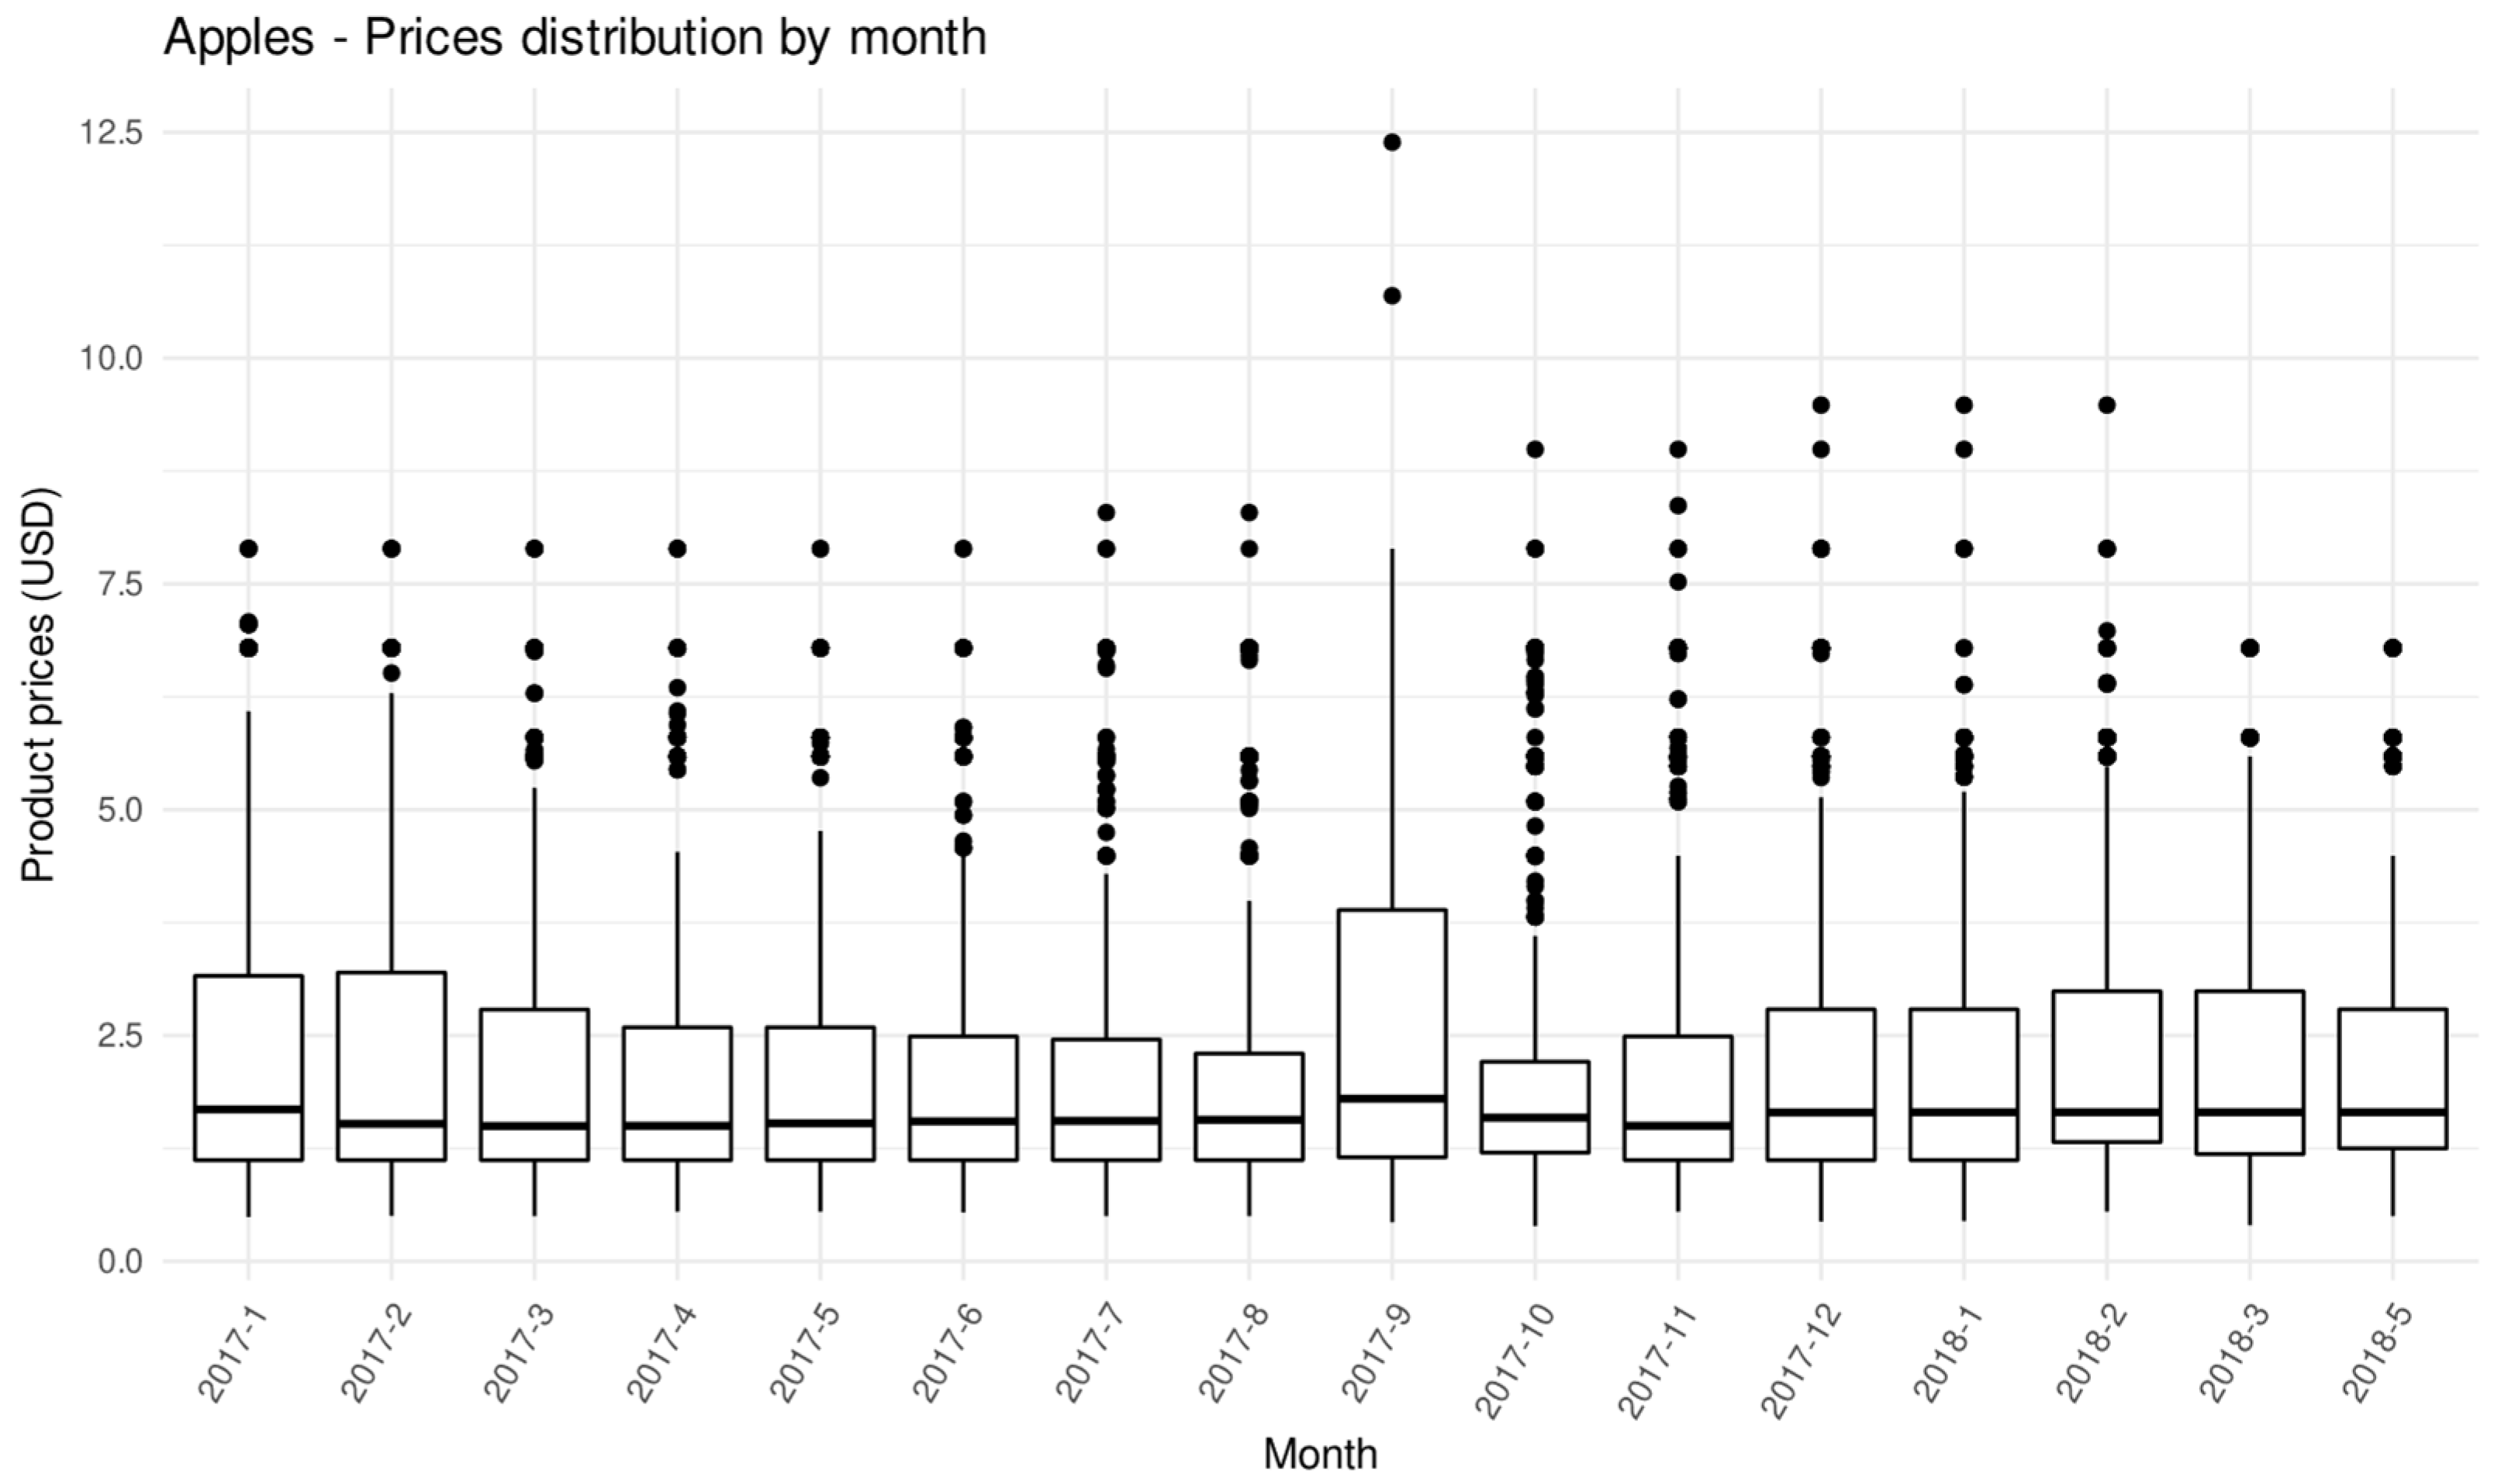
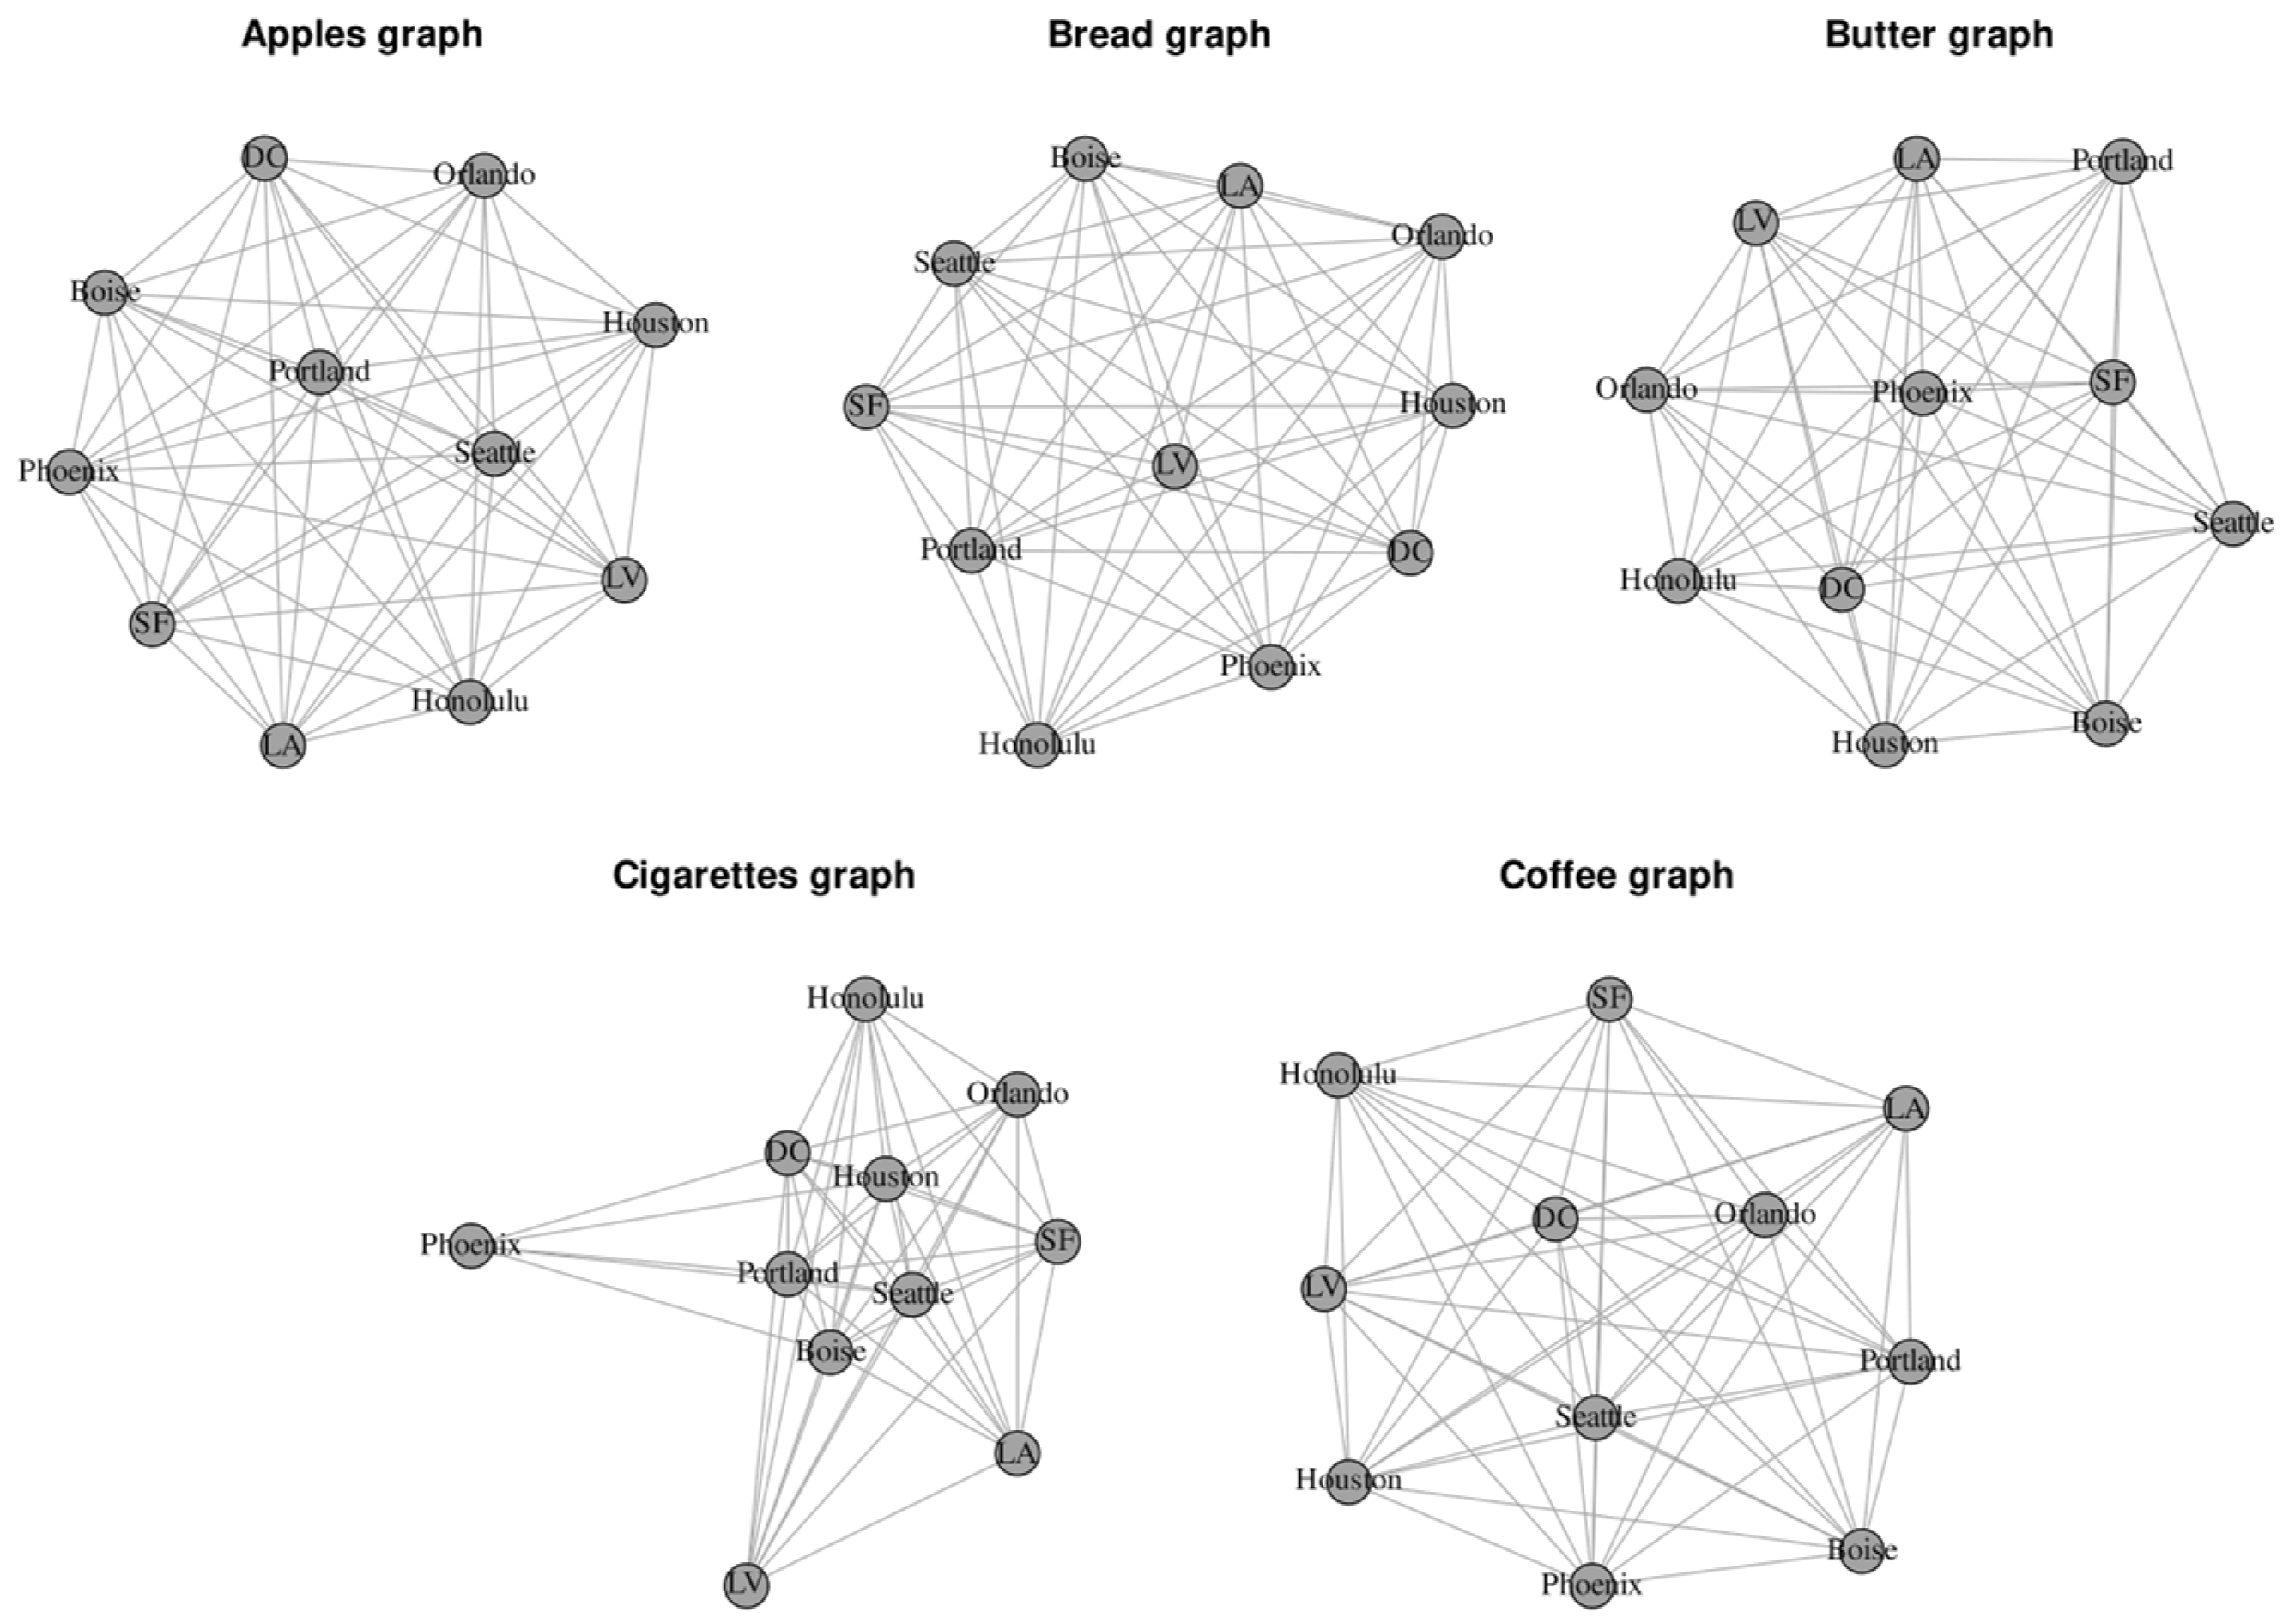
3.2. Data Acquisition and Description

The dataset used in this paper is a portion of a larger dataset, comprised of over 120 million data points, collected daily for the Grocerybear Project for over 50,000 unique items in about 750 commercial categories. Online prices have been collected using specialized software, developed in the context of the Grocerybear Project, that scans the websites of selected retailers that show prices online, finds relevant information on product webpages, and stores it in a database. The scraping software has been developed using the Python programming language and using the Selenium framework for web browser automation. Web browser automation, compared to other web scraping techniques, provides better results on websites that heavily rely on JavaScript to render data. The software was scheduled to automatically run every day and crawl throughout the selected websites, selecting sequentially different addresses for delivery. In each iteration, this software collected high-frequency information specific for the area selected, both in terms of prices and product availability. Information collected included product name, commercial category, product identification code, price, city, and collection date. Product attributes were parsed from the rendered webpages using HTML tags and XPATHS attributes for each specific field. This practice is common in web scraping using the Selenium framework, as in general all webpages on an e-commerce website share the same underlying HTML structure. Some of the attributes were visible in the rendered HTML, while others were embedded in tags, only visible when looking at the raw HTML. The number of data points is highly variable across days and months, because scraping routines were not always able to access and collect data. Reasons for these missing data points are various, ranging from failure of the system where scraping routines were running to retailers’ website redesigns that altered webpage formats.
Data were scraped from 11 shops—one shop in each USA city—from 4 online chains belonging to the same retail group. Categories are reported as assigned by each shop in its product classification, and mostly cover grocery products. Commercial categories were matched with ELIs using a text pattern search, and then manually validated. The fact that the 4 online chains belong to the same group and shared a common data infrastructure for both product commercial categorization and product identification codes was a tremendous advantage in our work. In fact, most products were shared across different cities with details we could match automatically for our elaborations, an operation that is much harder to perform across different retailers. Moreover, the selected retail group has both online and offline operations, with over 2000 stores under management across its different brands. Therefore, online prices can be taken as fully representative of general prices in the sampled areas (Cavallo 2017). The relevant size of this retail group also ensures price information can be regarded as representative of the overall market. However, we do not have information on quantities sold across different cities. Therefore, we are not able to determine the importance of each product in each city. The lack of weights for individual products is common unless scanner data are used for constructing price statistics.
Each product in our dataset has a category classification based on the online retailer category organization. In order to calculate price indexes for each CPI-U ELI, the first step is to rearrange the retailer classification according to CPI-U ELI definitions. To this aim, we manually selected commercial categories from a list provided by Grocerybear after filtering keywords. In order to ensure the reliability of our data, we performed a set of automated tests to detect potential outliers or incorrect data types on the original micro-data, with the aim of ensuring the absence of invalid data points. We manually checked the correspondence between the items and the ELI object of our analysis to ensure consistency of our findings. Finally, we excluded other cities, besides the 11 included in our study, since the coverage in terms of timeframe and items collected did not correspond with the main dataset. We mutually agreed the CPI-U ELIs to be published as Open Data and used in this paper, striking a balance between research interests and commercial targets by Grocerybear for the monetization of its full dataset. Individual products were matched by using product codes that are attached to the online goods. We controlled for the presence of matching unique products across cities, since in multilateral price index calculations the lack of common products across areas may effectively impair the ability to derive meaningful values (International Comparison Program—ICP 2021). Once the individual products were matched, we averaged all price observations across products for each item. Average prices were then aggregated to the ELI level.
In order to illustrate the potential of the suggested method, we selected 5 ELIs for eleven USA cities: Boise, Honolulu, Houston, Las Vegas, Los Angeles, Orlando, Phoenix, Portland, San Francisco, Seattle, and Washington DC. Data were collected between January 2017 and May 2018 and are presented as average monthly price in USD for each individual product in each city. The selected ELIs were Apples, Bread, Butter, Cigarettes, and Coffee. These ELIs were chosen to strike a balance between comparability and representativeness. Prices collected for the calculation of PPPs have to meet comparability and representativeness criteria, especially in the case of diverse countries in terms of climate, tastes, and preferences (EUROSTAT OECD 2012). Individual products collected for SPI construction should be comparable (be strictly the same or having similar price-determining characteristics) and representative (both in terms of consumer expenditure share and of price movements within the product group) across different areas. Failure to observe any of these requirements can lead to biased PPPs, resulting in an overestimation or underestimation of price level differences. The selected ELIs also represent common household items with a good amount of product matching across different cities in our sample, guaranteeing the soundness of our SPI calculations.
At the ELI level, we computed unweighted indexes using Equations (1)–(3) as data on quantities purchased cannot be observed via the Internet. This issue is not new to statistical agencies given that weighting information at the item level is generally lacking unless scanner data are available. For measuring price changes at detailed level, prices for identical items must be compared. By referring to the literature on this topic (de Haan and Hendriks 2013), this study uses multilateral index formulae in order to take advantage of all the detailed information contained in the online price database. As reported in Table 1, a total of 4172 unique products were matched, and in each ELI we can observe a fair variability of prices, indicating that we are potentially observing products with very different size and nature. This is particularly marked in the Cigarettes category, with a sizeable standard deviation of observed prices.
The selected ELIs display different patterns over time and provide good illustration examples. Figure 1; Figure 2 show the distribution of product prices for the Apples ELI across cities and months. By cross-referencing those two graphs, we can appreciate that for this ELI product prices seem to move together across time, but with some marked divergence in some cities during a few months—more evidently in September 2017.
From Figure 1 and Figure 2, we can observe that Apple ELIs are subjected to a greater level of price variability: they vary over time and across cities. Comparing apple prices across USA cities, in Figure 1 we can observe that Orlando is the city with the highest level of price variability compared to the other USA cities. Although apples are grown in almost every state, some areas of the USA with warm winters, such as Florida (Orlando), are not suitable for the production of commercial crops. Washington State is by far the largest producing state for apples in the United States. Thanks to a global marketplace, fresh apples appear in grocery stores all year round now, but the northern hemisphere’s apple season is typically from as early as July to as late as November. Indeed, results from Figure 2 shows seasonality in apple prices, with the highest median price observed in September 2017 (median price equal to $1440 per lb, mean price equal to $283 per lb).
Although not all the products are priced in all the cities, from Figure 3 we can observe that for each ELI, web-scraped exhibits overlap among cities, with Cigarettes being the least connected one. In our dataset, the strength of the interconnection and overlaps is strong, meaning that reliable price comparisons across different cities can be made for the ELIs we selected.
Indeed, for SPI, little overlap in the product headings priced by the two areas implies that they are very different and, by implication, inherently difficult to compare (Hill and Timmer 2006).

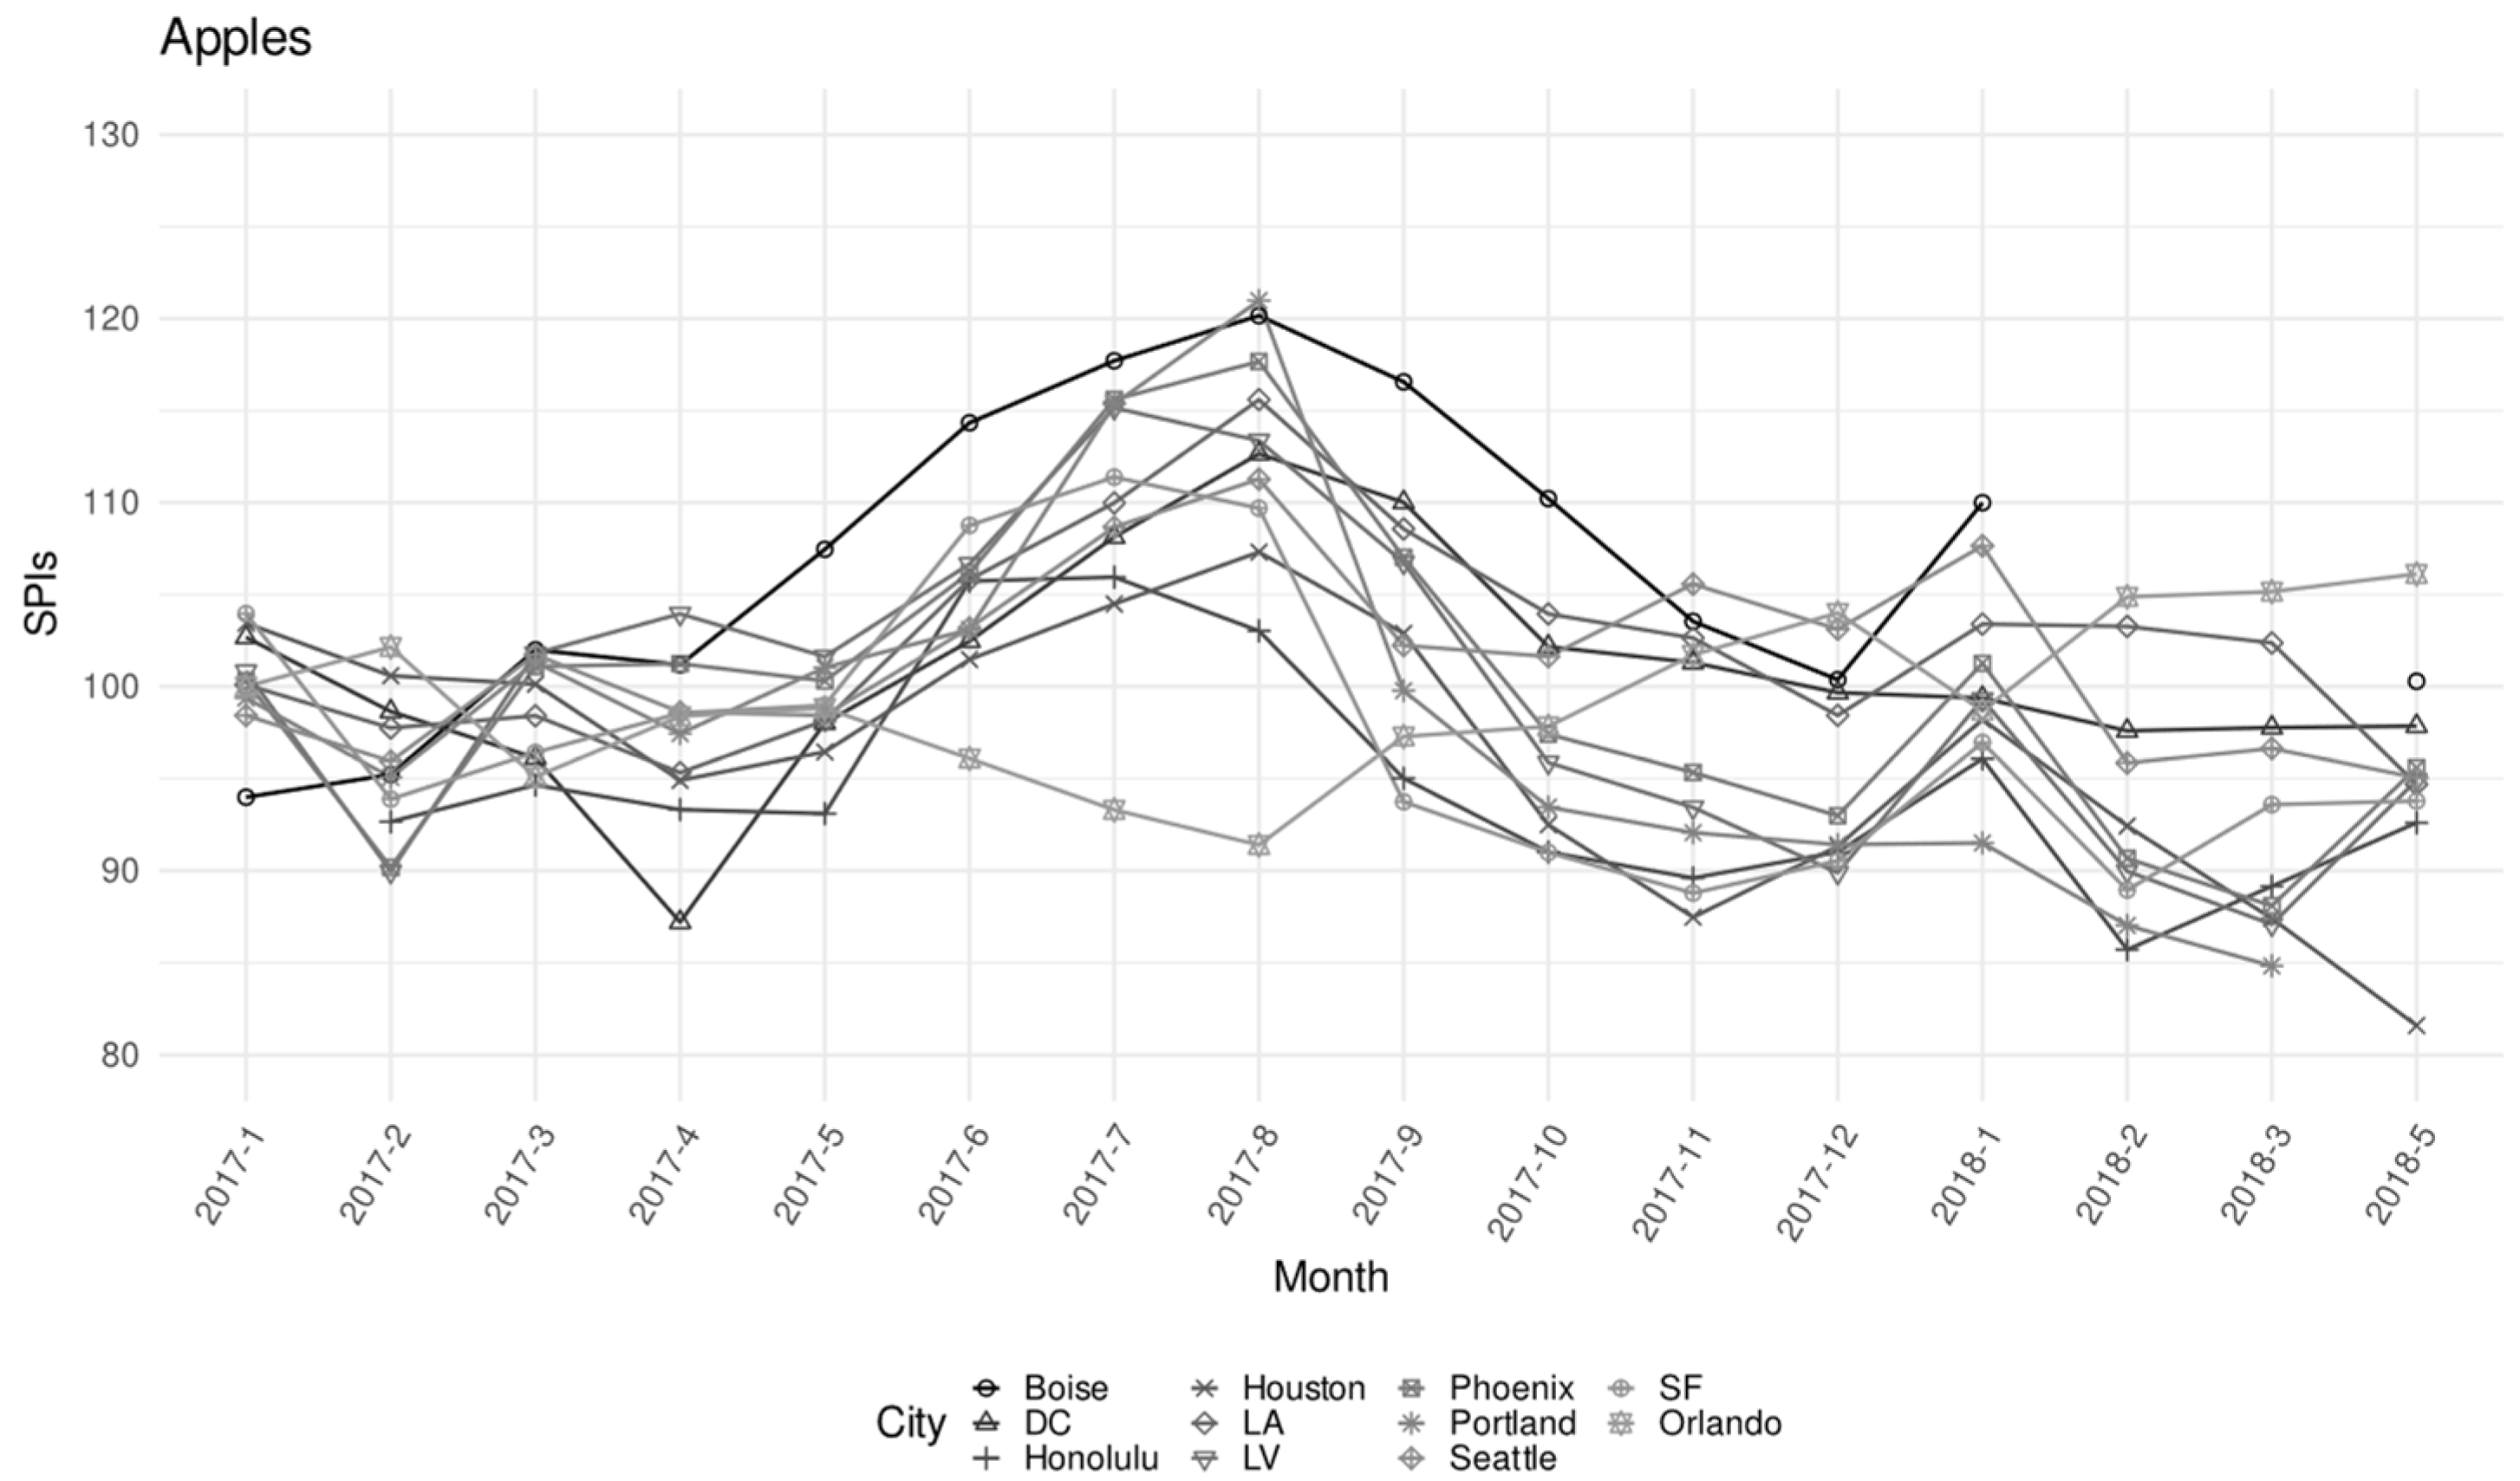
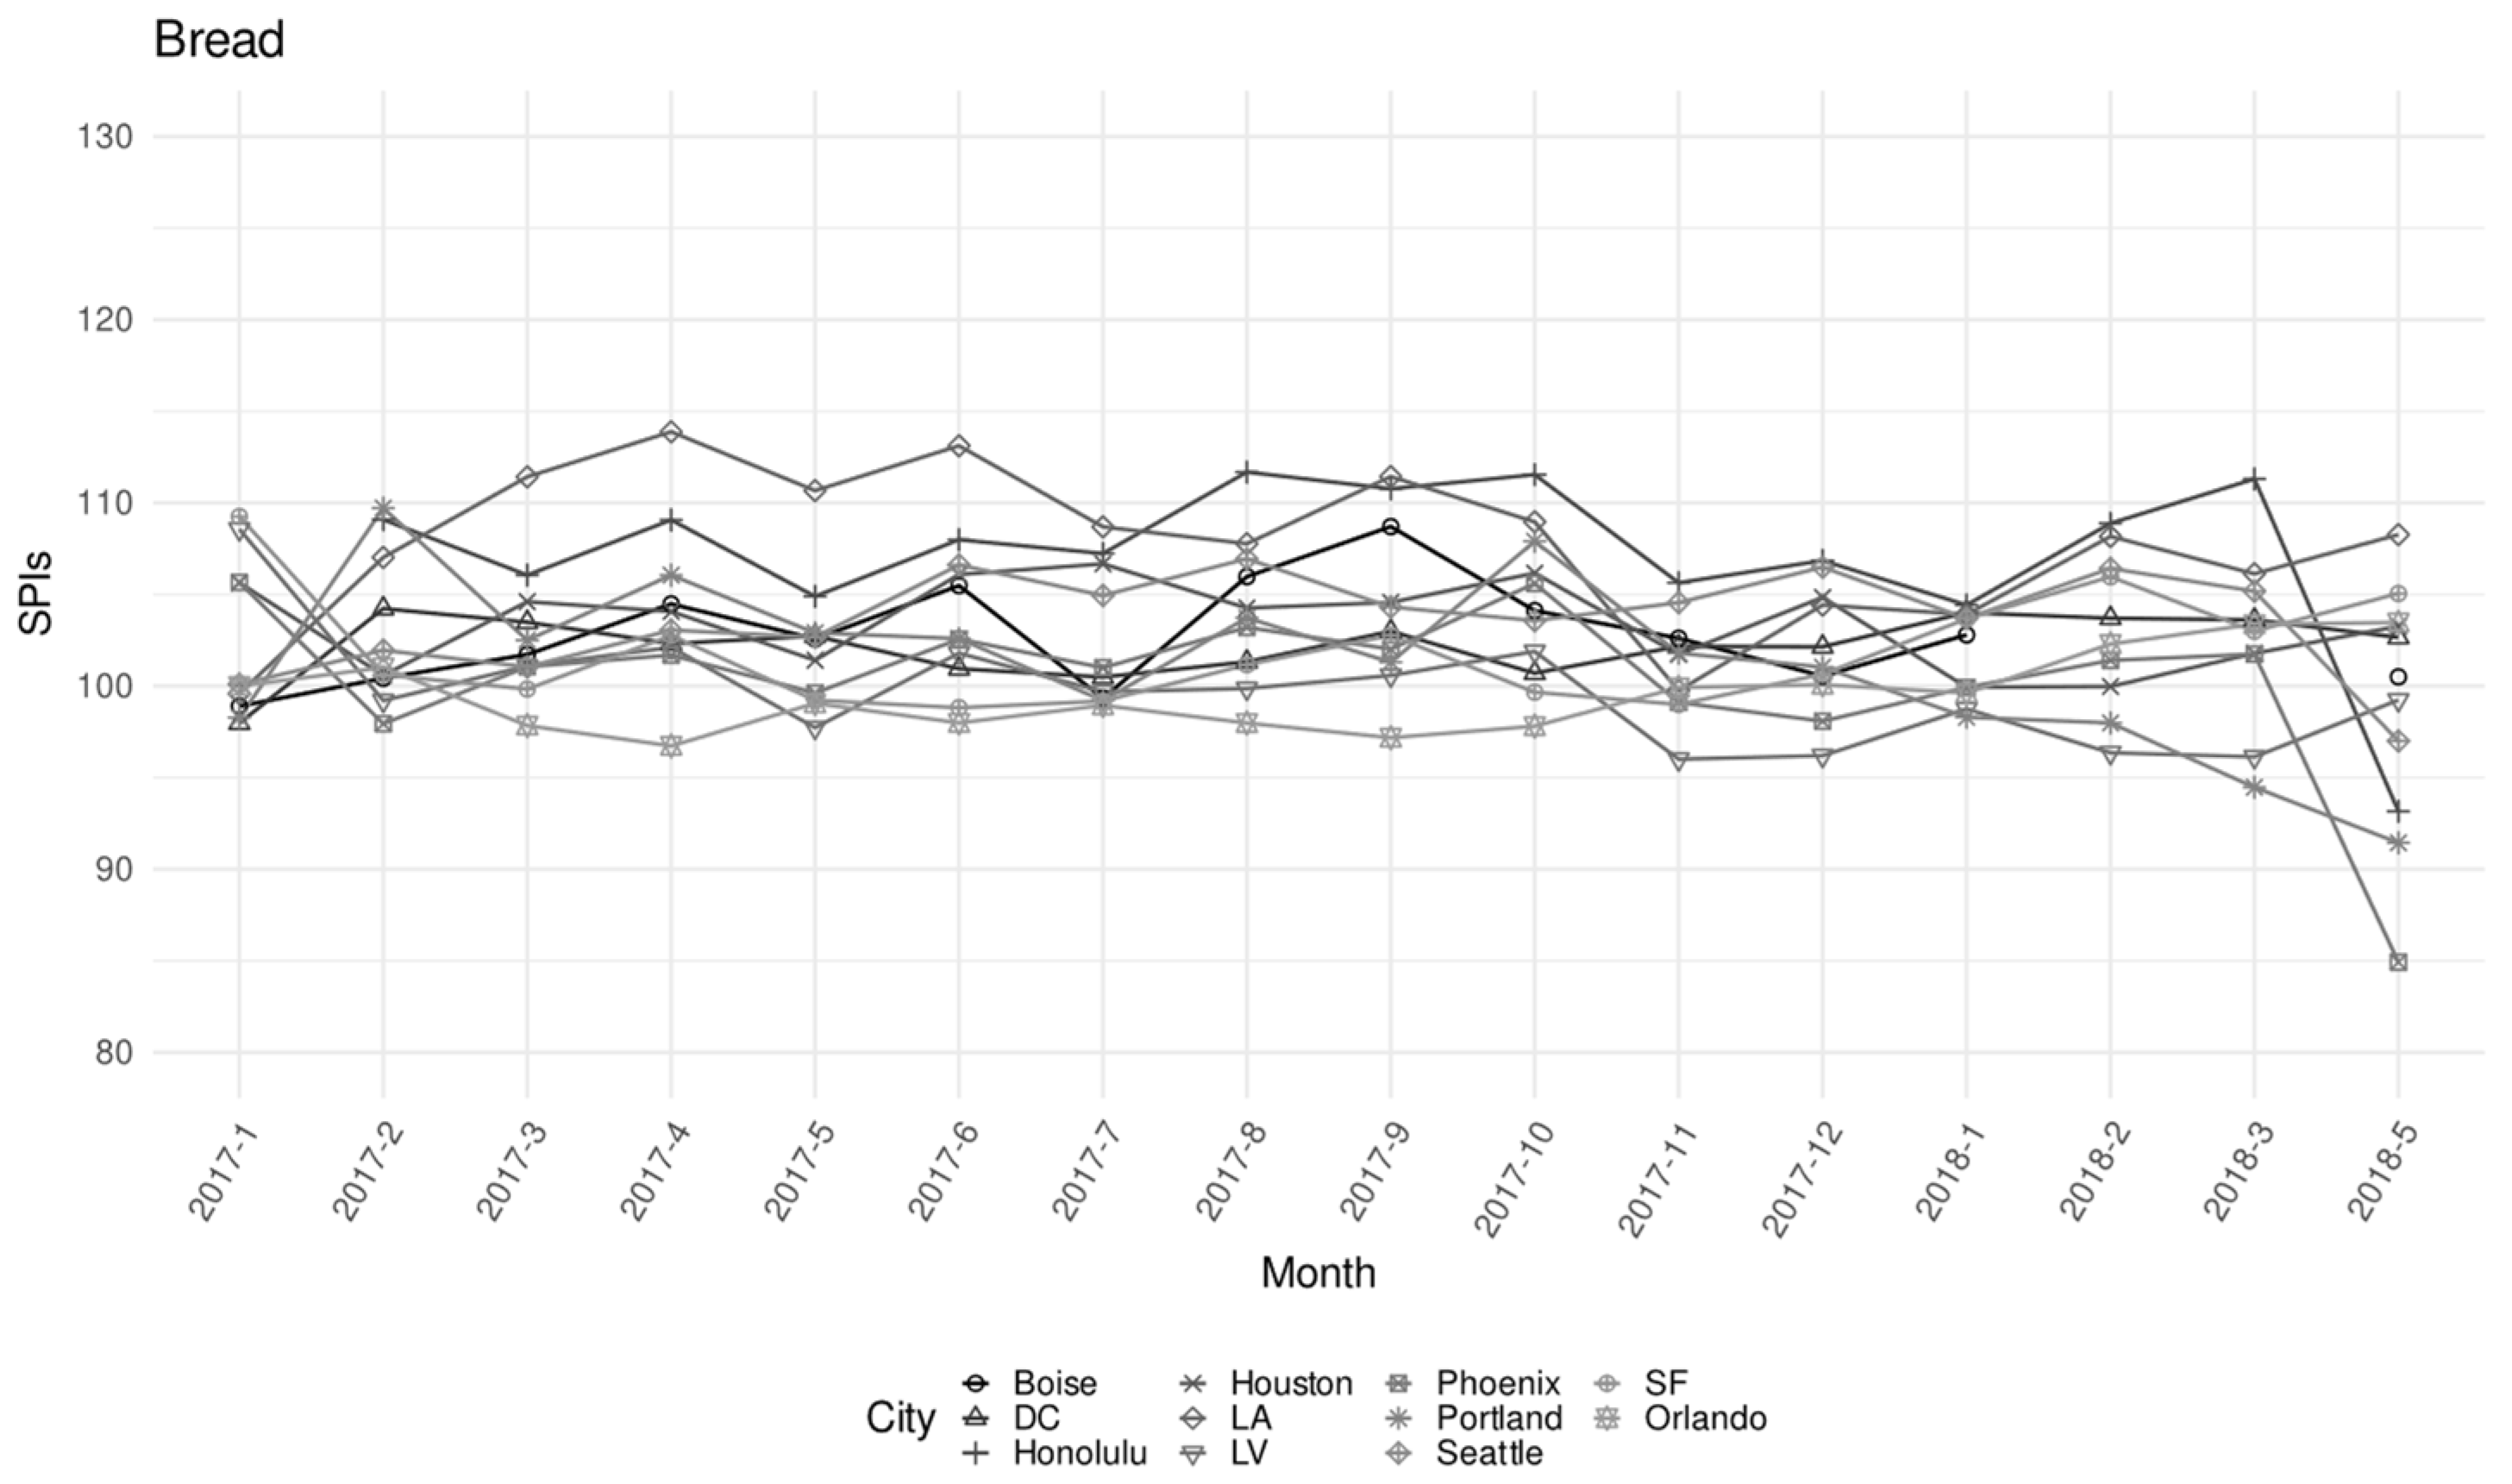
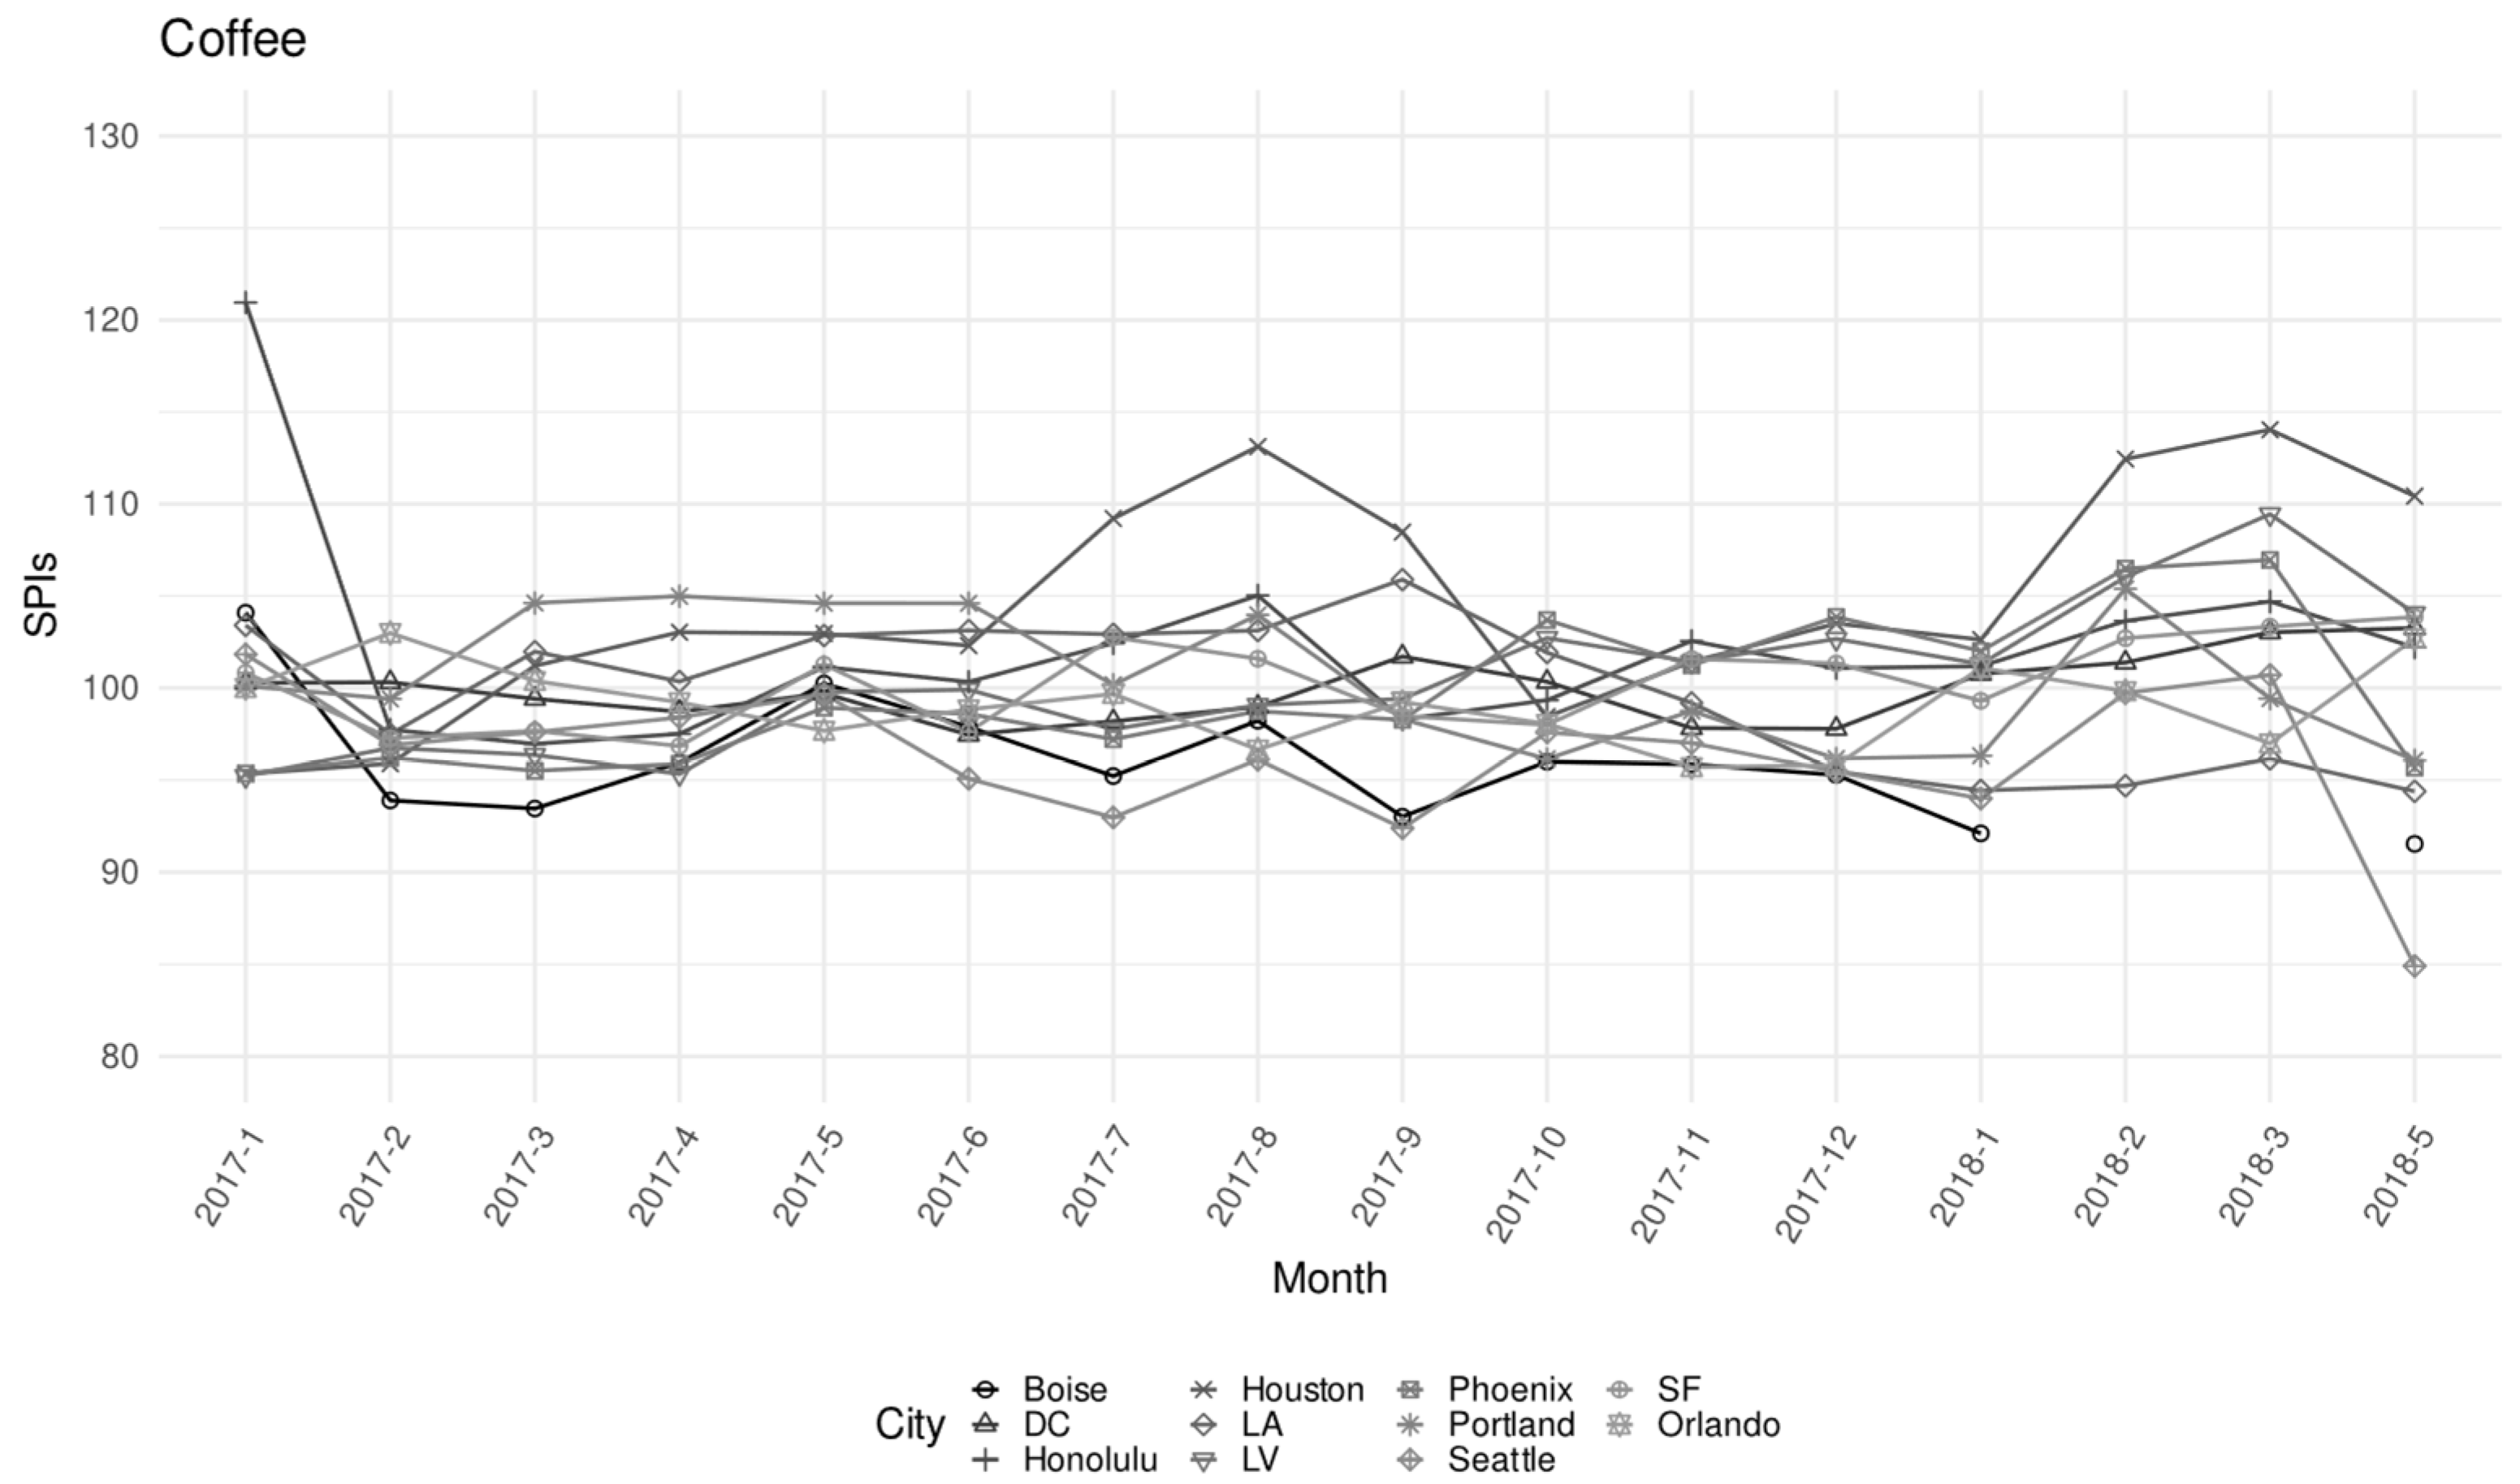
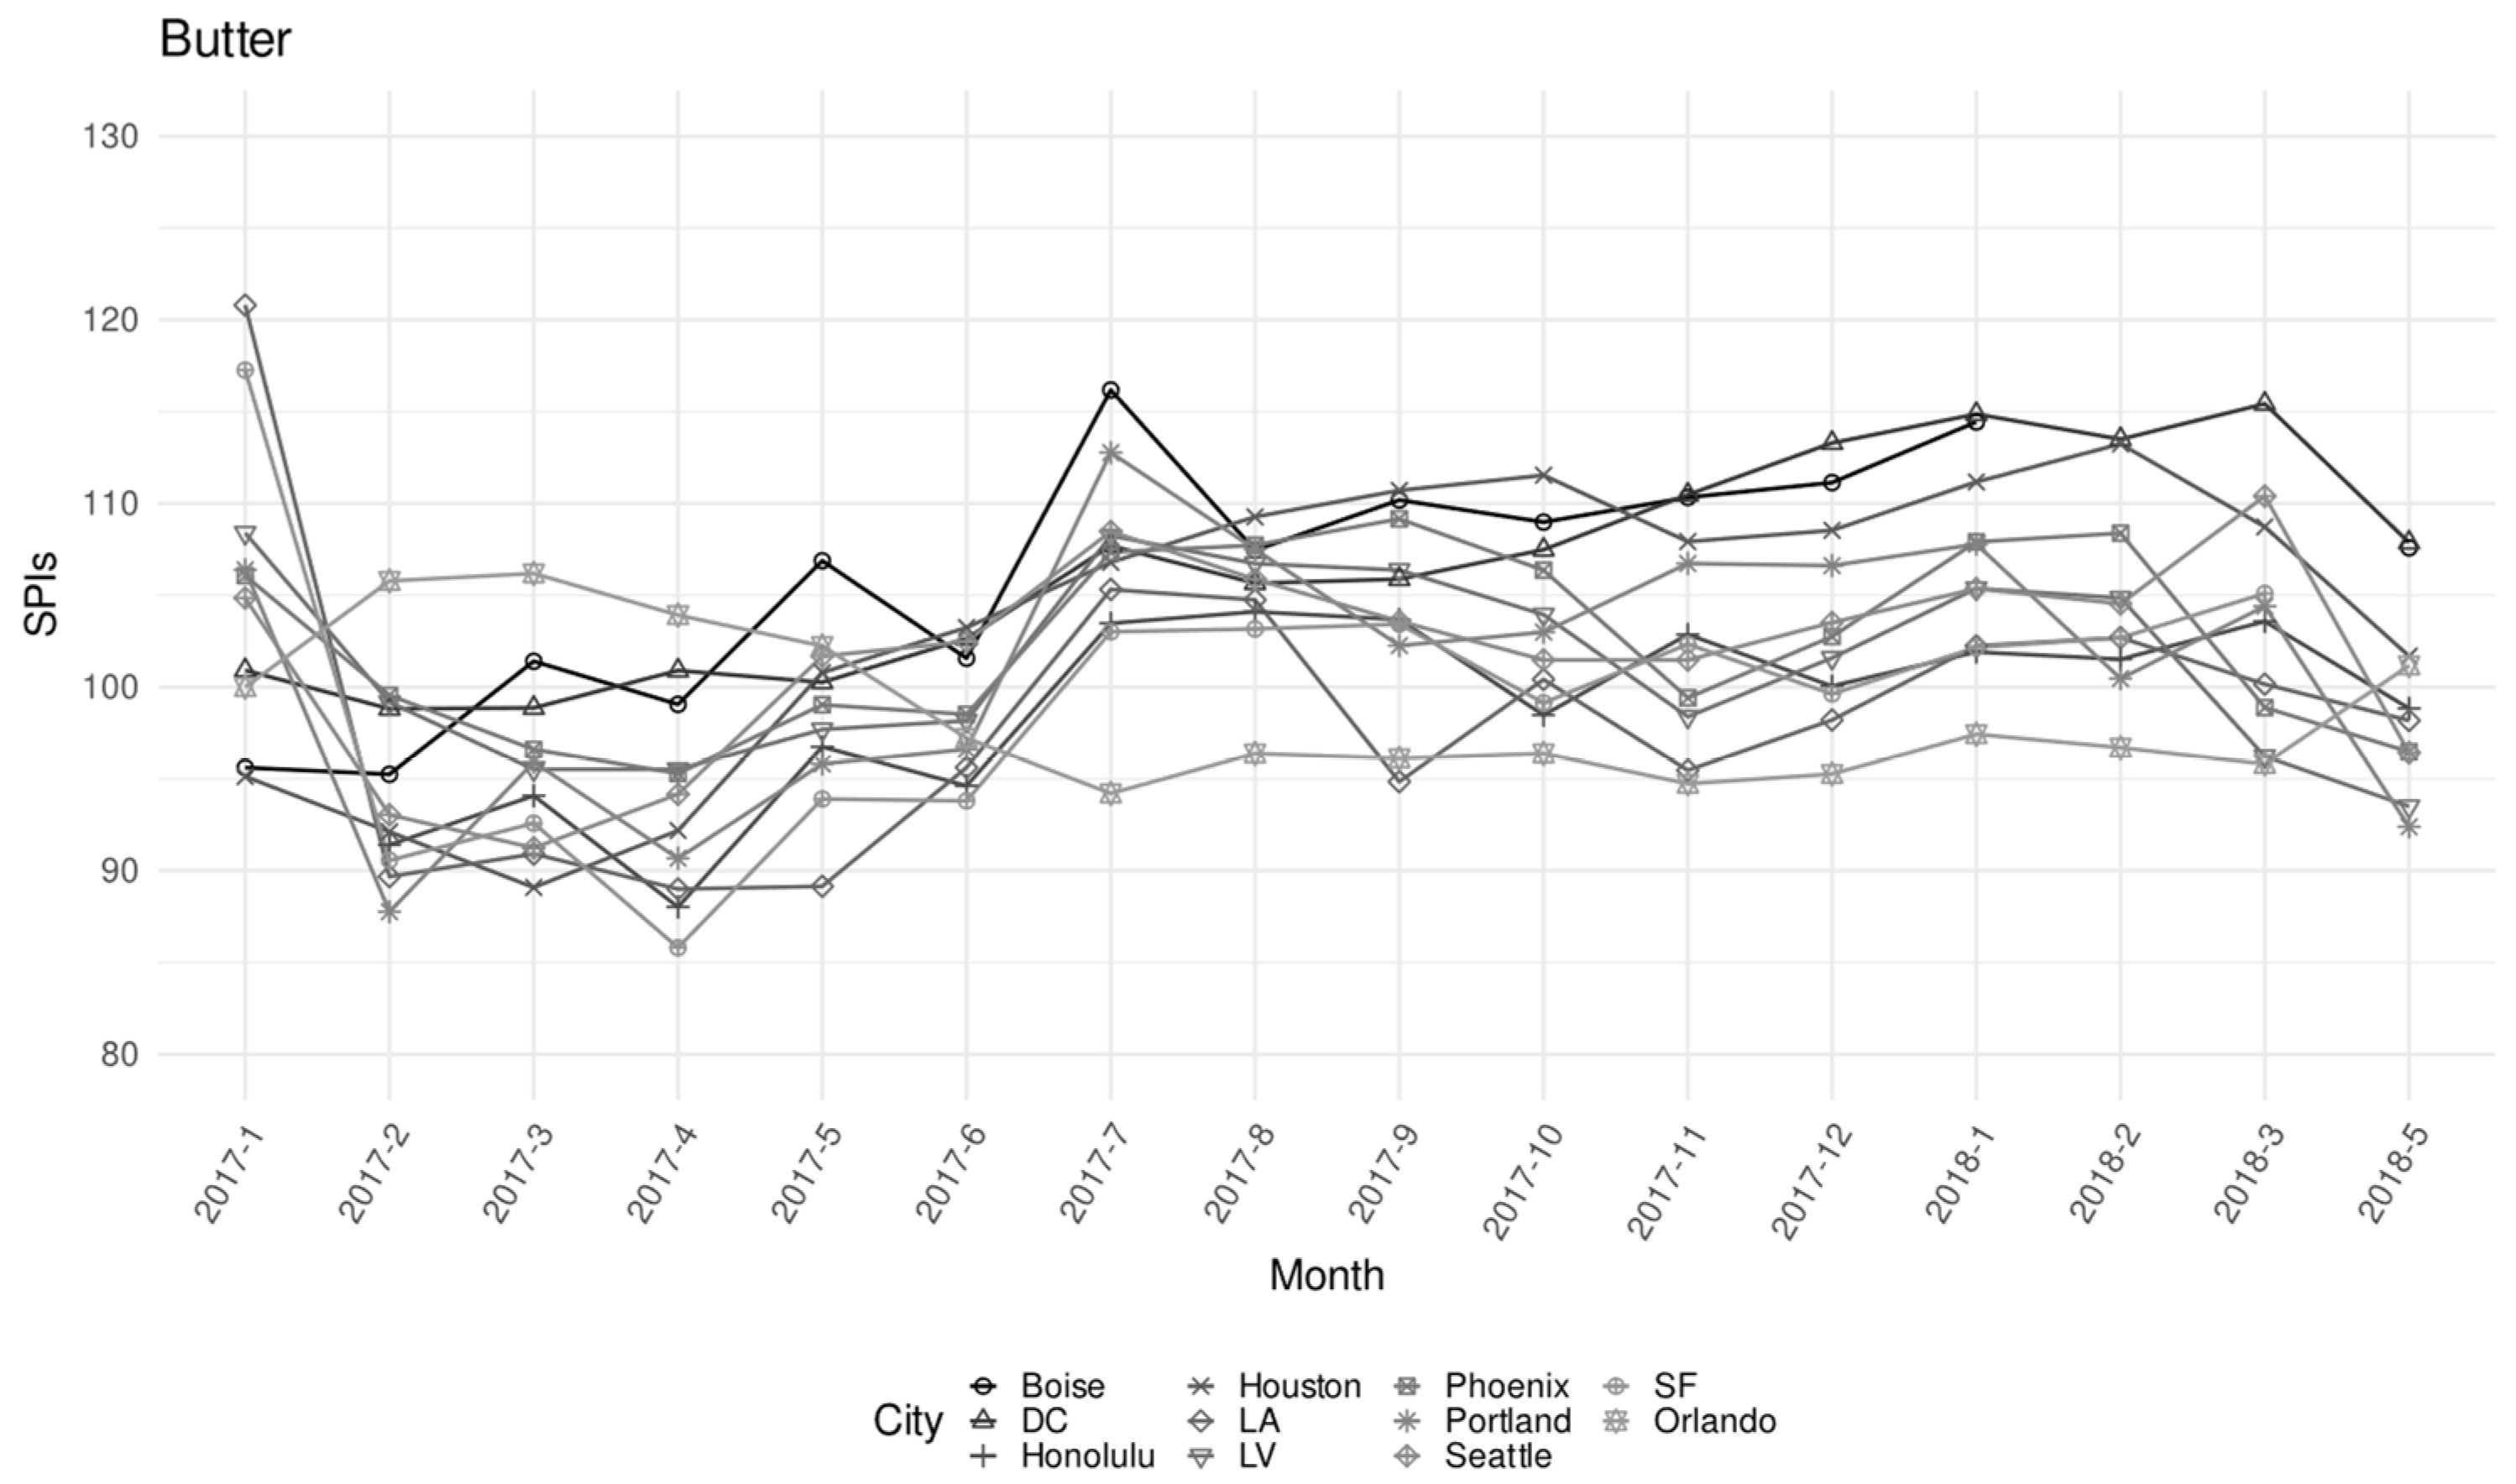
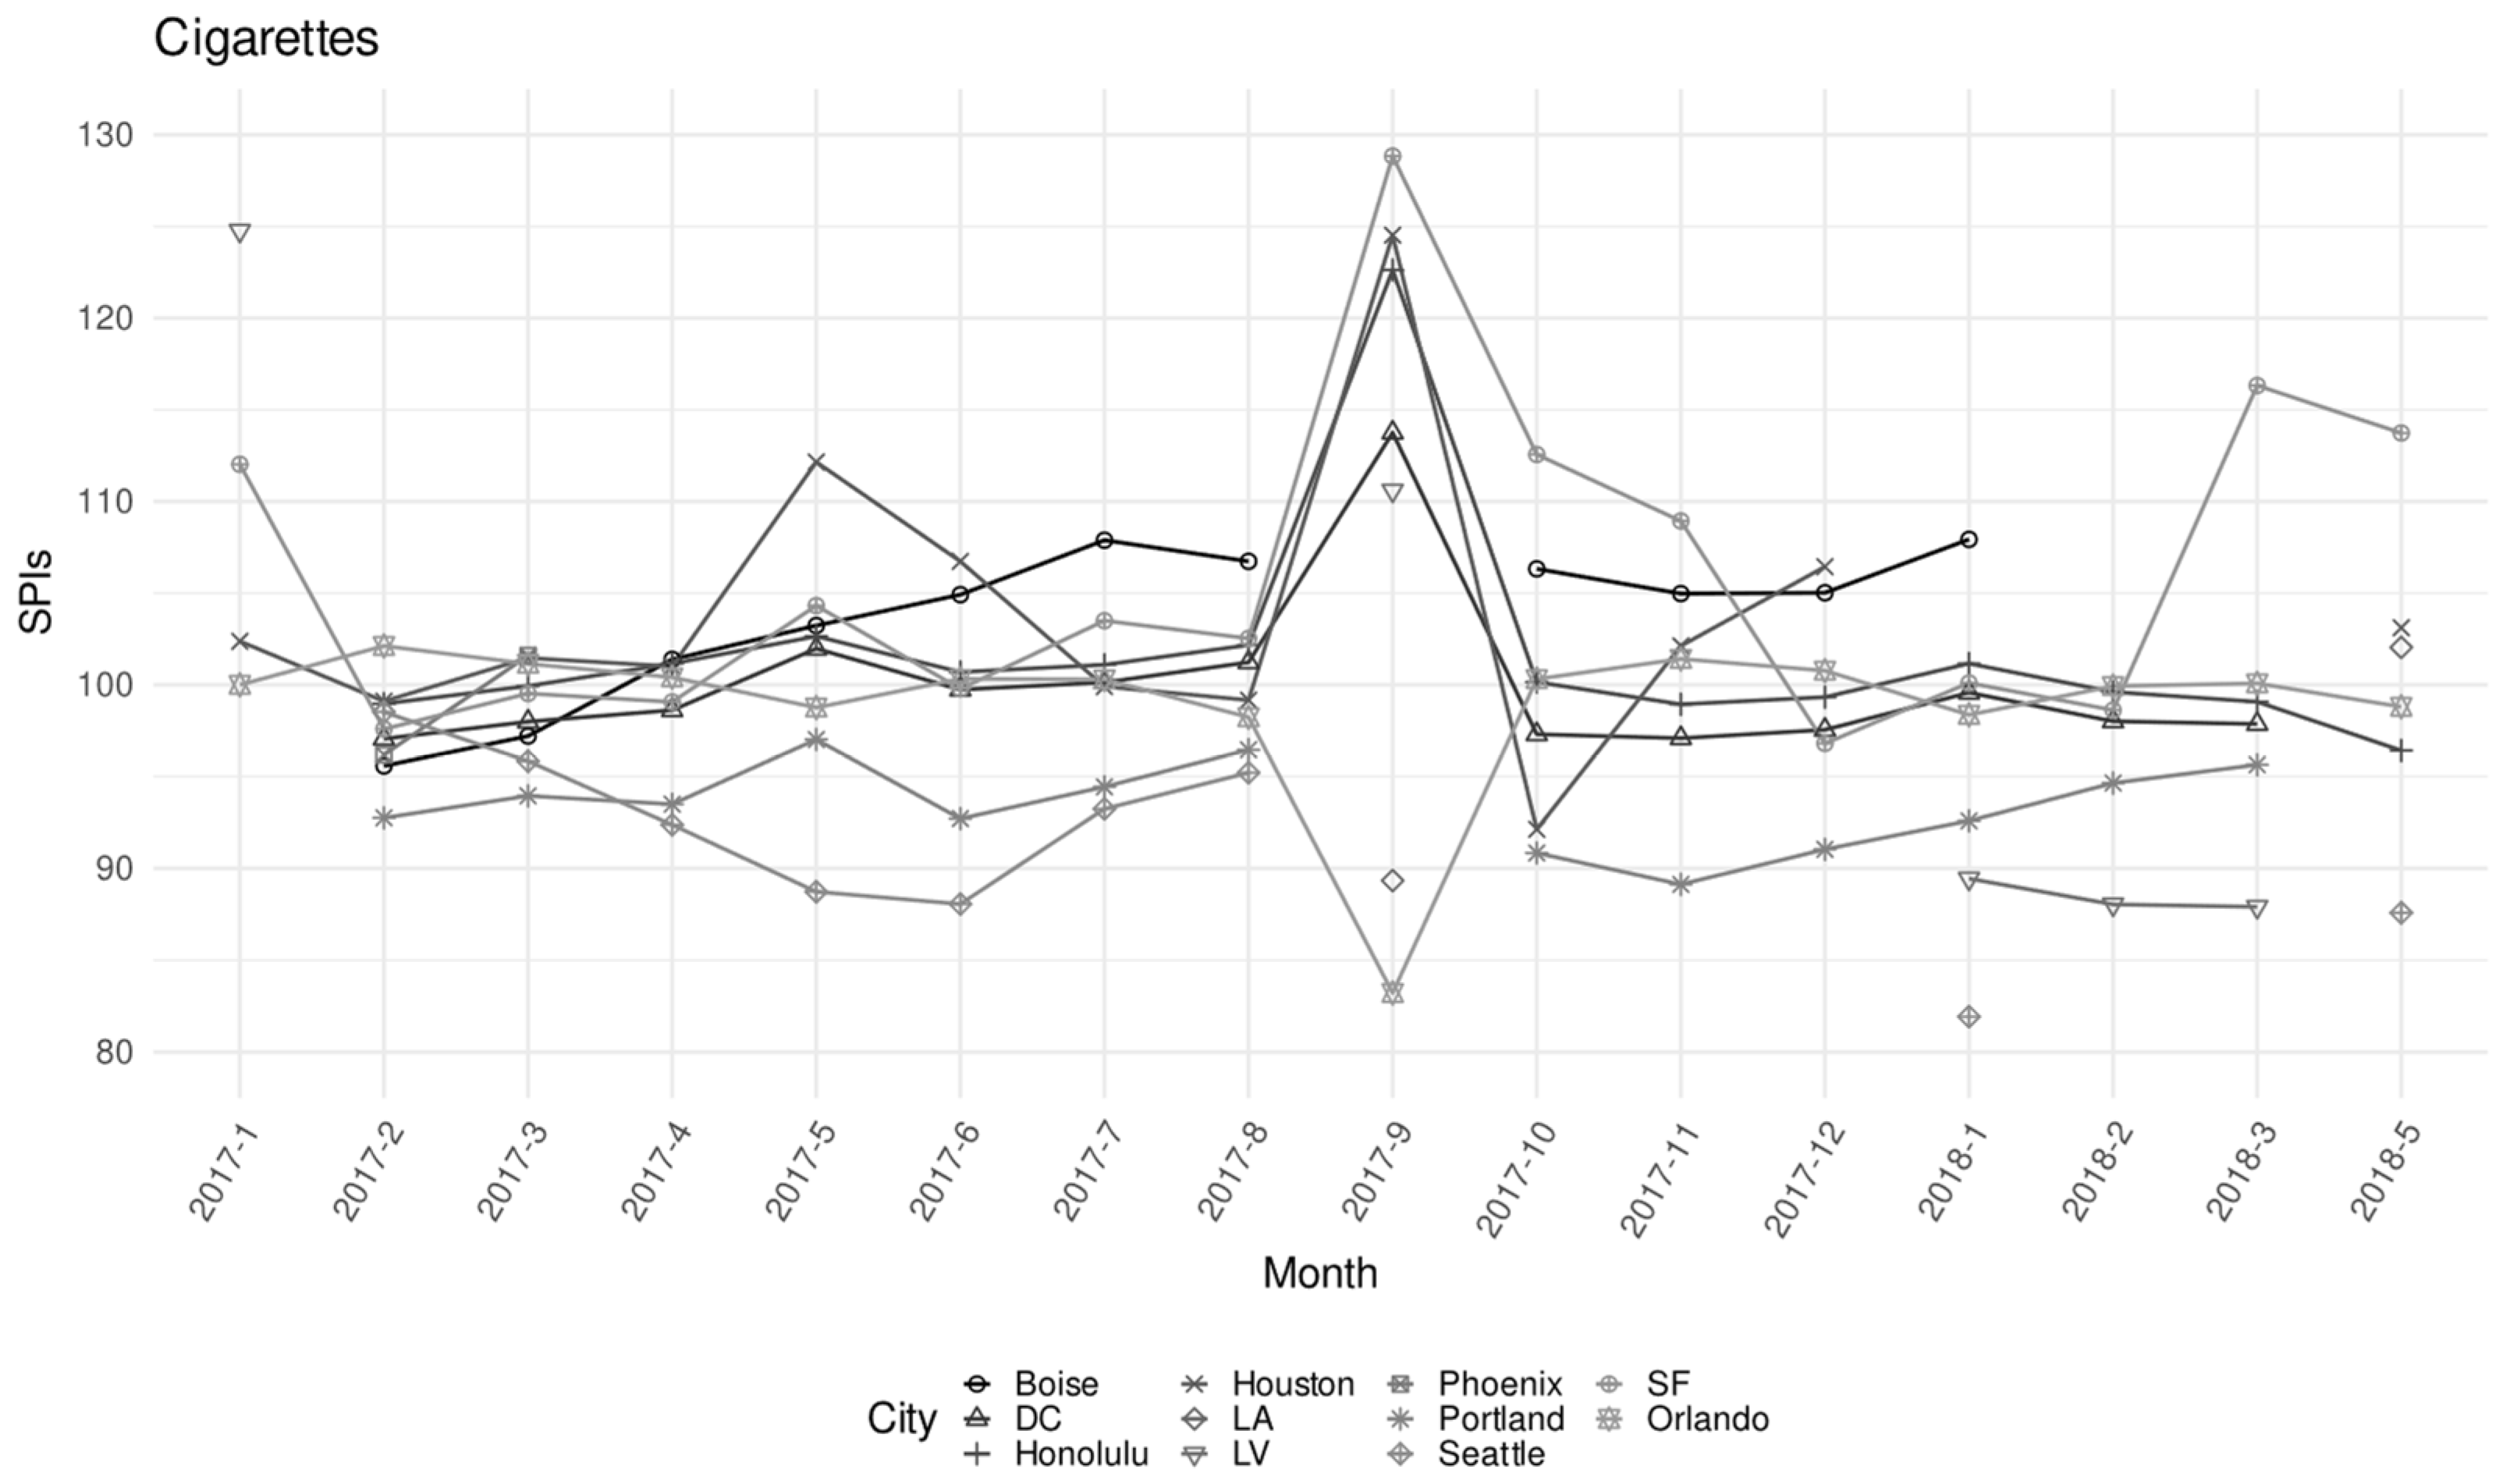
4. Results from TiCPD Models

In this section, we illustrate results from RDP (Equation (1)), TDP (Equation (2)), and TiRPD (Equation (3)) models for the Apples ELI, as reported in Section 3. Table 2, Table 3 and Table 4 illustrate parameter estimates corresponding to the three regression model specifications: Table 2 provides results from single-equation RPD regressions expressed in Equation (1), where a separate regression was done for each time period. For the sake of brevity, we reported results for the RPD model by considering Orlando as reference, so that each estimated coefficient (β_j) provides price differences relative to the Houston city for the fixed period 2017-08. Similarly, Table 3 provides parameter estimates from single equation TPD regressions expressed in Equation (2), where a separate regression was done for each city and the estimates are expressed relative to time period. In this table, we report the estimated coefficient (γ_t), which provides price differences relative to the time period 2017-08 for the fixed city equal to Orlando. Finally, Table 4 provides estimates from the combined specification model, the TiRPD model set out in Aizcorbe and Aten (2004), where the normalization is on price in Orlando in 2017-08. In order to illustrate the results of this model, in this table we report estimated coefficients for the period 2017-01 to 2017-12.
In the data, we have some missing values, meaning that different regressions generate different predicted values. In order to verify whether relative price levels across cities for a time period in the TiRPD are equal to those in the RPD, and price changes in the TiRPD are equal to those obtained from the TPD, we performed the Chow test (Chow 1960) using dummy interaction terms: δ j t δ k t = β j β k (differences between cities j and k for time t) and δ j t δ j s = γ t γ s (differences between time periods t and s for city j). Chow test for Apple ELI gave a F-statistic value of 0.99 and p-value of 0.52. From these results, we accept the null hypothesis that the two regressions provide equal estimates.
Observing the results reported in Table 2, heterogeneity in price differences across cities is confirmed when considering the Apple ELIs. Honolulu appears to be the most expensive city, indeed in August 2017 the price of apples was 42.3% higher than Orlando. All the estimated coefficients are significant. Moreover, the price of apples changed across time periods. From Table 3, we can observe that for Orlando city the highest increase in apple price occurred in December 2017, indeed in December 2017 the price of apples was 11.83% higher than August 2017. Results in Table 4 reveals the price evolution of apples over time and space by considering Orlando as city of reference in August 2017. It is interesting to note that in some cities, such as Boise and DC, apple prices were always lower than the price observed in August 2017 in Orlando city. For Orlando city, the highest increase in apple price was observed in December 2017 (in this month the price of apples was 13.5% higher than August), while the most expensive city was Honolulu in August 2017, when apple prices were 40% higher than price observed in Orlando.
In order to illustrate the evolution of PPPs over time and space, in Figure 4, Figure 5, Figure 6, Figure 7 and Figure 8 we report PPP results for each ELI obtained from the model expressed in Equation (3), where the normalization is based on the price in Orlando in 2017-01. Price differences show different spatial patterns for different consumption categories. From Figure 4, we can note a marked trend in the price for the Apples ELI, with price indexes moving mostly in the same direction across all cities except Orlando. This may be due to seasonal price variation for this fresh product, with substantial price increases during summer months in 2017 and a return to pre-summer price levels in the autumn of the same year. While in Figure 5, we can observe that the Bread ELI prices seem to move together across cities, with Los Angeles standing out for relatively higher prices between March and June 2017. From Figure 6, we can observe the presence of marked price spikes for the Coffee ELI in Houston city, with two occurrences (June–September 2017 and February–May 2018) where prices temporarily soared to then return to previous levels. The price index observed for the Butter ELI seems to move in the same direction across all cities except Orlando during summer 2017. Lower prices are observed at the beginning of the series (January–April 2017), while during November and December, Butter prices increased across all cities before then moving back towards low prices in early 2018. In Figure 8, we can observe high variability in relative prices changes for Cigarettes both across cities and months. Several factors affect how much residents pay for cigarettes in their state, such as Federal cigarette tax and state taxes. In this ELI, we also note several missing values in the SPI series. This makes difficult to derive meaningful insights for this specific ELI, which is possibly affected by a combination of local taxes which may have varied differently across cities and states during the sampling period.
Except for Cigarettes, all SPIs are roughly encompassed in a 30-point band in any given month. This finding is consistent with the analysis published by the U.S. Bureau of Economic Analysis for Regional Price Parities on all items for 2017, which presented overall price levels across USA areas and metropolitan cities.

5. Concluding Remarks

Real-time monitoring of online consumer prices may be a very effective instrument to support policy making, as it enables frequent actionable insights into the economic environment and immediate feedback on policy effects. Web scraping offers the potential to improve greatly the quality and efficiency of consumer price indices. Scraped data are available in real time, without any delays in accessing and processing the information. To this respect, scraping may be a promising solution to construct high-frequency price statistics for specific groups of products. We have shown that web scraping is a promising data collection method for improving available information on product price changes over time and across space. Although creating and maintaining a large set of reliable web scrapers at large scale may be a labor-intensive task, requiring sufficient IT knowledge, collecting prices online reduces the costly manual price collection for the NSIs and the response burden for the statistical units. Comparing price levels across geographical areas and how they change over time is an issue of interest to local governments, firms, households, and international organizations. However, this issue has received little attention in the index number literature due to the lack of suitable data (Hill 2004). This paper considers the problem of how to construct and reconcile price indexes across space and time by using web-scraped data. We applied the TiRPD regression model approach developed by Aizcorbe and Aten (2004) to estimate sub-national price indexes across time and space. The dataset used in this paper encompasses daily prices for five ELIs (Apples, Bread, Butter, Cigarettes, and Coffee) scraped using specialized software for eleven USA cities collected between January 2017 and May 2018. These ELIs were chosen to strike a balance between comparability and representativeness. In each ELI, individual products are matched by using product codes that are attached to the online goods. We controlled for the presence of matching unique products across cities, since in multilateral price index calculations the lack of common products across areas may effectively impair the ability to derive meaningful values (International Comparison Program—ICP 2021). We reported results obtained from CPD, TPD, and TiRPD models, as set out in Aizcorbe and Aten (2004), for the Apples ELI by considering Orlando as reference city. The SPIs computed for the Apple ELI displayed different patterns over time and space, providing a good illustration example. In addition, we provide insights on all five ELI patterns according to the TiRPD model, highlighting results specific for cities and categories. The use of this source of data may also have implications for official statistics as an ideal complement to traditional methods of collecting prices, particularly in goods categories that are well-represented online. Collecting online prices allow the computation of high-frequency price indexes for specific product categories based on more frequent and larger samples of goods and services. As with many scraped datasets and big data in general, data quality is a point of concern. Given the unfeasibility to manually check every single record, it may be appropriate to develop automatic routines to identify and correct anomalies that may affect results.

Author Contributions

Conceptualization: I.B., T.L. and L.P.; methodology: I.B. and T.L.; software, I.B. and L.P.; validation: T.L.; formal analysis, I.B. and L.P.; investigation I.B., T.L. and L.P.; data curation, L.P. and B.M.R.; writing—original draft preparation: I.B. and L.P.; writing—review and editing: T.L.; visualization I.B. and L.P. All authors have read and agreed to the published version of the manuscript.

Funding

This research received no external funding.

Institutional Review Board Statement

Not applicable.

Informed Consent Statement

Not applicable.

Data Availability Statement

Data and the R code that support the findings of this study are openly available in Mendeley Data at https://data.mendeley.com/datasets/w293jxpggj/2 with doi:10.17632/w293jxpggj.2 (accessed on 15 December 2021).

Conflicts of Interest

Authors declare no conflict of interest.

Notes

1
Statistics Netherlands, in the context of international EuroGroups Register project, explored the use of Wikipedia as a source for collecting relevant information for the maintenance of the register of internationally operating enterprises (ten Bosch et al. 2018). The United States Department of Agriculture has explored the use of web-scraped data to assess undercoverage of the National Agricultural Statistics Service by developing a list frame of all potential farms in the USA (Young and Jacobsen 2021).
2
PPPs are essentially spatial price index numbers. The concept of purchasing power parity is used to measure the price level in one location compared to that in another location. More specifically, at the international level, purchasing power parities of currencies are defined as the number of currency units of a country that can purchase the same basket of goods and services that can be purchased with one unit of currency of a reference currency (World Bank 2013). PPPs are calculated for product groups and for each of the various levels of aggregation up to and including gross domestic product (GDP).
3
Grocerybear is a brokerage for market intelligence who gathers local pricing and market information on what consumers pay for basic goods. The research team received a large dataset of historical microdata from Grocerybear under a Confidential Data Exchange agreement. Grocerybear authorized the publication of the aggregated dataset used for the present study (Benedetti et al. 2021). More details on the Grocerybear project are available at https://www.grocerybear.com (accessed on 15 December 2021).
4
Dataset and code used for this paper are made publicly available as Open Data (Benedetti et al. 2021).
5
At the international level, PPPs are compiled by the International Comparison Program (ICP), which is administered by the World Bank and overseen by the United Nations Statistical Commission with the collaboration of the OECD, EUROSTAT, and other regional organizations (see World Bank 2013, chapter 4 for details).
6
Entry-level items (ELIs) are the ultimate sampling units for the selection of the unique product or service within the outlet by the BLS national office in order to estimate CPI in the US.

References

  1. Aizcorbe, Ana, and Bettina Aten. 2004. An Approach to Pooled Time and Space Comparisons. Paper presented at SSHRC Conference on Index Number Theory and the Measurement of Prices and Productivity, Vancouver, BC, Canada, October 15. [Google Scholar]
  2. Aizcorbe, Ana, Carol Corrado, and Mark Doms. 2000. Constructing Price and Quantity Indexes for High Technology Goods. Washington, DC: NBER/CRIW Summer Institute, Industrial Output Section, Division of Research and Statistics, Federal Reserve Board. [Google Scholar]
  3. Aten, Bettina. 2005. Report on Interarea Price Levels; Working Paper No. 2005–2011. Suitland: Bureau of Economic Analysis.
  4. Aten, Bettina. 2006. Interarea price levels: An experimental methodology. Monthly Labor Review 129: 47–61. [Google Scholar]
  5. Aten, Bettina, Eric B. Figueroa, and Troy. M. Martin. 2014. Regional Price Parities for States and Metropolitan Ares, 2006–2010; Washington, DC: Survey of Current Business, Bureau of Economic Analisis.
  6. Barcaroli, Giulio, and Monica Scannapieco. 2019. Integration of ICT survey data and Internet data from enterprises websites at the Italian National Institute of Statistics. Statistical Journal of the IAOS 354: 643–56. [Google Scholar] [CrossRef]
  7. Benedetti, Ilaria, Tiziana Laureti, Luigi Palumbo, and Brandon Rose. 2021. US consumer prices data 2017-18 for sub-national CPI-U calculations using TiPRD model and R implementation. Mendeley Data. [Google Scholar] [CrossRef]
  8. Biggeri, Luigi, Tiziana Laureti, and Federico Polidoro. 2017. Computing sub-national PPPs with CPI data: An empirical analysis on Italian data using country product dummy models. Social Indicators Research 131: 93–121. [Google Scholar] [CrossRef]
  9. Breton, Robert, Tanya Flower, Matthew Mayhew, Elizabeth Metcalfe, Natasha Milliken, Christopher Payne, Thomas Smith, Joe Winton, and Ainslie Woods. 2016. Research Indices Using Web Scraped Data: May 2016 Update; Newport: Office for National Statistics.
  10. Bricongne, Jean-Charles, Baptiste Meunier, and Pouget Sylvain. 2021. Web Scraping Housing Prices in Real-time: The COVID-19 Crisis in the UK. Working Paper, Banque de France. Available online: https://entreprises.banque-france.fr/sites/default/files/medias/documents/wp827_0.pdf (accessed on 1 December 2021).
  11. Brunner, Karola. 2014. Automated Price Collection via the Internet; Wiesbaden: DESTATIS. Available online: https://www.destatis.de/EN/Methods/WISTAScientificJournal/Downloads/automated-price-collection-brunner-042014.pdf?__blob=publicationFile (accessed on 15 December 2021).
  12. Cavallo, Alberto. 2017. Are Online and Offline Prices Similar? Evidence from Multi-Channel Retailers. American Economic Review 107: 283–303. [Google Scholar] [CrossRef] [Green Version]
  13. Cavallo, Alberto, and Roberto Rigobon. 2016. The Billion Prices Project: Using Online Prices for Measurement and Research. Journal of Economic Perspectives 30: 151–78. [Google Scholar] [CrossRef] [Green Version]
  14. Cavallo, Alberto, W. Erwin Diewert, Robert C. Feenstra, Robert Inklaar, and Marcel P. Timmer. 2018. Using online prices for measuring real consumption across countries. AEA Papers and Proceedings 108: 483–87. [Google Scholar] [CrossRef] [Green Version]
  15. Chow, Gregory C. 1960. Tests of equality between sets of coefficients in two linear regressions. Econometrica: Journal of the Econometric Society 28: 591–605. [Google Scholar] [CrossRef]
  16. Clements, Kenneth W., and Haji Yaakob Izan. 1987. The Measurement of Inflation: A Stochastic Approach. Journal of Business and Economic Statistics 5: 339–50. [Google Scholar]
  17. Clements, Kenneth W., Izan HY Izan, and E. Antony Selvanathan. 2006. Stochastic Index Numbers: A Review. International Statistical Review 74: 235–70. [Google Scholar] [CrossRef]
  18. Costa, Alex, Jaume Garcia, Josep Lluís Raymond, and Daniel Sanchez-Serra. 2019. Subnational Purchasing Power of Parity in OECD Countries: Estimates Based on the Balassa-Samuelson Hypothesis. Paris: OECD. [Google Scholar]
  19. de Haan, Jan. 2015. A Framework for Large Scale Use of Scanner Data in the Dutch CPI. Paper presented at the 14th Ottawa Group Meeting, Tokyo, Japan, May 20–22. [Google Scholar]
  20. de Haan, Jan, and RensHendriks. 2013. Online Data, Fixed Effects and the Construction of High-Frequency Price Indexes. Sidney: Economic Measurement Group Workshop, pp. 28–29. Available online: https://www.business.unsw.edu.au/research-site/centreforappliedeconomicresearch-site/Documents/Jan-de-Haan-Online-Price-Indexes.pdf (accessed on 15 December 2021).
  21. de Haan, Jan, and Frances Krsinich. 2014. Scanner Data and the Treatment of Quality Change in Nonrevisable Price Indexes. Journal of Business and Economic Statistics 32: 341–58. [Google Scholar] [CrossRef]
  22. de Haan, Jan, Ren Hendriks, and Michael Scholz. 2021. Price Measurement Using Scanner Data: Time-Product Dummy Versus Time Dummy Hedonic Indexes. Review of Income and Wealth 67: 394–417. [Google Scholar] [CrossRef]
  23. Diewert. 2010. On the Stochastic Approach to Index Numbers. In Price and Productivity Measurement. Bloomington: Trafford Press, pp. 235–62. [Google Scholar]
  24. Dumbacher, Brian, and Cavan Capps. 2016. Big data methods for scraping government tax revenue from the web. Paper presented at the Joint Statistical Meetings, Section on Statistical Learning and Data Science, Chicago, IL, USA, July 30–June 4. [Google Scholar]
  25. Eurostat. 2020. Practical Guidelines on Web Scraping for the HICP. EUROPEAN COMMISSION EUROSTAT. Directorate C: Macro-Economic Statistics. Unit C-4: Price Statistics. Purchasing Power Parities. Housing Statistics. European Commission. Available online: https://ec.europa.eu/eurostat/documents/272892/12032198/Guidelines-web-scraping-HICP-11-2020.pdf/ (accessed on 1 December 2021).
  26. Eurostat. 2021. Internet Purchases by Individuals [Data Base]. Available online: https://ec.europa.eu/eurostat/web/digital-economy-and-society/data/database (accessed on 1 December 2021).
  27. EUROSTAT OECD. 2012. Eurostat-OECD Methodological Manual on Purchasing Power Parities; Luxembourg: Publications Office of the European Union, ISBN 978-92-79-25983-8. ISSN 1977-0375. [CrossRef]
  28. Harchaoui, Tarek M., and Robert V. Janssen. 2018. How can big data enhance the timeliness of official statistics? The case of the US consumer price index. International Journal of Forecasting 34: 225–34. [Google Scholar] [CrossRef]
  29. Hill, Robert. J. 2004. Constructing price indexes across space and time: The case of the European Union. American Economic Review 94: 1379–410. [Google Scholar] [CrossRef] [Green Version]
  30. Hill, Robert. J., and Iqbal A. Syed. 2015. Improving International Comparisons of Prices at Basic Heading Level: An Application to the Asia-Pacific Region. Review of Income and Wealth 61: 515–39. [Google Scholar] [CrossRef]
  31. Hill, Robert J., and Marcel P. Timmer. 2006. Standard errors as weights in multilateral price indexes. Journal of Business & Economic Statistics 24: 366–77. [Google Scholar]
  32. International Comparison Program—ICP. 2021. A Guide to the Compilation of Subnational Purchasing Power Parities (PPPs). Washington, DC: World Bank Group, Available online: https://thedocs.worldbank.org/en/doc/6448cdb85ae0f46ae2b37beb59f7602f-0050022021/original/2-03-RA-Item-07-DRAFT-Subnational-PPP-guide-Biggeri-and-Rao.pdf (accessed on 15 December 2021).
  33. Jaworski, Krystian. 2021. Measuring food inflation during the COVID-19 pandemic in real time using online data: A case study of Poland. British Food Journal 123: 160–80. [Google Scholar] [CrossRef]
  34. Juszczak, Adam. 2021. The use of web-scraped data to analyze the dynamics of footwear prices. Journal of Economics and Management 43: 251–69. [Google Scholar] [CrossRef]
  35. Kokoski, Mary. 1991. New research on interarea consumer price differences. Monthly Labor Review 114: 31. [Google Scholar]
  36. Kokoski, Mary, Brent Moulton, and Kimberly Zieschang. 1999. Interarea price comparisons for heterogenous goods and several levels of commodity aggregation. In International and Interarea Comparisons of Income, Output and Prices. Edited by Alan Heston and Robert E. Lipsey. Chicago: University of Chicago Press, pp. 123–66. [Google Scholar]
  37. Konny, Crystal, Brendan Williams, and David Friedman. 2019. Big Data in the US Consumer Price Index: Experiences and Plans. In Big Data for 21st Century Economic Statistics. Chicago: University of Chicago Press. [Google Scholar]
  38. Laureti, Tiziana, and Federico Polidoro. 2022. Using scanner data for computing consumer spatial price indexes at regional level: An empirical application for grocery products in Italy. Journal of Official Statistics. in press. [Google Scholar] [CrossRef]
  39. Laureti, Tiziana, and D. S. Prasada Rao. 2018. Measuring spatial price level differences within a country: Current status and future developments. Studies of Applied Economics 36: 119–48. [Google Scholar] [CrossRef]
  40. Macias, Paweł, and Damien Stelmasiak. 2019. Food Inflation Nowcasting with Web Scraped Data. NBP Working Paper. Warsaw: Narodowy Bank Polski, Education & Publishing Department, p. 302. [Google Scholar]
  41. Majumder, Amita, and Ranjan Ray. 2020. National and subnational purchasing power parity: A review. Decision 47: 103–24. [Google Scholar] [CrossRef]
  42. Mehrhoff, Jens. 2019. Introduction–The Value Chain of Scanner and Web Scraped Data. Economie et Statistique 509: 5–11. [Google Scholar] [CrossRef] [Green Version]
  43. Montero, Jose Maria, Tiziana Laureti, Roman Mínguez, and Gema Fernández-Avilés. 2020. A stochastic model with penalized coefficients for spatial price comparisons: An application to regional price indexes in Italy. Review of Income and Wealth 66: 512–33. [Google Scholar] [CrossRef]
  44. Nygaard, Ragnhild. 2015. The Use of Online Prices in the Norwegian Consumer Price Index; Oslo: Statistics Norway.
  45. Oancea, Bogdan, and Marian Necula. 2019. Web scraping techniques for price statistics—The Romanian experience. Statistical Journal of the IAOS 35: 657–67. [Google Scholar] [CrossRef]
  46. OECD. 2020. E-Commerce in the Time of COVID-19, Tackling Coronavirus (COVID-19) Contributing to a Global Effort. Paris, October, Available online: https://www.oecd.org/coronavirus/policy-responses/e-commerce-in-the-time-of-covid-19-3a2b78e8/ (accessed on 15 December 2021).
  47. OECD, The World Bank, The United Nations Economic Commission for Europe, and Statistical Office of the European Communities and Luxembourg. 2004. Consumer Price Index Manual: Theory and Practice. An Electronic Updated Version of the Manual Can Be Found at the Web Site of ILO. Geneva: International Labour Organization. [Google Scholar]
  48. Polidoro, Federico, Riccardo Giannini, Rosanna Lo Conte, Stefano Mosca, and Francesca Rossetti. 2015. Web Scraping Techniques to Collect Data on Consumer Electronics and Airfares for Italian HICP Compilation. Statistical Journal of the IAOS 31: 165–76. [Google Scholar] [CrossRef] [Green Version]
  49. Rao, D. S. Prasada, and Gholamreza Hajargasht. 2016. Stochastic Approach to Computation of Purchasing Power Parities in the International Comparison Program (ICP). Journal of Econometrics 191: 414–25. [Google Scholar] [CrossRef] [Green Version]
  50. Rokicki, Bartlomiej, and Geoffrey J. D. Hewings. 2019. Regional price deflators in Poland: Evidence from NUTS-2 and NUTS-3 regions. Spatial Economic Analysis 14: 88–105. [Google Scholar] [CrossRef]
  51. Selvanathan, E. Anthony. 1989. A Note on the Stochastic Approach to Index Numbers. Journal of Business and Economic Statistics 7: 471–74. [Google Scholar]
  52. Selvanathan, E. Anthony, and D. S. Prasada Rao. 1994. Index Numbers: A Stochastic Approach. London: Macmillan. [Google Scholar]
  53. Sharma, Anupam, and Deepika Jhamb. 2020. Changing Consumer Behaviours Towards Online Shopping-An Impact Of COVID 19. Academy of Marketing Studies Journal 24: 1–10. [Google Scholar]
  54. Sherwood, Mark K. 1975. Family budgets and geographic differences in price levels. Monthly Labor Review 98: 8–15. [Google Scholar]
  55. Souza, Thaís Góes de, Fernanda D. R. Fonseca, Vivian de Oliveira Fernandes, and Julio C. Pedrassoli. 2021. Exploratory Spatial Analysis of Housing Prices Obtained from Web Scraping Technique. The International Archives of Photogrammetry, Remote Sensing and Spatial Information Sciences 43: 135–40. [Google Scholar] [CrossRef]
  56. Statistics Canada. 2019. Web Scraping. Available online: https://www.statcan.gc.ca/eng/our-data/where/web-scraping (accessed on 1 December 2021).
  57. Summers, Robert. 1973. International price comparisons based upon incomplete data. Review Income Wealth 19: 1–16. [Google Scholar] [CrossRef]
  58. ten Bosch, Olav, Dick Windmeijer, Arnout van Delden, and Guido van den Heuvel. 2018. Web scraping meets survey design: Combining forces. Paper presented at the Big Data Meets Survey Science Conference, Bigsurv18 Conference, Barcelona, Spain, October 25–27. [Google Scholar]
  59. ten Bosch, Olav, and Dick Windmeijer. 2014. On the Use of Internet Robots for Official Statistics. Paper presented at the Meeting on the Management of Statistical Information Systems (MSIS 2014), Dublin, Ireland and Manila, Philippines, April 14–16. [Google Scholar]
  60. UNCTAD. 2020. COVID-19 and E-Commerce, Finding from a Survey of Online Consumers in 9 Countries; Geneva: United Nation Conference on trade and Development, UNCTAD. Available online: https://unctad.org/system/files/official-document/dtlstictinf2020d1_en.pdf (accessed on 1 December 2021).
  61. Varma, Manishkumar, Vinay Kumar, B. V. Sangvikar, and Avinash Pawar. 2020. İmpact of social media, security risks and reputation of e-retailer on consumer buying intentions through trust in online buying: A structural equation modeling approach. Journal of Critical Reviews 7: 119–27. [Google Scholar]
  62. Virgillito, Antonino, and Federico Polidoro. 2019. Big Data Techniques for Supporting Official Statistics: The Use of Web Scraping for Collecting Price Data. In Web Services: Concepts, Methodologies, Tools, and Applications. Pennsylvania: IGI Global, pp. 728–44. [Google Scholar]
  63. World Bank. 2013. Measuring the Real Size of the World Economy: The Framework, Methodology, and Results of the International Comparison Program—ICP. Washington, DC: World Bank. [Google Scholar] [CrossRef]
  64. Young, Linda J., and Michael Jacobsen. 2021. Sample Design and Estimation When Using a Web-Scraped List Frame and Capture-Recapture Methods. Journal of Agricultural, Biological and Environmental Statistics, 1–19. [Google Scholar] [CrossRef]
Figure 1. Product prices distribution by city for the Apples ELI. Dots represent outliers.
Economies 10 00095 g001
Figure 2. Product prices distribution by month for the Apples ELI. Dots represent outliers.
Economies 10 00095 g002
Figure 3. Connection graph for each ELI.
Economies 10 00095 g003
Figure 4. Spatial price indexes for Apples ELIs—January 2017–May 2018.
Economies 10 00095 g004
Figure 5. Spatial price indexes for Bread ELIs—January 2017–May 2018.
Economies 10 00095 g005
Figure 6. Spatial price indexes for Coffee ELIs—January 2017–May 2018.
Economies 10 00095 g006
Figure 7. Spatial price indexes for Butter ELIs—January 2017–May 2018.
Economies 10 00095 g007
Figure 8. Spatial price indexes for Cigarettes ELIs—January 2017–May 2018.
Economies 10 00095 g008
Table 1. CPI-U ELIs Tracked.
ELICPI-U WeightN. of ObservationsN. of Unique ProductsMonthly Price (USD)
MinAvgMaxSt. Dev.
Apple0.073%61261690.392.3212.391.73
Bread0.200%17,7946510.893.879.591.47
Butter0.063%71391601.254.9414.091.96
Cigarettes0.529%23473420.6916.69117.5921.71
Coffee0.169%77,45028500.898.41140.694.52
Total1.034%110,8564172
Table 2. RPD estimates ( β j , Orlando city as reference, at fixed time 2017-08).
City (ref. Orlando)Coeff.p-Value
Boise0.1930.000
DC0.1580.000
Honolulu0.4230.000
Houston0.1970.000
LA0.1200.017
LV0.1950.000
Phoenix0.1840.000
Portland0.2220.000
Seattle0.1480.001
SF0.1610.003
AIC = −253.38BIC = 11.83R2 = 0.96
Log-lik = 198.69
Table 3. TPD estimates ( γ t , time 2017-08 as reference for Orlando as a fixed city).
Time (ref. 2017_08)Coeff. p-Value
2017-010.0860.029
2017-020.0910.020
2017-030.0320.413
2017-040.0420.304
2017-050.0500.219
2017-060.0310.463
2017-07−0.0220.619
2017-090.0310.435
2017-100.0820.039
2017-110.0960.015
2017-120.1180.003
2018-010.0590.137
2018-020.1100.005
2018-030.1080.008
2018-050.1160.007
AIC = −242.93BIC = −60.77R2 = 0.95
Log-lik = 243.47
Table 4. TiRPD estimates ( δ j t , Orlando as reference at time 2017-08, p-value in brackets).
Time
City2017-012017-022017-032017-042017-052017-062017-072017-082017-092017-102017-112017-12
Orlando0.1090.1310.0470.0560.0600.035−0.011Ref. 0.0510.0950.1180.135
(0.014)(0.003)(0.289)(0.224)(0.197)(0.471)(0.824)-(0.260)(0.035)(0.007)(0.003)
Boise−0.246−0.310−0.242−0.205−0.133−0.076−0.0070.204−0.055−0.141−0.196−0.236
(0.000)(0.000)(0.000)(0.005)(0.075)(0.313)(0.928)(0.000)(0.435)(0.044)(0.004)(0.001)
DC−0.136−0.155−0.179−0.279−0.140−0.100−0.0480.167−0.023−0.114−0.130−0.140
(0.025)(0.010)(0.003)(0.000)(0.026)(0.128)(0.478)(0.000)(0.698)(0.070)(0.033)(0.024)
Honolulu−0.107−0.148−0.077−0.057−0.065−0.0300.0270.400−0.063−0.144−0.153−0.150
(0.112)(0.031)(0.258)(0.409)(0.352)(0.676)(0.705)(0.000)(0.367)(0.040)(0.023)(0.027)
Houston−0.135−0.182−0.099−0.143−0.160−0.126−0.0430.188−0.091−0.166−0.213−0.235
(0.044)(0.006)(0.143)(0.037)0.021(0.067)(0.540(0.000)(0.148)(0.012)(0.001)(0.000)
LA−0.162−0.207−0.137−0.138−0.119−0.086−0.0170.110−0.060−0.146−0.121−0.146
(0.016)(0.002)(0.045)(0.044)0.081(0.222)(0.808)(0.000)(0.387)(0.030)(0.066)(0.026)
LV−0.182−0.264−0.146−0.085−0.118−0.064−0.0420.184−0.097−0.265−0.219−0.282
(0.007)(0.000)(0.030)(0.215)0.092(0.379)(0.576)(0.000)(0.164)(0.000)(0.001)(0.000)
Phoenix−0.174−0.256−0.145−0.108−0.122−0.072−0.0300.170−0.092−0.226−0.191−0.233
(0.008)(0.000)(0.029)(0.111)0.074(0.310)(0.678)(0.000)(0.168)(0.001)(0.004)(0.000)
Portland−0.271−0.284−0.211−0.250−0.199−0.141−0.0260.212−0.186−0.273−0.312−0.333
(0.000)(0.000)(0.001)(0.000)0.002(0.035)(0.695)(0.000)(0.003)(0.000)(0.000)(0.000)
Seattle−0.136−0.184−0.115−0.118−0.106−0.0640.0070.125−0.085−0.124−0.065−0.082
(0.025)(0.002)(0.060)(0.058)0.094(0.323)(0.911)(0.000)(0.176)(0.044)(0.277)(0.174)
SF−0.179−0.213−0.151−0.084−0.083−0.0330.0130.126−0.179−0.272−0.253−0.228
(0.010)(0.002)(0.028)(0.229)0.241(0.652)(0.868)(0.000)(0.009)(0.000)(0.000)(0.001)
AIC BIC R2 Log-likelihood
−3.329 −1.356 0.94 1971.92
Publisher’s Note: MDPI stays neutral with regard to jurisdictional claims in published maps and institutional affiliations.

