Impact of Khartoum Stock Exchange Market Performance on Economic Growth: An Autoregressive Distributed Lag ARDL Bounds Testing Model


1
Department of Administrative Sciences and Humanities, Jouf University, Qurayyat 77451, Saudi Arabia
2
Department of Finance & Investment, Tabuk University, Tabuk 47315, Saudi Arabia
*
Authors to whom correspondence should be addressed.
Economies 2020, 8(4), 86; https://0-doi-org.brum.beds.ac.uk/10.3390/economies8040086
Submission received: 7 August 2020
/
Revised: 6 October 2020
/
Accepted: 9 October 2020
/
Published: 19 October 2020
(This article belongs to the Special Issue Asset Pricing, Investment, and Trading Strategies)
Abstract
:This study examines the impact of the Khartoum Stock Exchange market performance on economic growth in Sudan from Q1 1995 to Q4 2018. The data were collected from the Central Bank of Sudan (CBS) and Khartoum Stock Exchange (KSE). The autoregressive distributed lag (ARDL) bounds test was applied to estimate the impact of the Khartoum Stock Exchange market performance on economic growth. The results show that the Khartoum Stock Exchange market performance has a limited impact on economic growth. The results of the ARDL test reveal that the speed of adjustment towards long-run equilibrium after a short-term shock, which confirms the stability of Sudanese economic system through stock market performance, equals 24% only. Although market capitalization has a positive and significant impact on economic growth in the long term, the turnover ratio and stocks traded value showed insignificant negative impacts on economic growth. We recommend that suitable investment policies should be developed by policy makers for the Sudanese economy to allow the Khartoum securities market to attract foreign investors and encourage local investors in order to improve the efficiency and effectiveness of the stock market, thus, leading to a boost in securities exchanges as well as economic growth.
JEL Classification:
C22; C57; G20; E441. Introduction
The stock exchange market plays a critical role as a financial intermediary in the economy by mobilizing saving units, subsequently handling them as deficit units which require capital to produce goods and services. Thus, the market contributes to economic growth by effectively allocating financial resources to mitigate the creditors’ risks and enhance profitability by increasing the efficiency of financial intermediaries. Several literature reviews have explained the impact of stock markets on economic growth, as developed by Goldsmith (1969), Levine (1991), and Levine and Zervos (1998). By contrast, other authors have argued that stock market development measures explained part of the variation in economic growth, including Osamwonyi and Kasimu (2013), Adjasi and Biekpe (2006), Nguyen and Bui (2019), Rezina et al. (2017), Bayar et al. (2014), and Abdalla (2011). On the other hand, Pan and Mishra (2018) found a negative impact in the long term.
The stock market provides an indispensable centerpiece for the growth of economic sectors such as industries, firms, and trade, ultimately fostering a reasonable degree of economic growth in the country. Therefore, local government authorities—represented by the central banks—and the international monetary system track and control stock market activities closely. There are numerous avenues by which the impact of the stock market is conveyed to the economy. These avenues include liquidity on the stock market, real market capitalization, the value traded, and stock exchange turnover on the market, among other factors.
The stock exchange market is expected to promote savings by providing financial instruments for individuals that may better meet their risk preferences and liquidity needs. The mobilization of better savings would increase the savings rate (Abdalla 2011). Moreover, economic growth is perhaps encouraging for stock market development (Osamwonyi and Kasimu 2013). The stock market gives investors an opportunity to raise capital at reasonable costs. A fully fledged stock exchange market decreases credit risk to investors by providing market—rather than bank-based financing and, thus, is able to positively influence economic growth, as a perfect securities market helps investors to escape asymmetric information. This encourages companies to make investment decisions, therefore improving the efficiency of resource allocation and thereby increasing economic growth (Mamun et al. 2018).
The Khartoum Stock Exchange was launched in 1994. In 1995, a secondary market was launched with 34 listed companies. The market capitalization increased in 1997 to 139 dollars compared to 31 million dollars in 1995. The Financial Investment Bank was established to support the market. In 1999, the parallel market system was launched; furthermore, the issuance of Sukuk investment funds began in this year. In 2001, government participation certificates (Shahama) began to be issued. In 2003, the Khartoum index was announced as KSE30. The market witnessed an increase in trading indicators, the trading volume increased to 1.21 billion dollars, and the Khartoum KSE30 index increased with a growth of over 97.3% and a market value of 470 billion dollars. In 2007, the market was part of the African Stock Exchanges Union; in 2008, the share deposit of all listed companies was completed. In 2012, the electronic trading platform was launched. The market joined the Federation of Deposit Centers in Africa and the Middle East in 2014. In 2015, the market had an active role in combating money laundering. It received several international and regional awards, including the Capital Finance International Magazine Award in 2017. In 2018, market capitalization increased by SDG 48 million and the general index of the market increased by 13,317.48 points (KSE 2018).
Sudan’s economy, particularly in recent years, has suffered from high inflation, fluctuations in exchange rates, supply shortages, and other economic problems. These problems, especially high inflation and fluctuations in exchange rates, negatively affect the Khartoum Stock market returns as much as stock prices (Omer and Ahmed 2020; Mohamed and Elmahgop 2020).
In addition, there is no clear consensus in the last studies in Sudan investigated the impact of Khartoum Stock Exchange Market performance as a financial development indicator on real economic growth. However, some studies examined the relation between financial development and economic growth in Sudan using bank credit as financial development indicator such as: Abdel-Gadir (2012) he demonstrated that a weak relationship between financial development and economic growth in Sudan (Sirag et al. 2018) their findings revealed that Foreign Direct Investment (FDI) leads to better economic performance through financial development;
As we know, Sudan is ones of sub-Sahara African countries there are some studied conducted in this geographic area such as Enisan and Olufisayo (2009), and Ngare et al. (2014). However, they did not include the Khartoum stock exchange market as a developing African country market, to demonstrate its role in economic growth.
2. Research Design
2.1. Problem
There is no clear consensus in previous studies on Sudan, which investigated the impact of the Khartoum stock exchange market performance as a financial development indicator on real economic growth.
2.2. Objectives
The main objective of this study is to fill the gap in Sudanese studies, because there is no clear consensus about the impact of the Khartoum stock exchange market on real economic growth as such as. Thus, we add new knowledge to African and worldwide studies by investigating the impact of the Khartoum stock exchange market performance on economic growth over 23 years (1995–2018). Because this period covers the age of this market from it establishment until the end of last government period, this period covers all Sudanese economic conditions witnessed by the Khartoum stock exchange market (KSEM) but we consider 2019 as the beginning of Sudan’s temporary government period and excluded it from our study.
2.3. Methodology
The data were collected from the Central Bank of Sudan (CBS 2019) and the Khartoum stock exchange market (KSE 2018) for the period Q1 1995 to Q4 2018. Following some literature, we employed an autoregressive distributed lag (ARDL) approach to estimate the long run and the short run coefficients.
We employed the quarterly time series data of real GDP growth rate (RGDP), the turnover ratio of stocks traded (TR), the stocks traded value as a percentage of GDP (STV), and the market capitalization as a percentage of GDP (MC) to measure the impact of the Khartoum stock exchange market performance on economic growth in Sudan. The autoregressive distributed lag (ARDL) bounds test was applied to estimate the impact of the Khartoum stock exchange market performance on economic growth. The suggested hypotheses of this study are as follows:
The Khartoum stock exchange market performance has a significant positive impact on economic growth;
- −
- Capitalization has a significant positive impact on economic growth;
- −
- Turnover ratio has a significant positive impact on economic growth;
- −
- Stocks traded value has a significant positive impact on economic growth.
The results show that the Khartoum stock exchange market performance has a limited impact on economic growth, his weak relationship between KSEM performance and real GDP is attributed usually to the prevailing situations of political instability, and prolonged civil wars (Sufi an Abdel-Gadir (2012)).
2.4. Organization
The paper proceeds as follows: Section 2 provides research design, Section 3 briefly reviews the literature on the growth–stock market nexus. Section 4 specifies the model and indicates the sources of data and setting up the econometric methodology use in the study. Section 5, contains the main findings of the study, their analyses and assessments. The Section 6 contains conclusions and policy implications, recommendation, and limitations.
2.5. The Significant of the Study
This study fills the gap because there is no clear consensus about the impact of Khartoum stock exchange market on real economic growth and as such, this study adds new knowledge to African and worldwide studies. The results of the ARDL test reveals the speed of adjustment towards the long-run equilibrium after a short-term shock, which confirms the stability of the Sudanese economic system through stock market performance, equaling 24%.
2.6. Implications
One of the most obvious implications of our results is that if Sudan is to realize its target growth rate, it needs to create a stable political and economic climate conducive to increase real sector investment through the Khartoum stock exchange market. In addition to policies designated to raise local investment awareness and encourage foreign direct investment in the Khartoum stock market and adopting modern technology in the Sudanese financial system are preconditions for Sudan’s economic success. Thus, economic policy makers, Khartoum stock exchange market management, technology supplier companies, as well as economic and finance researchers are going to benefit from reading this paper.
2.7. The Limitations of This Study
This study focuses on financial development using Khartoum stock exchange market (KSEM) performance proxies as supply side only, following the suggestion that the existence of units relate to deficit units, thereby promoting efficient allocation of resources and thus leading other economic sectors in the growth process. Therefore, further studies should examine the bidirectional relationship between financial development, stock exchange market performance and economic growth in Sudan and other African countries.
3. Literature Review
The literature review conducted in the present study was crucial and allowed for the definition of the following model variables by which the impact of the stock market was measured: market capitalization, turnover ratio, and total value of stocks traded. The literature review differed in terms of the analysis methods used from other works. Some studies have found that the impact of the stock market was on economic growth, and some found otherwise. The most significant study was carried out by Goldsmith (1969). Therefore, the stock market could provide an effective investment channel for investors and increase long-term capital sources for companies, additionally boosting economic growth.
Firstly, this study is based on the Modigliani hypothesis, which refers to the increase in securities prices that lead to increases in individuals’ possession of wealth to a high permanent income level. Therefore, the consumption level increases, leading to increased investment, and the resulting increase in the investment multiplier, in turn, results in increased economic growth (Modigliani 1971).
Secondly, the literature review covered the following topics.
In the study by Osaseri and Osamwonyi (2019), the authors used quarterly data for the period 1994–2015. Moreover, they used the panel least squares approach based on a fixed estimation model. Their work showed that stock market development has a significant impact on economic growth. In addition, a positive correlation exists between stock market development indicators and BRICS’s economic growth.
Nyasha and Odhiambo (2019) used the autoregressive distributed lag approach to examine the period 1980–2012. They found that market-based financial developments have a positive effect on economic growth in the United States in both the long and the short term.
Tekin (2019) employed a Toda–Yamamoto Granger causality test to estimate quarterly data for the period 1998–2017. The results showed one-way causality from the stock market to economic growth in the USA, BRICS countries, and Turkey. However, the results for Germany indicated a two-way relationship.
Nguyen and Bui (2019) employed the ARDL approach estimation technique for the analysis of data. They revealed that economic growth was more strongly correlated with stock market efficiency than foreign investors’ net trading interest.
Mamun et al. (2018) employed the ARDL bounds testing approach to obtain estimations for the period 1993–2016. The study found a direct impact of the stock market on economic growth both in the short and long term along with the spread of interest rates, financial support, and real effective exchange rate.
Pan and Mishra (2018) used annual data over the period 2007–2012 and employed the ARDL bounds testing approach. They found no relationship between the stock market and the real economy in the short term. In addition, there was a negative relationship between the Shanghai A share stock market and the real sector in the long term.
Sirag et al. (2018) they have used fully modified ordinary least squares and the dynamic ordinary least squares techniques to estimate the long-run model, and analyzed annual data from 1970 to 2014. They have demonstrated that financial development and FDI are positive and significant in explaining economic growth in Sudan. Moreover, their findings revealed that FDI leads to better economic performance through financial development; they have use banks’ credit to the private sector as financial development proxy.
Rezina et al. (2017) employed the Granger causality test for estimations for the period 1994–2015. Their results showed that there is a long-term relationship between economic growth and the factors of stock market and that there is unidirectional causality from the factors of stock market capitalization, the total value of stocks traded, and the turnover ratio of stocks traded to economic growth.
Dimic et al. (2015) investigated how determinants of the political risk factor affect the stock returns of developed, emerging and frontier markets. They found that political risk influences the stock return of developed, emerging and frontier markets, which is different according to the market category. However, government stability is a unique source of political risk in frontier markets.
Bayar et al. (2014) employed the Granger causality test for the period 1999–2013. The results showed that the factors of stock market capitalization, total value of stocks traded, and turnover ratio of stocks traded had significant influences on economic growth in the long and short term.
Rajabi and Muhammad (2014) employed the dynamic panel pooled mean-group technique. They found that the stock market showed a significant effect on economic growth. Furthermore, the turnover ratio had a positive effect on economic growth.
Ngare et al. (2014) used annual data over the period 1980–2010 and employed the panel data econometrics technique. They found countries have stock markets that grow faster than countries that without stock markets, they demonstrated that, stock market development have a positive effect on economic growth, moreover, countries that were politically stable and less corrupt tend to grow faster.
Ishioro (2013) applied the Granger non-causality estimation technique proposed by Toda and Yamamoto. He found that there was a causality between economic growth and real stock market volatility, market capitalization, and the value traded ratio.
Masoud (2013) used causality testing and demonstrated that the stock market has a positive relationship on economic growth in the short and long term.
Osamwonyi and Kasimu (2013) adopted the Granger causality test for the period 1989–2009. Their results showed that there was causality between stock market development and economic growth in Kenya, while no causality was found in Ghana and Nigeria; however, their causality test showed the presence of causality between stock market capitalizations and the number of listed securities and bidirectional causality between stock turnover ratio and economic growth. Additionally, the stock traded value had a strong negative impact on economic growth.
Abdel-Gadir (2012) over the period (1970–2007) by using the autoregressive distributed lag (ARDL) approach to co-integration. He used M3/GDP and he value of credit offers by the commercial banks to the private sector divided by GDP as financial development proxies in addition to inflation rate and government spending (GOV) as a percentage to GDP proxies as macroeconomic in stability indicators, his results demonstrated that a weak relationship between financial development and economic growth in Sudan.
Abdalla (2011) used the Granger causality test. He demonstrated that economic growth is sensitive to the stock market and that there is a bidirectional causal relationship between market capitalization and economic growth; on the other hand, there was a unidirectional causal relationship from economic growth to stock market liquidity.
Kaya et al. (2011) employed the Granger causality test to estimate quarterly data for the period 1988 to 2004. The study concluded that stock market development did not lead to economic growth.
Enisan and Olufisayo (2009) employed the autoregressive distributed lag bounds test. Their results showed that the stock market development was co integrated with economic growth in Egypt and South Africa. Moreover, this test suggests that stock market development has a significant positive long run impact on economic growth. The Granger causality test based on vector error correction model (VECM) further showed that stock market development Granger causes economic growth in Egypt and South Africa. However, Granger causality, in the context of Vector AutoRegressionVAR shows evidence of bidirectional relationship between stock market development and economic growth for Cote D’Ivoire, Kenya, Morocco and Zimbabwe. In Nigeria, there is a weak evidence of growth-led finance using market size as indicator of stock market development. Based on these results, the paper argued that stock markets could help promote growth in Africa. However, to achieve this goal, African stock markets need to be further developed through appropriate regulatory and macroeconomic policies.
Adjasi and Biekpe (2006) used the dynamic panel data model. Their results showed a positive impact between the stock market and economic growth. Additionally, a significantly positive impact of the stock market was found in upper and middle-income countries, while the stock markets of low-income countries were shown to require development.
4. Materials and Methods
4.1. Data Sources
The study employs the quarterly time series data of real GDP growth rate (RGDP), the turnover ratio of stocks traded (TR), the stocks traded value as a percentage of GDP (STV), and the market capitalization as a percentage of GDP (MC) to measure the impact of the Khartoum stock exchange market performance on economic growth in Sudan. The data were collected from the Central Bank of Sudan (CBS 2019) and the Khartoum stock exchange market (KSE 2018) for the period Q1 1995 to Q4 2018.
4.2. Model Specification
The study was based on the Modigliani hypothesis and previous models, allowing us to build the following model:
where RGDP is economic growth, MC is market capitalization as a percentage of GDP (the value of listed shares of real GDP (Mamun et al. 2018), STV is the stocks traded value as a percentage of GDP (the value of the trades of domestic shares of real GDP (Ishioro 2013)), and TR is turnover ratio of stocks traded (total value of stocks traded/market capitalization) (Bayar et al. 2014).
4.3. Econometric Analysis Methods
4.3.1. Unit Root Test
The study employed Augmented Dickey–Fuller and Phillip–Perron stationary tests to examine the stationarity of the series. The results for the series are listed in Table 1 and Table 2.
The stationary test results show that RGDP, MC, TR and STV variables are stationary at the first level of difference. According to the ADF results in Table 1, the null hypothesis of non-stationary is rejected for all the variables at the 1%, 5%, 10% significance levels. The stability of the variables at the first level of difference enables the use of the ARDL bounds test.
The stationary test results show that RGDP, MC, TR and STV variables are stationary at the first level of difference. According to PP results in Table 2, the null hypothesis of non-stationarity is rejected for all the variables at 1%, 5%, and 10% significance levels. The stability of the variables at the first level of difference enables the use of the ARDL bounds test.
4.3.2. ARDL Bounds Test
The study employs the autoregressive distributed lag (ARDL) approach; it introduced originally by Pesaran (1997) and redeveloped ARDL bounds testing approach by Pesaran et al. (1999, 2001). The ARDL approach is distinguished from other co-integration approaches such as Engle and Granger (1987), Johansen and Juselius (1990), and Johansen (1992, 1995), it can be used if the variables are integrated of order one [I(1)], order zero [I(0)], or a combination of both. In addition, not assumed is an equal lag length in the model (Duasa 2007). Moreover, the ARDL approach provides unbiased estimates and statistically significant t-statistics in the long term even when some of the regressors are endogenous (Odhiambo 2011). It is suitable for small samples size ranging over 30 observations. The ARDL approach is applied as follows: test unit roots and ensure that the all variables are integrated of order one [I(1)], order zero [I(0)], or a combination of both, then the long and short term models are estimated by way of cointegration Wald test. The decision is that if the computed Ward test F-statistic is the upper bound critical value, therefore, we can reject the null hypothesis of cointegration. If the computed Ward test F-statistics is less than the lower bound critical value, this means that we don’t reject the null hypothesis of cointegration. Furthermore, the decision is inconclusive if the computed Wald test F-statistics value falls within the lower and upper bound critical values.
Finally, the diagnostic and stability analysis (Menegaki 2019). Therefore, the ARDL approach is very suitable to our study. It has been widely used in empirical studies in recent years.
An autoregressive distributed lag (ARDL) bounds test is specified as follows
4.3.3. ECM Model
After confirmation of the long term association, the error correction model (ECM) is applied to estimate short term relationships among underlying variables. The sign of ECT must be negative and statistically significant, with a coefficient (η) ranging between zero and one, which represents the speed of adjustment towards long-run equilibrium after a short-term shock that confirms the stability of the system. We estimate the following equation:
Bounds testing for co-integration analysis:
The Table 3 provides test results demonstrating that all variables have long-term relationships (an F-statistic above the critical upper bound value at the 1% significance level indicates that there is a long-term co-integration relationship among the RGDP and its independent variables).
4.3.4. Diagnostic Check for Serial Correlation
Table 4 indicates that the Breusch–Godfrey serial correlation LM test shows no problem with serial correlation, because the p-value is greater than 0.05.
5. Results
5.1. Estimation of Long-Term Coefficients
The long-term results in Table 5 allow and Figure A1 allow us to create the estimated long-term model shown above. The MC coefficient has statistical significance at the 0.01 level; in the long term, a 1% increase in MC would increase economic growth by 1.16%. The result shows that market capitalization has a positive impact on economic growth in Sudan, supporting the previous findings by Osaseri and Osamwonyi (2019), Mamun et al. (2018), Bayar et al. (2014), Abdalla (2011), Ishioro (2013), Ngare et al. (2014) and Enisan and Olufisayo (2009). The Enisan and Olufisayo (2009) study supports our study in the relationship between stock market and growth, as in the case of Nigeria. STV is statistically significant at the 10% level, but its impact on economic growth is negative. This result indicates that, in the long term, a 1% increase in STV would reduce economic growth by 4.52%. This result supports the previous findings by Pan and Mishra (2018) and Osamwonyi and Kasimu (2013) and is in contrast with those made by Osaseri and Osamwonyi (2019), Rezina et al. (2017) and Ishioro (2013). TR doesn’t affect significantly on economic growth. This result go in contrast of Osaseri and Osamwonyi (2019), Pan and Mishra (2018), Osamwonyi and Kasimu (2013), and Ishioro (2013).
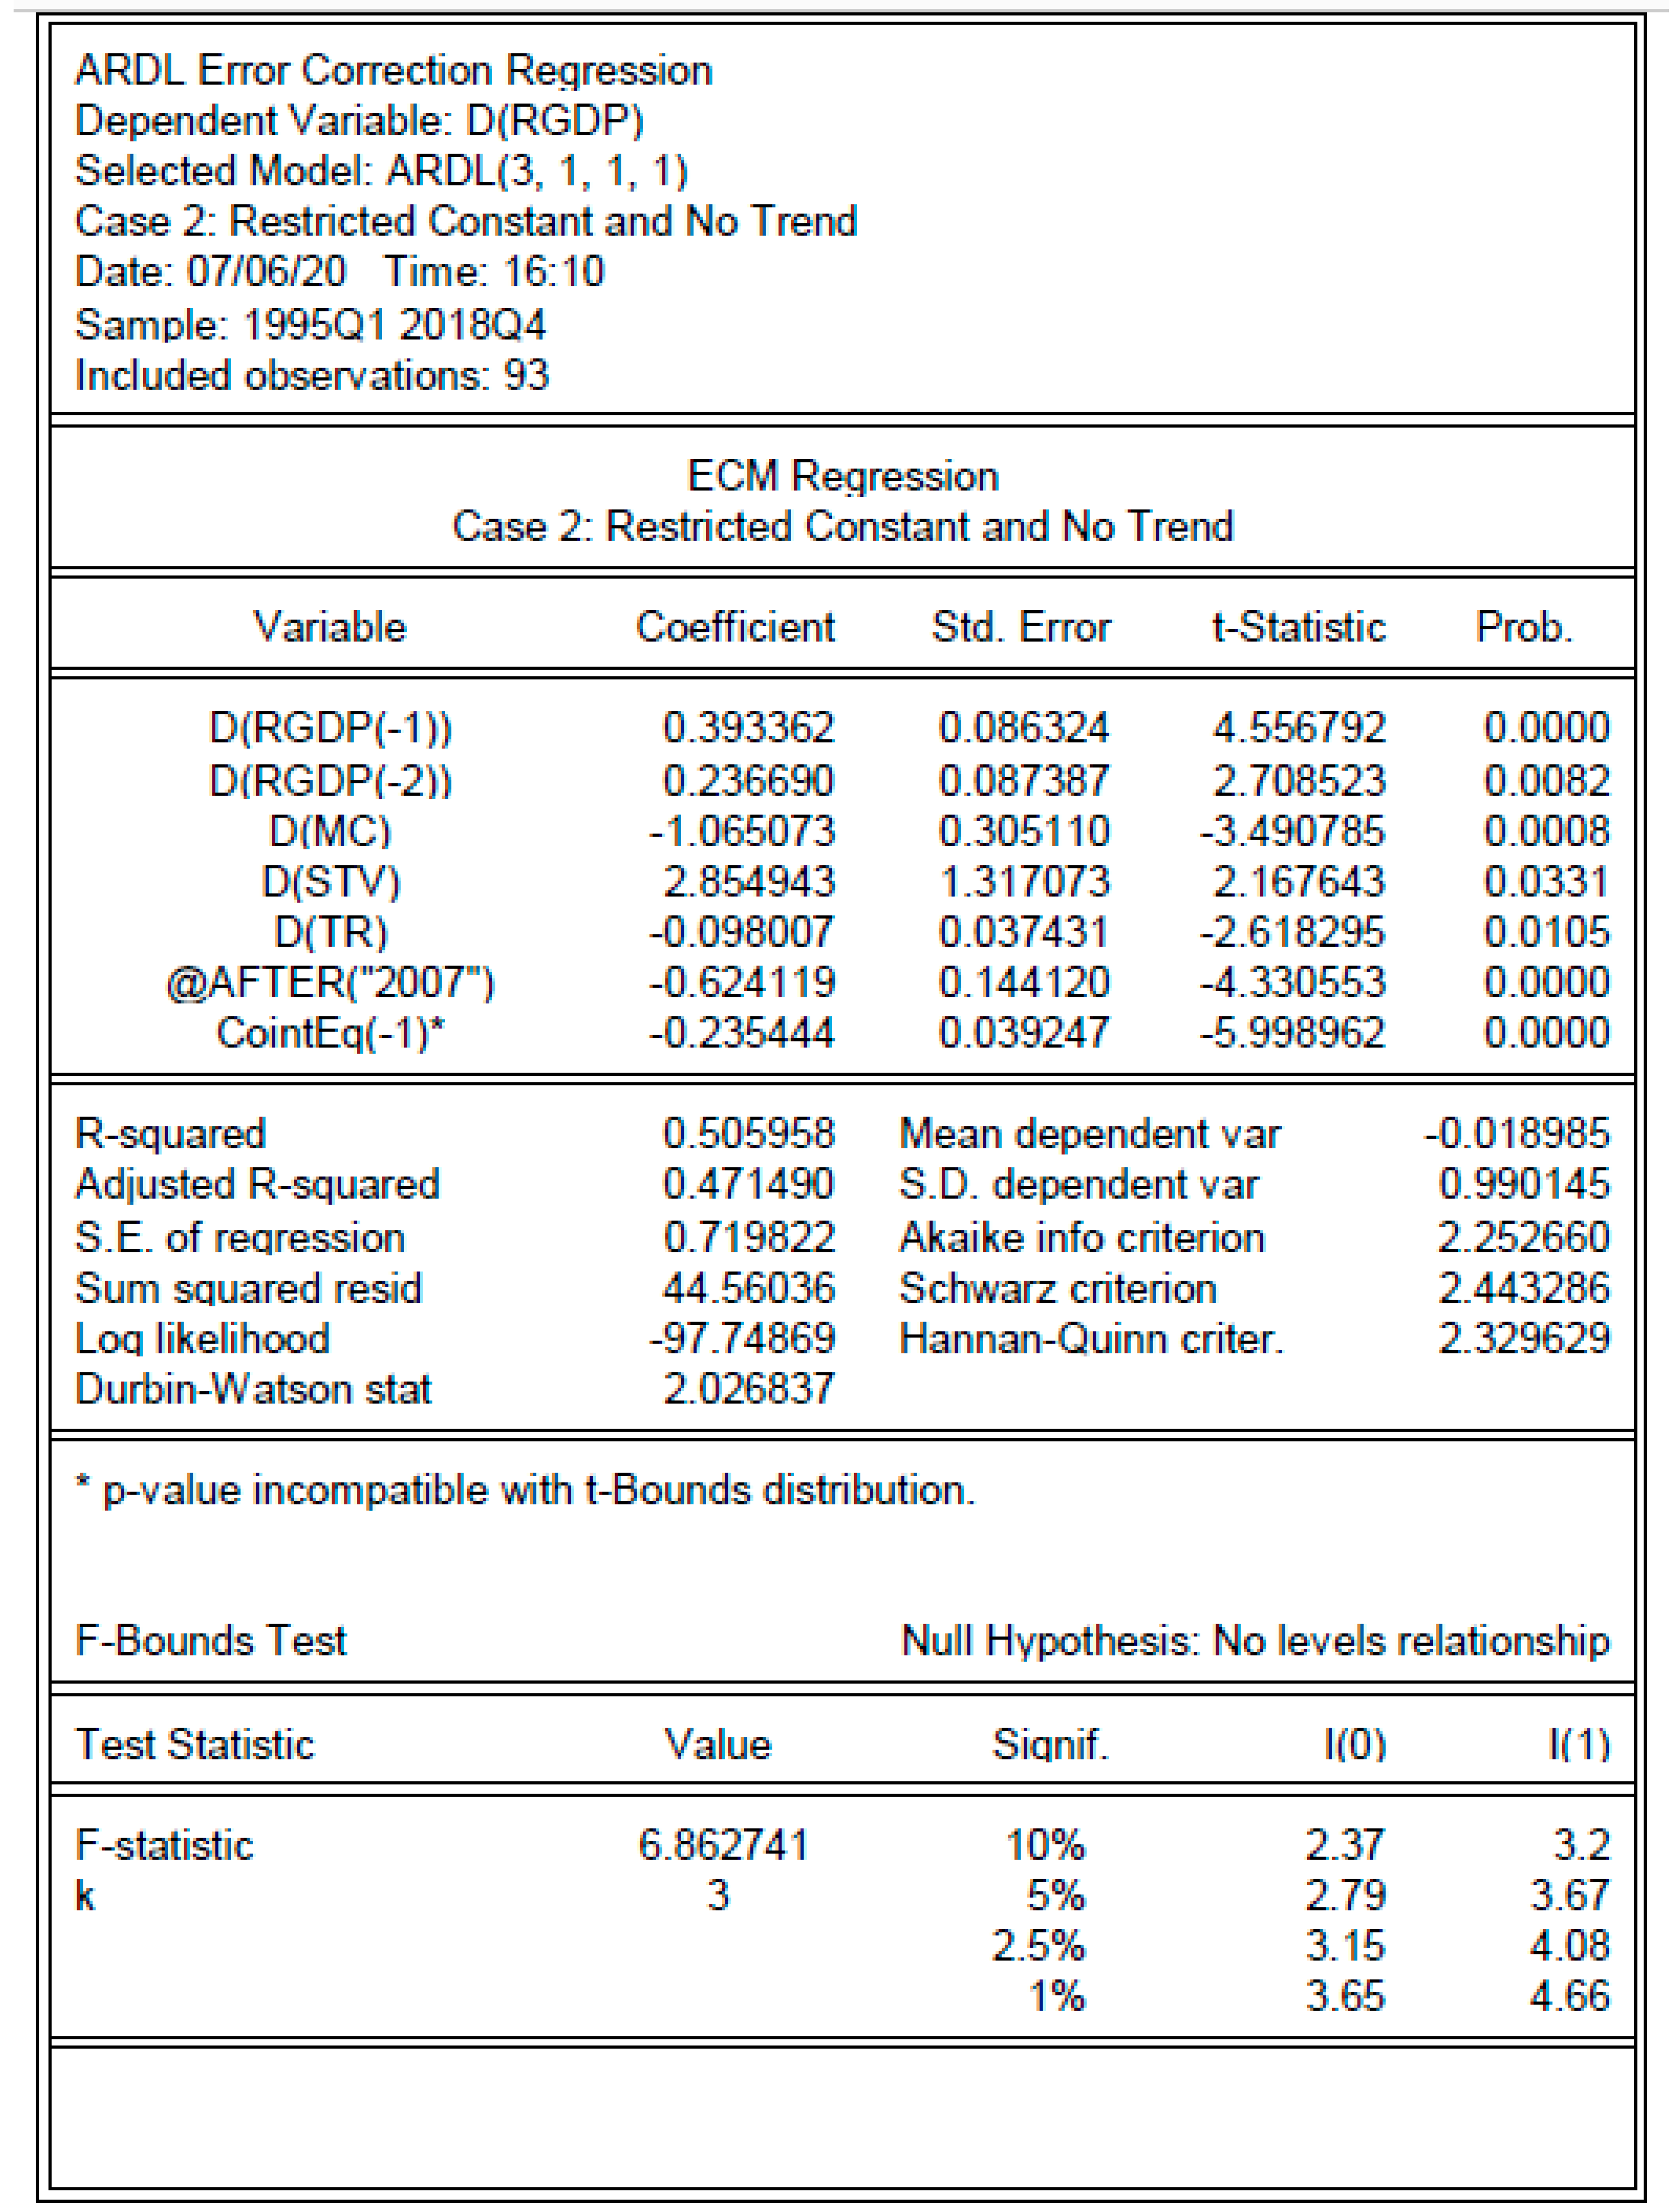
5.2. Short-Term Error Correction
The short-term results in Table 6 and Figure A2 indicate the value of the ECM (−1) coefficient was found to be negative and statistically significant, as expected. This indicates that a shock in the economy will be adjusted by 0.24 in the next year. This indicates that any shock in the Sudanese economy will be corrected in the next year by 24%, only through the stock exchange market. Thus, we can say that the stock exchange market can affect slightly the Sudanese economy. The short-term parameters are significantly different from the long-term results: MC has a negative impact on economic growth in Sudan and TR is statistically significant at the 0.05 level, but its impact on RGDP is negative, supporting the previous findings by Enisan and Olufisayo (2009). STV is statistically significant at the 0.05 level, and its impact on RGDP is positive. These results are in contrast to those of Sheilla Nyasha and Nicholas M Odhiambo, Nyasha and Odhiambo (2019) and Ngare et al. (2014), who demonstrated that market-based financial development has a positive impact on economic growth in the long and short term.
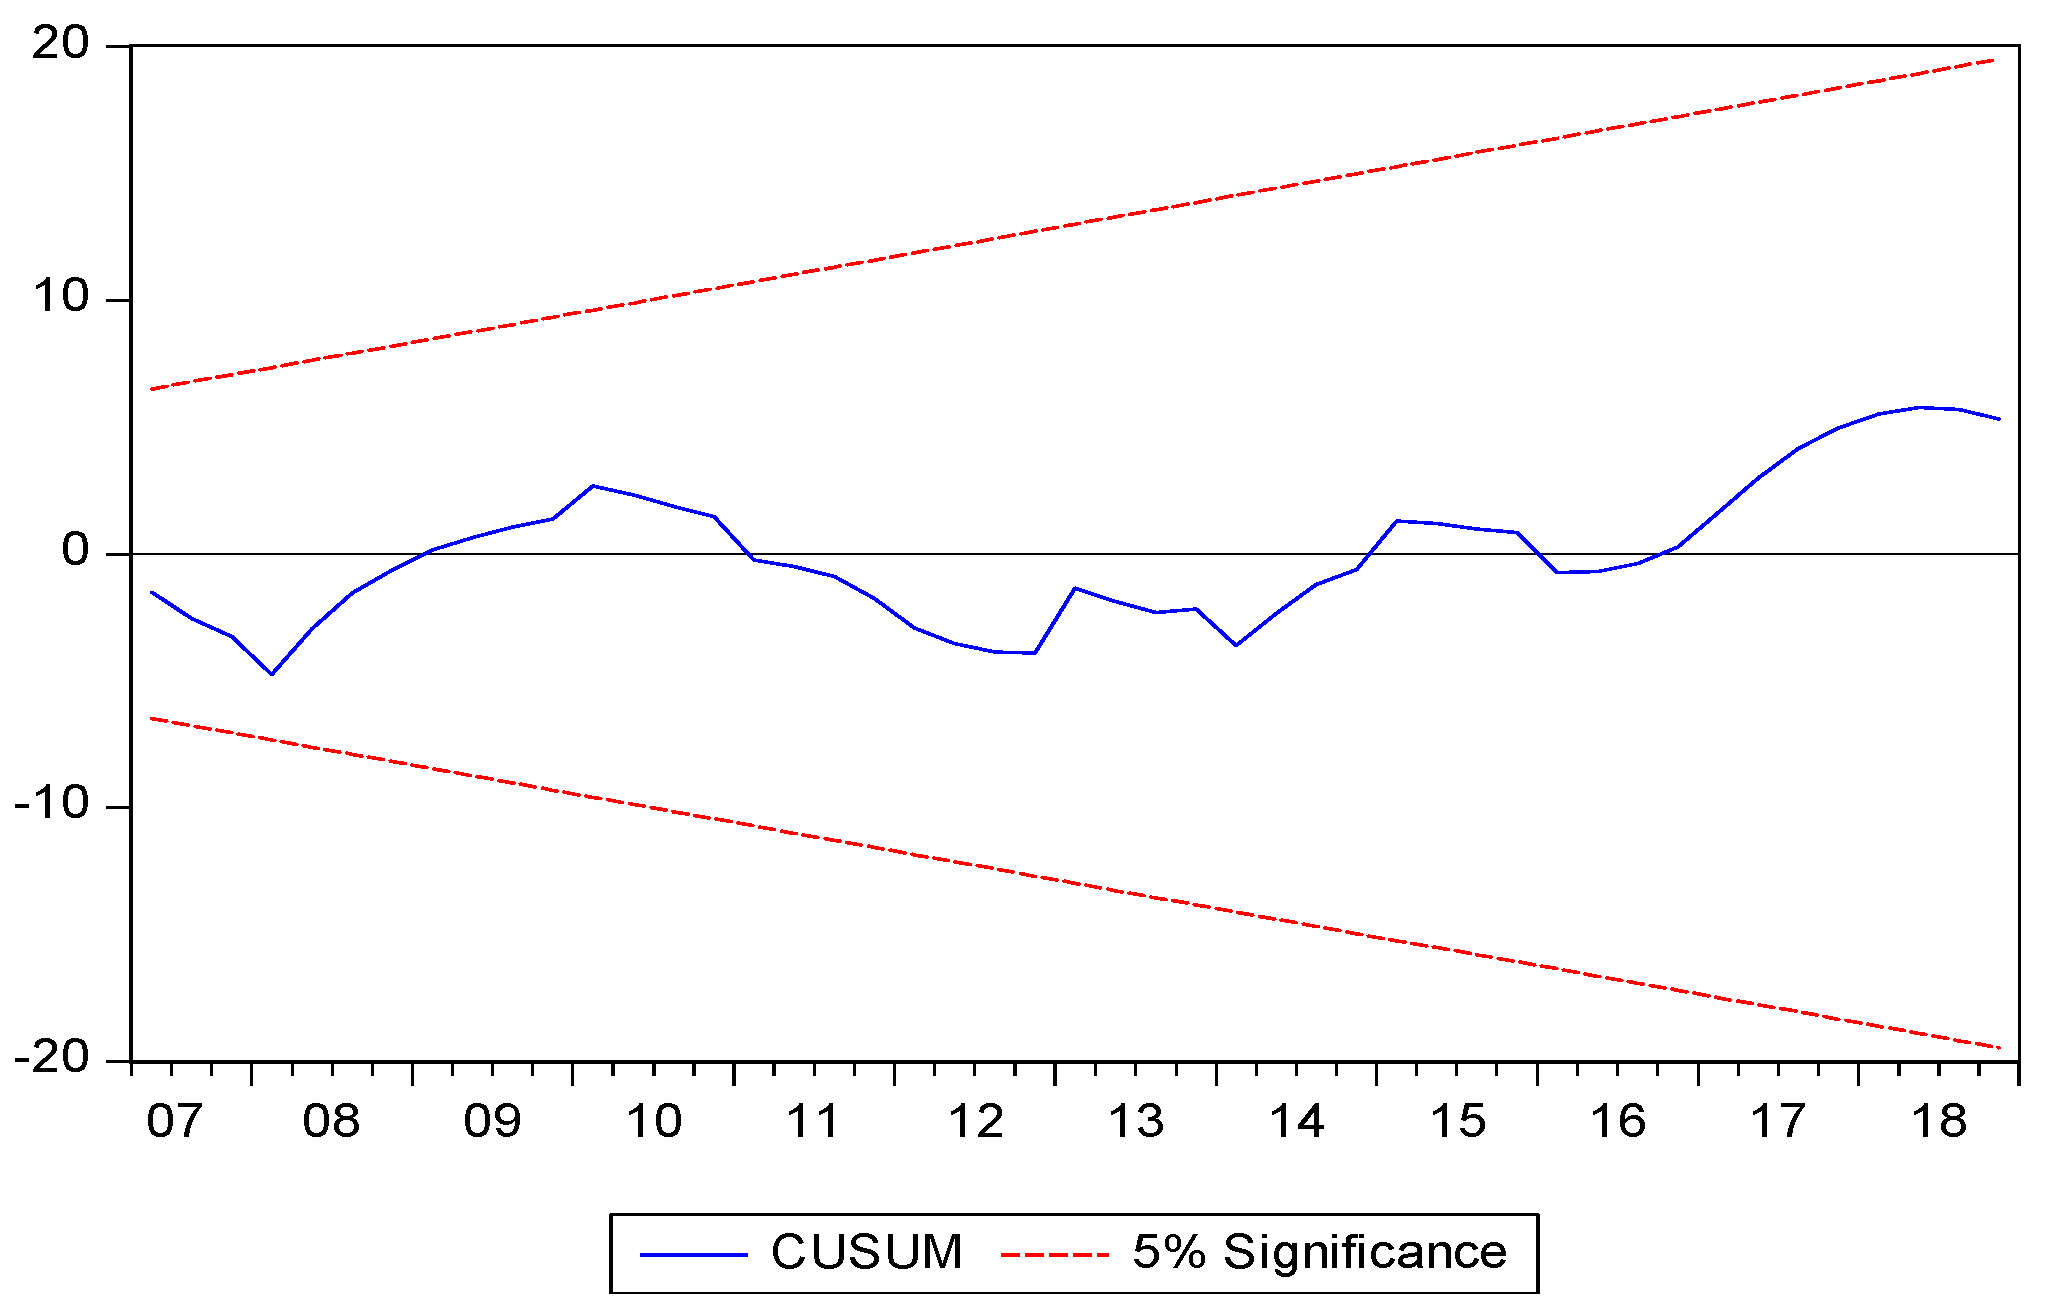
5.3. Stability Analysis
5.4. Diagnostic and Stability Analysis
Table 7 indicates that the LM test shows no problem in terms of serial correlation, since the p-value (0.77) is higher than 0.05. The results of the heteroskedasticity test indicate no issues since the p-value (0.45) is higher than 0.05. The Ramsey Regression Equation Specification Error testRESET test probability value (0.79) is higher than 0.05, which means the model is valid (i.e., it does not suffer from omitted variables).
6. Conlusions, Policy Implications, Recommendationand Limitations
6.1. Conclusions and Policy Implications
In this study, we examined the impact of the Khartoum stock exchange market performance on economic growth in Sudan; for this, the data for Q 1 1995 to Q4 2018 were used. The empirical results of the study and the stationary test results show that all variables are stationary at the first level of difference. The stability of the variables at the first level of difference enables the use of the ARDL bounds testing approach. Market capitalization (MC) measures the ability of the market to provide capital, and it was found to be has positive and statistically significant impact on economic growth in the long term, (coefficient = 1.160328, p value = 0.0104), see (Table 5). Therefore, this result indicates the ability of the market to mobilize capital. However, it has negative and significant impact on economic growth in short-term (coefficient = −1.065073, p = 0.0008), see (Table 6). The liquidity, represented by stock turnover ratio (TR), the result showed that it does not affect significantly on economic growth in the long term (coefficient = 0.072632, but, p value = 0.285) see Table 5. However, it affects negatively, and significantly on economic growth in the short-run (coefficient = −0.098, p value = 0.0105), see Table 6. This negative impact is observed through the investment efficiency of the stock exchange market, as well as the increasing in the transactions cost. Although the stocks traded value (STV) does not affect significantly on economic growth in the long-term, it affects positively and significantly on economic growth in the short-term.
The ECM (−1) coefficient was found to be negative and statistically significant, as expected. This indicates that a shock in the economy will be adjusted by 0.24 in the next year. This result indicates that any shock in the Sudanese economy will be corrected in the next year by 24% only through stock exchange market. Thus, we can say stock exchange market can affect slightly on the Sudan economy.
One of the most obvious implications of our results is that if Sudan is to realize its target growth rate it needs to create a stable political and economic climate conducive to increase in real sector investment through Khartoum stock exchange market. In addition to policies designated to raise local investment awareness and encourage foreign direct investment in the Khartoum stock market, and adopting modern technology in the Sudanese financial system, these are preconditions for Sudan’s economic success. Thus economic policy makers, Khartoum stock exchange market management, technology supplier companies, and economics and finance researchers are going to benefit from reading this paper.
6.2. Recommendations
This study recommends that suitable investment policies should be developed by policy makers for the Sudanese economy, allowing the Khartoum securities market to attract foreign investors and encourage local investors in order to improve the efficiency and effectiveness of the stock market, thus leading to securities exchanges as well as economic growth being boosted. Further studies should focus on the impact of bank credits and human capital on the model. In addition, we recommend further studies should examine the bidirectional relationship between financial development, stock exchange market performance and economic growth in Sudan and other African countries.
6.3. Limitations
The study was limited by a lack of financial and economic data for the recent years of 2019 and 2020. The study focuses on financial development using Khartoum stock exchange market (KSEM) performance proxies as supply side only, following the suggestion that the existence of units relates to the deficit units, thereby promoting efficient allocation of resources and thus leading other economic sectors in the growth process. Therefore, further investigation of (KSEM) as a financial development indicator in terms of demand side (to test how growth in the real sector of the economy can facilitate KSEM performance development) will complete our work.
Author Contributions
T.E. and B.B. prepared the study and were responsible for the design, development of the data analysis, and discussion results. All authors have read and agree to the published version of the manuscript.
Funding
This study does not receive any external funding.
Acknowledgments
Our completion of this project could not have been accomplished without the support of our husbands Ahmed Alsawy and Idriss Braima. Thank you for allowing us time away from you to research and write. You deserve a trip to the moon! Thanks to my parents as well, Gaber ElBasheer and Hamdow GadElkreem; you have our deepest gratitude, and your encouragement when times became difficult was much appreciated and duly noted. It was a great comfort and relief to know that you were willing to provide us with a good life. Finally, our deepest gratitude to our children; you helped us countless times when we could not look after you during our research and writing period.
Conflicts of Interest
There were no conflict of interest in the design of the study; in the collection, analyses, or interpretation of data; in the writing of the manuscript; or in the decision to publish the results.
Appendix A
Figure A1.
Estimation of long-term coefficients. Source: authors’ analysis using EViews 10, 2020.

Figure A2.
Short-term error correction result. Source: authors’ analysis using EViews 10, 2020.

References
- Abdalla, Suliman. 2011. Stock Market Development and Economic Growth in Sudan (1995–2009): Evidence from Granger Causality Test. Journal of Business Studies Quarterly 3: 93–105. [Google Scholar]
- Abdel-Gadir, Sufian Eltayeb. 2012. Financial Development and Economic Growth in Sudan: Empirical Assessment Based on an Application of the Autoregressive Distributed Lag (ARDL) Model. International Journal of Financial Management 2: 11–22. [Google Scholar]
- Adjasi, Charles K. D., and Nicholas B. Biekpe. 2006. Stock Market Development and Economic Growth: The Case of Selected African Countries. African Development Review 18: 144–61. [Google Scholar] [CrossRef]
- Bayar, Yilmaz, Abdulkadir Kaya, and Murat Yildirim. 2014. Effects of Stock Market Development on Economic Growth: Evidence from Turkey. International Journal of Financial Research 5: 93–100. [Google Scholar] [CrossRef] [Green Version]
- CBS (The Central Bank of Sudan). 2019. Available online: https://cbos.gov.sd/ar/periodicalspublications?field_publication_type_tid_i18n=46 (accessed on 21 June 2020).
- Dimic, Nebojsa, Vitaly Orlov, and Vanja Piljak. 2015. The Political Risk Factor in Emerging, Frontier, and Developed Stock Markets. Finance Research Letters 15: 239–45. [Google Scholar] [CrossRef]
- Duasa, Jarita. 2007. Determinants of Malaysian Trade Balance: An ARDL Bound Testing Approach. Global Economic Review 36: 89–102. [Google Scholar] [CrossRef]
- Engle, Robert F., and Clive W. J. Granger. 1987. Co-Integration and Error Correction: Representation, Estimation, and Testing. Econometrica 55: 251–76. [Google Scholar] [CrossRef]
- Enisan, Akinlo Anthony, and Akinlo O. Olufisayo. 2009. Stock Market Development and Economic Growth: Evidence from Seven Sub-Sahara African Countries. Journal of Economics and Business 61: 162–71. [Google Scholar] [CrossRef]
- Goldsmith, Raymond W. 1969. Financial Structure and Development. New Haven: Yale University Press. [Google Scholar]
- Ishioro, Bernhard O. 2013. Stock Market Development and Economic Growth: Evidence from Zimbabwe Developments in the Zimbabwe Stock Market. pp. 343–60. Available online: https://hrcak.srce.hr/112603 (accessed on 11 June 2020).
- Johansen, Soren, and Katarina Juselius. 1990. Maximum Likelihood Estimation and Inference on Cointegration—With Appucations to the Demand for Money. Oxford Bulletin of Economics and Statistics 52: 169–210. [Google Scholar] [CrossRef]
- Johansen, Søren. 1992. Cointegration in Partial Systems and the Efficiency of Single-Equation Analysis. Journal of Econometrics 52: 389–402. [Google Scholar] [CrossRef]
- Johansen, Søren. 1995. A Statistical Analysis of Cointegration for I(2) Variables. Econometric Theory 11: 25–59. [Google Scholar] [CrossRef]
- Kaya, Elif, Eralp Bektaş, and Mete Feridun. 2011. Stock Market and Banking Sector Development in Turkey: Do They Have the Same Impact on Economic Growth? Economic Research-Ekonomska Istraživanja 24: 65–74. [Google Scholar] [CrossRef] [Green Version]
- KSE. 2018. Anuual Repoet. Khartoum. Available online: http://www.kse.com.sd/ (accessed on 21 May 2020).
- Levine, Ross. 1991. Stock Markets, Growth, and Tax Policy. The Journal of Finance 46: 1445–65. [Google Scholar] [CrossRef]
- Levine, Ross, and Sara Zervos. 1998. Stock Markets, Banks, and Economic Growth. American Economic Review 88: 537–58. [Google Scholar] [CrossRef]
- Mamun, Abdullahil, Mohammad Hasmat Ali, Nazamul Hoque, Md Masrurul Mowla, and Shahanara Basher. 2018. The Causality between Stock Market Development and Economic Growth: Econometric Evidence from Bangladesh. International Journal of Economics and Finance 10: 212. [Google Scholar] [CrossRef] [Green Version]
- Masoud, Najeb M.H. 2013. The Impact of Stock Market Performance upon Economic Growth. International Journal of Economics and Financial Issues 3: 788–98. [Google Scholar]
- Menegaki, Angeliki N. 2019. The ARDL Method in the Energy-Growth Nexus Field; Best Implementation Strategies. Economies 7: 105. [Google Scholar] [CrossRef] [Green Version]
- Modigliani, Franco. 1971. Consumer Spending and Monetary Policy: The Linkages. Paper presented at the Monetary Conference, Federal Reserve Bank of Boston Conference Series 5, Nantucket Island, MA, USA, June. [Google Scholar]
- Mohamed, Omer Ahmed Sayed, and Faiza Omer Mohammed Elmahgop. 2020. Is the Effect of the Exchange Rate on Stock Prices Symmetric or Asymmetric? Evidence from Sudan. International Journal of Economics and Financial Issues 10: 209–15. [Google Scholar] [CrossRef] [Green Version]
- Ngare, Everlyne, Esman Morekwa Nyamongo, and Roseline N. Misati. 2014. Stock Market Development and Economic Growth in Africa. Journal of Economics and Business 74: 24–39. [Google Scholar] [CrossRef]
- Nguyen, My Linh Thi, and Toan Ngoc Bui. 2019. Stock Market, Real Estate Market, and Economic Growth: An ARDL Approach. Investment Management and Financial Innovations 16: 290–302. [Google Scholar] [CrossRef]
- Nyasha, Sheilla, and Nicholas M. Odhiambo. 2019. Do Financial Systems Spur Economic Growth in the USA? An Empirical Investigation. Panoeconomicus 66: 165–86. [Google Scholar] [CrossRef] [Green Version]
- Odhiambo, Nicholas M. 2011. Financial Intermediaries Versus Financial Markets: A South African Experience. International Business & Economics Research Journal (IBER) 10: 77–84. [Google Scholar] [CrossRef]
- Omer, Faiza, and Omer Ahmed. 2020. The Effect of Inflation Rates on Stock Market Returns in Sudan: The Linear Autoregressive Distributed Lag Model. Asian Economic and Financial Review 10: 808–15. [Google Scholar] [CrossRef]
- Osamwonyi, Ifuero Osad, and Abudu Kasimu. 2013. Stock Market and Economic Growth in Ghana, Kenya and Nigeria. International Journal of Financial Research 4: 83–98. [Google Scholar] [CrossRef] [Green Version]
- Osaseri, Godfrey, and Ifuero Osad Osamwonyi. 2019. Impact of Stock Market Development on Economic Growth in BRICS. International Journal of Financial Research 10: 23–30. [Google Scholar] [CrossRef]
- Pan, Lei, and Vinod Mishra. 2018. Stock Market Development and Economic Growth: Empirical Evidence from China. Economic Modelling 68: 661–73. [Google Scholar] [CrossRef]
- Pesaran, M Hashem. 1997. Econometrics and Economic Theory in the 20th Century. Cambridge: Cambridge University Press, pp. 1–24. [Google Scholar] [CrossRef]
- Pesaran, M. Hashem, Yongcheol Shin, and Ron P. Smith. 1999. Pooled Mean Group Estimation of Dynamic Heterogeneous Panels. Journal of the American Statistical Association 94: 621–34. [Google Scholar] [CrossRef]
- Pesaran, M. Hashem, Yongcheol Shin, and Richard J. Smith. 2001. Bounds Testing Approaches to the Analysis of Level Relationships. Journal of Applied Econometrics 16: 289–326. [Google Scholar] [CrossRef]
- Rajabi, Ehsan, and Junaina Muhammad. 2014. The Stock Markets, Banks and Growth Nexus: Asian Islamic Countries. Economic Notes: Review of Banking, Finance and Monetary Economics 43: 137–65. [Google Scholar] [CrossRef]
- Rezina, Sonia, Nusrat Jahan, and Mohitul Ameen Ahmed Mustafi. 2017. Contribution of StockMarket towards Economic Growth: An Empirical Study on Bangladesh Economy. European Scientific Journal, ESJ 13: 238. [Google Scholar] [CrossRef] [Green Version]
- Sirag, Abdalla, Samira SidAhmed, and Hamisu Sadi Ali. 2018. Financial Development, FDI and Economic Growth: Evidence from Sudan. International Journal of Social Economics 45: 1236–49. [Google Scholar] [CrossRef]
- Tekin, Bilgehan. 2019. The Causality between Economic Growth and Stock Market in Developing and Developed Countries: Toda-Yamamoto Approach. Theoretical and Applied Economics XXVI: 79–90. [Google Scholar]
- MacKinnon, James G. 1996. Numerical distribution functions for unit root and cointegration tests. Journal of Applied Econometrics 11: 601–18. [Google Scholar]
Figure 1.
Plot of cumulative sum of recursive residual.

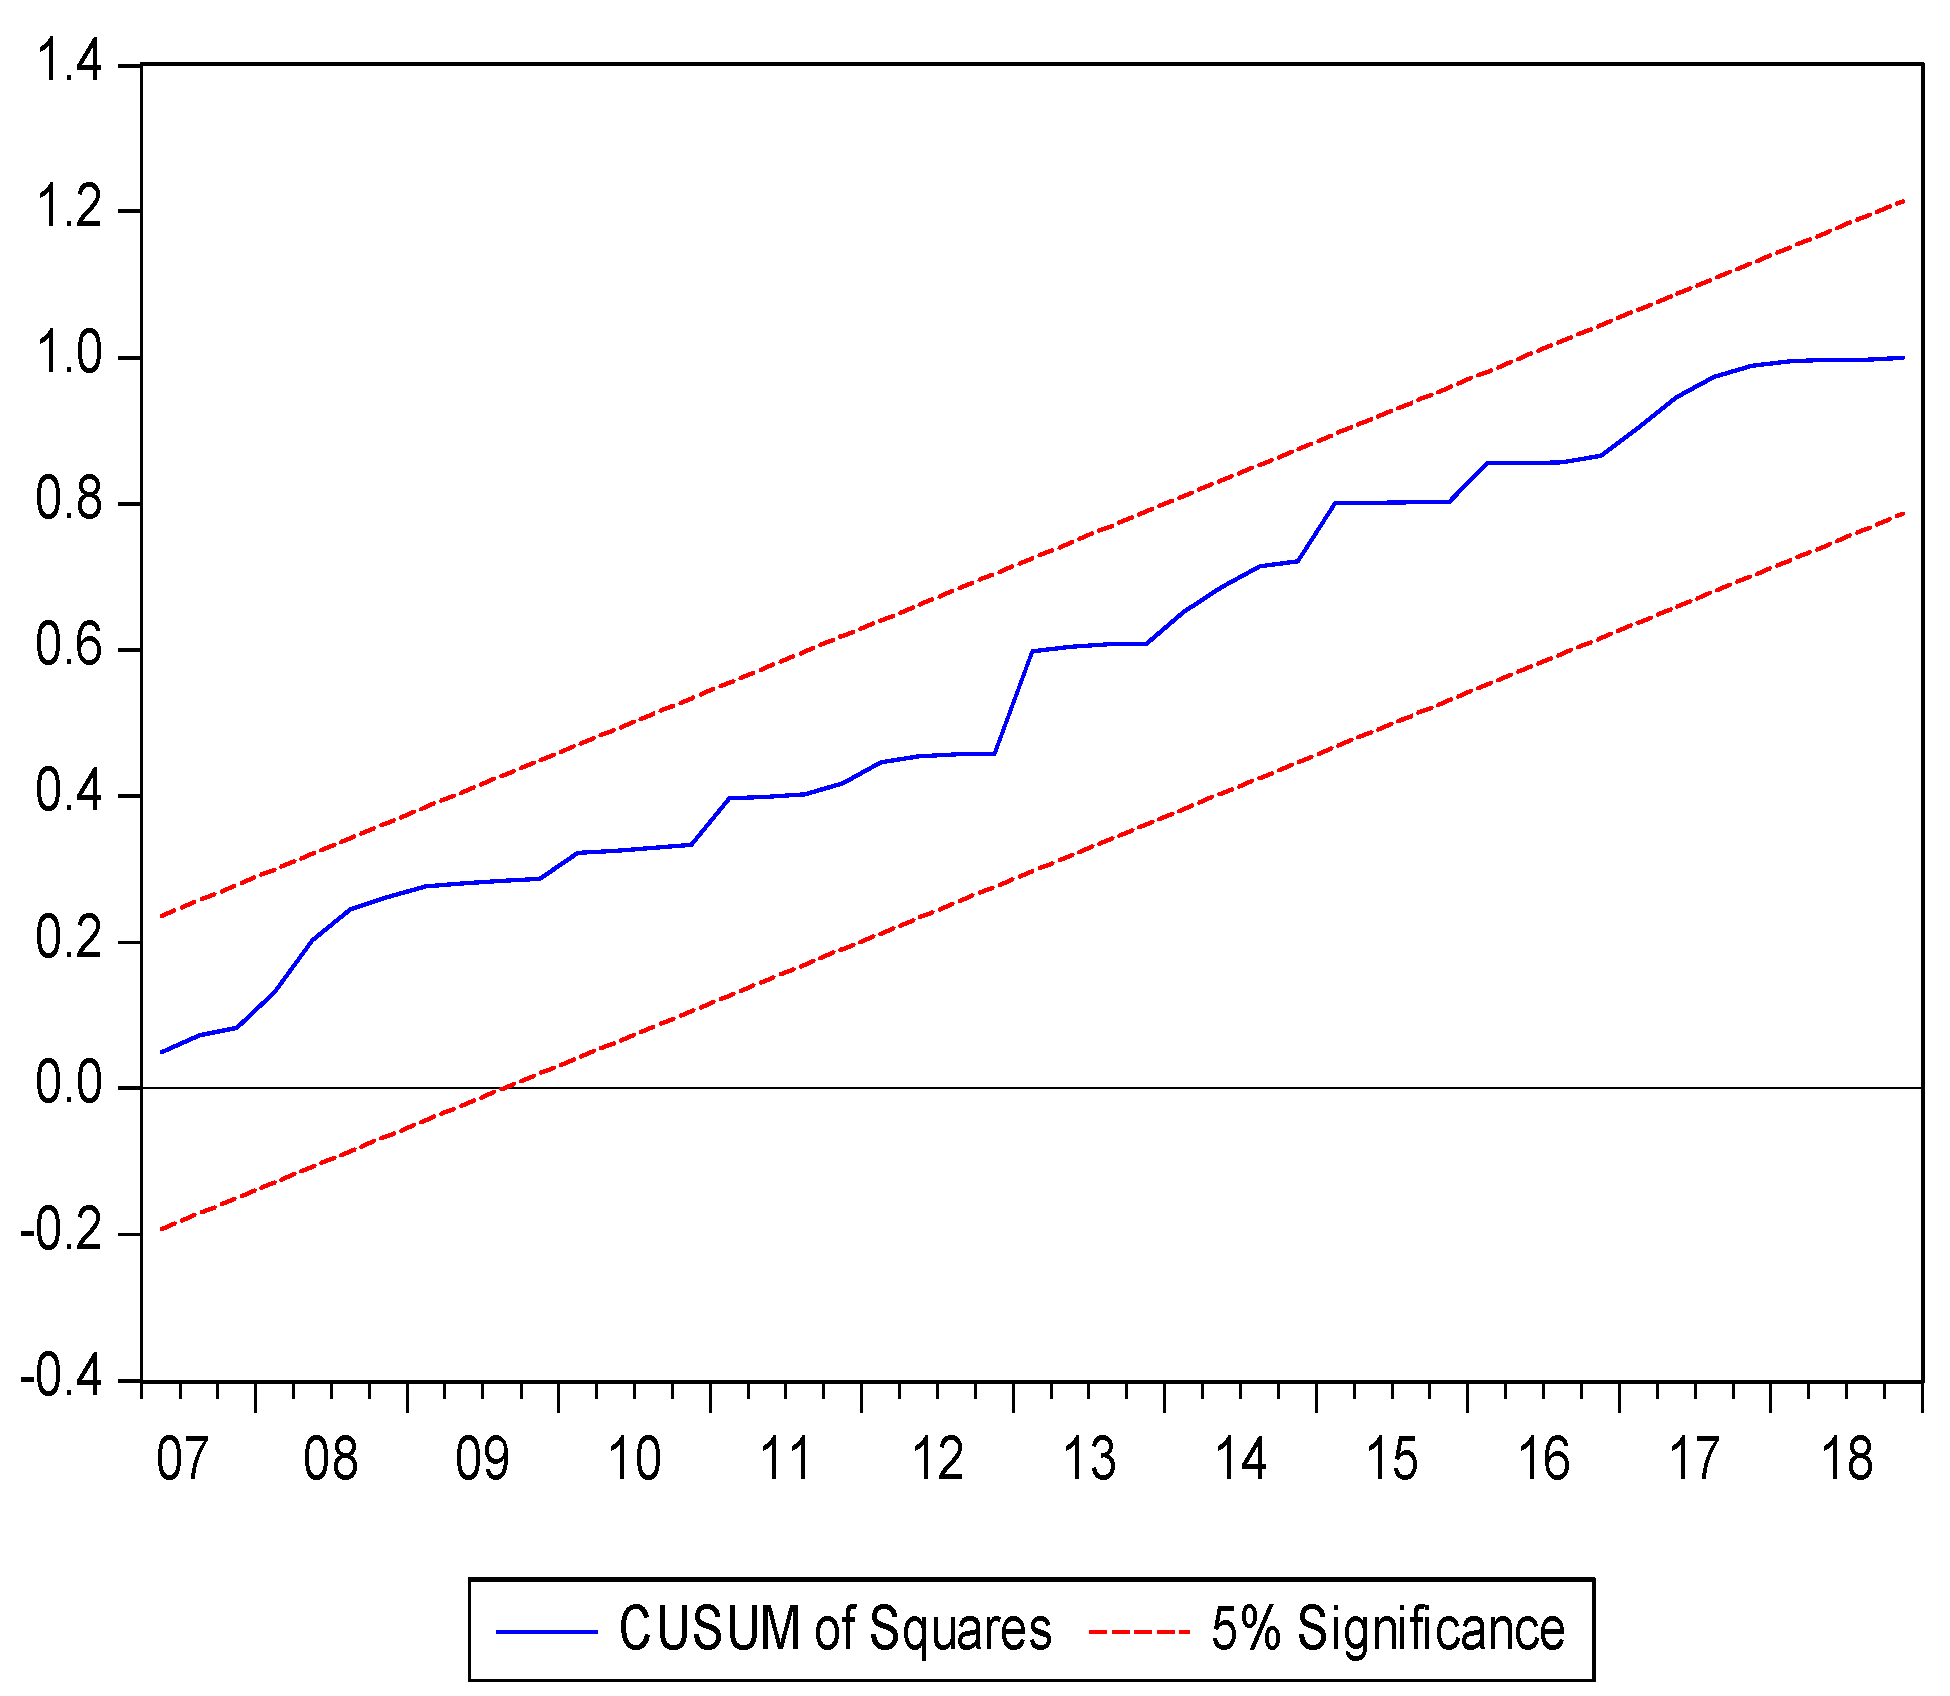
Figure 2.
Plot of cumulative sum of squares. Source: authors’ analysis using EViews 10, 2020.


Table 1.
Augmented Dickey–Fuller (ADF) stationary test. RGDP: real GDP growth rate; MC: market capitalization; STV: stocks traded value; TR: turnover ratio.
Table 1.
Augmented Dickey–Fuller (ADF) stationary test. RGDP: real GDP growth rate; MC: market capitalization; STV: stocks traded value; TR: turnover ratio.
| Unit Root Test Results Table (ADF) | |||||
|---|---|---|---|---|---|
| Null Hypothesis: The Variable Has a Unit Root | |||||
| At Level | |||||
| RGDP | MC | STV | TR | ||
| With Constant | t-Statistic | −1.9175 | −2.5775 | −1.4089 | −1.9416 |
| Prob. | 0.3229 | 0.1014 | 0.5747 | 0.3120 | |
| no | no | no | no | ||
| With Constant and Trend | t-Statistic | −2.2542 | −2.5589 | −0.2717 | −1.1806 |
| Prob. | 0.4538 | 0.3000 | 0.9904 | 0.9078 | |
| no | no | no | no | ||
| Without Constant and Trend | t-Statistic | −0.8878 | −0.6555 | −0.6302 | −0.7333 |
| Prob. | 0.3287 | 0.4306 | 0.4417 | 0.3961 | |
| no | no | no | no | ||
| At First Difference | |||||
| d(RGDP) | d(MC) | d(STV) | d(TR) | ||
| With Constant | t-Statistic | −3.0848 | −2.3194 | −5.2510 | −1.8133 |
| Prob. | 0.0314 | 0.1682 | 0.0000 | 0.3718 | |
| ** | no | *** | no | ||
| With Constant and Trend | t-Statistic | −3.0791 | −2.3047 | −5.4981 | −1.7198 |
| Prob. | 0.1179 | 0.4269 | 0.0001 | 0.7340 | |
| no | no | *** | no | ||
| Without Constant and Trend | t-Statistic | −3.0898 | −2.2751 | −5.3006 | −1.7949 |
| Prob. | 0.0024 | 0.0229 | 0.0000 | 0.0692 | |
| *** | ** | *** | * | ||
Table 2.
Phillip–Perron (PP) stationary test.
| Unit Root Test Results Table (PP) | |||||
|---|---|---|---|---|---|
| Null Hypothesis: The Variable Has a Unit Root | |||||
| At Level | |||||
| RGDP | MC | STV | TR | ||
| With Constant | t-Statistic | −2.9828 | −1.5729 | −1.5865 | −1.8247 |
| Prob. | 0.0401 | 0.4924 | 0.4855 | 0.3666 | |
| ** | no | no | no | ||
| With Constant and Trend | t-Statistic | −3.9008 | −1.4984 | −0.8996 | −1.9022 |
| Prob. | 0.0157 | 0.8236 | 0.9512 | 0.6456 | |
| ** | no | no | no | ||
| Without Constant and Trend | t-Statistic | −0.8838 | −0.4596 | −0.8874 | −1.2666 |
| Prob. | 0.3307 | 0.5136 | 0.3292 | 0.1879 | |
| no | no | no | no | ||
| At First Difference | |||||
| d(RGDP) | d(MC) | d(STV) | d(TR) | ||
| With Constant | t-Statistic | −6.0204 | −3.7612 | −4.2412 | −3.4290 |
| Prob. | 0.0000 | 0.0046 | 0.0010 | 0.0123 | |
| *** | *** | *** | ** | ||
| With Constant and Trend | t-Statistic | −5.9429 | −3.7583 | −4.4010 | −3.4840 |
| Prob. | 0.0000 | 0.0232 | 0.0035 | 0.0470 | |
| *** | ** | *** | ** | ||
| Without Constant and Trend | t-Statistic | −6.0644 | −3.7386 | −4.2749 | −3.4440 |
| Prob. | 0.0000 | 0.0003 | 0.0000 | 0.0007 | |
| *** | *** | *** | *** | ||
Table 3.
Wald test for long-term cointegration.
| Wald Test | ||||
|---|---|---|---|---|
| F-statistic Value | Signif. | I(1) | I(0) | |
| 6.862741 | 10% | 2.37 | 3.2 | |
| 5% | 2.79 | 3.67 | ||
| 2.50% | 3.15 | 4.08 | ||
| 1% | 3.65 | 4.66 | ||
Source: authors’ analysis using EViews 10, 2020.
Table 4.
Diagnostic check for serial correlation.
| Breusch–Godfrey Serial Correlation LM Test | |
|---|---|
| F-statistic | 0.085333 |
| Prob. F(1,81) | 0.7709 |
Source: authors’ analysis using EViews 10, 2020.
Table 5.
Estimation of long-term coefficients.
| Estimation of Long-Term Coefficients | ||||
|---|---|---|---|---|
| Variable | Coefficient | Std. Error | t-Statistic | Prob |
| MC | 1.160328 | 0.442268 | 2.623583 | 0.0104 |
| STV | −4.515979 | 2.438455 | −1.851984 | 0.0676 |
| TR | 0.072632 | 0.067485 | 1.076261 | 0.285 |
| C | 5.82237 | 1.089981 | 5.341717 | 0 |
| EC = RGDP − (1.1603 × MC − 4.5160 × STV + 0.0726 × TR + 5.8224) | ||||
Source: authors’ analysis using EViews 10, 2020.
Table 6.
Short-term error correction.
| Short-Term Error Correction Result | ||||
|---|---|---|---|---|
| Variable | Coefficient | Std. Error | t-Statistic | Prob. |
| D(RGDP(−1)) | 0.393362 | 0.086324 | 4.556792 | 0 |
| D(RGDP(−2)) | 0.23669 | 0.087387 | 2.708523 | 0.0082 |
| D(MC) | −1.065073 | 0.30511 | −3.490785 | 0.0008 |
| D(STV) | 2.854943 | 1.317073 | 2.167643 | 0.0331 |
| D(TR) | −0.098007 | 0.037431 | −2.618295 | 0.0105 |
| @AFTER(“2007”) | −0.624119 | 0.14412 | −4.330553 | 0 |
| CointEq(−1) * | −0.235444 | 0.039247 | −5.998962 | 0 |
* means the result is significant all levels (1, 5, 10). Source: authors’ analysis using EViews 10, 2020.
Table 7.
Diagnostic and stability analysis.
| Statistics | Estimated Value | Prob |
|---|---|---|
| Breusch–Godfrey Serial Correlation LM Test | 0.085333 | 0.7709 |
| ARCH Test | 0.584675 | 0.4465 |
| Ramsey RESET Test | 0.26835 | 0.7891 |
Source: authors’ analysis using EViews 10, 2020.
Publisher’s Note: MDPI stays neutral with regard to jurisdictional claims in published maps and institutional affiliations. |
© 2020 by the authors. Licensee MDPI, Basel, Switzerland. This article is an open access article distributed under the terms and conditions of the Creative Commons Attribution (CC BY) license (http://creativecommons.org/licenses/by/4.0/).
Share and Cite
MDPI and ACS Style
Elhassan, T.; Braima, B. Impact of Khartoum Stock Exchange Market Performance on Economic Growth: An Autoregressive Distributed Lag ARDL Bounds Testing Model. Economies 2020, 8, 86. https://0-doi-org.brum.beds.ac.uk/10.3390/economies8040086
AMA Style
Elhassan T, Braima B. Impact of Khartoum Stock Exchange Market Performance on Economic Growth: An Autoregressive Distributed Lag ARDL Bounds Testing Model. Economies. 2020; 8(4):86. https://0-doi-org.brum.beds.ac.uk/10.3390/economies8040086
Chicago/Turabian StyleElhassan, Tomader, and Bakhita Braima. 2020. "Impact of Khartoum Stock Exchange Market Performance on Economic Growth: An Autoregressive Distributed Lag ARDL Bounds Testing Model" Economies 8, no. 4: 86. https://0-doi-org.brum.beds.ac.uk/10.3390/economies8040086
Note that from the first issue of 2016, this journal uses article numbers instead of page numbers. See further details here.