Generalized Trust and Economic Growth: The Nexus in MENA Countries

Department of Economics, The British University in Egypt, El Sherouk City 11837, Egypt
*
Author to whom correspondence should be addressed.
Economies 2021, 9(1), 39; https://0-doi-org.brum.beds.ac.uk/10.3390/economies9010039
Submission received: 5 January 2021
/
Revised: 10 March 2021
/
Accepted: 11 March 2021
/
Published: 16 March 2021
Abstract
:This study mainly examines the relationship between generalized/horizontal/social trust and economic growth in countries in the Middle East and North Africa (MENA) region, considering the substantial decline in their trust values since 2005. The study utilizes a multiple linear regression model based on panel data comprising 104 countries over the period from 1999 to 2020. Trust data were obtained from the last four waves of the World Values Survey (WVS). A Pooled Ordinary Least Squares (POLS) estimation technique was used, and interaction terms between trust and several dummy variables were employed. The results show an overall positive and significant relationship between trust and economic growth in the general model and for all country classifications, except for MENA, where the overall relationship is negative but almost negligible. Trust has the highest impact on growth in transition economies, followed in order by developing Asia, developed, developing/Sub-Saharan Africa, developing America, and then MENA countries. Further investigations reveal that the overall negative/reversed effect of trust on economic growth in MENA is only during waves 6 and 7, where the coefficients are sizable.
Keywords:
generalized trust; horizontal trust; social trust; social capital; economic growth; democracy; MENA; developing countries; Arab Spring; WVSJEL Classification:
O17; O43; O571. Introduction
Cultural and behavioral factors including trust have been explored in the academic literature relatively recently to decipher the reasons for persistent growth differentials across countries. Trust, research reveals, although only one constituent of social capital, is an imperative aspect for economic and social relations (Algan 2018). The concept of generalized/horizontal/social trust refers to the level of trust between individuals in a society unknown to each other—interpersonal trust, which is different from trust in institutions—institutional trust—or authorities, which is sometimes referred to as vertical trust. Generalized trust (or simply “trust” unless otherwise specified) is perceived as one of the main decisive drivers of economic performance/growth (Knack and Keefer 1997; La Porta et al. 1997; Zak and Knack 2001; Algan 2018). Research performed from 2009 onwards demonstrated the causality of this relationship (Algan and Cahuc 2010), which is transmitted through several channels. These channels include trust’s boosting effects on efficiency, human capital accumulation, governance, investment and innovation, financial markets’ operations, firms’ organizations, labor markets’ operations, and trade, which all directly and positively affect growth. Trust also plays a crucial role in enhancing the well-being of citizens, which directly affects their productivity and consequently economic growth. Trust, according to Arrow (1972) is an essential lubricant of a social system since it facilitates cooperation and mutually beneficial exchanges in the existence of imperfect information and incomplete contracts. This study is not interested in investigating the channels through which trust affects growth. Rather, it is interested in testing how trust affected economic growth in general and particularly in the MENA countries.
Kasmaoui et al. (2018) is the only study that examined the trust–growth relationship in MENA countries, driven by the several changes the region has undergone recently, such as demographic transitions, the Arab Spring, and other economic changes. These events affected both the economic growth and the trust levels in the region. Their study focused on a sample of 60 countries that were included in only the sixth wave (2010–2014) of the World Values Survey (WVS), and their cross-country analysis showed a positive and significant impact of trust on growth in the overall sample. However, when the relationship was investigated only for the MENA countries in the sample, the results indicated that the impact was weaker compared to other countries. Since this study covered only a single, turbulent period the results may not be generalizable to the MENA region’s overall trust–growth interconnection, suggesting room for further investigation.
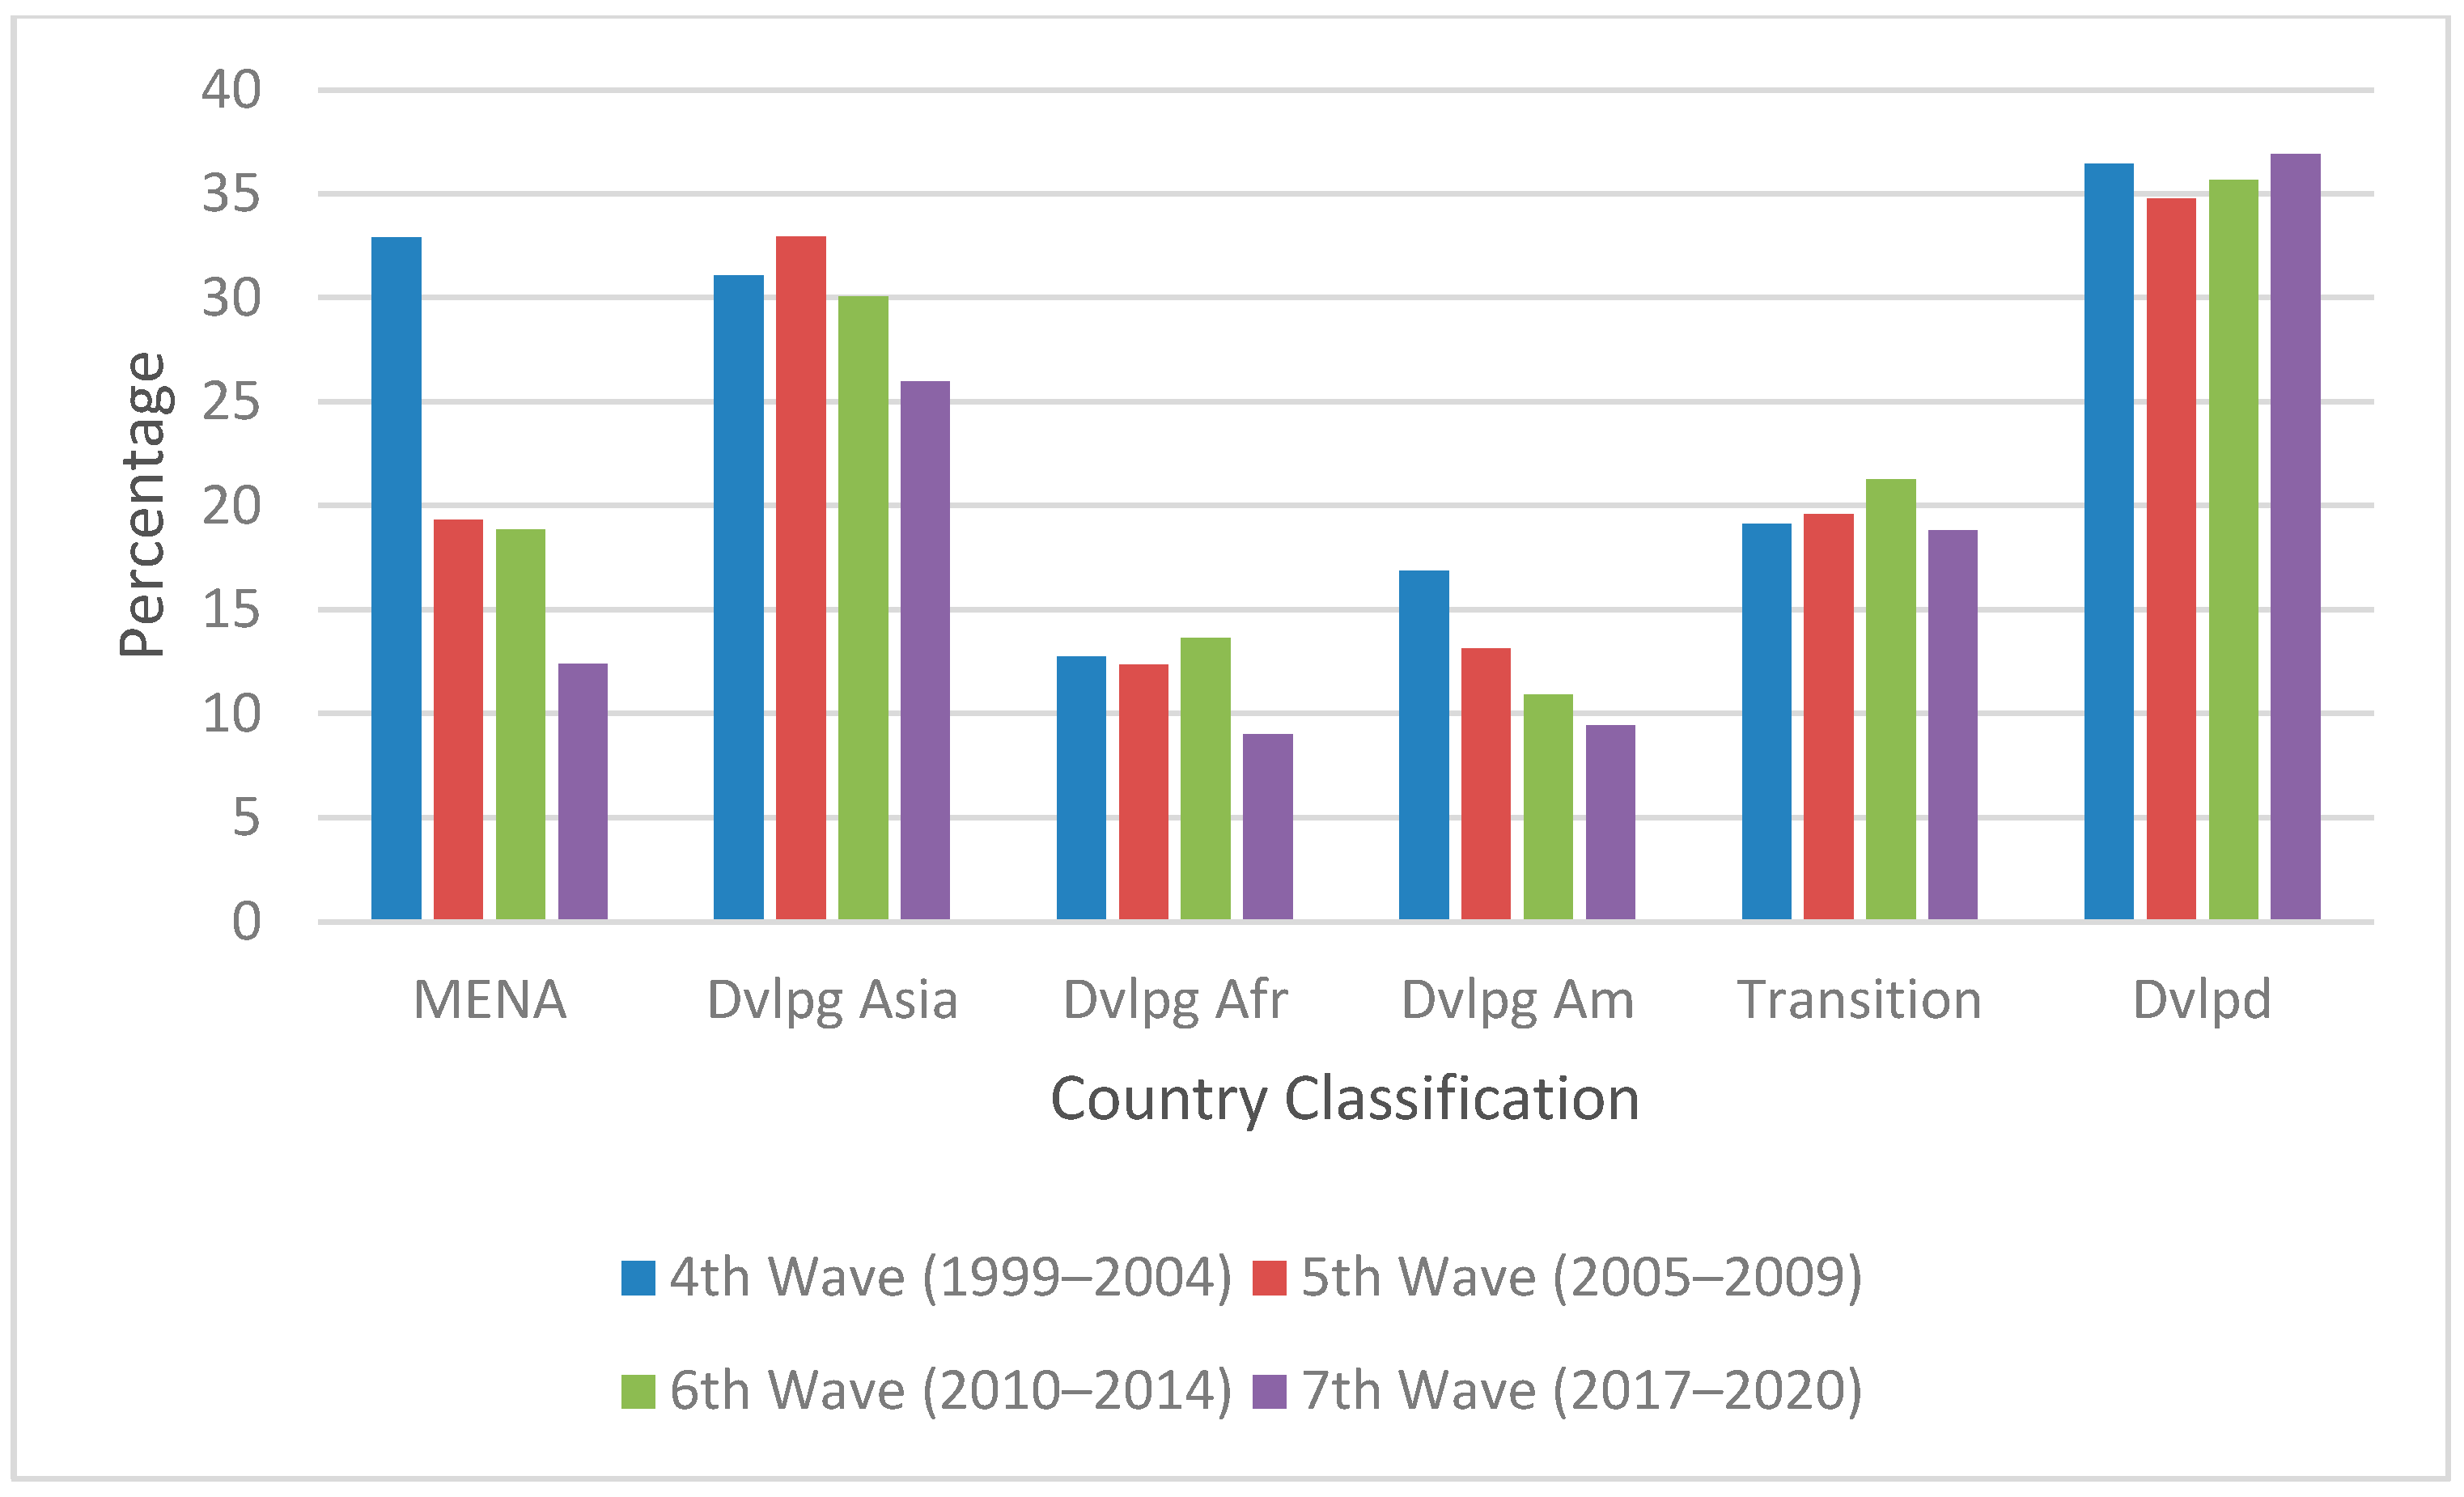
MENA countries are of specific interest because they started with trust levels that are very comparable to those of developing Asian and developed countries, yet they are the only region that experienced a significant deterioration in their trust values across the last four waves of the WVS. Developing American countries also experienced reduced trust values throughout the four waves, but not as stark as the fall in those of MENA nations. As shown in Figure 1 and Table A1 (in Appendix A), in MENA, generalized trust dropped by 41% from wave 4 to 5, by 2% from wave 5 to 6, by 34% from wave 6 to 7, and by 62% over the entire period from wave 4 to 7.
One possible reason for this decline is the Arab Spring, including the circumstances that led up to it (occurring during wave 5), its beginnings (during wave 6) and its lasting ramifications, from which several MENA economies are still suffering. The Arab Spring was exemplified by violence and upheaval in several countries as well as political and social fragmentation, even within individual families. Given the Arab regional identity, this implies that increased group tension during the uprising could harm interpersonal trust across the region (Spierings 2019). Furthermore, in several countries the actions of those who came into political power after the uprising may have changed people’s general views on trustworthiness, particularly in those countries whose new leaders were untrustworthy and corrupt. Even before the Arab Spring, the economic, political, and social circumstances that led to its occurrence might have manifested themselves in the massive drop in the trust values described above. It is still an interesting observation and perhaps requires more in-depth research, that during the worst years of disruptions—that of the Arab Spring itself (wave 6), trust did not drop as much as it did before the onset of the Arab Spring (from wave 4 to wave 5) and after it (moving from wave 6 to wave 7).
Many MENA countries were faced with several other major challenges before and during the uprising, such as chronic unemployment, declining remittances, and social and political unrest (Acheboune and Driouchi 2014; El-Katiri et al. 2014; Naufal and Vargas-Silva 2010). These challenges had a major impact on growth in many MENA countries and given the reduced level of interpersonal trust, it is interesting to investigate if the latter affected the former.
This study thus explores how generalized trust affects economic growth in MENA countries. This is done by comparing this relationship in the MENA region to other countries at various stages of economic development using a panel data set covering 104 countries during the period from 1999 to 2020. The period covered by the study was chosen based on the availability of data for MENA countries in the WVS, which began in the fourth wave (1999–2004) and has continued since then. Previous studies measured either the general impact of trust on growth, or the impact of different variables on the accumulation of trust in a certain economy but not for such an extended period as this study covers. Moreover, the impact of trust on growth in MENA countries has been investigated only once, using cross-country analysis and for only one wave as mentioned earlier. To the best of our knowledge, no previous studies have investigated the impact of trust on economic growth in MENA countries using panel data, and none have compared it to other countries in terms of economic development classifications. This study aims to fill these gaps in the literature. The results show that trust positively affects economic growth in the general model, and that an overall positive trust–growth relationship is strongest in transition countries, followed by developing Asia, developed, developing/Sub-Saharan Africa, developing America, and then MENA countries. MENA countries not only have the weakest trust–growth nexus, but this relationship even reversed its sign during the last two waves. The results of this study should be of interest to sociologists, economists, policymakers, and governments to help them understand the underlying reasons behind this unusual finding.
2. Literature Review
2.1. Trust and ITS Measurement
The trust concept has been differently interpreted by many, resulting in different measures, and consequently different policy implications (Algan 2018). Mobilized by this, OECD (2017) have reviewed these differences and produced its “Guidelines on Measuring Trust”. Following these guidelines, trust is defined as “a person’s belief that another person [interpersonal trust] or institution [institutional trust] will act consistently with their expectations of positive behaviour” (p. 42). OECD (2017) differentiated between two types of interpersonal trust: generalized trust, which refers to trust in people unknown to the respondent, and limited trust, which refers to trust in people known to the respondent, such as family, friends, and close-by neighbors. This study only focuses on interpersonal generalized trust.
The OECD (2017) identified four various approaches to measuring the same concept of trust—three are survey-based and one is behavioral/experimental-based. The survey-based approaches vary according to the focus of the questions asked. The evaluation approach focuses its questions to the respondents on their views at the time of the survey—the present, while the expectations and the experiences approaches focus their questions on the respondents’ views about the future and in the past, respectively. The survey data thus provide subjective information. Contrarily, the experimental-based approach focuses on lab experiments that are designed to evoke an array of social behaviors including trust and capture actual behavior. Measures of trust based on experiments, although not subjective, are not and cannot be performed on a large scale, contrary to the survey-based ones, and thus cannot be used as “good predictors of macroeconomic outcomes” (Algan 2018).
In surveys, “the generalized trust question” (following the evaluation approach) or in other words, the “standard” measure of trust, is the most often used measure of interpersonal trust. Whereby respondents are asked “Generally speaking, would you say that most people can be trusted, or that you need to be very careful when dealing with people?”, where the answers are binary, taking the value of 1 if the choice is that most people can be trusted and 0 otherwise (OECD 2017).
Whether this “standard” measure of trust is reliable (i.e., generates consistent results when measured at different periods of time) and valid (i.e., measures what it is supposed to measure) has been extensively discussed in the literature, with many scholars on opposite sides of the issue (Barro 1991; Beugelsdijk and Van Schaik 2005; Hardin 2002; Katz and Rotter 1969; Lundmark et al. 2016; Rice and Feldman 1997; Uslaner 2008, 2012; Volland 2010). Uslaner (2015) offered a thorough defense in response to each criticism of the “standard” measure. OECD (2017) identified several criteria, including but not limited to reliability, face validity, convergent validity, and construct validity to evaluate the statistical quality of the interpersonal generalized trust measure. The OECD (2017) also identified many issues with these survey-based data trust measures, such as stemming from nonofficial surveys, using very small sample sizes that are not always representative, with relatively poor coverage especially over time, and using different response scales. Nevertheless, the OECD (2017) found strong evidence for the reliability and the validity of the interpersonal generalized trust measures, as they were found to be consistent over time and across different sources of data, they had relatively low nonresponse rates and they have been found to be highly correlated with a sizable array of economic and social outcomes. According to Algan (2018), “for inter-personal trust there is a consensus on using generalized trust as the preferred measure” and that is why OECD (2017) recommended using them in official statistics vehicles.
2.2. Trust and Economic Growth—Theoretical Underpinnings
The causes of economic growth and development, Algan (2018) explained, have moved away from stressing the important role of capital (human and physical) accumulation and technological progress, to focusing on formal institutions’ role in supporting or weakening market institutions that influence wealth accumulation and innovations, to then shifting attention towards deep-seated elements such as social capital and trust.
Trust boosts economic growth directly through several channels. It reduces transaction costs by solving the problems of collective action without the intervention of regulations (Ostrom 1990), which increases efficiency (Coase 1990) and thus stimulates growth. Trust augments human capital (Coleman 1988), which is a significant determinant of growth (Temple 2001) by increasing both the demand for and supply of education (Bjørnskov 2006). The demand for education increases since it solves the principle-agent problem of the hard to monitor tasks assigned to educated workers, while, through encouraging people to share their human capital, it generates positive outcomes/externalities by affecting the level of schooling, thus increasing its supply by the government. Trust enhances governance, a main growth factor, through broadening government accountability, achieving agreements even when the positions of politicians and voters are strongly polarized, and allowing for greater policy innovations when new challenges are met (Knack 2002). Trust increases investment rates and innovation (Whitely 2000; Algan and Cahuc 2014), both crucial growth determinants, through supporting the well-functioning of the financial markets, which is negatively affected by uncertainties that stem from moral hazard and contract enforcement difficulties (Algan and Cahuc 2014). Zak and Knack (2001) argued that distrusting brokers incurs a transaction cost on investors, which lowers the investment rate. Trust positively affects growth through the organization of firms (Algan and Cahuc 2014) by easing cooperation among anonymous individuals, which results in the surfacing and development of private and public organizations as well as by favoring decisions’ decentralization within organizations, which enhances their adaptability to changes in the environment (Fukuyama 1995; La Porta et al. 1997; Bertrand and Schoar 2006; Bloom et al. 2012). Trust supports the well-functioning of the labor markets (Algan and Cahuc 2014) through favoring cooperation between management and labor (Aghion et al. 2011), which encompasses a bundle of factors that support economic growth and well-being. Trust boosts international trade with foreign partners as it provides security for the gains of trade by lowering the risk of noncompliance with trade contracts (De Groot et al. 2004).
Trust also stimulates growth indirectly through its effect on the well-being of citizens. Reviewing several studies, Algan (2018) showed that trust positively affects the health of individuals—in terms of lower suicide rates, better mental health, lower rates of heart disease and death rates—and increases life satisfaction and happiness. Better health (Arora 2001) and life satisfaction and happiness (Bellet et al. 2020) have both been associated with higher productivity and consequently economic growth.
2.3. Trust and Economic Growth—Empirical Findings
Knack and Keefer’s (1997) groundbreaking study examined the relationship between trust and economic growth across countries in a certain period (cross-section analysis). Using indicators from the World Values Survey (WVS), they found that trust positively affects growth. Zak and Knack (2001) using the model in Knack and Keefer (1997), confirmed those results and found that trust is positively correlated with investment rates and growth in per capita income.
La Porta et al. (1997) also used WVS trust data and cross-country analysis to confirm that trust promotes growth through enhancing government efficiency and participation in social organizations. Schmidt (2003) found that trust promotes growth by accumulating human and physical capital, increasing the spread of technology, and improving the level of functioning within institutions. Bjørnskov (2012) indicated that trust positively affects schooling and governance, both of which significantly affect growth. In their studies, both Schmidt and Bjørnskov depended on WVS trust data. Bjørnskov and Méon (2013) showed that trust results in improvements in education, the quality of institutions, and GDP per capita.
Similarly, but focusing on states rather than countries, Knack (2002), and Dincer and Uslaner (2010) found a significant direct relationship between trust and growth across the individual states in the U.S. Cui (2017) investigated the relationship across provinces in China and concluded that trust positively and significantly promotes growth in such provinces.
Dearmon and Grier (2009) were the first to update the method used in Knack and Keefer (1997) and Zak and Knack (2001) to incorporate panel estimation techniques. Using WVS trust data, they concluded that the effect of trust on economic development stems from its effect on human and physical capital. They also found that the marginal impact of trust on both of those forms of capital decreases as trust increases, which means that promoting trust would be most beneficial to low-trust countries (Dearmon and Grier 2011).
Utilizing panel estimation techniques as well, Roth (2009) demonstrated an inverse relationship between trust and growth. This result stemmed from including developed countries in the sample, and the explanation given was that the effect of trust on growth relies upon the initial level of trust in the economy. If the initial level of trust is already high (relative to other countries), the effect of trust on growth will be negative; if the initial level of trust is low, trust will have a positive effect on growth. This is supported to some extent by the findings in Dearmon and Grier (2011).
Volland (2010) using WVS trust data tested the robustness of the trust–growth relationship, particularly with respect to the claim that trust captures how well a country’s institutions function. His results showed that trust positively and significantly affects growth and that the trust–growth relationship is indeed robust after controlling for respondents’ perceptions of the functioning/quality of institutions. Peiró-Palomino and Tortosa-Ausina (2013) studied the role of trust on economic development and showed that while trust is a principal driver of economic development, it is not relevant for poor countries and exhibits diminishing returns as an economy becomes richer. The irrelevance of trust for poor countries contradicts the findings in Knack and Keefer (1997), who proposed that trust is more relevant to a poor country whose rule of law and institutions are weak; in that situation, trust (an informal institution) substitutes for weak formal institutions, lowering transaction costs which could, in turn, increase output. In contrast, Zak and Knack (2001) suggested the idea of “low-trust poverty trap” wherein poor countries with low trust levels cannot use trust to lubricate growth and development.
Horváth (2013) was an exception to the studies discussed above. He utilized Bayesian Model Averaging to research the impact of trust on growth and focused on the robustness of the relationship and the role of model uncertainty. His results showed that trust is among the top determinants of, and has a positive impact on, long-run economic growth, and that for countries with a weak rule of law the effect of trust is stronger. Moreover, the findings were robust regarding the endogeneity of the trust–growth relationship.
Concerns about whether the correlation between trust and economic growth could go from income to trust, and not the other way around, as all the previous studies have demonstrated, have been put to rest by Algan and Cahuc (2010) who confirmed, after controlling for reverse causality and confounding factors, a steady causal relation moving from trust to income.
Algan and Cahuc (2014) plotted for 106 countries, their per capita income during 1980–2009 against their average generalized trust during 1981–2008, and found a steady correlation, where 20% of per capita income cross-country variation was associated with trust differences. Moreover, using regression analysis, they found that after controlling for several factors, trust continues to have a positive and significant effect on per capita income. Trust was calculated as the country average from replies to the “Generally speaking” trust question in five waves of the WVS, four waves of the European Values Survey, both covering the 1981–2008 period, and the third wave (2005) of the Afrobarometer.
Lopes and Rivera-Castro (2018) using WVS trust data for 79 countries during the 1994–2014 period, tested whether trust affected growth in democratic countries. Their results showed that democratic countries enjoying high trust levels have lower growth rates than nondemocratic countries with low trust levels. Their results also showed that democracy alone is not the reason behind the lower growth rates but rather the democracy–trust conjunction that increased government spending and reduced investment rates. This interesting finding is not far away from the conclusions of Dearmon and Grier (2011) and Peiró-Palomino and Tortosa-Ausina (2013) that highlighted the diminishing marginal returns of trust on growth in rich/developed countries, which usually enjoy high trust levels, since most rich/developed countries are in fact democratic. This democracy–trust association calls for further investigation in this study given that almost all MENA countries included score relatively low in their democracy indices and are thus considered nondemocratic.
3. Methodology
Prompted by the previously noted significant drop in trust values for MENA countries, the primary goal of this study is to investigate the trust–growth nexus in those countries. To do so, the first step is to test the hypothesis that generalized trust positively affects economic growth in general, as suggested in the existing literature. Then the MENA region’s trust–growth relationship is compared to other country classifications to gain a better understanding of this relationship in the MENA region in particular.
To measure trust, as in most other studies, the generalized trust question from the WVS is used, and it is then measured as the percentage of respondents who choose the response, “most people can be trusted”. The WVS consists of seven waves over the period from 1984 to 2020; on average, each wave is conducted over a four-year period. This study uses only the last four waves covering the subperiods 1999–2004, 2005–2009, 2010–2014 and 2017–2020 (published July 2020), respectively, because these waves include MENA countries. The total number of countries originally included in the sample was 104, including 15 MENA countries, but the final number is 92, as some countries were dropped due to missing variables. A list of the countries and the classification to which they belong is shown in Table A2 in Appendix A. This study adopts the base model used in Knack and Keefer (1997), Zak and Knack (2001), and updated by Volland (2010). Therefore, in addition to the main independent variable, Trust, other exogenous control variables affecting growth are used as discussed below. Table A3 in Appendix A provides a summary of the variables used in the model, their definitions, expected signs, and data sources.
Initial GDP Per Capita (GDPPC): The neoclassical growth model and the Absolute Convergence hypothesis postulate that poor countries grow faster than rich economies (Ramsey 1928; Solow 1956). According to Barro (2003), the convergence hypothesis suggests that countries with a relatively low initial level of GDPPC will experience an acceleration in economic growth during the observation interval. Hence, economic growth is expected to be inversely related to the initial level of GDPPC. Since this variable measures convergence, it should reflect the previous period’s level of growth. Following Zak and Knack (2001), the initial level of GDP per capita growth is the first growth observation in the five years observation window; thus, it is referred to as t − 5.
Inflation: According to Gokal and Hanif (2004), high levels of inflation hamper economic growth because of the adverse costs it imposes on investment, its tax distortions, and its negative effect on countries’ international competitiveness. On the other hand, referring to the Aggregate Demand—Aggregate Supply (AD-AS) model, an increase in growth increases inflation and thus a positive relationship between the two variables is possible. Nevertheless, the empirical literature shows an inverse relationship (Barro 1995; Bruno and Easterly 1995). Economic growth is therefore expected to be negatively correlated with inflation.
Life Expectancy: Life expectancy is a proxy for a country’s quality of health care. Improvements in health conditions could decrease mortality rates, accelerating the growth of the population base and reducing income per capita. Similarly, countries with an aging population experience low levels of GDPPC growth due to the declining percentage of the population in the labor force (Bhargava et al. 2001; Sachs and Warner 1997). On the other hand, if a country experiences a drop in mortality rates after a demographic transition phase, an increase in life expectancy would reduce population growth and increase per capita income (Barro and Lee 1994; Bloom et al. 2000). Based on this, the relationship between economic growth and life expectancy cannot be confidently determined a priori.
Schooling Attainment: The level of schooling attainment is used as a proxy for human capital, which is a determinant of economic growth since an educated labor force is more productive and innovative (Mankiw et al. 1992; Nelson and Phelps 1966). Consequently, economic growth is expected to be positively correlated with schooling attainment.
Investment: Most growth models consider capital formation as an antecedent of economic growth. This strong and positive relationship has been established in both theoretical and empirical studies (Blomstrom et al. 1996; Ram 1989). This study also expects economic growth to be positively correlated with the level of investment.
Military Expenditure: Military expenditures may represent an opportunity cost, as they decrease spending on other productive activities such as human capital, and research and development, and thus negatively affects economic growth (Dunne and Vougas 1999; Dunne et al. 2002). An opposing view holds that military expenditures could accelerate economic growth by having a stimulative effect that results in higher aggregate demand, employment, innovation, and production (Chletsos and Kollias 1995). Therefore, the relation between economic growth and military expenditure cannot be assertively determined a priori.
Price of Investment Goods: Real investment rates are positively correlated with economic performance. However, most of the findings in the literature indicate that while the investment rate at domestic prices cannot explain changes in growth, relative prices of capital can (De Long and Summers 1991; De Long and Summers 1993; Taylor 1994). This study expects economic growth to be negatively correlated with the price of investment goods.
Trade Openness: Trade openness refers to an economy’s trade policy orientation. Empirical evidence reveals that trade openness positively affects economic growth (Frankel and Romer 1999; Sachs and Warner 1995) in support of the endogenous growth theory, which postulates that trade has a positive impact on growth through innovation and technology spillovers (Grossman and Helpman 1991). Thus, economic growth is expected to be positively associated with trade openness.
Rule of Law: Rule of Law means the extent to which it is possible to secure property rights, or to uphold the integrity of contracts in a country. It represents institutional development, such as having a credible police force, public defenders and prosecutors, reforming the criminal code, and ensuring the integrity of the penal system. The empirical literature concludes that robust property rights are associated with improved economic performance (Clague et al. 1999; Knack and Keefer 1995). Therefore, this study expects economic growth to be positively associated with the rule of law.
Democracy: There is controversy in the literature regarding the effect of democracy on economic growth. Many scholars believe that democratic regimes stimulate growth more than their authoritarian counterparts because they robustly promote human capital accumulation and less robustly reduce income inequality, among other reasons (Clague et al. 1996; Haggard 1997; cited in Lopes and Rivera-Castro 2018). Other scholars believe the opposite because democratic regimes lower physical capital accumulation and increase government consumption as a ratio of GDP, both of which occur because of redistributive pressures (Rao 1984; Persson and Tabellini 1992; Blanchard and Shleifer 2001; Tavares and Wacziarg 2001; all cited in Lopes and Rivera-Castro 2018). Still, there are even others that found no relationship at all (Barro and Lee 1993; Alesina et al. 1996; cited in Lopes and Rivera-Castro 2018). Consequently, the democracy-growth relationship cannot be decisively determined a priori.
Based on the above, the general model used in this study, which is an extended form of the neoclassical growth model, is specified as follows:
where the subscripts ‘i’ and ‘t’ denote the country and wave, respectively, and ε is the error term. The dependent variable is the growth rate of real GDPPC (measured in constant (2010) US dollars). Following Dearmon and Grier (2009), all annual macroeconomic data were made consistent with the WVS data by using an observation window for each country. That is, data related to waves 4, 5, 6 and 7 are averages of the periods 1999–2004, 2005–2009, 2010–2014, and 2017–2020, respectively. For level of education, the five-year interval closest to the first year of the wave is selected. For Democracy, wave 4 used the Economic Intelligence Unit’s (EIU 2020) democracy indices first published values in 2006 and then from wave 5 to wave 7, the averages were taken as for the rest of the variables. The data set, which consists of 214 observations, is unbalanced, meaning that not all countries have four observation windows. STATA version 12.0 was used to perform all statistical analysis. Table A4 in Appendix A displays the descriptive statistics of all the variables used in this study, including all the interaction terms.
Growthit = β0 + β1Trustit + β2 GDPPCit−5 + β3 Inflit + β4 Lexpecit + β5 Schoolingit + β6 Invit + β7 Militaryit + β8 POIit + β9 Opennessit + β10 RLWit + β11 Democit + εit
4. Results and Discussion
A multiple linear regression model is used to test the effect of each of the independent variable and the control variables on the dependent variable. As a first step, the dependent variable was checked for normality using the Shapiro–Wilk test and showed a p-value of 0.046. Since this is greater than 0.01, the null hypothesis should not be rejected, meaning that the dependent variable is considered normally distributed with 99% confidence. A Pooled Ordinary Least Squares (POLS) estimation technique is then used. The POLS approach is the best option since interaction terms for the trust variable with the various countries’ classification dummies will be introduced to the model later. Moreover, the dataset used is not the typical panel data that would allow for random or fixed effects estimation models, since roughly 27% of the countries are included in only one wave, 37% are present in two waves, 23% have observations in the three waves and just 13% of the countries are present in all four waves.
4.1. The General Model
Before interpreting the results of the general model (shown in Table 1, column 1), the Variance Inflation Factor (VIF) was employed to test for multicollinearity. As shown in Table 2a, there are no multicollinearity concerns since all VIF values are below 10. Heteroskedasticity was also examined using a Breusch–Pagan/Cook–Weisberg test. The probability of the chi-square value was 0.206, which is greater than the standard threshold of 0.05, indicating that the null hypothesis should not be rejected, i.e., the variance of the residuals is constant with 95% confidence. Next, a Ramsey regression specification-error test was utilized to test for omitted variables, which gave a p-value of 0.076; a value greater than 0.05 means that the model is correctly specified and that there are no omitted variables, with 95% confidence. Regarding endogeneity, theoretically speaking the way the data are used eliminate or greatly mitigate this problem. To be more precise, for education for instance, the five-year interval closest to the first year of the wave is selected, while for growth of the GDPPC it is the average of the whole interval; this means that education is to a great extent the leading variable and precedes growth of the GDPPC, which almost eliminates the endogeneity problem. For most of the other variables, averages are also taken for the whole five-year interval, which also to a great extent mitigate the endogeneity problem. Statistically, there is endogeneity if the covariance between any regressor and the error term is not zero. Thus, to make sure that there is no endogeneity, the simplest technique was used where the model was estimated then the residual was predicted and correlated with all the regressors. As shown in Table A5 in Appendix A, the correlation is zero, which means there is no endogeneity.
The value of the R-square obtained in this model is similar to those obtained in previous studies that analyzed the trust–growth relationship (Knack and Keefer 1997; Volland 2010; Zak and Knack 2001). The adjusted R-square is 0.33, indicating that the proposed model explains 33% of the total variance in GDPPC growth. The model is deemed to be sound since the F-statistic is equal to 0.00.
Regarding the coefficients of the variables, the coefficients of GDPPCt−5 (although trivial) and Infl are negative and significant, as expected. The coefficients of Lexpec and Military are also negative and significant, while Schooling, Inv, and RWL have significantly positive coefficients, as expected. The coefficients of POI, Openness, and Democ are all insignificant. Regarding the Trust variable, it has a positive and significant coefficient of 0.0429, suggesting that a one-unit increase in the level of trust increases GDPPC growth on average by 0.0429 units, holding other variables constant. This outcome is consistent with the findings in previous studies (Bjørnskov 2006; Knack and Keefer 1997; Knack 2001; La Porta et al. 1997; Zak and Knack 2001).
4.2. The Economic Development Country Classifications’ Model
Running the model for MENA countries alone to investigate the effect of trust on their economic growth was not feasible because of the small number of observations. Therefore, an interaction term between the Trust variable and a MENA dummy variable that takes the value of 1 if the country belongs to the MENA region and 0 otherwise, is added to see the impact of the Trust variable on growth if the observation is from a MENA country. Moreover, and for better comparability, the same is done with other economic development country classifications, since different country groups might have different effects on growth as the literature discussed before portrayed, and so another four interaction terms are added. As shown in column 2 of Table 1, these are between Trust and each of a developing/Sub-Saharan African countries’ dummy, a developing American countries’ (North, Central, Latin and the Caribbean) dummy, a transition countries’ dummy, and a developed countries’ dummy (which includes developed North America, Asia, EU and Oceania). There is no interaction term between Trust and a dummy for developing Asia, because developing Asian countries are used as the chosen reference category for the other interaction terms, for three reasons. First, like MENA countries, they have a developing country status. Second, their trust values at the beginning of wave 4 were very comparable to those of MENA countries. Third, they represent more than quarter of the developing countries in the sample; thus, it serves as a good reference category. The coefficients of the Trust interaction terms (positive or negative), are then each added to the coefficient of the Trust variable and the result reflects the size and sign of the impact of trust on growth in the different country groups.
Once again, multicollinearity was tested and did not posit any concerns since all VIF values are under 10, as shown in Table 2b. Heteroskedasticity was also tested and the probability of the chi-square value is 0.205, indicating that it is not a problem. Omitted variables were also tested, which gave a p-value of 0.263, indicating that the model is correctly specified, with 95% confidence. Endogeneity was tested as well and the correlation values between the residual and the regressors were all zeros, as shown in Table A6 in Appendix A, indicating that it is not a problem.
Slightly better values are obtained for the R-square and adjusted R-square. The signs and significance (or lack thereof) of the coefficients for GDPPCt−5, Infl, Lexpec, Inv, Military, POI, Openness, RWL and Democ are all similar to the results obtained from the general model. The magnitudes of the coefficients differ slightly, but not in a way that would cause any significant changes to the original interpretations. The main difference is seen for Schooling, which still has its original sign but is now insignificant with respect to growth.
The coefficient of Trust is positive and significant, suggesting that trust in developing Asian countries has a positive effect on economic growth, and that a one-unit increase in trust would increase growth in developing Asian countries by 0.0607 units. The coefficients of DvlgAfr_Trust and Dvlg Am_Trust are both negative while that of Transition_Trust is positive, but they are all insignificant, indicating that the effect of trust on developing African, developing American, and transition countries’ growth is not significantly different than its impact on developing Asian countries. This result is in line with, and marginally reinforces the findings in Knack and Keefer (1997), which suggested that trust is more pertinent in relatively poor countries whose rule of law and institutions are weak. It also contradicts the results in Peiró-Palomino and Tortosa-Ausina (2013) that contended that trust is irrelevant to poorer countries. The coefficient of Dvlpd_Trust is negative and significant, supporting the results in Peiró-Palomino and Tortosa-Ausina’s (2013) showing that trust exhibits diminishing returns in wealthy countries. For all the above country classifications, however, the overall effect of trust on growth is still positive, taking the values of 0.0664, 0.0272, 0.0218 and 0.0118 for transition, developed, developing African, and developing American countries, respectively.
Regarding the impact of trust on economic growth in MENA countries, the coefficient of MENA_Trust is negative and significant, indicating that the effect of trust on MENA countries’ growth is significantly less (by 0.0667) than in developing Asian countries, with 99% confidence. This outcome supports the results in Kasmaoui et al. (2018). However, an increase of one unit in the level of trust in MENA countries, would decrease growth by 0.006 (0.0607–0.0667) units, holding all other variables constant. In other words, the impact of trust on MENA countries’ growth is not just significantly less than in developing Asian countries, but it might actually negatively impact their growth. This negative impact, although it is small and can be considered negligible, is unusual. To summarize, the above results indicate that trust has the highest impact on growth in transition countries, followed in order by the countries of developing Asia (the reference category), developed, developing Africa, developing America, and then tailed by MENA countries, which showed an inverse relation between trust and growth.
This unusual finding, although small, warrants further investigation. One approach would be to determine whether this is a MENA-wave-specific finding, since this may have been a result of the Arab Spring, which likely affected MENA’s trust values. As discussed earlier, and as shown in Figure 1, the significant decline in trust values in MENA countries compared to other country-classifications in waves 5, 6 and 7 perhaps reflect the circumstances that led up to the Arab Spring, the Arab Spring itself and the repercussions of the Arab Spring, respectively. This hypothesis would call for using separate interaction terms between MENA and Trust in each of the different waves.
4.3. The MENA-Wave-Specific Model
To inspect the MENA-wave-specific issue, the model specification in column 3 of Table 1 was used, but this time the interaction term between MENA and Trust was specified by wave. For example, MENAW4_Trust is an interaction term between Trust and a dummy that takes the value of 1 if the country belongs to the MENA region and is in wave 4, and 0 otherwise. Although MENA includes Iran and Turkey and the focus here is on the Arab Spring, the results of a separate analysis (results not shown) in which Iran and Turkey are removed from the relevant dummies are not meaningfully different than the results in column 3. The usual tests were conducted for this model and showed no multicollinearity (see Table 2c), homoscedasticity (prob. chi-sq. = 0.29), no omitted variable bias (p-value = 0.18) and no endogeneity (see Table A7 in Appendix A). The results show that there are no significant changes with respect to all nontrust variables, except for Lexpec and Inv, which now became insignificant, as well as all non-MENA Trust variables.
Examining the coefficients of the new interaction terms reveals that MENAW4_Trust is negative and significant, indicating that the effect of trust on MENA countries’ growth during wave 4 (1999–2004) is significantly smaller (by 0.0528) than in developing Asian countries, with 95% confidence. However, an increase in the level of trust in MENA countries by one unit is suggested to cause growth to increase by 0.0019 (0.0547–0.0528) units, holding all other variables constant. This coefficient, although it shows that trust does positively affect MENA countries’ growth, is very small and can be considered negligible. The coefficient of MENAW5_Trust, although negative, is insignificant. This shows that during wave 5 (2010–2014), the effect of trust on MENA countries’ growth was not significantly different than that of the developing Asian countries. Similar to the coefficient of MENAW4_Trust, the coefficients of MENAW6_Trust and MENAW7_Trust are both negative and significant. They are also larger than the Trust coefficient and are perhaps the reason behind the same finding in column 2. Unlike with MENAW4_Trust, a unit increase in the level of trust in MENA countries during waves 6 and 7 suggests a decrease in growth by 0.0659 (0.0547–0.1206) units and 0.1174 (0.0547–0.1721) units, respectively. These two overall coefficients are close, respectively, to the overall coefficients of Trust itself (that of the reference category; developing Asia) and Transition_Trust, but are in the opposite direction, suggesting that trust in MENA affected their growth negatively and significantly during these waves. Kasmaoui et al.’s (2018) results also showed the same overall negative and significant impact of trust on economic growth in MENA countries in wave 6, the period of their study, but they did not discuss this result in their paper. In fact, their estimates showed an overall effect of trust on growth in MENA ranging from −0.2884 to −0.3108, independent of the estimation technique (OLS or the 2SLS). Our result is thus consistent with that of Kasmaoui et al.
Since Trust in MENA countries, in reality, was on average significantly lower during waves 6 and 7 than in previous waves, the above finding suggests that a unit decrease in the level of trust in MENA countries during waves 6 and 7 caused growth to increase by 0.0659 and 0.1174, respectively. The negative relationship between trust and growth proposed by Roth (2009) relates to the possible adverse effects of collective action. Olson (1982) argued that collective action and “collusion” (resulting from high generalized trust) could be used by a society to hamper economic reforms that could lead to improved economic performance. Thus, high interpersonal trust can negatively impact growth by reducing efficiency. Alternatively, low interpersonal trust may prevent detrimental collusions, allowing economic reforms to take place, and improving economic performance and thus growth. One must, however, be cautious with this interpretation. Confirming that this is a causal relation requires further research, maybe even on a country-by-country basis. A correlation can, however, be deduced but the arguments will differ from one country to another—below are just two examples to clarify the point.
Before the January 2011 revolution, Egypt’s growth rate was on average 2.2% during wave 4 (1999–2004), jumped to 4.2% during wave 5 (2005–2009), dropped to 0.7% during wave 6 (2010–2014) and increased to 2.9% during wave 7 (2017–2020) (World Bank 2018). From wave 4 to wave 5, Egypt’s generalized trust values dropped from 38% to 19%, increased to 22% during wave 6 and dropped to 7% during wave 7. The trust–growth relationship in Egypt is clearly an inverse one. During the years of wave 4 and specifically wave 5, Diwan (2016) explained how economic privileges were given to businessmen who supported the regime and favored firms were given the opportunity to entirely monopolize the previously liberalized economic sectors. In 2010, for instance, thirty-two businessmen closely associated with ex-president Mubarak, obtained 80% of the total credit acquired by the formal private sector and gained 60% of this sector’s overall profits, though they employed only 11% of Egypt’s labor force. This government–businessmen “collusion” simultaneously caused growth on one hand but lowered institutional/governmental trust on the other hand. Algan and Cahuc (2014) argued and showed a high positive correlation between generalized trust and the quality of institutions. Rothstein and Stolle (2008) have also shown that the integrity of institutions and their transparency are among the principal influencers of generalized trust. This could explain the significant drop in trust values in Egypt during wave 5. The Egyptian revolution itself was a result of the dissatisfaction of Egyptians with their most important institutions; their government, the judiciary and the police, and explains their revolution slogan “Bread, Freedom and Social Justice.” During the years of wave 6, understandably, growth dropped because of the political instability and the lack of investment at the time, but trust values increased since Egypt was going through a democratic transition, which positively impacted institutional trust. During the years of wave 7, a military figure in power, president Sisi was able to carry out economic reforms financed by the IMF, which explains the increased growth. Being less democratic thus allowed fierce subsidy cuts and other needed structural changes. However, this was coupled with lower generalized trust values that signified lack of institutional trust, probably a result of the government–military “collusion” or declining levels of democracy. The Arab Barometer (2020) showed that trust in the military, the judiciary and the government had significantly even lower values in 2019 compared to 2011. To summarize, the relatively high growth rates in Egypt in waves 5 and 7 are to a great extent due to the government–businessmen collusion and government–military collusion, respectively, and not in themselves a resultant of low generalized trust. These collusions are what led to the reduction in institutional trust, which is highly correlated to low generalized trust.
Another example is that of oil rich Iraq, which had average growth rates equal to 2.9% in waves 4 and 5 and reaching 3.7% in wave 6, but which were coupled with dwindling trust values starting at 47% in wave 4 and reaching 11% in wave 7. This inverse trust–growth association in Iraq tells a slightly different story than that of Egypt. Iraq’s high growth rates, which reached 13% in 2016 (CIA 2021) are due to its structural characteristic as a state-run economy that depends primarily on its oil sector, and which represents 85% of the government revenue and 80% of its foreign exchange earnings (CIA 2021). Simultaneously, the civil war and the political turmoil in Iraq are but a reflection of lack of institutional trust and consequently low generalized trust.
4.4. The Democracy–Trust Model
To gain an even better understanding of the impact of trust on growth of the MENA countries, which are considered nondemocratic, the association between democracy and trust referred to earlier is tested, and a democracy–trust interaction term was generated. However, since it is always advisable for interaction terms to include at least one binary variable, Democ was replaced by Democ2. It took the value of 1 if Democ (the democracy index of a country) is greater than 60 and 0 if 60 or below. The EIU regards a country as a full democracy if its democracy index is above 80, a flawed democracy if its democracy index is greater than 60 and reaches up to 80, a hybrid democracy if its democracy index is greater than 40 and reaches up to 60, and an authoritarian country if its democracy index is equal or below 40. Democ2 was then multiplied by Trust to get the interaction term.
As shown in Table 2d, when Democ2 and Democ2_Trust were both included in the same regression (results not shown), the VIF score was greater than 10, signifying multicollinearity, and so Democ2 was dropped from the regression. The new VIF scores in Table 2e are all below 10 and there are no issues regarding heteroskedasticity (prob. chi-sq. = 0.23), no omitted variable bias (p-value = 0.14) and no endogeneity (see Table A8).
The results of this new regression are shown in Table 1, column 4. Compared to column 1, there are almost no mentionable changes in the signs and the significance of the coefficients of all the variables as well as the adjusted R-square value. Regarding Trust, its coefficient is both positive and significant, suggesting that trust in nondemocratic (hybrid and authoritarian) countries has a positive effect on their economic growth, and that a one-unit increase in trust would increase growth in those nondemocratic countries by 0.0602 units. This finding supports that of Knack and Keefer (1997) and Lopes and Rivera-Castro (2018) in that trust is very important to developing and nondemocratic countries. Democ2_Trust, however, has a negative and significant coefficient, indicating that the effect of trust on democratic countries’ growth is significantly less (by 0.0350) than in nondemocratic countries, with 99% confidence. This means that democratic societies’ growth is hurt when compared to their nondemocratic counterparts because of their high generalized trust scores, because they are more attentive to redistributive pressures. This resonates well with the findings of Lopes and Rivera-Castro (2018). The overall effect of trust on democratic countries’ growth is still positive though (equal to 0.0252), suggesting that trust still has a positive impact on democratic countries’ growth but with diminishing returns. This echoes the finding regarding Dvlpd_Trust, discussed earlier, where the overall trust effect on growth was 0.0272.
A closer look at the economic and political country classifications in Table A2 in Appendix A shows that all developed countries are democratic, almost all MENA, developing African and transition countries are nondemocratic (or not consistently democratic), and almost half of the developing Asian and developing American countries are nondemocratic. In other words, the majority of democratic countries are the developed countries (64%), while the sweeping majority of the nondemocratic countries are the developing countries (74%). This provides a solid confirmation that the two different country classifications are to a great extent similar and that the same results regarding the trust–growth relationship would still hold. They both look at the same issue but from slightly different angles and they both reached the same conclusion; Trust is important for growth in developing and nondemocratic countries and also for developed democratic countries, but it exhibits diminishing returns in the latter.
One of the limitations of this study is the small number of countries for which data is available in all four of the waves studied, especially those belonging to the MENA region, which might have affected the results. As highlighted earlier, survey-based generalized trust measures have many shortcomings including their relatively poor coverage over time; however, they are reliable and valid (OECD 2017) and through including them in official surveys as recommended by OECD, they would eventually provide better country and year coverage and would consequently become very good macroeconomic predictors.
5. Conclusions
So, what do all the above results indicate with respect to the trust–growth nexus in MENA countries? The impact of trust on MENA countries’ growth is the weakest when compared to other country classifications. The overall negative effect is very small and can be considered negligible. Regarding the MENA-wave-specific model, the impact of trust on MENA’s growth during wave 4 is almost negligible, is not significantly different than that of developing Asian countries during wave 5, and is negative and significant during waves 6 and 7, resulting in a sizable reversal of the overall relationship between trust and growth from being positive during wave 5 to becoming negative. The examples from Egypt and Iraq show, however, that this relationship is most probably a correlation rather than a causation. Regarding the democracy–trust conjunction, no definitive conclusion could be inferred from the fourth model’s specification about this relationship in MENA in specific. In general, what could be concluded is that trust in nondemocratic countries have showed a positive impact on those countries’ growth. The results above thus imply that although a few MENA countries were able to grow with their dwindling trust values, this might not be sustainable since a virtuous trust–growth nexus has been firmly established in both developing and nondemocratic countries. Moreover, the declining trust values for the MENA countries would probably cause ill effects in the fabric of their societies and would have other adverse effects on their economies, especially in the long run. These issues require thus further investigation as to the reasons and impact of their effects from sociological, economic, and political perspectives.
Resting on the argument that trust changes and is affected by the environment (Putnam 2000), as evidenced in Figure 1, there is room for policies that could increase trust in general and in MENA countries in particular. One of these policies is related to boosting institutional trust through improving the transparency and integrity of institutions. An even more important policy is related to education programs that should encourage horizontal rather than vertical teaching practices, whereby, the relationships among students would become the main focus in the classroom and the primary emphasis would be on students working together in groups, which would strengthen the cooperation among the new generations, augment social capital and thus increase generalized trust (Algan 2018).
Author Contributions
Conceptualization, R.S.M. and M.A.; Data curation, R.S.M. and M.A.; Formal analysis, Rania Miniesy; Investigation, R.S.M. and M.A.; Methodology, R.S.M. and M.A.; Validation, R.S.M.; Writing—original draft, R.S.M. and M.A.; Writing—review & editing, Rania Miniesy. All authors have read and agreed to the published version of the manuscript.
Funding
This research received no external finding.
Acknowledgments
The authors would like to thank John Adams for comments on an earlier version of this paper. They would also like to thank Alaa Abdelaziz Mohamed Ramadan and Hossameldin Ahmed for answering all their econometric inquires.
Conflicts of Interest
The authors declare no conflict of interest.
Appendix A

Table A1.
Generalized trust mean values with number of observations per country classification per wave.
Table A1.
Generalized trust mean values with number of observations per country classification per wave.
| Classification of Countries | 4th Wave | 5th Wave | 6th Wave | 7th Wave | ||||
|---|---|---|---|---|---|---|---|---|
| (1999–2004) | (2005–2009) | (2010–2014) | (2017–2020) | |||||
| Mean | # of Surveyed People | Mean | # of Surveyed People | Mean | # of Surveyed People | Mean | # of Surveyed People | |
| MENA | 32.9 | 16,516 | 19.32 | 11,819 | 18.86 | 16,827 | 12.39 | 9925 |
| Dvlg Asia | 31.07 | 12,414 | 32.94 | 11,901 | 30.05 | 15,688 | 25.97 | 20,187 |
| Dvlg Afr | 12.76 | 8198 | 12.37 | 9109 | 13.64 | 9868 | 9 | 3682 |
| Dvlg Am | 16.88 | 10,306 | 13.13 | 10,505 | 10.91 | 12,778 | 9.43 | 14,094 |
| Transition | 19.11 | 7562 | 19.58 | 6799 | 21.28 | 11,839 | 18.83 | 22,279 |
| Dvlpd | 36.45 | 9416 | 34.77 | 26,409 | 35.65 | 19,408 | 36.9 | 53,709 |
Table A2.
List of countries in the sample. Economic development country classification is based on that of UNCTAD (United Nations Conference on Trade and Development). Democracy country classification (Democ2) is based primarily on data from EIU.
Table A2.
List of countries in the sample. Economic development country classification is based on that of UNCTAD (United Nations Conference on Trade and Development). Democracy country classification (Democ2) is based primarily on data from EIU.
| MENA (Dem) | DvgAsia(Dem) | DvgAfr (Dem) | DvgAm (Dem) | Transition (Dem) | Dvlpd (Dem) |
|---|---|---|---|---|---|
| Algeria (0) | Bangladesh (*) | BurkinFaso (0) | Argentina (1) | Albania (0) | Andorra (.) |
| Egypt (0) | China (0) | Ethiopia a (0) | Bolivia (0) | Armenia (0) | Australia (1) |
| Iran (0) | HongKonga (*) | Ghana (*) | Brazil (1) | Azerbaijan (0) | Austria (1) |
| Iraq (0) | India (1) | Mali (0) | Chile (1) | Belarus (0) | Bulgaria (1) |
| Jordan (0) | Indonesia (1) | Nigeria (0) | Colombia (1) | Bos.& Herzeg.(0) | Canada (1) |
| Kuwait (0) | Macaoa (.) | Rwanda (0) | Ecuador (*) | Georgia (0) | Croatia (1) |
| Lebanon (0) | Malaysia (1) | S. Africa (1) | Guatemala (*) | Kazakhstan (0) | Cyprus (1) |
| Libya a (0) | Myanmar (0) | Tanzania (0) | Haitia (0) | Kyrgyzstan (0) | Czech Rep. (1) |
| Morocco (0) | Pakistan (0) | Uganda (0) | Mexico (1) | Macedonia (*) | Denmark (1) |
| Palestine a (0) | Philippines (1) | Zambia (0) | Nicaragua (0) | Moldova (1) | Estonia (1) |
| Qatar (0) | Singapore (0) | Zimbabwe (0) | Peru (1) | Montenegro a (*) | Finland (1) |
| S. Arabia (0) | S. Korea (1) | Trin.&Tob. (1) | Russia (0) | France (1) | |
| Tunisia (*) | Taiwana (1) | Uruguay (1) | Serbia (1) | Germany (1) | |
| Turkey (0) | Thailand (1) | Venezuela (0) | Tajikistan a (0) | Greece (1) | |
| Yemen (0) | Vietnam (0) | Ukraine (*) | Hungary (1) | ||
| Uzbekistan a (0) | Iceland a (1) | ||||
| Israel (1) | |||||
| Italy (1) | |||||
| Japan (1) | |||||
| Lithuania (1) | |||||
| Netherlands (1) | |||||
| N. Zealand (1) | |||||
| Norway (1) | |||||
| Poland (1) | |||||
| Puerto Rico a (1) | |||||
| Romania (1) | |||||
| Slovakia (1) | |||||
| Slovenia (1) | |||||
| Spain (1) | |||||
| Sweden (1) | |||||
| Switzerland (1) | |||||
| UK (1) | |||||
| USA (1) |
Note: a Countries automatically dropped because of missing variables. * Countries do not have consistent Democ2 score across waves.
Table A3.
Summary of variables used, their definitions, expected signs, and data sources.
| Determinates of Growth | Variable | Variable Definition | Expected Sign | Data Sources |
|---|---|---|---|---|
| Dependent Variable | Growth | The growth rate of real GDPPC (measured in constant (2010) US dollars) during each observation window | NA | World Development Indicators (WDI) |
| Trust (Indep. Variable) | Trust | % of respondents who answered that most people can be trusted | +ve | WVS (Inglehart et al. 2014–2020) |
| Initial Level of GDPPC (Control Variable) | GDPPCt−5 | The first value of real GDPPC (measured in constant (2010) US dollars) in the observation window of each country | −ve | WDI |
| Inflation (Control Variable) | Infl | The annual percentage change in the price of the average consumer’s goods basket | −ve | WDI |
| Life Expectancy (Control Variable) | Lexpec | Life expectancy of individuals in years | Ambiguous | WDI |
| Schooling Attain. (Control Variable) | Schooling | Average years of schooling for those above 25 years old | +ve | Barro and Lee (2010) & Human Development Report |
| Investment (Control Variable) | Inv | Share of investment in GDP | +ve | WDI |
| Military Expend. (Control Variable) | Military | Share of military expenditure as a percentage of GDP | Ambiguous | WDI |
| Price of Invest. Goods (Control Variable) | POI | Price level of investment goods relative to the US prices | −ve | Penn World Table (PWT) 9 (Feenstra et al. 2015) |
| Trade Openness (Control Variable) | Openness | The share of trade in GDP | +ve | WDI |
| Rule of Law (Control Variable) | RLW | The perception of individuals to the extent of confidence in rules, enforcement of contracts, courts and police. It takes the value between −2.5 and +2.5 | +ve | Worldwide Governance Indicators |
| Democracy (Control Variable) | Democ | Democracy index expresses the quality of democracies as a number between 0 and 100 | Ambiguous | EIU |
Table A4.
Descriptive statistics of all variables, including all the interaction terms.
| Variable | Obs. | Mean | Std. Dev | Min | Max |
|---|---|---|---|---|---|
| Growth | 229 | 2.53 | 2.37 | −6.81 | 10.88 |
| GDPPCt−5 | 229 | 17,040.42 | 19,269.65 | 232.78 | 91,549.04 |
| Infl | 223 | 6.12 | 13.00 | −0.49 | 174.21 |
| Lexpec | 228 | 73.84 | 7.35 | 44.57 | 84.81 |
| Schooling | 229 | 9.27 | 2.88 | 1.25 | 14.10 |
| Inv | 228 | 0.23 | 0.06 | 0.06 | 0.43 |
| Military | 215 | 2.06 | 1.35 | 0.36 | 9.97 |
| POI | 227 | 0.63 | 0.25 | 0.11 | 1.54 |
| Openness | 226 | 83.63 | 56.96 | 13.75 | 396.04 |
| RWL | 229 | 0.18 | 1.00 | −1.75 | 2.04 |
| Democ | 227 | 61.42 | 20.21 | 18.74 | 98.80 |
| Trust | 232 | 24.91 | 16.36 | 2.10 | 73.90 |
| MENA_Trust | 232 | 3.07 | 8.79 | 0 | 50.50 |
| DvlgAfr_Trust | 232 | 1.01 | 3.79 | 0 | 25.30 |
| DvlgAm_Trust | 232 | 1.75 | 4.82 | 0 | 24.60 |
| Transition_Trust | 232 | 2.79 | 7.56 | 0 | 40.00 |
| Dvlpd_Trust | 232 | 11.33 | 19.54 | 0 | 73.90 |
| MENAW4_Trust | 232 | 1.13 | 6.57 | 0 | 50.50 |
| MENAW5_Trust | 232 | 0.50 | 3.61 | 0 | 38.60 |
| MENAW6_Trust | 232 | 1.06 | 4.79 | 0 | 38.50 |
| MENAW7_Trust | 232 | 0.37 | 2.18 | 0 | 15.90 |
| Democ2 | 227 | 0.58 | 0.50 | 0 | 1.00 |
| Democ2_Trust | 227 | 15.96 | 19.36 | 0 | 73.90 |
Table A5.
Correlation matrix including the residual for module specification # 1.
| GDPPCt−5 | Infl | Lexpec | Schooling | Inv | Military | POI | Openness | RWL | Democ | Trust | e1 | |
|---|---|---|---|---|---|---|---|---|---|---|---|---|
| GDPPCt−5 | 1.00 | |||||||||||
| Infl | −0.21 | 1.00 | ||||||||||
| Lexpec | 0.59 | −0.40 | 1.00 | |||||||||
| Schooling | 0.56 | −0.19 | 0.65 | 1.00 | ||||||||
| Inv | 0.22 | −0.11 | 0.36 | 0.11 | 1.00 | |||||||
| Military | −0.16 | 0.14 | −0.06 | −0.09 | −0.02 | 1.00 | ||||||
| POI | 0.72 | −0.23 | 0.50 | 0.64 | −0.01 | −0.21 | 1.00 | |||||
| Openness | 0.10 | −0.09 | 0.24 | 0.29 | 0.22 | −0.03 | −0.03 | 1.00 | ||||
| RWL | 0.81 | −0.30 | 0.65 | 0.60 | 0.32 | −0.12 | 0.63 | 0.22 | 1.00 | |||
| Democ | 0.66 | −0.24 | 0.55 | 0.57 | 0.13 | −0.35 | 0.59 | 0.06 | 0.77 | 1.00 | ||
| Trust | 0.63 | −0.13 | 0.39 | 0.32 | 0.19 | −0.05 | 0.47 | 0.06 | 0.55 | 0.34 | 1.00 | |
| e1 | 0.00 | 0.00 | 0.00 | 0.00 | 0.00 | 0.00 | 0.00 | 0.00 | 0.00 | 0.00 | 0.00 | 1.00 |
Table A6.
Correlation matrix including the residual for module specification # 2.
| GDPPCt−5 | Infl | Lexp | Scho | Inv | Milit | POI | Open | RWL | Dem | Trust | MENA Trust | DvgAfr Trust | DvgAm Trust | Tran Trust | Dvlpd Trust | e2 | |
|---|---|---|---|---|---|---|---|---|---|---|---|---|---|---|---|---|---|
| GDPPCt−5 | 1.00 | ||||||||||||||||
| Infl | −0.21 | 1.00 | |||||||||||||||
| Lexpec | 0.59 | −0.40 | 1.00 | ||||||||||||||
| Schooling | 0.56 | −0.19 | 0.65 | 1.00 | |||||||||||||
| Inv | 0.22 | −0.11 | 0.36 | 0.11 | 1.00 | ||||||||||||
| Military | −0.16 | 0.14 | −0.06 | −0.09 | −0.02 | 1.00 | |||||||||||
| POI | 0.72 | −0.23 | 0.50 | 0.64 | −0.01 | −0.21 | 1.00 | ||||||||||
| Openness | 0.10 | −0.09 | 0.24 | 0.29 | 0.22 | −0.03 | −0.03 | 1.00 | |||||||||
| RWL | 0.81 | −0.30 | 0.65 | 0.60 | 0.32 | −0.12 | 0.63 | 0.22 | 1.00 | ||||||||
| Democ | 0.66 | −0.24 | 0.55 | 0.57 | 0.13 | −0.35 | 0.59 | 0.06 | 0.77 | 1.00 | |||||||
| Trust | 0.63 | −0.13 | 0.39 | 0.32 | 0.19 | −0.05 | 0.47 | 0.06 | 0.55 | 0.34 | 1.00 | ||||||
| MENA_Trust | −0.15 | 0.08 | −0.10 | −0.34 | 0.03 | 0.39 | −0.31 | −0.08 | −0.22 | −0.43 | 0.09 | 1.00 | |||||
| DvgAfr_Trust | −0.16 | 0.23 | −0.70 | −0.37 | −0.19 | −0.14 | −0.08 | −0.19 | −0.21 | −0.20 | −0.16 | −0.10 | 1.00 | ||||
| DvgAm_Trust | −0.16 | 0.05 | 0.06 | −0.14 | −0.13 | −0.18 | 0.00 | −0.21 | −0.14 | 0.12 | −0.23 | −0.13 | −0.10 | 1.00 | |||
| Transition_Trust | −0.21 | 0.07 | −0.08 | 0.24 | −0.19 | 0.10 | −0.01 | 0.13 | −0.28 | −0.28 | −0.04 | −0.13 | −0.10 | −0.14 | 1.00 | ||
| Dvlpd_Trust | 0.85 | −0.19 | 0.53 | 0.58 | 0.12 | −0.21 | 0.73 | 0.06 | 0.79 | 0.71 | 0.73 | −0.21 | −0.16 | −0.22 | −0.21 | 1.00 | |
| e2 | 0.00 | 0.00 | 0.00 | 0.00 | 0.00 | 0.00 | 0.00 | 0.00 | 0.00 | 0.00 | 0.00 | 0.00 | 0.00 | 0.00 | 0.00 | 0.00 | 1.00 |
Table A7.
Correlation matrix including the residual for module specification # 3.
| 1 | 2 | 3 | 4 | 5 | 6 | 7 | 8 | 9 | 10 | 11 | 12 | 13 | 14 | 15 | 16 | 17 | 18 | 19 | 20 | ||
|---|---|---|---|---|---|---|---|---|---|---|---|---|---|---|---|---|---|---|---|---|---|
| 1 | GDPPCt−5 | 1.00 | |||||||||||||||||||
| 2 | Infl | −0.21 | 1.00 | ||||||||||||||||||
| 3 | Lexpec | 0.59 | −0.40 | 1.00 | |||||||||||||||||
| 4 | Schooling | 0.56 | −0.19 | 0.65 | 1.00 | ||||||||||||||||
| 5 | Inv | 0.22 | −0.11 | 0.36 | 0.11 | 1.00 | |||||||||||||||
| 6 | Military | −0.16 | 0.14 | −0.06 | −0.09 | −0.02 | 1.00 | ||||||||||||||
| 7 | POI | 0.72 | −0.23 | 0.50 | 0.64 | −0.01 | −0.21 | 1.00 | |||||||||||||
| 8 | Openness | 0.10 | −0.09 | 0.24 | 0.29 | 0.22 | −0.03 | −0.03 | 1.00 | ||||||||||||
| 9 | RWL | 0.81 | −0.30 | 0.65 | 0.60 | 0.32 | −0.12 | 0.63 | 0.22 | 1.00 | |||||||||||
| 10 | Democ | 0.66 | −0.24 | 0.55 | 0.57 | 0.13 | −0.35 | 0.59 | 0.06 | 0.77 | 1.00 | ||||||||||
| 11 | Trust | 0.63 | −0.13 | 0.39 | 0.32 | 0.19 | −0.05 | 0.47 | 0.06 | 0.55 | 0.34 | 1.00 | |||||||||
| 12 | DvgAfr_Trust | −0.16 | 0.23 | −0.70 | −0.37 | −0.19 | −0.14 | −0.08 | −0.19 | −0.21 | −0.20 | −0.16 | 1.00 | ||||||||
| 13 | DvgAm_Trust | −0.16 | 0.05 | 0.06 | −0.14 | −0.13 | −0.18 | 0.00 | −0.21 | −0.14 | 0.12 | −0.23 | −0.10 | 1.00 | |||||||
| 14 | Transition_Trust | −0.21 | 0.07 | −0.08 | 0.24 | −0.19 | 0.10 | −0.01 | 0.13 | −0.28 | −0.28 | −0.04 | −0.10 | −0.14 | 1.00 | ||||||
| 15 | Dvlpd_Trust | 0.85 | −0.19 | 0.53 | 0.58 | 0.12 | −0.21 | 0.73 | 0.06 | 0.79 | 0.71 | 0.73 | −0.16 | −0.22 | −0.21 | 1.00 | |||||
| 16 | MENAW4_Trust | −0.10 | 0.05 | −0.08 | −0.20 | 0.07 | 0.28 | −0.22 | −0.09 | −0.10 | −0.25 | 0.16 | −0.05 | −0.07 | −0.07 | −0.11 | 1.00 | ||||
| 17 | MENAW5_Trust | −0.10 | 0.06 | −0.06 | −0.12 | 0.00 | 0.14 | −0.11 | 0.00 | −0.12 | −0.17 | 0.02 | −0.04 | −0.05 | −0.05 | −0.08 | −0.03 | 1.00 | |||
| 18 | MENAW6_Trust | −0.02 | −0.01 | −0.05 | −0.23 | −0.05 | 0.16 | −0.12 | −0.01 | −0.12 | −0.25 | −0.01 | −0.06 | −0.08 | −0.08 | −0.12 | −0.04 | −0.03 | 1.00 | ||
| 19 | MENAW7_Trust | −0.09 | 0.05 | 0.04 | −0.05 | −0.01 | 0.14 | −0.13 | −0.02 | −0.11 | −0.18 | −0.13 | −0.05 | −0.07 | −0.07 | −0.11 | −0.03 | −0.03 | −0.04 | 1.00 | |
| 20 | e3 | 0.00 | 0.00 | 0.00 | 0.00 | 0.00 | 0.00 | 0.00 | 0.00 | 0.00 | 0.00 | 0.00 | 0.00 | 0.00 | 0.00 | 0.00 | 0.00 | 0.00 | 0.00 | 0.00 | 1.00 |
Table A8.
Correlation matrix including the residual for module specification # 4.
| GDPPCt−5 | Infl | Lexpec | Schooling | Inv | Military | POI | Openness | RWL | Trust | Democ2 Trust | e4 | |
|---|---|---|---|---|---|---|---|---|---|---|---|---|
| GDPPCt−5 | 1.00 | |||||||||||
| Infl | −0.21 | 1.00 | ||||||||||
| Lexpec | 0.59 | −0.40 | 1.00 | |||||||||
| Schooling | 0.56 | −0.19 | 0.65 | 1.00 | ||||||||
| Inv | 0.22 | −0.11 | 0.36 | 0.11 | 1.00 | |||||||
| Military | −0.16 | 0.14 | −0.06 | −0.09 | −0.02 | 1.00 | ||||||
| POI | 0.72 | −0.23 | 0.50 | 0.64 | −0.01 | −0.21 | 1.00 | |||||
| Openness | 0.10 | −0.09 | 0.24 | 0.29 | 0.22 | −0.03 | −0.03 | 1.00 | ||||
| RWL | 0.81 | −0.30 | 0.65 | 0.60 | 0.32 | −0.12 | 0.63 | 0.22 | 1.00 | |||
| Trust | 0.63 | −0.13 | 0.39 | 0.32 | 0.19 | −0.05 | 0.47 | 0.06 | 0.55 | 1.00 | ||
| Democ2_Trust | 0.77 | −0.18 | 0.51 | 0.54 | 0.13 | −0.27 | 0.65 | 0.04 | 0.78 | 0.72 | 1.00 | |
| e4 | 0.00 | 0.00 | 0.00 | 0.00 | 0.00 | 0.00 | 0.00 | 0.00 | 0.00 | 0.00 | 0.00 | 1.00 |
References
- Acheboune, Amale, and Ahmed Driouchi. 2014. Unemployment Persistence, Risks of Skill Obsolescence, and Impacts on the Knowledge Economy in Arab Countries. In Knowledge-Based Economic Policy Development in the Arab World. Hershey: IGI Global, pp. 273–91. [Google Scholar]
- Aghion, Philippe, Yann Algan, and Pierre Cahuc. 2011. Can policy affect culture? Minimum wage and the quality of labor relations. The Journal of the European Economic Association 9: 3–42. [Google Scholar] [CrossRef]
- Alesina, Alberto, Sule Özler, Nouriel Roubini, and Phillip Swagel. 1996. Political stability and economic growth. Journal of Economic Growth 1: 189–211. [Google Scholar] [CrossRef] [Green Version]
- Algan, Yann. 2018. Trust and Social Capital. In For Good Measure: Advancing Research on Well-being Metrics Beyond GDP. Edited by Joseph Stiglitz, Jean-Paul Fitoussi and Martine Durand. Paris: OECD Publishing. [Google Scholar] [CrossRef]
- Algan, Yann, and Pierre Cahuc. 2010. Inherited trust and growth. The American Economic Review 100: 2060–92. [Google Scholar] [CrossRef] [Green Version]
- Algan, Yann, and Pierre Cahuc. 2014. Trust, growth and well-being: New evidence and policy implications. In Handbook of Economic Growth. Edited by Philippe Aghion and Steven Durlauf. Amsterdam: Elsevier, vol. 2, pp. 49–120. [Google Scholar]
- Arrow, Kenneth. 1972. Gifts and exchanges. Philosophy and Public Affairs 1: 343–62. [Google Scholar]
- Arab Barometer. 2020. Survey Data on Egypt from AB Wave II (2010–2011) and AB Wave V (2018–2019). Available online: www.arabbarometer.org/survey-data/ (accessed on 17 February 2021).
- Arora, Suchit. 2001. Health, human productivity, and long-term economic growth. The Journal of Economic History 61: 699–749. [Google Scholar]
- Barro, Robert. 1991. Economic growth in a cross section of countries. The Quarterly Journal of Economics 106: 407–43. [Google Scholar] [CrossRef] [Green Version]
- Barro, Robert. 1995. Inflation and Economic Growth. Working Paper No. w5326. Cambridge: National Bureau of Economic Research. [Google Scholar]
- Barro, Robert. 2003. Determinants of economic growth in a panel of countries. Annals of Economics and Finance 4: 231–74. [Google Scholar]
- Barro, Robert, and Jong Lee. 1993. International comparisons of educational attainment. Journal of Monetary Economics 32: 363–94. [Google Scholar] [CrossRef] [Green Version]
- Barro, Robert, and Jong Lee. 1994. Sources of economic growth. Carnegie-Rochester Conference Series on Public Policy 40: 1–46. [Google Scholar] [CrossRef]
- Barro, Robert, and Jong Lee. 2010. A New Data Set of Educational Attainment in the World, 1950–2010. Journal of Development Economics 104: 184–98. [Google Scholar] [CrossRef]
- Bellet, Clement, Jan-Emmanuel De Neve, and George Ward. 2020. Does Employee Happiness Have an Impact on Productivity? London: Centre for Economic Performance, LSE. [Google Scholar]
- Bertrand, Marianne, and Antoinette Schoar. 2006. The role of family in family firms. The Journal of Economic Perspectives 20: 73–96. [Google Scholar] [CrossRef] [Green Version]
- Beugelsdijk, Sjoerd, and Ton Van Schaik. 2005. Social capital and growth in European regions: An empirical test. European Journal of Political Economy 21: 301–24. [Google Scholar] [CrossRef]
- Bhargava, Alok, Dean Jamison, Lawernce Lau, and Christopher Murray. 2001. Modeling the effects of health on economic growth. Journal of Health Economics 20: 423–40. [Google Scholar] [CrossRef]
- Bjørnskov, Christian. 2006. The multiple facets of social capital. European Journal of Political Economy 22: 22–40. [Google Scholar] [CrossRef]
- Bjørnskov, Christian. 2012. How does social trust affect economic growth? Southern Economic Journal 78: 1346–68. [Google Scholar]
- Bjørnskov, Christian, and Pierre Méon. 2013. Is trust the missing root of institutions, education, and development? Public Choice 157: 641–69. [Google Scholar] [CrossRef] [Green Version]
- Blanchard, Olivier, and Andrei Shleifer. 2001. Federalism with and without Political Centralization, China Versus Russia. IMF Papers 48: 171–79. [Google Scholar]
- Blomstrom, Mangus, Robert Lipsey, and Mario Zejan. 1996. What explains the growth of developing countries? In Convergence of Productivity: Cross-National Studies and Historical Evidence. New York: Oxford University Press, pp. 243–59. [Google Scholar]
- Bloom, David, David Canning, and Pia Malaney. 2000. Population dynamics and economic growth in Asia. Population and Development Review 26: 257–90. [Google Scholar]
- Bloom, Nicholas, Raffaela Sadun, and John Van Reenen. 2012. The organization of firms across countries. The Quarterly Journal of Economics 127: 1663–1705. [Google Scholar] [CrossRef] [Green Version]
- Bruno, Michael, and William Easterly. 1995. Inflation crises and long-run growth. Journal of Monetary Economics 41: 3–26. [Google Scholar] [CrossRef] [Green Version]
- Chletsos, Michael, and Christos Kollias. 1995. The demand for Turkish military expenditure 1960–1992. Cyprus Journal of Economics 8: 64–74. [Google Scholar]
- CIA (Central Intelligence Agency). 2021. The World Factbook, Countries, Iraq. Available online: https://www.cia.gov/the-world-factbook/countries/iraq/#economy (accessed on 18 February 2021).
- Clague, Christopher, Philip Keefer, Stephen Knack, and Mancur Olson. 1996. Property and contract rights in autocracies and democracies. Journal of Economic Growth 1: 243–76. [Google Scholar] [CrossRef] [Green Version]
- Clague, Christopher, Philip Keefer, Stephen Knack, and Mancur Olson. 1999. Contract-intensive money: Contract enforcement, property rights, and economic performance. Journal of economic growth 4: 185–211. [Google Scholar] [CrossRef] [Green Version]
- Coase, Ronald. 1990. The Firm, the Market and the Law. Chicago: University of Chicago Press. [Google Scholar]
- Coleman, James. 1988. Social capital in the creation of human capital. American Journal of Sociology 94: S95–S120. [Google Scholar] [CrossRef]
- Cui, Wei. 2017. Social trust, institution, and economic growth: Evidence from China. Emerging Markets Finance and Trade 53: 1243–1261. [Google Scholar] [CrossRef]
- De Groot, Henri, Gert-Jan Linders, Piet Rietveld, and Uma Subramanian. 2004. The institutional determinants of bilateral trade patterns. Kyklos 57: 103–23. [Google Scholar] [CrossRef]
- De Long, Baradford, and Lawerence Summers. 1991. Equipment investment and economic growth. The Quarterly Journal of Economics 106: 445–502. [Google Scholar] [CrossRef]
- De Long, Bradford, and Lawerence Summers. 1993. How strongly do developing economies benefit from equipment investment? Journal of Monetary Economics 32: 395–415. [Google Scholar] [CrossRef]
- Dearmon, Jacob, and Kevin Grier. 2009. Trust and development. Journal of Economic Behavior and Organization 71: 210–20. [Google Scholar] [CrossRef]
- Dearmon, Jacob, and Kevin Grier. 2011. Trust and the accumulation of physical and human capital. European Journal of Political Economy 27: 507–19. [Google Scholar] [CrossRef]
- Dincer, Oguzhan, and Eric Uslaner. 2010. Trust and Growth. Public Choice 142: 59–67. [Google Scholar] [CrossRef]
- Diwan, Ishac. 2016. Economic Growth after the Arab Spring. Analysis and Opinions—Project Syndicate. Belfer Center. Harvard Kennedy School. Available online: https://www.belfercenter.org/publication/economic-growth-after-arab-spring (accessed on 17 February 2021).
- Dunne, Paul, and Dimitrios Vougas. 1999. Military spending and economic growth in South Africa: A causal analysis. Journal of Conflict Resolution 43: 521–37. [Google Scholar] [CrossRef]
- Dunne, Paul, Eftychia Nikolaidou, and Ron Smith. 2002. Military spending, investment and economic growth in small industrialising economies. South African Journal of Economics 70: 789–808. [Google Scholar] [CrossRef]
- Economic Intelligence Unit. 2020. Democracy Indices Dataset—v3. London: Economic Intelligence Unit. [Google Scholar]
- El-Katiri, Laura, Bassam Fattouh, and Richard Mallinson. 2014. The Arab Uprisings and MENA Political Instability–Implications for Oil & Gas Markets. MEP8. Oxford: Oxford Institute for Energy Studies. [Google Scholar]
- Feenstra, Robert, Robert Inklaar, and Marcel P. Timmer. 2015. The Next Generation of the Penn World Table. American Economic Review 105: 3150–82. [Google Scholar] [CrossRef] [Green Version]
- Frankel, Jeffrey, and David Romer. 1999. Does trade cause growth? American Economic Review 893: 379–99. [Google Scholar] [CrossRef] [Green Version]
- Fukuyama, F. 1995. Trust: The Social Virtues and the Creation of Prosperity. New York: Free Press. [Google Scholar]
- Gokal, Vikesh, and Subrina Hanif. 2004. Relationship between Inflation and Economic Growth. Working Paper. Suva: Economics Department, Reserve Bank of Fiji. [Google Scholar]
- Grossman, Gene, and Elhanan Helpman. 1991. Innovation and Growth in the World Economy. Cambridge: Harvard University Press. [Google Scholar]
- Haggard, Stephan. 1997. Democratic institutions and economic policy. In Institutions and Economic Development. Edited by Christopher Clague. Baltimore: Johns Hopkins University Press. [Google Scholar]
- Hardin, Russell. 2002. Trust and Trustworthiness. New York: Russell Sage Foundation. [Google Scholar]
- Horváth, Roman. 2013. Does Trust Promote Growth? Journal of Comparative Economics 41: 777–88. [Google Scholar] [CrossRef] [Green Version]
- Inglehart, R., C. Haerpfer, A. Moreno, C. Welzel, K. Kizilova, J. Diez-Medrano, M. Lagos, P. Norris, E. Ponarin, and B. Puranen, eds. 2014–2020. World Values Survey: Round Four, Five, Six and Seven—Country-Pooled Datafile. Madrid: JD Systems Institute, Available online: http://www.worldvaluessurvey.org/WVSDocumentationWV7.jsp and www.worldvaluessurvey.org/WVSDocumentationWV4/5/6/7.jsp. (accessed on 8 September 2020). [Google Scholar]
- Kasmaoui, Kamal, Mazhar Mughal, and Jamal Bouoiyour. 2018. Does Trust Influence Economic Growth? Evidence from the Arab World. Economics Bulletin 38: 880–91. [Google Scholar]
- Katz, Harvey, and Julian Rotter. 1969. Interpersonal trust scores of college students and their parents. Child Development 40: 657–61. [Google Scholar] [CrossRef]
- Knack, Stephen. 2001. Trust, Associational Life, and Economic Performance. Working Paper. Munich: University Library of Munich. [Google Scholar]
- Knack, Stephen. 2002. Social Capital and the Quality of Government: Evidence from the US States. American Journal of Political Science 46: 772–85. [Google Scholar] [CrossRef]
- Knack, Stephen, and Philip Keefer. 1995. Institutions and economic performance: Cross-country tests using alternative institutional measures. Economics and Politics 7: 207–27. [Google Scholar] [CrossRef]
- Knack, Stephen, and Philip Keefer. 1997. Does social capital have an economic payoff? A cross-country investigation. The Quarterly Journal of Economics 112: 1251–88. [Google Scholar] [CrossRef]
- La Porta, Rafael, Florencio Lopez-de-Silanes, Andrei Shleifer, and Robert Vishny. 1997. Trust in Large Organizations. The American Economic Review, 333–38. [Google Scholar]
- Lopes, Thiago, and Miguel Rivera-Castro. 2018. Democracy, Trust and Economic Growth. The Empirical Economics Letters 16: 1277–86. [Google Scholar]
- Lundmark, Sebastian, Mikael Gilljam, and Stefan Dahlberg. 2016. Measuring generalized trust: An examination of question wording and the number of scale points. Public Opinion Quarterly 80: 26–43. [Google Scholar] [CrossRef] [Green Version]
- Mankiw, Gregory, David Romer, and David Weil. 1992. A contribution to the empirics of economic growth. The Quarterly Journal of Economics 107: 407–37. [Google Scholar] [CrossRef]
- Naufal, George, and Carlos Vargas-Silva. 2010. Migrant transfers in the MENA region: A two way street in which traffic is changing. Migration Letters 7: 168–78. [Google Scholar] [CrossRef]
- Nelson, Richard, and Edmund Phelps. 1966. Investment in humans, technological diffusion, and economic growth. The American Economic Review 56: 69–75. [Google Scholar]
- OECD. 2017. OECD Guidelines on Measuring Trust. Paris: OECD Publishing. [Google Scholar] [CrossRef]
- Olson, Mancur. 1982. The Rise and Decline of Nations. New Haven: Yale University Press. [Google Scholar]
- Ostrom, Elinor. 1990. Governing the Commons. Cambridge: Cambridge University Press. [Google Scholar]
- Peiró-Palomino, Jesus, and Emili Tortosa-Ausina. 2013. Can trust effects on development be generalized? A response by quantile. European Journal of Political Economy 32: 377–90. [Google Scholar] [CrossRef] [Green Version]
- Persson, Perotti, and Guido Tabellini. 1992. Growth, distribution and politics. European Economic Review 36: 593–602. [Google Scholar] [CrossRef]
- Putnam, Robert. 2000. Bowling Alone: The Collapse and Revival of American Community. New York: Simon and Schuster. [Google Scholar]
- Ram, Rati. 1989. Government size and economic growth: A new framework and some evidence from cross-section and time-series data: Reply. The American Economic Review 79: 281–84. [Google Scholar]
- Ramsey, Frank. 1928. A mathematical theory of saving. The Economic Journal 38: 543–59. [Google Scholar] [CrossRef]
- Rao, Vaman. 1984. Democracy and economic development. Studies on Competitive International Development 19: 67–81. [Google Scholar] [CrossRef]
- Rice, Tom, and Jan Feldman. 1997. Civic culture and democracy from Europe to America. The Journal of Politics 59: 1143–72. [Google Scholar] [CrossRef]
- Roth, Felix. 2009. Does too much trust hamper economic growth? Kyklos 62: 103–28. [Google Scholar] [CrossRef]
- Rothstein, Bo, and Dietlind Stolle. 2008. The state and social capital: An institutional theory of generalized trust. Comparative Politics 40: 441–67. [Google Scholar] [CrossRef]
- Sachs, Jeffrey, and Andrew Warner. 1995. Natural Resource Abundance and Economic Growth. Working Paper No. w5398. Cambridge: National Bureau of Economic Research. [Google Scholar]
- Sachs, Jeffrey, and Andrew Warner. 1997. Fundamental sources of long-run growth. The American Economic Review 87: 184–88. [Google Scholar]
- Schmidt, Katja. 2003. Is Trust Important for Economic Development and Growth? Berlin Disponível Science and Politics 28: 664–83. [Google Scholar]
- Solow, Robert. 1956. A contribution to the theory of economic growth. The Quarterly Journal of Economics 70: 65–94. [Google Scholar] [CrossRef]
- Spierings, Niels. 2019. Social Trust in the Middle East and North Africa: The Context-Dependent Impact of Citizens’ Socio-Economic and Religious Characteristics. European Sociological Review 35: 894–911. [Google Scholar] [CrossRef]
- Tavares, Jose, and Romain Wacziarg. 2001. How democracy affects growth. European Economic Review 45: 1341–78. [Google Scholar] [CrossRef]
- Taylor, Alan. 1994. Domestic Saving and International Capital Flows Reconsidered. Working Paper No. 4892. Cambridge: National Bureau of Economic Research. [Google Scholar]
- Temple, Jonathan. 2001. Generalizations that aren’t? Evidence on education and growth. European Economic Review 45: 905–18. [Google Scholar] [CrossRef]
- Uslaner, Eric. 2008. The foundations of trust: Macro and micro. Cambridge Journal of Economics 32: 289–94. [Google Scholar] [CrossRef]
- Uslaner, Eric. 2012. Generalized Trust Questions. In Improving Public Opinion Surveys: Interdisciplinary Innovation and the American National Election Studies. Edited by John H. Aldrich and Kathleen M. McGraw. Princeton: Princeton University Press, pp. 101–14. [Google Scholar]
- Uslaner, Eric. 2015. Measuring generalized trust: In defense of the ‘standard’ question. In Handbook of Research Methods on Trust. Cheltenham: Edward Elgar Publishing. [Google Scholar]
- Volland, Benjamin. 2010. Trust, Confidence and Economic Growth: An Evaluation of the Beugelsdijk Hypothesis. Jena Economic Research Papers 2010,080. Jena: Friedrich Schiller University Jena and Max Planck Institute of Economics. [Google Scholar]
- Whitely, Paul. 2000. Economic growth and social capital. Political Studies 48: 443–66. [Google Scholar] [CrossRef]
- World Bank. 2018. World Development Indicators. Washington: World Bank. [Google Scholar]
- Zak, Paul, and Stephen Knack. 2001. Trust and growth. The Economic Journal 111: 295–321. [Google Scholar] [CrossRef]
Figure 1.
Generalized trust mean values by country classification and wave.

Table 1.
Results for the general model and the models with different trust interactions.
| Dependent Var. | Coef. | Coef. | Coef. | Coef. | ||||
|---|---|---|---|---|---|---|---|---|
| Growth | (1) | (2) | (3) | (4) | ||||
| GDPPCt−5 | −0.0001 | *** | −0.0001 | *** | −0.0001 | *** | −0.0001 | *** |
| (0.0000) | (0.0000) | (0.0000) | (0.0000) | |||||
| Infl | −0.0580 | *** | −0.0535 | *** | −0.0528 | *** | −0.0556 | *** |
| (0.0113) | (0.0113) | (0.0112) | (0.0113) | |||||
| Lexpec | −0.0949 | *** | −0.0802 | * | −0.0625 | −0.0969 | *** | |
| (0.0298) | (0.0442) | (0.0443) | (0.0293) | |||||
| Schooling | 0.1784 | ** | 0.0925 | 0.0737 | 0.1971 | *** | ||
| (0.0771) | (0.0905) | (0.0900) | (0.0762) | |||||
| Inv | 5.9858 | ** | 4.5016 | * | 3.5803 | 5.2405 | ** | |
| (2.4689) | (2.5154) | (2.4999) | (2.4505) | |||||
| Military | −0.2577 | ** | −0.2070 | * | −0.2131 | * | −0.3131 | *** |
| (0.1123) | (0.1162) | (0.1146) | (0.1082) | |||||
| POI | −0.8394 | −0.7602 | −0.8042 | −0.8440 | ||||
| (0.9451) | (1.0087) | (1.0018) | (0.9341) | |||||
| Openness | 0.0037 | 0.0017 | 0.0017 | 0.0026 | ||||
| (0.0033) | (0.0033) | (0.0033) | (0.0033) | |||||
| RWL | 0.5417 | * | 0.6808 | ** | 0.6656 | ** | 0.7282 | ** |
| (0.3178) | (0.3296) | (0.3254) | (0.2951) | |||||
| Democ | −0.0090 | −0.0105 | −0.0162 | |||||
| (0.0124) | (0.0138) | (0.0138) | ||||||
| Trust | 0.0429 | *** | 0.0607 | *** | 0.0547 | *** | 0.0602 | *** |
| (0.0107) | (0.0139) | (0.0139) | (0.0124) | |||||
| MENA_Trust | −0.0667 | *** | ||||||
| (0.0191) | ||||||||
| DvlgAfr_Trust | −0.0389 | −0.0367 | ||||||
| (0.0615) | (0.0610) | |||||||
| DvlgAm_Trust | −0.0489 | −0.0581 | ||||||
| (0.0355) | (0.0352) | |||||||
| Transition_Trust | 0.0056 | 0.0017 | ||||||
| (0.0250) | (0.0248) | |||||||
| Dvlpd_Trust | −0.0335 | * | −0.0336 | * | ||||
| (0.0196) | (0.0193) | |||||||
| MENAW4_Trust | −0.0528 | ** | ||||||
| (0.0222) | ||||||||
| MENAW5_Trust | −0.0213 | |||||||
| (0.0361) | ||||||||
| MENAW6_Trust | −0.1206 | *** | ||||||
| (0.0307) | ||||||||
| MENAW7_Trust | −0.1721 | *** | ||||||
| (0.0616) | ||||||||
| Democ2_Trust | −0.0350 | ** | ||||||
| (0.0152) | ||||||||
| _cons | 8.4658 | *** | 8.6085 | *** | 8.2073 | *** | 8.2871 | *** |
| (2.0514) | (3.1239) | (3.1027) | (1.9170) | |||||
| Number of obs. | 214 | 214 | 214 | 214 | ||||
| F (11, 202) = | 10.38 | F (16, 197) = 8.62 | F (19, 194) = 7.96 | F (11, 202) = 11.06 | ||||
| Prob > F | 0 | 0 | 0 | 0 | ||||
| R-squared | 0.36 | 0.41 | 0.44 | 0.38 | ||||
| Adj R-squared | 0.33 | 0.36 | 0.38 | 0.34 | ||||
| Root MSE | 1.94 | 1.88 | 1.85 | 1.92 | ||||
Note: (1) Standard errors are between parentheses. (2) ***, **, * represent significance level at 1%, 5%, and 10% respectively.
Table 2.
All Variance Inflation Factor (VIF) values for all carried regressions.
| a | c | d | ||||||
| Variable | VIF | 1/VIF | Variable | VIF | 1/VIF | Variable | VIF | 1/VIF |
| RWL | 5.52 | 0.18 | Dvlpd_Trust | 9.09 | 0.11 | Democ2_Trust | 10.11 | 0.10 |
| GDPPCt−5 | 4.39 | 0.23 | Lexpec | 6.48 | 0.15 | RWL | 4.90 | 0.20 |
| Democ | 3.48 | 0.29 | RWL | 6.32 | 0.16 | GDPPCt−5 | 4.54 | 0.22 |
| POI | 3.08 | 0.32 | GDPPCt−5 | 5.33 | 0.19 | Democ2 | 4.11 | 0.24 |
| Schooling | 2.77 | 0.36 | Democ | 4.71 | 0.21 | Trust | 3.89 | 0.26 |
| Lexpec | 2.68 | 0.37 | Schooling | 4.13 | 0.24 | POI | 3.24 | 0.31 |
| Trust | 1.78 | 0.56 | POI | 3.78 | 0.26 | Schooling | 2.86 | 0.35 |
| Inv | 1.40 | 0.72 | Trust | 3.27 | 0.31 | Lexpec | 2.75 | 0.36 |
| Openness | 1.33 | 0.75 | DvlgAfr_Trust | 3.13 | 0.32 | Inv | 1.41 | 0.71 |
| Military | 1.31 | 0.77 | Transition_Trust | 2.09 | 0.48 | Openness | 1.34 | 0.75 |
| Infl | 1.28 | 0.78 | DvlgAm_Trust | 1.78 | 0.56 | Infl | 1.29 | 0.78 |
| Mean VIF | 2.64 | Inv | 1.57 | 0.64 | Military | 1.29 | 0.78 | |
| Military | 1.49 | 0.67 | Mean VIF | 3.48 | ||||
| MENAW4_Trust | 1.43 | 0.70 | ||||||
| b | Openness | 1.39 | 0.72 | e | ||||
| Variable | VIF | 1/VIF | MENAW6_Trust | 1.36 | 0.73 | Variable | VIF | 1/VIF |
| Dvlpd_Trust | 9.02 | 0.11 | Infl | 1.35 | 0.74 | Democ2_Trust | 4.95 | 0.20 |
| RWL | 6.28 | 0.16 | MENAW7_Trust | 1.21 | 0.83 | RWL | 4.87 | 0.21 |
| Lexpec | 6.25 | 0.16 | MENAW5_Trust | 1.14 | 0.88 | GDPPCt−5 | 4.43 | 0.23 |
| GDPPCt−5 | 5.18 | 0.19 | Mean VIF | 3.21 | POI | 3.08 | 0.32 | |
| Democ | 4.60 | 0.22 | Schooling | 2.77 | 0.36 | |||
| Schooling | 4.05 | 0.25 | Lexpec | 2.65 | 0.38 | |||
| POI | 3.71 | 0.27 | Trust | 2.45 | 0.41 | |||
| Trust | 3.17 | 0.32 | Inv | 1.41 | 0.71 | |||
| DvlgAfr_Trust | 3.09 | 0.32 | Openness | 1.32 | 0.75 | |||
| Transition_Trust | 2.07 | 0.48 | Infl | 1.29 | 0.78 | |||
| MENA_Trust | 1.80 | 0.56 | Military | 1.24 | 0.81 | |||
| DvlgAm_Trust | 1.75 | 0.57 | Mean VIF | 2.77 | ||||
| Inv | 1.54 | 0.65 | ||||||
| Military | 1.48 | 0.68 | ||||||
| Openness | 1.38 | 0.73 | ||||||
| Infl | 1.34 | 0.74 | ||||||
| Mean VIF | 3.54 | |||||||
Publisher’s Note: MDPI stays neutral with regard to jurisdictional claims in published maps and institutional affiliations. |
© 2021 by the authors. Licensee MDPI, Basel, Switzerland. This article is an open access article distributed under the terms and conditions of the Creative Commons Attribution (CC BY) license (http://creativecommons.org/licenses/by/4.0/).
Share and Cite
MDPI and ACS Style
Miniesy, R.S.; AbdelKarim, M. Generalized Trust and Economic Growth: The Nexus in MENA Countries. Economies 2021, 9, 39. https://0-doi-org.brum.beds.ac.uk/10.3390/economies9010039
AMA Style
Miniesy RS, AbdelKarim M. Generalized Trust and Economic Growth: The Nexus in MENA Countries. Economies. 2021; 9(1):39. https://0-doi-org.brum.beds.ac.uk/10.3390/economies9010039
Chicago/Turabian StyleMiniesy, Rania S., and Mariam AbdelKarim. 2021. "Generalized Trust and Economic Growth: The Nexus in MENA Countries" Economies 9, no. 1: 39. https://0-doi-org.brum.beds.ac.uk/10.3390/economies9010039
Note that from the first issue of 2016, this journal uses article numbers instead of page numbers. See further details here.