
R&D Investment, Financial and Environmental Performance Nexuses via Bootstrap Fourier Quantiles Granger Causality Test


Department of Accounting, Chaoyang University of Technology, Taichung 41349, Taiwan
Economies 2021, 9(2), 85; https://0-doi-org.brum.beds.ac.uk/10.3390/economies9020085
Submission received: 5 April 2021
/
Revised: 20 May 2021
/
Accepted: 24 May 2021
/
Published: 28 May 2021
(This article belongs to the Special Issue Challenges in Environmental and Resource Economics)
Abstract
:This study investigated the relationship between R&D investments and financial and environmental performance. The direction, size, and significance of various phases of these variables were generated using the bootstrap Fourier quantiles Granger causality test. In our results, a positive relationship between R&D investment and CO2 emission reductions was found at two tails of quantiles. Additionally, we observed a significantly positive relationship between financial performance and CO2 emission reductions at the 0.5 quantile and above. The correlation between R&D investment and financial performance was identified to be positive under the 0.3, 0.4, 0.5 and 0.9 quantiles and negative under the 0.5 and 0.6 quantiles. The changing linkages among R&D investment, environmental performance and financial performance found in this study provide important information for policy makers, aiding in the development of R&D strategies to upgrade financial and environmental performance simultaneously.
1. Introduction
When considering the influence of CO2 emissions on global warming, it is usually accepted that firms play a key role in emitting high levels of air contaminants through the manufacturing process (Busch and Hoffmann 2011). Widespread social concerns about this issue have pushed firms to find out ways of reducing their CO2 emissions. Nevertheless, firms have encountered ostensible dilemmas relating to potential advantages and disadvantages. On the one hand, decreasing CO2 emissions may not only create a cost burden for firms, but may also be harmful to competitiveness; on the other hand, it may save costs and improve efficiency (Hart and Ahuja 1996). Thus, the basic issue currently facing firms is how to develop strategies to upgrade firms’ environmental performance (FEP) as well as financial performance (FFP) simultaneously.
Moreover, innovation is a strategy, i.e., several firms have lowered CO2 emissions, upgraded competitiveness and improved FFP concurrently (Triguero et al. 2013). For this reason, this innovation is a key outcome of firms’ research and development (R&D) investments; R&D investment has a positive influence on FFP simultaneously (Scarpellini et al. 2019; Duque-Grisales et al. 2020; Ezhilarasi and Kabra 2020). Relevant green R&D investment not only reduces CO2 emissions, upgrading FEP (Samsul et al. 2019), it also improves FFP (Lee and Min 2015) and firm value (Ganda 2018). In summary, previous studies conclude that the greater the R&D investment, the greater the CO2 emission reduction (better FEP). However, Duque-Grisales et al. (2020) state that green R&D investment is not associated with better FFP.
Additionally, prior studies have focused on how FEP responds to FFP, using CO2 emissions as a proxy for FEP with respect to corporate social responsibility. Several studies have revealed the negative nexus between CO2 emissions (FEP) and FFP (Liu et al. 2017; Moneva and Ortas 2010; Clarkson et al. 2011; Gallego-Álvarez et al. 2015), especially during the pre-financial crisis period (Muhammad et al. 2015). Other studies have revealed negative associations between CO2 emission and firm value (Saka and Oshika 2014; Matsumura et al. 2013). However, several studies have disclosed a negative nexus between FEP and FFP (Liang and Liu 2017) or firm value (Chang 2015). Others have found no such relationships (Lucato et al. 2017), including during the financial crisis (Muhammad et al. 2015). In addition, some have investigated the causal nexus between FEP and FFP; Endrikat et al. (2014) have shown not only that this causal direction might be reversed, i.e., from FFP to FEP, but also that this nexus is positive and partially bidirectional. Hence, to date, relevant studies of the relationship between FEP and FFP have not reached consistent conclusions.
This study examined the nexus between R&D investment, FEP (CO2 emissions) and FFP in Taiwan using a novel bootstrap Fourier quantiles Granger causality test (BFQGCT) and data from 2005 to 2018. To date, this BFQGCT study is the first to provide a deep analysis of the influence of direction and size, as well as their significance in various phases of these trivariate relations. The empirical results show that the greater the R&D investment, the greater the CO2 emission reduction under 0.2, 0.3, 0.7, 0.8 and 0.9 quantiles, separately; meanwhile, the greater the reduction in CO2 emissions, the better the FFP under 0.5, 0.6, 0.8 and 0.9 quantiles; the more R&D investment, the better the FFP under 0.3, 0.4, 0.5 and 0.9 quantiles, respectively; moreover, the better the FFP, the less R&D investment under 0.5 and 0.6 quantiles, individually. Hence, understanding the causality nexus, as well as pathways among R&D investment, FEP and FFP, may have special significance for policy makers, helping to understand how R&D strategies can upgrade FEP and FFP concurrently.
This study is organized as follows: The next section discusses the literature review. The subsequent section proposes the new bootstrap Fourier quantiles Granger causality test. We then describe the data used in the study; then, the empirical results are offered. The last section contains the proposals and conclusions of this study.
2. Literature Review
Despite the huge number of studies regarding the R&D investment–FEP–FFP nexus for various countries over various periods, varying outcomes continue to be observed and the whole picture remains unclear. The trivariable nexus is conventionally analyzed in three parts: R&D investment–FEP, R&D investment–FFP and FEP–FFP. For the first strand of the literature, Lee and Min (2015) indicate the influence of green R&D investment in eco-innovation with regard to FEP and FFP in Japanese manufacturing between 2001 and 2010, finding a negative nexus between CO2 emissions and green R&D, although the latter was positively associated with FFP. Using firm-level data from G6 countries between 2004 and 2016, Samsul et al. (2019) showed that R&D investment upgrades FEP. Utilizing data from 181 technology-industry firms in Taiwan, Huang and Jim Wu (2010) reveal that FEP in green commodity initiatives displayed a positive influence on FFP. Examining the nexus between FFP and green initiatives, as well as FEP, Chen et al. (2018) found that green initiatives displayed a positive effect upon green FEP, which in turn exerted a positive influence on FFP. Nevertheless, the influence of green initiatives varies by nation. Firms in Canada, as well as European nations, have linked green initiatives and FEP, as well as in Japan and USA. Hong Kong and China lag behind compared to other nations. Tariq et al. (2019) found that the higher the green commodity innovation performance, the higher the FFP in Thai manufacturing firms.
Several pieces of empirical evidence of a nexus between R&D investment and FFP exist. Lin (2017) found that R&D investment has a positive link with a firm’s value in a study of firms engaging in social responsibility in Taiwan. Ganda (2018) reported a positive nexus between Green R&D and firm value in an analysis of 14 South African mining companies. Analyzing green patents and R&D intensity, with the aim of discovering the factors leading to successful eco-innovation procedures in Spain and in the EU, Scarpellini et al. (2019) proposed a positive nexus between eco-innovation activity and R&D intensity in firms. Meanwhile, relevant results show the impact of implementing innovation on FFP. Ezhilarasi and Kabra (2020) found that R&D investment has a positive influence on FFP. Duque-Grisales et al. (2020) reported that a positive moderating effect of R&D investment on the nexus between FFP and green innovation was exhibited in firms with increasing R&D investments, analyzing 86 listed firms in emerging transnational markets in Latin America.
Some studies have specified whether it pays to be green, thus concentrating on the nexus between FEP and FFP. Clarkson et al. (2011) addressed the question ‘‘Does it pay to be green?’’ among the four most polluting industries in the US, showing that firms which upgraded their FEP in the previous period resulted in improving their FFP in the following periods. Busch and Hoffmann (2011) reported that when using CO2 emissions as an outcome-based approach, FEP pays off. Contrarily, using CO2 control according to a procedure-based method, they observed a negative nexus between the FEP and FFP among the 2500 biggest firms by market capitalization in the Dow Jones Global Index. Matsumura et al. (2013) indicated that on average, for each extra million kilograms of CO2 emissions, company value is reduced by USD 212,000 for S&P 500 corporations. A negative nexus between CO2 emissions and FFP was found to exist in the UK (Liu et al. 2017) for 89 international firms (Gallego-Álvarez et al. 2015) during the pre-financial crisis period (Muhammad et al. 2015). Molina-Azorín et al. (2009) reviewed 32 studies to examine the influence of FEP on FFP. The results were varied, but studies in which a positive impact of FEP on FFP was found were dominant. Buysse and Verbeke (2003) reported that an environmental leadership approach is linked with an increase in FFP for Belgium-based companies, but not for affiliates of foreign multinational enterprises.
Several studies have evaluated the nexus between FEP and environmental disclosure, studying whether investors consider the significance and value of FEP information when making investment decisions. Dilla et al. (2019) showed that FEP, as well as assurances regarding relevant FEP information, had a high effect on investors’ investing decisions, with sturdy environmental responsibility opinions. DiSegni et al. (2015) compared the FFP in all the US companies included in the Dow Jones Sustainability Indices and proposed that corporations with strong social responsibility and environmental sustainability are categorized by importantly larger profit measures than the corresponding industries and firms. Wingard and Vorster (2001) reported a positive nexus between FFP and firm environmental responsibility with respect to South African recorded firms, i.e., the higher the level of a firm’s environmental responsibility, the better its FFP. Longoni and Cagliano (2018) offered empirical support for the influence of comprehensive environmental disclosure practices in relation to FFP but found no nexus with respect to the effect on FEP. Nevertheless, Deswanto and Siregar (2018) showed that FFP has no effect on firm environmental disclosures. Moreover, they argued that lagging FEP indicates a positive influence with respect to firm environmental disclosures, concluding that environmental disclosures by firms have no effect on the firm’s market value and do not arbitrate the influence of FEP and FFP regarding firm value in Indonesia. Testa and D’Amato (2017) studied the bidirectional causal nexus between FFP and firm environmental responsibility regarding the listed manufacturing company data in Italy from 2005 to 2014. Meanwhile, their outcomes showed no support for the bidirectional hypothesis; however, firm environmental responsibility had a significant relationship with previous FFP, supporting the slack resources hypothesis. Giannarakis et al. (2017) studied the influence of FEP with respect to the environmental disclosure level of Standard and Poor’s 500 firms, and their relevant results showed that higher pollution levels regarding greenhouse gas emissions had a negative effect on the distribution of carbon disclosure information, which suggests a positive nexus between a firm’s environmental disclosure level and its FEP. In addition, Alipour et al. (2019) indicated that there was a significant positive nexus between FFP and environmental disclosure quality in Iranian firms.
Muhammad et al. (2015) found no connection between FEP and FFP from 2008 to 2010 (during the financial crisis) in Australia. Liang and Liu (2017) obtained the same result for Chinese firms. Based on a comprehensive meta-analysis of 149 studies, Endrikat et al. (2014) showed a positive and partly bidirectional nexus between FEP and FFP. Laguir et al. (2018) demonstrated a bidirectional nexus between FEP and FFP for French banks. Yu et al. (2009) made use of correlation analysis with data from of 51 European firms in 14 industries across 15 countries for the purpose of investigating the possible nexus between FFP and FEP; finding no positive nexus between FFP and FEP. Dragomir (2010) reported no nexus between FFP and FEP based on data from 60 of the biggest European Union industry commercial units. To date, the academic debate concerning the nexus between R&D investment, FEP (CO2 emission) and FFP is ongoing.
3. Methodology
3.1. Empirical Model
Despite the causality specification of the Granger causality test (GCT, Granger 1969), which is unable to offer knowledge regarding nonlinear causalities or a tail causal relation, the quantile causality method analyzes causal nexuses in a more agile and careful way. In this study, the quantile regression Fourier Toda–Yamamoto (QRFT-Y) GCT proposed by Nazlioglu et al. (2016) is used to test the relations among R&D investment, CO2 emissions and ROA in Taiwan. Via the QRFT-Y GCT, the subsequent Fourier series is used in lieu of utilizing dummy parameters to cogitate the structural breaks in the causal nexus. Gallant (1981) and Gallant and Souza (1991) indicate that a small number of low-frequency units for a Fourier function are able to catch an unidentified number of breaks regarding sharp as well as gradual structural breaks:
This Fourier series, in which k specifies the frequency, can be incorporated into the testing equation; its quantile approach is defined as follows:
or
where x, y and z are R&D investment, CO2 emissions and ROA, respectively. The GCT can be simulated from z→y at various quantiles regarding the null hypothesis of γ(τi) = 0 for i = 1, 2, …, p. Moreover, the null hypothesis without Granger causality, i.e., Rβ(τ) = 0, is simulated as follows:
where R defines the indicator matrix of these variables (constrained variables denoted by ones), β(τ) denotes D’ column stack, S represents the variance–covariance matrix for the unconstrained approach; indicates the Kronecker product. Furthermore, considering that Hatemi-J and Uddin (2012) mention the fact that conditional heteroskedasticity (ARCH) influences exist in the data, and these do not usually abide by normal distribution; there is thus a probability that the Wald statistic distribution will significantly diverge from its asymptotic distribution. Hence, the bootstrapping simulation technique, using 10,000 iterations, proposed by Hatemi-J and Uddin (2012), is used to comprise the 1%, 5% and 10% critical values from the empirical distribution. Similarly, the Wald test can be utilized for testing of the null hypothesis: γ(τi) = 0 for i = 1, 2.
3.2. Data
In this study, Taiwan Stock Exchange (TSE)-listed firms were used for sample data, obtained from the Taiwan Economic Journal (TEJ) database. Although the initial sample started with 2640 firm-year observations (542 firms) that were involved with CO2 emissions, as stated in their financial reports from 2005 to 2018, up to 1097 of these (222 firms) were excluded, owing to 430 of them (90 firms) having missing accounting and financial data, and 667 (132 firms) having zero R&D investment, respectively. Thus, the final unbalanced panel data comprised 1543 firm-year observations (320 firms) from 2005 to 2018, covering the financial crisis (from 2007 to 2009) period.
These are cross-sectional and time-series data, permitting the overall examination of the trivariable nexus. This study’s parameters were defined as follows. The CO2 emissions were evaluated as the ratio of CO2 emissions to assets in order to minimize heterogeneity problem which arises from different sizes. The return on assets (ROA) was evaluated as the ratio of net profit to assets. R&D was measured as the ratio of R&D investment to net sales revenue. Following Scarpellini et al. (2019), we used R&D investment as a metric for the measurement of innovation, and CO2 emissions and ROA served as a proxy for FEP and FFP, respectively.
Table 1 presents the descriptive statistics for the unbalanced panel sample from 2005 to 2018. The total number of firms was 320, and there were 1543 firm-year observations. Jarque–Bera analysis showed that CO2 emissions, ROA and R&D were non-normally distributed. The mean (median) value of CO2 emission (divided by assets) was 0.1092 (0.0214), with a maximum value of 4.0409. The mean (median) value of ROA was 10.39072 (9.7600), with a maximum value of 55.64. The mean (median) value of R&D was 0.088068 (0.023), with a maximum value of 17.68196.
4. Empirical Results
Using a novel bootstrap Fourier quantiles Granger causality test to analyze data from 2005 to 2018, this study examines the nexus between R&D investment, FEP (CO2 emissions) and FFP (ROA) in Taiwan. First, we carried out traditional unit root tests, followed by the test of bootstrap Fourier Granger causality in quantiles.
4.1. Unit Root Test Results
Numerous traditional unit root tests the ADF, PP and KPSS tests were applied and the outcomes are shown in Table 2. Only R&D was non-stationary, and this became stationary at level (I (0)) and after taking the first difference. CO2 emissions and ROA were all stationary at level (I (0)) and after taking the first difference, respectively.
4.2. Bootstrap Fourier Quantiles Granger Causality Test
To test the Granger causality, the existence of a Fourier expansion in equation (2) is tested using the conventional Wald test. The critical values are computed, using the bootstrapping procedure, with 10,000 replications. In Table 3, the BFQGCT results, running from R&D to CO2 emissions, indicate that the values of the Wald statistics equal 4040.917, 1748.515, 14,956.70, 2048.546 and 1334.683 under 0.2, 0.3, 0.7, 0.8 and 0.9 quantiles, respectively, and each is greater than its bootstrap critical values at 5% or 1%. The results indicate that the null hypothesis of γ_1 = γ_2 = 0 can be strongly rejected at 5% or 1% levels of significance. There is a one-way Granger causality running from R&D investment to CO2 emissions (under 0.2, 0.3, 0.7, 0.8 and 0.9 quantiles). By observing the symbol of the independent-variable coefficients, it can be seen that R&D investment causes CO2 emissions to decrease. These findings demonstrate that R&D investment (innovation) reduces CO2 emissions (increasing environmental performance) under 0.2, 0.3, 0.7 and 0.8 environment performance quantiles, respectively. The Granger causality running from CO2 emissions to R&D is insignificant.
Table 3 shows the results of the Granger causality test running from CO2 emissions to ROA, indicating that the values of the Wald statistics equal 17.20173, 27.32757, 57.70779 and 119.3797 under 0.5, 0.6, 0.8 and 0.9 quantiles, respectively, and each is greater than its bootstrap critical values at 5%. The results indicate that the null hypothesis of γ_1 = γ_2 = 0 can be strongly rejected at the 5% level of significance. There is a one-way Granger causality running from CO2 emissions (environmental performance) to ROA (financial performance) (under 0.5, 0.6, 0.8 and 0.9 quantiles). The symbol of the independent-variable coefficients indicates that CO2 emissions cause ROA to decrease. This means that reducing emissions (increasing environmental performance) “Granger-causes” an increase financial performance under 0.5, 0.6 0.8 and 0.9 financial performance quantiles, respectively. The Granger causality running from ROA to CO2 emissions is insignificant.
The Granger causality test running from R&D to ROA indicates that the values of the Wald statistics equal 411.8341, 397.0857, 470.3310 and 11,289.359 under 0.3, 0.4, 0.5, and 0.9, respectively, and each is greater than its bootstrap critical values at 10% or 5%. The outcomes show that the null hypothesis of γ_1 = γ_2 = 0 can be strongly rejected at the 10% or 5% level of significance. There is a one-way Granger causality running from R&D to ROA (under 0.3, 0.40, 0.5 and 0.9). By examining the symbol of the independent-variable coefficients, it can be seen that increasing R&D causes ROA to increase. These findings conclude that increasing R&D investment increases FFP under 0.3, 0.4, 0.5 and 0.9 financial performance quantiles, respectively.
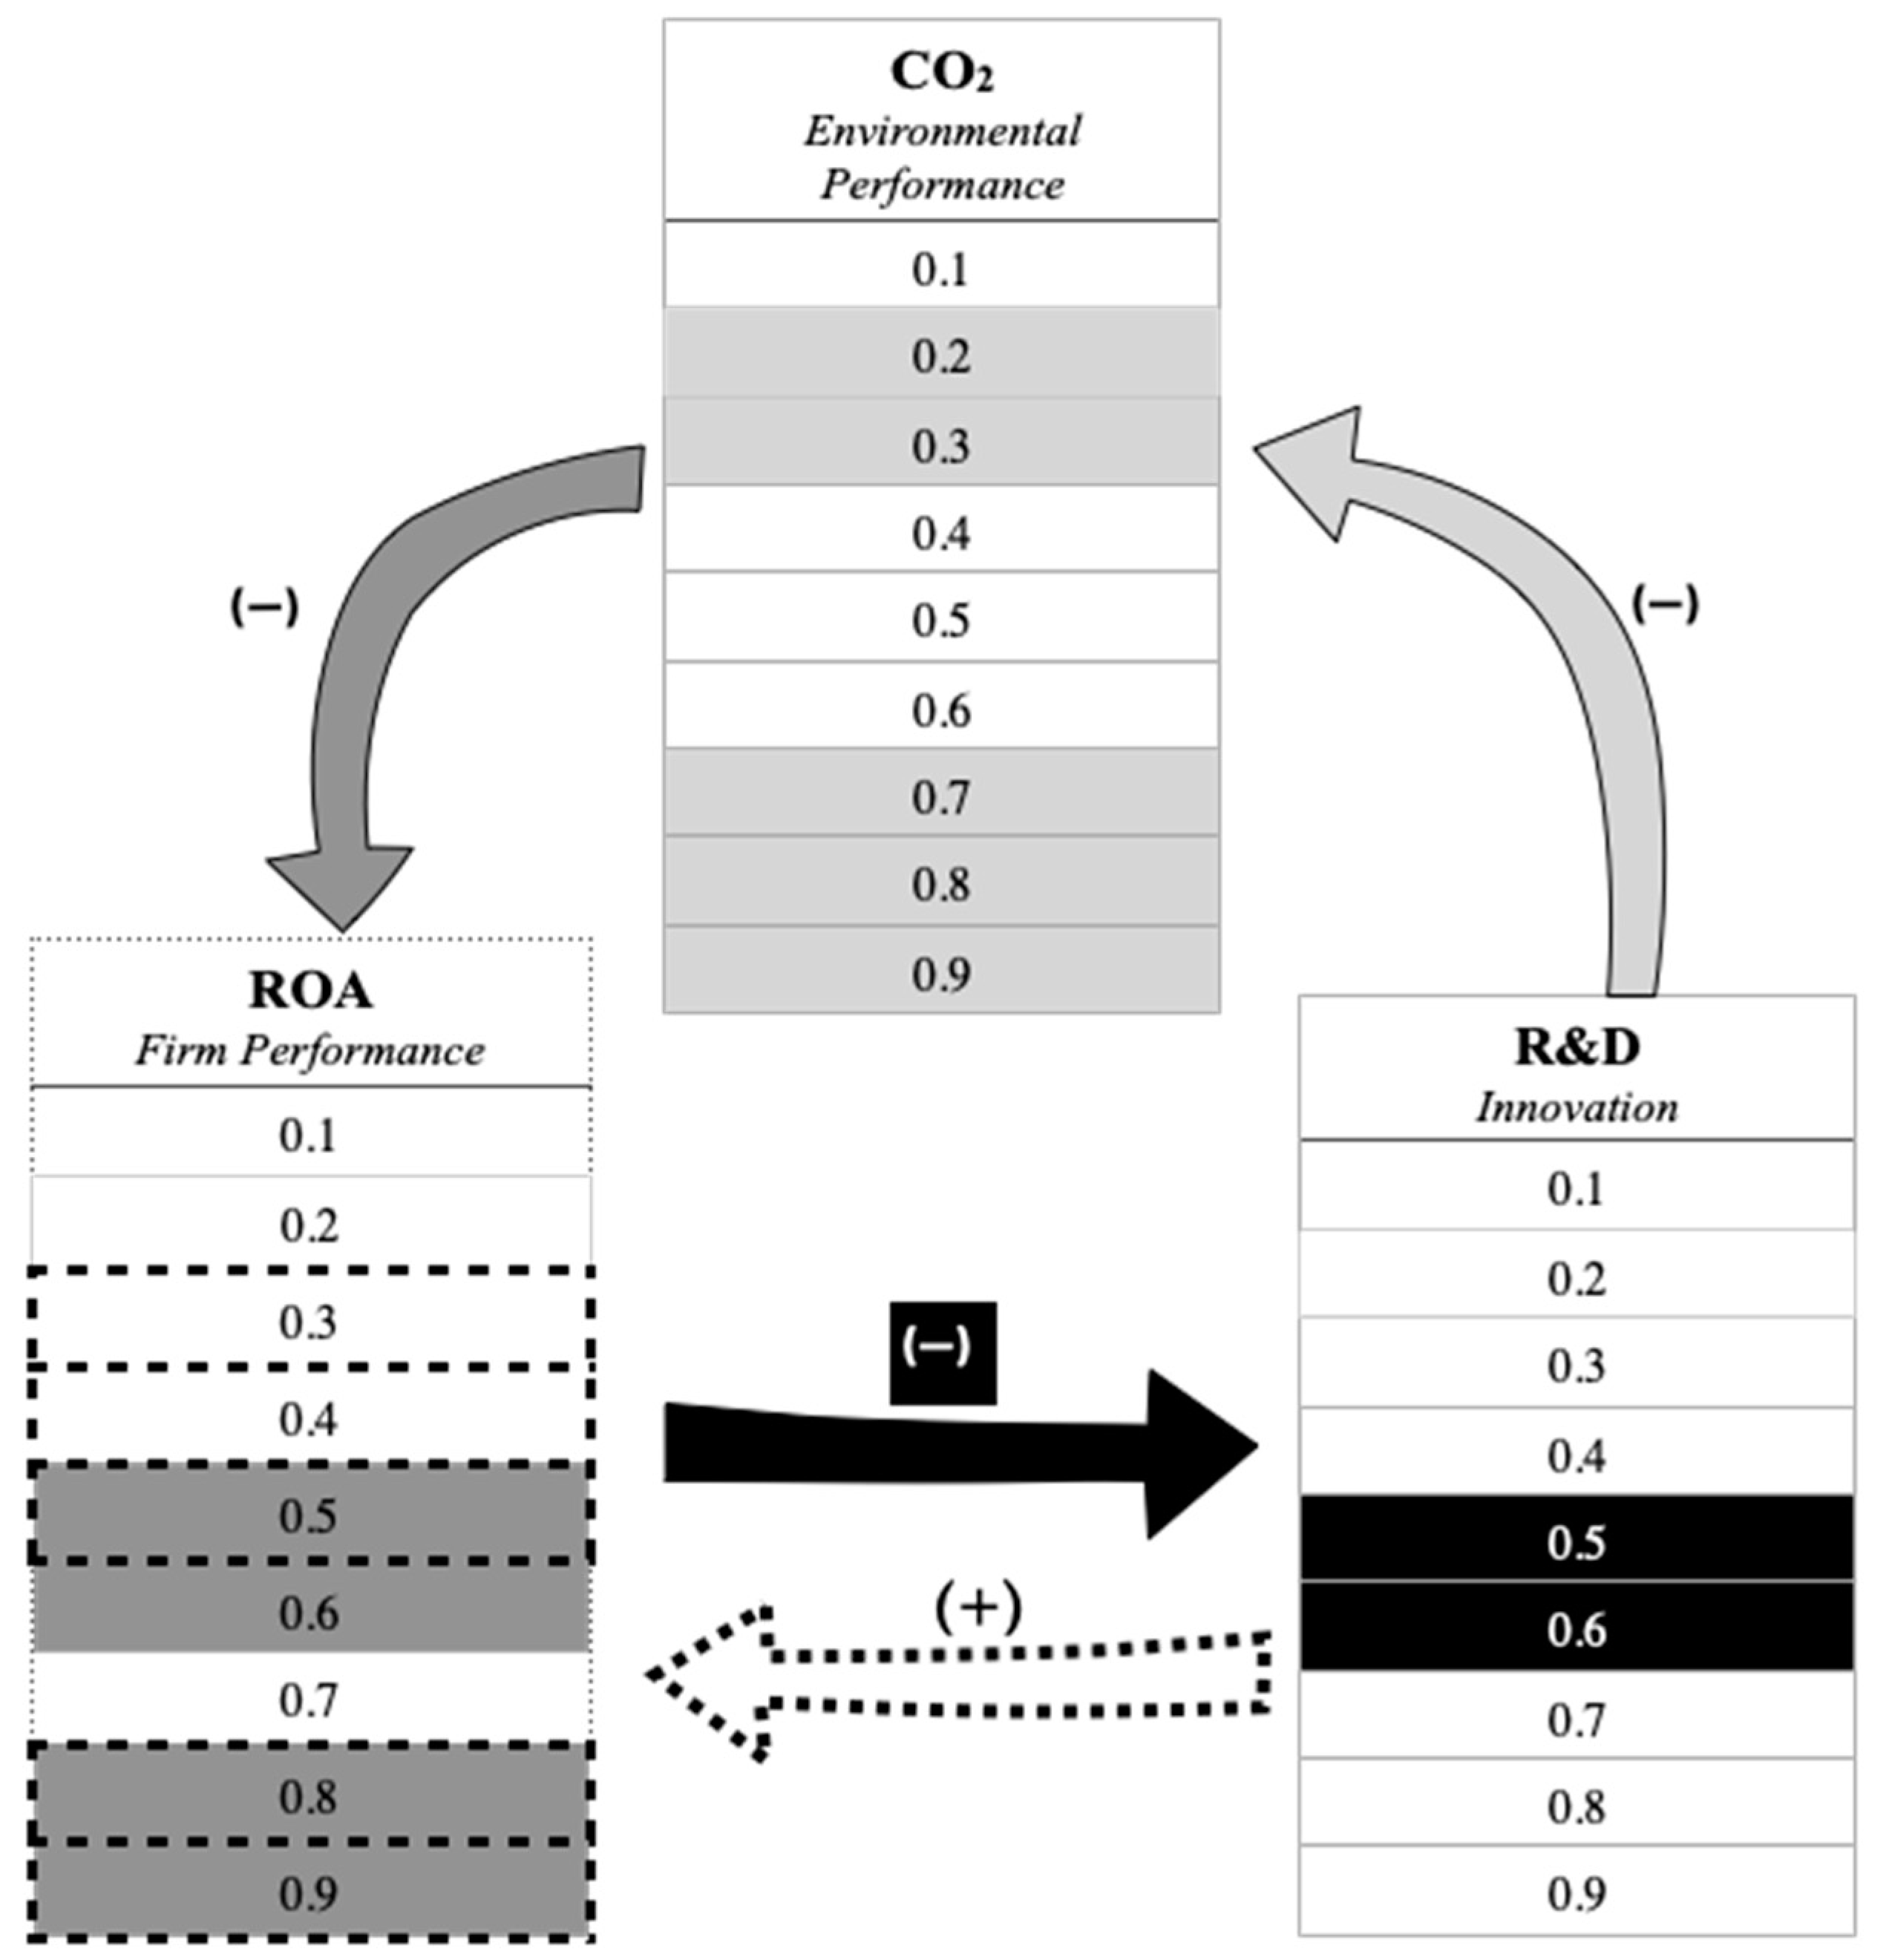
The Granger causality test running from ROA to R&D indicates that the values of the Wald statistics equal 35.66072 and 22.96598 under 0.5 and 0.6, respectively, and each is greater than its bootstrap critical values at 1% and 5%. The outcomes show that the null hypothesis of γ_1 = γ_2 = 0 can be strongly rejected at the 1% and 5% level of significance. The Granger causality runs from ROA to R&D (under 0.5 and 0.6 quantiles). By examining the symbol of the independent-variable coefficients, it can be seen that increasing ROA causes R&D investment to decrease, i.e., the better the FFP, the lower the R&D investment under the middle R&D investment quantiles. The causality nexus, as well as the pathways among R&D investment, CO2 emission and financial performance, are shown in Figure 1.
5. Conclusions
As CO2 emissions affect global warming, social concern about the environment is increasing. These increasing social concerns, along with the question of whether “it pays to be green” in business, have motivated firms to seek solutions in regard to decreasing CO2 emissions and increasing profitability simultaneously. In this study, we have examined the nexus between R&D investment, FEP (CO2 emissions) and FFP in Taiwan via a novel BFQGCT using data from 2005 to 2018. The empirical outcomes show that R&D investment causes an improvement in both CO2 emissions and ROA. By examining the results of the independent-variable coefficients, it can be observed that R&D investment (innovation) reduces CO2 emissions (boosting FEP) under 0.2, 0.3, 0.7, 0.8 and 0.9 FEP quantiles, separately, and R&D investment increases ROA (FFP) under 0.3, 0.4, 0.5 and 0.9 FFP quantiles, individually. Reducing CO2 emissions (FEP) causes an increase in ROA (FFP) under 0.5, 0.6, 0.8 and 0.9 ROA quantiles, separately, and increasing ROA (FFP) causes reduced R&D investment under 0.5 and 0.6 quantiles, individually. Finally, increasing R&D causes an increase in ROA under 0.3, 0.40, 0.5 and 0.9 ROA quantiles, individually, in Taiwan.
Contrary to the findings of a previous study that used only mean coefficient analysis via the OLS method, the analyses presented here indicate that the greater the R&D investment, the greater the reduction in CO2 emissions under 0.2, 0.3, 0.7, 0.8 and 0.9 environment performance quantiles, individually. In contrast with previous findings (Scarpellini et al. 2019; Duque-Grisales et al. 2020; Ezhilarasi and Kabra 2020), our results show that a larger R&D investment is linked with better financial performance under 0.3, 0.4, 0.5 and 0.9 quantiles, separately. The negative causality running from ROA to R&D under 0.5 and 0.6 R&D investment quantiles, individually, indicates that better financial performance is linked with the less R&D investment in middle R&D investment quantiles. These findings suggest that there is a negative causality running from environmental performance to financial performance under the 0.5, 0.6, 0.8 and 0.9 financial performance quantiles, individually, which offers a potential explanation for the inconclusive findings in the previous literature (Liu et al. 2017; Moneva and Ortas 2010; Clarkson et al. 2011; Gallego-Álvarez et al. 2015; Muhammad et al. 2015). Understanding this causal nexus, as well as the pathways among R&D investment, CO2 emission and financial performance, has special significance for policy makers intending to understand how R&D strategies can improve FEP and FFP simultaneously. This study is unique among prior studies in that it examines the direction and size of R&D investment, financial and environmental performance relations via a bootstrap Fourier quantiles Granger causality test. Due to the limitations of this model, it was not possible to analyze how the quantiles of the explanatory variables affected the conditional quantiles of the dependent variables. Further studies can hopefully make up for this limitation.
Author Contributions
F.-L.L. conceptualized the idea of this paper, collected and analyzed the data. F.-L.L. also wrote the manuscript. The author has read and agreed to the published version of the manuscript.
Funding
This research received no external funding.
Institutional Review Board Statement
Not applicable.
Informed Consent Statement
Not applicable.
Data Availability Statement
The datasets generated for this study are available on request to the author.
Conflicts of Interest
The author declares no conflict of interest.
References
- Alipour, Mohammad, Mehrdad Ghanbari, Babak Jamshidinavid, and Aliasghar Taherabadi. 2019. Does board independence moderate the relationship between environmental disclosure quality and performance? Evidence from static and dynamic panel data. Corporate Governance 19: 580–610. [Google Scholar] [CrossRef]
- Busch, Timo, and Volker H. Hoffmann. 2011. How hot is your bottom line? Linking carbon and financial performance. Business and Society 50: 233–65. [Google Scholar] [CrossRef]
- Buysse, Kristel, and Alain Verbeke. 2003. Environmental strategy choice and financial profitability: Differences Between multinationals and domestic firms in Belgium. Research in Global Strategic Management 9: 43–63. [Google Scholar] [CrossRef]
- Chang, Kai. 2015. The effect of environmental performance and preference disclosure on financial performance: Empirical evidence from unbalanced panel data of heavy-pollution industries in China. Journal of Industrial Engineering and Management 8: 21–36. [Google Scholar] [CrossRef]
- Chen, Fang, Thomas Ngniatedema, and Suhong Li. 2018. A cross-country comparison of green initiatives, green performance and financial performance. Management Decision 56: 1008–32. [Google Scholar] [CrossRef]
- Clarkson, Peter M., Yue Li, Gordon D. Richardson, and Florin P. Vasvari. 2011. Does It really Pay to Be Green? Determinants and Consequences of Proactive Environmental Strategies. Journal of Accounting and Public Policy 30: 122–44. Available online: http://0-www-sciencedirect-com.brum.beds.ac.uk/science/article/pii/S0278-4254(10)00064-5 (accessed on 28 May 2021).
- Deswanto, Refandi Budi, and Sylvia Veronica Siregar. 2018. The associations between environmental disclosures with financial performance, environmental performance, and firm value. Social Responsibility Journal 14: 180–93. [Google Scholar] [CrossRef]
- Dilla, William, Diane Janvrin, Jon Perkins, and Robyn Raschke. 2019. Do environmental responsibility views influence investors’ use of environmental performance and assurance information? Sustainability Accounting, Management and Policy Journal 10: 476–97. [Google Scholar] [CrossRef]
- DiSegni, Dafna M., Moshe Huly, and Sagi Akron. 2015. Corporate social responsibility, environmental leadership and financial performance. Social Responsibility Journal 11: 131–48. [Google Scholar] [CrossRef] [Green Version]
- Dragomir, Voicu D. 2010. Environmentally sensitive disclosures and financial performance in a European setting. Journal of Accounting & Organizational Change 6: 359–88. [Google Scholar] [CrossRef]
- Duque-Grisales, Eduardo, Javier Aguilera-Caracuel, Jaime Guerrero-Villegas, and Encarnación García-Sánchez. 2020. Does green innovation affect the financial performance of Multilatinas? The moderating role of ISO 14001 and R&D investment. Business Strategy and the Environment, Wiley Blackwell 29: 3286–302. [Google Scholar] [CrossRef]
- Endrikat, Jan, Edeltraud Guenther, and Holger Hoppe. 2014. Making sense of conflicting empirical findings: A meta-analytic review of the relationship between corporate environmental and financial performance. European Management Journal 32: 735–51. [Google Scholar] [CrossRef]
- Ezhilarasi, G., and Kailash Chandra Kabra. 2020. The value relevance of quantitative and qualitative environmental disclosure of polluting companies in India: A static and dynamic panel data evidence. International Journal of Business Environment 11: 98–124. [Google Scholar] [CrossRef]
- Gallant, A. Ronald. 1981. On the bias in flexible functional forms and an essentially unbiased form: The Fourier flexible form. Journal of Econometrics 15: 211–45. Available online: https://EconPapers.repec.org/RePEc:eee:econom:v:15:y:1981:i:2:p:211-245 (accessed on 28 May 2021).
- Gallant, A. Ronald, and Geraldo Souza. 1991. On the asymptotic normality of Fourier flexible form estimates. Journal of Econometrics 50: 329–53. [Google Scholar] [CrossRef] [Green Version]
- Gallego-Álvarez, Isabel, Liliane Segura, and Jennifer Martínez-Ferrero. 2015. Carbon emission reduction: The impact on the financial and operational performance of international companies. Journal of Cleaner Production 103: 149–59. [Google Scholar] [CrossRef]
- Ganda, F. 2018. Green research and development (R&D) investment and its impact on the market value of firms: Evidence from South African mining firms. Journal of Environmental Planning and Management 61: 515–34. [Google Scholar] [CrossRef]
- Giannarakis, Grigoris, George Konteos, Nikolaos Sariannidis, and George Chaitidis. 2017. The relation between voluntary carbon disclosure and environmental performance: The case of S&P 500. International Journal of Law and Management 59: 784–803. [Google Scholar] [CrossRef]
- Granger, Clive W. J. 1969. Investigating causal relations by econometric models and cross spectral methods. Econometrica 37: 424–38. Available online: https://0-www-jstor-org.brum.beds.ac.uk/stable/1912791 (accessed on 28 May 2021).
- Hart, Stuart L., and Gautam Ahuja. 1996. Does it pay to be green? An empirical examination of the relationship between emission reduction and firm performance. Business Strategy and the Environment 5: 30–37. [Google Scholar] [CrossRef]
- Hatemi-J, Abdulnasser, and Gazi Salah Uddin. 2012. Is the casual nexus of energy utilization and economic growth asymmetric in the US? Economic Systems 36: 461–69. [Google Scholar] [CrossRef]
- Huang, Yi-Chun, and Yen-Chun Jim Wu. 2010. The effects of organizational factors on green new product success: Evidence from high-tech industries in Taiwan. Management Decision 48: 1539–67. [Google Scholar] [CrossRef]
- Laguir, Issam, Magalie Marais, Jamal El Baz, and Rebecca Stekelorum. 2018. Reversing the business rationale for environmental commitment in banking Does financial performance lead to higher environmental performance? Management Decision 56: 358–75. [Google Scholar] [CrossRef]
- Lee, Ki-Hoon, and Byung Min. 2015. Green R&D for eco-innovation and its impact on carbon emissions and firm performance. Journal of Cleaner Production 108: 534–42. [Google Scholar] [CrossRef] [Green Version]
- Liang, Dapeng, and Tiansen Liu. 2017. Does environmental management capability of Chinese industrial firms improve the contribution of corporate environmental performance to economic performance? Evidence from 2010 to 2015. Journal of Cleaner Production 142: 2985–98. [Google Scholar] [CrossRef]
- Lin, Y.-C. 2017. Does R&D investment under corporate social responsibility increase firm performance? Investment Management and Financial Innovation 14: 217–26. [Google Scholar] [CrossRef] [Green Version]
- Liu, Yang, Xiaoyan Zhou, Jessica Yang, and Andreas G. F. Hoepner. 2017. Corporate Carbon Emission and Financial Performance: Does Carbon Disclosure Mediate the Relationship in the UK? European Accounting Association Annual Congress, 10–12. [Google Scholar] [CrossRef]
- Longoni, Annachiara, and Raffaella Cagliano. 2018. Inclusive environmental disclosure practices and firm performance: The role of green supply chain management. International Journal of Operations & Production Management 38: 1815–35. [Google Scholar] [CrossRef] [Green Version]
- Lucato, Wagner Cezar, Elpidio Moreira Costa, and Geraldo Cardoso de Oliveira Neto. 2017. The environmental performance of SMEs in the Brazilian textile industry and the relationship with their financial performance. Journal of Environmental Management 203: 550–56. [Google Scholar] [CrossRef]
- Matsumura, Ella Mae, Rachna Prakash, and Sandra C. Vera-Munoz. 2013. Firm-value effects of carbon emissions and carbon disclosures. The Accounting Review 89: 695–724. [Google Scholar] [CrossRef]
- Molina-Azorín, Rocky, David Lamond, José F. Molina-Azorín, Enrique Claver-Cortés, Maria D. López-Gamero, and Juan J. Tarí. 2009. Green management and financial performance: A literature review. Management Decision 47: 1080–100. [Google Scholar] [CrossRef]
- Moneva, José M., and Eduardo Ortas. 2010. Corporate environmental and financial performance: A multivariate approach. Industrial Management & Data Systems 110: 193–210. [Google Scholar] [CrossRef]
- Muhammad, Noor, Frank Scrimgeour, Krishna Reddy, and Sazali Abidin. 2015. The relationship between environmental performance and financial performance in periods of growth and contraction: Evidence from Australian publicly listed companies. Journal of Cleaner Production 102: 324–32. [Google Scholar] [CrossRef]
- Nazlioglu, Saban, N. Alper Gormus, and Uğur Soytas. 2016. Oil prices and real estate investment trusts (REITs): Gradual-shift causality and volatility transmission analysis. Energy Economics 60: 168–75. [Google Scholar] [CrossRef]
- Saka, Chika, and Tomoki Oshika. 2014. Disclosure effects, carbon emissions and corporate value. Sustainability Accounting. Management and Policy Journal 5: 22–45. [Google Scholar] [CrossRef]
- Samsul, Md Samsul, Muhammad Atif, Chu Chien-Chi, and Uğur Soytaş. 2019. Does corporate R&D investment affect firm environmental performance? Evidence from G-6 countries. Energy Economics 78: 401–11. [Google Scholar] [CrossRef]
- Scarpellini, Sabina, Pilar Portillo-Tarragona, and Luz Maria Marin-Vinuesa. 2019. Green patents: A way to guide the eco-innovation success process? Academia Revista Latinoamericana de Administracion 32: 225–43. [Google Scholar] [CrossRef]
- Tariq, Adeel, Yuosre Badir, and Supasith Chonglerttham. 2019. Green innovation and performance: Moderation analyses from Thailand. European Journal of Innovation Management 22: 446–67. [Google Scholar] [CrossRef]
- Testa, Mario, and Antonio D’Amato. 2017. Corporate environmental responsibility and financial performance: Does bidirectional causality work? Empirical evidence from the manufacturing industry. Social Responsibility Journal 13: 221–34. [Google Scholar] [CrossRef]
- Triguero, Angela, Lourdes Moreno-Mondéjar, and María A. Davia. 2013. Drivers of different types of eco-innovation in European SMEs. Ecological Economics 92: 25–33. [Google Scholar] [CrossRef]
- Wingard, Hermina Christina, and Quintus Vorster. 2001. Financial performance of environmentally responsible South African listed companies. Meditari Accountancy Research 9: 313–32. [Google Scholar] [CrossRef] [Green Version]
- Yu, Vincent, Hsiu-I Ting, and Yen-Chun Jim Wu. 2009. Assessing the greenness effort for European firms: A resource efficiency perspective. Management Decision 47: 1065–79. [Google Scholar] [CrossRef] [Green Version]
Figure 1.
Quantile Granger Causality Test Direction.


Table 1.
Descriptive Statistics.
| Mean | Medium | Max. | Min. | Std.Dev. | Skewness | Kurtosis | Jarque–Bera | |
|---|---|---|---|---|---|---|---|---|
| CO2 | 0.1092702 | 0.021471 | 4.0409 | 0.0000031 | 0.33829 | 7.204648 | 64.13949 | 253,673.3 *** |
| ROA | 10.39072 | 9.760000 | 55.640 | −63.04000 | 8.286528 | −0.479822 | 10.49469 | 3670.491 *** |
| R&D | 0.088068 | 0.023018 | 17.68196 | 2.39 × 10⁻⁵ | 0.778212 | 18.77636 | 375.0439 | 8,989,701 *** |
Notes: *** indicates significance at the 1% level. CO2 indicates the ratio of carbon emission to assets, used in order to minimize the heterogeneity problem which arises from different sizes. ROA refers to the ratio of net profit to assets and R&D refers to the ratio of R&D investment to net sales revenue.
Table 2.
Unit Root Test Results.
| Level | First Difference | |||||
|---|---|---|---|---|---|---|
| ADF | PP | KPSS | ADF | PP | KPSS | |
| CO2 | −7.824175 *** | −11.63009 *** | 0.372556 | −12.97932 *** | −60.37167 *** | 0.079667 |
| ROA | −18.57293 *** | −23.46197 *** | 0.242253 | −23.46197 *** | −146.3223 *** | 0.077861 |
| R&D | −11.174 *** | −6.88788 *** | −50.16287 *** | −18.71048 | −50.16287 *** | 0.116063 |
Notes: *** indicates significance at the 1%, 5% and 10% levels, separately. CO2, refers to the ratio of carbon emission to assets, used to minimize the heterogeneity problem which arises from different sizes. ROA refers to the ratio of net profit to assets and R&D refers to the ratio of R&D investment to net sales revenue.
Table 3.
Quantile Granger causality test among CO2 emissions, ROA and R&D.
| Quantile | Wald Test | CV 10% | CV 5% | CV 1% | |
|---|---|---|---|---|---|
| R&D→CO2 (negative) | 0.1 | 2.137394 | 579.4584 | 1226.427 | 4204.114 |
| 0.2 | 4048.917 ** | 581.3760 | 1164.403 | 4586.895 | |
| 0.3 | 1748.515 ** | 447.0656 | 853.5995 | 3288.686 | |
| 0.4 | 11.50215 | 375.8133 | 645.3720 | 2315.774 | |
| 0.5 | 6.815864 | 393.0546 | 637.7543 | 1860.990 | |
| 0.6 | 3.146628 | 458.4620 | 752.7757 | 3216.239 | |
| 0.7 | 14,956.70 ** | 595.3574 | 1025.499 | 4906.720 | |
| 0.8 | 2048.546 ** | 553.0080 | 1133.514 | 5111.547 | |
| 0.9 | 1334.683 ** | 367.9836 | 814.6717 | 3258.381 | |
| CO2→R&D | 0.1 | 3.880787 | 89.13272 | 125.0902 | 263.7421 |
| 0.2 | 1.951739 | 36.83624 | 50.19736 | 87.53883 | |
| 0.3 | 1.069226 | 23.23389 | 30.37297 | 47.74848 | |
| 0.4 | 3.064328 | 20.97151 | 26.13679 | 41.64357 | |
| 0.5 | 7.655415 | 22.86247 | 28.58717 | 44.25323 | |
| 0.6 | 9.659755 | 29.81040 | 36.59088 | 57.44164 | |
| 0.7 | 2.334995 | 41.04957 | 50.95854 | 76.42753 | |
| 0.8 | 0.898962 | 65.85857 | 84.46474 | 136.1751 | |
| 0.9 | 3.004358 | 108.4133 | 147.1132 | 268.6119 | |
| CO2→ROA (negative) | 0.1 | 15.70273 | 65.06867 | 85.70210 | 145.4731 |
| 0.2 | 2.602070 | 25.97153 | 35.32248 | 61.96993 | |
| 0.3 | 8.946593 | 15.69944 | 21.71965 | 38.12811 | |
| 0.4 | 7.295380 | 12.15180 | 16.66797 | 29.97618 | |
| 0.5 | 17.20173 ** | 12.27122 | 16.51336 | 28.73321 | |
| 0.6 | 27.32757 ** | 14.92517 | 19.52453 | 32.64043 | |
| 0.7 | 19.32699 | 21.67174 | 28.28871 | 46.05749 | |
| 0.8 | 57.70779 ** | 37.64852 | 48.66073 | 87.00708 | |
| 0.9 | 119.3797 ** | 77.38182 | 100.8456 | 174.9821 | |
| ROA→CO2 | 0.1 | 0.532327 | 23.39925 | 27.08539 | 34.32783 |
| 0.2 | 3.043201 | 16.08705 | 18.15568 | 22.78126 | |
| 0.3 | 3.958516 | 15.65950 | 17.73498 | 21.70123 | |
| 0.4 | 3.158619 | 15.99712 | 18.09925 | 22.31895 | |
| 0.5 | 2.501898 | 15.82778 | 17.92695 | 22.32631 | |
| 0.6 | 3.426661 | 16.38645 | 18.86070 | 24.30664 | |
| 0.7 | 6.121450 | 19.46645 | 22.38043 | 29.09297 | |
| 0.8 | 7.133838 | 27.26242 | 32.11197 | 41.93813 | |
| 0.9 | 32.68547 | 52.58201 | 64.05667 | 87.97280 | |
| R&D→ROA (positive) | 0.1 | 341.3374 | 575.3449 | 663.1935 | 938.3257 |
| 0.2 | 386.0742 | 445.2968 | 524.5006 | 754.4572 | |
| 0.3 | 411.8341 * | 353.6841 | 422.8852 | 578.4530 | |
| 0.4 | 397.0857 ** | 335.1044 | 386.8160 | 514.1024 | |
| 0.5 | 470.3310 ** | 322.8919 | 375.7900 | 486.7262 | |
| 0.6 | 148.1905 | 270.1801 | 340.4037 | 495.5135 | |
| 0.7 | 128.7050 | 379.8922 | 467.0425 | 679.6993 | |
| 0.8 | 370.8866 | 567.1032 | 672.3535 | 943.0788 | |
| 0.9 | 1289.359 ** | 849.3702 | 1020.328 | 1404.347 | |
| ROA→R&D (negative) | 0.1 | 3.043362 | 37.08690 | 44.13056 | 59.42251 |
| 0.2 | 9.743216 | 22.38750 | 25.82377 | 33.62489 | |
| 0.3 | 15.85482 | 20.22187 | 23.12610 | 28.80851 | |
| 0.4 | 18.23258 | 18.48369 | 20.93514 | 26.67804 | |
| 0.5 | 35.66072 *** | 17.96496 | 20.67274 | 26.01630 | |
| 0.6 | 22.96598 ** | 18.95430 | 21.75916 | 27.86017 | |
| 0.7 | 7.064264 | 19.63218 | 22.91689 | 30.25602 | |
| 0.8 | 16.28614 | 25.96321 | 30.44414 | 41.30809 | |
| 0.9 | 24.86138 | 56.45294 | 66.90733 | 90.15367 | |
Notes: The frequency of the data is monthly. CV10%, CV 5%, and CV1% are the critical values of statistical significance, individually. *, ** and *** indicate rejection at the 10%, 5% and 1% levels, individually.
Publisher’s Note: MDPI stays neutral with regard to jurisdictional claims in published maps and institutional affiliations. |
© 2021 by the author. Licensee MDPI, Basel, Switzerland. This article is an open access article distributed under the terms and conditions of the Creative Commons Attribution (CC BY) license (https://creativecommons.org/licenses/by/4.0/).
Share and Cite
MDPI and ACS Style
Lin, F.-L. R&D Investment, Financial and Environmental Performance Nexuses via Bootstrap Fourier Quantiles Granger Causality Test. Economies 2021, 9, 85. https://0-doi-org.brum.beds.ac.uk/10.3390/economies9020085
AMA Style
Lin F-L. R&D Investment, Financial and Environmental Performance Nexuses via Bootstrap Fourier Quantiles Granger Causality Test. Economies. 2021; 9(2):85. https://0-doi-org.brum.beds.ac.uk/10.3390/economies9020085
Chicago/Turabian StyleLin, Feng-Li. 2021. "R&D Investment, Financial and Environmental Performance Nexuses via Bootstrap Fourier Quantiles Granger Causality Test" Economies 9, no. 2: 85. https://0-doi-org.brum.beds.ac.uk/10.3390/economies9020085
Note that from the first issue of 2016, this journal uses article numbers instead of page numbers. See further details here.