
Empirical Analysis of Military Expenditures in NATO Nations


Department of Resources Management, University of Defence, Kounicova 65, 66210 Brno, Czech Republic
*
Author to whom correspondence should be addressed.
Economies 2021, 9(3), 107; https://0-doi-org.brum.beds.ac.uk/10.3390/economies9030107
Submission received: 21 June 2021
/
Revised: 2 July 2021
/
Accepted: 14 July 2021
/
Published: 23 July 2021
Abstract
:The aim of the article is to identify possible “follower” behaviour; it means to reveal countries following the average military burden of North Atlantic Treaty Organization (NATO) member states. To analyse the relationship between military expenditure of NATO member states and selected socio-economic variables (average military burden of NATO member states, gross domestic product, government expenditure (non-military), share of trade balance of gross domestic product and population), the Autoregressive Distributed Lag model has been used. The short-term results demonstrate follower behaviour, especially in the new NATO member states (effort to fulfil the commitment to spend 2% of gross domestic product on defence). The long-term results have revealed a positive relationship between military expenditures and the variable describing the average military burden of NATO member states in the traditional and also new NATO member states. A positive relationship between military expenditure and gross domestic product has also been observed in the majority of evaluated countries in the long-term model. The public good effect has been determined in six member states only, and the crowding out effect in five member states. A positive effect of the balance of trade on military expenditure has been observed in two countries only.
1. Introduction
The 2002 NATO Summit in Prague represented a milestone for NATO member states, consisting of reaching a broad consensus on the necessity to spend the recommended two percent of gross domestic product on defence. The agreed political obligation was further confirmed at the NATO Summit in Wales in 2014. However, only a very small group of the current 30 member states actually allocates more than two percent of their gross domestic product on defence, and from the long view, only Greece, Turkey, and the USA fulfil this political obligation. The allies counting on non-excludability enshrined in Article 5 of the Washington Treaty have contributed to the widening gap between military expenditure of the USA and European countries. The United States have appealed many times for increasing military expenditure of European allies, which is an obligation arising from Article 3 of the Washington Treaty; however, an increase in military expenditure can be observed over the last few years only and especially in countries geographically close to Russia.
This paper is a follow-up to the study of Nikolaidou (2008), analysing military expenditure of selected European countries by means of an ARDL model. The authors of this paper have analysed 27 selected NATO member states (except Island, Montenegro, and North Macedonia) while focusing on the identification of member states that can be considered “followers”, i.e., countries following or copying the average military burden of other NATO member states. The tendencies have been analysed for the period from 1993 to 2019 for the group of traditional allies that became members before 1999; for the period from 1999 to 2019 for the Czech Republic, Hungary, and Poland; for the period from 2004 to 2019 for Bulgaria, Estonia, Lithuania, Latvia, Romania, Slovakia, and Slovenia; and for the period from 2009 to 2019 for Albania and Croatia. To perform the analysis, data arising from the model of Nikolaidou (2008) describing the relationship between military expenditure (military expenditure in constant prices) and selected socio-economic variables (population, gross domestic product, government expenditure (non-military), share of trade balance of GDP, and average military burden of NATO member states) has been examined. The results of the model have revealed potential followers (if the sign of variable average military burden of NATO is positive), i.e., countries that did not rely on NATO-based defence only, which can have some characteristic features of a public good, in the analysed period, but contributed to increasing military expenditure, that could gradually converge or at least narrow the gap between military expenditure of European NATO member states and the USA.
2. Literature Overview
National defence ranks among the basic functions of a developed country essential for its long-term existence. Smith ([1776] 2001) describes the responsibility of the state and the sovereign “…the first duty of the sovereign, that of protecting the society from the violence and invasion of other independent societies, can be performed only by means of a military force.” National defence, therefore, requires that considerable resources be consumed and belongs to one of the most expensive public goods the society provides, according to Mankiw (1999). The issue of military expenditure level, structure, and manner of financing has been a topic of expert discussions for a long time but, in spite of that or because of that, the opinions on defence as a public good are mixed. Samuelson (1954); Samuelson and Nordhaus (1991); Stiglitz (1997); Mankiw (1999); Jackson and Brown (2003); and Schiller (2004) are among the supporters of the perception of national defence as a pure public good. Sandler (1977); and Tambovtsev (2014) take a somewhat ambiguous stance on national defence. Olson and Zeckhauser (1966); and Hampl (2001) incline to the view that national defence is a mixed or pure private good.
National defence as a pure public good must be characterized as follows: non-rivalry in consumption; non-excludability from consumption; costs of public good provisions are not dependant on the number of consumers, i.e., the costs of provisioning the good to another consumer (marginal costs of the consumer) equal to zero; the consumption of the good is automatic, unconscious, and sometimes involuntary or forced.
Non-rivalrous good means that the consumption of the good by one person does not affect the supply available for consumption by another person. A larger number of consumers/users does not reduce the utility for an individual. Non-excludability refers to the fact that actual consumption of/utility derived from this good cannot be quantified. Once the good is provided, it is consumed as a whole. Non-excludability from consumption means that it is costly or technically impossible to exclude some consumers from using the good, or that the good would become purposeless if they were excluded. Zero marginal costs connected with the consumption of a given good by another person mean that costs of national defence do not depend on the number of users. The defence of a state requires the same amount of money irrespective of whether the population is 10 million or 10.5 million. The automatic character is inherent to this public good and means that if defence is provided, it is available to everybody irrespective of whether they want it or not. The unconsciousness is connected with the preventive character of the public good; the society and population living in peace for a long time forget about defence and ignore it. Another characteristic is the impossibility to refuse or the enforced character of the public good. A pacifist living in a given country is protected even though he is not interested in this activity and does not look with favour upon it. As there are no options open to him, the utility of the good is reduced.
However, some reservations more or less challenge the theory about national defence as a pure public good. Sandler (1977) points out that national defence can be considered a pure public good as deterrence, preventive measure against an armed conflict only. If a conflict erupted, non-rivalry would decrease in the given state. If a country had to defend its territory in two lines, opportunity costs of available source allocation would be incurred that could endanger appropriate provision of two defence lines and, therefore, the same utility for the population protected by these lines. Hampl (2001) has similar reservations; in his opinion non-rivalry of national defence would be disturbed if a large territory was annexed, or if a dramatic population increase was experienced. He considers that the army would not be able to maintain the same level of defence for all inhabitants without additional costs. Certain risk of exclusion from national defence is also connected with defence ensured by NATO. If one member state blocked a decision about help for an attacked ally, the country concerned would be excluded from collective defence.
National defence of the analysed countries is currently mostly ensured in cooperation with NATO. The economic character of the good can, therefore, be viewed from another perspective. Important aspects for assessing the good can be the level of utility from defence, which can be individual or shared, and weapon technology ensuring collective defence and security.
With respect to NATO, defence as a pure public good is connected with the period of the Forward Defence and Massive Retaliation strategic policies where NATO relied on nuclear deterrence of the US nuclear capability. At present operations and measures under Article 5 of the Washington Treaty, e.g., campaign against international terrorism, or the Airborne Warning and Control System (AWACS), can be considered pure public goods. However, defence ensured by the member states does not have to have the character of a pure public good. Van Ypersele de Strihou (1967) points out that military expenditure of an ally produces collective defence as a pure public good, but also defence as a pure private good. Defence as a pure private good includes, e.g., military actions of Greece against Turkey, military actions of the United Kingdom against separatists in Northern Ireland or to protect Falkland Islands, French operations to ensure security of French Guyana. When countries produce defence as a pure public good (military activities for the benefit of NATO) and simultaneously a pure private good (military activities of an ally serving its own interests), Van Ypersele de Strihou (1967) speaks about a “mixed good”. It is also important to draw attention to the fact that unanimous consent is required for the invocation of Article 5 of the Washington Treaty and member states may fail to agree on a joint action, in consequence of which one of the member states may be excluded from collective defence. In light of the above defence arising from the Flexible Response, Direct Confrontation, and Crisis Management strategies had a mixed character.
In spite of the above objections and facts, the Allied collective defence retains basic characteristic features of a pure public good that entails unwillingness of member states to allocate adequate national resources to ensure national defence. Nevertheless, the ability to effectively protect the national territory is an indispensable prerequisite for the proper function of the military alliance. Non-excludability, indivisibility, and non-rivalry however create the free-rider problem.
The free-rider problem, its definition and identification form the subject-matter of many economic studies Olson and Zeckhauser (1966); Russett (1970); Khanna and Sandler (1996); Sandler and Murdoch (2000); Gonzales and Montolio (2001); Nikolaidou (2008); Plümper and Neumayer (2014).
The authors of this paper have analysed approaches to free riding on the basis of the following studies Sandler and Murdoch (2000); Nikolaidou (2008); Plümper and Neumayer (2014) applying exploitation hypothesis, estimated demand for military expenditure, and quasi-spatial approach.
The exploitation hypothesis analysis is based on works Olson and Zeckhauser (1966) assuming that economically powerful allies contribute to defence more (share of military expenditure of GDP) than economically weaker states (similarly see Russett (1970); later Khanna and Sandler (1996)). Sandler and Murdoch (2000), and analogously Wukki and Sandler (2019), applied correlation analysis to examine the exploitation hypothesis. Test results of the hypothesis concerning the existence of a positive correlation between gross domestic product of member states and their military expenditure as a share of GDP show a positive, but low correlation between analysed variables from 1988–1999. The results also indicate the decreasing value in the correlation coefficient confirming military expenditure cuts in smaller member states after 1990, which started widening the gap between military expenditures of the USA and European allies. Sandler and Murdoch (2000) simultaneously points out the unequal sharing of military expenditure leading to behaviour called exploitation after 1998, i.e., in the accession period of new member states. The author subsequently carries out a correlation analysis of nine possible NATO enlargement scenarios to test the relations between gross domestic product and military expenditure (share of GDP). The results indicate an increase in unequal military expenditure sharing in the event of NATO enlargement. The conclusions arrived at by Wukki and Sandler (2019) confirm the above assumption about the effects of NATO enlargement on exploiting economically powerful member states. These conclusions were confirmed by correlation analyses performed from 1961 to 2017 (correlation analysed every five years until 2010 and every year from 2010), which revealed higher levels in correlation coefficient from 2005, i.e., when economically weaker states joined NATO. The conclusions comply with the general assumption Olson (1965) about the influence of the number of member states on the behaviour called free riding.
The free riding analysis based on the estimate of military expenditure demand is the subject-matter of a paper by Gonzales and Montolio (2001) focusing on the dependence of Spanish military expenditure on economic growth measured by the growth rate of gross domestic product, on the Spanish membership in NATO, on military expenditure of NATO member states, and on military expenditure of potential enemies of Spain (Morocco and Tunisia). To estimate military expenditure demand, the authors used data characterizing selected determinants from 1977 to 1997. The authors defined free riding as behaviour characterized by a decrease in military expenditure of Spain (or possibly lower growth rate) in comparison with military expenditure of other allies. The econometric model results (ordinary least squares) indicated that Spain behaved like a free rider after its accession when Spain started relying on utilities arising from its membership and failed to increase its military expenditure in comparison with other allies, which enabled Spain to increase non-military expenditure.
Nikolaidou (2008) also applied the method of military expenditure demand estimation and analysed military expenditure determinants of 15 European Union member states. The author used the below factors influencing their military expenditure: gross domestic product, population, government expenditure (non-military), economic openness, average military expenditure (share of GDP) of analysed European countries, and military expenditure of the USA (share of GDP). The author identified free-riding as the relationship between military expenditure and a variable characterizing average military expenditure (share of GDP) of analysed European countries. The model discovered a positive correlation between analysed variables in countries designated as “followers” and negative correlation with respect to free riding. The results of the ARDL model confirm that out of the 15 European countries, Belgium, Denmark, Greece, Portugal, Spain and the United Kingdom behave like followers, and France, Italy and Luxembourg like free-riders. Germany belongs to free-riders if military expenditures of European countries and of the USA are compared. Similarly, the authors Abdelfattah et al. (2013), in the example of Egypt’s military expenditures, describe the relationship between military expenditures and the economic power of the country measured by GDP, the size of the military expenditures of neighbouring countries, size of population, the quality of democracy, and the degree of economic openness of the country measured by the share of net exports in the country’s GDP.
An alternative quasi-spatial approach to testing augmented predictions of the free-riding is pursued by Plümper and Neumayer (2014). An alternative interpretation is based on the premise that incentives to free-ride are a function of the safety level of NATO members. Changes to this safety level are triggered by growth in US spending on the one hand and growth in Soviet spending if in excess of US spending on the other hand. Based on the results, the authors confirmed that 11 allies behaved like free-riders from 1956 to 1988 (Canada, the United Kingdom, The Netherlands, Belgium, France, Portugal, West Germany, Italy, Greece, Norway, Denmark, and Turkey) and rejected the free-rider hypothesis in the case of Portugal only during the dictatorship of Salazar and subsequently Caetano. Just like the other allies, Portugal has been considered a free-rider since it became a democratic country. However, the analysis results simultaneously demonstrate that the degree (intensity) of free-riding depends on the geographical location of the respective country; allies located closer to the Soviet Union showed lower intensity of free-riding than those bordering other European countries.
The follower behaviour will be analysed in the below part of the paper applying Nikolaidou (2008) model based on the military expenditure demand estimation.
3. Data Description
The authors apply the model used in Nikolaidou (2008) to analyse the approach of the allies to their political obligation to allocate 2 per cent of gross domestic product for the benefit of the defence. The ARDL model analyses the relation between military expenditure (absolute figures, constant prices) and selected socioeconomic variables (population size, gross domestic product, government expenditure (non-military), share of trade balance of GDP, and average military burden of NATO member states). From the point of view of the approach to the identification of countries behaving like followers, i.e., countries showing positive statistical correlation between military expenditure level and average military burden of NATO member states, attention will be paid to the interpretation of the results of the ARDL model concerning this “interest” variable.
To make the analysis, data from the SIPRI database (SIPRI 2021) has been used describing military expenditure absolute figures in constant prices for 2018 (USD) and military spending as an indicator of the military burden on the economy (military expenditure as a share of GDP). Accompanying variables have been obtained from the World Bank database (World Bank 2021) and SIPRI database (SIPRI 2021). Twenty-seven NATO states have been analysed (excluding Island, Montenegro, and North Macedonia).
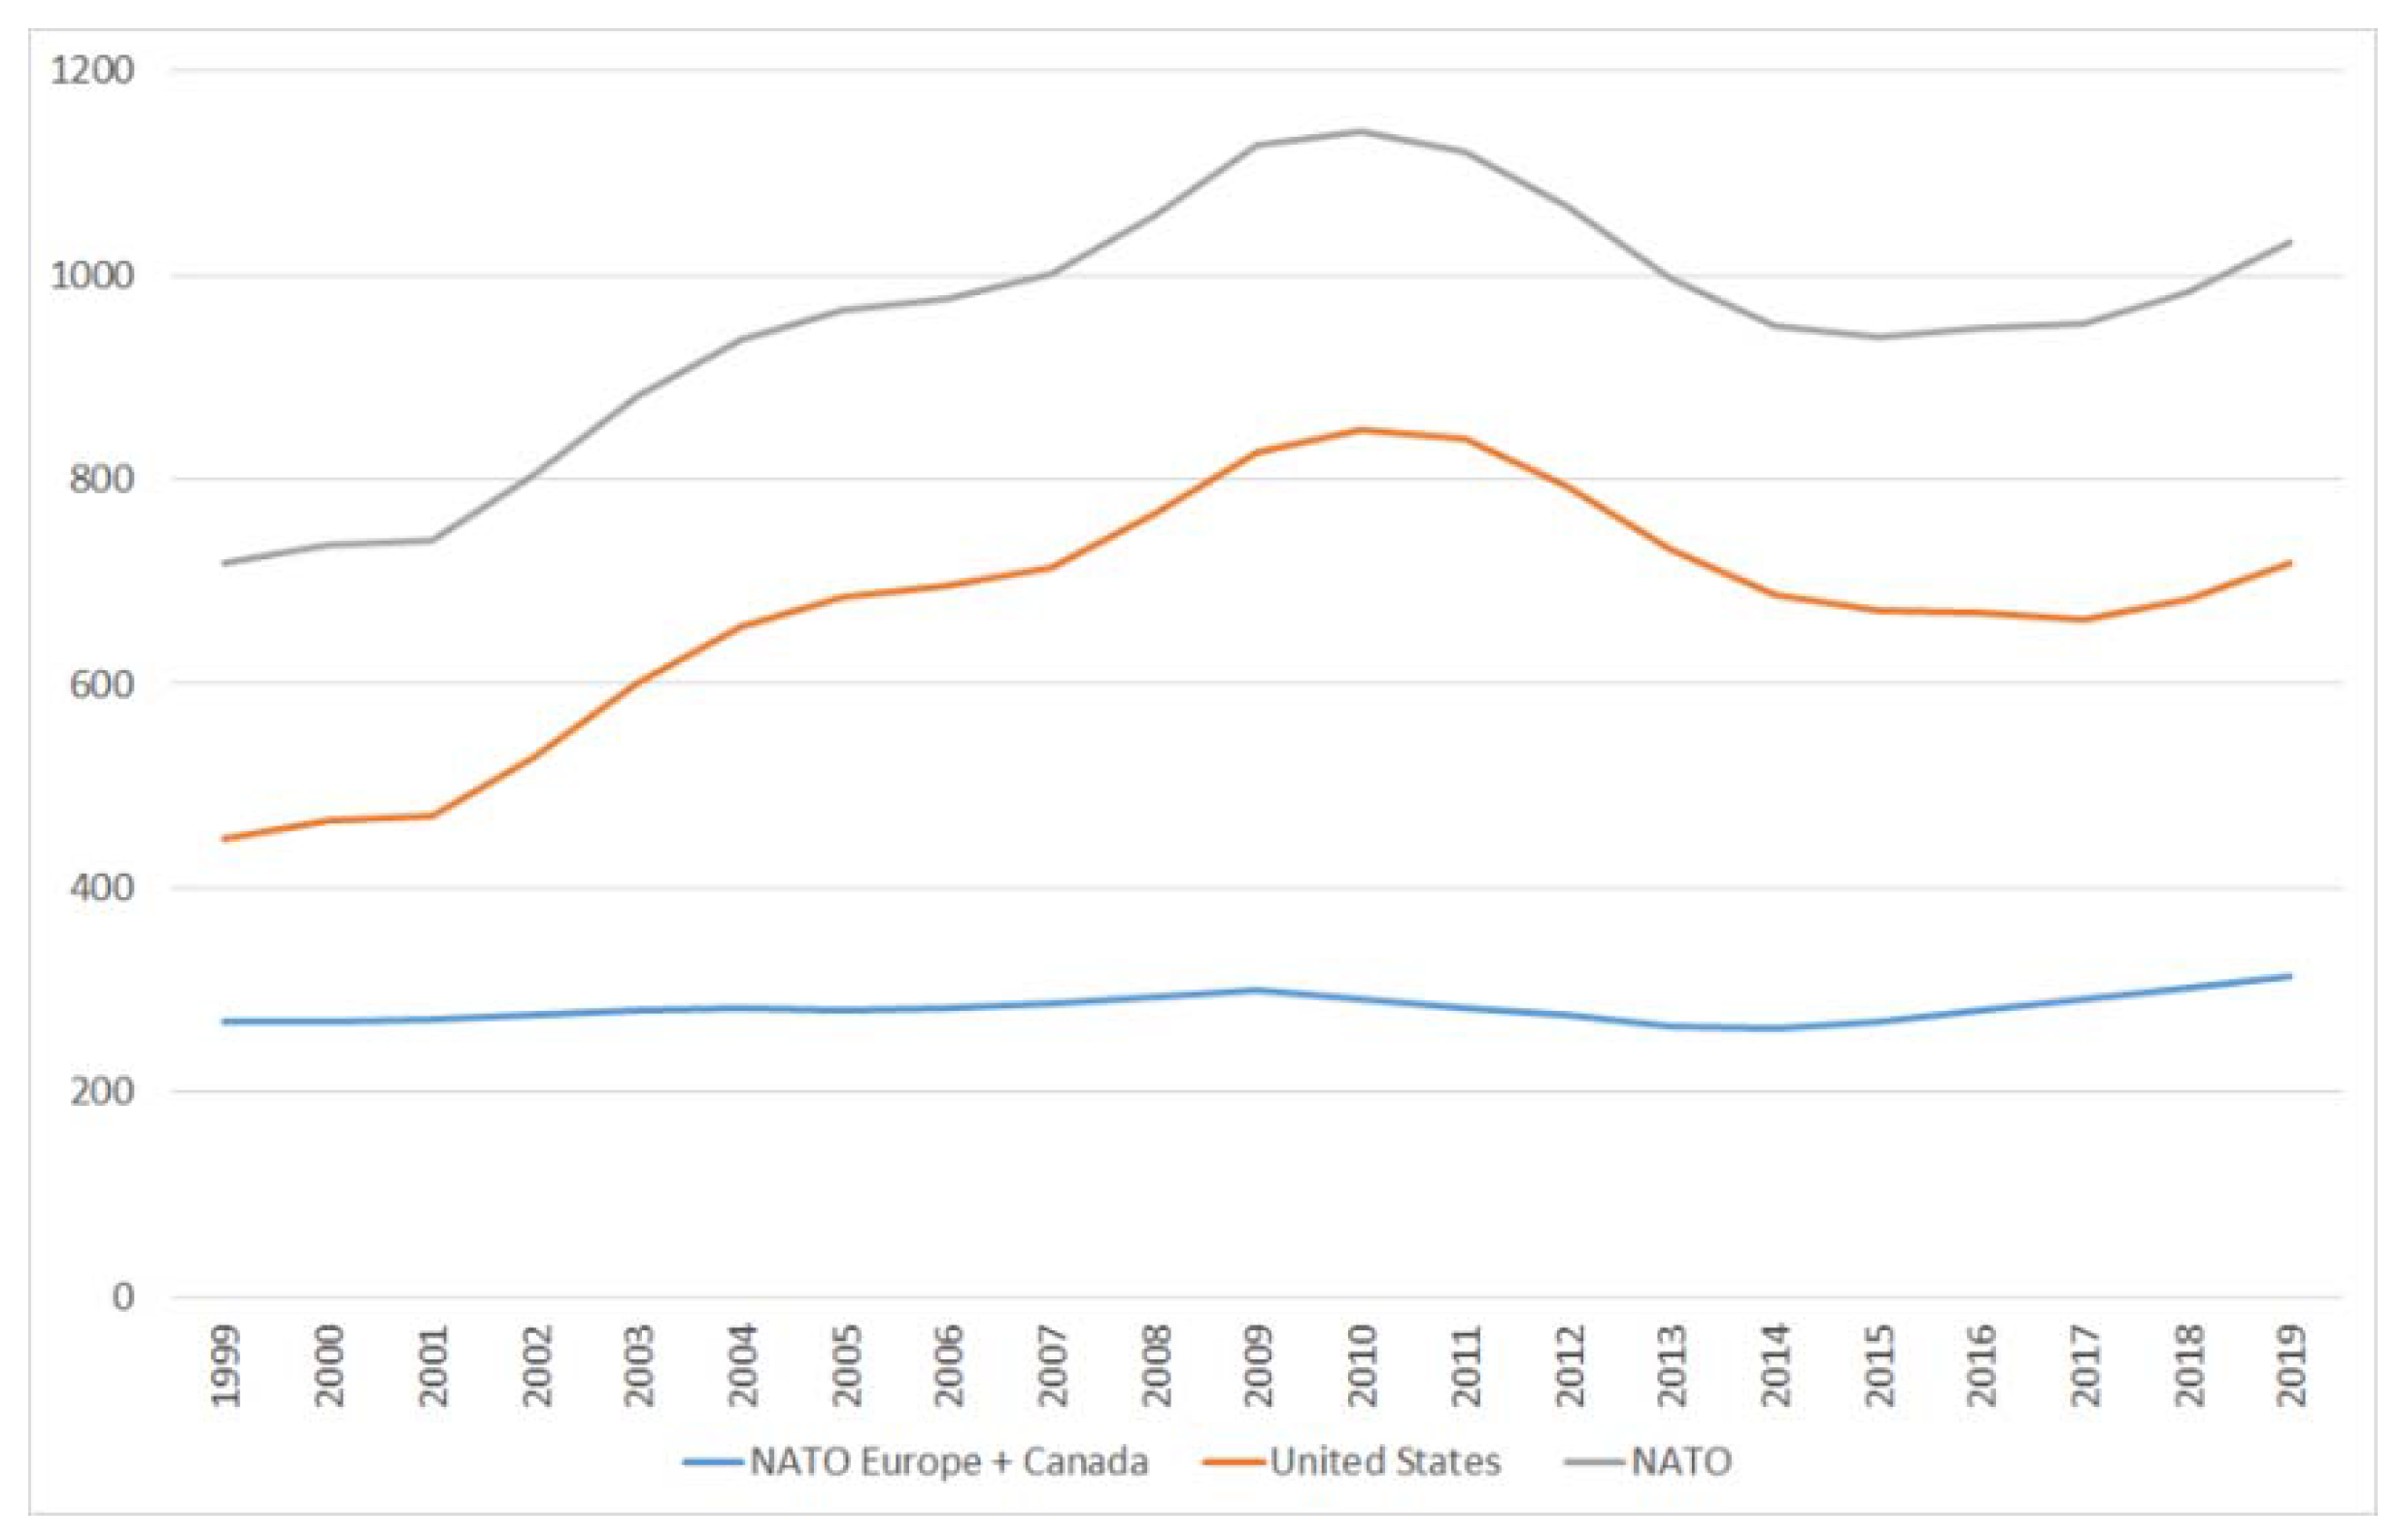
Military expenditure levels of the analysed countries from 1999 to 2019 (from the 1999 enlargement) show that military spending of the allies was influenced by the economic crisis, when military expenditure went down in the majority of member states, and by changed security environment connected with the war on terrorism (at the beginning of the analysed period) and Russian politics (at the end of the analysed period). Countries showing the largest increase in military expenditure year-on-year at the beginning of the monitored period, i.e., from 2001–2002, were Lithuania (63.5%), Norway (20.2%), Estonia (19.4%), USA (12.3%), Slovenia (10.9%), and Hungary (10.2%). After 2009 military expenditure went down especially in European member states in consequence of which the gap between the US and European countries widened considerably, see Figure 1.
US military expenditure levels show significant year-on-year changes in approx. five-year cycles. The largest year-on-year increase can be seen in 2001 and 2002, when military expenditure was influenced by the war on terrorism and wars in Afghanistan and Iraq. Military expenditure cuts were imposed in consequence of the economic crisis.
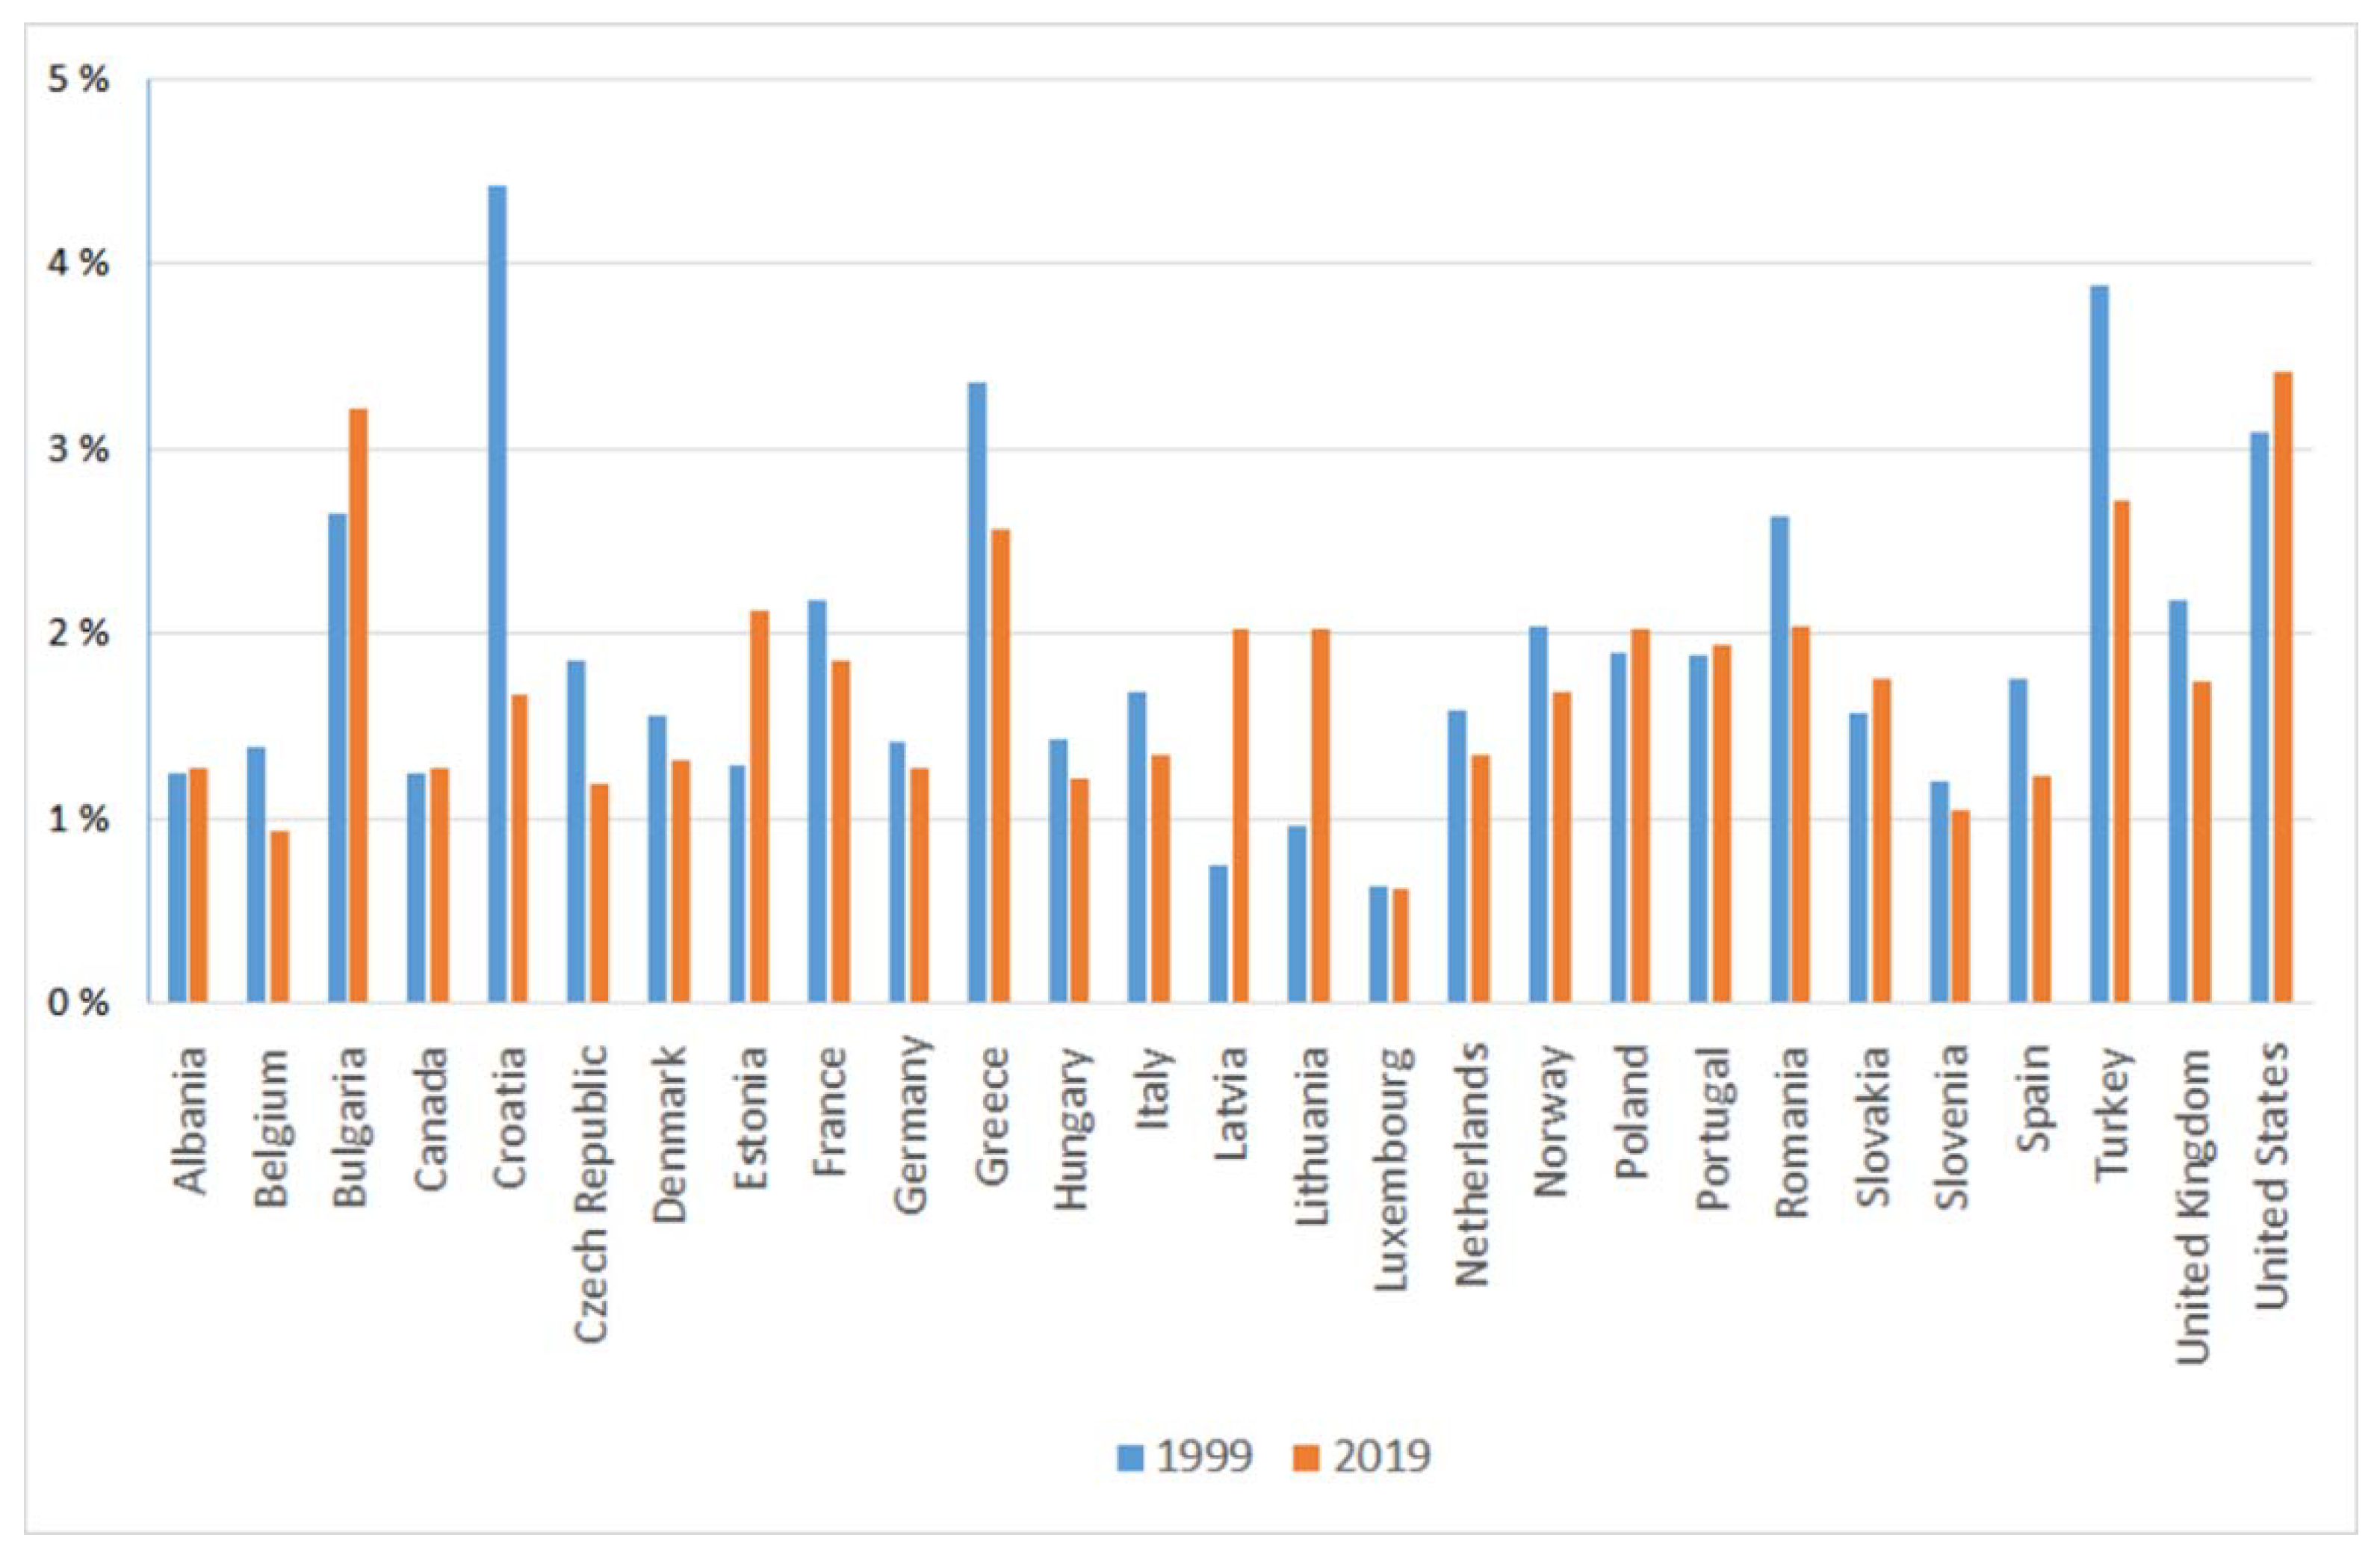
Similar US dominance can be seen when comparing military expenditure as a share of GDP, i.e., the indicator evaluating fulfilment of the political obligation to spend a minimum two percent of GDP on defence.
Figure 2 indicates military expenditure as a share of GDP at the beginning and at the end of the analysed period. The chart shows that countries fulfilling the political obligation to allocate two percent of GDP on defence are Bulgaria, Poland, Lithuania, Latvia, Estonia, Greece, Turkey, and the USA. The biggest military expenditure increase as a share of GDP can be seen in the new member states following their accession to the Alliance, namely Lithuania, Latvia, Estonia, and Bulgaria. The accelerating trend can be observed especially immediately after the 2014 NATO Summit in Wales, which confirmed the original allied obligation (see Holcner and Olejnicek 2017; Odehnal and Neubauer 2020). Non-excludability from collective capacity to resist an armed attack is stipulated in Article 3, with the result that not all the allies behave like followers, i.e., countries reflecting military expenditure of other member states in their spending. The ARDL model described below identifies the follower behaviour of countries demonstrating a positive correlation between military expenditure and the average military burden of NATO member states.
4. Models and Methods
Data concerning 27 countries from 1993 to 2019 has been used to identify the follower behaviour. We apply autoregressive distributed lag model ARDL (, , , …, ), where is the number of lags of the dependent variable , are numbers of lags of explanatory variables , . The model can be written as
where is a one-dimensional zero mean error term. It is possible to transform the model into a long-run representation showing the long run response of the dependent variable to a change in the explanatory variables (Baltagi 2011; Mills 2019). The long run estimates are given by (Pesaran and Shin 1999; Pesaran et al. 2001 )
Besides the dynamic description, the ARDL approach also offers testing of cointegration. The cointegrated system of time series can by estimated as ARDL model (Pesaran and Shin 1999) with the advantage that variables in a cointegrating relationship can be either or without needing to specify which are or . For the purpose of cointegration analysis, the form of (1) in differences is used.
where ECt = Yt − − , and . Pesaran et al. (2001) proposed a methodology to prove the long-run relationship that exists between an independent variable and regressors. For so-called bounds testing, they use the following representation of (3):
The long-run relationship is tested as follows and . The distribution of the test statistic based on (4) depends on whether the regressors are or . Pesaran et al. (2001) provides critical values for the cases where all regressors are and the cases where all regressors are . These critical values are used as the bound for the more typical cases where the regressors are a mixture of and .
ARDL models are among the popular and frequently used approaches in econometric studies, see, e.g., Marques et al. (2019); Menegaki (2019); Kurecic and Kokotovic (2017); Dimitraki and Win (2020); Feridun et al. (2011); or Malizard (2014).
5. Results and Discussion
The below variables (see Table 1) have been used in the model.
The model has been selected in accordance with the AIC criterion where the maximum lag (p and qj parameters in model (1)) is 1. The model has taken into consideration the short run series concerning some countries. Higher order lags caused numerical problems in setting the model parameters. The models concerning individual countries have been estimated for the period from 1993 or the year when the respective country joined NATO, see Appendix A, Table A1. The average military burden of NATO member states (NATOt) has been calculated as the average value of NATO member states that were members in the given year. If the sign of variable average military burden of NATO is positive, the country is a follower. The ARDL model applied to estimate the long-term relations has identified cointegration in the majority of countries (see bound F-test, Table 2). Canada, Croatia, Estonia, and Slovenia represent an exception.
The authors adopt the ARDL model based on Nikolaidou (2008) to identify the relationship between military spending and the average military burden (share of GDP) of NATO member states. A positive relationship implies that the ally behaves like a follower, increases its military expenditure when the average NATO military burden is increasing too. For example, in the case of Poland (see Table 2), all variables were significant, and we can reveal a positive link between military expenditures and GDP and average military burden of NATO member states. We can observe a negative effect in the case of population, government expenditure and trade balance. For Albania, there is no evidence that the analysed variables have had any effect on military expenditure. Generally, the estimated long-run coefficients (see Table 2) have revealed a positive (statistically significant) relationship between military expenditure levels and the variable describing the average military burden of NATO member states (share of GDP) of “followers”, i.e., countries that increase military expenditure when the average military burden of NATO member states is increasing. The below traditional allies can be considered followers: Belgium, Canada, Denmark, France, Germany, the Netherlands, Norway, Portugal, Spain, Turkey, and the United Kingdom. The following new member states behave like followers: Bulgaria, the Czech Republic, Hungary, Poland, Romania, and Slovakia. Cointegration has not been confirmed for Canada, Croatia, Estonia, and Slovenia. If compared, e.g., with the Janeliūnas and Zapolskis (2015) study analysing the behaviour of alliance’s economies through a burden sharing index that measures potential benefits and costs arising from NATO membership, the results have been in agreement as for the United Kingdom, Germany, France, Canada, Spain, the Netherlands, Belgium, Denmark, the Czech Republic, Portugal, and Norway. Similarly, the Nikolaidou (2008) results analysing selected 15 EU states indicate that Belgium, Denmark, Germany, Portugal, Spain, The Netherlands, and the UK are followers of the European NATO.
The results of the ARDL model (long–run estimates) simultaneously confirm a positive link between military expenditure and economic performance measured by gross domestic product in the majority of allies (Belgium, the Czech Republic, Denmark, Hungary, Italy, Latvia, Lithuania, Luxembourg, The Netherlands, Poland, Portugal, Romania, Slovakia, Slovenia, and Spain). According to the model, the development of military expenditure of the majority of NATO member states reflects the economic development of the respective country and can therefore be considered one of the major determinants of military expenditure. A negative link can be observed in Norway, and the USA (similarly in Abdelfattah et al. 2013). When the relationship between population and military expenditure is analysed (according to Nikolaidou (2008)) testing of the public good effect of defence (captured by the negative coefficient of the population variable), a negative link can be observed only in Belgium, the Czech Republic, Denmark, Poland, Spain, and the United Kingdom. The crowding-out effect of defence (captured by the negative coefficient of the non-defence government expenditures) can be seen in Hungary, Latvia, Italy, Poland, and Romania. The share of trade balance of GDP has a positive effect on military expenditure in Latvia and Lithuania, and negative effect in Belgium, Greece, Italy, Luxembourg, Poland, Spain, Turkey, and the USA.
The results of the estimated ARDL model analysing the short-run relationship between military expenditure amount and selected socioeconomic variables show a positive relationship between military expenditure and the average military burden (share of GDP) of NATO member states in Bulgaria, the Czech Republic, Germany, Lithuania, Latvia, Norway, Poland, and Slovakia (see Table 3). A negative link has been revealed in Luxembourg and Slovenia. The most significant short-term effect has been observed in the estimated values for Latvia and Lithuania (coefficients 4.155 and 2.399, respectively). It corresponds with the military expenditure development of these countries that doubled from 2015 to 2019, which is a unique phenomenon among the allies over such a short period of time. This dramatic increase in military spending of Baltic States has been triggered by the changing security environment and their geographical proximity to Russia. A similar short-term trend has been identified in Bulgaria too (estimated coefficient 1.625), where the military expenditure increase from 2016 to 2019 was more than double. This dramatic increase has been brought about by investments in the armed forces modernization, e.g., purchase of F-16 Fighting Falcons. Additionally, Slovakia shows a double increase in military spending between 2014 and 2019 (coefficient 2.800), which is connected with the efforts to achieve the two percent of GDP Alliance’s spending target as early as 2022. The short-term effects of the estimated ARDL model show that especially new member states rank among so called followers as these countries are aware of their underestimated military expenditure and their obligations arising therefrom.
6. Conclusions
Economic theory suggests that defence is a typical example of a public good, i.e., a good characterized by non-excludability and non-rivalry. Non-excludability is enshrined in Article 5 of the Washington Treaty, the collective-defence clause, and non-rivalry is based on the weapon systems and deterrence policy arising from the existence of weapons of mass destruction. The theory therefore suggests that non-excludability from the consumption of this good naturally leads to behaviour called free riding. The unwillingness to pay for collective defence can be seen in the long-term failure to fulfil the obligation to allocate two percent of gross domestic product on defence. The paper has analysed the relationship between military expenditure of NATO member states and selected primarily economic variables with the aim of identifying countries displaying characteristics of follower behaviour, it means countries following the average military burden of NATO member states calculated as a share of GDP. The model results revealing potential followers in NATO simultaneously point out a simplified view that is often taken when evaluating the Allies exclusively according to whether their military expenditures have reached the two percent share of GDP. The short-term ARDL model results demonstrate follower behaviour especially in the new member states, such as Lithuania, Latvia, Poland, the Czech Republic, Slovakia, and Bulgaria. Out of the traditional countries Germany and Norway can be considered followers. A significant increase in military expenditure of new allies can be observed in the analysed period triggered by their efforts to fulfil their political obligation and changed security and economic environments of these countries, which encourages military expenditure on modernization of the armed forces, increase in the number of soldiers, and especially investments. It is not surprising that, with the exception of the Czech Republic, these new member states follow the recommendation to allocate 20 percent on investment. From the long-run perspective, the below countries behave like followers: Belgium, Bulgaria, Canada, the Czech Republic, Denmark, France, Germany, Hungary, the Netherlands, Norway, Poland, Portugal, Romania, Slovakia Spain, Turkey, and the United Kingdom. The model results reveal the efforts of the new member states to fulfil their obligation to increase military expenditure, which initiates follower behaviour. However, the long-term sustainability of this trend is in doubt in light of the anticipated economic performance impairment, ballooning deficits of state budgets, and massive national debts as inevitable negative economic consequences of the current pandemic.
Author Contributions
Conceptualization, J.O. and J.N.; methodology, J.N. and J.O.; software, J.N.; validation, J.O. and J.N. and L.B.; data curation, J.N. and J.O.; writing—original draft preparation, J.O., J.N., A.O., and J.B.; writing—review and editing, J.O., J.N., and L.B.; visualization, J.N.; supervision, J.O. and J.N. All authors have read and agreed to the published version of the manuscript.
Funding
This article has been supported by the Czech Republic Ministry of Defence—Faculty of Military Leadership of University of Defence development program “AERO”.
Acknowledgments
We thank the editor, the anonymous referees for their useful comments and suggestions that improved this work.
Conflicts of Interest
The authors declare no conflict of interest.
Appendix A

Table A1.
ARDL model parameter estimates; standard errors of the estimates are in parenthesis (note: * p < 0.1, ** p < 0.05, *** p < 0.01).
Table A1.
ARDL model parameter estimates; standard errors of the estimates are in parenthesis (note: * p < 0.1, ** p < 0.05, *** p < 0.01).
| LMILEXt−1 | LGDPt | LGDPt−1 | LPOPt | LPOPt−1 | LNONt | LNONt−1 | TBt | TBt−1 | NATOt | NATOt−1 | Const. | |
|---|---|---|---|---|---|---|---|---|---|---|---|---|
| Albania | 0.780 * | 5.267 * | 28.032 | −0.502 | −0.002 | −0.229 | −461.690 | |||||
| (0.323) | (2.191) | (17.509) | (0.577) | (0.020) | (0.335) | (279.799) | ||||||
| Belgium | 0.438 ** | 0.471 ** | −1.792 * | −0.075 | −0.02 *** | 0.150 * | 28.407* | |||||
| (0.203) | (0.169) | (0.958) | (0.299) | (0.007) | (0.073) | (14.043) | ||||||
| Bulgaria | −0.427 | 2.781 | −6.073 * | 207.236 | −257.204 | −1.715 | 1.211 | −0.057 ** | −0.026 | 1.625 | 3.233 * | 833.499 |
| (0.701) | (2.311) | (2.094) | (125.966) | (123.251) | (1.355) | (1.134) | (0.017) | (0.020) | (1.032) | (1.308) | (371.845) | |
| Canada | 0.442 | 0.618 | −0.018 | 1.330 | −1.214 | −0.012 | 0.346 | −5.128 | ||||
| (0.308) | (0.631) | (1.295) | (1.113) | (0.792) | (0.014) | (0.247) | (13.969) | |||||
| Croatia | −0.272 | 0.354 | 1.110 | 1.128 | −0.007 | −0.116 | −23.350 | |||||
| (0.471) | (1.792) | (2.622) | (1.583) | (0.024) | (0.701) | (51.268) | ||||||
| Czech Republic | −0.127 | 0.912 | −11.33 *** | 0.129 | 0.021 | 0.018 | 0.874 *** | 0.564 | 176.950 *** | |||
| (0.259) | (0.552) | (2.333) | (0.244) | (0.014) | (0.015) | (0.214) | (0.385) | (36.540) | ||||
| Denmark | −0.518 | 0.403 | 0.896 | −31.05 *** | 27.928 ** | −0.035 | 1.270 | −0.001 | −0.010 | 0.689 *** | 29.010 | |
| (0.332) | (0.482) | (0.542) | (10.149) | (9.951) | (0.465) | (0.740) | (0.007) | (0.008) | (0.170) | (20.902) | ||
| Estonia | 0.564 * | 0.826 | −8.463 | −0.185 | −0.117 | −0.005 | 0.001 | 0.270 | 115.976 | |||
| (0.268) | (0.531) | (26.982) | (1.098) | (0.625) | (0.016) | (0.009) | (1.454) | (384.683) | ||||
| France | 0.380 * | −0.299 | 3.119 * | 1.459 ** | −1.669 ** | −0.007 | 0.014 | 0.190 *** | −42.362 * | |||
| (0.185) | (0.216) | (1.733) | (0.578) | (0.593) | (0.011) | (0.011) | (0.056) | (23.677) | ||||
| Germany | 0.368 * | 0.145 | −2.152 * | 1.467 | 0.456 *** | −0.003 | 0.399 *** | −0.266 ** | 10.322 | |||
| (0.209) | (0.207) | (1.228) | (0.916) | (0.144) | (0.004) | (0.110) | (0.098) | (14.024) | ||||
| Greece | 0.117 | 0.167 | 32.412 * | −35.47 ** | 0.155 | −0.007 | −0.016 | 0.199 | −0.584 ** | 54.049 | ||
| (0.232) | (0.337) | (17.420) | (14.686) | (0.300) | (0.010) | (0.012) | (0.346) | (0.261) | (66.140) | |||
| Hungary | 0.223 | 3.097 *** | −0.592 * | −38.38 ** | 46.814 ** | −0.951 ** | 0.004 | 0.665 *** | −150.424 * | |||
| (0.163) | (0.658) | (0.332) | (15.798) | (16.723) | (0.409) | (0.010) | (0.156) | (69.086) | ||||
| Italy | 0.172 | 0.065 | 1.206 *** | −1.118 | −1.068 ** | −0.015 | 0.168 * | 24.536 | ||||
| (0.165) | (0.376) | (0.404) | (1.188) | (0.442) | (0.010) | (0.092) | (18.852) | |||||
| Latvia | −0.086 | 3.978 ** | 2.709 * | −59.767 | 68.788 * | −0.343 | −3.513 * | 0.001 | 0.070 ** | 4.155 ** | −4.259 * | −157.885 * |
| (0.319) | (0.856) | (1.119) | (30.344) | (28.702) | (1.027) | (1.108) | (0.017) | (0.014) | (0.970) | (1.431) | (49.917) | |
| Lithuania | 0.882 *** | 2.988 *** | −23.1 *** | 35.275 *** | −0.431 ** | 0.196 | 0.031 ** | 0.040 *** | 2.399 *** | −4.281 *** | −206.994 *** | |
| (0.045) | (0.343) | (2.336) | (3.907) | (0.109) | (0.130) | (0.008) | (0.005) | (0.261) | (0.370) | (33.255) | ||
| Luxembourg | 0.041 | 0.615 | 2.028 * | −42.17 ** | 45.084 ** | −1.029 * | −0.007 | −0.038 * | −1.390 * | 2.288 ** | −50.572 *** | |
| (0.259) | (1.207) | (1.097) | (15.840) | (16.512) | (0.571) | (0.018) | (0.018) | (0.758) | (0.908) | (11.690) | ||
| Netherlands | 0.215 | 0.796 *** | −9.078 ** | 8.906 ** | 0.085 | −0.005 | 0.459 *** | *** | −2.459 | |||
| (0.189) | (0.168) | (3.814) | (3.830) | (0.141) | (0.006) | (0.071) | (12.273) | |||||
| Norway | −0.080 | −0.027 | −0.714 * | −0.215 | 1.477 ** | −0.002 | 0.007 | 0.506 *** | −0.267 | 4.033 | ||
| (0.255) | (0.284) | (0.374) | (1.023) | (0.542) | (0.004) | (0.004) | (0.147) | (0.187) | (12.857) | |||
| Poland | −0.652 *** | 2.805 *** | −0.994 ** | −109.781 *** | −0.721 * | −0.394 | 0.001 | −0.020 ** | 1.097 *** | −0.709 ** | 1920.426 *** | |
| (0.191) | (0.461) | (0.351) | (25.348) | (0.331) | (0.334) | (0.005) | (0.009) | (0.241) | (0.228) | (444.116) | ||
| Portugal | −0.374 | 1.383 *** | −26.418 * | 27.276 * | 0.027 | 0.008 | −0.016 | 0.155 | 0.334 | −20.586 | ||
| (0.214) | (0.437) | (15.093) | (13.601) | (0.307) | (0.008) | (0.011) | (0.230) | (0.246) | (37.775) | |||
| Romania | 0.024 | 2.235 ** | 17.811 | −18.670 | −0.519 | −0.717 | −0.011 | 0.010 | 1.004 * | 7.150 | ||
| (0.362) | (0.822) | (18.588) | (14.507) | (0.560) | (0.397) | (0.013) | (0.014) | (0.466) | (121.802) | |||
| Slovakia | −0.603 | 1.329 * | −142.8 * | 126.976 * | −0.286 | 0.602 | −0.001 | 2.800 *** | −0.759 | 235.017 | ||
| (0.507) | (0.573) | (60.853) | (57.189) | (0.510) | (0.618) | (0.014) | (0.676) | (0.521) | (227.794) | |||
| Slovenia | −0.201 | 0.120 | 2.930 | 1.568 | −18.650 | 0.140 | 0.390 | 0.001 | −1.492 | 1.944 | 217.037 | |
| (0.656) | (0.685) | (1.904) | (20.008) | (17.750) | (0.500) | (0.492) | (0.028) | (1.326) | (1.299) | (124.357) | ||
| Spain | −0.282 | 0.219 | 0.744 | −13.6 *** | 12.356 *** | 0.207 | −0.030 *** | 0.298 *** | *** | 19.418 * | ||
| (0.179) | (0.279) | (0.433) | (2.945) | (2.868) | (0.311) | (0.006) | (0.079) | (10.668) | ||||
| Turkey | −0.096 | 0.578 | 72.193 *** | −72.34 *** | 0.567 ** | 0.441 | −0.031 * | 1.806 *** | *** | −10.649 | ||
| (0.166) | (0.497) | (21.098) | (20.018) | (0.245) | (0.284) | (0.016) | (0.290) | (30.037) | ||||
| United Kingdom | 0.257 | −0.353 ** | 0.224 | −1.665 *** | 0.772 ** | −0.011 | 0.134 *** | *** | 29.001 *** | |||
| (0.238) | (0.160) | (0.142) | (0.542) | (0.295) | (0.007) | (0.029) | (9.961) | |||||
| United States | 0.558 *** | −1.110 * | 1.256 | 1.034 ** | −0.058 ** | 0.028 | 0.173 | −16.689 | ||||
| (0.143) | (0.546) | (1.798) | (0.342) | (0.019) | (0.228) | (0.206) | (24.930) |
References
- Abdelfattah, Yasmine, Aamer S. Abu-Qarn, J. Paul Dunne, and Shadwa Zaher. 2013. The Demand for Military Spending in Egypt: A panel analysis. Defence and Peace Economics 25: 231–45. [Google Scholar] [CrossRef] [Green Version]
- Baltagi, Badi H. 2011. Econometrics, 5th ed. New York: Springer. [Google Scholar]
- Dimitraki, Ourania, and Sandar Win. 2020. Military Expenditure Economic Growth Nexus in Jordan: An Application of ARDL Bound Test Analysis in the Presence of Breaks. Defence and Peace Economics. [Google Scholar] [CrossRef]
- Feridun, Mete, Bansi Sawhney, and Muhammad Shahbaz. 2011. The Impact of Military Spending on Economic Growth: The Case of North Cyprus. Defence and Peace Economics 22: 555–62. [Google Scholar] [CrossRef]
- Gonzalez, Pedro, and Daniel Montolio. 2001. Has Spain been free-riding in NATO? An econometric approach. Defence and Peace Economics 12: 465–85. [Google Scholar]
- Hampl, Mojmír. 2001. Trojí přístup k veřejným statkům. Finance a úvěr 51: 111–25. [Google Scholar]
- Holcner, Vladan, and Ales Olejnícek. 2017. Possibilities of Defense Spending Stabilization. Journal of Security Sustainability Issues 7: 5–16. [Google Scholar] [CrossRef]
- Jackson, Peter, and Charles Brown. 2003. The Economics of Public Sector. Prague: Eurolex Bohemia, pp. 250–65. [Google Scholar]
- Janeliūnas, Tomas, and Martynas Zapolskis. 2015. Lithuania as a Rational Free Rider in NATO. In Robert Czulda, Marek Madej. Newcomers no more? Contemporary NATO and the Future of the Enlargement from the Perspective of “Post-Cold War” Members. 1. vyd. Warsaw, Prague and Brussels: International Relations Research Institute in Warsaw, ISBN 978-83-62784-04-2. [Google Scholar]
- Khanna, Jyoti, and Todd Sandler. 1996. NATO Burden Sharing: 1960–1992. Defence and Peace Economics 7: 115–33. [Google Scholar] [CrossRef]
- Kurecic, Petar, and Filip Kokotovic. 2017. The Relevance of Political Stability on FDI: A VAR Analysis and ARDL Models for Selected Small, Developed, and Instability Threatened Economies. Economies 5: 22. [Google Scholar] [CrossRef] [Green Version]
- Malizard, Julien. 2014. Defense Spending and Unemployment in France. Defence and Peace Economics 25: 635–42. [Google Scholar] [CrossRef]
- Mankiw, Gregory. 1999. Principles of Economica. Prague: Grada, pp. 31–44. [Google Scholar]
- Marques, Luís Miguel, José Alberto Fuinhas, and António Cardoso Marques. 2019. Are There Spillovers from Chinaon the Global Energy-Growth Nexus? Evidence from Four World Regions. Economies 7: 59. [Google Scholar] [CrossRef] [Green Version]
- Menegaki, Angeliki N. 2019. The ARDL Method in the Energy-Growth Nexus Field; Best Implementation Strategies. Economies 7: 105. [Google Scholar] [CrossRef] [Green Version]
- Mills, Terence C. 2019. Applied Time Series Analysis: A Practical Guide to Modeling and Forecasting. London: Academic Press. [Google Scholar]
- Nikolaidou, Eftychia. 2008. The demand for military expenditure: Evidence from the EU15 (1961–2005). Defence and Peace Economics 21: 273–92. [Google Scholar] [CrossRef] [Green Version]
- Odehnal, Jakub, and Jiri Neubauer. 2020. Economic, Security, and Political Determinants of Military Spending in NATO Countries. Defence and Peace Economics 31: 517–31. [Google Scholar] [CrossRef]
- Olson, Mancur. 1965. The Logic of Collective Action. Cambridge: Harvard University Press. [Google Scholar]
- Olson, Mancur, and Richard Zeckhauser. 1966. An Economic Theory of Alliances. Review of Economics and Statistics 48: 266–79. [Google Scholar] [CrossRef]
- Pesaran, M. Hashem, and Yongcheol Shin. 1999. An Autoregressive Distributed Lag Modelling Approach to Cointegration Analysis. In Econometrics and Economic Theory in the 20th Century: The Ragnar Frisch Centennial Symposium. Edited by S. Strom. Cambridge: Cambridge University Press. [Google Scholar]
- Pesaran, M. Hashem, Yongcheol Shin, and Richard J. Smith. 2001. Bounds Testing Approaches to the Analysis of Level Relationships. Journal of Applied Econometrics 16: 298–326. [Google Scholar] [CrossRef]
- Plümper, Thomas, and Eric Neumayer. 2014. Free-riding in alliances testing: An old theory with a new method. Conflict Management and Peace Science 32: 247–68. [Google Scholar] [CrossRef] [Green Version]
- Russett, Bruce M. 1970. What Price Vigilance? New Haven: Yale University Press. [Google Scholar]
- Samuelson, Paul A. 1954. The Pure Theory of Public Expenditure. Review of Economics and Statistics 36: 387–389. [Google Scholar] [CrossRef]
- Samuelson, Paul A., and William D. Nordhaus. 1991. Economics. Prague: Svoboda Publishing, pp. 83–99. [Google Scholar]
- Sandler, Todd. 1977. Impurity of Defense: An Application to the Economics of Alliances. Kyklos 30: 443–60. [Google Scholar] [CrossRef]
- Sandler, Todd, and James C. Murdoch. 2000. On Sharing NATO Defence Burdens in the 1990s and Beyond. Fiscal Studies 21: 297–327. [Google Scholar] [CrossRef] [Green Version]
- Schiller, Bradley R. 2004. Microeconomics. Brno: Computer Press, pp. 251–61. [Google Scholar]
- SIPRI. 2021. Military Expenditure. Available online: https://www.sipri.org/sites/default/files/SIPRI-Milex-data-1988-2019.xlsx (accessed on 21 January 2021).
- Smith, Adam. 2001. The Wealth of Nations. Prague: Liberal Institute. First published 1776. [Google Scholar]
- Stiglitz, Josef E. 1997. Public Sector Economics. Prague: Grada Publishing, pp. 353–67. [Google Scholar]
- Tambovtsev, Vitaly L. 2014. Public goods and Public interests: Is There a Connection? Voprosy Ekonomiki 11: 25–40. [Google Scholar] [CrossRef]
- Van Ypersele de Strihou, Jaques. 1967. Sharing the defence burden among western allies. Review of Economics and Statistics 49: 527–36. [Google Scholar] [CrossRef]
- World Bank. 2021. External Balance on Goods and Services (% of GDP). Available online: https://www.sipri.org/sites/default/files/SIPRI-Milex-data-1988-2019.xlsx (accessed on 21 January 2021).
- Wukki, Kim, and Todd Sandler. 2019. NATO at 70: Pledges, Free Riding, and Benefit-Burden Concordance. Defence and Peace Economics 31: 400–13. [Google Scholar]
Figure 1.
Military expenditures (Billions USD, constant 2018 prices).

Figure 2.
Military expenditures as a percentage of GPD.

Table 1.
Description of variables.
| Variables | Decription |
|---|---|
| LMILEXt | Military expenditure logarithm in constant USD 2018 prices |
| LGDPt | Gross domestic product logarithm |
| LPOPt | Population logarithm |
| LNONt | Government expenditure logarithm—excluding military expenditure |
| TBt | Trade balance as a share of GDP |
| NATOt | Average military burden of NATO member states (percentage of GDP) |
Table 2.
ARDL model parameter estimates for each country (long-run with bound F-test); standard errors of the estimates are in parenthesis (note: * p < 0.1, ** p < 0.05, *** p < 0.01).
Table 2.
ARDL model parameter estimates for each country (long-run with bound F-test); standard errors of the estimates are in parenthesis (note: * p < 0.1, ** p < 0.05, *** p < 0.01).
| LGDP | LPOP | LNON | TB | NATO | Const. | Bound F−test | ||||||||
|---|---|---|---|---|---|---|---|---|---|---|---|---|---|---|
| Albania | 23.927 | 127.334 | −2.281 | −0.007 | −1.039 | −2097.232 | 3.205 | * | ||||||
| (38.311) | (204.420) | (4.299) | (0.088) | (2.431) | (3372.226) | |||||||||
| Belgium | 0.838 | * | −3.189 | *** | −0.133 | −0.041 | *** | 0.268 | ** | 50.532 | *** | 3.627 | ** | |
| (0.468) | (1.036) | (0.564) | (0.013) | (0.121) | (12.786) | |||||||||
| Bulgaria | −2.307 | −35.012 | −0.353 | −0.058 | 3.404 | * | 584.033 | 4.198 | *** | |||||
| (1.943) | (23.448) | (1.173) | (0.028) | (1.279) | (396.705) | |||||||||
| Canada | 1.107 | −0.032 | 0.206 | −0.022 | 0.619 | * | −9.182 | 1.516 | ||||||
| (1.260) | (2.313) | (1.614) | (0.029) | (0.319) | (25.525) | |||||||||
| Croatia | 0.278 | 0.873 | 0.886 | −0.006 | −0.092 | −18.352 | 1.800 | |||||||
| (1.397) | (1.956) | (1.221) | (0.018) | (0.551) | (38.339) | |||||||||
| Czech Republic | 0.809 | ** | −10.060 | *** | 0.114 | 0.034 | 1.276 | *** | 157.006 | *** | 5.708 | *** | ||
| (0.348) | (1.953) | (0.228) | (0.023) | (0.225) | (32.706) | |||||||||
| Denmark | 0.856 | *** | −2.060 | * | 0.813 | ** | −0.007 | 0.454 | *** | 19.110 | 5.589 | *** | ||
| (0.234) | (1.160) | (0.306) | (0.006) | (0.074) | (12.444) | |||||||||
| Estonia | 1.898 | −19.432 | −0.693 | −0.008 | 0.619 | 266.285 | 1.244 | |||||||
| (1.631) | (66.679) | (2.711) | (0.034) | (3.476) | (947.950) | |||||||||
| France | −0.482 | 5.034 | −0.339 | 0.011 | 0.306 | *** | −68.358 | 4.503 | *** | |||||
| (0.343) | (3.069) | (0.902) | (0.014) | (0.072) | (42.955) | |||||||||
| Germany | 0.230 | −1.083 | 0.722 | ** | −0.005 | 0.210 | ** | 16.340 | 4.069 | ** | ||||
| (0.293) | (1.034) | (0.294) | (0.006) | (0.073) | (19.173) | |||||||||
| Greece | 0.189 | −3.471 | 0.176 | −0.026 | * | −0.436 | 61.243 | 5.799 | *** | |||||
| (0.401) | (5.452) | (0.334) | (0.014) | (0.294) | (86.170) | |||||||||
| Hungary | 3.225 | *** | 10.857 | * | −1.225 | * | 0.005 | 0.856 | *** | −193.658 | ** | 8.057 | *** | |
| (0.797) | (5.085) | (0.592) | (0.013) | (0.235) | (85.962) | |||||||||
| Italy | 1.535 | *** | −1.351 | −1.290 | ** | −0.018 | * | 0.203 | 29.646 | 6.714 | *** | |||
| (0.330) | (1.351) | (0.584) | (0.010) | (0.119) | (20.562) | |||||||||
| Latvia | 6.158 | ** | 8.308 | * | −3.551 | * | 0.066 | * | −0.095 | −145.397 | * | 7.958 | *** | |
| (1.323) | (3.445) | (1.266) | (0.023) | (0.908) | (52.709) | |||||||||
| Lithuania | 25.389 | * | 102.971 | * | −1.999 | 0.609 | * | −15.996 | −1758.632 | * | 128.445 | *** | ||
| (9.899) | (45.461) | (1.177) | (0.269) | (7.220) | (771.855) | |||||||||
| Luxembourg | 2.754 | ** | 3.036 | * | −1.072 | −0.047 | ** | 0.937 | −52.709 | *** | 3.969 | ** | ||
| (1.175) | (1.480) | (0.626) | (0.021) | (0.542) | (16.312) | |||||||||
| Netherlands | 1.014 | *** | −0.219 | 0.108 | −0.006 | 0.584 | *** | −3.131 | 10.572 | *** | ||||
| (0.156) | (1.045) | (0.161) | (0.008) | (0.093) | (16.146) | |||||||||
| Norway | −0.686 | ** | −0.199 | 1.367 | *** | 0.004 | 0.221 | ** | 3.734 | 3.661 | ** | |||
| (0.260) | (0.942) | (0.351) | (0.004) | (0.104) | (11.822) | |||||||||
| Poland | 1.096 | *** | −66.467 | *** | −0.676 | *** | −0.012 | ** | 0.235 | *** | 1162.727 | *** | 12.039 | *** |
| (0.182) | (13.687) | (0.166) | (0.005) | (0.069) | (239.999) | |||||||||
| Portugal | 1.006 | *** | 0.625 | 0.020 | −0.006 | 0.356 | *** | −14.985 | 6.565 | *** | ||||
| (0.310) | (1.812) | (0.223) | (0.009) | (0.094) | (27.336) | |||||||||
| Romania | 2.290 | *** | −0.880 | −1.266 | * | −0.001 | 1.029 | *** | 7.329 | 5.192 | *** | |||
| (0.536) | (6.965) | (0.615) | (0.017) | (0.256) | (125.552) | |||||||||
| Slovakia | 0.829 | ** | −9.870 | 0.197 | −0.001 | 1.273 | *** | 146.585 | 4.121 | ** | ||||
| (0.302) | (7.176) | (0.272) | (0.009) | (0.234) | (109.358) | |||||||||
| Slovenia | 2.538 | ** | −14.218 | 0.441 | 0.001 | 0.376 | 180.647 | 1.824 | ||||||
| (0.794) | (10.612) | (0.766) | (0.024) | (0.403) | (141.148) | |||||||||
| Spain | 0.751 | *** | −1.043 | * | 0.162 | −0.024 | *** | 0.233 | *** | 15.145 | * | 8.936 | *** | |
| (0.146) | (0.561) | (0.242) | (0.004) | (0.057) | (7.799) | |||||||||
| Turkey | 0.527 | −0.142 | 0.919 | *** | −0.028 | * | 1.648 | *** | −9.715 | 15.320 | *** | |||
| (0.437) | (1.873) | (0.236) | (0.015) | (0.127) | (27.537) | |||||||||
| United Kingdom | −0.173 | −2.240 | *** | 1.039 | *** | −0.014 | 0.180 | *** | 39.031 | *** | 19.259 | *** | ||
| (0.158) | (0.261) | (0.084) | (0.014) | (0.058) | (3.650) | |||||||||
| United States | −2.513 | ** | 2.843 | 2.340 | *** | −0.132 | *** | 0.455 | −37.767 | 15.183 | *** | |||
| (1.006) | (3.934) | (0.566) | (0.033) | (0.363) | (54.943) |
Table 3.
ARDL model parameter estimates for each country (short-run); standard errors of the estimates are in parenthesis (note: * p < 0.1, ** p < 0.05, *** p < 0.01).
Table 3.
ARDL model parameter estimates for each country (short-run); standard errors of the estimates are in parenthesis (note: * p < 0.1, ** p < 0.05, *** p < 0.01).
| ΔLGDP | ΔLPOP | ΔLNON | ΔTB | ΔNATO | EC | |||||||
|---|---|---|---|---|---|---|---|---|---|---|---|---|
| Albania | −0.220 | *** | ||||||||||
| (0.029) | ||||||||||||
| Belgium | −0.562 | *** | ||||||||||
| (0.097) | ||||||||||||
| Bulgaria | 2.781 | ** | 207.236 | *** | −1.715 | ** | −0.057 | *** | 1.625 | *** | −1.427 | *** |
| (0.617) | (22.778) | (0.471) | (0.007) | (0.258) | (0.152) | |||||||
| Canada | 1.330 | *** | −0.558 | *** | ||||||||
| (0.412) | (0.148) | |||||||||||
| Croatia | −1.272 | *** | ||||||||||
| (0.227) | ||||||||||||
| Czech Republic | 0.021 | ** | 0.874 | *** | −1.127 | *** | ||||||
| (0.007) | (0.120) | (0.143) | ||||||||||
| Denmark | 0.403 | −31.054 | *** | −0.035 | −0.001 | −1.518 | *** | |||||
| (0.271) | (4.439) | (0.320) | (0.005) | (0.205) | ||||||||
| Estonia | −0.185 | −0.005 | −0.436 | *** | ||||||||
| (0.326) | (0.005) | (0.108) | ||||||||||
| France | 1.459 | *** | −0.007 | −0.620 | *** | |||||||
| (0.243) | (0.007) | (0.095) | ||||||||||
| Germany | −2.152 | ** | 0.399 | *** | −0.632 | *** | ||||||
| (0.807) | (0.048) | (0.102) | ||||||||||
| Greece | 32.412 | *** | −0.007 | 0.199 | −0.883 | *** | ||||||
| (4.154) | (0.006) | (0.148) | (0.118) | |||||||||
| Hungary | 3.097 | *** | −38.381 | *** | −0.777 | *** | ||||||
| (0.268) | (5.580) | (0.084) | ||||||||||
| Italy | 0.065 | −0.828 | *** | |||||||||
| (0.233) | (0.105) | |||||||||||
| Latvia | 3.978 | *** | −59.767 | *** | −0.343 | 0.001 | 4.155 | *** | −1.086 | *** | ||
| (0.304) | (4.752) | (0.252) | (0.005) | (0.262) | (0.084) | |||||||
| Lithuania | −23.155 | *** | −0.431 | *** | 0.031 | *** | 2.399 | *** | −0.118 | *** | ||
| (0.372) | (0.039) | (0.002) | (0.045) | (0.002) | ||||||||
| Luxembourg | 0.615 | −42.172 | *** | −0.007 | −1.390 | *** | −0.959 | *** | ||||
| (0.499) | (7.090) | (0.010) | (0.378) | (0.152) | ||||||||
| Netherlands | −9.078 | *** | −0.785 | *** | ||||||||
| (1.257) | (0.079) | |||||||||||
| Norway | −0.027 | −0.002 | 0.506 | *** | −1.080 | *** | ||||||
| (0.172) | (0.003) | (0.102) | (0.182) | |||||||||
| Poland | 2.805 | *** | −0.721 | *** | 0.001 | 1.097 | *** | −1.652 | *** | |||
| (0.221) | (0.180) | (0.003) | (0.120) | (0.139) | ||||||||
| Portugal | −26.418 | *** | 0.008 | 0.155 | −1.374 | *** | ||||||
| (4.518) | (0.005) | (0.116) | (0.173) | |||||||||
| Romania | 17.811 | *** | −0.519 | * | −0.011 | −0.976 | *** | |||||
| (3.595) | (0.229) | (0.007) | (0.114) | |||||||||
| Slovakia | −142.800 | *** | −0.286 | 2.800 | *** | −1.603 | *** | |||||
| (20.684) | (0.208) | (0.224) | (0.201) | |||||||||
| Slovenia | 0.120 | 1.568 | 0.140 | −1.492 | ** | −1.201 | *** | |||||
| (0.316) | (3.124) | (0.167) | (0.429) | (0.213) | ||||||||
| Spain | 0.219 | −13.693 | *** | −1.282 | *** | |||||||
| (0.144) | (1.522) | (0.139) | ||||||||||
| Turkey | 72.193 | *** | 0.567 | *** | −1.096 | *** | ||||||
| (5.444) | (0.138) | (0.084) | ||||||||||
| United Kingdom | −0.353 | *** | −0.743 | *** | ||||||||
| (0.068) | (0.055) | |||||||||||
| United States | 0.028 | −0.442 | *** | |||||||||
| (0.074) | (0.034) |
Publisher’s Note: MDPI stays neutral with regard to jurisdictional claims in published maps and institutional affiliations. |
© 2021 by the authors. Licensee MDPI, Basel, Switzerland. This article is an open access article distributed under the terms and conditions of the Creative Commons Attribution (CC BY) license (https://creativecommons.org/licenses/by/4.0/).
Share and Cite
MDPI and ACS Style
Odehnal, J.; Neubauer, J.; Olejníček, A.; Boulaouad, J.; Brizgalová, L. Empirical Analysis of Military Expenditures in NATO Nations. Economies 2021, 9, 107. https://0-doi-org.brum.beds.ac.uk/10.3390/economies9030107
AMA Style
Odehnal J, Neubauer J, Olejníček A, Boulaouad J, Brizgalová L. Empirical Analysis of Military Expenditures in NATO Nations. Economies. 2021; 9(3):107. https://0-doi-org.brum.beds.ac.uk/10.3390/economies9030107
Chicago/Turabian StyleOdehnal, Jakub, Jiří Neubauer, Aleš Olejníček, Jana Boulaouad, and Lenka Brizgalová. 2021. "Empirical Analysis of Military Expenditures in NATO Nations" Economies 9, no. 3: 107. https://0-doi-org.brum.beds.ac.uk/10.3390/economies9030107
Note that from the first issue of 2016, this journal uses article numbers instead of page numbers. See further details here.