The Effective Use of Information Technology and Interactive Activities to Improve Learner Engagement

1
School of Mathematical and Computer Science, Heriot Watt University, Edinburgh EH14 4AS, UK
2
Department of Computer Science, Institute of Management Sciences, Peshawar 25000, Pakistan
*
Author to whom correspondence should be addressed.
Educ. Sci. 2020, 10(12), 349; https://0-doi-org.brum.beds.ac.uk/10.3390/educsci10120349
Submission received: 7 October 2020
/
Revised: 18 November 2020
/
Accepted: 20 November 2020
/
Published: 25 November 2020
(This article belongs to the Special Issue Using Technology in Higher Education—Series 1)
Abstract
:Student engagement in the learning process is the key to successful delivery of teaching and learning. Teachers face several challenges to engage learners in different disciplines, including computer science. This research conducts a review of BSc (Computer Science) programmes and introduces interactive activities to enhance learner engagement. The study was conducted using a repeated measure design involving 24 participants. The findings revealed that the use of technology, and collaborative and interactive activities in groups may positively influence learner engagement. The participants’ feedback before and after introduction of group tasks and interactive activities showed a significant (p < 0.001) and increasing trend in response to questions-related learner engagement. The participants agreed that their learning experience and engagement enhanced with the use of technology and interactive and collaborative activities.
1. Introduction
Student engagement has been an ongoing issue in higher education in various contexts including face-to-face, online, and blended learning [1,2] Research studies indicate that teachers face numerous difficulties in organising learning activities to enhance learner engagement [3,4]. However, this may be a challenge in many courses associated with software application development, which involves programming and software development due to inherent complexities involving mathematical, relational, and algorithmic models.
A large number of studies conducted in different disciplines agree that learner engagement is a common issue [5]. It poses a similar challenge in teaching computer science [6] as many other disciplines. Learning to develop computer applications and databases has been difficult, however, these are core competencies, which are highly demanding in industry and academia [7]. To attain skills and competence in design and development of computer applications, students are expected to engage in an understanding of conceptual design and practice the development exercises. According to Jenkins [8], teaching and learning application development can be challenging and identifying students’ motivations is a key factor to successful outcome. Jenkins states that engagement would not happen without motivation.
The use of an appropriate curriculum theory is essential to adopt a relevant curriculum model for design, development, implementation, and evaluation approaches [9,10]. There is an intensive discussion in literature relating to the definition of curriculum, however, it is widely referred to as “planned and guided learning” in a formal educational context [11]. The curriculum theories and models are classified into (i) transmitted—a body of knowledge to be transmitted (ii) product—to achieve certain ends in students, (iii) process, and (iv) praxis. Clearly, the curriculum models are based on theories of teaching and learning. The transmitted curriculum is focused on a syllabus, which is concerned with course content. Using this model, knowledge in the form of content is transmitted to students [12]. The product curriculum is pre-defined, where plans are drawn up to achieve previously designed objectives. It attempts to achieve certain ends in students. The Tyler model is a product curriculum model which applies an outcome based approach associated with “scientific management” [13]. Unlike the product approach, the process curriculum is defined as “a set of documents” for implementation. The curriculum is viewed as a “process” which involves teachers, students, and knowledge in order to achieve the requisite competence. This is defined by teachers and learners’ interaction in the classroom. The Stenhouse approach is an example of a process curriculum model [14]. While a product curriculum model is structured, the process model looks to the world of experimentation. The praxis model is based on the process model. It is referred to as an act of engaging, applying, exercising, and realising ideas. The curriculum is formed in the process of reflection and interaction between teachers and learners.
There is plenty of discussion in the literature on pros and cons of all of the above models. This research adopted a repeated measure design and inspired from action research approach to identify and address issues relating quality of teaching and learning with a focus on learner engagement. The study conducts repeated measures in a teaching practice to improve learner engagement and curriculum delivery. The following research objectives are framed to address issues relating student engagement and motivation:
- Review a teaching practice to identify issues related to delivery and quality of teaching and learning associated with student engagement in computer science;
- take actions to address the issues identified as a result of the above;
- evaluate the influence of actions taken.
2. Background
There has been a continuous shift in teaching and learning from an instruction-based and didactic approach to student-centred outcomes-oriented learning [15,16,17]. This approach encourages active involvement of students in teaching and learning activities, which includes concentrated attention, interest, and enjoyment as opposed to apathy and lack of interest with instructions [18,19,20].
The student-centred design is believed to increase learner’s engagement and help achieve learning goals and promote autonomous learning [21]. The term “Learner Engagement” has been widely researched for many years and is open to various interpretations by academics and researchers. Research studies attribute learner engagement to understanding different dimensions and proposed various models of measurement. It is defined as students’ involvement in active learning, peer collaboration, and interaction with the teacher [1]. According to Schunk et al. [2], it is a learner’s behaviour and response to teaching, including cognitive and emotional energy to accomplish a learning task. Fredricks et al. [3] defined three types of engagement including (i) behavioural, (ii) emotional, and (iii) cognitive, which are widely adopted parameters by many researchers. The behavioural engagement is determined by students’ positive conduct, making efforts and active participation in learning activities, and responding to teacher’s direction to activities [4,5]. In general, behavioural engagement is a measure of student participation, concentration, attention, and punctuality in the classroom. The emotional engagement is a student’s emotional response to peers, teachers, and reactions in the classroom, e.g., fatigue, boredom, happiness, excitement [4,6]. Some researchers define emotional engagement as reactions to the institution, teacher, and course activities [7]. The cognitive engagement as a theoretical construct explains the amount of effort students are willing to invest in working on a given learning task [8]. It relates to an individual’s mental model, perception, processing, and learning of a task. Therefore, it is a challenge to measure the cognitive engagement. In summary, the learner’s engagement is dependent upon a number of factors including active participation, collaboration, interaction, reaction to teachers’ direction, attention, positive conduct, perception, and making efforts to learn and perform various learning activities. An increased engagement in learning activities has been a significant predictor of continuing motivation and commitment [22]. Motivation and engagement are vital to successful learners’ outcomes [23]. According to Kahu [24], this is an increasingly researched, theorised, and debated issue due to growing evidence of its critical role in overall achievement and learning. Bryson and Hand [25] identified three level of engagement including discourse with students, professionalism with the teaching process, and enthusiasm for the subject. According to Cutler [26] “in-class passivity among students in higher education is a growing problem”. This may lead to lack of engagement and impacts learning activities. Cullen [27] indicates that large class sizes have been more common in recent times, and Usher and Cervenan [28] expressed that this may contribute to learners’ disengagement. In a recent study, O’Connor and Donovan [29] analysed student perceptions on passivity and engagement. They reported 70% agreement on research questions relating learners’ engagement using a revised approach to the traditional PowerPoint teaching. Some earlier studies [30,31,32] suggest that students’ lack of engagement with academic activities is one of the key reasons for demotivation, negative experience, and dropping out. In their comparative study of two groups (Blended n = 99 and traditional n = 111) Law et al. [23] identified no difference in the mode of learning on motivation and outcome. Their findings revealed the positive influence of learning motivation on learning performance and enrolment. While many studies established the importance of learner engagement [33,34,35], there are several factors that contribute to good or poor engagement. Mystkowska-Wiertelak [36] identified that teachers believe that changing learners’ engagement and attitudes may sometimes be beyond their control. It may be influenced by personal and previous experiences. However, the effective use of course materials, teaching methodology, and intervention strategies can impact learners’ behaviour [34,37].
Besides the traditional face-to-face learning, learner engagement is an inherit problem in remote online learning with anonymity and lack of monitoring. The recent outbreak of the Covid-19 pandemic caused by SARS-cov-2 has significantly changed the teaching and learning landscape [22]. There has been a rapid shift in teaching and learning strategies, and many institutions are moving from traditional face-to-face classrooms to blended or online learning [23]. This has triggered an increased demand for learner engagement in rapidly growing blended learning. Coleman and Money [20] argue that peer-based learning can play a key role in building relationships between students and teachers in traditional teaching.
Researchers adopted several techniques to improve learners’ engagement. Beside instructional intervention, the use of technology, including mobile phones and online platforms, can contribute to positive learning experience [24]. Many studies [25,26,27] have reported an increase in students’ engagement with the use of electronic feedback devices such as clickers—a credit card size handheld device using infrared signal to send student responses to a receiver attached to a computer and software. Conversely, Lasry [28] reported that clickers have motivating influence, however, it provides no additional benefit to student outcomes. Trees and Jackson [26] reported positive perception of using clickers based on survey responses of 1500 undergraduate students citing social and communication factors, feedback, and a desire to be engaged in active learning. However, some studies reported limitations of using clicker technology, particularly in large classrooms. The purchase and maintenance of hand held devices incurs additional costs [29,30]. The technical difficulties may challenge both students and faculty, who are not technologically savvy [31,32].
Teaching and learning approaches have been changing rapidly with the advent of technology. In recent years, teachers have been adopting various technologies to engage learners [6,33,34,35,36,37,38]. An increased use of mobile technology has increased the opportunities for access to more interactive resources. Although previous studies [24,39,40,41] have proposed the use of mobile phones as a delivery vehicle, it can be utilised for in-class room instant response and as a feedback tool. Mobile phones play an important role in gamification of learning activities [17]. Some studies [42,43,44,45] argue that the use of mobile phones and laptops could cause digital distractions in a classroom. However, mobile phones may be utilised for learning activities in order to increase interest and discourage student involvement in other activities leading to digital distraction.
The constructivist models have been widely used in teaching computer science [46,47,48] due to its applicability and alignment with the type of content, e.g., programming, algorithms, etc. According to the constructivist approach, the teacher cannot ignore students’ existing knowledge [49]. This theory encompasses different teaching approaches, including the problem-based learning. Based on the findings from the initial survey discussed above, the research work employed the problem-based approach to teaching and learning [50] as a primary model. According to this model, the starting point for learning should be a problem, query, or puzzle that the learner wishes to solve [51]. This method is widely used in teaching practices in medical sciences [52]. Collaborativism or cooperative models promote socialisation [53,54], engagement, and inclusive learning environments [55], which are derived from the constructivist theory [46].
Researchers agree that students’ engagement with purposeful learning activities is one of the important factors for student success in learning and personal development [53,56,57,58]. Some studies indicate that tacit knowledge acquired through experience is effective in improving teaching and learning [59,60,61]. The use of effective pedagogical approaches has been a challenge and widely researched area [62]. While some researchers believe in imposing and transmitting knowledge to students, others suggest a structured approach with defined objectives [11,63]. One school of thought supports inclusive development of needs analysis involving teachers and learners [11,64].
Given the above discussion, the learner’s engagement and motivation is identified as a key issue during instructional based lectures [65,66]. Teachers are responsible for designing learning activities that are intellectually stimulating and ensure student engagement. Although, the use of instant electronic feedback technology may increase learners’ engagement; however, there are some limitations to this approach including cost, resources, device management, maintenance, and technical operation. This study will investigate a combination of technology, and problem-based and social learning activities adopting Mayer’s multimedia principles in computer science in an attempt to encourage learning and enhance learner experience.
3. Research Methodology
The data were collected in a “Data and Knowledge Management” module in the BSc (Computer Science) Programme at a UK University, in an attempt to analyse and promote learner engagement and optimize outcomes. The module uses lectures and lab-based seminars for teaching and learning.
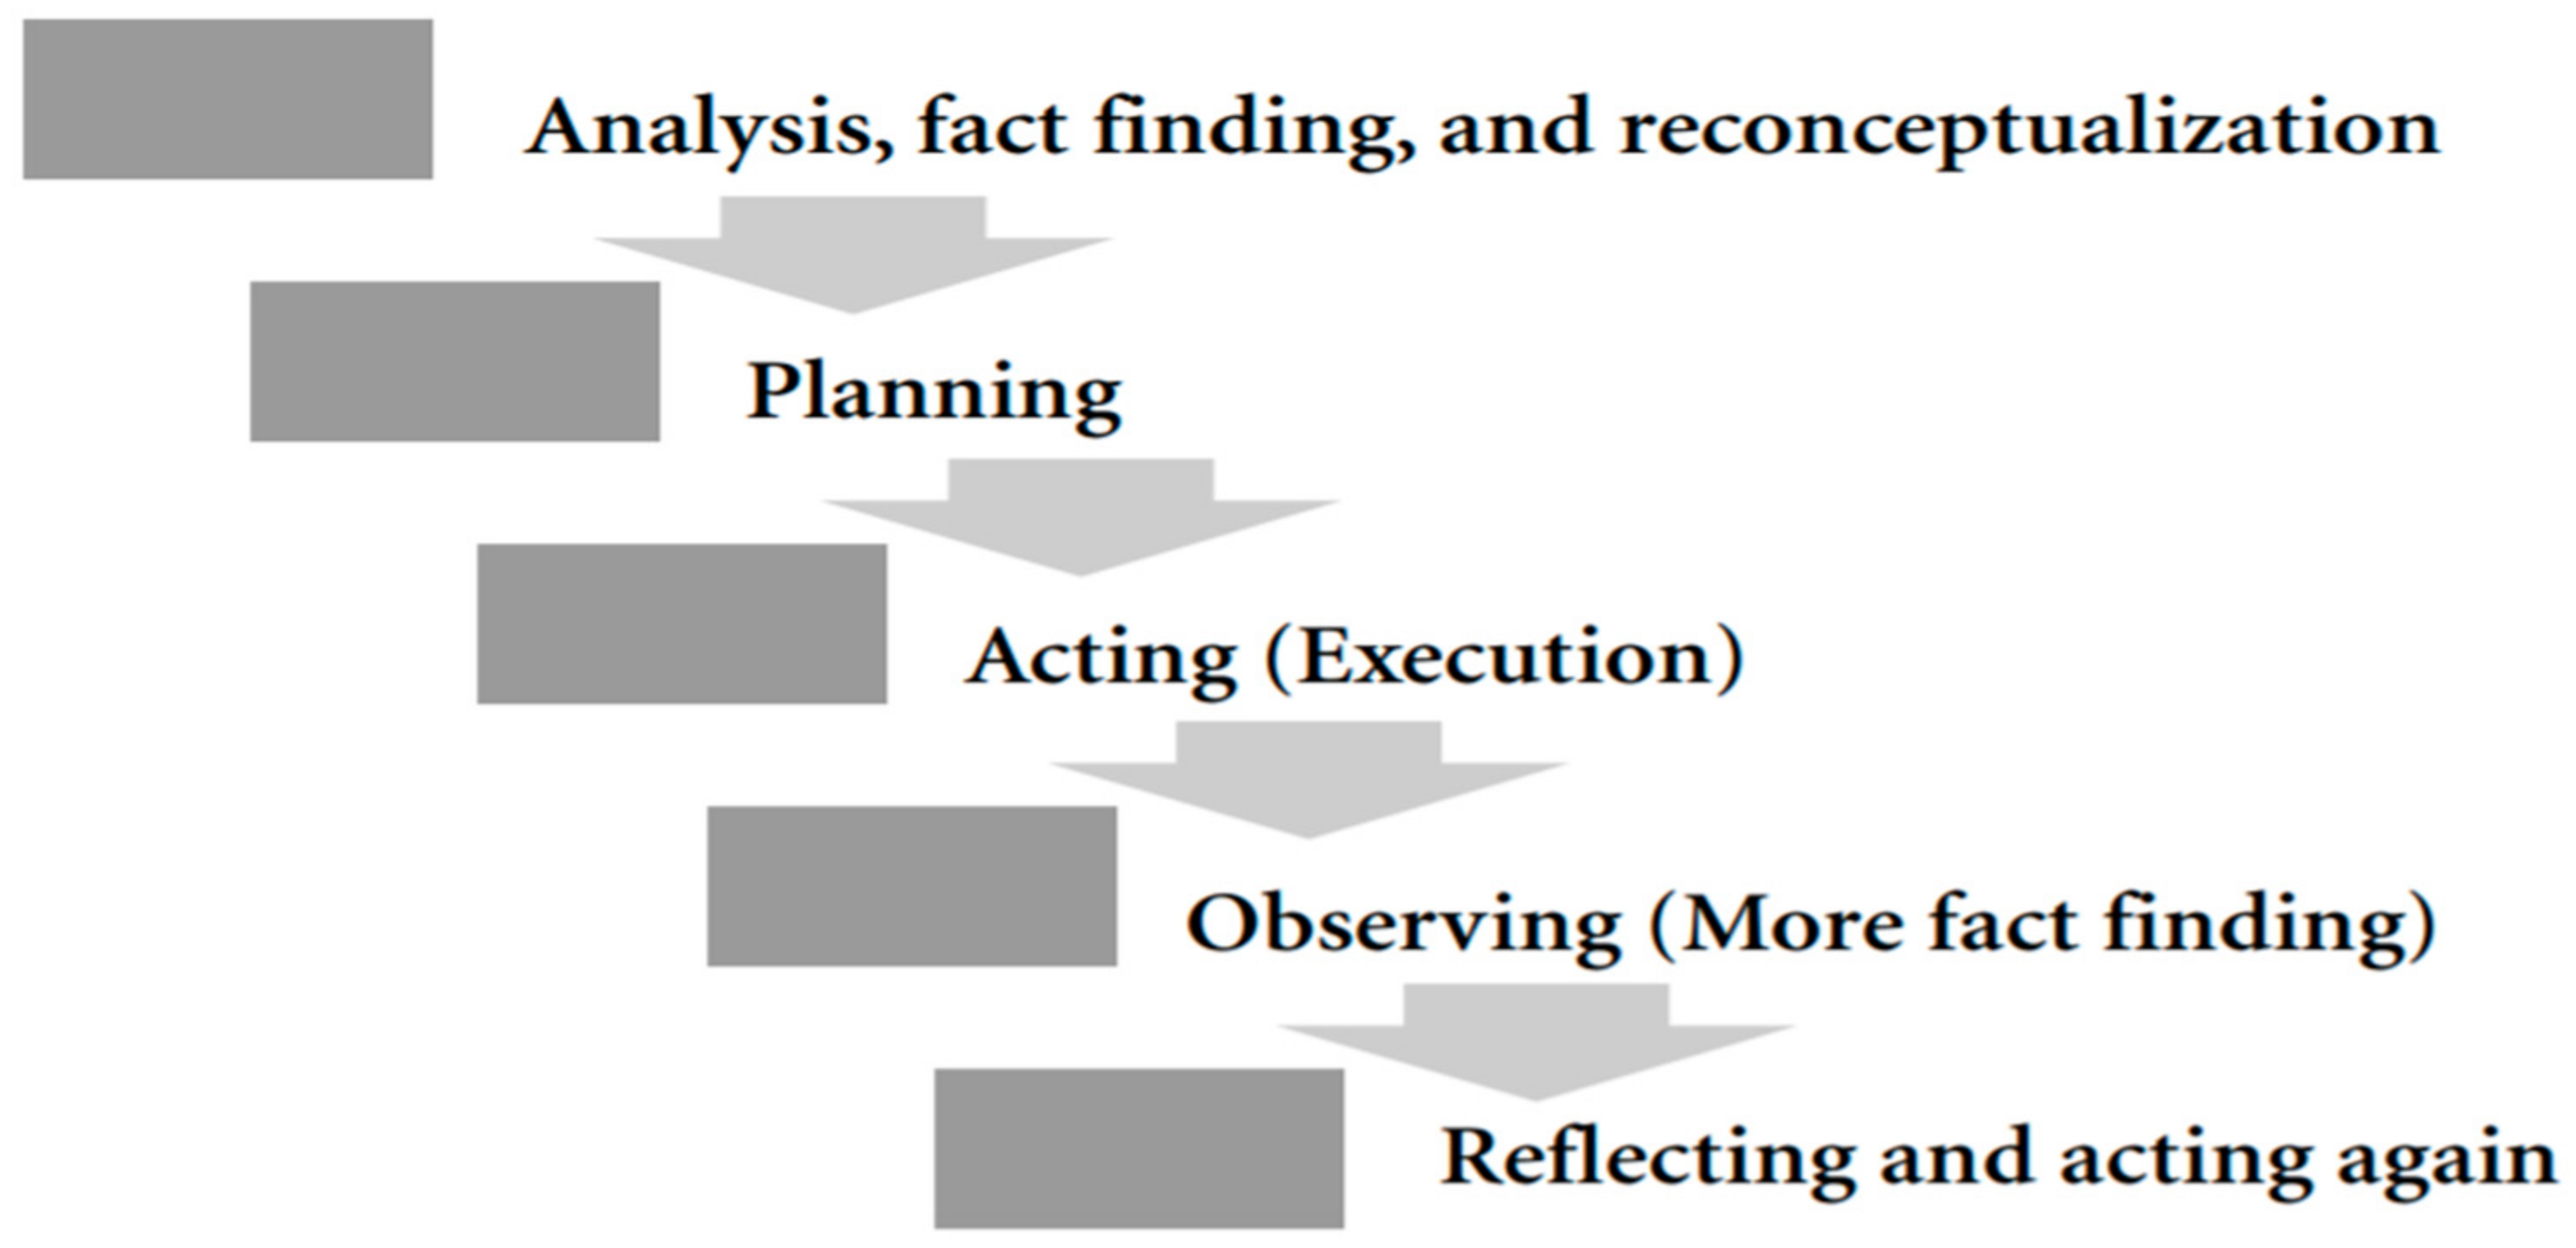
This research adopts the action research spiral model [67]. It is a phased approach to analyse, plan, act, observe, and reflect in a teaching and learning context. A quantitative web-based questionnaire was utilised for data collection. It can be challenging to assess a learner’s engagement and realistic response in a simulation environment; therefore, the study was conducted in a real classroom setting. It allowed us to collect data not known prior to the teacher’s intervention.
3.1. Survey Method
This study adopted a survey method using an online questionnaire for data collection. The survey is an extensively utilised tool for collection of data and user feedback to evaluate performance [68]. According to Dillman and Bowker [69], a survey is an effective approach to estimate the distribution of characteristics in a defined population. However, this study was conducted in a live classroom setting, and due to a limited number of volunteers in a live classroom session, we did not implement a random sample or a controlled group.
A questionnaire is a survey technique implemented both in paper and online forms. This project employs a web-based questionnaire to collect students’ feedback on the quality of teaching and learning.
3.2. Measurement Instrument
To test the learner engagement, pre- and post-interactive activities questionnaires were designed. The survey was developed by adopting a Student Evaluation of Educational Quality (SEEQ) questionnaire [70] using questions associated with teaching and learning activities [70]. According to Marsh, Hocevar, and Roche [71,72], “the SEEQ instrument has been widely researched for over 13 years in undergraduate and graduate programs for approximately 50,000 courses and by 1 million users, which indicates that it is both valid and reliable”. It is one of the most reliable and widely used questionnaires [70].
The SEEQ questionnaire consists of 34 items for evaluating nine dimensions i.e., Learning, Instructor Enthusiasm, Organization, Group Interaction, Individual Rapport, Breadth of Coverage, Examinations/Grading, Assignments, and Workload or Difficulty. This research adopted the relevant dimensions and utilised 17 items of the SEEQ questionnaire. As shown in Table 1, 16 instruments utilised a five-point Likert scale, i.e., 5-Strongly Disagree, 4-Disagree, 3-Neutral, 2-Agree, and 1-Strongly Agree.
In the final stage of the study, an additional 15 items questionnaire was adopted and tailored to the research requirements based on a questionnaire developed by Farzaneh and Nejadansari [73].
3.3. Research Approach
This research employed a repeated measures design. The research implementation was inspired from Lewin’s [74,75] action research spiral model, as shown in Figure 1. We adapted the widely used model to our study context, which relies on data to understand and transform learners’ behaviour in a teaching environment. It was conducted in multiple phases described below:
- Participants Recruitment: The study was conducted in a face-to-face, 12-week module using actual events, teaching, and learning activities. Table 2 shows participants’ characteristics summarised from classroom attendance. Student participation was voluntary, and their feedback kept anonymised. The participants’ identification was not recorded as part of the data collection. A total of 24 participants responded to the questionnaire and provided their feedback at different stages of the study.
- Initial Survey (Pre-test): An initial survey was conducted after week 2 for fact findings using the SEEQ questionnaire, which is discussed in Section 4.1.
- Introduction of Interactive Activities (Intervention): Based on the initial findings, we implemented different approaches including Slido, Plickers, group tasks, and card sorting activities to improve learning, which is explained in Section 4.2.
- Repeat Survey (Post-test): A repeat survey was conducted after 8 weeks of the initial survey with the same participants to evaluate the impact of interventions. Participants also responded to an additional questionnaire relating to the specific use of activities.
4. Results and Implementation
This section discusses implementation of the research. The detailed analysis of each phase of the process is described above.
4.1. Initial Survey
The analysis of initial fact findings is shown in Table 2 column 1. A total of 16 questions were evaluated by a total of 24 students. Their feedback was anonymised in order to encourage participation and collect accurate feedback without any reluctance. To check the reliability and internal consistency of scale, a Cronbach alpha test was used. The “α” value for questions was greater than 0.8, which shows “Good” internal consistency.
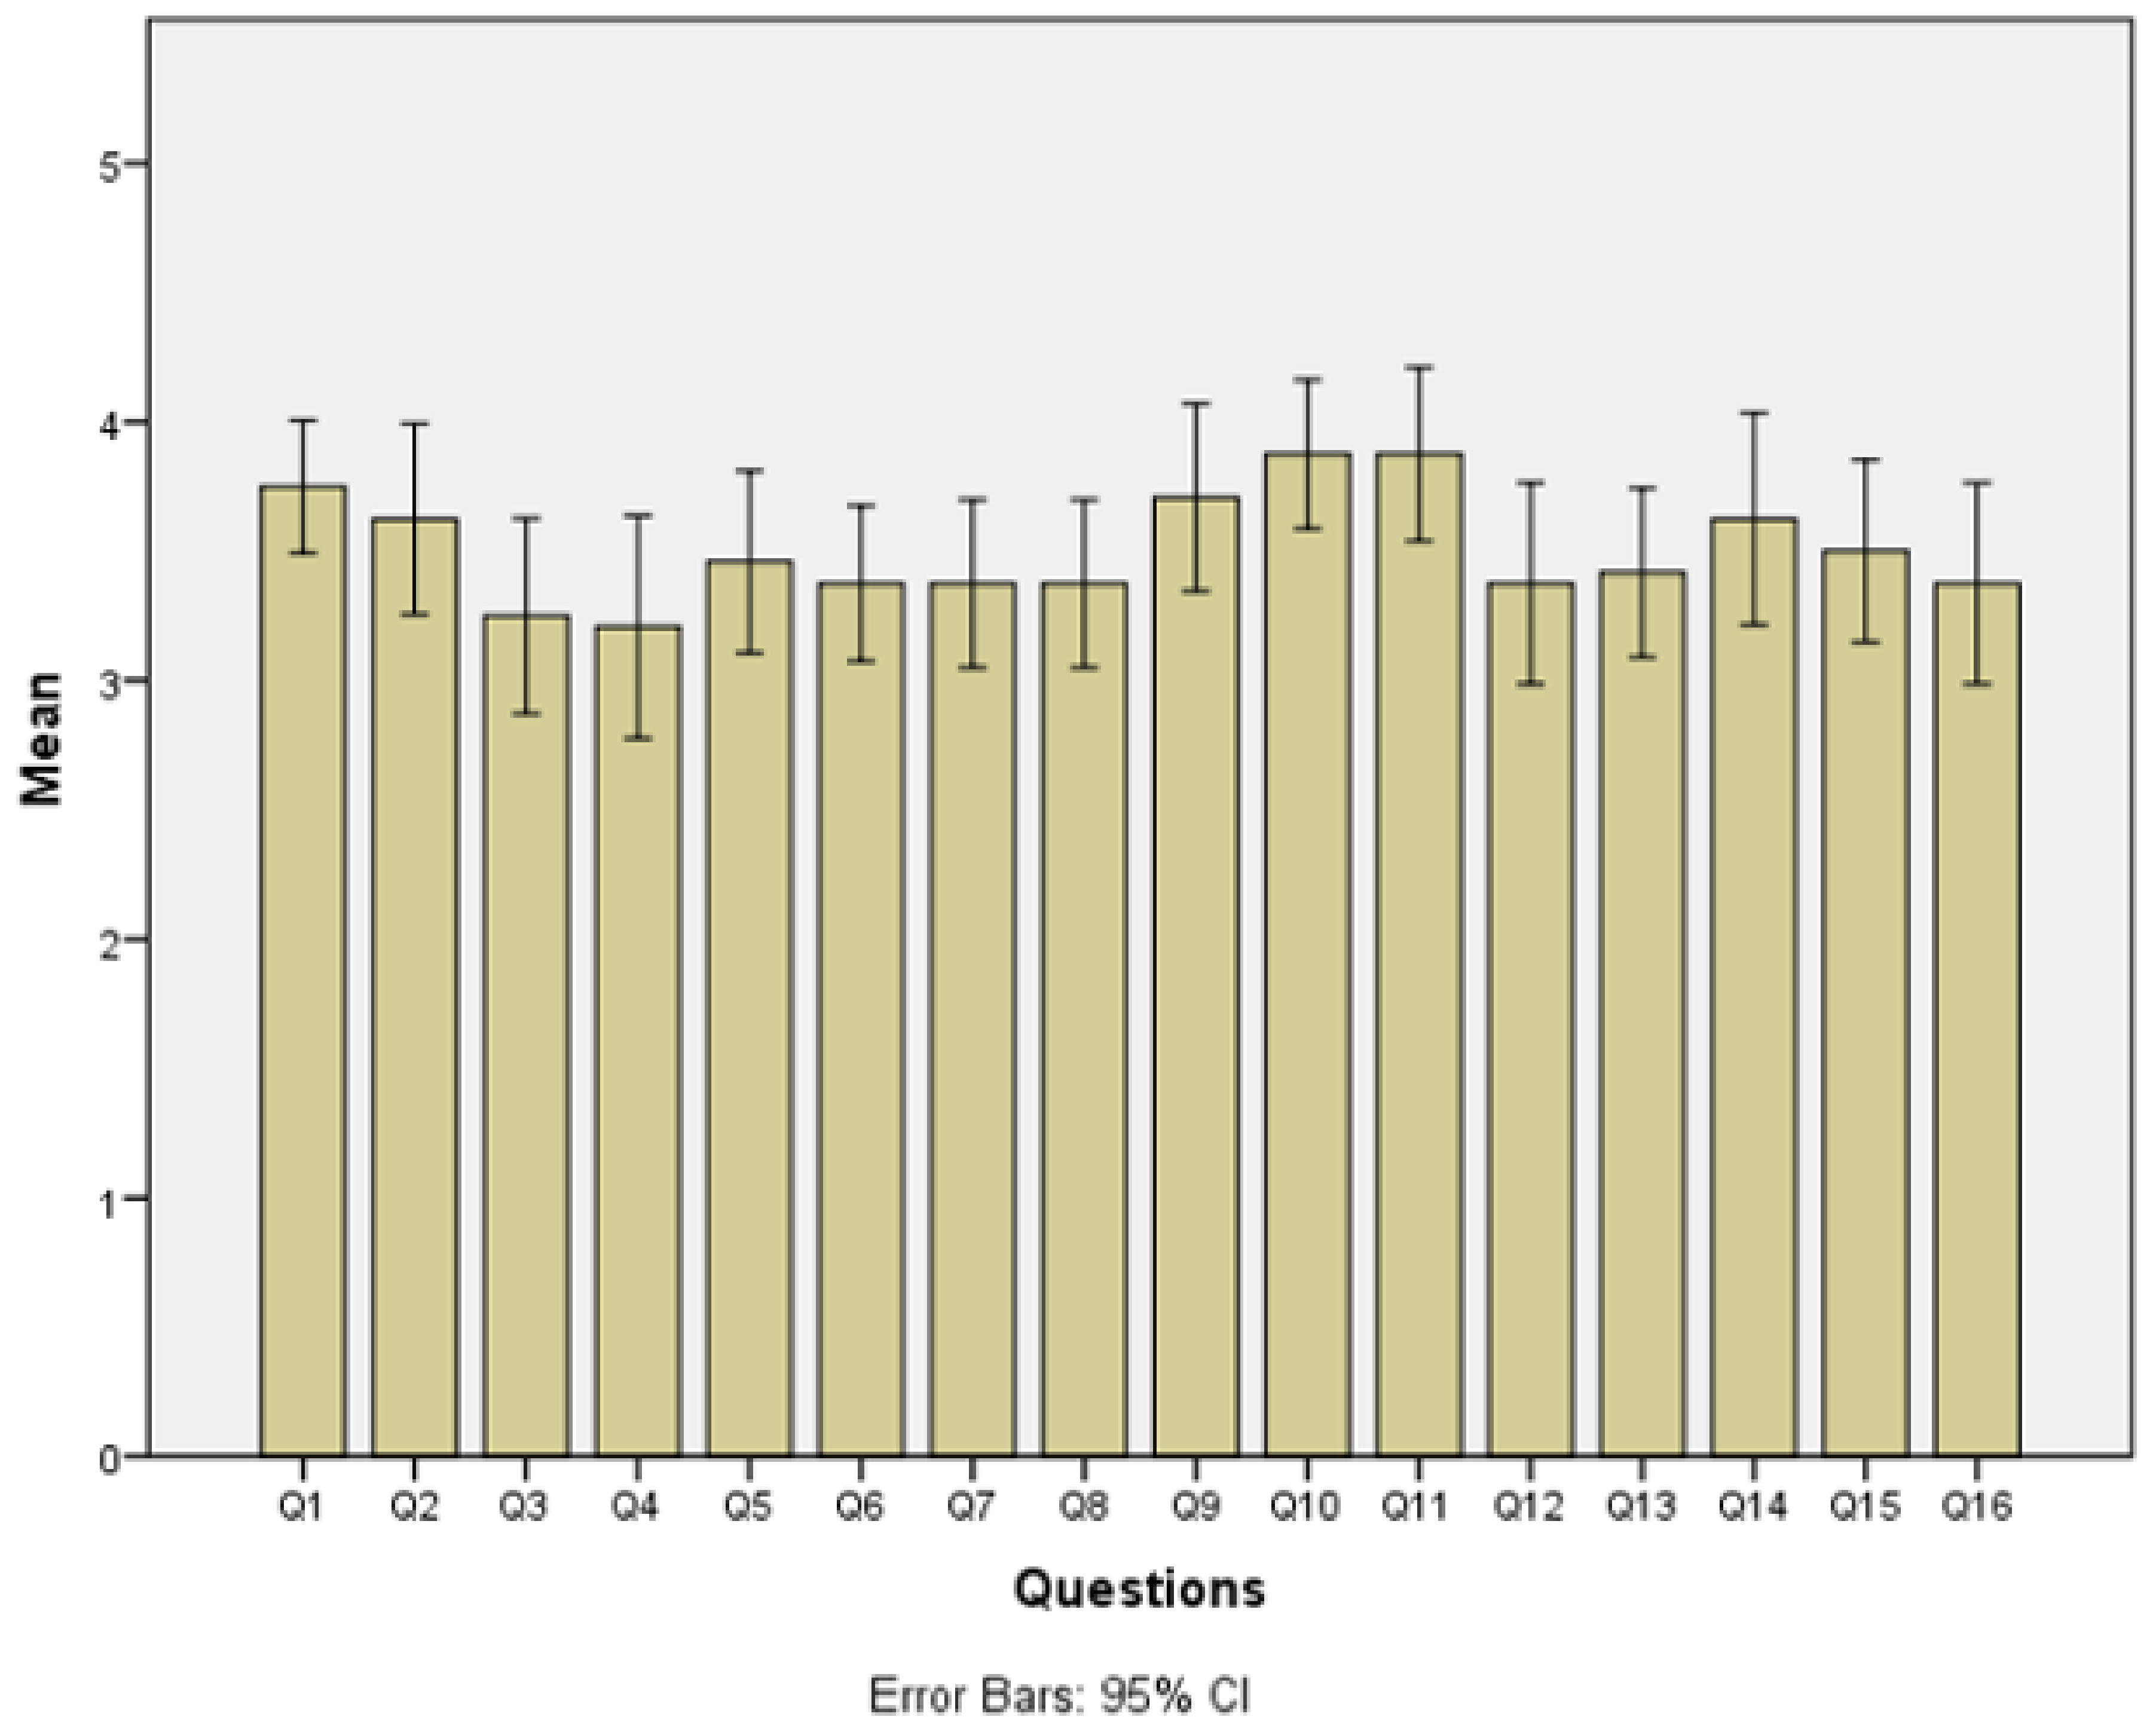
Results shown in Table 3, column 1, and Figure 2 revealed that all responses scored between 3 and 4 (mean value). The participants response was “just above neutral” to the majority of survey instruments on a five-point Likert scale [5-Strongly Agree, 4-Agree, 3-Neutral, 2-Disagree, 1-Strongly Disagree]. The initial findings indicate a need for more work to improve the learning experience. Of the total 16 questions, only questions 10 and 11 scored [Mean: 3.8], i.e., “Students were invited to share their ideas and knowledge” and “Students were encouraged to ask questions and were given meaningful answers”.
There were no direct questions about learner engagement in the initial questionnaire, however, participants showed no significant “agreement” to any of the instruments related with “1–4 learning”, “5–8 organization”, “9–12 group interaction”, and “13–15 breadth”. There was some positive feedback about teachers’ interaction and encouragement to engage learners in response to questions “9–12 group interaction”. However, the overall rating was just above neutral. Given the feedback from learners, the following actions were taken to enhance learning, engagement, collaboration, group interaction, and organization.
4.2. Introduction of Interactive Activities
The study implemented the above models using a problem-based approach [50,77] in groups to teach both theoretical and practical skills in the “Data and Knowledge Management” module. Group tasks and interactive activities were introduced to enhance learner experience. The group tasks were followed by discussions to encourage leaners to ask questions and for teacher to assess their progress. As per constructive alignment, group tasks and learning activities were aligned with learning objectives and assessment [78]. The following specific actions were taken to enhance learner engagement in teaching sessions:
- Segmentation: As recommended by Gibbs and Jenkins [79,80], each teaching session was broken down into small segments in a power point presentation as described below. The course content and presentation were shared with students on MOODLE Learning Management System (LMS) before the teaching session.
- Card Sorting Activity: In order to involve students in the learning process, questions and answers were printed on laminated paper cards for a card sorting and mapping activity. After teaching the relevant material for 15–20 min, students were invited to sort or map answers to questions on printed cards in groups (group of three), e.g., titles for primary key, foreign key, and super key were mixed with their definitions on cards, and students were asked to pair them up [81]. Some of these definitions were related with previous teaching sessions to help them recall. This was followed by further teaching material on a PowerPoint presentation in the next segment.
- Group Task: After teaching the next segment for 15–20 min, students were invited to perform a 15 min task on paper in groups. For example, in one session, students were asked to normalize data for a “student application form” to 1st, 2nd, and 3rd normal forms in groups. This was followed by further teaching material on a PowerPoint presentation in the next segment.
- Interactive Activity (Plickers): After teaching in the next segment for 15–20 min. Students were invited to participate in a “Plickers” Multiple Choice Questions (MCQ) quiz [82], an audience response system. Using this method:
- The lecturer (author) prepared questions before the lecture and uploaded them to the Plickers website.
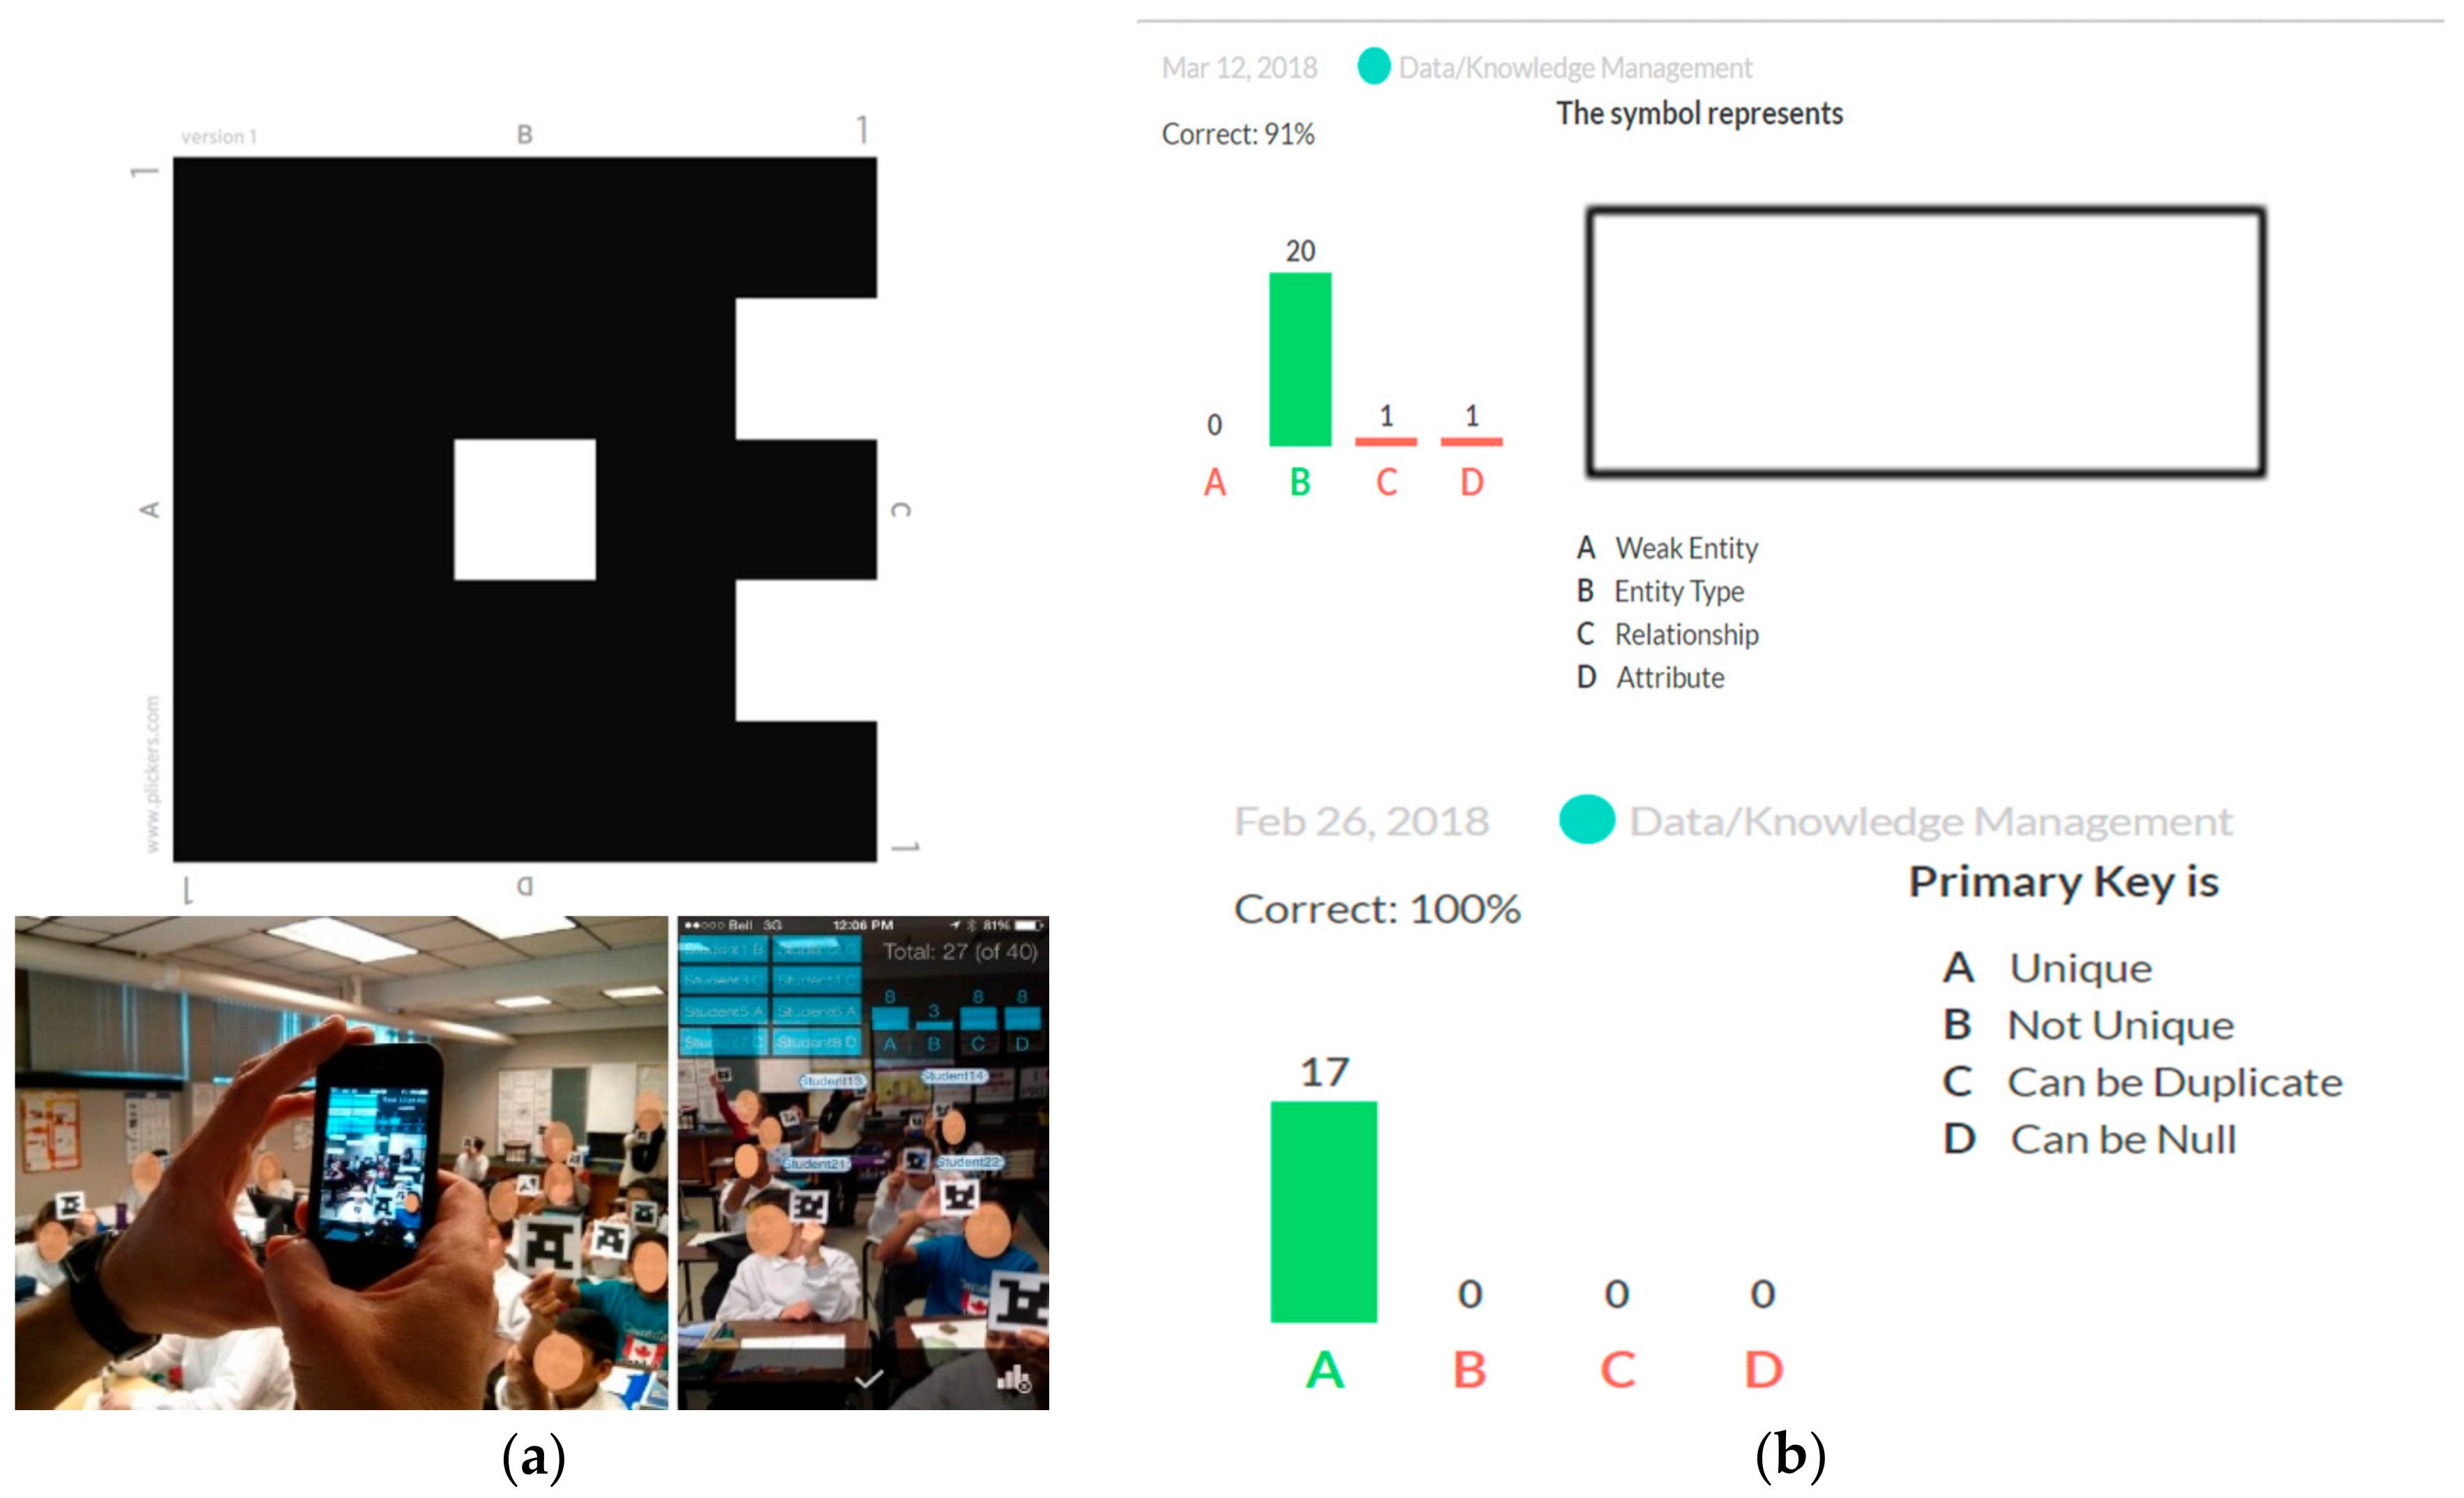
- To collect answers, mobile readable cards (see Figure 3a,b) were printed and shared with students.
- Students were invited to answer MCQ questions shared from the Plickers library. These were displayed on the multimedia projector.
- Students answered the questions by showing the printed card in a specific position. Each position represents different answer choice, i.e., a, b, c, and d.
- The lecture (author) scanned their responses from display cards using the Plickers mobile app, and results were instantly displayed on the multimedia projector. Each Plicker card is unique and represents an individual student.
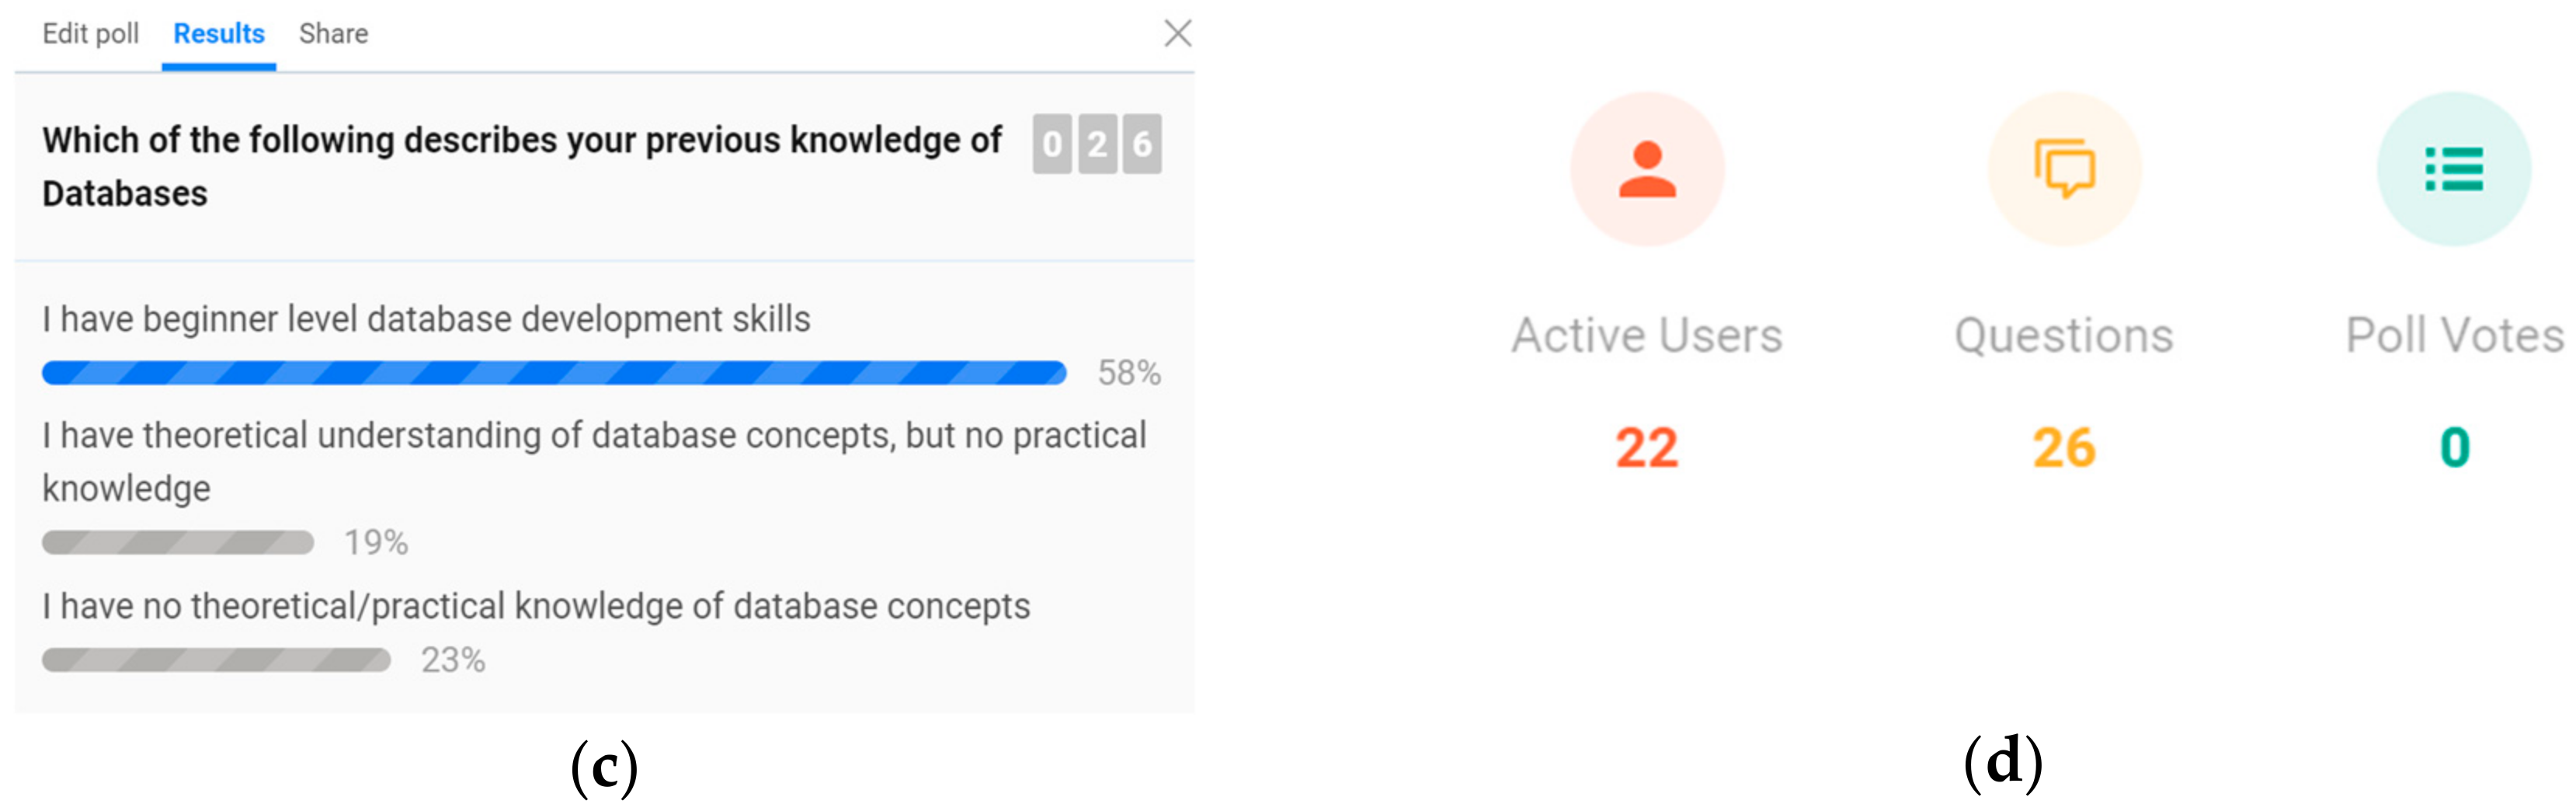
- Interactive Activity (Slido): At the end of lecture, students were invited to answer MCQ questions on Slido using their mobile phones (see Figure 3c,d). Slido is a real time interactive online application for polls, MCQs, and questions [83]. Using this method:
- Students answered MCQ questions on their phones and the results were displayed instantly on projector from the Slido website.
- Students were invited to ask questions regarding the lecture in the Slido “Questions & Answers” section.
- Students were able to rate questions posted by other students and displayed on the projector.
- Students may ask questions anonymously in order to encourage individuals who would otherwise hesitate to ask questions face-to-face.
The initial observation and verbal feedback from students suggest that these interactive activities and group tasks enhanced their learning experience.
4.3. Repeat Survey
This section provides an analysis of participants’ feedback on the SEEQ questionnaire using the same instruments and participants in a repeat survey. The survey was conducted after 8 weeks of the initial survey and actions taken (see Section 3.1 and Section 3.2 above). A total of 24 students responded to the questionnaire. It was the same group which participated in the initial survey to keep the findings consistent and for authentic statistical comparison. To check the reliability and internal consistency of scale, a Cronbach alpha test was used. The “α” value for questions was greater than 0.8 with (α = 0.866), which shows “Good” internal consistency.
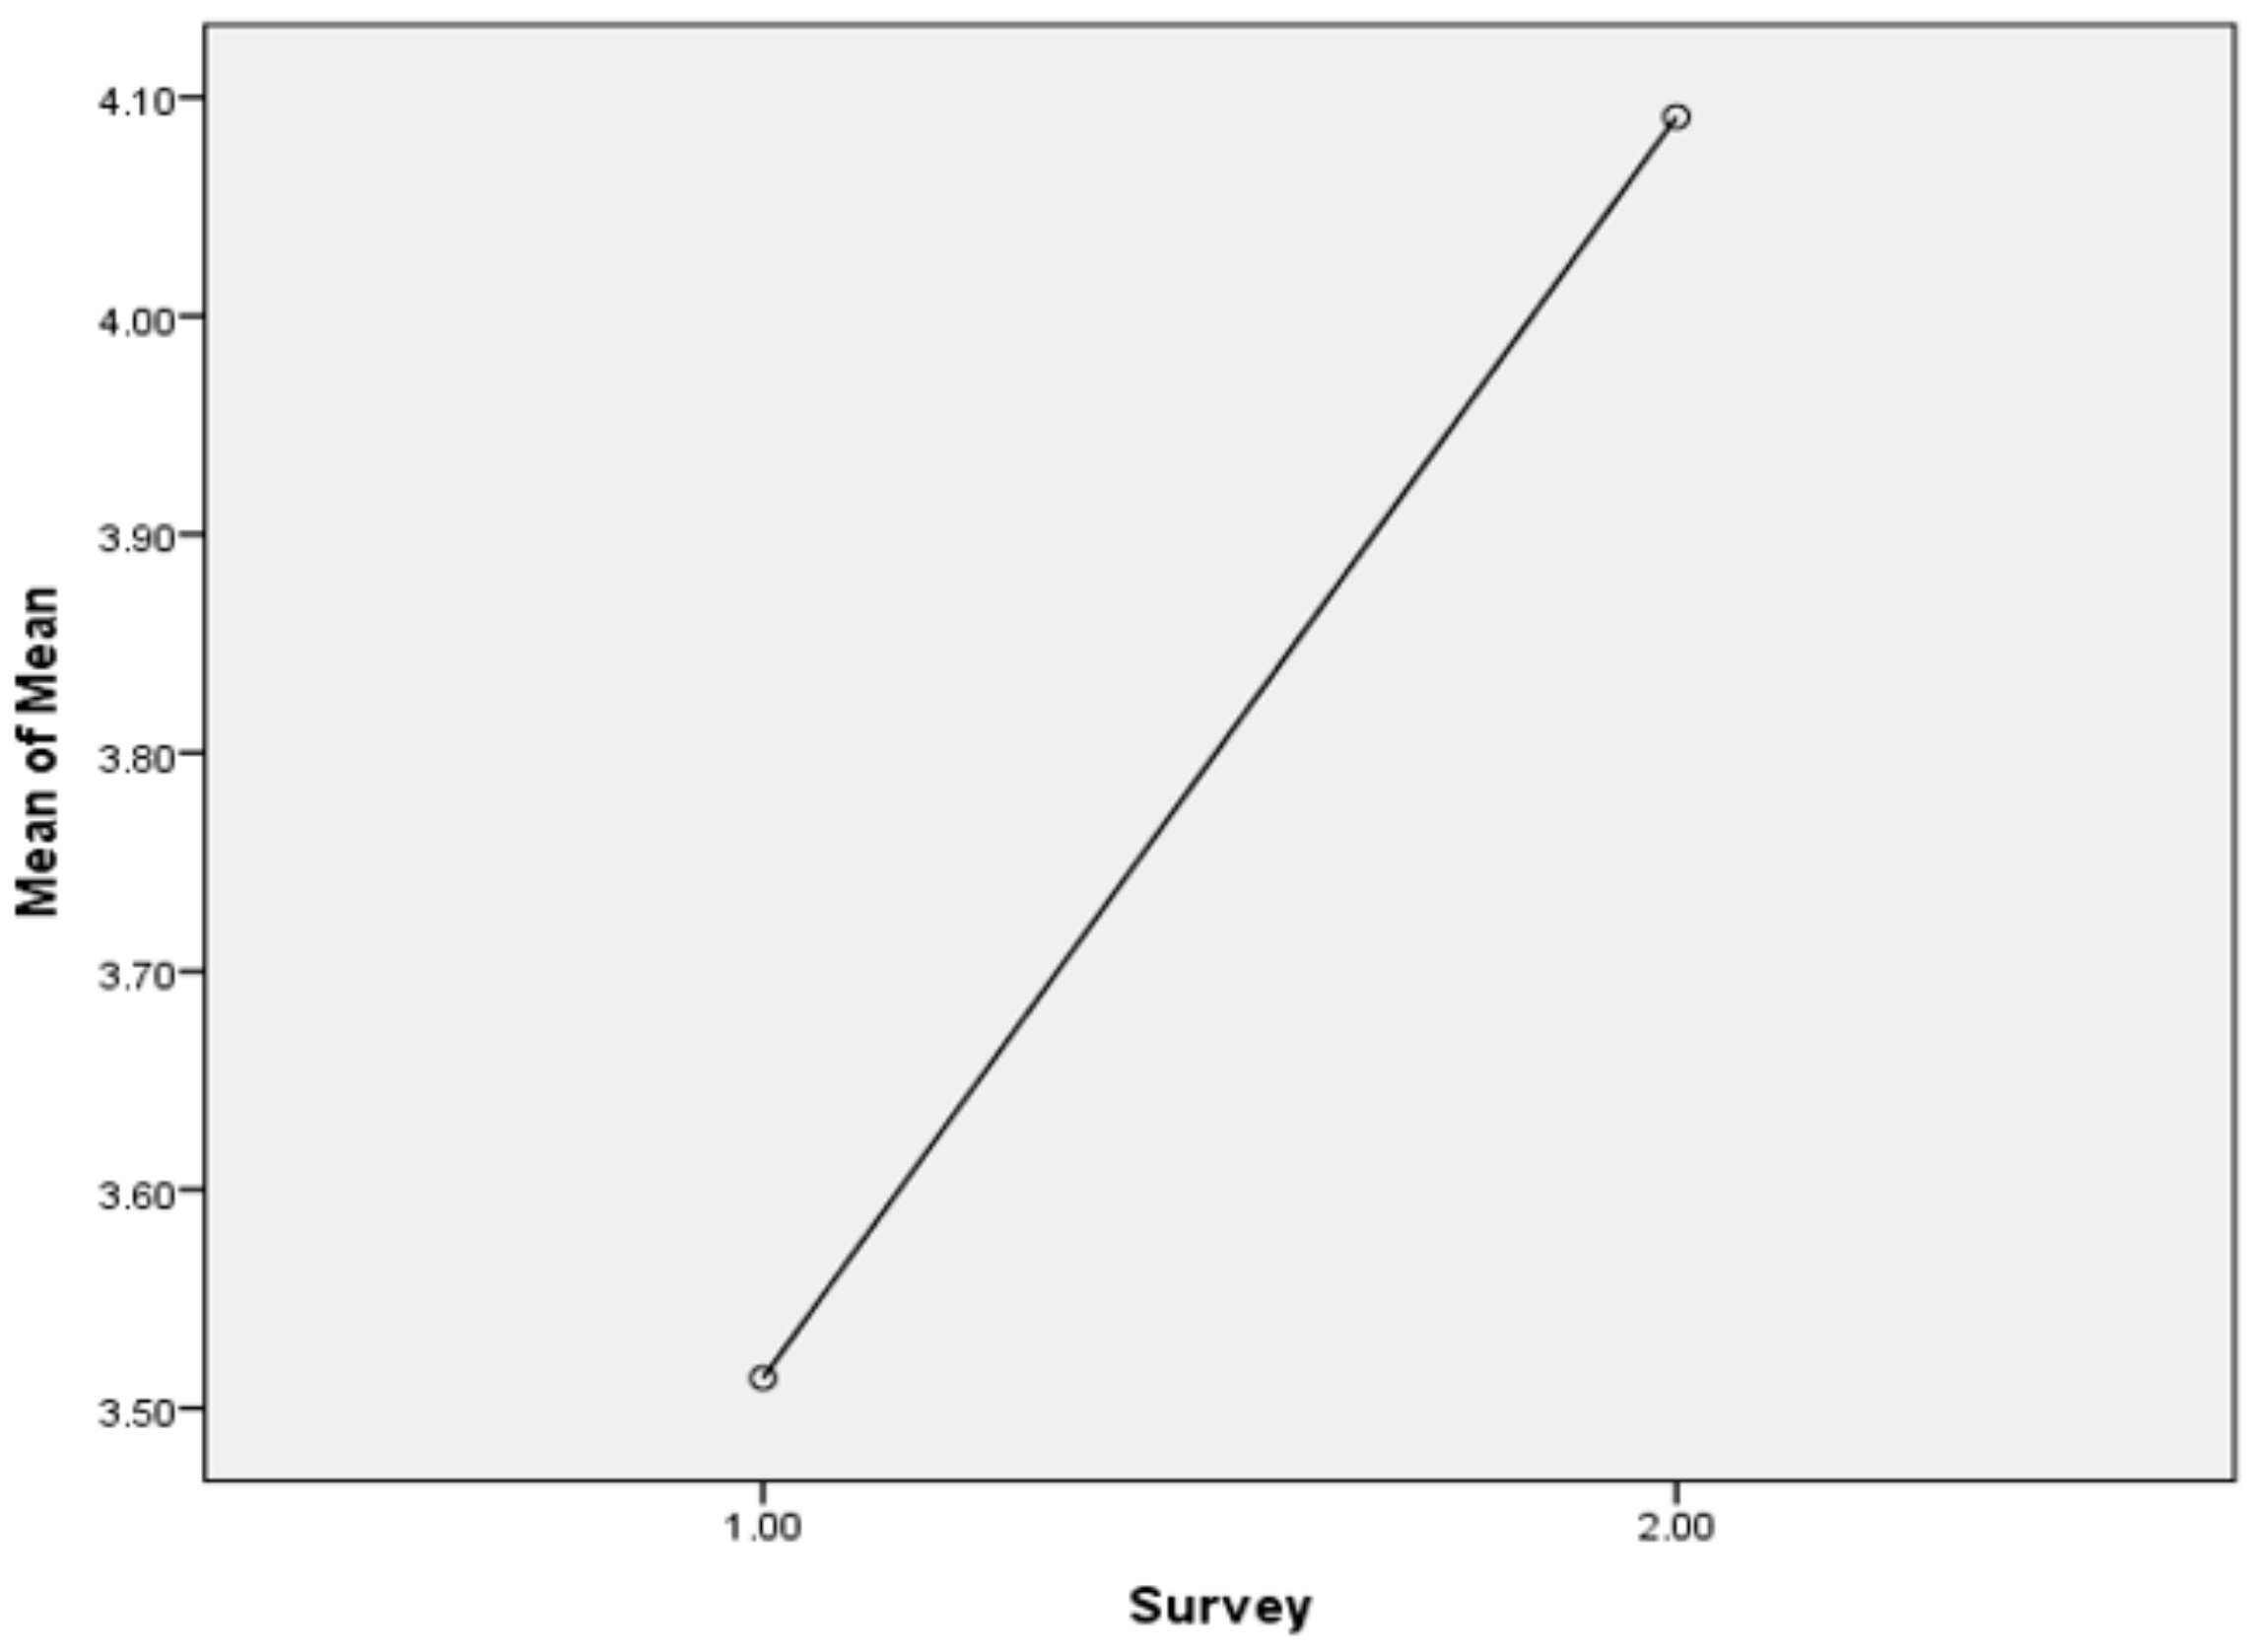
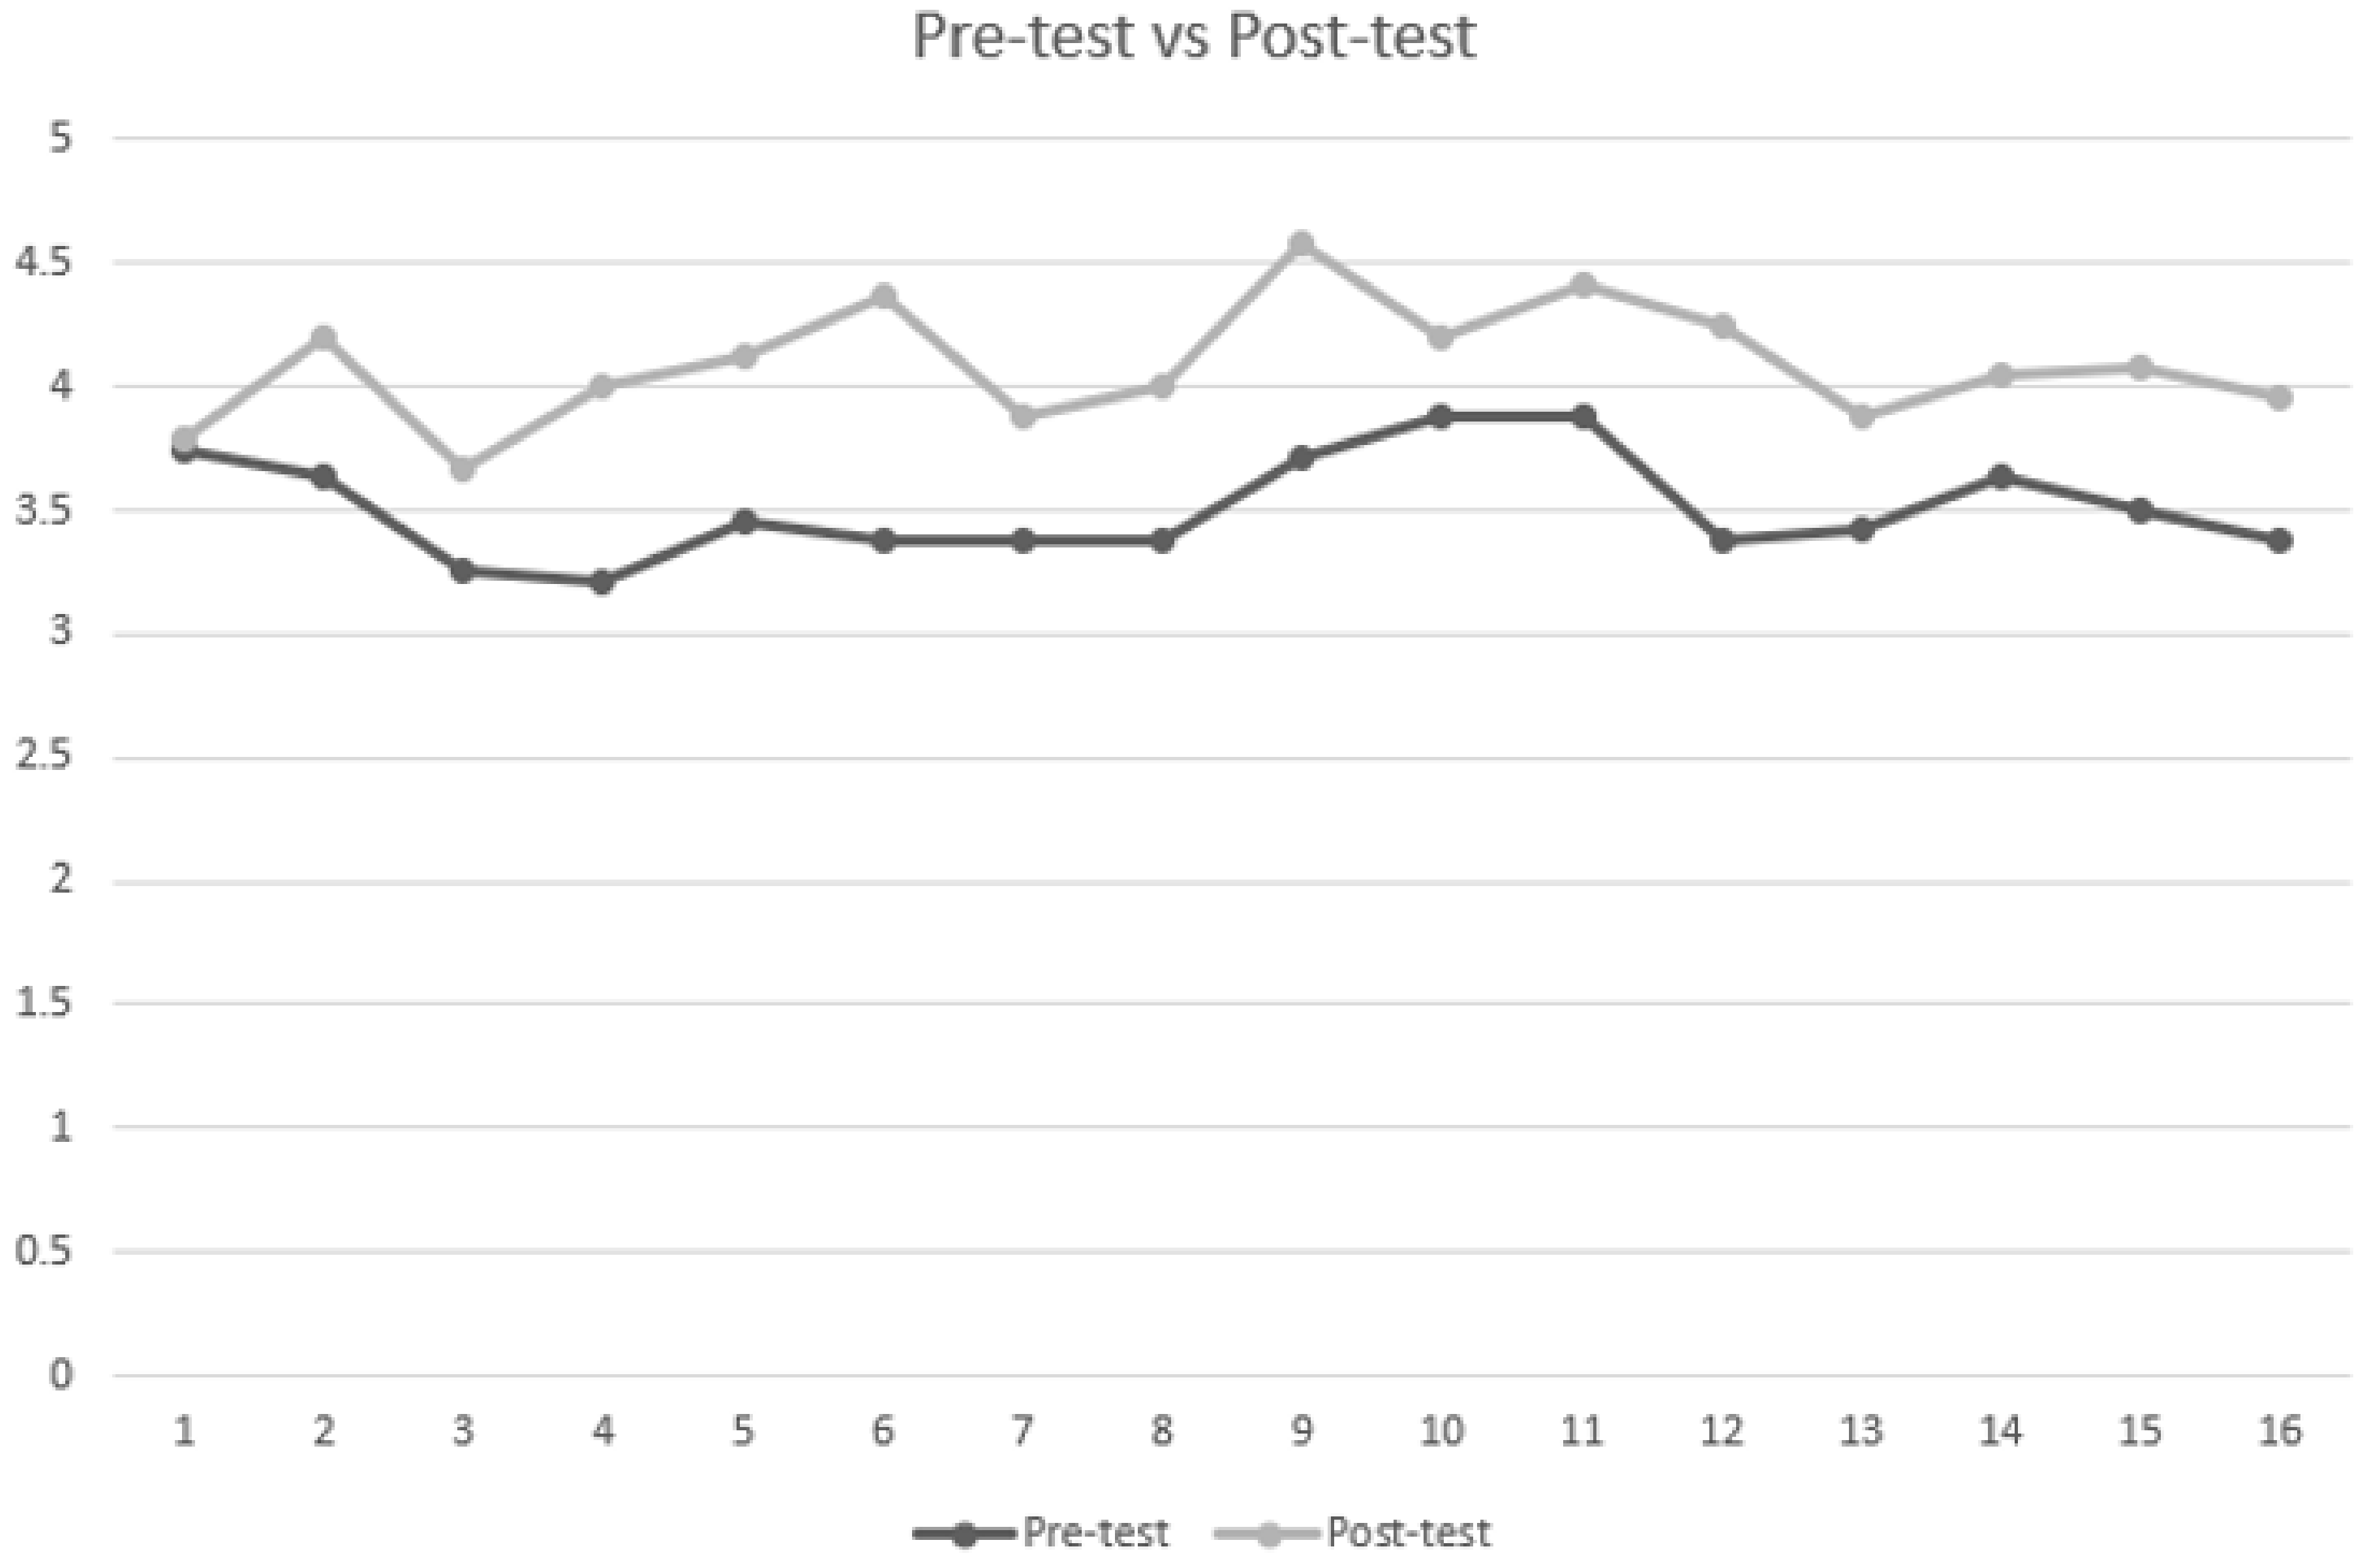
In order to test the significance of any trend in the data presented in Table 3, columns 1st and 2nd, a one-way ANOVA test was performed with linear contrasts. A significant trend was confirmed in participants’ response to survey 1 (pre-test) and survey 2 (post-test after group, interactive activities) questions F (1, 30) = 52.12, p < 0.01. A Spearman correlation coefficient was computed to assess the direction of the trend between surveys 1 and 2 (rs = 0.81, n = 32, p < 0.01), which shows an increasing trend in the mean score. The trend graph shown in Figure 4 and Figure 5 indicates an increasing trend in participants’ response to the SEEQ questionnaire before and after “taking actions”.
A paired-samples t-test was conducted to compare the mean values of survey instruments before and after the use of actions, i.e., group activities. There was a significant difference in the scores for the SEEQ questionnaire’s pre-test (M = 3.5, SD = 0.20) and post-test (M = 4.0, SD = 0.24) conditions; t (15) = 9.8, p < 0.001.
4.4. Learners’ Feedback on Interactive Activities
The above findings indicate a significant difference in participants’ feedback with regards to learning, organization, group interaction, and breadth.
The actions taken had a positive influence on learner experience and outcomes. In order to confirm the reason for enhanced learner engagement, a third survey was conducted using questions directly related to the collaborative and group activities discussed above (see Section 4.3).
In order to confirm learners’ feedback on the revised teaching approach, an online questionnaire was organised on the use of technology, collaboration, group tasks, and interactive tools discussed in Section 4.2. The 15 instrument questionnaire was adopted from the instrument developed by Farzaneh and Nejadansari [73] and tailored to the requirements of this research. A total of 24 participants responded to the questionnaire. It was the same group that participated in the previous surveys in order to keep the feedback consistent.
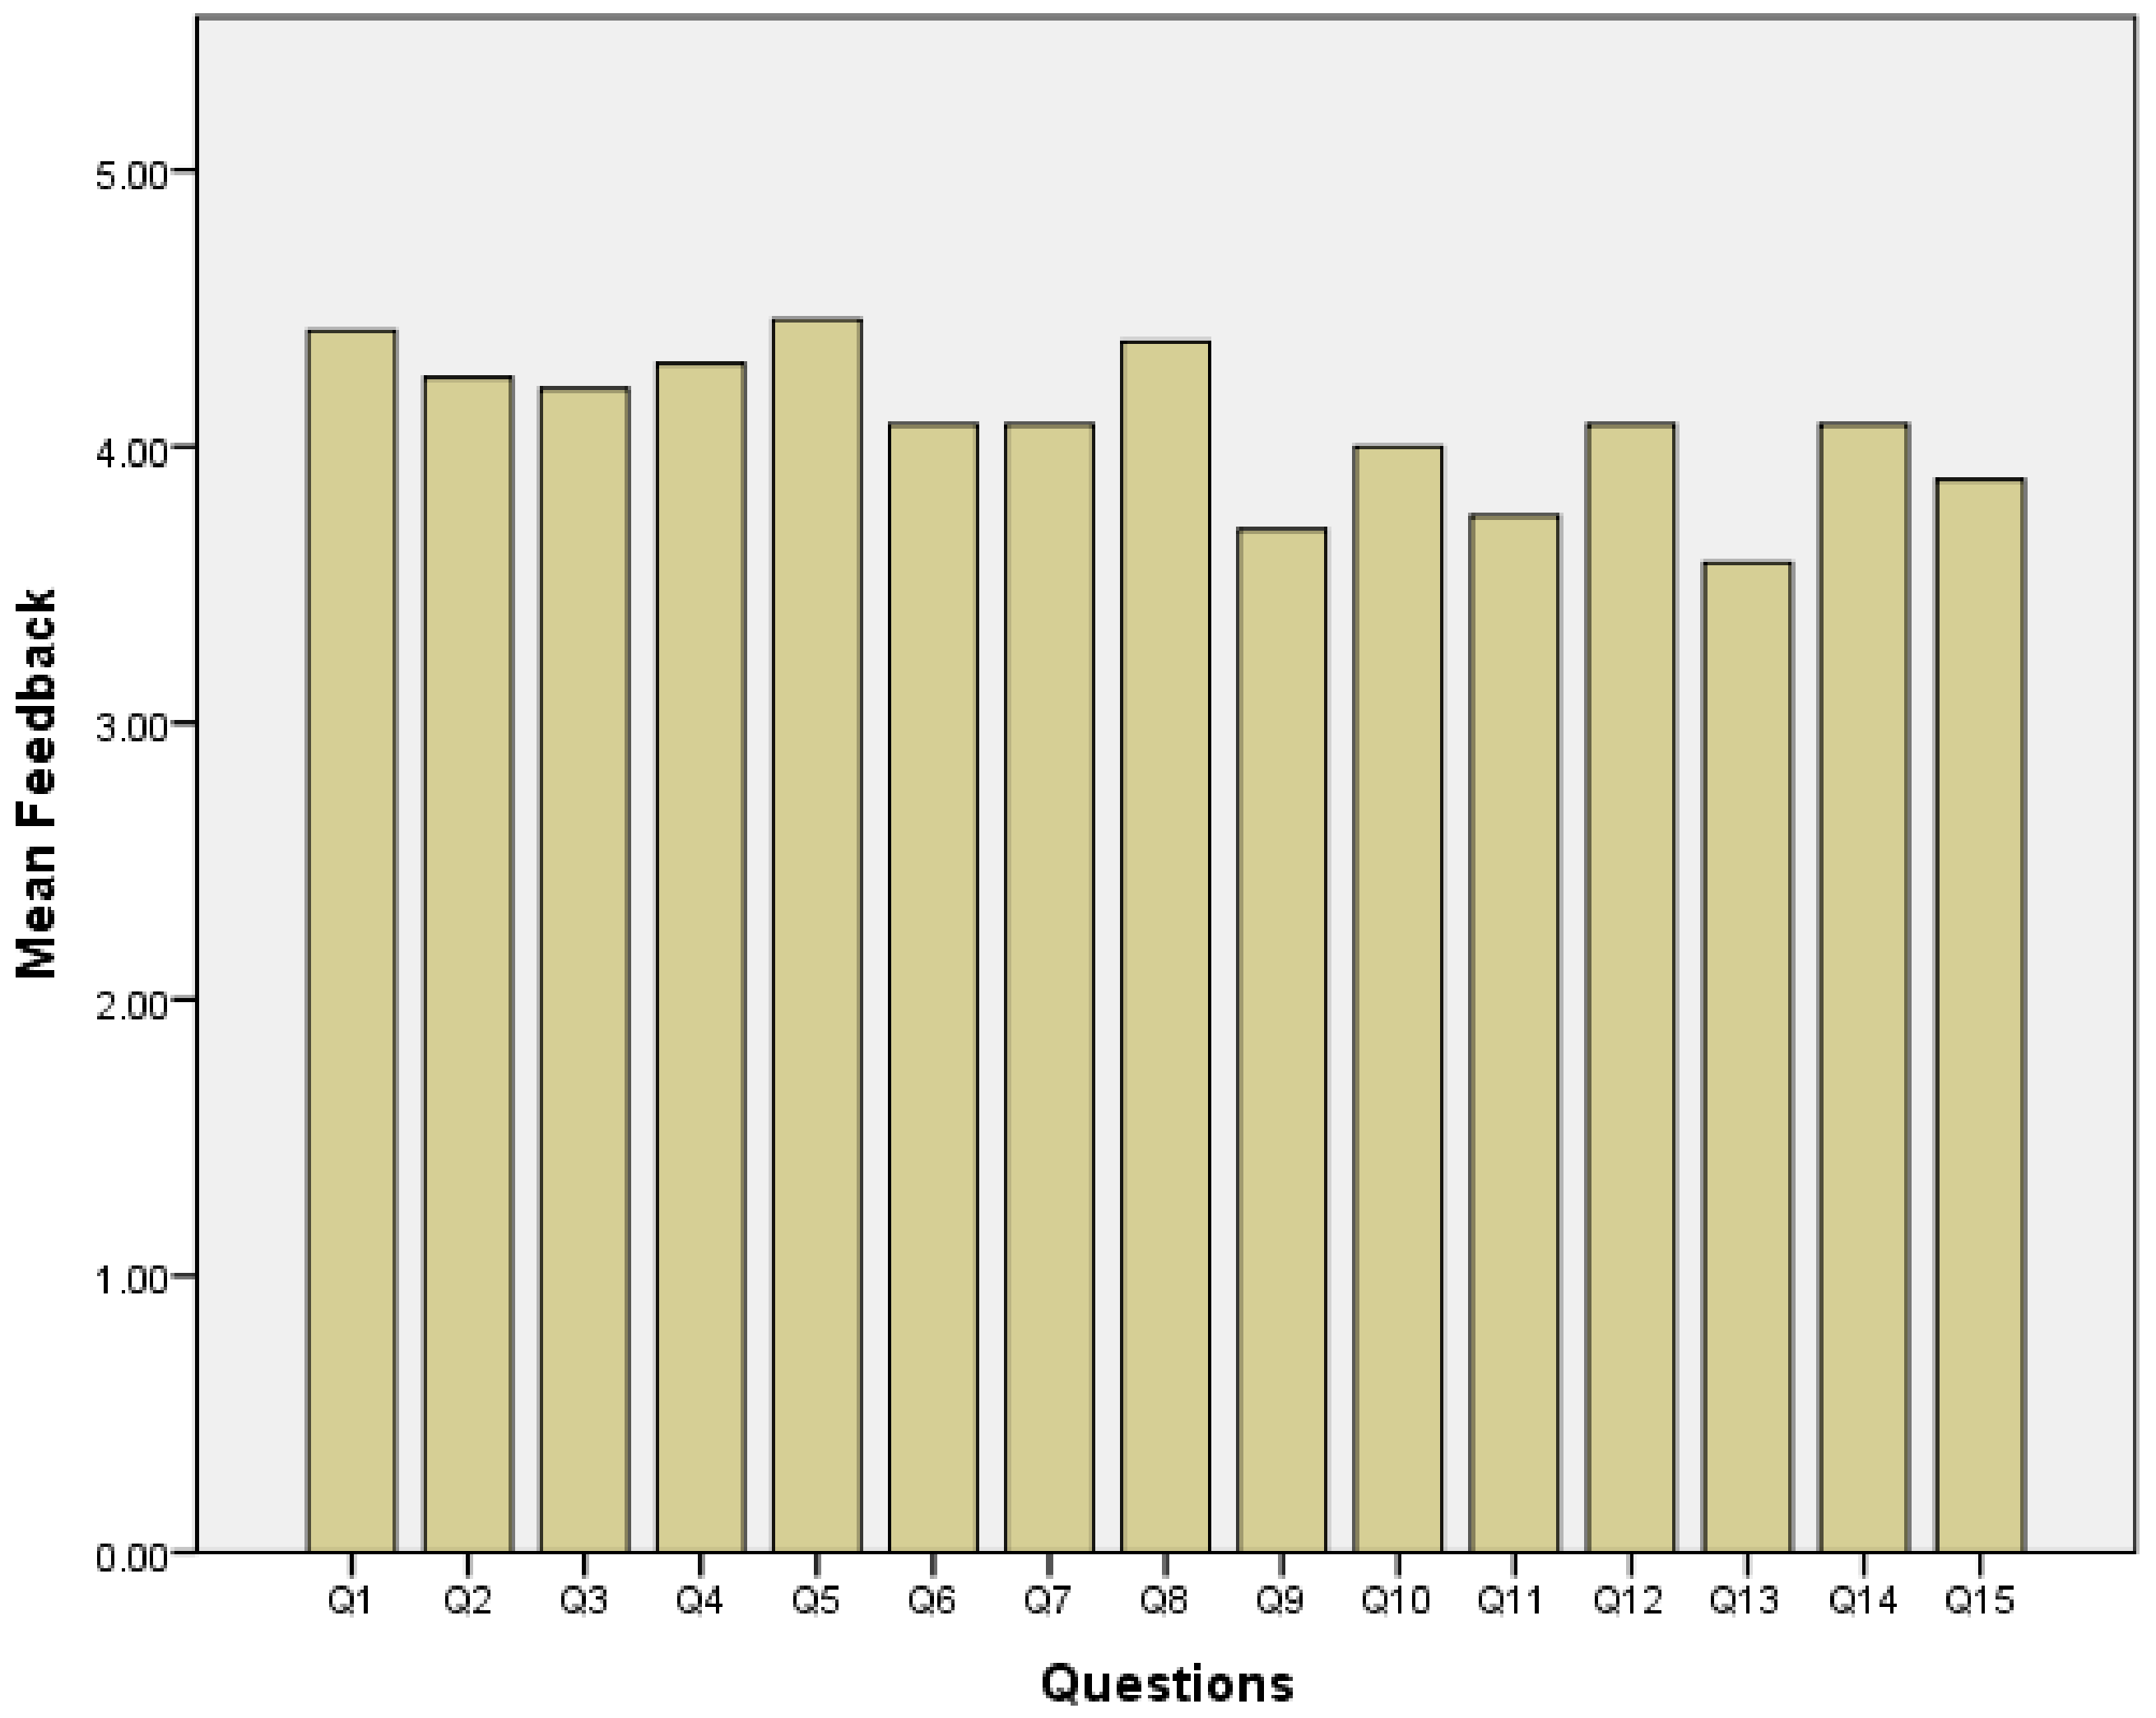
Findings of the survey are shown in Figure 6 and Table 4. Participants showed a significant agreement to the majority of questions in the survey. Questions [1,2,3,4], relating group tasks and collobrative activities, scored 4.21 or above. The question regarding the use of technology, i.e., “Plickers” and “Slido” scored 4.46.
4.5. Learners Outcomes and Feedback
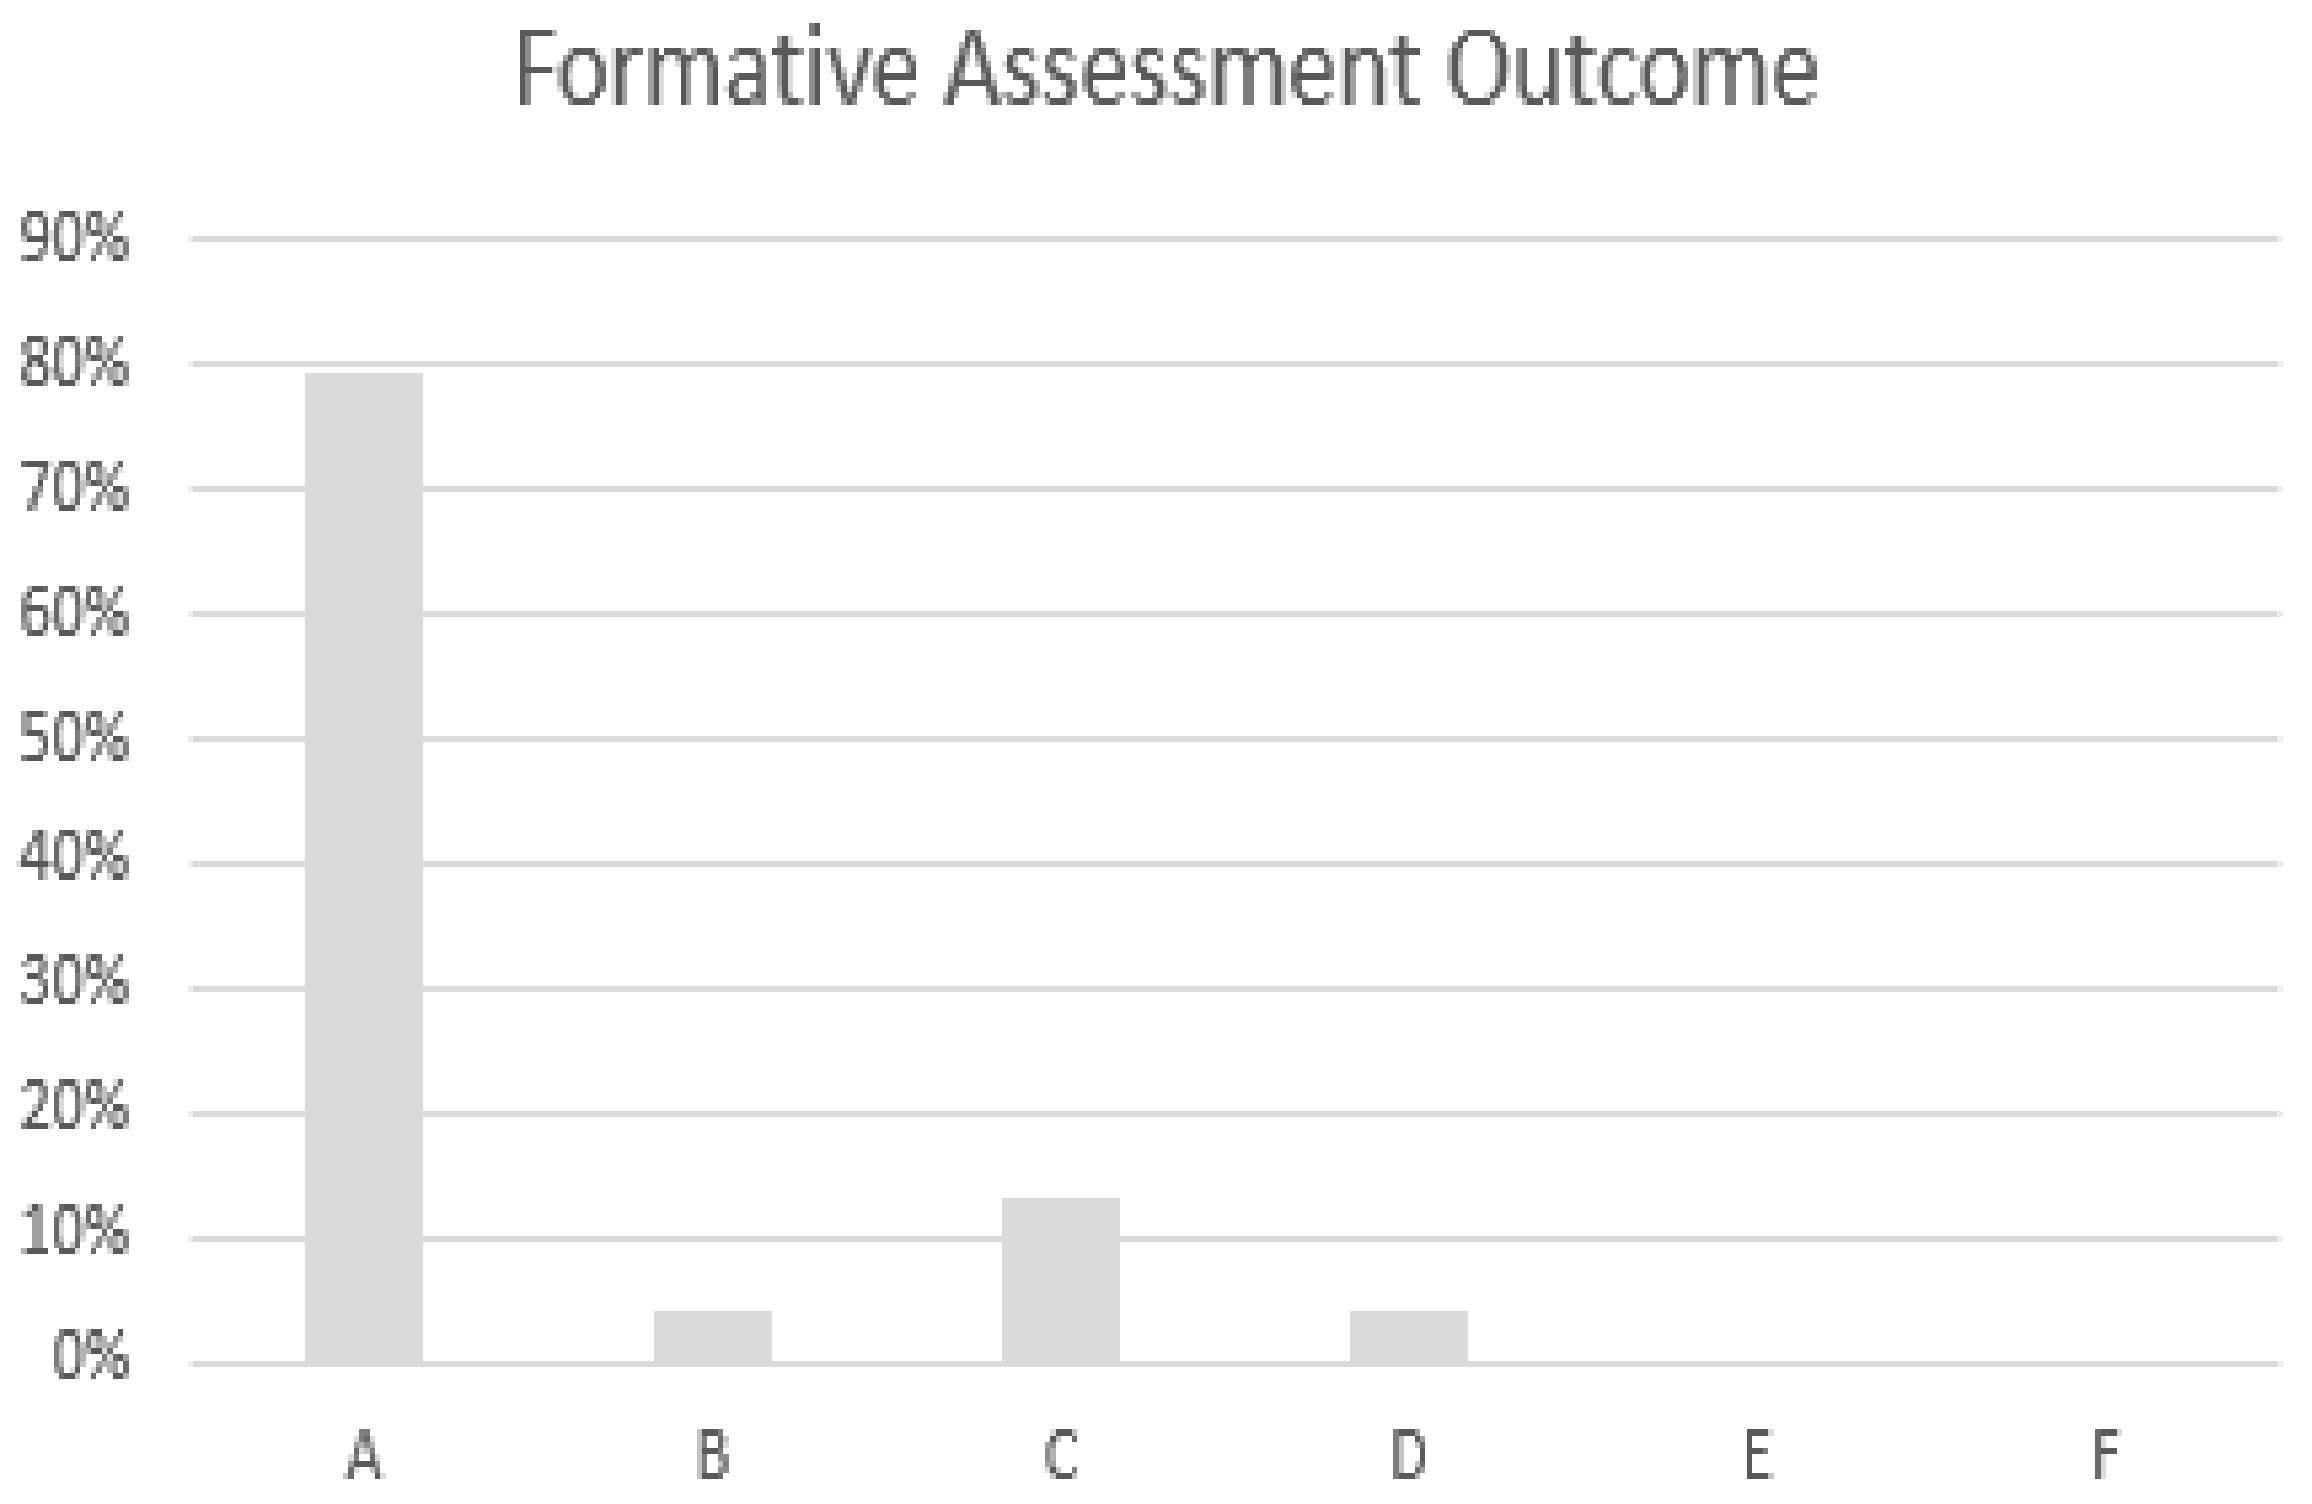
While student engagement in the classroom is the key to a successful outcome, it is important to complete the cycle and evaluate a student’s overall achievement and curriculum outcome. Therefore, we analysed the outcome of the formative assessment during interactive activities as well as the relevant summative component in the final coursework. Figure 7 shows the overall outcomes of the assessment performed using Plickers and Slido quizzes. Students were asked a total of 42 questions interleaved during lectures from week 3 to week 8. The outcomes of the assessment were Mean = 79.41, Min = 43, Max = 100, SD = 14.17. This indicates a good level of engagement in the classroom.
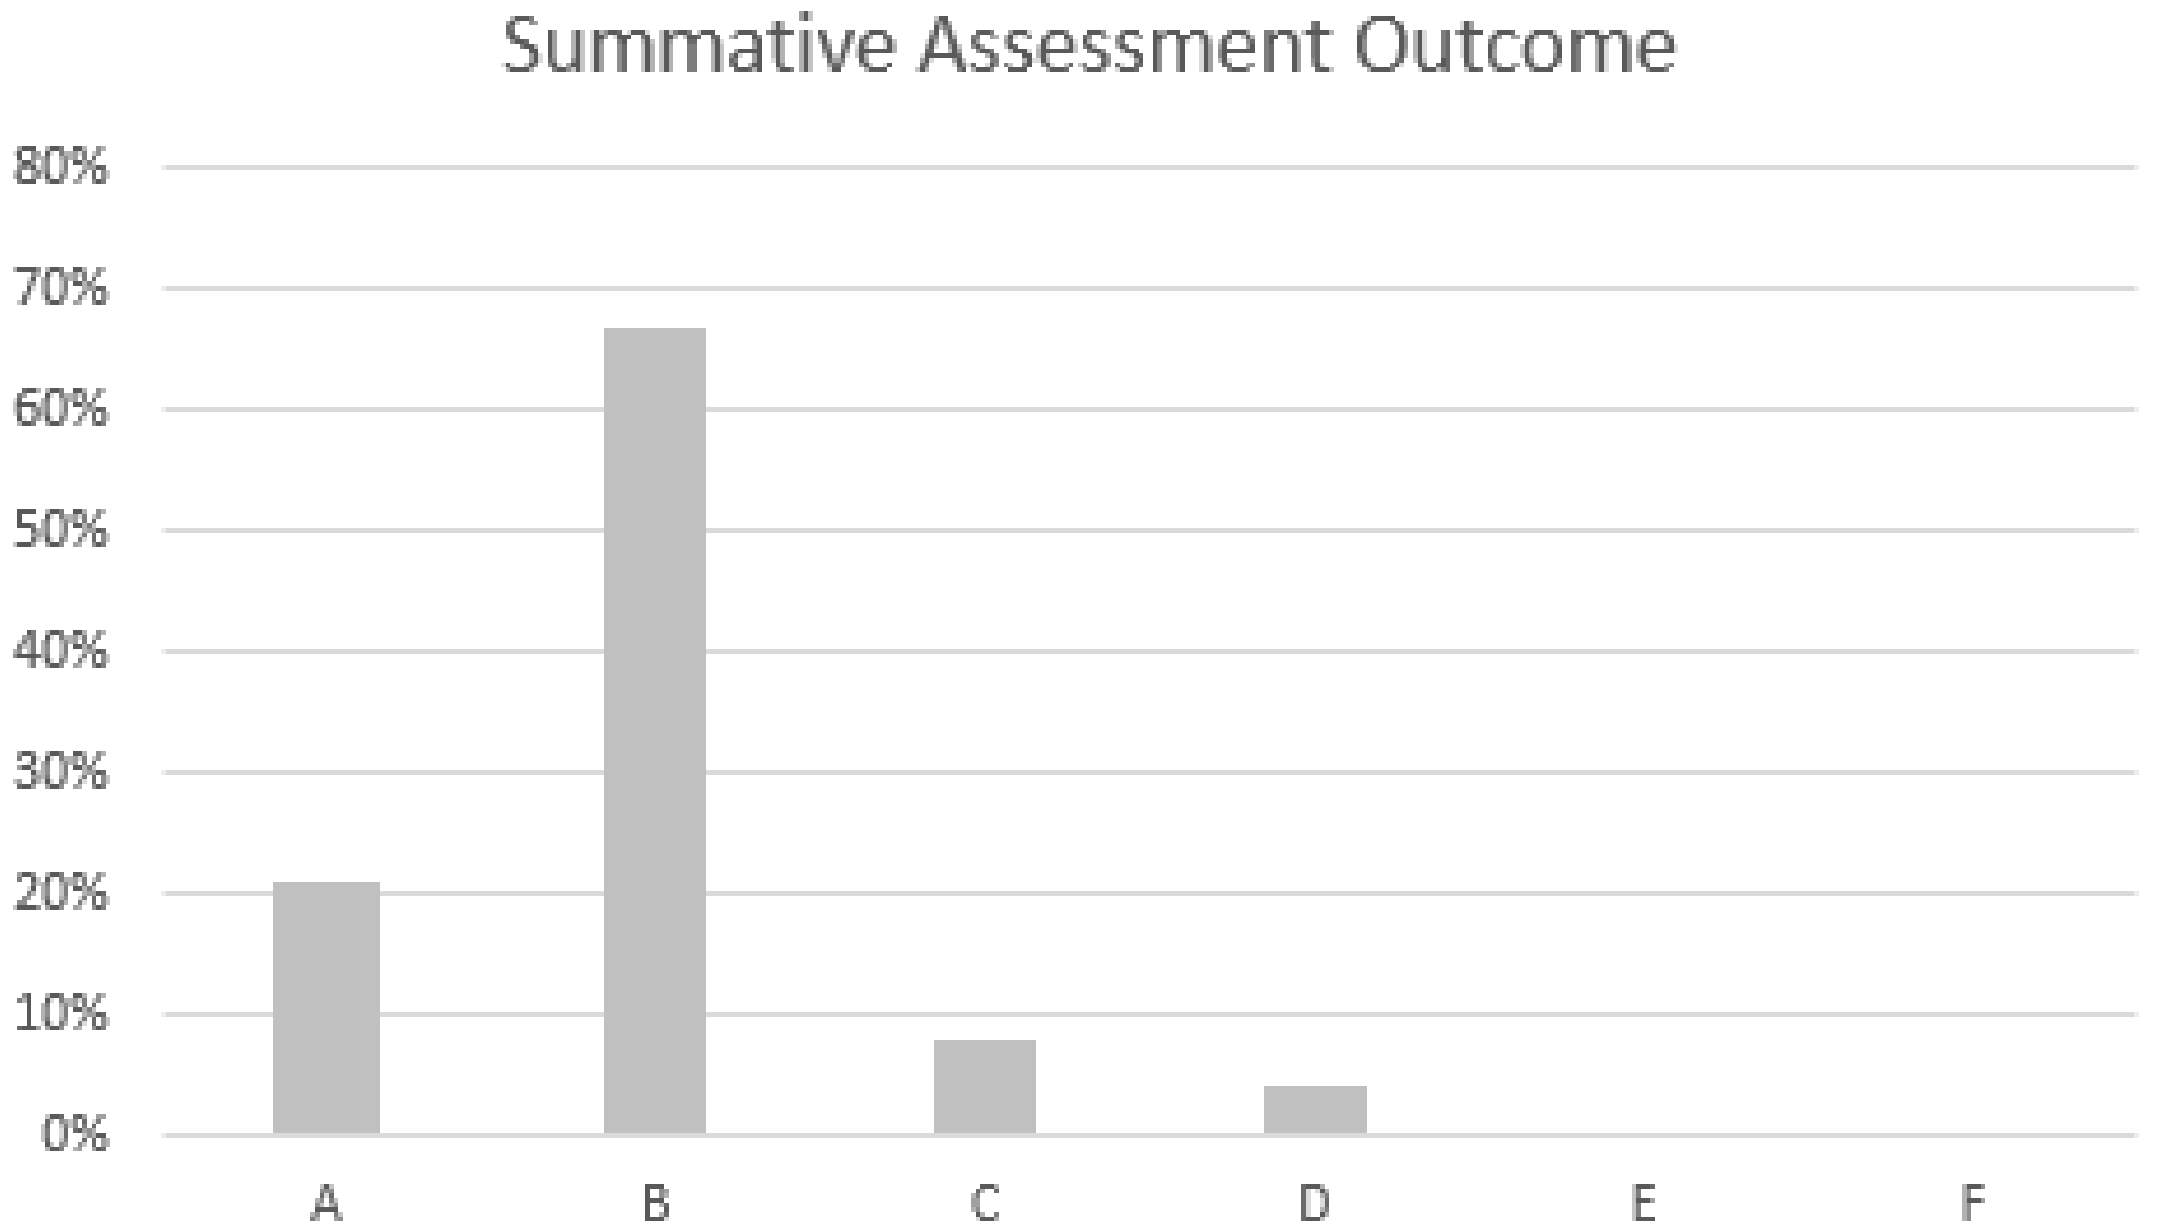
The summative assessment had two components, i.e., theoretical coursework and practical implementation. Since the interactive activities were related with the theoretical underpinning of the subject, we have analysed the final outcome of the coursework for the 24 students that participated in the study. Figure 8 shows a summary of students’ outcomes in the relevant summative assessment component, which were Mean = 64.41, Min = 43, Max = 73, SD = 6.78. The summative assessment was conducted in week 13. Figure 7 and Figure 8 show that students achieved 96% [A–C] grades and 4% [D] grades in both formative and summative assessments.
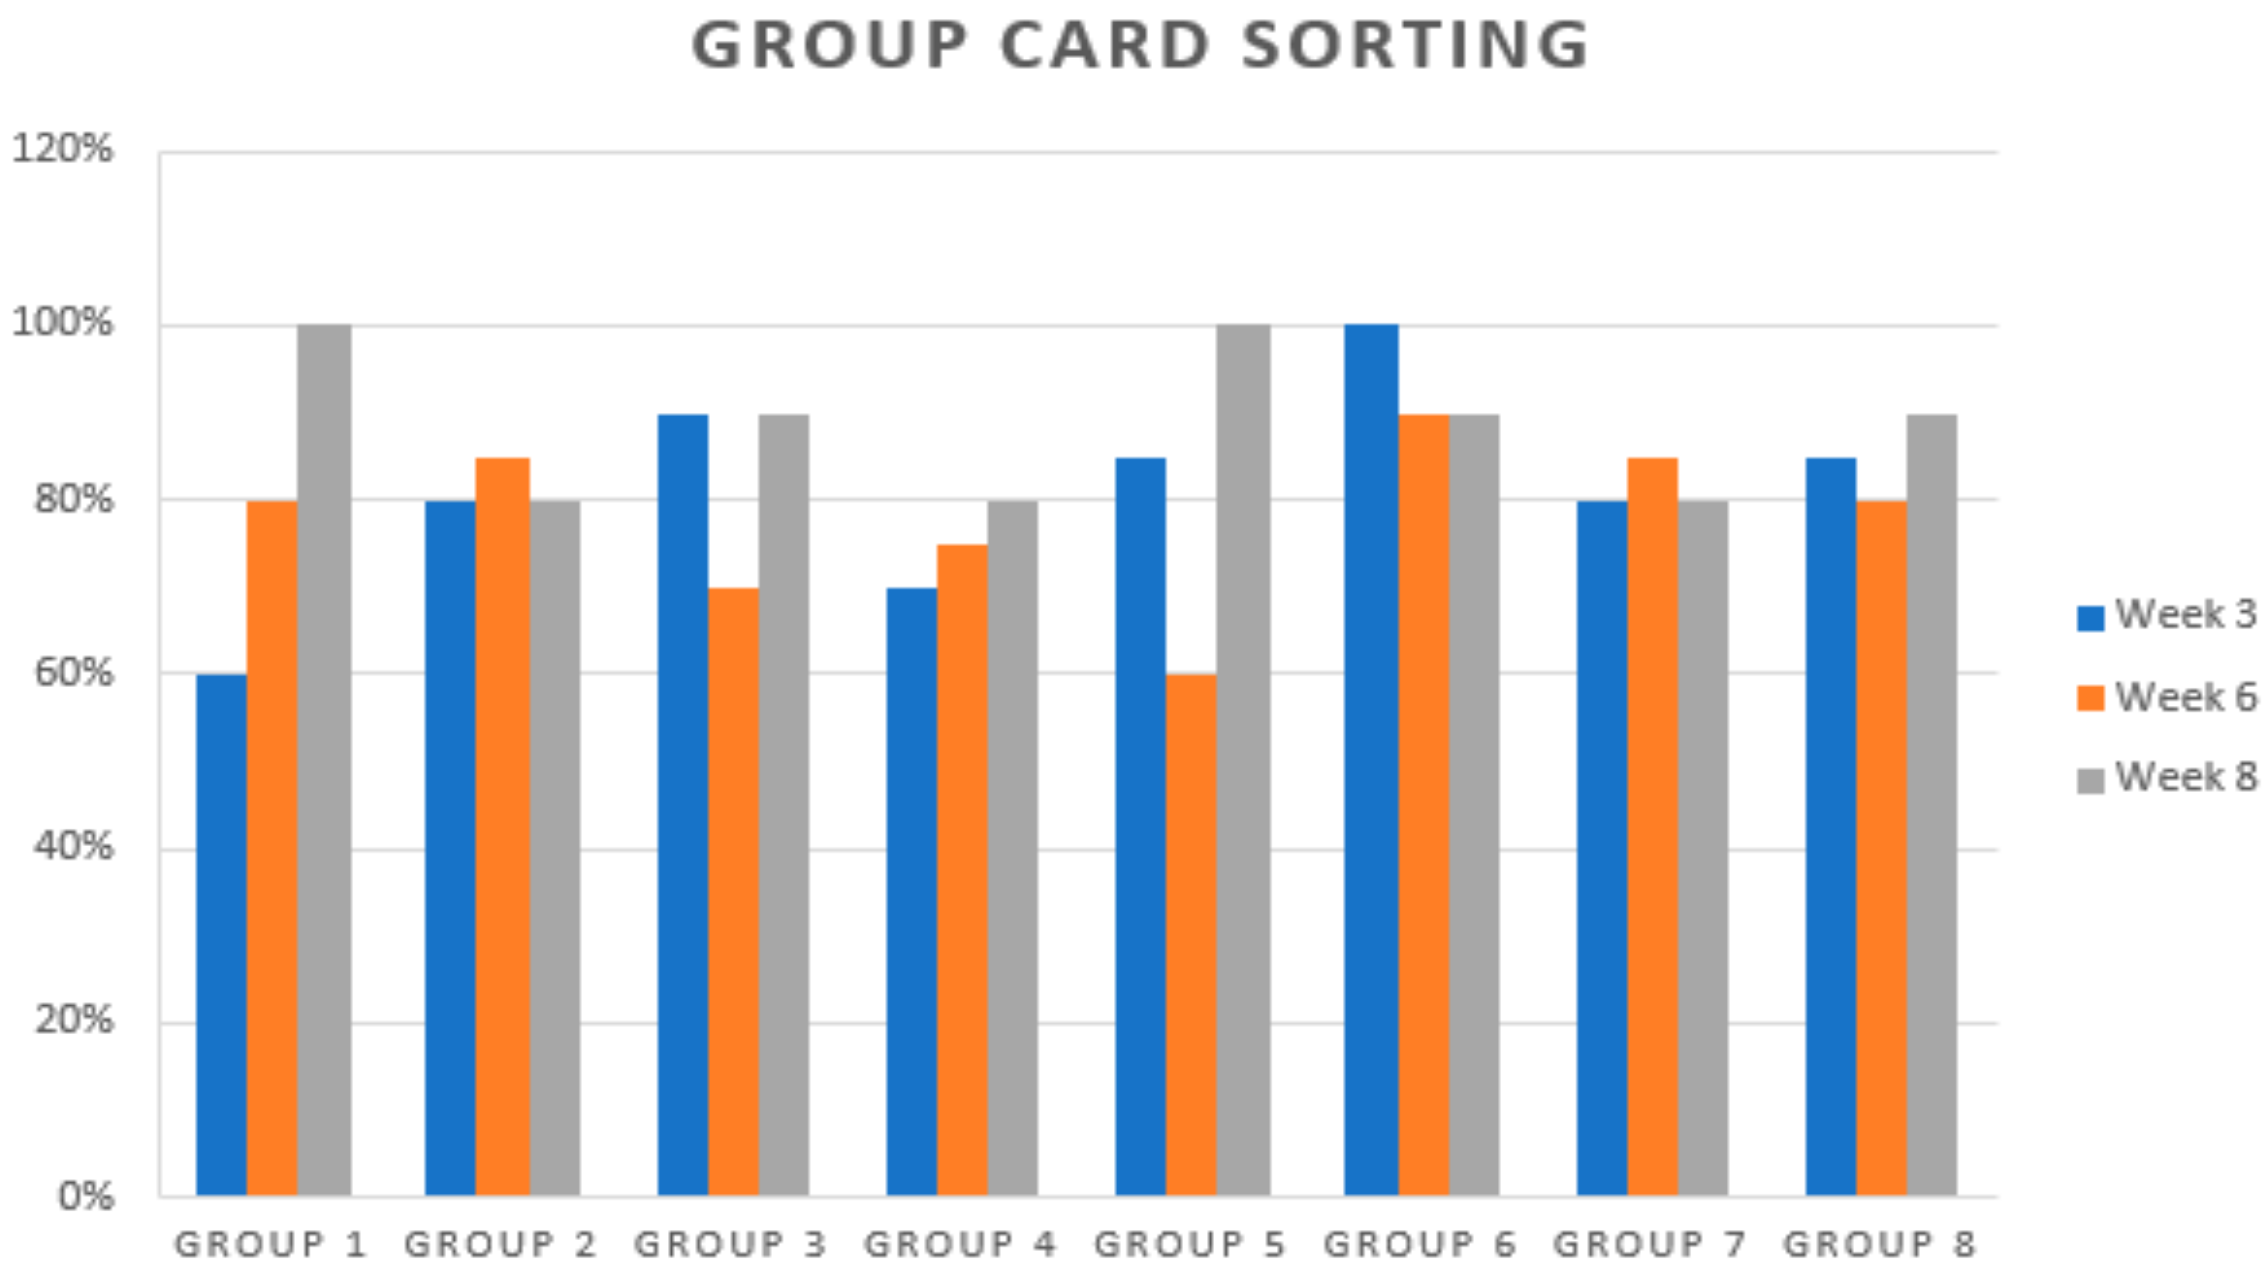
The group card sorting activity was performed in groups, i.e., 8 groups of 3 students randomly allocated each week, and students matched questions and answers written on cards randomly sorted. The lecturer went to each group on their desks in the classroom to check their answers and helped them on spot to match the correct outcomes in case of an incorrect match. To manage time, the group activities were conducted in weeks 3, 6, and 8 only. Figure 9 shows the outcome of the card sorting games recorded in weeks 3, 6, and 8. Student outcomes in the card sorting game activity was Mean = 82.51, Min = 60, Max = 100, SD = 0.11.
To measure the level of engagement, we asked an open text before and after the introduction of interactive activities as shown in Table 4 above. The findings are encouraging and positive. The participants provided positive comments in response to open text question expressing their enjoyment for the new activities as quoted below. This indicates positive emotional engagement.
“I like it and I wish all lecturers do the same!”
“Love the questions at the end of the lectures.”
“Seminars are really productive and have made the course very interesting. I have enjoyed the seminars very much so far and will continue to learn more outside of class because of it.”
4.6. Teacher Observations
There are several factors that may influence learner engagement in a classroom setting. Findings of the pre-test and post-test observations are noted below to understand learners’ behavioural, emotional, and cognitive response to teacher interventions.
- Response to Teacher Enquiries: Before the intervention in week 3, the student–teacher interaction was teacher driven. Some students were believed to be reluctant to participate and respond to teacher enquiries. The problem-based group tasks and card sorting activities [81] increased students’ response to the teacher’s enquiries. This fostered learning and increased trust in the student–teacher relationship and promoted collaborative learning. There was a notable increase in the student’s response to teacher’s enquiries.
- Student Enquiries: The number of students’ enquiries was zero in the first two weeks. However, the group-based activities encouraged constructive discussions and enquiries. It helped in knowledge construction and inclusive learning. At times, the problem-based group exercise generated positive debates between peers, students, and the teacher. The level of interest increased in the last 4 weeks, and some students stayed for longer after the lecture time to make further enquiries.
- Peer Chat and Mobile Phone Distractions: It was observed that a small number of students (4–5) were constantly involved in distracting peer chat and occasionally engaged in activities on their phones in the first 3 weeks. Students were randomly seated during the problem-based group tasks and card sorting exercise, which helped to divert the discussion in a positive direction. Furthermore, students used their phones for live participation in Slido quizzes, which minimized digital distraction. The use of Plickers display cards to answer the questions increased the element of excitement and participation.
- Late Joining: It was observed that 2–3 students were joining late in the first two weeks. The use of participatory activities encouraged students to be punctual and arrive on time. This improved the class discipline and minimized distraction.
Overall, a positive behavioural change was observed in the classroom. Students’ social interaction increased as a result of the teacher’s interventions. The use of technology-based interactions introduced an element of excitement, competition, curiosity, and fun. Students openly expressed their likeness for the teaching approach in the classroom and responded to calls. The segmentation of lectures and variation in activities minimized fatigue. Students were provided instant and constructive feedback on their work.
5. Discussion
The initial analysis of the first survey discussed above indicates positive feedback; however, there was room for improvement in some areas.
While interactive activities are key to learner engagement, there is a significant importance of the subject area, course content, and learning outcomes on learners’ motivation [84,85]. As shown in Table 3, “Learning section”, Q1–4, overall, there has been an increase in students’ feedback in this area. Notably, there was no change in response to Question 1 “I have found the course intellectually challenging and stimulating”, scored 3.7, before and after the introduction of interactive activities. This indicates that irrespective of teaching methodology, intellectually challenging course material has an important role in learning experience. Response to this section reveals the importance and role of a subject area, learning material, and specific learning outcomes in learners’ motivation.
Questions 10 and 11 were evaluated the highest, with a mean score of 3.8 each. This shows genuine teaching efforts to engage learners during the conventional lectures. Although the participants rating to all questions was well-above the median score, none of the questions scored 4 or above.
We introduced changes in three key areas (i) use of technology, i.e., Plickers, Slido, (ii) group activities, i.e., problem-based questions, card sorting, to improve learning and engage students, and (iii) segmentation of lectures. In response to question 7, “The group based problem solving format is the best way for me to learn the material” and question 8, “I enjoyed working with my class mates on group tasks”, participants evaluated them highly, with a mean score 4.08 (SD = 0.81) and 4.38 (SD = 0.7), respectively. In their influential study, Dochy et al. [86] revealed that “there is a robust positive effect from problem based learning on the skills of students and no single study reported negative effects”. However, to fully understand the impact of the problem-based approach, it is warranted to investigate the final learning outcomes post summative assessment. The outcomes of both formative and summative assessments were positive.
The problem-based approach was not the only indicator for change in learners’ behaviour. The cognitive load theory describes how a limited capacity of working memory can impact learners’ ability to process new information [87], which may influence engagement with learning activities. We attempted to reduce cognitive load and pressure on students’ working memory by switching from ongoing passive lecture to active learning, promoting social learning and utilising technology. The segmentation principle of Mayer and Moreno [80] on 12 principles of multimedia design can be applied in an in-class room setting, which states that people learn better when a lesson is presented in user-paced segments rather than as a continuous unit.
The creative use of interactive tools and technologies encouraged participation and inclusive learning. An improvement in students’ engagement, participation, and interest was also observed during classroom activities. The students expressed this in their feedback to open text questions cited in the previous section. The use of Plickers and Slido applications was effective for formative assessment. Some students were hesitant to respond to short enquiries made by the lecturer, however, the problem-based group task ensured inclusive learning. In response to questions relating the specific use of Slido and Plickers, participants evaluated them significantly high with a mean score of 4.58 (SD = 0.6). Furthermore, evidence from other studies indicates students’ likeness for the use of interactive activities and technology. In a recent study by Wood et al. [88] on the use of the technology, 83% of respondents preferred Plickers compared to written, paper quizzes. In a similar vein, Ha [89] showed that students reported “slido helped them participate more actively in class by answering”, and rated a relevant survey question positively (Mean = 4.12). Stowell and Nelson [90] reported an increase in students’ engagement with the use of clickers. Sun [91] reported that the use of technology and in-class polls reduced students’ anxiety, and improved outcomes as well as their attention during polling. The use of innovative approaches to designing learning activities using Slido and Plickers improved on the legacy clicker system by reducing the cost of purchase and maintenance of hand held devices [92]. Although participants responded positively to the use of mobile phones, there are limitations to their use, including access to mobile phones or laptops, the Internet, and software license costs for a large number of users.
The group activities and problem-based tasks were aligned with the learning outcomes. Participants responded positively to questions relating card sorting activities and group tasks, and both scored 4.08. An earlier study [93] reported that in problem-based and team learning, the amount of learner-to-learner engagement was much greater than in lectures, where most engagement was of the learner-to-instructor and self-engagement types. This also increased learner-to-instructor engagement. However, organising group tasks and card sorting may require additional time and resources.
6. Study Limitations
The study was conducted in an active teaching practice with a limited number of participants (n = 24). This may influence the ecological validity to generalise the findings. Although some argue that a teacher observing a small set of classrooms can still produce optimum design insights [94], the current study may result in location and context bias, which needs further investigation. Furthermore, the study is limited to evaluate the impact of interactive and group activities on student motivation and engagement. However, this may further benefit from understanding the statistical correlation of student engagement on the overall learning outcomes including summative assessment. A similar study [95] researched the impact of interactive engagement on overall student achievement (n = 124). Their findings revealed notable improvements on overall student’s academic achievement. These findings are helpful in drawing inference to support the current findings. Another study [96], conducted with 224 high school students, revealed positive outcomes as a result of increased learner engagement. From the current findings and above discussion, we can predict that an increased learner engagement may have a positive influence on the learner’s overall achievements.
The current study targeted computer science undergraduate students at a UK university, and further testing in diverse locations and programmes will reinforce the evidence. The scope needs to further broaden the gender distribution and age range. According to Shibley Hyde and Kling [97], women performs better in higher education than men. Therefore, the current study may benefit further from an increased number of participants with appropriate gender distribution. The study also lacks a control group that would allow us to verify differences or similarities on the use of interactive and didactic application. Furthermore, the learners’ response to the use of interactive activities was recorded using questionnaires and presented here. However, the measure of learning outcome, i.e., what student learnt using various activities, was not recorded, which can be an import factor to determine learning outcomes.
The Community of Enquiry (EOI) framework defines the formation and process of empirical inquiry into problematic situations [98]. The framework constructs three types of learners’ presence including social, cognitive, and teaching presence to understand educational experience. The current study can further expand to understand the teaching presence. The teaching presence is crucial to establish teaching approach, curriculum delivery, and facilitation methods [99].
7. Conclusions
This study conducted a review of a teaching practice, followed by a repeated measure approach to understand the influence of collaboration, group work, and problem-based approaches using interactive activities to enhance learner engagement. The findings indicate significant (p < 0.001) improvement in students’ feedback on learning, engagement, and group work. The use of media technology and interactive activities has a positive impact on promoting learning and, therefore, learner engagement. This study recommends to: (i) Promote problem-based approaches to learning in computer science and encourage student participation in problem solving tasks, (ii) encourage participation and exploit technology driven techniques to promote interaction, (iii) encourage group work to promote social construction of knowledge and collaborative learning, (iv) integrate learning outcomes, module outcome, assessment, and learning activities, and introduce strategies to measure student engagement.
This research work was conducted in one module. However, there is a potential for organising the study in an array of modules and programmes more widely to increase participation and conduct in-depth comparative analysis. The sample size was small, and the study is warranted on a larger sample size, multiple programmes, and diverse locations to increase the statistical significance and currency.
Author Contributions
Conceptualization, A.U.; Data curation, A.U.; Formal analysis, A.U.; Investigation, A.U.; Methodology, A.U.; Software, A.U.; Validation, S.A.; Visualization, S.A.; Writing—original draft, A.U.; Writing—review & editing, S.A. A.U. conceptualize, developed, and implemented the idea in a real teaching practise. A.U. collected and curated the data followed by design, methodology, formal analysis, and drafting the work. S.A. performed review and contributed research validation. Both authors have read and agreed to the published version of the manuscript.
Funding
This research received no external funding.
Conflicts of Interest
The authors declare no conflict of interest.
Availability of Data and Material
The summarised data and material is published in the article.
References
- Halverson, L.R.; Graham, C.R. Learner engagement in blended learning environments: A conceptual framework. Online Learn. 2019, 23, 145–178. [Google Scholar] [CrossRef]
- Paulsen, J.; McCormick, A.C. Reassessing disparities in online learner student engagement in higher education. Educ. Res. 2020, 49, 20–29. [Google Scholar] [CrossRef]
- Kuh, G.D. The national survey of student engagement: Conceptual and empirical foundations. New Dir. Inst. Res. 2009, 2009, 5–20. [Google Scholar] [CrossRef]
- Mallin, I. Lecture and active learning as a dialectical tension. Commun. Educ. 2017, 66, 242–243. [Google Scholar] [CrossRef]
- Deng, R.; Benckendorff, P.; Gannaway, D. Learner engagement in MOOCs: Scale development and validation. Br. J. Educ. Technol. 2020, 51, 245–262. [Google Scholar] [CrossRef]
- Delialioğlu, Ö. Student engagement in blended learning environments with lecture-based and problem-based instructional approaches. J. Educ. Technol. Soc. 2012, 15, 310–322. [Google Scholar]
- Law, K.M.; Lee, V.C.; Yu, Y.-T. Learning motivation in e-learning facilitated computer programming courses. Comput. Educ. 2010, 55, 218–228. [Google Scholar] [CrossRef]
- Jenkins, T. The motivation of students of programming. ACM SIGCSE Bull. 2001, 33. [Google Scholar] [CrossRef]
- Harrison, C.V. Concept-based curriculum: Design and implementation strategies. Int. J. Nurs. Educ. Scholarsh. 2020, 1. [Google Scholar] [CrossRef]
- Pountney, R. The Curriculum Design Coherence. In A Research Approach to Curriculum Development; British Educational Research Association: London, UK, 2020; p. 37. [Google Scholar]
- Blenkin, G.M.; Kelly, A.V. The Primary Curriculum in Action: A Process Approach to Educational Practice; Harpercollins College Division: New York, NY, USA, 1983. [Google Scholar]
- Smith, M.K. Curriculum theory and practice. The Encyclopedia of Informal Education. 2000. Available online: www.infed.org/biblio/b-curricu.htm (accessed on 2 November 2020).
- Tyler, R.W. Basic Principles of Curriculum and Instruction; University of Chicago Press: Chicago, IL, USA, 1949. [Google Scholar]
- Stenhouse, L. An Introduction to Curriculum Research and Development; Pearson Education: London, UK, 1975. [Google Scholar]
- Jonassen, D.H. Thinking technology: Context is everything. Educ. Technol. 1991, 31, 35–37. [Google Scholar]
- Ramsden, P. Learning to Teach in Higher Education; Routledge: London, UK, 2003. [Google Scholar]
- Camilleri, M.A.; Camilleri, A. Student centred learning through serious games. In Student-Centred Learning through Serious Games, Proceedings of the 13th Annual International Technology, Education and Development Conference, Valencia, Spain, 11–13 March 2019; International Academy of Technology, Education and Development (IATED): Valencia, Spain, 2019. [Google Scholar]
- Newmann, F.M. Student Engagement and Achievement in American Secondary Schools; ERIC: New York, NY, USA, 1992. [Google Scholar]
- Stodolsky, S.S. The Subject Matters: Classroom Activity in Math and Social Studies; University of Chicago Press: Chicago, IL, USA, 1988. [Google Scholar]
- Coleman, T.E.; Money, A.G. Student-centred digital game-based learning: A conceptual framework and survey of the state of the art. High. Educ. 2020, 79, 415–457. [Google Scholar] [CrossRef] [Green Version]
- Lee, E.; Hannafin, M.J. A design framework for enhancing engagement in student-centered learning: Own it, learn it, and share it. Educ. Technol. Res. Dev. 2016, 64, 707–734. [Google Scholar] [CrossRef]
- Demuyakor, J. Coronavirus (COVID-19) and online learning in higher institutions of education: A survey of the perceptions of Ghanaian international students in China. Online J. Commun. Media Technol. 2020, 10, e202018. [Google Scholar] [CrossRef]
- Dhawan, S. Online learning: A panacea in the time of COVID-19 crisis. J. Educ. Technol. Syst. 2020, 49, 5–22. [Google Scholar] [CrossRef]
- Carroll, M.; Lindsey, S.; Chaparro, M.; Winslow, B. An applied model of learner engagement and strategies for increasing learner engagement in the modern educational environment. Interact. Learn. Environ. 2019, 1–15. [Google Scholar] [CrossRef]
- Bode, M.; Drane, D.; Kolikant, Y.B.-D.; Schuller, M. A clicker approach to teaching calculus. Not. AMS 2009, 56, 253–256. [Google Scholar]
- Trees, A.R.; Jackson, M.H. The learning environment in clicker classrooms: Student processes of learning and involvement in large university-level courses using student response systems. Learn. Media Technol. 2007, 32, 21–40. [Google Scholar] [CrossRef]
- Kennedy, G.E.; Cutts, Q.I. The association between students’ use of an electronic voting system and their learning outcomes. J. Comput. Assist. Learn. 2005, 21, 260–268. [Google Scholar] [CrossRef]
- Lasry, N. Clickers or flashcards: Is there really a difference? Phys. Teach. 2008, 46, 242–244. [Google Scholar] [CrossRef] [Green Version]
- Greer, L.; Heaney, P.J. Real-time analysis of student comprehension: An assessment of electronic student response technology in an introductory earth science course. J. Geosci. Educ. 2004, 52, 345–351. [Google Scholar] [CrossRef]
- Zhu, E.; Bierwert, C.; Bayer, K. Qwizdom student survey December 06. Raw Data 2006, unpublished. [Google Scholar]
- Hall, R.H.; Collier, H.L.; Thomas, M.L.; Hilgers, M.G. A student response system for increasing engagement, motivation, and learning in high enrollment lectures. In Proceedings of the Americas Conference on Information Systems, Omaha, NE, USA, 11–14 August 2005; p. 255. [Google Scholar]
- Silliman, S.E.; Abbott, K.; Clark, G.; McWilliams, L. Observations on benefits/limitations of an audience response system. Age 2004, 9, 1. [Google Scholar]
- Koenig, K. Building acceptance for pedagogical reform through wide-scale implementation of clickers. J. Coll. Sci. Teach. 2010, 39, 46. [Google Scholar]
- Mason, R.B. Student engagement with, and participation in, an e-forum. J. Int. Forum Educ. Technol. Soc. 2011, 258–268. [Google Scholar]
- Walsh, J.P.; Chih-Yuan Sun, J.; Riconscente, M. Online teaching tool simplifies faculty use of multimedia and improves student interest and knowledge in science. CBE Life Sci. Educ. 2011, 10, 298–308. [Google Scholar] [CrossRef] [PubMed]
- Sun, J.C.Y.; Rueda, R. Situational interest, computer self-efficacy and self-regulation: Their impact on student engagement in distance education. Br. J. Educ. Technol. 2012, 43, 191–204. [Google Scholar] [CrossRef] [Green Version]
- Middlebrook, G.; Sun, J.C.-Y. Showcase hybridity: A role for blogfolios. In Perspectives on Writing; The Wac Clearinghouse, University of California: Santa Barbara, CA, USA, 2013; pp. 123–133. [Google Scholar]
- Tømte, C.E.; Fossland, T.; Aamodt, P.O.; Degn, L. Digitalisation in higher education: Mapping institutional approaches for teaching and learning. Qual. High. Educ. 2019, 25, 98–114. [Google Scholar] [CrossRef] [Green Version]
- Valk, J.-H.; Rashid, A.T.; Elder, L. Using mobile phones to improve educational outcomes: An analysis of evidence from Asia. Int. Rev. Res. Open Distrib. Learn. 2010, 11, 117–140. [Google Scholar] [CrossRef] [Green Version]
- Şad, S.N.; Göktaş, Ö. Preservice teachers’ perceptions about using mobile phones and laptops in education as mobile learning tools. Br. J. Educ. Technol. 2014, 45, 606–618. [Google Scholar] [CrossRef]
- Ally, M. Mobile Learning: Transforming the Delivery of Education and Training; Athabasca University Press: Edmonton, AB, Canada, 2009. [Google Scholar]
- McCoy, B. Digital Distractions in the Classroom: Student Classroom Use of Digital Devices for Non-Class Related Purposes; University of Nebraska: Lincoln, NE, USA, 2013. [Google Scholar]
- Fried, C.B. In-class laptop use and its effects on student learning. Comput. Educ. 2008, 50, 906–914. [Google Scholar] [CrossRef]
- Burns, S.M.; Lohenry, K. Cellular phone use in class: Implications for teaching and learning a pilot study. Coll. Stud. J. 2010, 44, 805–811. [Google Scholar]
- Flanigan, A.E.; Babchuk, W.A. Digital distraction in the classroom: Exploring instructor perceptions and reactions. Teach. High. Educ. 2020, 1–19. [Google Scholar] [CrossRef]
- Leidner, D.E.; Jarvenpaa, S.L. The use of information technology to enhance management school education: A theoretical view. MIS Q. 1995, 19, 265–291. [Google Scholar] [CrossRef]
- Moallem, M. Applying constructivist and objectivist learning theories in the design of a web-based course: Implications for practice. Educ. Technol. Soc. 2001, 4, 113–125. [Google Scholar]
- Zendler, A. Teaching Methods for computer Science Education in the Context of Significant Learning Theories. Int. J. Inf. Educ. Technol. 2019, 9. [Google Scholar] [CrossRef] [Green Version]
- Ben-Ari, M. Constructivism in computer science education. J. Comput. Math. Sci. Teach. 2001, 20, 45–73. [Google Scholar]
- Barrows, H.S. How to Design a Problem-Based Curriculum for the Preclinical Years; Springer Pub. Co.: Berlin/Heidelberg, Germany, 1985; Volume 8. [Google Scholar]
- Boud, D. Problem-based learning in perspective. In Problem-Based Learning in Education for the Professions; Higher Education Research and Development Society of Australia: Sydney, Australia, 1985; Volume 13. [Google Scholar]
- Pluta, W.J.; Richards, B.F.; Mutnick, A. PBL and beyond: Trends in collaborative learning. Teach. Learn. Med. 2013, 25, S9–S16. [Google Scholar] [CrossRef]
- Bruce, S. Social Learning and Collaborative Learning: Enhancing Learner’s Prime Skills; International Specialised Skills Institute: Carlton, Australia, 2019; p. 64. [Google Scholar]
- Bruffee, K.A. Collaborative Learning: Higher Education, Interdependence, and the Authority of Knowledge. In ERIC; Johns Hopkins University Press: Baltimore, MD, USA, 1999. [Google Scholar]
- Slavin, R.E. Cooperative Learning: Theory, Research, and Practice; Educational Leadership; Johns Hopkins University Press: Baltimore, MD, USA, 1990. [Google Scholar]
- Pace, C.R. Measuring the quality of student effort. Curr. Issues High. Educ. 1980, 2, 10–16. [Google Scholar]
- Jelfs, A.; Nathan, R.; Barrett, C. Scaffolding students: Suggestions on how to equip students with the necessary study skills for studying in a blended learning environment. J. Educ. Media 2004, 29, 85–96. [Google Scholar] [CrossRef]
- Ginns, P.; Ellis, R. Quality in blended learning: Exploring the relationships between on-line and face-to-face teaching and learning. Internet High. Educ. 2007, 10, 53–64. [Google Scholar] [CrossRef]
- McCutcheon, G.; Jung, B. Alternative perspectives on action research. Theory Pract. 1990, 29, 144–151. [Google Scholar] [CrossRef]
- Schön, D.A. Knowing-in-action: The new scholarship requires a new epistemology. Chang. Mag. High. Learn. 1995, 27, 27–34. [Google Scholar] [CrossRef]
- McNiff, J. You and Your Action Research Project; Routledge: Milton, UK, 2016. [Google Scholar]
- Wlodkowski, R.J.; Ginsberg, M.B. Diversity & Motivation; Jossey-Bass Social and Behavioral Science Series; Jossey-Bass: San Francisco, CA, USA, 1995. [Google Scholar]
- Tyler, R.W. Basic Principles of Curriculum and Instruction; University of Chicago Press: Chicago, IL, USA, 2013. [Google Scholar]
- Prideaux, D. Curriculum design. BMJ 2003, 326, 268–270. [Google Scholar] [CrossRef] [PubMed]
- Greenwood, C.R.; Horton, B.T.; Utley, C.A. Academic Engagement: Current Perspectives in Research and Practice. Sch. Psychol. Rev. 2002, 31, 328–349. [Google Scholar] [CrossRef]
- Lee, J.; Song, H.-D.; Hong, A.J. Exploring factors, and indicators for measuring students’ sustainable engagement in e-learning. Sustainability 2019, 11, 985. [Google Scholar] [CrossRef] [Green Version]
- Zuber-Skerritt, O. A model for designing action learning and action research programs. Learn. Organ. 2002, 9, 143–149. [Google Scholar] [CrossRef] [Green Version]
- Gable, G.G. Integrating case study and survey research methods: An example in information systems. Eur. J. Inf. Syst. 1994, 3, 112–126. [Google Scholar] [CrossRef] [Green Version]
- Dillman, D.A.; Bowker, D.K. The web questionnaire challenge to survey methodologists. Online Soc. Sci. 2001, 53–71. [Google Scholar]
- Coffey, M.; Gibbs, G. The evaluation of the student evaluation of educational quality questionnaire (SEEQ) in UK higher education. Assess. Eval. High. Educ. 2001, 26, 89–93. [Google Scholar] [CrossRef]
- Marsh, H.W.; Hocevar, D. Students’ evaluations of teaching effectiveness: The stability of mean ratings of the same teachers over a 13-year period. Teach. Teach. Educ. 1991, 7, 303–314. [Google Scholar] [CrossRef]
- Marsh, H.W.; Roche, L.A. Making students’ evaluations of teaching effectiveness effective: The critical issues of validity, bias, and utility. Am. Psychol. 1997, 52, 1187. [Google Scholar] [CrossRef]
- Farzaneh, N.; Nejadansari, D. Students’ attitude towards using cooperative learning for teaching reading comprehension. Theory Pract. Lang. Stud. 2014, 4, 287. [Google Scholar] [CrossRef]
- Lewin, K. Action research and minority problems. J. Soc. Issues 1946, 2, 34–46. [Google Scholar] [CrossRef]
- Lewin, K. Frontiers in group dynamics II. Channels of group life; social planning and action research. Hum. Relat. 1947, 1, 143–153. [Google Scholar] [CrossRef]
- Dickens, L.; Watkins, K. Action research: Rethinking Lewin. Manag. Learn. 1999, 30, 127–140. [Google Scholar] [CrossRef]
- Barrows, H.S. A taxonomy of problem-based learning methods. Med. Educ. 1986, 20, 481–486. [Google Scholar] [CrossRef]
- Biggs, J. Enhancing teaching through constructive alignment. High. Educ. 1996, 32, 347–364. [Google Scholar] [CrossRef]
- Gibbs, G.; Jenkins, A. Break up your lectures: Or Christaller sliced up. J. Geogr. High. Educ. 1984, 8, 27–39. [Google Scholar] [CrossRef]
- Mayer, R.E.; Moreno, R. Nine ways to reduce cognitive load in multimedia learning. Educ. Psychol. 2003, 38, 43–52. [Google Scholar] [CrossRef] [Green Version]
- Ullah, A. GitHub Repository for Card Sorting—Data and Knowledge Management. Available online: https://github.com/abrarullah007/cardsorting.git (accessed on 2 November 2020).
- Thomas, J.; López-Fernández, V.; Llamas-Salguero, F.; Martín-Lobo, P.; Pradas, S. Participation and knowledge through Plickers in high school students and its relationship to creativity. In Proceedings of the UNESCOUNIR ICT & Education Latam Congress, Bogota, Colombia, 22–24 June 2016. [Google Scholar]
- Graham, K. TechMatters: Further Beyond Basic Presentations: Using Sli.do to Engage and Interact With Your Audience. LOEX Q. 2015, 42, 4. [Google Scholar]
- Bolkan, S. Intellectually stimulating students’ intrinsic motivation: The mediating influence of affective learning and student engagement. Commun. Rep. 2015, 28, 80–91. [Google Scholar] [CrossRef]
- Oh, J.; Kim, S.J.; Kim, S.; Vasuki, R. Evaluation of the effects of flipped learning of a nursing informatics course. J. Nurs. Educ. 2017, 56, 477–483. [Google Scholar] [CrossRef] [PubMed]
- Dochy, F.; Segers, M.; Van den Bossche, P.; Gijbels, D. Effects of problem-based learning: A meta-analysis. Learn. Instr. 2003, 13, 533–568. [Google Scholar] [CrossRef] [Green Version]
- Kirschner, F.; Kester, L.; Corbalan, G. Cognitive load theory and multimedia learning, task characteristics, and learning engagement: The current state of the art. Comput. Hum. Behav. 2010. [Google Scholar] [CrossRef]
- Wood, T.A.; Brown, K.; Grayson, J.M. Faculty and student perceptions of Plickers. In Proceedings of the American Society for Engineering Education, San Juan, PR, USA, 2017; Volume 5. [Google Scholar]
- Ha, J. Using Mobile-Based Slido for Effective Management of a University English Reading Class. Multimed. Assist. Lang. Learn. 2018, 21, 37–56. [Google Scholar]
- Stowell, J.R.; Nelson, J.M. Benefits of electronic audience response systems on student participation, learning, and emotion. Teach. Psychol. 2007, 34, 253–258. [Google Scholar] [CrossRef]
- Sun, J.C.-Y. Influence of polling technologies on student engagement: An analysis of student motivation, academic performance, and brainwave data. Comput. Educ. 2014, 72, 80–89. [Google Scholar] [CrossRef]
- McBurnett, B. Incorporating Paper Clicker (Plicker) Questions in General Chemistry Courses To Enhance Active Learning and Limit Distractions. In Technology Integration in Chemistry Education and Research (TICER); ACS Publications: Washington, DC, USA, 2019; pp. 177–182. [Google Scholar]
- Kelly, P.A.; Haidet, P.; Schneider, V.; Searle, N.; Seidel, C.L.; Richards, B.F. A comparison of in-class learner engagement across lecture, problem-based learning, and team learning using the STROBE classroom observation tool. Teach. Learn. Med. 2005, 17, 112–118. [Google Scholar] [CrossRef]
- Uchidiuno, J.; Yarzebinski, E.; Keebler, E.; Koedinger, K.; Ogan, A. Learning from african classroom pedagogy to increase student engagement in education technologies. In Proceedings of the 2nd ACM SIGCAS Conference on Computing and Sustainable Societies, Accra, Ghana, 3–5 July 2019. [Google Scholar]
- Tlhoaele, M.; Hofman, A.; Winnips, K.; Beetsma, Y. The impact of interactive engagement methods on students’ academic achievement. High. Educ. Res. Dev. 2014, 33, 1020–1034. [Google Scholar] [CrossRef]
- Mustami’ah, D.; Widanti, N.S.; Rahmania, A.M. Student Engagement, Learning Motivation And Academic Achievement Through Private Junior High School Students In Bulak District, Surabaya. Int. J. Innov. Res. Adv. Stud. IJIRAS 2020, 7, 130–139. [Google Scholar]
- Shibley Hyde, J.; Kling, K.C. Women, motivation, and achievement. Psychol. Women Q. 2001, 25, 364–378. [Google Scholar] [CrossRef]
- Garrison, D.R.; Anderson, T.; Archer, W. Critical inquiry in a text-based environment: Computer conferencing in higher education. Internet High. Educ. 1999, 2, 87–105. [Google Scholar] [CrossRef] [Green Version]
- Garrison, D.R.; Vaughan, N.D. Blended Learning in Higher Education: Framework, Principles, and Guidelines; John Wiley & Sons: Hoboken, NJ, USA, 2008. [Google Scholar]
Figure 1.
Lewin’s action research model [76].
Figure 1.
Lewin’s action research model [76].

Figure 2.
Results of initial feedback on SEEQ questionnaire.

Figure 3.
Interactive activities. (a) Plicker cards, (b) Plicker results, (c) Slido polls, (d) Slido questions summary.
Figure 3.
Interactive activities. (a) Plicker cards, (b) Plicker results, (c) Slido polls, (d) Slido questions summary.


Figure 4.
Trend graph.

Figure 5.
Pre-test and post-test survey comparison.

Figure 6.
Feedback on interactive group activities.

Figure 7.
Formative assessment outcome.

Figure 8.
Summative assessment outcome.

Figure 9.
Card sorting outcome.


Table 1.
SEEQ (Student Evaluation of Educational Quality) Questionnaire [70].
Table 1.
SEEQ (Student Evaluation of Educational Quality) Questionnaire [70].
| Learning |
| 1. I have found the course intellectually challenging and stimulating. |
| 2. I have learned something which I consider valuable. |
| 3. My interest in the subject has increased as a consequence of this course. |
| 4. I have learned and understood the subject materials of this course. |
| Organization |
| 5. Instructor’s explanations were clear. |
| 6. Course materials were well prepared and carefully explained. |
| 7. Proposed objectives agreed with those actually taught, so I knew where course was going. |
| 8. Instructor gave lectures that facilitated taking notes. |
| Group Interaction |
| 9. Students were encouraged to participate in class discussions. |
| 10. Students were invited to share their ideas and knowledge. |
| 11. Students were encouraged to ask questions and were given meaningful answers. |
| 12. Students were encouraged to express their own ideas and/or question the instructor. |
| Breadth |
| 13. Instructor contrasted the implications of various theories. |
| 14. Instructor presented the background or origin of ideas/concepts developed in class. |
| 15. Instructor presented points of view other than his/her own when appropriate. |
| 16. Instructor adequately discussed current developments in the field. |
| Comments/Feedback |
| 17. Please provide any additional comments or feedback. |
Likert Scale [5-Strongly Agree to 1-Strongly Disagree].
Table 2.
Participants’ characteristics.
| Characteristic | Value |
|---|---|
| Programme | BSc (Computer Science) |
| Module | Data and Knowledge Management |
| Average Age | 20–22 |
| Nationalities | UK (21), China (1), Middle East (2) |
| Gender | Female: 7, Male: 17 |
| Total participants | 24 |
Table 3.
Feedback on interactive group activities.
| SEEQ Questionnaire | Response (Mean) | |
|---|---|---|
| Learning | Pre | Post |
| 1. I have found the course intellectually challenging and stimulating. | 3.7 | 3.7 |
| 2. I have learned something which I consider valuable. | 3.6 | 4.2 |
| 3. My interest in the subject has increased as a consequence of this course. | 3.2 | 4.2 |
| 4. I have learned and understood the subject materials of this course. | 3.2 | 4.0 |
| Organization | ||
| 5. Instructor’s explanations were clear. | 3.4 | 4.1 |
| 6. Course materials were well prepared and carefully explained. | 3.3 | 4.3 |
| 7. Proposed objectives agreed with those actually taught so I knew where course was going. | 3.3 | 3.8 |
| 8. Instructor gave lectures that facilitated taking notes. | 3.3 | 4.0 |
| Group Interaction | ||
| 9. Students were encouraged to participate in class discussions. | 3.7 | 4.5 |
| 10. Students were invited to share their ideas and knowledge. | 3.8 | 4.2 |
| 11. Students were encouraged to ask questions and were given meaningful answers. | 3.8 | 4.4 |
| 12. Students were encouraged to express their own ideas and/or question the instructor. | 3.3 | 4.2 |
| Breadth | ||
| 13. Instructor contrasted the implications of various theories. | 3.4 | 3.8 |
| 14. Instructor presented the background or origin of ideas/concepts developed in class. | 3.6 | 4.0 |
| 15. Instructor presented points of view other than his/her own when appropriate. | 3.5 | 4.0 |
| 16. Instructor adequately discussed current developments in the field. | 3.3 | 3.9 |
| Comments/Feedback | ||
| 17. Please provide any additional comments or feedback. | x | x |
Likert scale [5-Strongly Agree to 1-Strongly Disagree].
Table 4.
Feedback on interactive group activities.
| No. | Questions | Mean | SD |
|---|---|---|---|
| Q.1 | I enjoyed working together in groups. | 4.42 | 0.82 |
| Q.2 | The group/collaborative approach method made understanding of “Database” concepts easy for me. | 4.25 | 0.83 |
| Q.3 | I felt responsibility to contribute to my group. | 4.21 | 0.82 |
| Q.4 | I get along with other group members. | 4.30 | 0.8 |
| Q.5 | The use of technology, e.g., Slido and Plickers, enhanced my learning experience in the class. | 4.46 | 0.64 |
| Q.6 | The card sorting format is the best way for me to learn the material. | 4.08 | 0.7 |
| Q.7 | The group-based problem-solving format is the best way for me to learn the material. | 4.08 | 0.81 |
| Q.8 | I enjoyed working with my class mates on group tasks. | 4.38 | 0.7 |
| Q.9 | The group-based problem-solving format was disruptive (r). | 3.70 | 1.3 |
| Q.10 | The group-based problem-solving approach was NOT effective (r). | 4.00 | 1.1 |
| Q.11 | The group task method helped me to develop enjoyment in coming to the class. | 3.75 | 0.78 |
| Q.12 | I prefer that my teacher use more group activities. | 4.08 | 0.86 |
| Q.13 | My work is better organized when I am in a group. | 3.58 | 0.91 |
| Q.14 | Group activities make the learning experience easier. | 4.08 | 0.64 |
| Q.15 | Cooperative learning can improve my attitude towards work. | 3.88 | 0.73 |
5-Strongly Agree–1-Strongly Disagree “(r) indicate reverse scored”.
Publisher’s Note: MDPI stays neutral with regard to jurisdictional claims in published maps and institutional affiliations. |
© 2020 by the authors. Licensee MDPI, Basel, Switzerland. This article is an open access article distributed under the terms and conditions of the Creative Commons Attribution (CC BY) license (http://creativecommons.org/licenses/by/4.0/).
Share and Cite
MDPI and ACS Style
Ullah, A.; Anwar, S. The Effective Use of Information Technology and Interactive Activities to Improve Learner Engagement. Educ. Sci. 2020, 10, 349. https://0-doi-org.brum.beds.ac.uk/10.3390/educsci10120349
AMA Style
Ullah A, Anwar S. The Effective Use of Information Technology and Interactive Activities to Improve Learner Engagement. Education Sciences. 2020; 10(12):349. https://0-doi-org.brum.beds.ac.uk/10.3390/educsci10120349
Chicago/Turabian StyleUllah, Abrar, and Sajid Anwar. 2020. "The Effective Use of Information Technology and Interactive Activities to Improve Learner Engagement" Education Sciences 10, no. 12: 349. https://0-doi-org.brum.beds.ac.uk/10.3390/educsci10120349
Note that from the first issue of 2016, this journal uses article numbers instead of page numbers. See further details here.