A Multidisciplinary Study of Eye Tracking Technology for Visual Intelligence

 ,
,
Abstract
:1. Introduction
2. Background
2.1. Observational Learning
2.2. Effective Multimedia Learning
2.3. Eye Tracking as an Instructional Tool
2.4. Learning through EMMEs
3. Method
4. Courses and Study Material
4.1. ARTHIST 231/331 Framing the Viewer and ARTHIST 725 Concepts in Contemporary Art
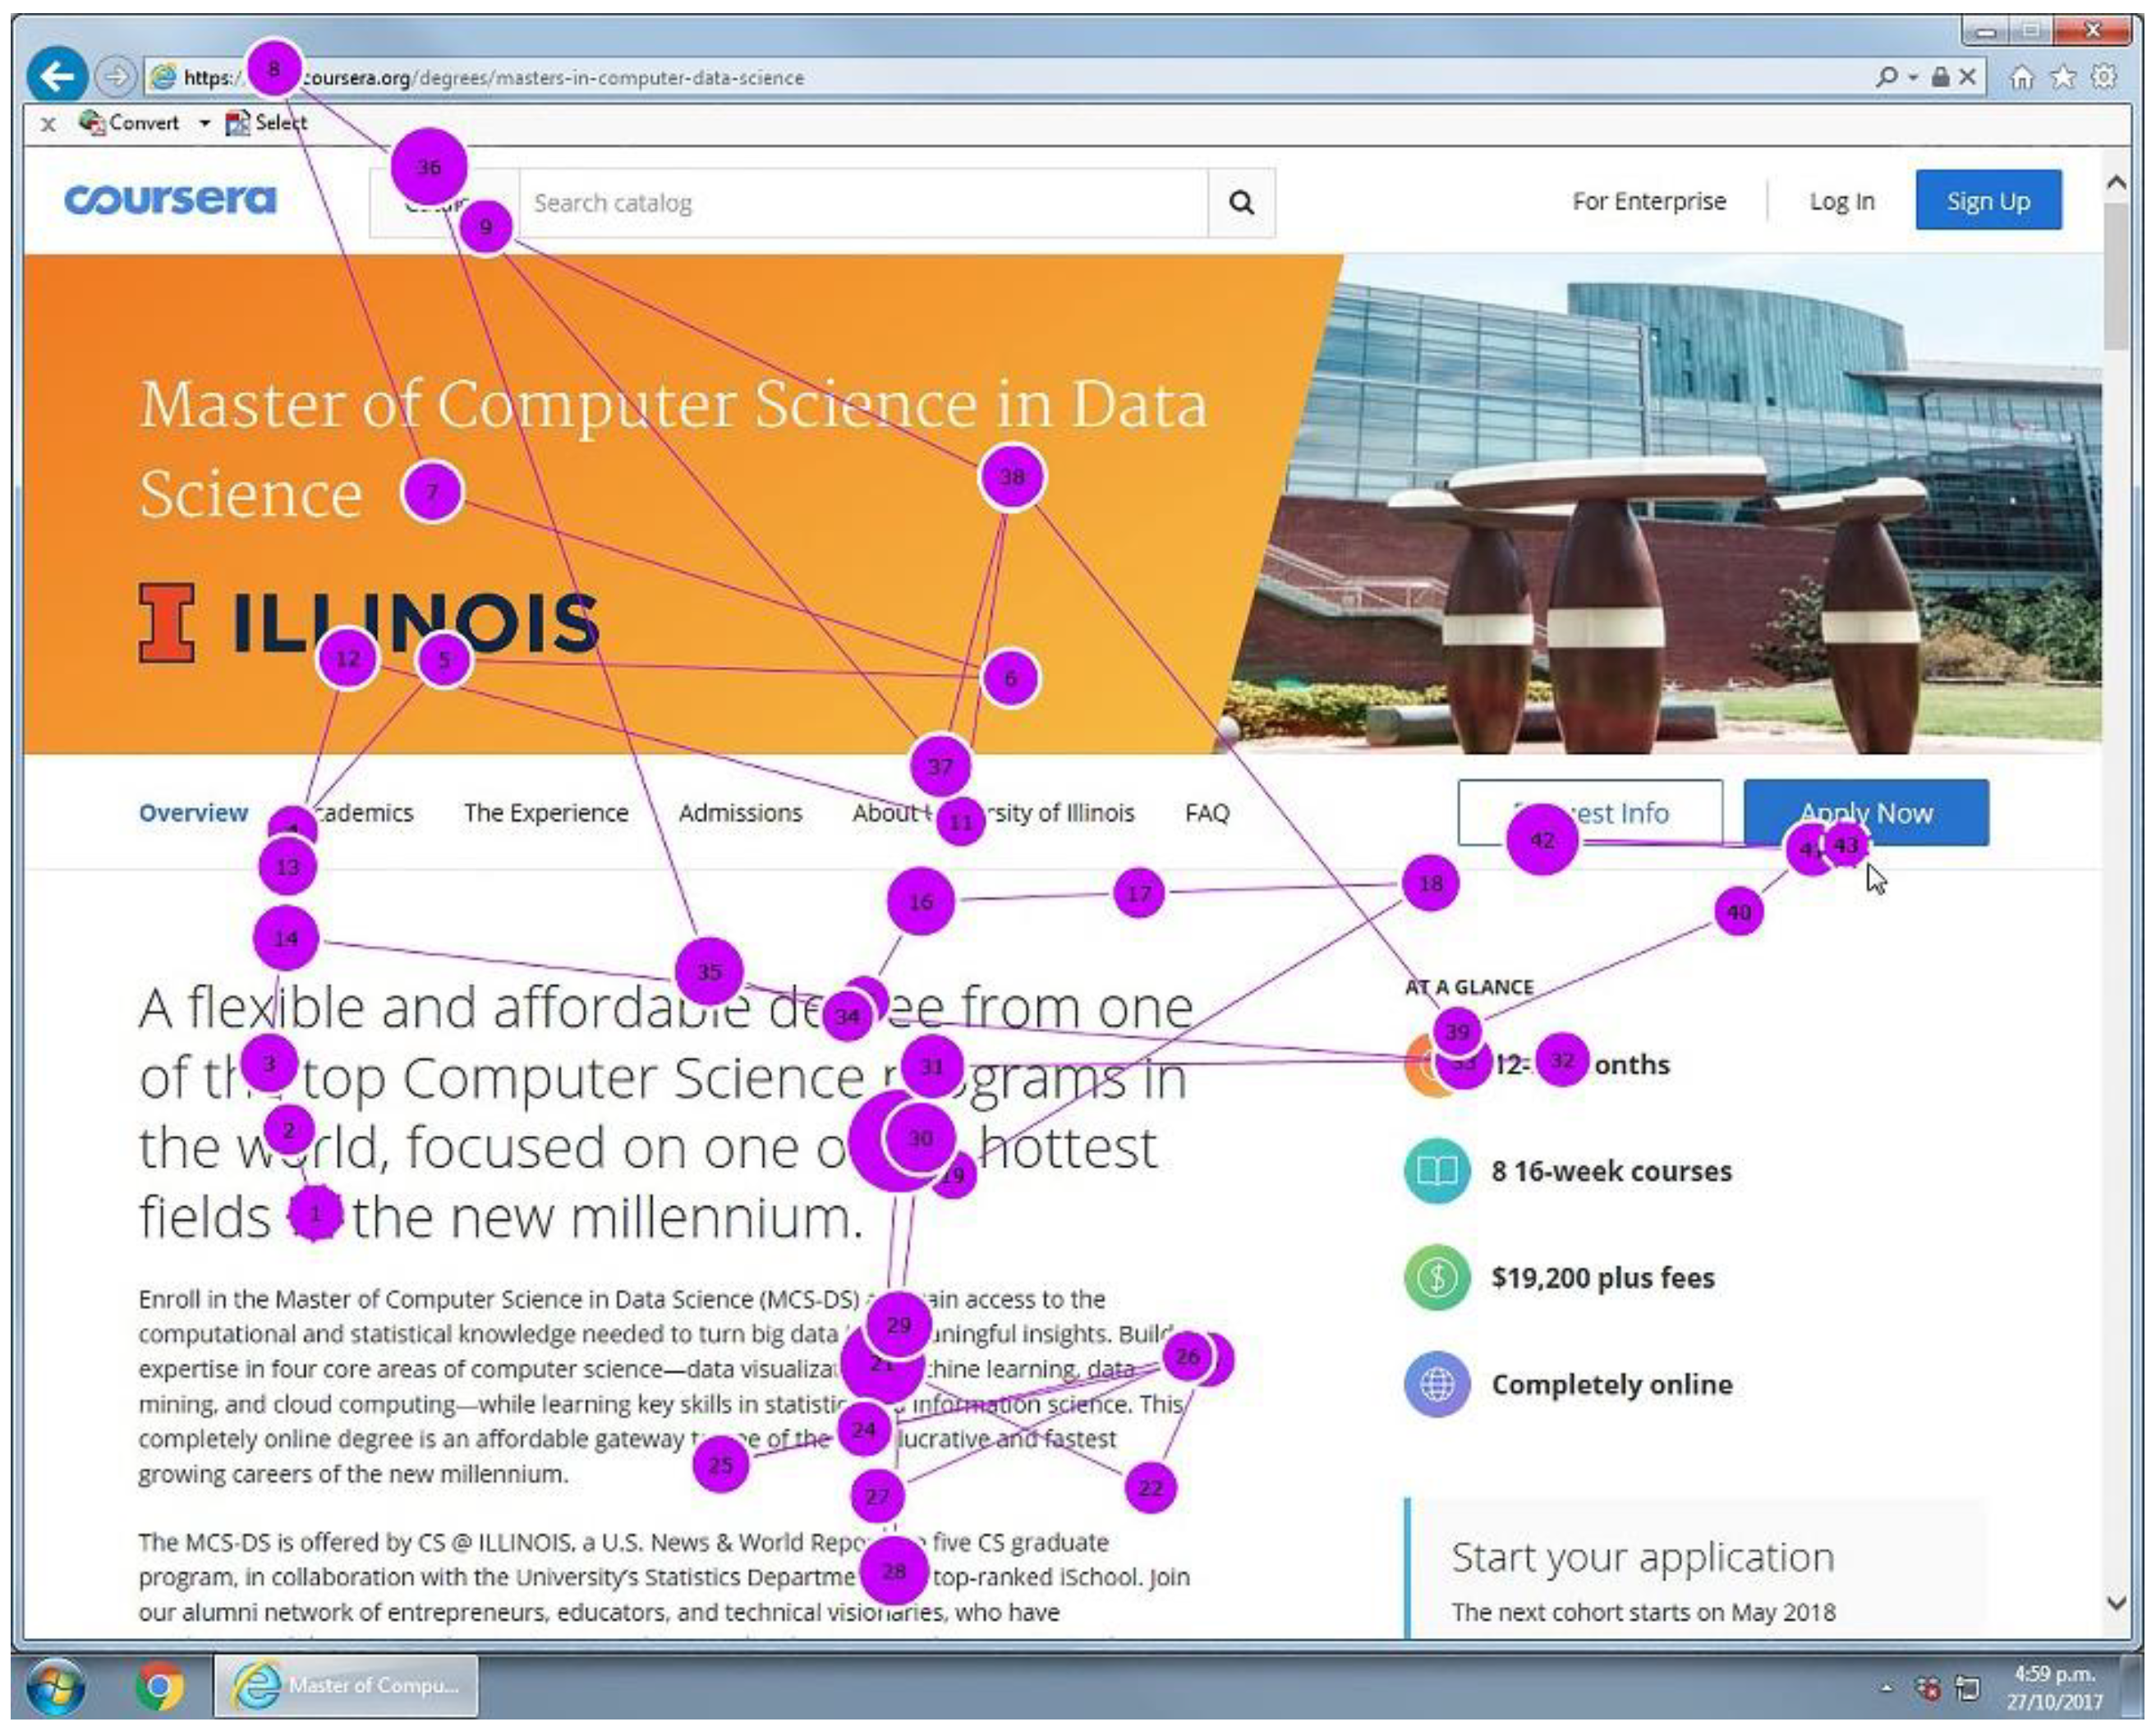
4.2. CM20216 Designing Interactive Systems
4.3. PSYCH 303 Cognitive Science
4.4. HLTHPSYC 715 Research Methods in Health Psychology
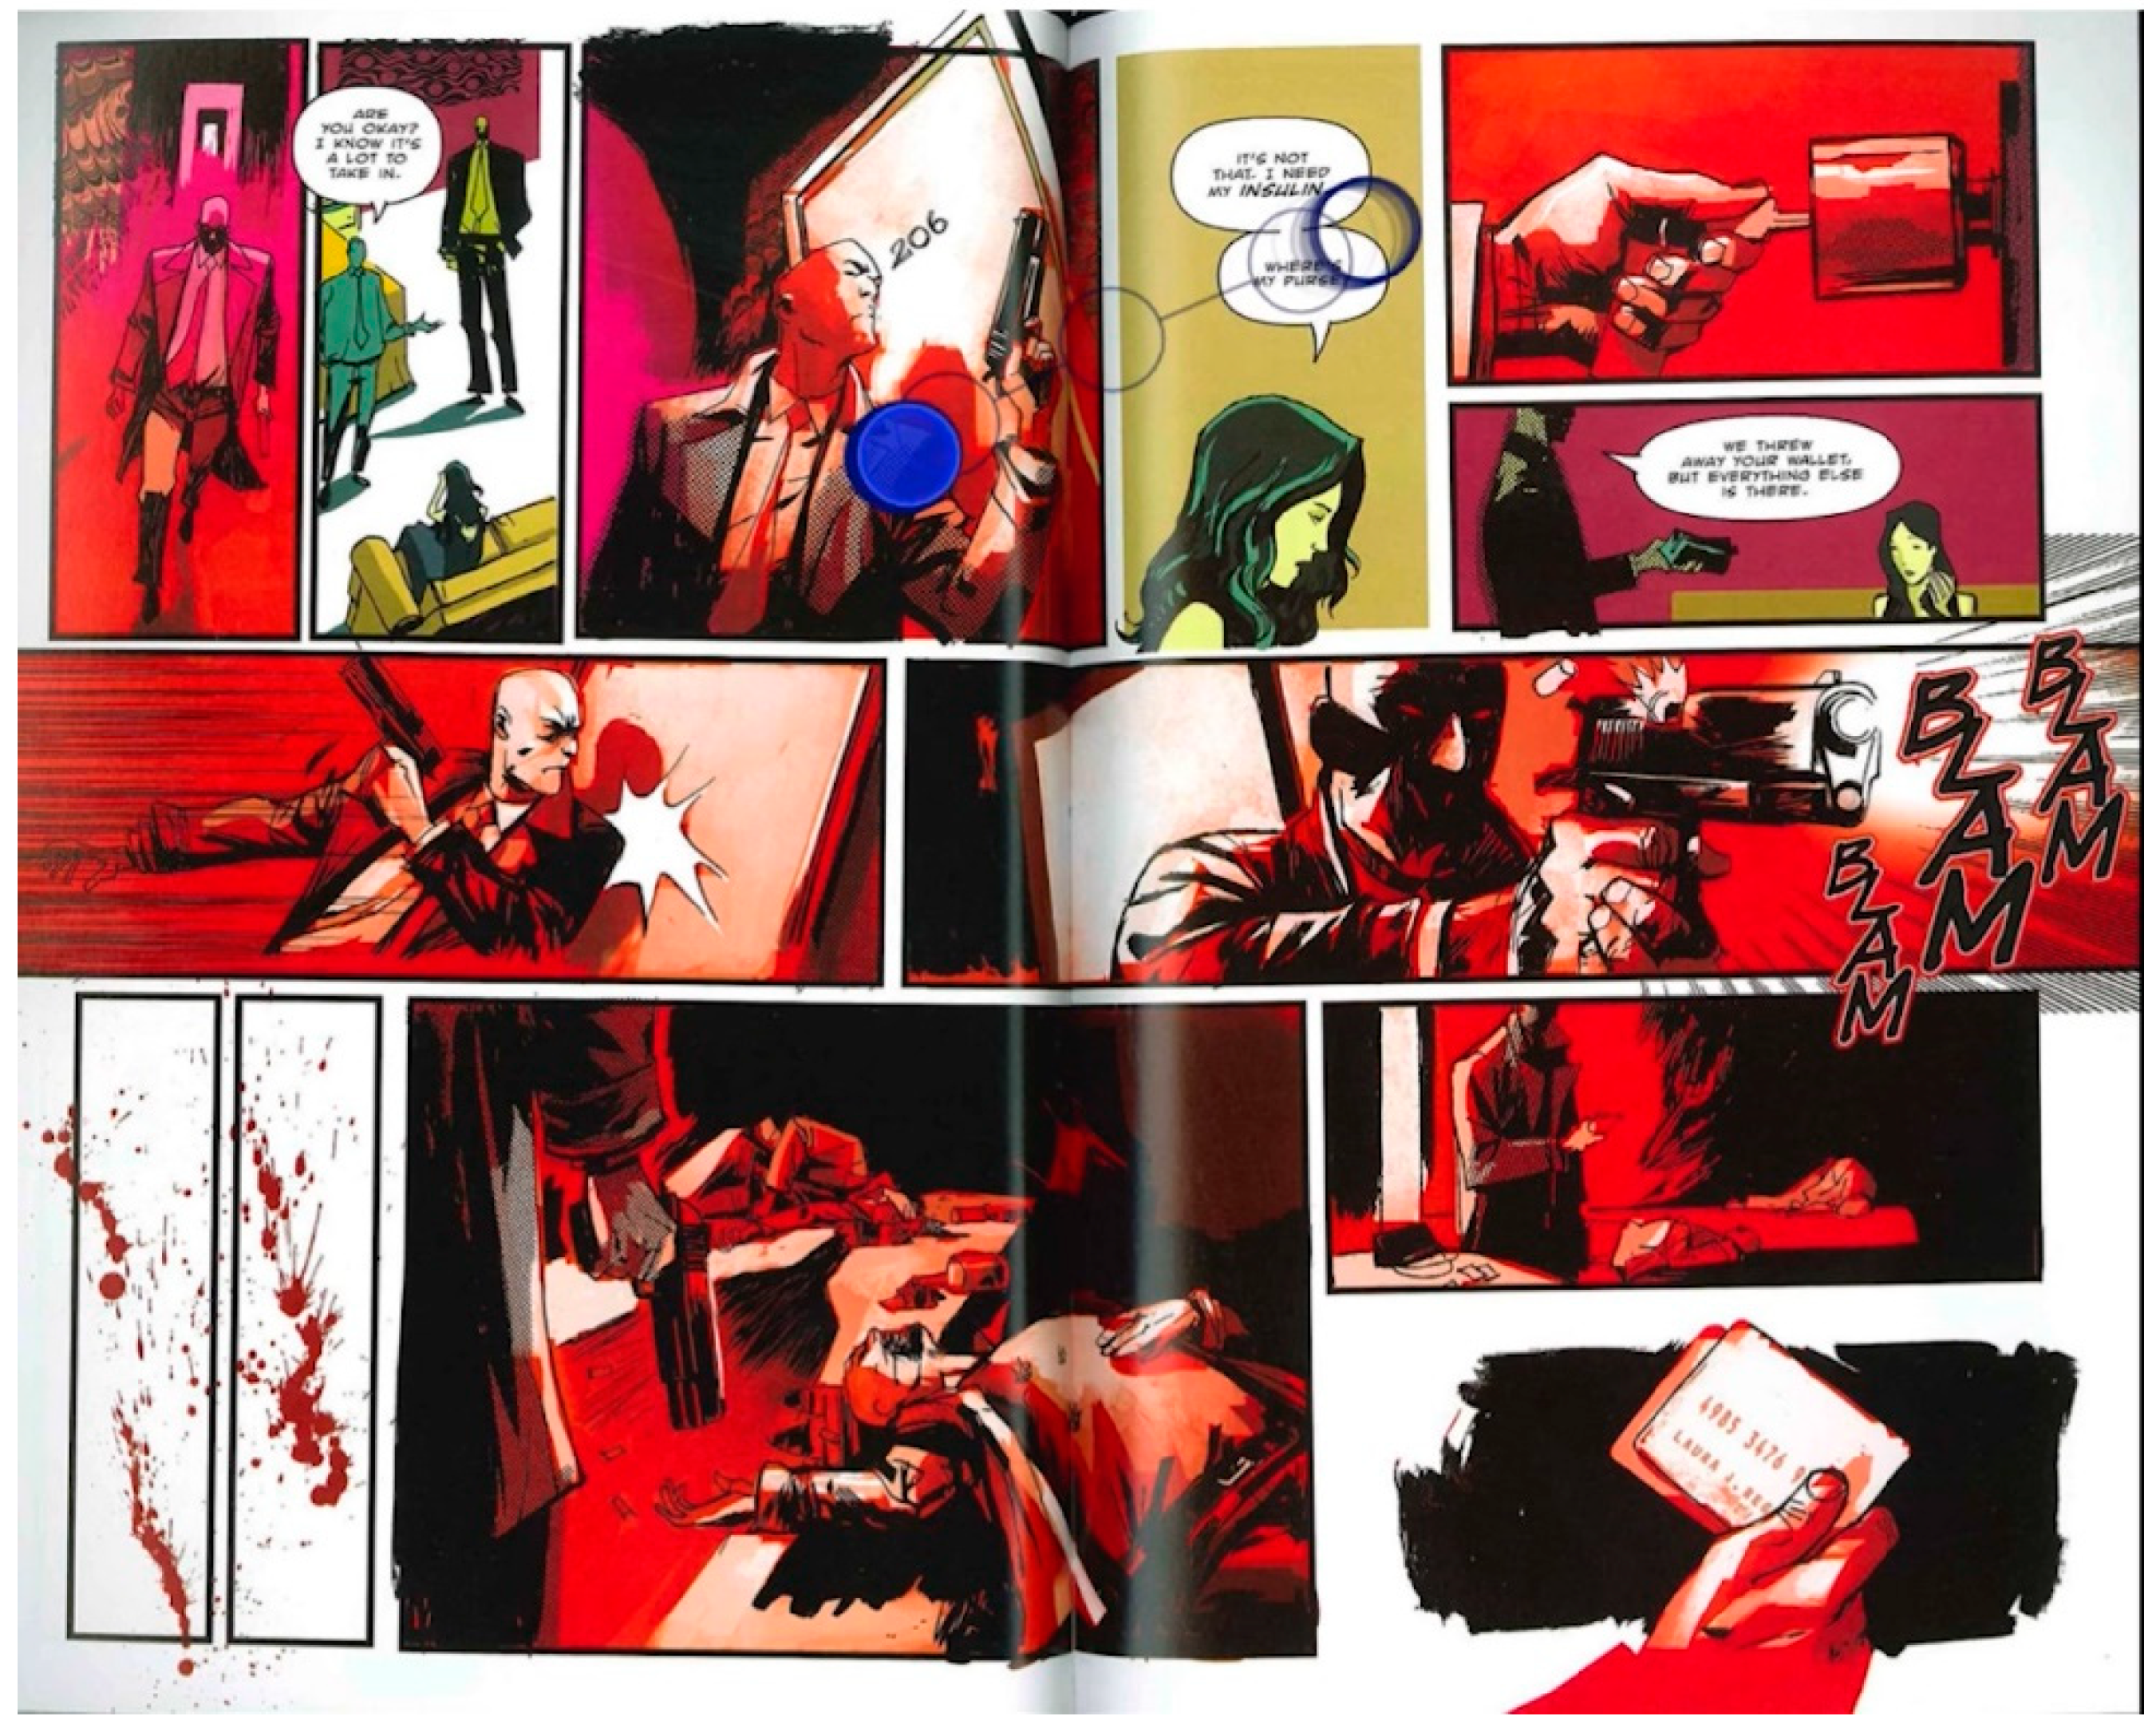
4.5. MEDIA 222/327 Comics and Visual Narrative
5. Procedure
6. Results
7. Discussion
Author Contributions
Funding
Conflicts of Interest
Appendix A
References
- Holsanova, J.; Holmberg, N.; Holmqvist, K. Reading information graphics: The role of spatial contiguity and dual attentional guidance. Appl. Cognit. Psychol. Off. J. Soc. Appl. Res. Mem. Cognit. 2009, 23, 1215–1226. [Google Scholar] [CrossRef]
- Louwerse, M.M.; Graesser, A.C.; McNamara, D.S.; Lu, S. Embodied conversational agents as conversational partners. Appl. Cognit. Psychol. Off. J. Soc. Appl. Res. Mem. Cognit. 2009, 23, 1244–1255. [Google Scholar] [CrossRef]
- Schwonke, R.; Berthold, K.; Renkl, A. How multiple external representations are used and how they can be made more useful. Appl. Cognit. Psychol. Off. J. Soc. Appl. Res. Mem. Cognit. 2009, 23, 1227–1243. [Google Scholar] [CrossRef]
- Van Gog, T.; Jarodzka, H.; Scheiter, K.; Gerjets, P.; Paas, F. Attention guidance during example study via the model’s eye movements. Comput. Hum. Behav. 2009, 25, 785–791. [Google Scholar] [CrossRef]
- Bandura, A. Social Foundations of Thought and Action; Prentice Hall: Upper Saddle River, NJ, USA, 1986. [Google Scholar]
- Schunk, D.H.; Zimmerman, B.J. Social origins of self-regulatory competence. Educ. Psychol. 1997, 32, 195–208. [Google Scholar] [CrossRef] [Green Version]
- Couzijn, M.; Rijlaarsdam, G. Learning to read and write argumentative text by observation of peer learners. In Effective Learning and Teaching of Writing; Springer: Berlin/Heidelberg, Germany, 2005; pp. 241–258. [Google Scholar]
- Schunk, D.H. Peer models: Influence on children’s self-efficacy and achievement. J. Educ. Psychol. 1985, 77, 313. [Google Scholar] [CrossRef]
- Groenendijk, T.; Janssen, T.; Rijlaarsdam, G.; Bergh, H. The effect of observational learning on students’ performance, processes, and motivation in two creative domains. Br. J. Educ. Psychol. 2013, 83, 3–28. [Google Scholar] [CrossRef]
- Seppänen, M.; Gegenfurtner, A. Seeing through a teacher’s eyes improves students’ imaging interpretation. Med. Educ. 2012, 46, 1113–1114. [Google Scholar] [CrossRef]
- Jarodzka, H.; Balslev, T.; Holmqvist, K.; Nyström, M.; Scheiter, K.; Gerjets, P.; Eika, B. Conveying clinical reasoning based on visual observation via eye-movement modelling examples. Instruct. Sci. 2012, 40, 813–827. [Google Scholar] [CrossRef] [Green Version]
- Jarodzka, H.; Gog, T.; Dorr, M.; Scheiter, K.; Gerjets, P. Learning to see: Guiding students’ attention via a Model’s eye movements fosters learning. Learn. Instruct. 2013, 25, 62–70. [Google Scholar] [CrossRef]
- Mayer, R.E. Multimedia learning. In Psychology of Learning and Motivation; Elsevier: Amsterdam, The Netherlands, 2002; Volume 41, pp. 85–139. [Google Scholar]
- Mayer, R.E. Introduction to Multimedia Learning. In The Cambridge Handbook of Multimedia Learning; Cambridge University Press: Cambridge, UK, 2005; pp. 1–16. [Google Scholar]
- Mayer, R.E. A cognitive theory of multimedia learning: Implications for design principles. J. Educ. Psychol. 1998, 91, 358–368. [Google Scholar]
- Scheiter, K.A. Signals foster multimedia learning by supporting integration of highlighted text and diagram elements. Learn. Instruct. 2015, 36, 11–26. [Google Scholar] [CrossRef]
- Seufert, T. Supporting coherence formation in learning from multiple representations. Learn. Instruct. 2003, 13, 227–237. [Google Scholar] [CrossRef] [Green Version]
- Seufert, T.A. Cognitive load and the format of instructional aids for coherence formation. Appl. Cognit. Psychol. Off. J. Soc. Appl. Res. Mem. Cognit. 2006, 20, 321–331. [Google Scholar] [CrossRef]
- Hegarty, M.A.-A. Constructing mental models of machines from text and diagrams. J. Mem. Lang. 1993, 32, 717–742. [Google Scholar] [CrossRef]
- Mason, L.; Pluchino, P.; Tornatora, M.C. Using eye-tracking technology as an indirect instruction tool to improve text and picture processing and learning. Br. J. Educ. Psychol. 2016, 47, 1083–1095. [Google Scholar] [CrossRef]
- Theeuwes, J. Top-down and bottom-up control of visual selection. Acta Psychol. 2010, 135, 77–99. [Google Scholar] [CrossRef] [PubMed]
- Franconeri, S.L.; Simons, D.J. Moving and looming stimuli capture attention. Percept. Psychophys. 2003, 65, 999–1010. [Google Scholar] [CrossRef] [Green Version]
- Yantis, S.; Jonides, J. Abrupt visual onsets and selective attention: Evidence from visual search. J. Exp. Psychol. Hum. Percept. Perform. 1984, 10, 601. [Google Scholar] [CrossRef]
- Underwood, G.; Chapman, P.; Brocklehurst, N.; Underwood, J.; Crundall, D. Visual attention while driving: Sequences of eye fixations made by experienced and novice drivers. Ergon. 2003, 46, 629–646. [Google Scholar] [CrossRef]
- Jarodzka, H.; Scheiter, K.; Gerjets, P.; Van Gog, T. In the eyes of the beholder: How experts and novices interpret dynamic stimuli. Learn. Instruct. 2010, 20, 146–154. [Google Scholar] [CrossRef] [Green Version]
- Grant, E.R.; Spivey, M.J. Eye movements and problem solving: Guiding attention guides thought. Psychol. Sci. 2003, 14, 462–466. [Google Scholar] [CrossRef] [PubMed]
- Canham, M.A. Effects of knowledge and display design on comprehension of complex graphics. Learn. Instruct. 2010, 22, 155–166. [Google Scholar] [CrossRef]
- Velichkovsky, B.M. Communicating attention: Gaze position transfer in cooperative problem solving. Pragmat. Cognit. 1995, 3, 199–223. [Google Scholar] [CrossRef]
- Bond, R.A. Assessing computerised eye tracking technology for gaining insight into expert interpretation of the 12-lead electrocardiogram: An objective quantitative approach. J. Electrocardiol. 2014, 47, 895–906. [Google Scholar] [CrossRef]
- McLaughlin, L.A. Computing eye gaze metrics for the automatic assessment of radiographer performance during X-ray image interpretation. Int. J. Med. Inform. 2017, 05, 11–21. [Google Scholar] [CrossRef]
- Mason, L.; Pluchino, P.; Tornatora, M.C. Eye-movement modeling of integrative reading of an illustrated text: Effects on processing and learning. Contemp. Educ. Psychol. 2015, 41, 172–187. [Google Scholar] [CrossRef]
- Scheiter, K.A. Self-regulated learning from illustrated text: Eye movement modelling to support use and regulation of cognitive processes during learning from multimedia. Br. J. Educ. Psychol. 2018, 88, 80–94. [Google Scholar] [CrossRef]
- Chabris, C.A. The Invisible Gorilla: And Other Ways Our Intuitions Deceive Us; Harmony: New York, NY, USA, 2010. [Google Scholar]
- Elkins, J. The Domain of Images; Cornell University Press: Ithaca, NY, USA, 2001. [Google Scholar]
- Zangemeister, W.A. Evidence for a global scanpath strategy in viewing abstract compared with realistic images. Neuropsychol. 1995, 33, 1009–1025. [Google Scholar] [CrossRef]
- Nodine, C.A. How do viewers look at artworks? Bull. Psychol. Arts 2003, 4, 65–68. [Google Scholar]
- Cela-Conde, C.J. The neural foundations of aesthetic appreciation. Prog. Neurobiol. 2011, 94, 39–48. [Google Scholar] [CrossRef] [PubMed]
- Arnheim, R. Entropy and Art: An Essay on Disorder and Order; Univ of California Press: Berkeley, CA, USA, 1974. [Google Scholar]
- Yarbus, A.L. Eye Movements and Vision; Springer: Berlin/Heidelberg, Germany, 2013. [Google Scholar]


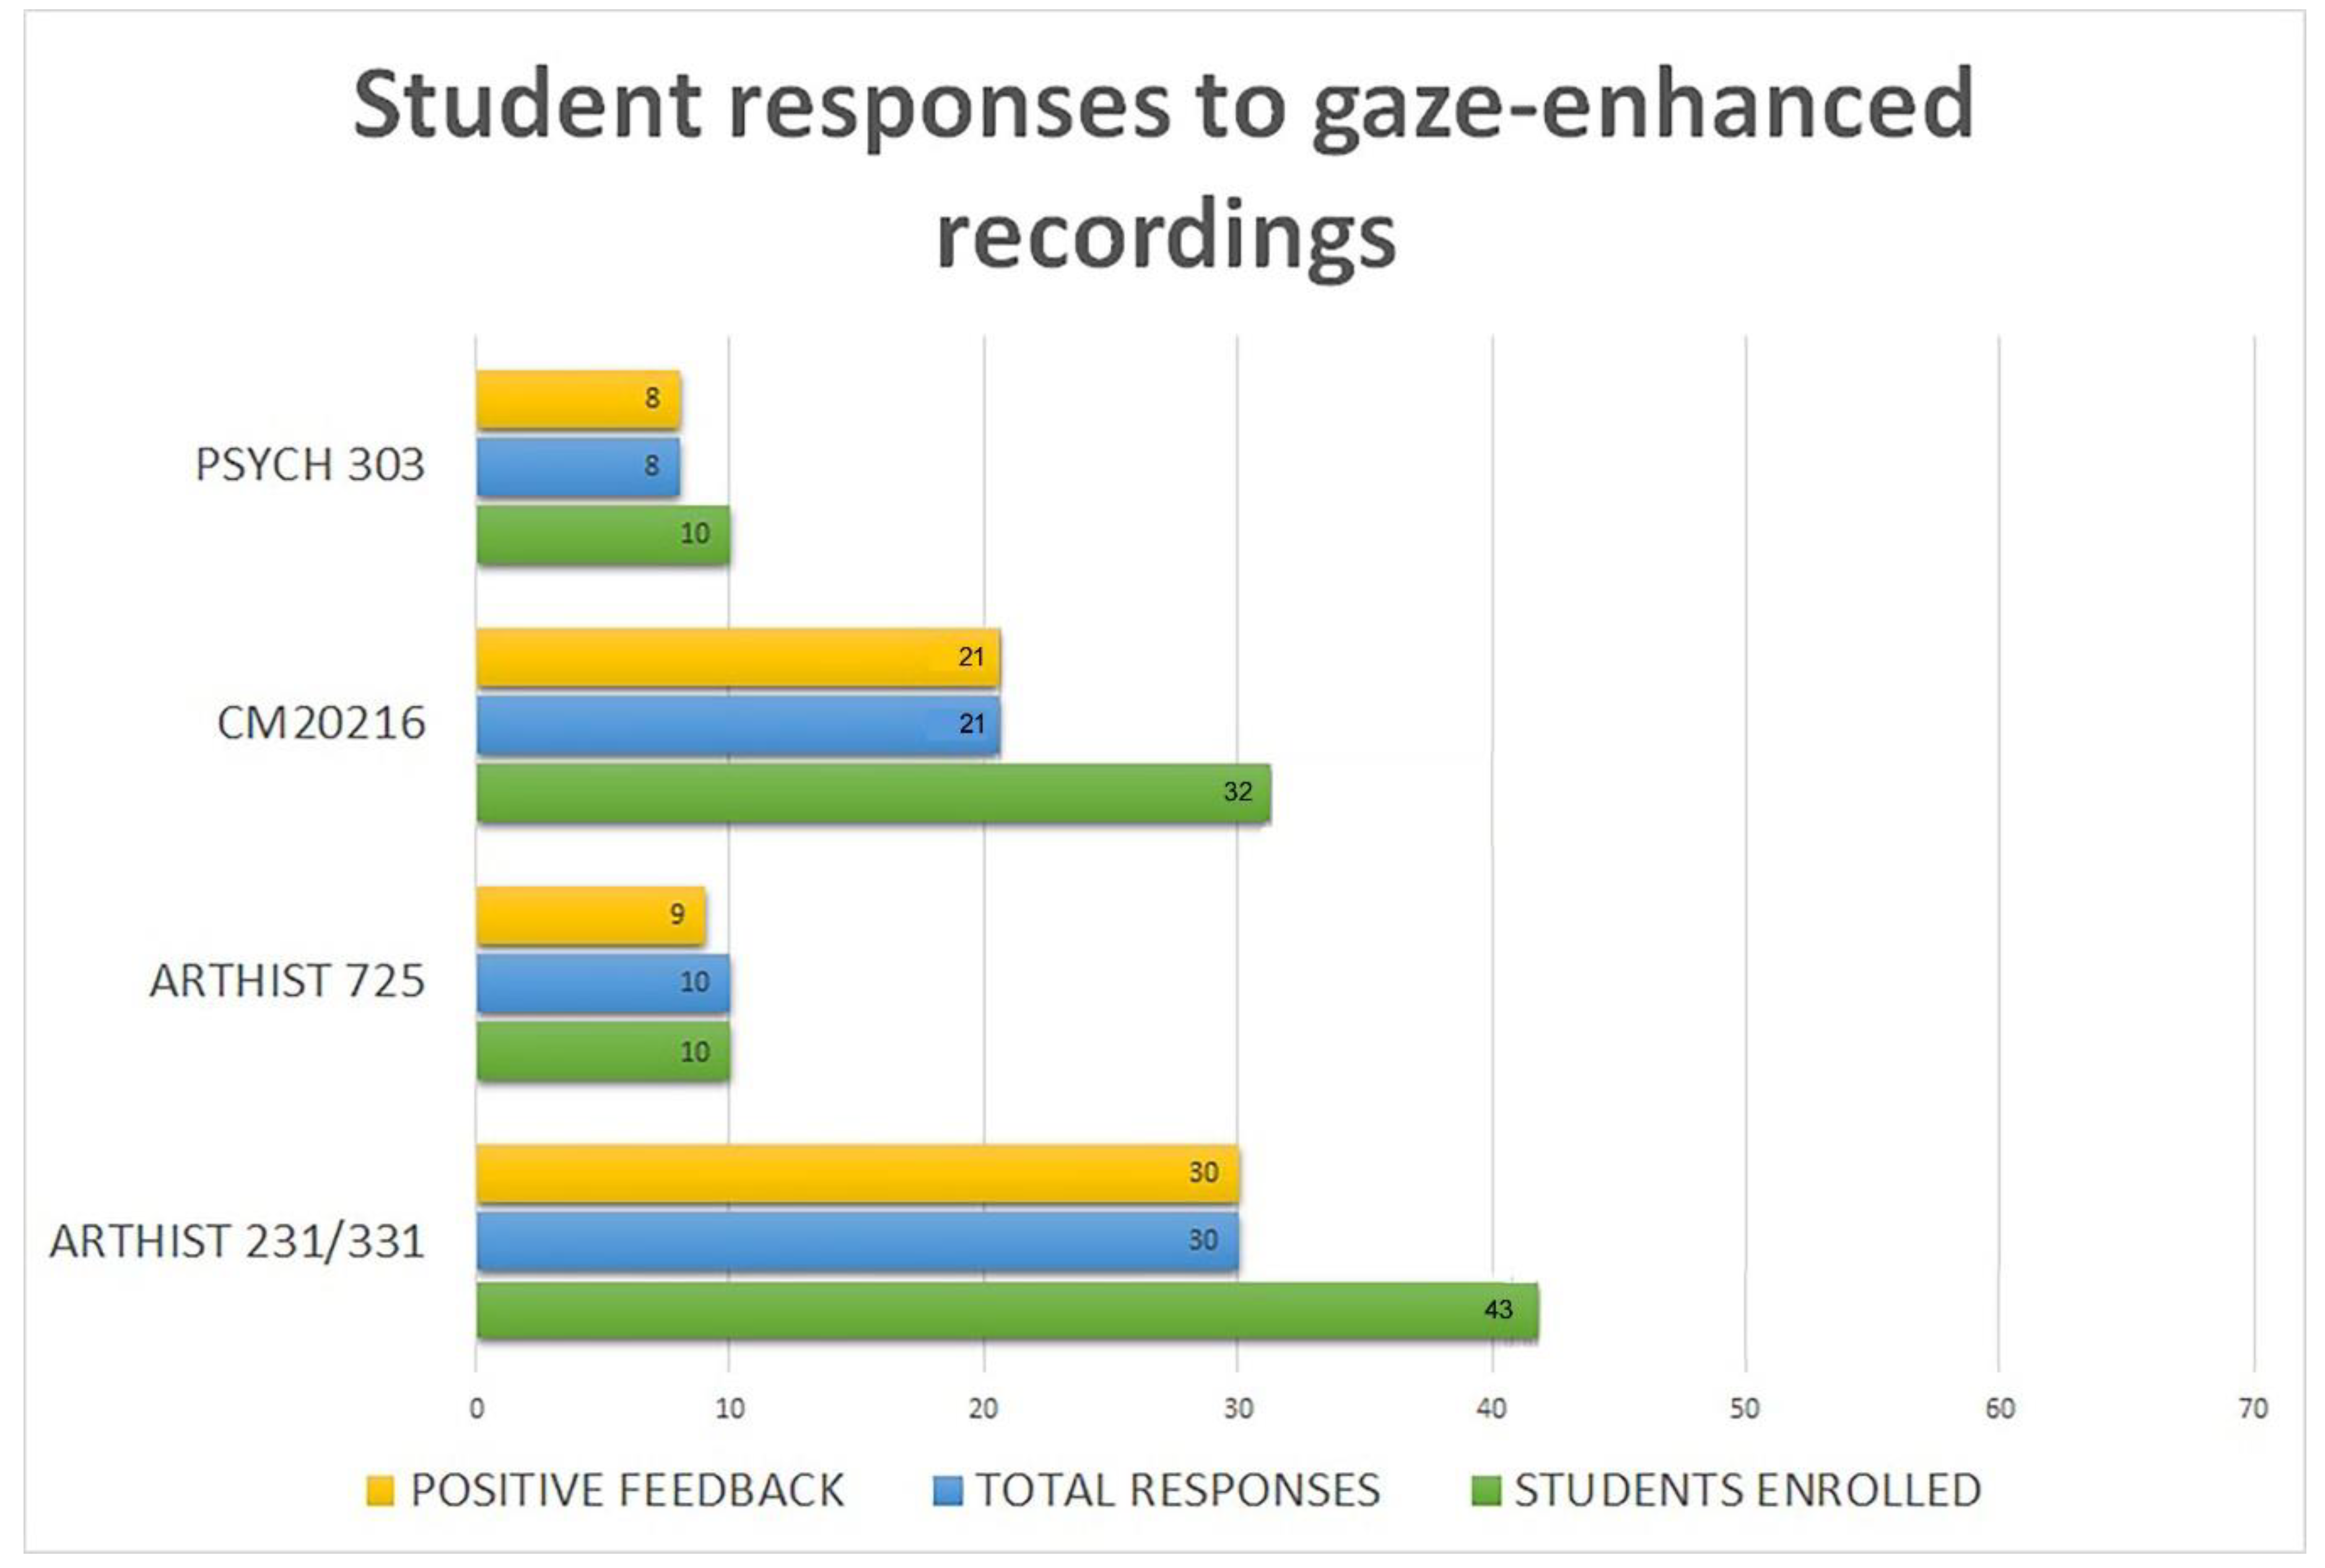
| Participant | Total Time (mins/s) | Eye Gaze Patterns | Score |
|---|---|---|---|
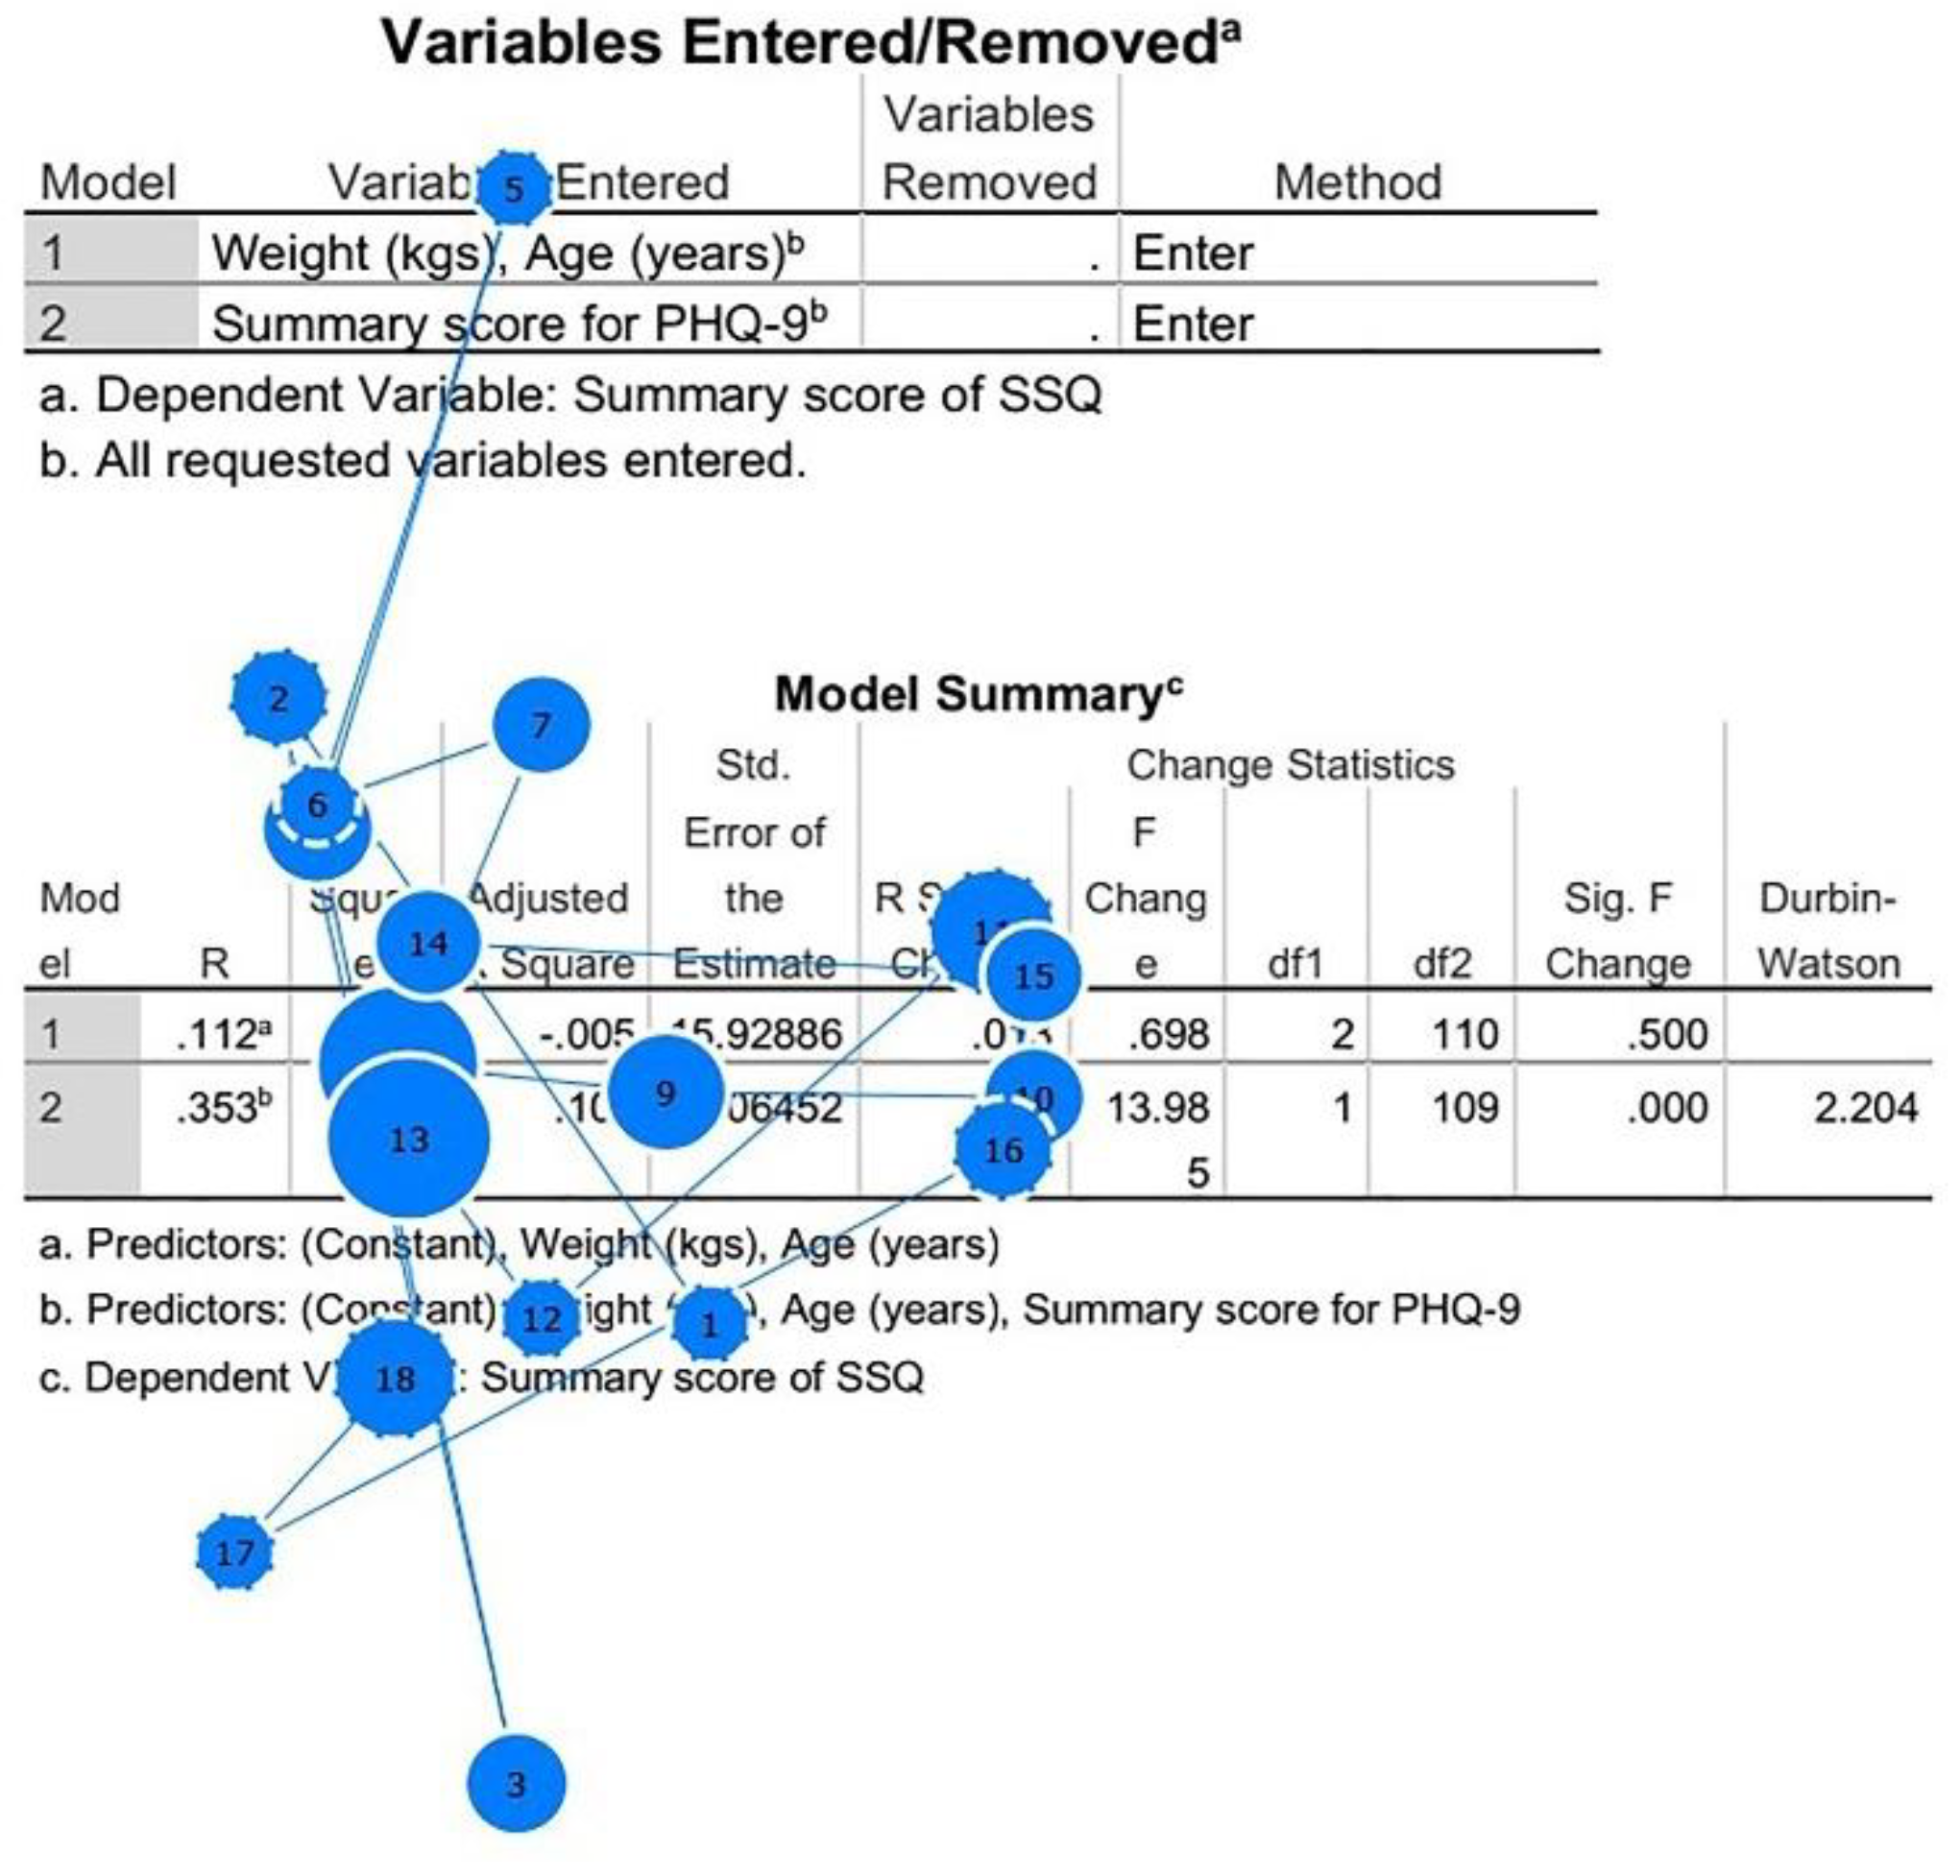
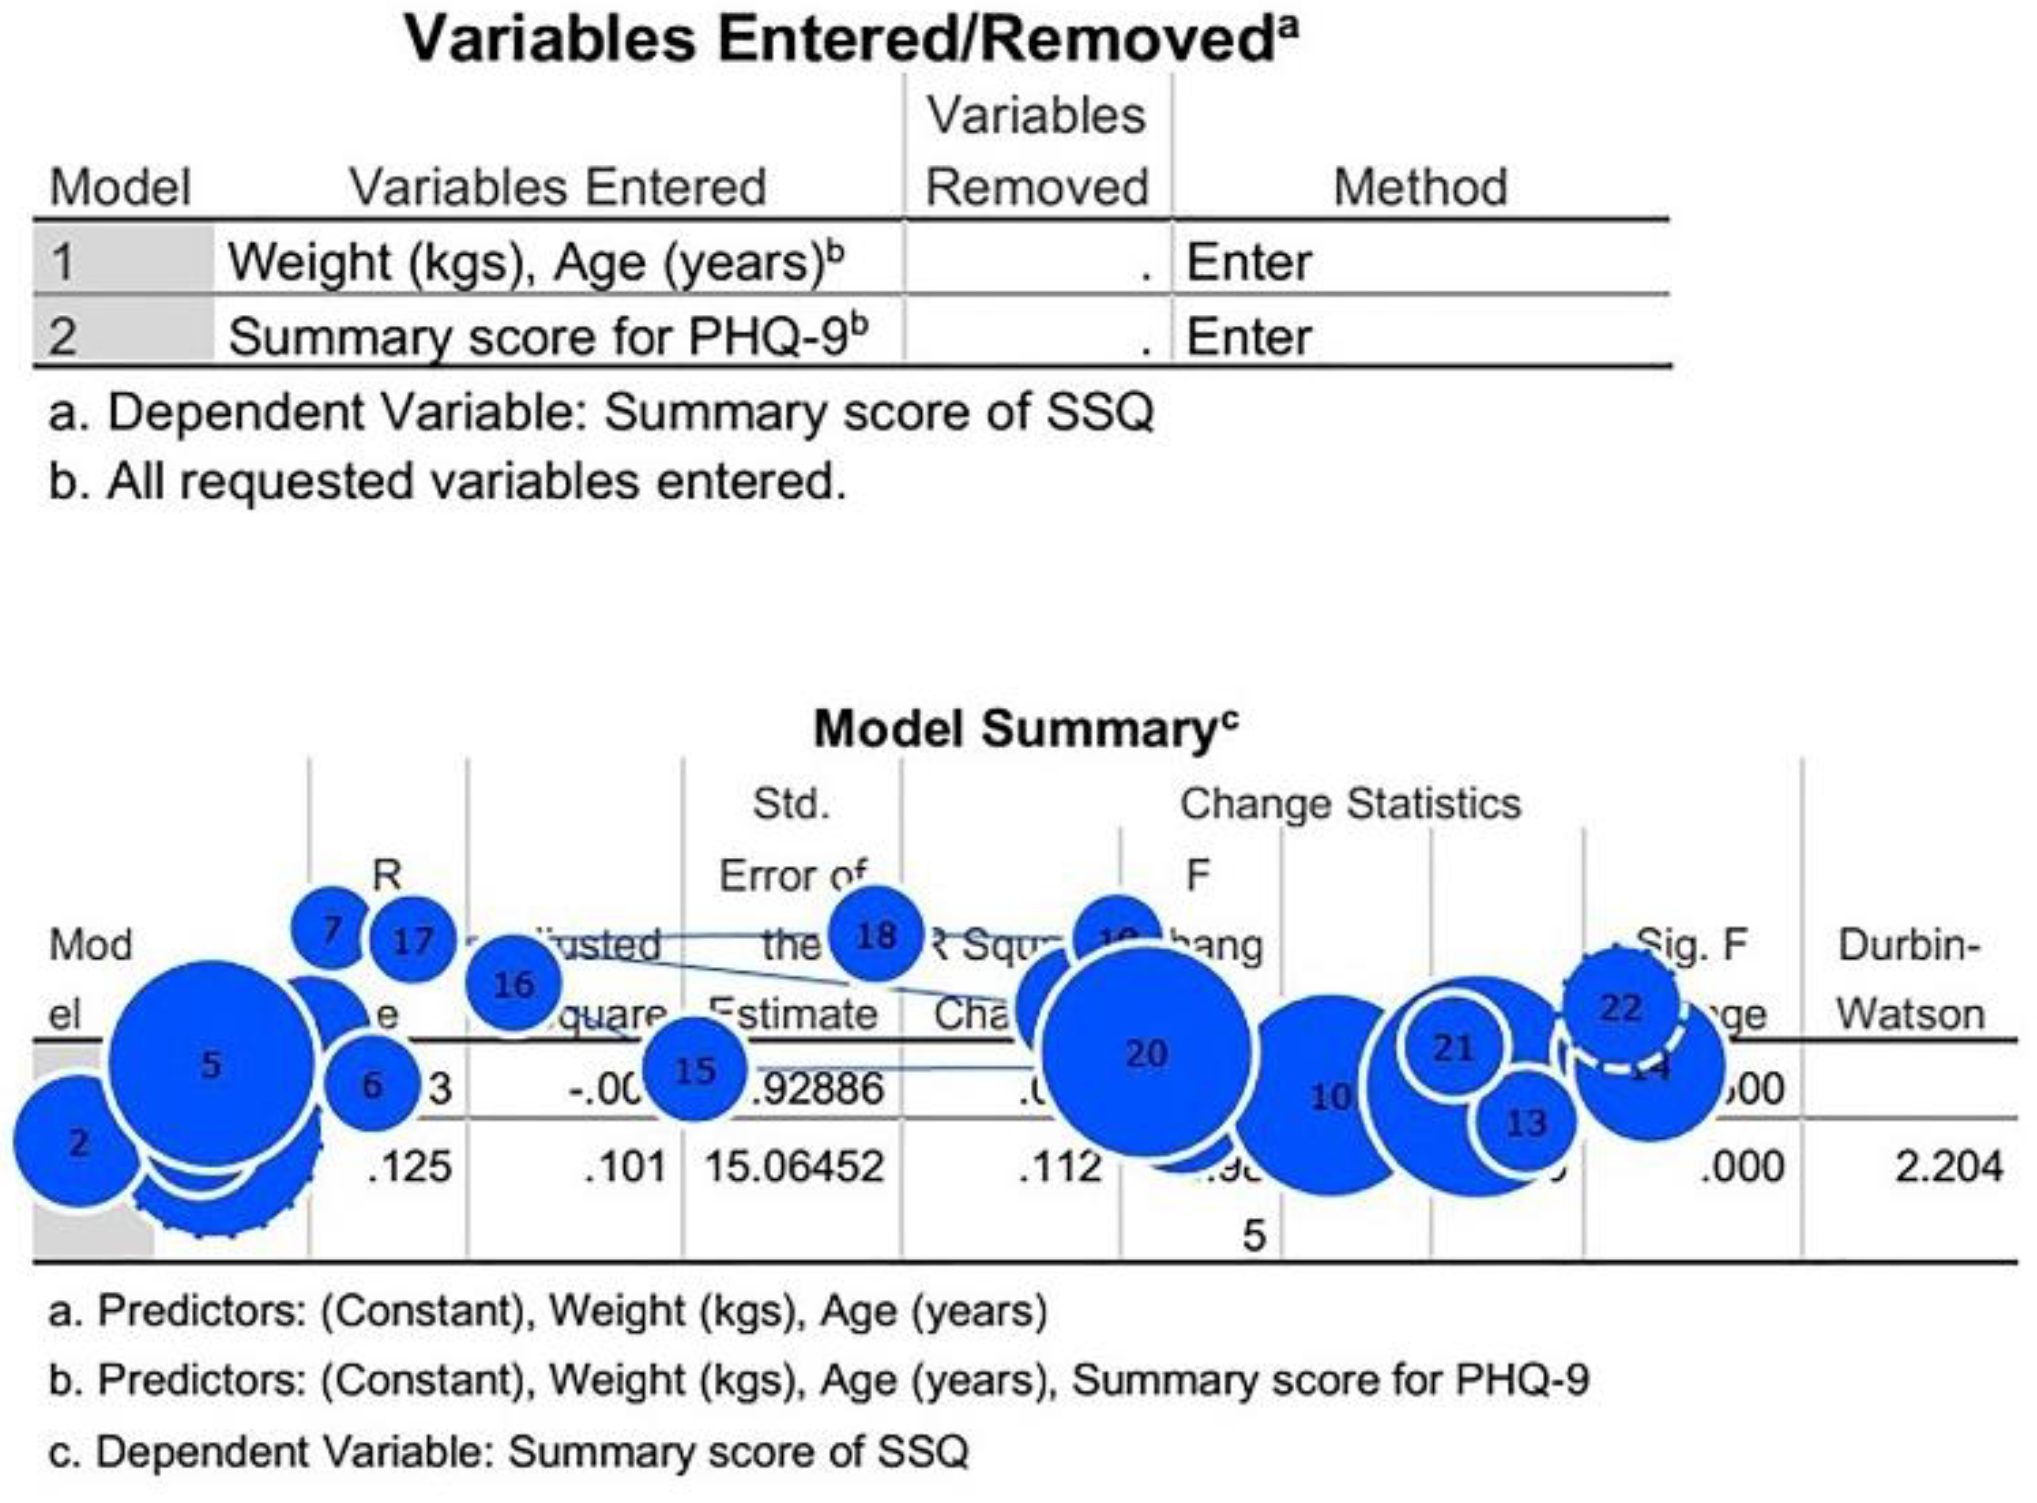
| student 1 | 6.54 | 60 s reading question; 20 s skimming images; 1 min on descriptive stats, ANOVA table and model summary/writing; 30 s question and writing; 30 s descriptive table and writing; 1 min on model summary, ANOVA and writing; 10 s coefficients table; 90 s model summary and writing. | 3/10 |
| student 2 | 4.56 | 30 s reading question; 50 s skimming images; 20 s model summary, residuals, colinearity; 25 s model summary; 15 s question and writing; 40 s coefficients table and writing; 20 s ANOVA table/writing; 30 s coefficients table/writing. | 5.5/10 |
| student 3 | 8.28 | 40 s reading question; 70 s skimming images; 20 s question; 10 s descriptive table; 80 s model summary; 20 s question; 80 s writing/model summary; 30 s ANOVA and coefficients; 15 s other results; 15 s coefficients; 20 s variables entered; 20 s question; 30 skimming. | 4/10 |
| course co-ordinator | 9.07 | 30 s reading question; 50 s skimming images; 1 min question and writing; 3 min model summary and writing; 50 s ANOVA table and writing; 70 s coefficients table/writing; 10 s skimming the remaining tables; 1 min ANOVA table and writing; 5 s question | N/A |
| Sample Quotes from Student Questionnaires |
|---|
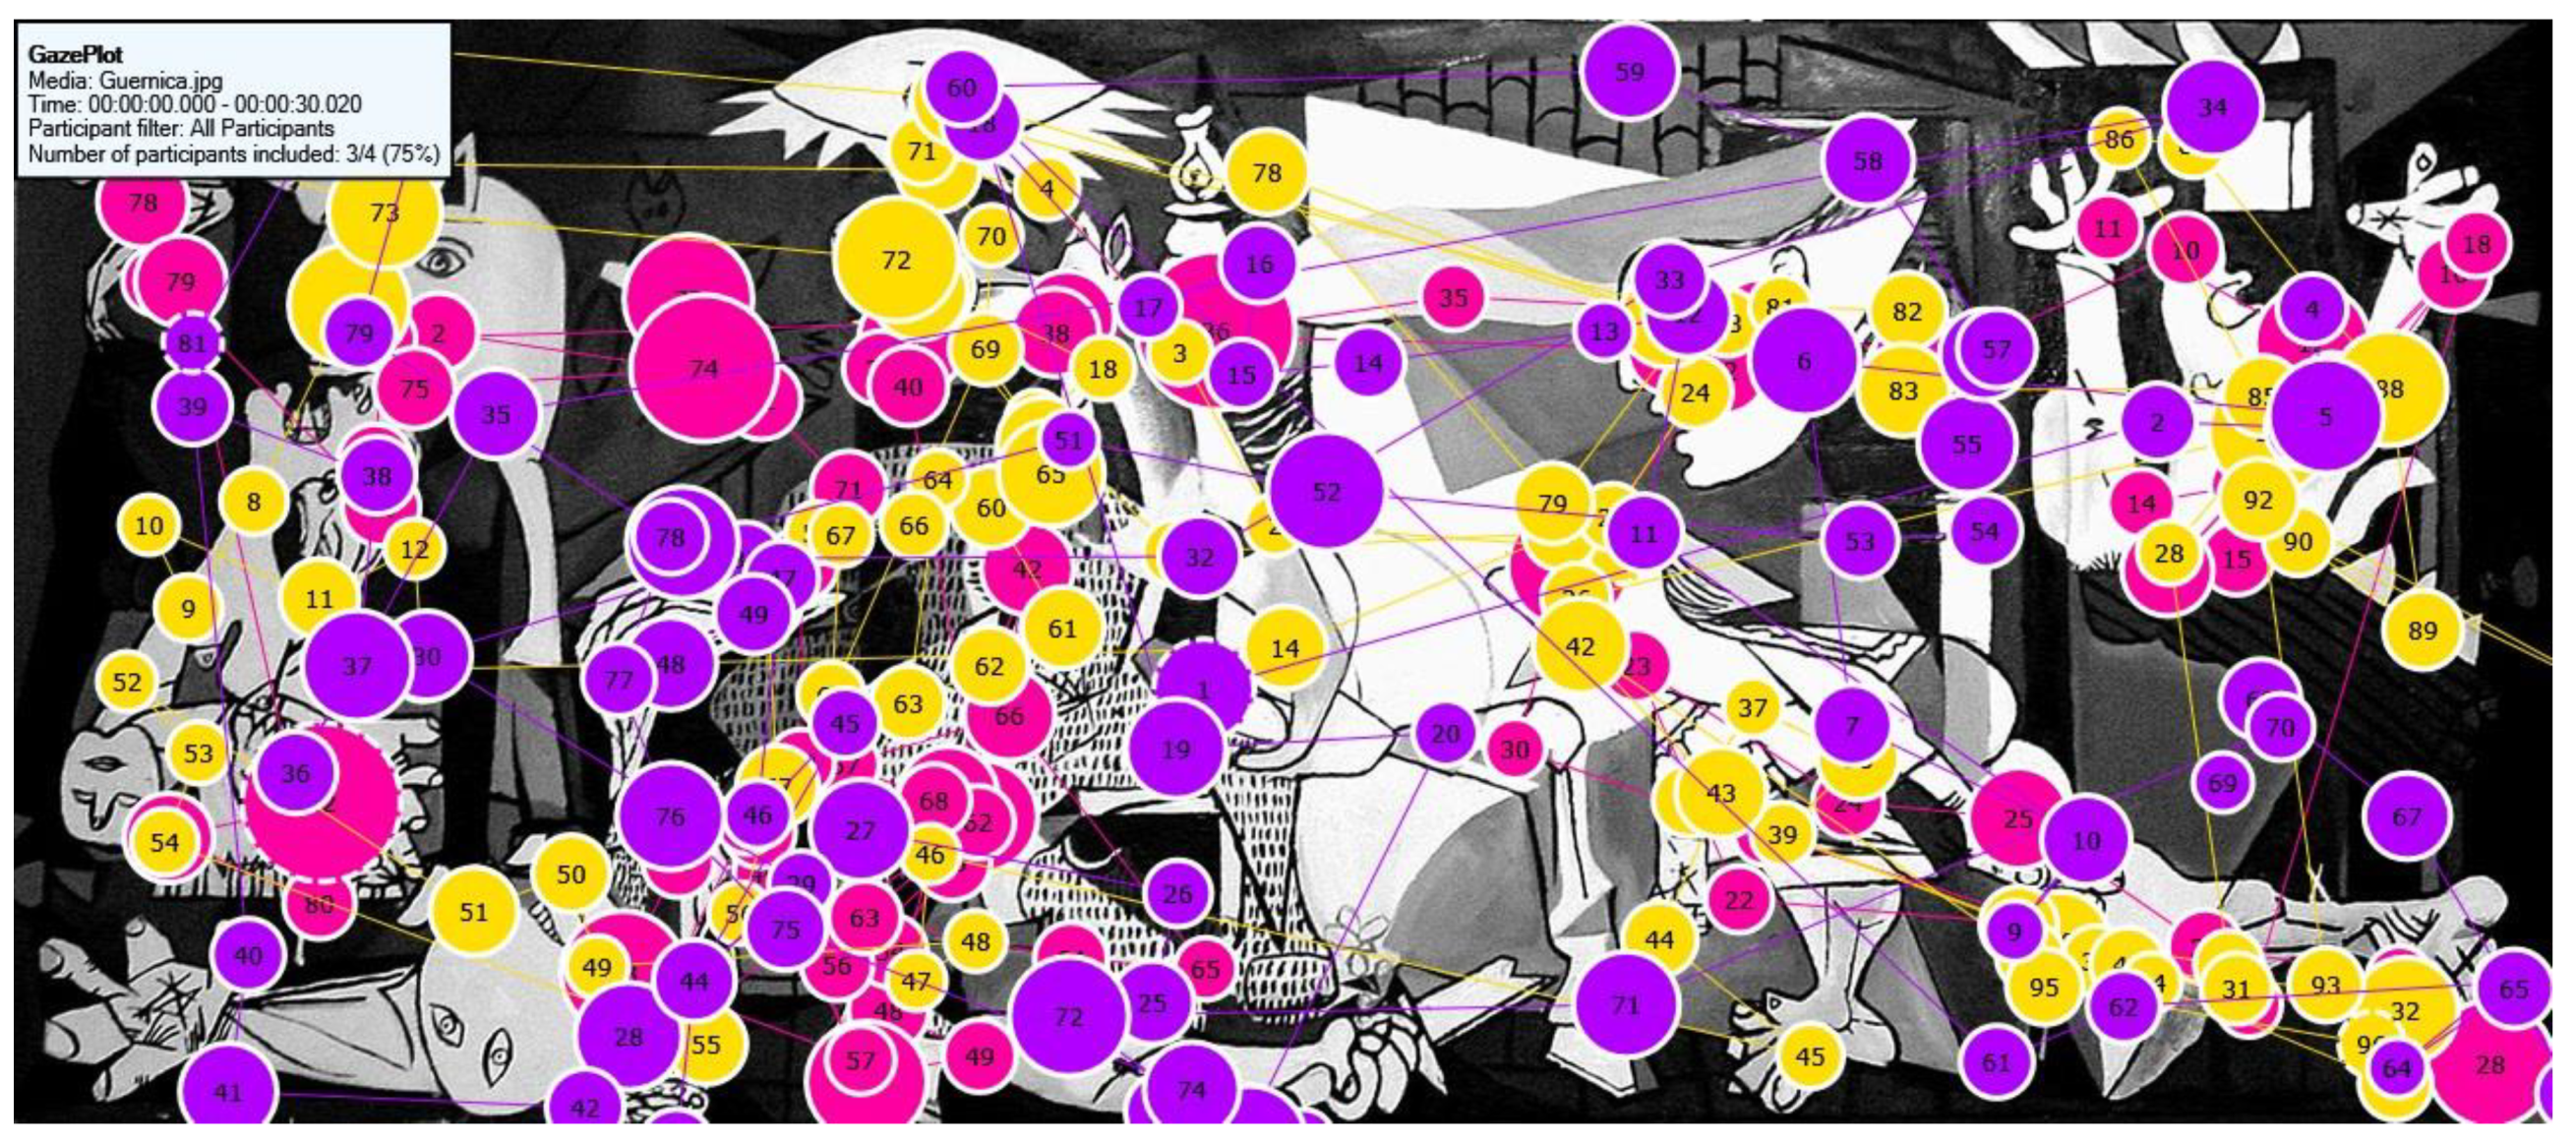
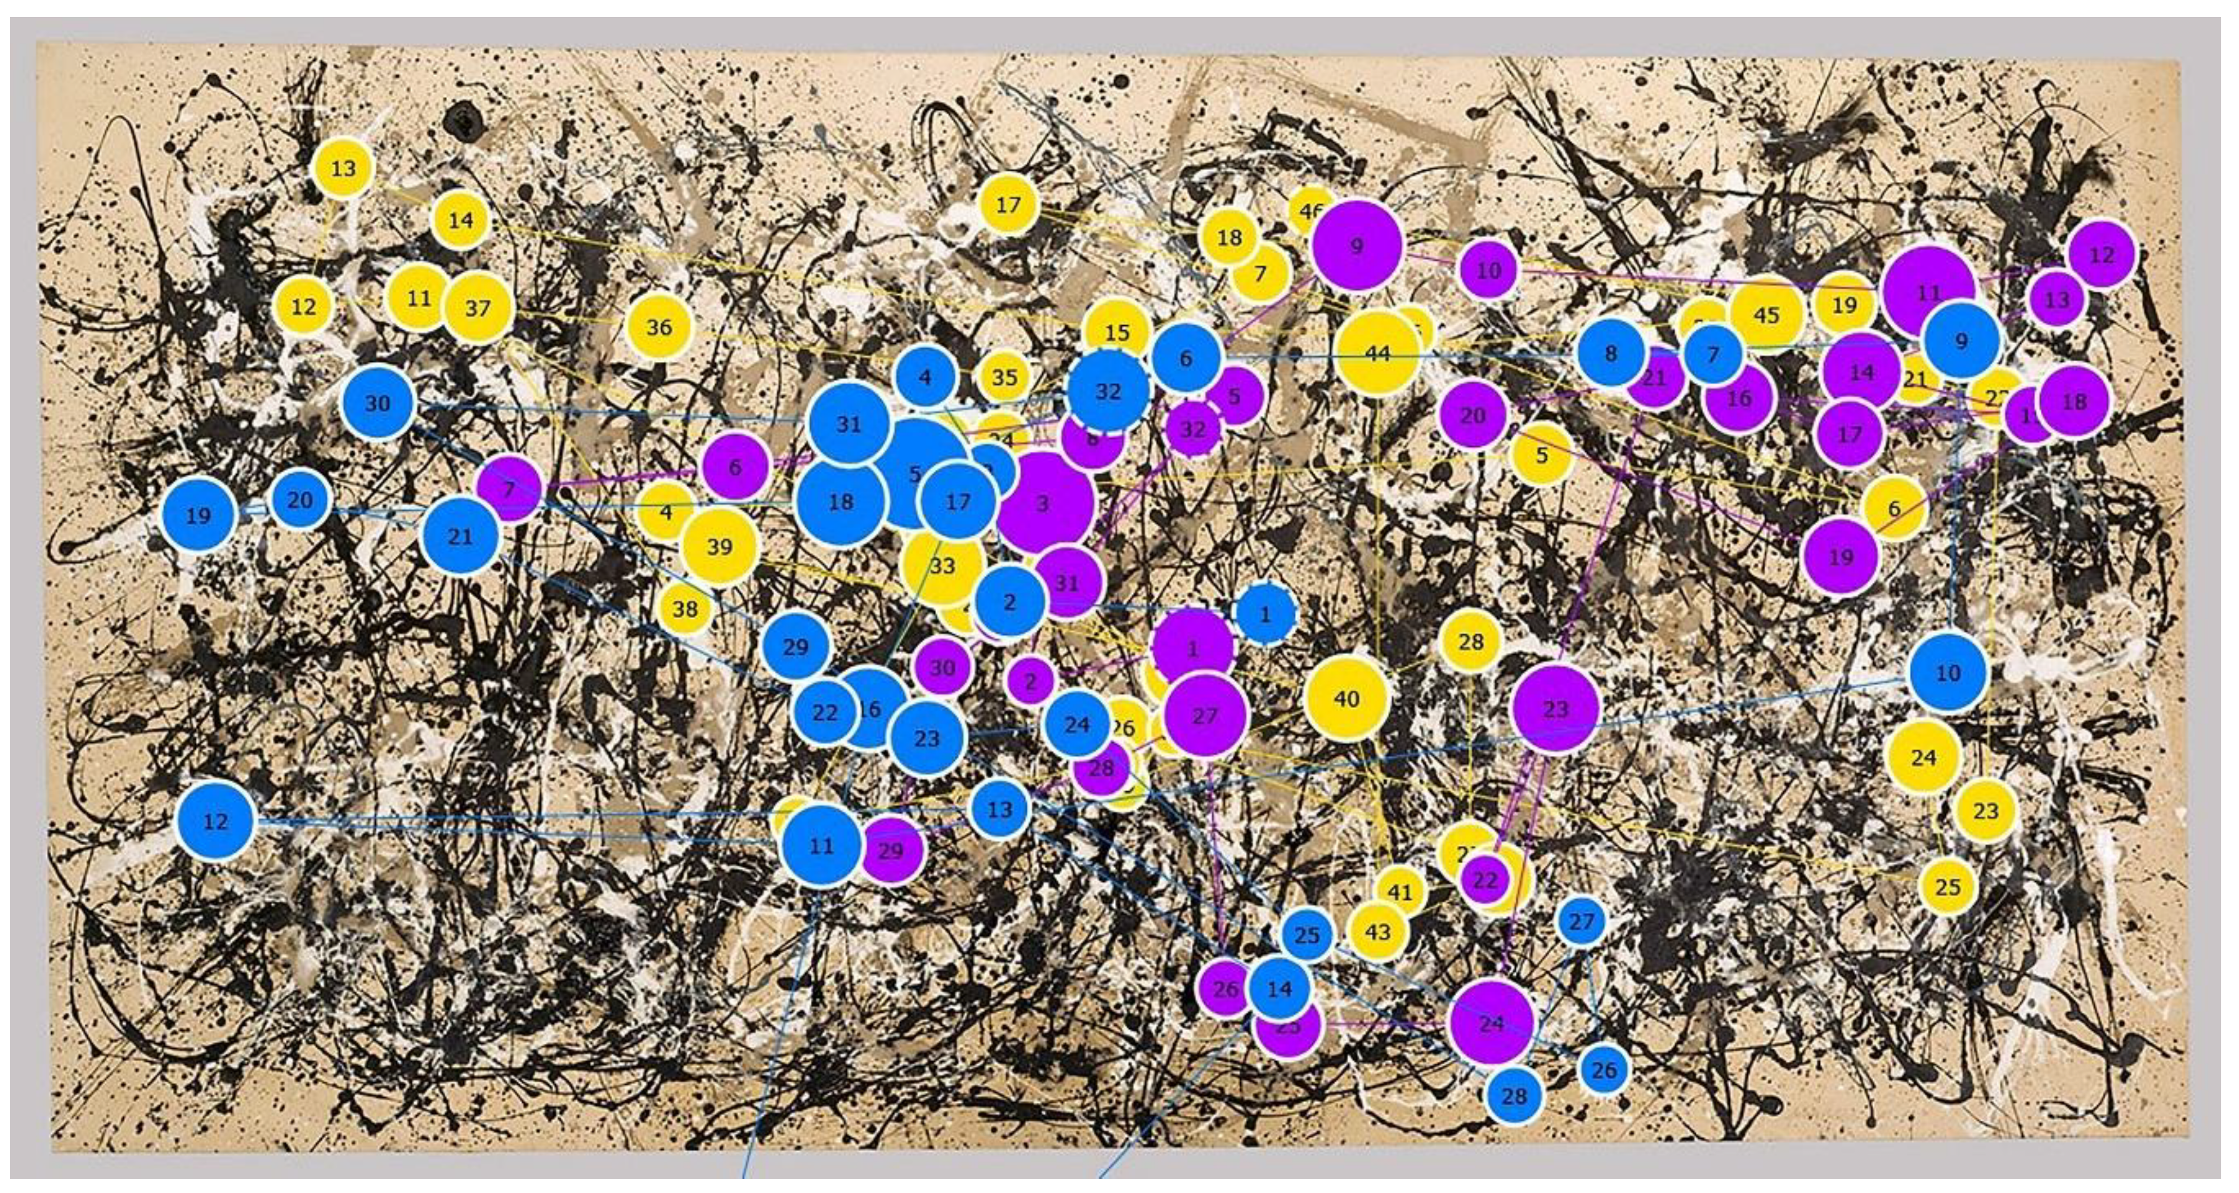
| “Really cool to learn about how just because you’re fixated on something, doesn’t mean you’re actually processing it.” |
| “It helps to visually see what the lecturer was trying to explain. Sometimes seeing it’s easier to understand and therefore easier to write/talk about” |
| Why Interesting? | What Learned? | How Does This Technology Help to Learn? |
|---|---|---|
| “I never thought of acknowledging how eyes move around an image, so I found it fascinating to see it for the first time” | “Salience of main feathers, edges, blocks of colour, following line” | “Definitely helped to give a new perspective on how we view art… I’ve become more conscious of how my eye moves around an image” |
| “encourages us to look deeper and further” | “Students attracted to obvious, experienced viewers wider engagements” | “expands horizons and encourages new methods of analysis and approaches…” |
| “provides a new perspective on composition, how art is seen, how artists might have intended art to be seen” | “I learned which areas attract the eye and how artists induce movement” | “shows how other people view work, helps to step outside of your own perception” |
| “Makes me more aware of my own eye movements, interesting to see from an artist’s point of view, the effects of composition” | “Very interesting to see differences between novices and experts… and even the areas in a picture commonly ignored” | “Helps to reflect on how to read an artwork” |
| “Invokes thinking about the effect of prior knowledge on the way art is viewed…how different aspects that one pays attention to change the sensory experience” | ||
| “Increased awareness of viewing process” | ||
| “I think the technology was most interesting in cases of abstract or cubist art—helping to understand the way the viewer is attracted to nonrepresentational art, and how they navigate that experience” |
| Why Interesting? | What Learned? | How Does this Technology Help to Learn? |
|---|---|---|
| “Interesting to see how perception works on a physically recordable level” | “Cognitive processes, movements, what happens when a person is concentrating/not concentrating on, how brain works while looking at images” | “Helps students to consider the intricacy of reception and how artworks affect us physically as well as cognitively” |
| “To identify the rhythm people find in artworks that guides them” | “Makes us aware of flaws in our viewing and what we are ignoring” |
| Why Interesting? | What Learned? | How Does This Technology Help to Learn? |
|---|---|---|
| “Visual examples more helpful than text” | “Valued real world situation” | “Visually explained theory” |
| “Made me consider design choices I have made” | “shows what people look at and what confuses them” (in website design) | “Makes more interesting” |
| “Overload of information causes confusion, colour coding, labelling stuff” | Can adapt lectures more to suit students better” | |
| “People don’t always look at the most obvious places” | “Can incorporate it into potential lab settings” | |
| “Easy to identify poor design choices” |
© 2020 by the authors. Licensee MDPI, Basel, Switzerland. This article is an open access article distributed under the terms and conditions of the Creative Commons Attribution (CC BY) license (http://creativecommons.org/licenses/by/4.0/).
Share and Cite
Sindhwani, S.; Minissale, G.; Weber, G.; Lutteroth, C.; Lambert, A.; Curtis, N.; Broadbent, E. A Multidisciplinary Study of Eye Tracking Technology for Visual Intelligence. Educ. Sci. 2020, 10, 195. https://0-doi-org.brum.beds.ac.uk/10.3390/educsci10080195
Sindhwani S, Minissale G, Weber G, Lutteroth C, Lambert A, Curtis N, Broadbent E. A Multidisciplinary Study of Eye Tracking Technology for Visual Intelligence. Education Sciences. 2020; 10(8):195. https://0-doi-org.brum.beds.ac.uk/10.3390/educsci10080195
Chicago/Turabian StyleSindhwani, Shyamli, Gregory Minissale, Gerald Weber, Christof Lutteroth, Anthony Lambert, Neal Curtis, and Elizabeth Broadbent. 2020. "A Multidisciplinary Study of Eye Tracking Technology for Visual Intelligence" Education Sciences 10, no. 8: 195. https://0-doi-org.brum.beds.ac.uk/10.3390/educsci10080195