The Moderating Effect of Gender Equality and Other Factors on PISA and Education Policy


Norwegian Centre for Learning Environment and Behavioral Research in Education, University of Stavanger, 4021 Stavanger, Norway
Educ. Sci. 2021, 11(1), 10; https://0-doi-org.brum.beds.ac.uk/10.3390/educsci11010010
Submission received: 7 December 2020
/
Revised: 28 December 2020
/
Accepted: 30 December 2020
/
Published: 1 January 2021
Abstract
:Globalisation and policy transfer in education make it incumbent upon decision makers to prioritise among competing policy options, select policy initiatives that are appropriate for their national contexts, and understand how system-specific factors moderate the relationship between those policies and student outcomes. This study used qualitative comparative analysis and correlational analyses to explore these relationships with publicly available data on socio-economic, cultural, and education conditions, and their association with PISA 2015 results in 49 countries. Findings show that gender and income equality, human development, and individualism were outcome-enabling conditions for PISA 2015 results, and gender equality was the most consistent of these conditions. These factors significantly moderated the relationships between education policy and PISA results. Implications for the identification of meaningful peer countries for comparative educational research, policy transfer, and the future expansion of PISA are discussed.
1. Introduction
Education policies, and the systems in which they exist, are unique to their historical, social, economic, and cultural contexts [1]. However, policymaking in education has become increasingly influenced by international ideas [2], and the ideologies of those organisations that gather data on, and promote, those ideas [3,4]. The concept of education as a basic human right, global public good, and source of national economic competitiveness is now almost universally accepted, and international models for improving education quality have become popular among policymakers, researchers, and practitioners alike [5,6,7]. Within this context, the Organisation for Economic Co-Operation and Development (OECD) and other international organisations have developed multinational assessments of student achievement that rank the relative performance of countries and provide extensive data on their education systems. The OECD’s Programme for International Student Assessment (PISA) is one of the most influential of these programs [5] and has contributed extensively to education policy discourses around “best practice” and “high-performing countries” [6,7]. This has put policymakers under increasing pressure to improve their education systems in alignment with converging global processes identified by international comparative assessments [8]. They must evaluate, assess, and prioritise among competing policy options [9], consider their national contexts and limitations, and select or design appropriate policy initiatives for their unique problems. However, little insight is offered into the moderating effect that larger social forces have on the relationships between policies and outcomes, when transferred to different contexts.
1.1. Education Policy in the Global Context
International comparison has been considered important for knowledge advancement throughout history and in diverse disciplines [6]. This has been especially true in education, with early comparative educationalists believing in the value of studying foreign education systems [10,11]. However, they did not believe that education systems could be improved by replicating successful education policies from around the world, without first paying attention to the system-specific factors within the nations from which policies originated [7,10,11].
Over the last half century, simultaneous consideration of local and international policies has consistently contributed to theory building in education [7], to the point that it is now common for policymakers to look to initiatives from other countries when designing education reforms [12]. A fertile environment for comparing, borrowing, and transferring policies in education has emerged [6], and comparative international assessments of student achievement, such as PISA, have become important tools in national education policy development [5]. These assessments receive extensive media coverage [13] and are therefore in the forefront of the minds of policymakers [14]. They have become catalysts for education reforms that travel across borders and reappear in similar forms in different countries [7]. These “travelling reforms” [12] (p. 324) are grounded in policy recommendations based on evidence from “high performing” countries [15] or of shared policies, often of unknown origin, but labelled as “international standards” or “best practices” [5,7]. The resulting policy recommendations have generally emphasised school-level reform, which has been the logical outcome of assessment programmes that focus on what happens within schools and classrooms and conclude that the academic achievement of students reflects primarily the design and effective execution of classroom interactions.
1.2. The OECD and PISA
PISA is a triennial assessment of the knowledge and skills of 15 year olds in compulsory education. It was launched in 1997 to provide valid, comparable, cross-national evidence of education outcomes, and to inform policy decisions [16]. While it initially assessed education outcomes in only OECD countries, more than half of the 79 nations that in 2018 participated in the seventh cycle of PISA were non-OECD countries. With the launch of PISA for development (PISA-D), the OECD aims to expand the reach of PISA to 170 participating nations by 2030, and to consolidate educational assessment and common basic education standards as global objectives aligned with the United Nation’s Sustainable Development Goals [14].
OECD education data are an accessible, politically acknowledged, and respected source of comparative information on policies, practices, and education outcomes [14,17]. The datasets include large samples, collected under strict sampling designs, and collated with attention to published quality criteria, and as such, are a resource for secondary analyses of global systems and trends in education [18]. Researchers have, for example, used PISA data to expand knowledge of the relationships between education inputs and outcomes, while avoiding the high costs and ethical pitfalls that are sometimes encountered in randomised experiments with children [18].
PISA has become “the global yardstick for school system performance and progress over time” [19] (p. 3) and a politically influential tool for the governance of education systems [19,20]. Despite recognising the non-causal nature of their data, the OECD and other agencies have worked to isolate and promote policies and practices that “work” for raising student achievement. This has given rise to the “What Works” industry focusing primarily on school-level variables that are amenable to change [15,21] and policies that are widely accepted as international best practices [17]. Few participating countries have had their policy reform agendas untouched by this phenomenon [19]. As a result, today’s education policy across different contexts demonstrates marked similarities [6]. This is especially apparent in the policy discourse around effective pedagogies, teacher training and quality, and strategic funding. However, the resulting “travelling reforms” fail to overcome the basic paradox of advocating for the transfer of policy in the absence of causal claims [5], which the OECD clearly states are not supported by their data. The PISA-driven educational reforms do not, therefore, achieve the objective of translating “complex conditions into straightforward solutions” [5] (p. 202).
1.3. Critiques of the Power of PISA
Not all researchers support the international educational testing regime, nor the data-driven policy recommendations of the OECD. Some have disparaged the OECD’s assumed role as “diagnostician, judge and policy advisor to the world’s school systems” [2] (p. 9) and the positioning of PISA as a signal of responsible citizenship in global society [17]. They argue that PISA results are less meaningfully associated with economic and educational well-being than their political significance suggests [22] and criticise the overt focus on what can be measured and calculated, competition between nations, and economic results [3]. This largely economic view, they claim, has reduced and redefined the aims and purposes of education [4], and influenced, governed, and shaped the way policymakers think about and define the problems and targets of education [3]. One-directional policy lending and borrowing has been promoted and “high-performing countries” have been held up as models for education system organisation in lower-performing countries [19]. The promoted “international standards” and “best practices” have been criticised as being “generalised assertions of unclear provenance” [5] (p. 210) with a strong focus on economic, political, and cultural competition, and global competitive advantage. Transferable best practices have included (for example) privatisation of public schooling, teacher selection criteria, certification, and professional development, lengthening the school day, school organisation, and teacher accountability and incentives [15,17,21]. Some international agencies have made the delivery of development grants and other funding dependent upon the adoption of such policy initiatives, and such transfers have resulted in some fundamental contradictions when “solutions are borrowed from educational systems where the problems are entirely different” [12] (p. 331).
Finally, some researchers have questioned the political and ideological neutrality of PISA, the flaws in item construction, administration, student sampling and technical validity [20], as well as cultural bias and indicator oversimplification [23]. They have challenged the legitimacy, motives, and financing of the OECD’s education assessments, even claiming that children and schools have been harmed by the three yearly testing cycles [24]. The OECD has responded to some of these criticisms stating that the organisation’s work has a legitimate mandate from its member countries, that it reports on an unprecedented number of learning outcomes and contexts, and that it has facilitated many important opportunities for collaborative and strategic policy design [25]. They have also suggested that the claim that a two-hour sample-based evaluation could endanger the well-being of students and teachers was without justification [25].
1.4. The Moderating Effect of System-Specific Factors
The intermingling of ideas from diverse educational systems can play an important role in educational advancement, as evidenced by, for example, the worldwide success of universal primary education, a philosophy and practice initiated in just a few developed countries and later adopted globally [26]. However, an understanding of the complexity surrounding the transfer of education policy to different contexts is required [27]. Research indicates that we must take care in the selection and transfer of policies from one context to another [7] as education policies work in some countries precisely because of the support they receive from economic and social systems that are difficult, if not impossible, to fully replicate elsewhere [17]. This does not mean that we should cease using international models in our search for improving education, or that the PISA regime should be dismantled [19]. However, expectations about the effectiveness of international policy borrowing and lending should be restrained [1], given that policies, when applied in different contexts, may develop into very different practices and even undermine quality [28]. Gaining a deeper understanding of the relationships between contextual factors, PISA scores, and education policies could enable policymakers to approach international policy borrowing and lending in an appropriately cautious and informed manner. This article aims to shed light on the relationships between education policies, system-specific factors and student outcomes, with a so-far little explored methodological approach that corresponds to a social-ecological model of education.
As discussed in the next section, social-ecological models [29,30] offer a framework for exploring the moderating effect of system-specific factors on social outcomes. However, such explorations have often encountered methodological limitations within the current approaches to comparative education [5]. In contemporary education research, multinational organisations have typically presented descriptive and linear analyses to describe the observed associations between education conditions and outcomes. These general linear methods have come to dominate the research agenda [31], even when other approaches may be warranted [18]. However, due to general linear assumptions, possible spurious correlations, and/or ambiguous directionality, these methods may not be valid for the identification of the causal relationships that should precede the transfer of policies [5,31]. A second popular research approach, multiple case study, includes thick descriptions of small samples of cases and conditions, from which theory is extrapolated to make generalisations about similar populations. Multiple case studies have typically focused on a limited range of countries, often truncated on the dependent variable of high-performance. As no contradictory or inconsistent cases are considered, case selection bias may have resulted in overgeneralisation [5], and the absence of complex, conditional considerations, threatens the cross-national validity of the resulting policy recommendations [32].
Theory in comparative education research has been dominated by the assumptions of these methods and “divided by the unnecessarily narrow approach to causality implicit in the dominant methods in the discipline” [31] (p. 183). Comparative studies have paid little attention to the nature of the social world and causal relationships and have resulted in ontologies that have outrun the methodologies of the field [33]. Problems that involve reciprocal causation and interaction effects or that break with general linear assumptions, are too complex and collinear to fully model as linear relationships and require the analysis of too many cases for traditional case study approaches [33,34]. Comparative methods in education need to expand to include alternatives that align with real-world ontologies [31]. Set-theoretic methods, such as qualitative comparative analysis (QCA), are promising alternatives [33]. This study therefore used QCA to explore which system-specific factors are associated with PISA results.
Set-theoretic methods are founded in Mill’s (1843) canons for logical induction [35]. In the 1980s, Ragin identified these canons as useful for reducing complexity in social research and developed QCA as a systematic, set-theoretic, computer-based, and comparative approach for exploring hypotheses of complex causal patterns [34]. QCA is especially appropriate for macro-comparative social science studies [36,37] and has been applied to the study of diverse phenomena, including the contextual factors associated with achievement in citizenship education [38] and the onset of ethnic conflict [39] (both of which relied on OECD data). It is a robust method, designed for the exploration of the type of questions raised in this study.
In the policy recommendation sections of recent international reports, researchers have been encouraged to explore how to prioritise among competing policy options [9] and the moderating effect of system-specific factors on the relationships between education inputs and outcomes [40]. However, in the literature reviewed for this study, there were limited investigations into the relationship between system-specific factors and student results, and no systematic analysis of the moderating effects of those system-specific factors. Recent research into the practice of policy transfer in education has shown it to be limited by narrow assumptions of the transferability of policy [1] and, as a result, the early aspirations of exploring the intangible, impalpable, cultural forces underlying systems are still largely pending. This study seeks to address that gap. It is grounded in a social-ecological model of education (modelled on Bronfenbrenner’s social-ecological theory [29]) and identifies system-specific factors underlying high-performing education systems. These factors, outside the reach of teachers and schools, are explored as moderators of policy effectiveness [40], and therefore important for education outcomes [41]. Set-theoretic analyses are used to identify which of the factors are outcome-enabling conditions for student achievement, and correlational analyses are used to explore the moderating effects that these factors might have on the relationships between education policies and student outcomes. The research questions are:
- Which system-specific factors are associated with PISA 2015 results?
- Do these system-specific factors moderate the relationship between education conditions and student outcomes, and if so, how?
2. Theoretical Framework and Selection of System-Specific Factors
Social-ecological theory provides a conceptual explanation for the impact of socio-economic and cultural factors on social outcomes [29], and for the interaction of these system-specific factors with policy initiatives. As a guiding theoretical framework for this study, socio-ecological theory provided both the structure for the investigation, and the impetus to consider alternative methods of data analysis that allowed for multiple interactions, collinearity of factors, and moderated outcomes [34,42].
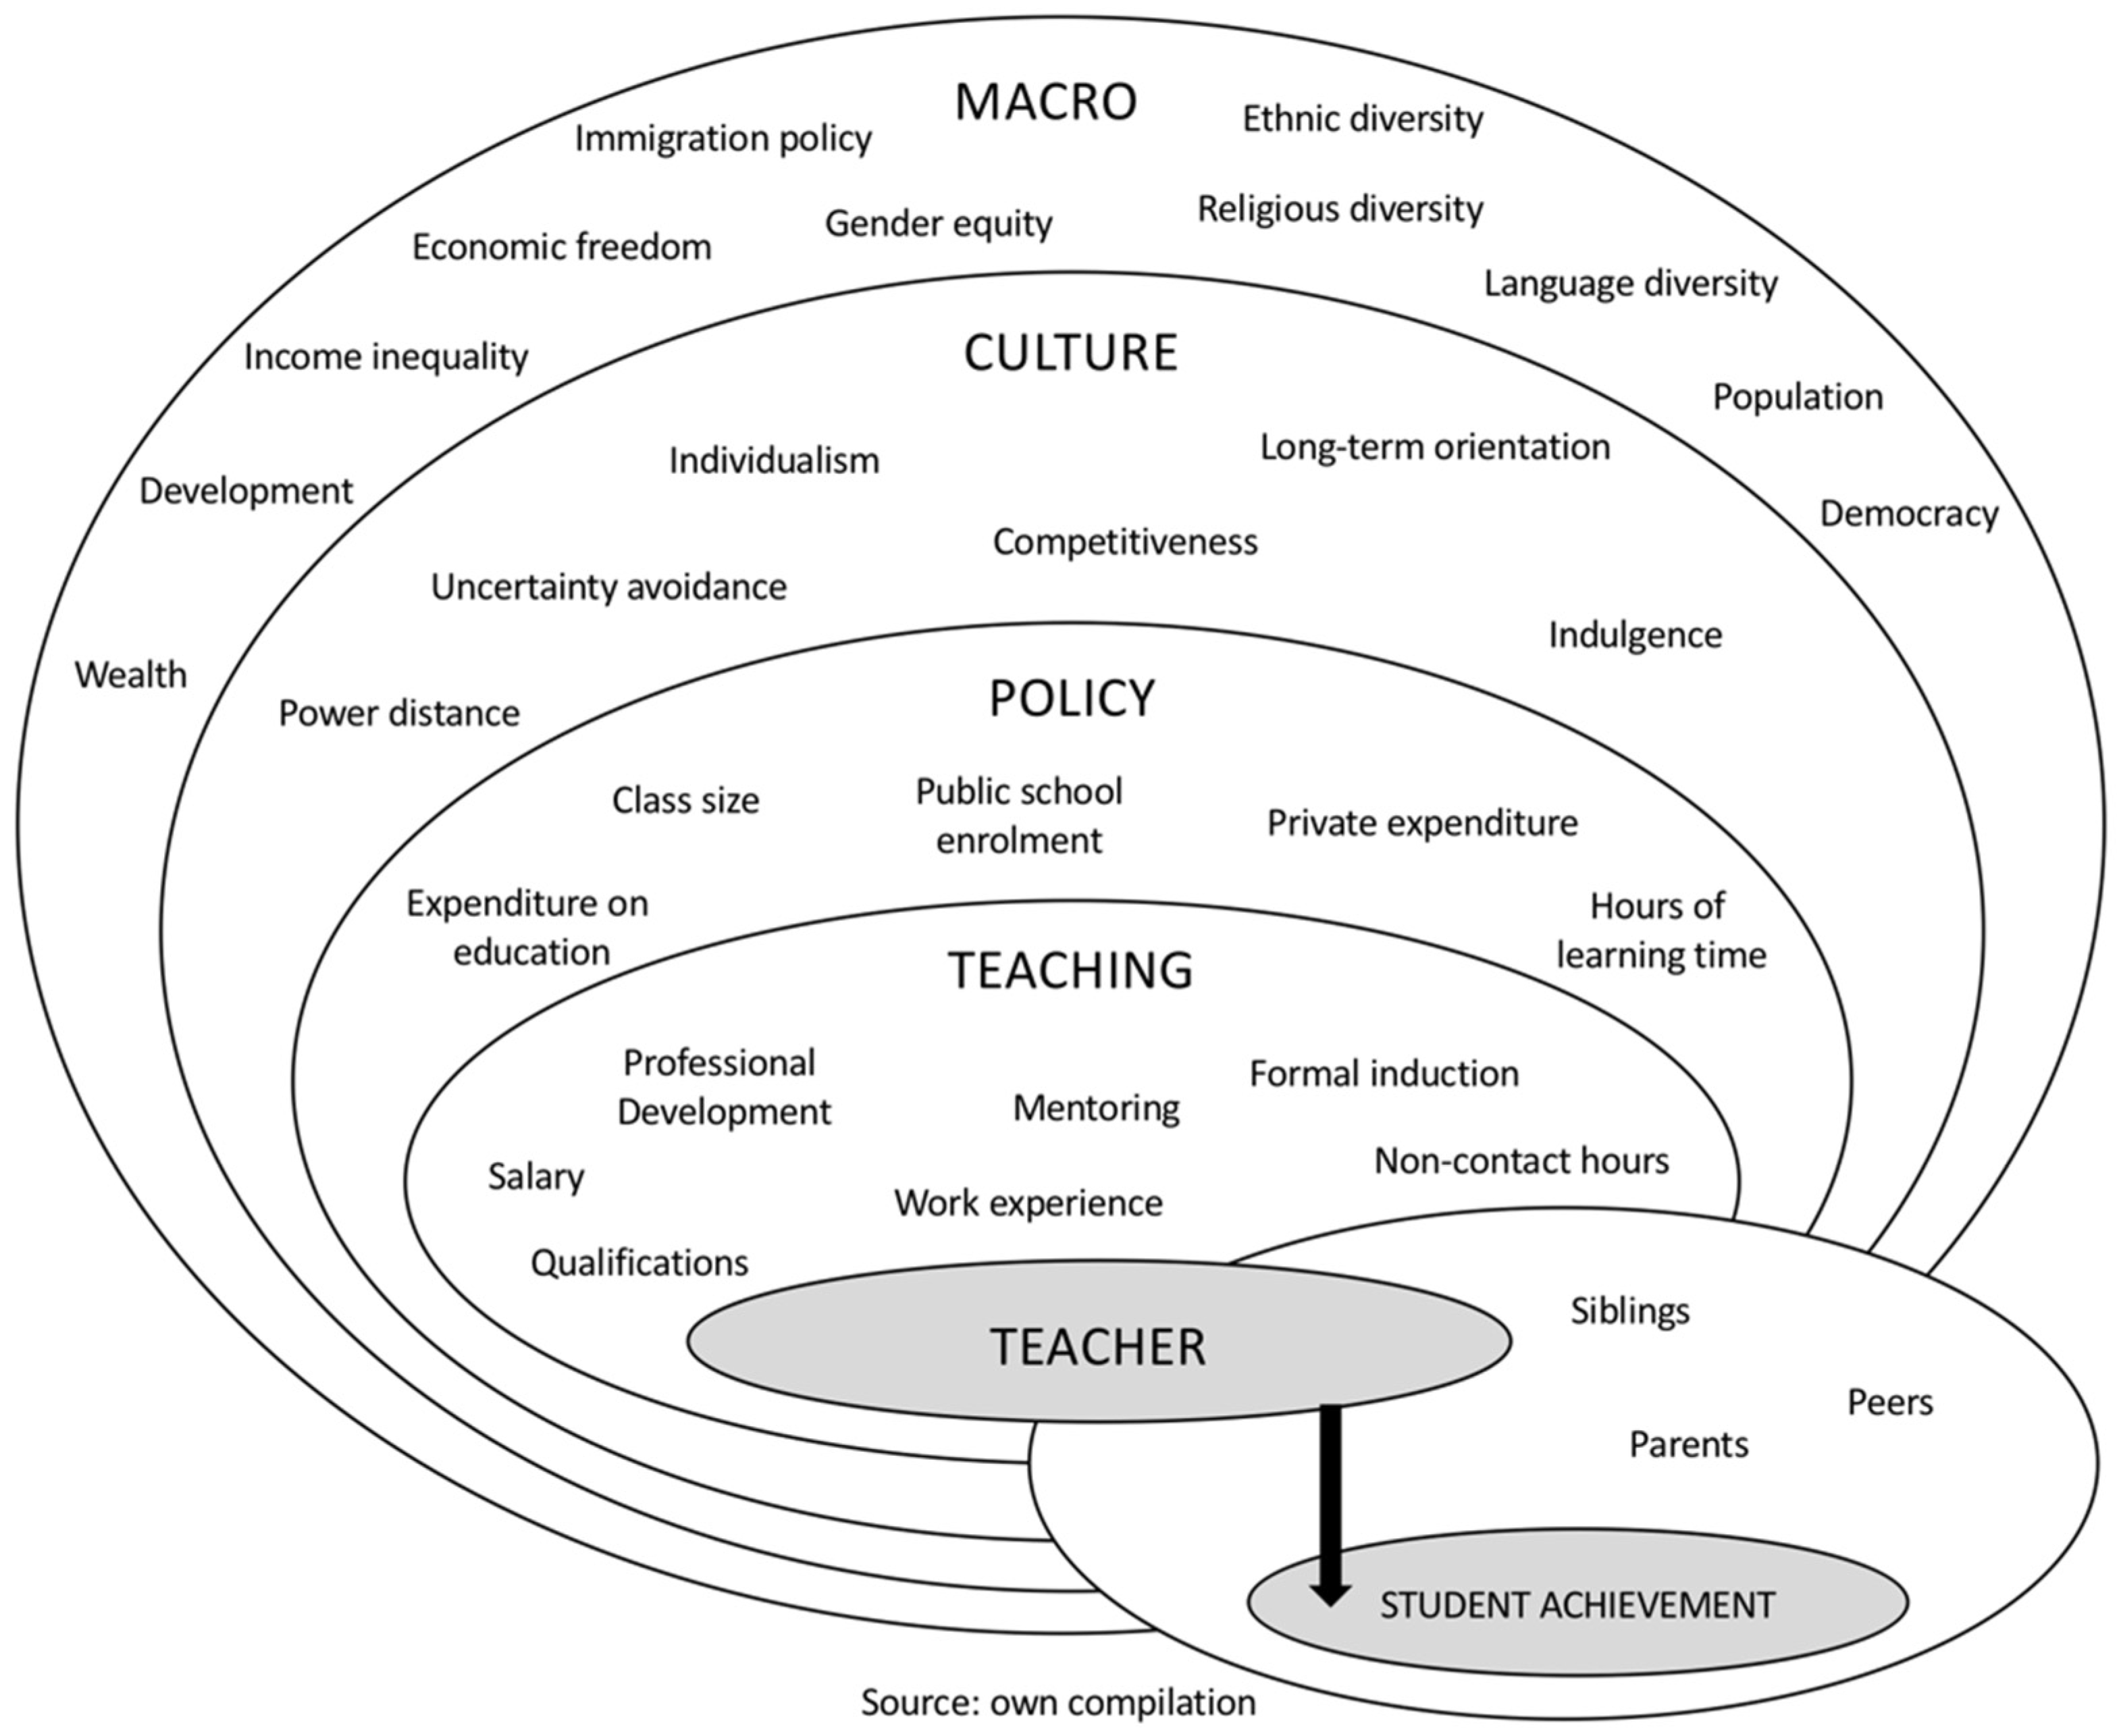
Bronfenbrenner’s social-ecological theory emphasises the importance of system-specific factors for understanding human behaviour and development [29,30]. His work, and the work of other researchers that have used his model, show that explanations for social phenomena may be found in the individual characteristics, contact between individuals, and the influences of institutions, organisations, states, and cultures upon those individuals [43,44,45]. This theory has been widely accepted in developmental psychology and education [30]. In cross-national studies in education, an octagon model, inspired by Bronfenbrenner’s social-ecological approach, underpins the IEA’s Civic Education Study [46,47], and an OECD working paper proposes complex interactions between governance, policies, actors, and external inputs in education [48]. In the analytical framework for PISA 2012 [49], system-specific factors are suggested to influence the relationships between processes and outcomes at school level, and Meyer and Schiller [41] have investigated the “largely unexplored” but important impact that non-educational factors have on PISA outcomes. The interlocking cultural and contextual factors that influence and transform education policy agendas [50] are the factors identified in Bronfenbrenner’s social-ecological models [29,30].
Figure 1 illustrates the conceptual model that underpins this study. All the factors included at the socio-economic, cultural, and policy levels of this model were included in the analyses described in the following sections. Guided by Bronfenbrenner’s socio-ecological theory [29], this study did not aim to make causal claims about the system-specific factors or the education conditions that are explored, but rather to interrogate the validity of implied causal relationships between education conditions and student results in the absence of contextual considerations.
2.1. Socio-Economic and Cultural Factors
The following socio-economic conditions have been shown to impact outcomes in societies and schools: wealth and poverty, economic development, inequality, child welfare, and more broadly, the legal, political, and economic systems and ideologies that underpin nations [22,29,41,50,51,52,53,54]. Each of these studies focused on a limited number of socio-economic conditions, and have, without exception, shown that the presence of positive factors (for example, wealth or equality) is associated with better outcomes, whilst the presence of negative factors (for example, poverty or inequality) is associated with worse outcomes. The socio-economic factors selected for this study were inspired by these previous studies and are listed in Table 1.
The cultural factors, based on Hofstede’s dimensions of culture [56,57,58], were power distance, uncertainty avoidance, individualism, competitiveness (also termed masculinity vs. femininity), long-term orientation, and indulgence. These collective mental models distinguish between different groups of people and are useful for understanding the moderating effect of culture on social phenomena [58]. They have been used, for example, to deepen understanding of education achievement and assessment practices through a cultural lens [50,59,60], to gauge the effect of non-educational factors in large-scale assessments [41], and to explore the gendered nature of educational leadership across contexts [61]. Despite criticisms that these dimensions are excessive and unbalanced [62,63] they have also been acknowledged as rigorous, relevant, and accurate [63]. Hofstede has stated that these dimensions cross “academic borderlines” and create a “paradigm shift in cross-cultural studies” [57] (p. 1355). He has also claimed that although his model is important, “in many practical cases it is redundant, and economic, political, or institutional factors provide better explanations” (p. 1359).
In this study, only human development, income inequality, gender equality, and individualism are found to be consistent outcome-enabling conditions for PISA, and therefore, due to space restrictions, are the only factors described here.
2.1.1. Human Development
PISA scores have been shown to be higher in countries with a high level of affluence and human development [41]. The OECD has suggested that a relationship between wealth, education processes, and outcomes exists [49], but has also indicated that high national income is not a prerequisite for high performance [64]. The composite index used in this study (the Human Development Index) is a weighted index including life expectancy, years of schooling, and gross national income per capita.
2.1.2. Income Inequality
Income inequality has been found to be a “hugely damaging force” and the common denominator in “the enormous variations which exist from one society to another” [52] (p. 195). It is a key feature of human social organisation, and is compounding, pervasive, and self-reinforcing at both ends of the continuum [53]. Patterns of inequality challenge participation and attainment in education [52], determine who gets to attend school longer and who attends the best schools [53], and amplify the gap between high- and low-achieving students [51]. Education reforms modelled on other countries’ performance should therefore consider patterns of inequality and disadvantage. The 80/20 income ratio is used in this study, which is compiled from World Bank data on the income share held by the top 20% of the population, as a multiple of the income held by the bottom 20%.
2.1.3. Gender Equality
Although largely understudied as a moderating factor in education, the importance of gender equality is not a new consideration. Indeed, in 1795, Condorcet stated that “inequality between the sexes is fatal even to the party in whose favour it works” [65] (p. 355), and Mill (1869) concluded that “the legal subordination of one sex to another is wrong in itself, and now one of the chief hindrances to human improvement” [66] (p. 1). Gender has more recently been shown to “unsettle” current approaches to comparative education [67] (p. 121). However, gender equality in education has typically been researched solely as a desirable outcome. The societal level of gender equality has not been systematically considered as a factor related to aggregate student achievement, or even to the size of the gender gap in educational results. Gender equality in health, education, economic status, empowerment, and political representation is measured by the Gender Inequality and the Global Gender Gap Indices.
2.1.4. Individualism
Hofstede’s cultural dimension for individualism measures the preference for a loosely knit social framework in which individuals are expected to take care of only themselves and their immediate families [56,57,58]. Individualism, in combination with other factors such as wealth and inequality, has been shown to be associated with PISA results [41].
2.2. Education Policy Variables
Education policy variables were selected based on policies discussed in OECD reports, and available data in the OECD online databases. They were cumulated expenditure on education, student learning time, public school enrolment, private expenditure on education, class size, teachers’ salary, percentage of qualified teachers, percentage of teachers receiving professional development, percentage of teachers receiving induction, percentage of teachers with mentors, and proportion of teacher non-contact hours. Data used for these variables came from the OECD databases [64,68,69].
This study examined the associations between PISA results and these system-specific factors and policy variables, guided by the theoretical understanding of education as a social ecology where policies, practices and student outcomes are mutually dependent on socio-economic and cultural factors.
3. Methods and Materials
3.1. Methods
In this study, QCA is used for the identification of system-specific factors consistent with PISA results (step 1, following typical best practices for crisp-set QCA [36,37,70,71]), and correlational analyses are used for the exploration of moderated relationships between education policies and student outcomes (step 2).
3.1.1. Qualitative Comparative Analysis
The central principles of QCA are fully explained elsewhere [34,36,37,70], but in brief, as an analytic technique, crisp-set QCA includes the binary calibration of data into condition sets, the determination of combinations of conditions that are consistent with the occurrence and the absence of the outcome, and the identification of different configurations of conditions that explain the same outcome in complex real-world scenarios. QCA is the analysis of necessary conditions followed by the analysis of sufficient conditions [42]. These concepts can be explained by the following example. A necessary hypothesis, that “all high-performing countries are wealthy,” would be supported by QCA if at least 95% of high-performing countries were found to also be wealthy. A sufficient hypothesis, that “all countries with low income equality and high risk avoidance are low performing,” would be supported by QCA if at least 80% of countries with that configuration were found to also be low performing. These consistency thresholds have been established by the developers of QCA, considering that a necessary relationship is a more radical empirical claim than a sufficient relationship, and therefore requires a higher level of consistency [70].
For the identification of system-specific factors consistent with PISA results, step 1 of this study, the relationship between system-specific factors and high PISA results, was analysed separately from the relationship with low PISA results, and analyses of necessity were followed by analyses of sufficiency. The findings are represented using the “standards of good practice” for reporting QCA, as documented by Schneider and Wagemann [71].
3.1.2. Correlational Analyses
The exploration of moderated relationships between education policies and student outcomes, step 2, was achieved by exploring the differences in sample means and correlations when the samples were grouped by the level of the system-specific factors identified in step 1. Cohen’s D was used to estimate the magnitude of the differences between group means [72], and the statistical significance of the difference in means was estimated using the Welch two sample (unequal variances) t-test [73]. Finally, the magnitude of the differences between group correlations (and the statistical significance of the difference) was estimated using Fisher’s r to z transformation, and subsequent comparison of z-scores [74]. The purpose of this second step was to provide preliminary evidence of how system-specific factors moderate the relationship between policy and student achievement, and therefore interrogate the validity of causal inference in the absence of contextual considerations.
All set-theoretic and statistical analyses were conducted in R [75]. Alpha was set at 0.05. The R code is published in the supplementary online materials.
3.2. Data
3.2.1. Cases
The countries included in this study were selected considering completeness of data on all socio-economic and cultural conditions and validated PISA 2015 results from whole country samples. This resulted in a sample of 49 countries (Table 2). A list of excluded PISA countries, and the reason for their exclusion, is available in the Table S1 in the Supplementary Materials.
3.2.2. Student Achievement
PISA 2015 scores were used as the outcome for this study. Despite being a narrow education outcome, PISA scores are widely accepted as a proxy for education performance and student learning over time [19] and are available for a large number of countries. For the QCA analysis (step 1), the outcome was calibrated into the sets HIGH_PISA and LOW_PISA. Countries with scores above the OECD average in all three assessments (reading, mathematics, and science) were calibrated as HIGH_PISA countries, and countries with PISA 2015 scores below the all country average in all three assessments were calibrated as LOW_PISA countries. For the correlational analyses (step 2) each combination of a test and country was considered as a case. Therefore, each country represents 3 cases (reading, math, and science) providing a total sample of sufficient size, and with sufficient variation, for correlational analyses by groups.
3.2.3. System-Specific Factors and Education Policy Variables
The OECD average value was used as the calibration criteria for the socio-economic factors (i.e., better than the OECD average was calibrated as “high”), and the cross-over point established by Hofstede [58] was used for the cultural factors. The resulting calibrated conditions can be interpreted, for example, as HIGH HUMAN DEVELOPMENT (above the OECD average on the Human Development Index) or HIGH INDIVIDUALISM (more individualistic than collective). The two gender equality indices consider similar indicators, weighted differently, and arrive at similar, but not identical, rankings. Therefore, HIGH GENDER EQUALITY are those countries with a better than OECD average on either of these two indices. The correlational analyses did not require calibration of the education policy variables. Data tables (raw and calibrated) are available in the Supplementary Materials (Tables S2–S4).
4. Results
4.1. System-Specific Factors as Outcome-Enabling Conditions
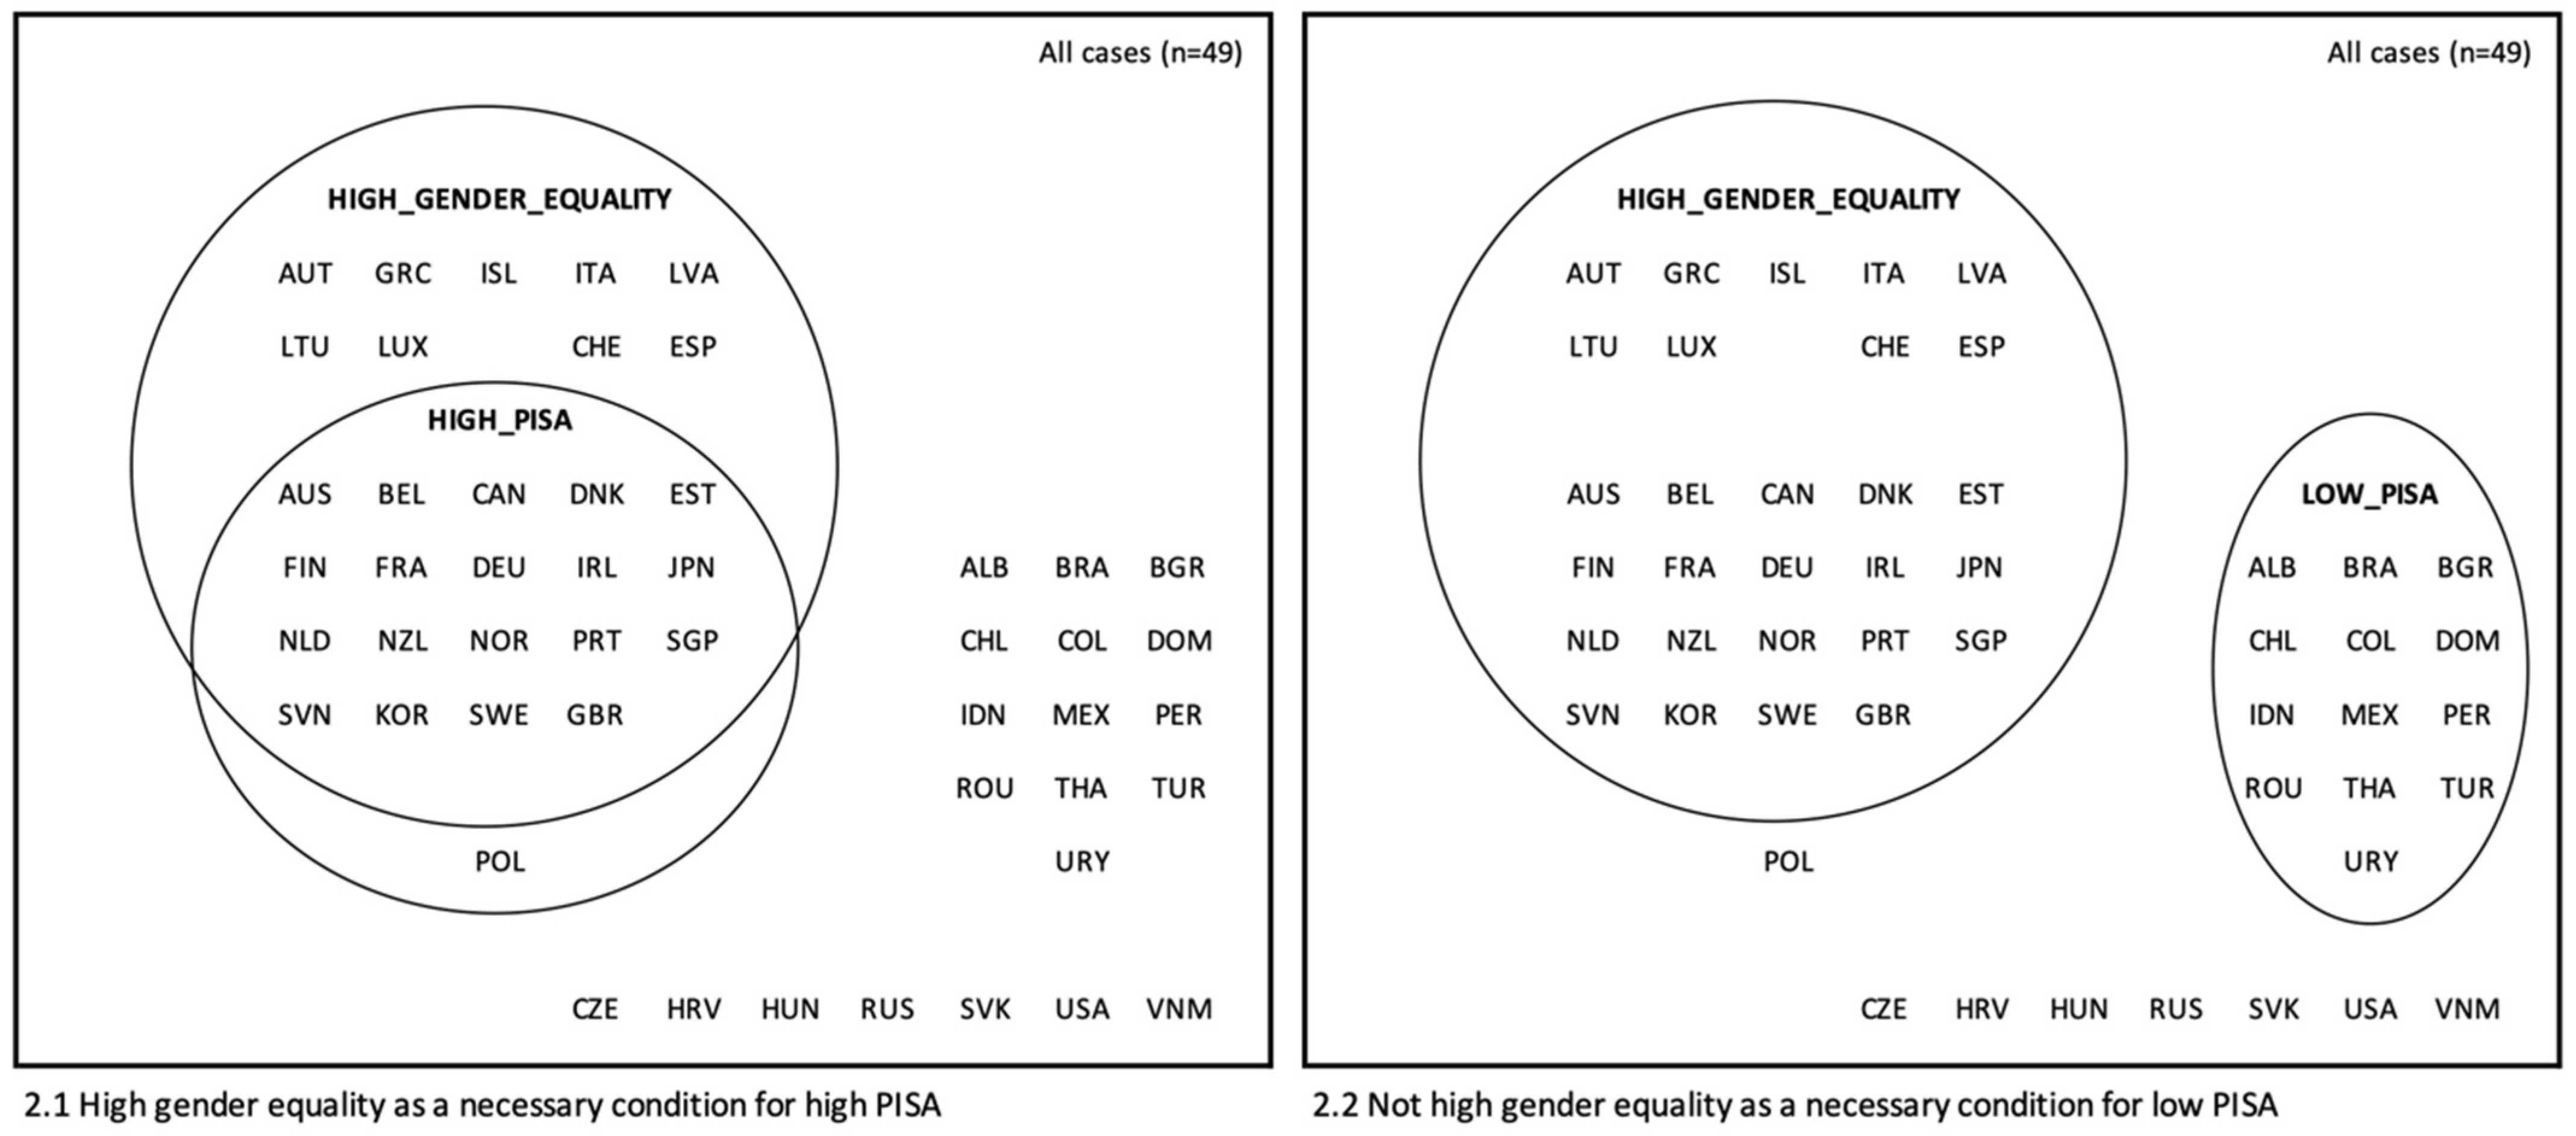
The analysis of necessity for high PISA tested whether all high PISA countries had one or more system-specific factor in common. Only one condition met the required threshold:
HIGH_GENDER_EQUALITY <= HIGH_PISA (consistency 0.95, coverage 0.68)
This indicates that 95% of high PISA countries (19 of 20 countries) were high in gender equality, and these 19 countries represented 68% of all high gender equality countries. Poland was the only contradictory case.
The analysis of necessity for low PISA found:
not HIGH_GENDER_EQUALITY <= LOW_PISA (consistency 1.00, coverage 0.62)
This indicates that 100% of low PISA countries (13 countries) were not high in gender equality, and these 13 countries represented 62% of all countries that were not high in gender equality. These relationships are illustrated in Figure 2.
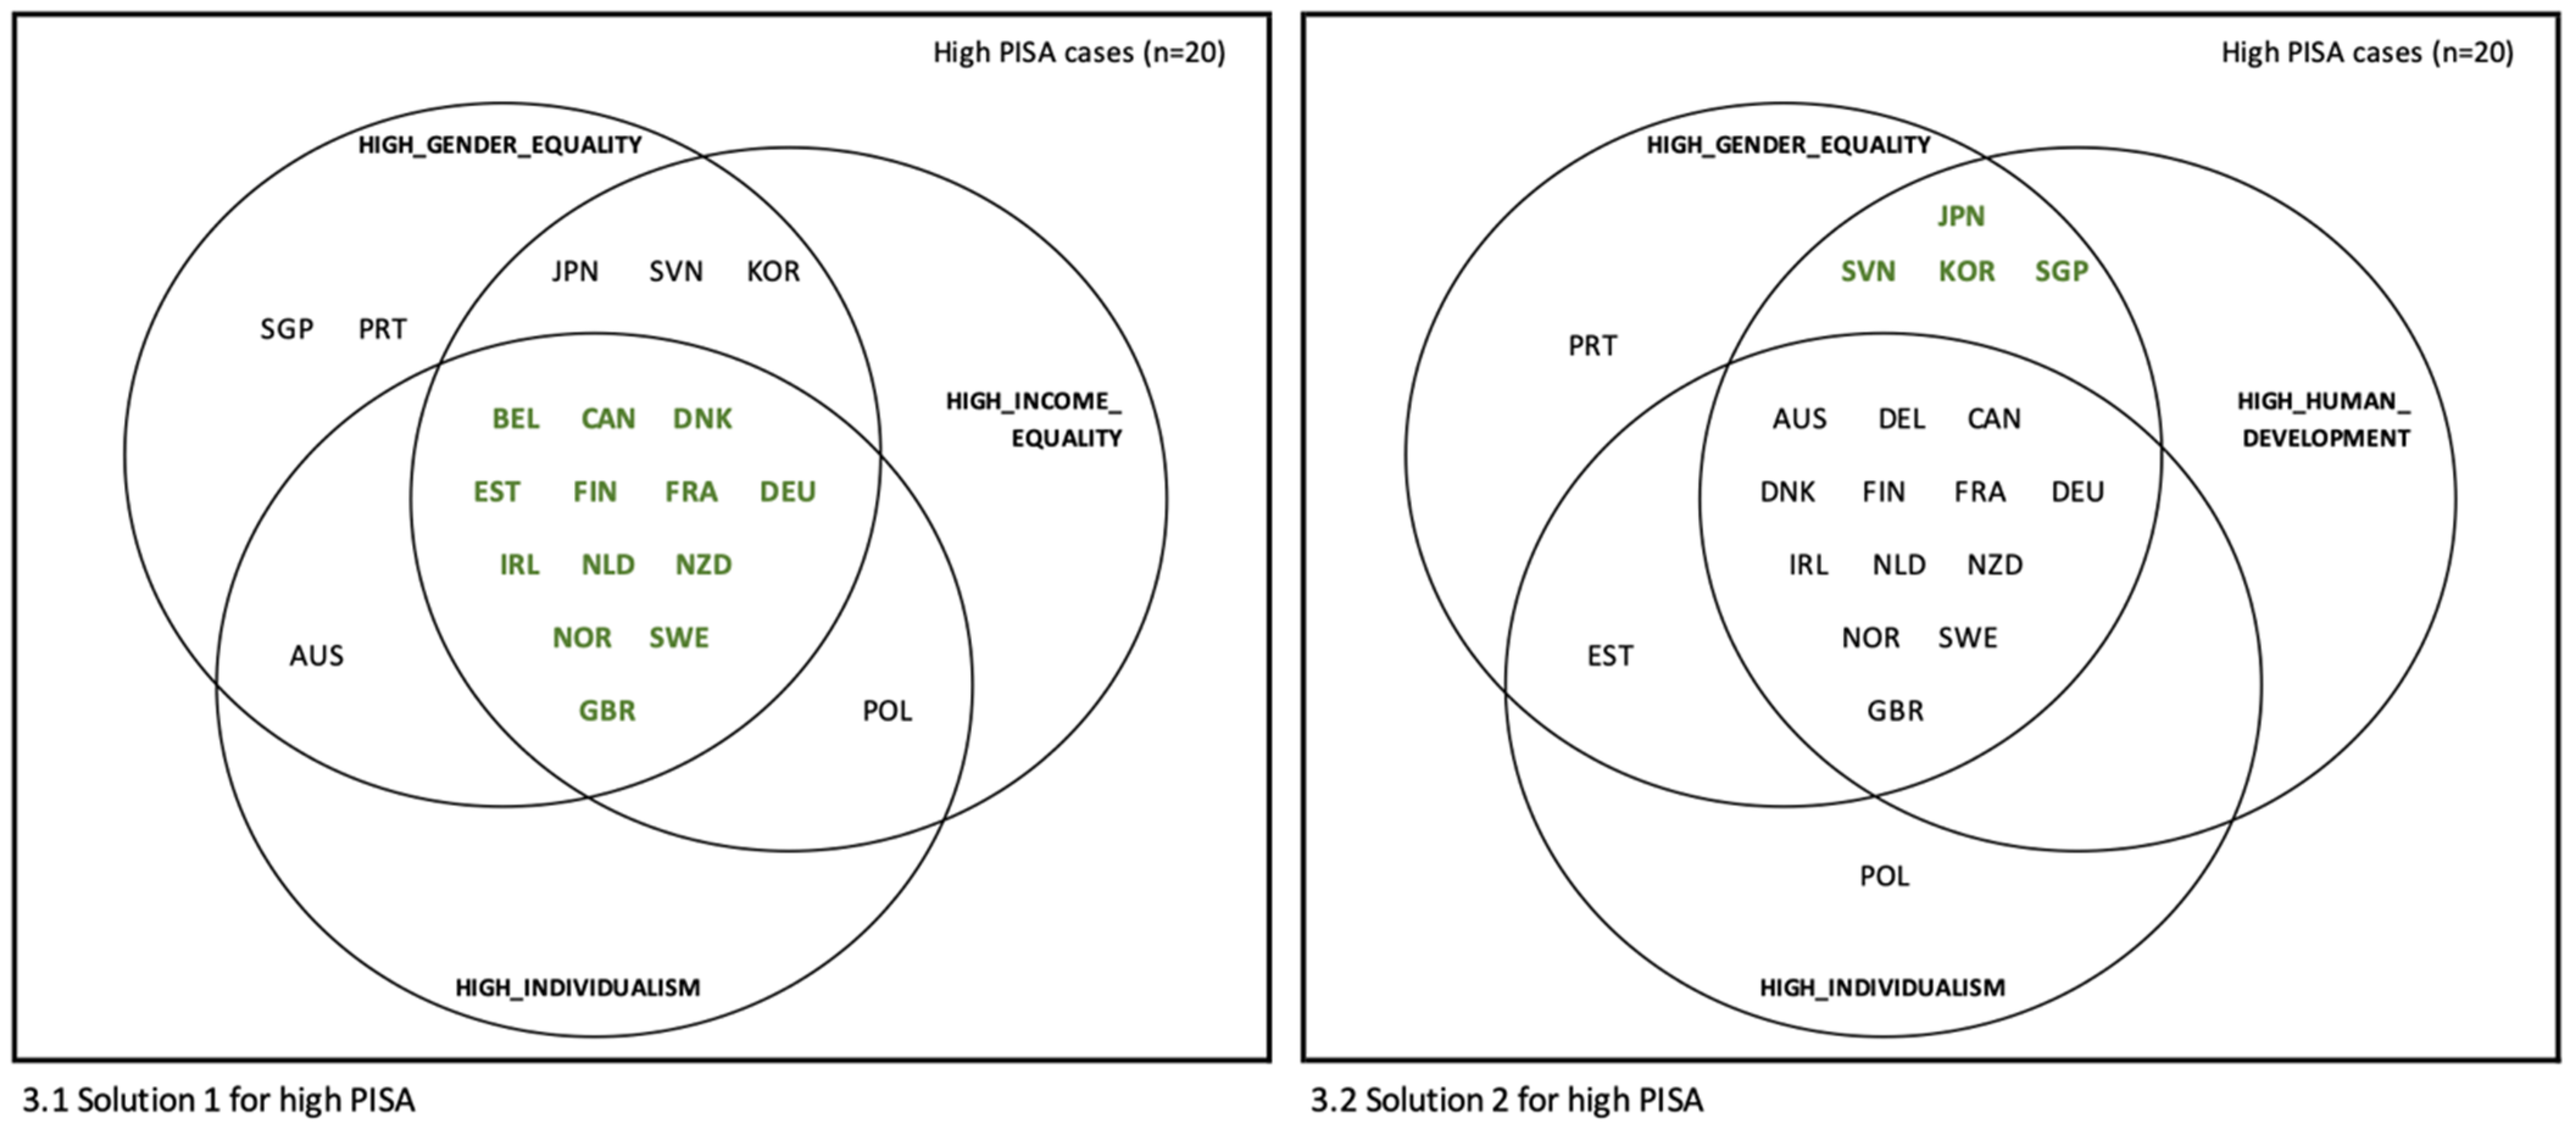
The iterative analysis of sufficiency, as indicated by the best practices for QCA, tested groups of conditions to find the combination that produced the truth table (a truth table presents cases sorted by all logically possible combinations of conditions under analysis [70]) with the fewest contradictions [70]. The analysis for high PISA found that the combination of high gender equality, high income equality, high human development, and high individualism produced the truth table, Table 3, which when simplified using standard QCA procedures resulted in the solutions:
HIGH_GENDER_EQUALITY * HIGH_INCOME_EQUALITY * HIGH_INDIVIDUALISM => HIGH_PISA
(consistency 0.812, coverage 0.650)
(consistency 0.812, coverage 0.650)
HIGH_GENDER_EQUALITY * HIGH_HUMAN_DEVELOP * not HIGH_INDIVIDUALISM => HIGH_PISA
(consistency 1.000, coverage 0.200)
(consistency 1.000, coverage 0.200)
These solutions indicate that almost all high PISA countries were either high in gender equality AND income equality AND individualism (solution 1, covering 13 high PISA countries (65%) and 3 contradictory cases (Austria, Switzerland, and Iceland) resulting in consistency of 0.812) or high in gender equality AND human development AND not individualism (solution 2, covering 4 high PISA countries (20%) with no contradictory cases (consistency of 1.000)). This model covers 17 of the 20 high PISA cases (85%), with Australia, Poland, and Portugal remaining unexplained. These configurations of contextual conditions, and their consistency among high PISA countries, are illustrated in Figure 3.
The analysis for low PISA resulted in the truth table reproduced in Table 4, and the solution:
not HIGH_GENDER_EQUALITY * not HIGH_HUMAN_DEVELOP * not HIGH_INDIVIDUALISM => LOW_PISA
(consistency 0.812, coverage 1.000)
(consistency 0.812, coverage 1.000)
Solution 3 indicates that all low PISA countries were members of the configuration of not high gender equality AND not high human development AND not high individualism. Three contradictory cases (Vietnam, Russia, and Croatia) belong to this configuration and had mixed (neither high nor low) PISA results, resulting in consistency of 0.812. This configuration of contextual conditions and its consistent association with low PISA results is illustrated in Figure 4.
The robustness of these models was checked by randomly dropping cases and making small calibration changes, which slightly modified the solution consistency and coverage, but caused no logical contradictions. As a result of these analyses, the conditions high gender equality, high human development, high income equality, and high individualism were identified as outcome-enabling for PISA results, with gender equality being the most consistent and therefore most empirically important of these conditions.
4.2. The Moderating Effect
Step 2 explored whether the relationships between education policy variables and PISA scores were moderated when countries were grouped by membership in the identified outcome-enabling conditions. Two types of differences between groups were tested for, firstly, a statistically significant difference in the mean value of the policy variable, and secondly, a statistically significant difference in the correlation of the policy variable with PISA scores. Whereas a difference in means is empirically interesting and relevant for future policy decisions, it is the difference in correlations that represents a moderated relationship. Table 5 shows the results of these analyses when countries were grouped by their level of gender equality. It can be observed that six policy variables display a statistically significant moderation of their correlation with PISA scores when grouped. In five of those cases (class size, public school enrolment, private expenditure on education, teacher experience, and teacher mentoring), not only the magnitude of the correlation, but also the direction of the correlation is different.
The same analyses were conducted grouping countries by their level of human development, income equality, and individualism. Full results tables for these analyses are available in the supplementary material (Tables S5–S7) and are summarised in Table 6.
Of the 12 policy conditions analysed in this study, only the relationship of student hours in class with PISA scores was not moderated by any system-specific factor. Class size, public school enrolment, private expenditure on education, and teacher induction were all moderated in the majority of the analyses.
5. Discussion
This study explored which system-specific factors were consistently associated with PISA results, and if and how these system-specific factors moderated the relationship between education conditions and student outcomes. The results showed that gender equality, income equality, human development, and individualism were associated with PISA 2015 results in 49 countries. Gender equality was the most consistent of these factors, being present in almost all (95%) of the high-performing countries and absent in all of the low-performing countries. Results also showed that the relationship between most education policies and student outcomes (as measured by PISA) were moderated in strength and/or direction by these system-specific factors. Thus, although the initial conceptual model implied that context-based policy and practice acted directly upon student outcomes, this study has shown that system-specific factors moderate the relationships between education policies and student outcomes. There are several implications from this work, including the relevance of gender equality for education achievement and research, the importance of identifying meaningful peer countries, and special considerations for the future of PISA and policy transfer.
5.1. Gender Equality
Of the eleven system-specific factors analysed in this study, the factor that was most relevant, most consistent, and symmetrically associated with PISA results was gender equality. Although understudied and therefore potentially surprising in the field of comparative education, this finding supports early concerns regarding the social impact of gender inequality, as expressed, for example, by Condorcet in 1795 [65] and Mill in 1869 [66]. This study provides evidence that the systematic disempowerment and limitation of opportunity, recognition, and representation of women, even among developed countries where the more brutal forms of gender oppression are rare, negatively impacts the education of all children, including boys. This has, to date, not been reported in research that considers the effect of system-specific factors on education outcomes.
5.2. Meaningful Peer Countries
The principal implication for policymakers is the importance of informed selection of meaningful peer countries. This is not an original idea, as other researchers have shown that we should “compare a country with meaningfully chosen peers… those other countries with which one shares important socio-economic and cultural attributes” [41] (p. 207). It is also the idea implicit in criticisms of decontextualised transfer of education policy and provides a plausible explanation for why policies applied in different countries, have, at times, resulted in different outcomes [28].
The findings from this study provide evidence that system-specific factors moderate the effectiveness of education policy, and emphasise, therefore, the importance of carefully selecting similar countries for policy borrowing and lending. Researchers and policymakers can identify the system-specific factors that are independently and conjointly associated with education results, the configuration of system-specific factors to which a country belongs, and group countries by these configurations. Meaningfully chosen, aspirational peer countries can be identified among the countries that are most similar in the most relevant conditions but perform better on the chosen outcome. As policies may result in different outcomes across different types of countries, a cautious transfer of policies between meaningful aspirational peers has the potential to reduce these differences. This approach would return to the foundations of comparative research in education, and once again recognise the factors upholding school systems and accounting for their practical efficiency.
5.3. The Future of PISA and Policy Transfer
Finally, as PISA is expanded towards 170 participating nations by 2030 [14], international organisations and policymakers should consider whether the additional countries are more likely to be contextually similar to the countries that score higher or lower on PISA. Of the 150 countries not included in the first step of this study, there are 34 additional countries with data on the system-specific factors discussed here. None of these countries are members of solution set 1 (81% consistent with high PISA results), nor are any of them members of solution set 2 (100% consistent with high PISA results). However, 29 (85%) of these countries are members of solution set 3, the configuration that is 81% consistent with low PISA results. Therefore, as PISA expands to include more countries, these additional countries are most likely to be similar to the countries that currently perform poorly on PISA and have reduced possibilities of effective policy transfer from countries that are typically high performers. The findings from this study indicate that future research could explore the identification of appropriate, meaningfully chosen, aspirational peer countries for those nations that are consistently lower in the outcome-enabling conditions, as policy learning and transfer from those countries may have a higher chance of success. In the meantime, the transfer of policies from high performing systems, without contextual consideration, should be approached with caution.
6. Limitations and Future Research
As this study was conducted within a field already criticised for making tenuous causal claims, it must be emphasised that causal claims from these findings are not analytically justified. Using QCA as an alternative method of analysis has not changed the nature of the data (which the OECD has stipulated cannot prove causality). In addition, the use of existing data has meant that the conditions included in this study were limited by freely available indices, and cases were limited to those for which data were available. It is possible that other relevant system-specific conditions exist but were not included. However, their addition would logically not contravene the findings of this study, as high gender equality would continue to be a necessary condition, even if another necessary condition was found.
The number of cases is both a strength and limitation of this study. The samples are of a sufficient size for making moderate generalisations for similar countries, but not for all countries. Of the 23 PISA countries that were not included, four would qualify as high PISA cases—BSJG (Beijing, Shanghai, Jiangsu, and Guangdong), Macao, Hong Kong, and Chinese Taipei (also commonly known as Taiwan). It is, therefore, important to stipulate that this study is limited by the exclusion of China and its dependencies, and that the findings should not be generalised to include these, or similar, countries. The other 19 excluded countries are not high PISA cases, so whereas their inclusion (should data become available) may shed additional light on conditions consistently associated with low PISA results, they are unlikely to impact the findings associated with high PISA results.
This study invites future research into several areas. The relationship of gender equality with education and other social outcomes should be further investigated from a longitudinal perspective, as should the possibility of differentiated impacts upon gender groups (at both the system and individual level). When relevant data exists, the countries that have been excluded from this study should be incorporated, especially so as to further understand the impact of gender dynamics on education and other social outcomes in China, its dependencies, and other Asian countries. Finally, policymakers and researchers should gather expansive data on individual policy initiatives, and deeply explore the moderation of policy outcomes by system-specific factors, as although this analysis has provided preliminary evidence of moderating effects, these need to be more deeply understood across more countries and contexts, and through more complex models.
7. Conclusions
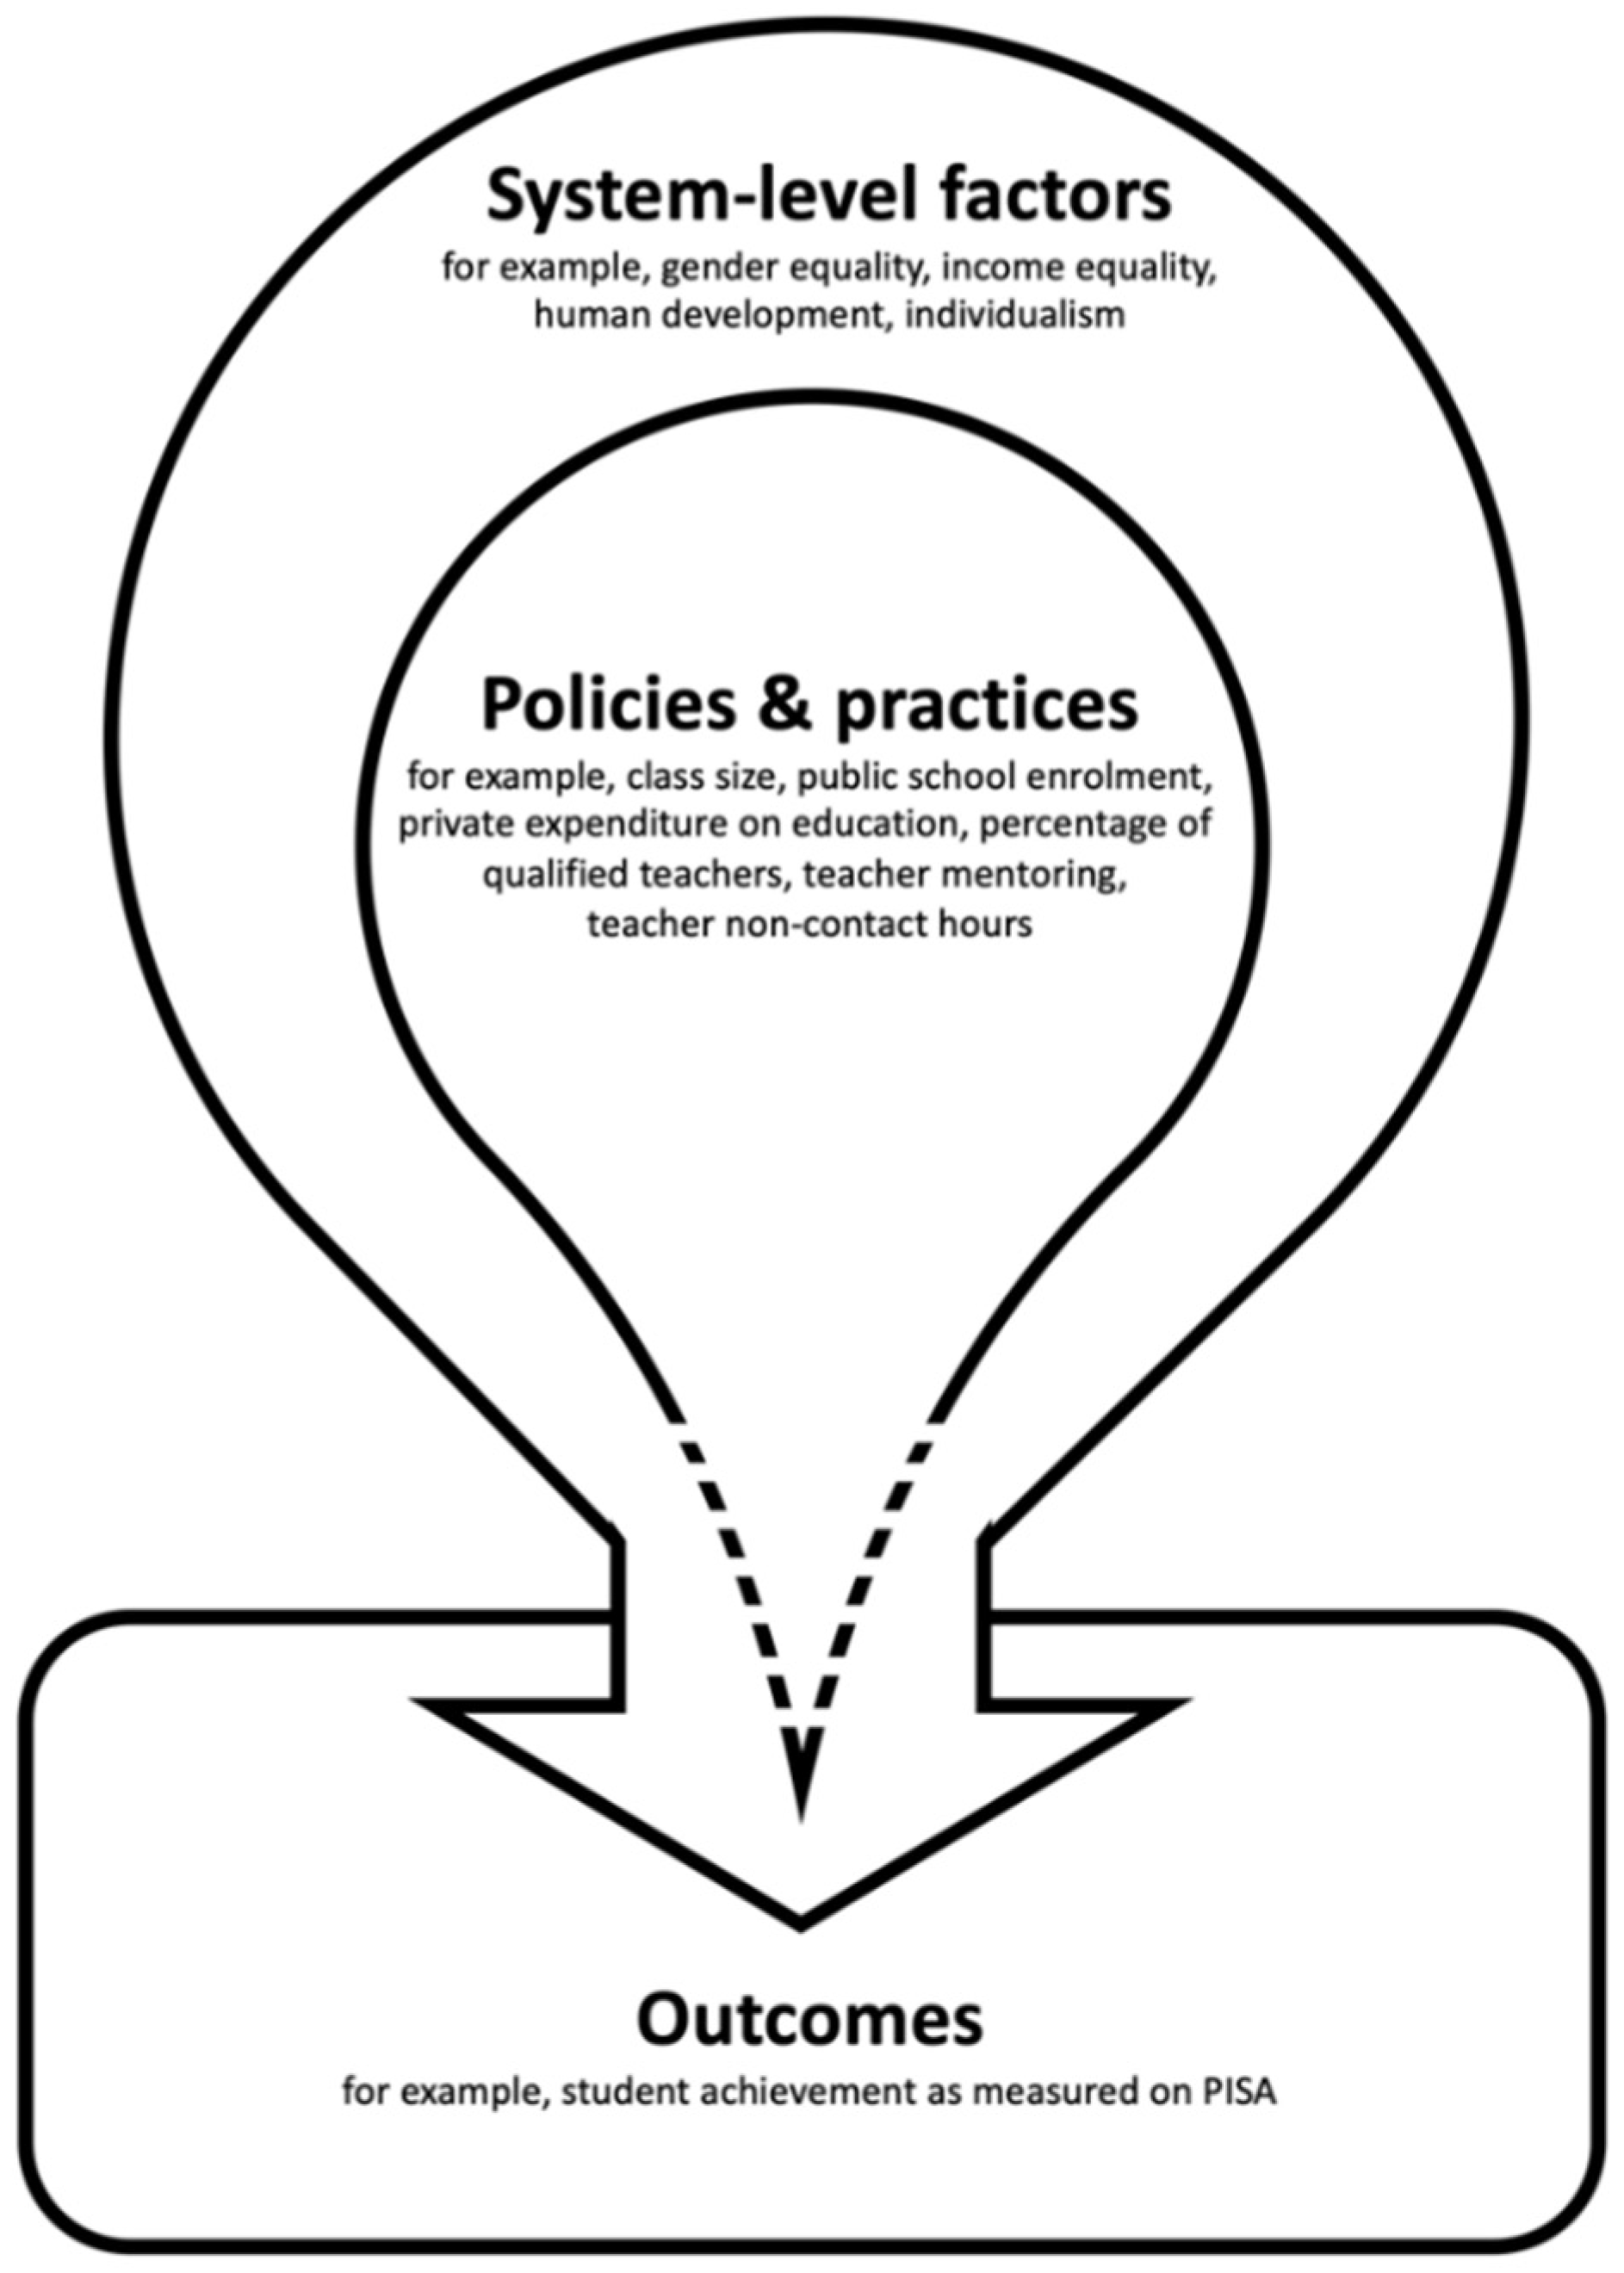
This study has established that some system-specific factors were consistently associated with PISA 2015 results in 49 countries, and that those factors moderated the relationship between education policies and student outcomes. Specifically, gender equality, income equality, human development, and individualism were outcome-enabling conditions for PISA results, and gender equality was the most consistent of these conditions. The initial conceptual model (Figure 1) placed teaching and learning within concentric circles representing socio-economic, cultural, and education policy conditions, implying that policy and practice were situated within contexts, but acted directly upon student outcomes. However, this study has shown that the relationships between education policies and student outcomes are moderated by system-specific factors. Policy and practice, therefore, do not act directly upon student outcomes without first passing through the moderating effect of system-level factors, illustrated in Figure 5.
System-specific factors matter in education, as they are strongly associated with education outcomes and moderate the relationship that education policies and practices have with student outcomes, in some cases even changing the direction of those relationships. Policymakers wishing to learn from education policies in other countries should therefore exercise caution and focus their policy learning on those nations with similar configurations of system-specific factors.
Supplementary Materials
The following are available online at https://0-www-mdpi-com.brum.beds.ac.uk/2227-7102/11/1/10/s1: R code; Table S1: Excluded countries; Table S2: Socio-economic factors; Table S3: Cultural factors; Table S4: Policy variable; Table S5: Analyses grouped by human development; Table S6: Analyses grouped by income equality; Table S7: Analyses grouped by individualism.
Funding
This research received no external funding.
Institutional Review Board Statement
Ethical review and approval were waived for this study, due to the study being a secondary study using only freely available international data sets.
Informed Consent Statement
Not applicable.
Data Availability Statement
The data presented in this study are available in the Supplementary Materials.
Acknowledgments
The author thanks David Berg, Lisa Smith, and the University of Otago College of Education and Scholarship Office (NZ) for their support during the early stages of this study, and Natalia Kucirkova and the University of Stavanger (Norway) Learning Environment Centre for their ongoing support for this research.
Conflicts of Interest
The author declares no conflict of interest.
References
- Silova, I.; Rappleye, J.; Auld, E. Beyond the western horizon: Rethinking education, values, and policy transfer. In Handbook of Education Policy Studies; Fan, G., Popkewitz, T., Eds.; Springer: Singapore, 2020; pp. 3–29. [Google Scholar]
- Meyer, H.; Benavot, A. PISA and the globalization of education governance: Some puzzles and problems. In PISA, Power, and Policy: The Emergence of Global Educational Governance; Meyer, H., Benavot, A., Eds.; Symposium Books Ltd.: Oxford, UK, 2013; pp. 9–26. [Google Scholar]
- Gorur, R. Producing calculable worlds: Education at a glance. Discourse Stud. Cult. Politi Educ. 2015, 36, 578–595. [Google Scholar] [CrossRef]
- Gorur, R. Seeing like PISA: A cautionary tale about the performativity of international assessments. Eur. Educ. Res. J. 2016, 15, 598–616. [Google Scholar] [CrossRef]
- Auld, E.; Morris, P. PISA, policy and persuasion: Translating complex conditions into education ‘best practice’. Comp. Educ. 2016, 52, 202–229. [Google Scholar] [CrossRef]
- Steiner-Khamsi, G. Understanding policy borrowing and lending: Building comparative policy studies. In Policy Borrowing and Lending in Education; Steiner-Khamsi, G., Waldow, F., Eds.; Routledge: New York, NY, USA, 2012; pp. 3–18. [Google Scholar]
- Steiner-Khamsi, G. Cross-national policy borrowing: Understanding reception and translation. Asia Pac. J. Educ. 2014, 34, 153–167. [Google Scholar] [CrossRef]
- Grek, S. Governing by numbers: The PISA ‘effect’ in Europe. J. Educ. Pol. 2009, 24, 23–37. [Google Scholar] [CrossRef] [Green Version]
- World Bank. What Matters Most for Teacher Policies: A Framework Paper. 2013. Available online: https://openknowledge.worldbank.org/handle/10986/20143 (accessed on 5 November 2020).
- Sadler, M. How far can we learn anything of practical value from the study of foreign systems of education? In Proceedings of the Guildford Educational Conference, Guildford, UK, 20 October 1900. [Google Scholar]
- Kandel, I. Studies in Comparative Education; George G. Harrap & Co Ltd.: London, UK, 1933. [Google Scholar]
- Steiner-Khamsi, G. The politics and economics of comparison. Comp. Educ. Rev. 2010, 54, 323–342. [Google Scholar] [CrossRef]
- Grey, S.; Morris, P. PISA: Multiple “truths” and mediatised global governance. Comp. Educ. 2018, 54, 109–131. [Google Scholar] [CrossRef] [Green Version]
- Xiaomin, L.; Auld, E. A historical perspective on the OECD’s ‘humanitarian turn’: PISA for development and the learning framework 2030. Comp. Educ. 2020, 56, 503–521. [Google Scholar] [CrossRef]
- Barber, M.; Mourshed, M. How the World’s Best-Performing School Systems Come Out on Top; McKinsey & Co: London, UK, 2007; Available online: https://www.mckinsey.com/industries/public-and-social-sector/our-insights/how-the-worlds-best-performing-school-systems-come-out-on-top# (accessed on 5 November 2020).
- OECD. Measuring Student Knowledge and Skills: A New Framework for Assessment; OECD Publishing: Paris, France, 1999. [Google Scholar]
- Kamens, D. Globalization and the emergence of an audit culture: PISA and the search for ‘best practices’ and magic bullets. In PISA, Power, and Policy: The Emergence of Global Educational Governance; Meyer, H., Benavot, A., Eds.; Symposium Books Ltd.: Oxford, UK, 2013; pp. 117–139. [Google Scholar]
- Gustafsson, J. Effects of international comparative studies on educational quality on the quality of educational research. Eur. Educ. Res. J. 2008, 7, 1–17. [Google Scholar] [CrossRef] [Green Version]
- Breakspear, S. How Does PISA Shape Education Policymaking? Why How We Measure Learning Determines What Counts in Education; Center for Strategic Education: Melbourne, Australia, 2014. [Google Scholar]
- Sahlberg, P.; Hargreaves, A. The Tower of PISA Is Badly Leaning: An Argument for Why It Should Be Saved. The Washington Post. 24 March 2015. Available online: https://www.washingtonpost.com/news/answer-sheet/wp/2015/03/24/the-tower-of-pisa-is-badly-leaning-an-argument-for-why-it-should-be-saved/ (accessed on 5 November 2020).
- Mourshed, M.; Chijioke, C.; Barber, M. How the World’s Most Improved School Systems Keep Getting Better; McKinsey & Co: London, UK, 2010; Available online: https://www.mckinsey.com/industries/public-and-social-sector/our-insights/how-the-worlds-most-improved-school-systems-keep-getting-better (accessed on 5 November 2020).
- Rowley, K.; Edmunds, C.; Dufur, M.; Jarvis, J.; Silviera, F. Contextualising the achievement gap: Assessing educational achievement, inequality, and disadvantage in high-income countries. Comp. Educ. 2020, 56, 459–483. [Google Scholar] [CrossRef]
- Dobbins, M.; Martens, K. Towards an education approach à la finlandaise? French education policy after PISA. J. Educ. Pol. 2012, 27, 23–43. [Google Scholar] [CrossRef]
- Meyer, H.; Zahedi, K. Open letter to Andreas Schleicher. Policy Futur. Educ. 2014, 12, 872–877. [Google Scholar] [CrossRef]
- OECD. Response of OECD to points raised in Heinz-Dieter Meyer and Katie Zahedi, ‘Open Letter’. Policy Futur. Educ. 2014, 12, 878–879. [Google Scholar] [CrossRef] [Green Version]
- Reimers, F.; O’Donnell, E. (Eds.) Fifteen Letters on Education in Singapore; Lulu Publishing Services: Morrisville, NC, USA, 2016; ISBN 978-1483450629. Available online: https://books.google.com/books?hl=zh-CN&lr=&id=QmEUDAAAQBAJ&oi=fnd&pg=PA1&dq=Fifteen+Letters+on+Education+in+Singapore&ots=Spk5eXNrvT&sig=IZnGyIfTQXgci7uh605YJibZi4c#v=onepage&q=Fifteen%20Letters%20on%20Education%20in%20Singapore&f=false (accessed on 30 December 2020).
- Burdett, N.; O’Donnell, S. Lost in translation? The challenges of educational policy borrowing. Educ. Res. 2016, 58, 113–120. [Google Scholar] [CrossRef] [Green Version]
- Carnoy, M.; Rhoten, D. What does globalization mean for educational change? A comparative approach. Comp. Educ. Rev. 2002, 46, 1–9. [Google Scholar] [CrossRef]
- Bronfenbrenner, U. The Ecology of Human Development: Experiments by Design and Nature; Harvard University Press: Cambridge, MA, USA, 1979. [Google Scholar]
- Darling, N. Ecological systems theory: The person in the center of the circles. Res. Hum. Dev. 2007, 4, 203–217. [Google Scholar] [CrossRef]
- Abbott, A. Transcending general linear reality. Sociol. Theory 1988, 6, 169–186. [Google Scholar] [CrossRef]
- Rohlfing, I. Case Studies and Causal Inference: An Integrative Framework; Palgrave MacMillan: Hampshire, UK, 2012. [Google Scholar]
- Hall, P. Aligning ontology and methodology in comparative politics. In Comparative Historical Analysis in the Social Sciences; Mahoney, J., Rueschemeyer, D., Eds.; Cambridge University Press: Cambridge, UK, 2003; pp. 373–404. [Google Scholar]
- Ragin, C. The Comparative Method: Moving beyond Qualitative and Quantitative Strategies; University of California Press: Los Angeles, CA, USA, 1987. [Google Scholar]
- Mill, J. A System of Logic, Ratiocinative and Inductive: Being a Connected View of the Principles of Evidence, and the Methods of Scientific Investigation; John W. Parker: London, UK, 1843. [Google Scholar]
- Berg-Schlosser, D.; De Meur, G.; Ragin, C.; Rihoux, B. Qualitative Comparative Analysis (QCA) as an approach. In Configurational Comparative Methods: Qualitative Comparative Analysis (QCA) and Related Techniques; Rihoux, B., Ragin, C., Eds.; SAGE Publications Ltd.: Thousand Oaks, CA, USA, 2009; pp. 1–18. [Google Scholar]
- Rihoux, B. Qualitative comparative analysis (QCA) and related systematic comparative methods: Recent advances and remaining challenges for social science research. Int. Sociol. 2006, 21, 679–706. [Google Scholar] [CrossRef]
- Toots, A.; Lauri, T. Institutional and contextual factors of quality in civic and citizenship education: Exploring possibilities of qualitative comparative analysis. Comp. Educ. 2015, 51, 247–275. [Google Scholar] [CrossRef]
- Bara, C. Incentives and opportunities: A complexity-oriented explanation of violent ethnic conflict. J. Peace Res. 2014, 51, 696–710. [Google Scholar] [CrossRef] [Green Version]
- OECD. Supporting Teacher Professionalism: Insights from TALIS 2013; OECD Publishing: Paris, France, 2016. [Google Scholar] [CrossRef]
- Meyer, H.; Schiller, K. Gauging the role of non-educational effects in large-scale assessments: Socio-economics, culture and PISA outcomes. In PISA, Power, and Policy: The Emergence of Global Educational Governance; Meyer, H., Benavot, A., Eds.; Symposium Books Ltd.: Oxford, UK, 2013; pp. 207–224. [Google Scholar]
- Schneider, C. Two-step QCA revisited: The necessity of context conditions. Qual. Quant. 2019, 53, 1109–1126. [Google Scholar] [CrossRef]
- O’Connor, E.; McCartney, K. Examining teacher-child relationships and achievement as part of an ecological model for development. Am. Educ. Res. J. 2007, 44, 340–369. [Google Scholar] [CrossRef]
- Price, D.; McCallum, F. Ecological influences on teachers’ well-being and “fitness”. Asia Pac. J. Teach. Educ. 2015, 43, 195–209. [Google Scholar] [CrossRef]
- Abbott, A. Linked ecologies: States and universities as environments for professions. Sociol. Theory 2005, 23, 245–274. [Google Scholar] [CrossRef]
- IEA. Assessment Framework: IEA International Civic and Citizenship Education Study 2016; IEA Secretariat: Amsterdam, The Netherlands, 2016. [Google Scholar]
- Schulz, W.; Sibberns, H. IEA Civic Study Technical Report; IEA Secretariat: Amsterdam, The Netherlands, 2004. [Google Scholar]
- Snyder, S. The simple, the complicated, and the complex: Educational reform through the lens of complexity theory. In OECD Education Working Papers, No. 96; OECD Publishing: Paris, France, 2013. [Google Scholar]
- OECD. PISA 2012 Assessment and Analytical Framework: Mathematics, Reading, Science, Problem Solving and Financial Literacy; OECD Publishing: Paris, France, 2013. [Google Scholar] [CrossRef]
- Miller, P. ‘Culture’, ‘context’, school leadership and entrepreneurialism: Evidence from sixteen countries. Educ. Sci. 2018, 8, 76. [Google Scholar] [CrossRef] [Green Version]
- Gorard, S. Overcoming equity-related challenges for the education and training systems of Europe. Educ. Sci. 2020, 10, 305. [Google Scholar] [CrossRef]
- Wilkinson, R.; Pickett, K. The Spirit Level: Why Equality Is Better for Everyone; Penguin Books: London, UK, 2010. [Google Scholar]
- Ragin, C.; Fiss, P. Intersectional Inequality: Race, Class, Test Scores, and Poverty; University of Chicago Press: Chicago, IL, USA, 2017. [Google Scholar]
- Alexander, R. Culture and Pedagogy: International Comparisons in Primary Education; Wiley-Blackwell: Malden, MA, USA, 2001. [Google Scholar]
- Alesina, A.; Devleeschauwer, A.; Easterly, W.; Kurlat, S.; Wacziarg, R. Fractionalization. J. Econ. Growth 2003, 8, 155–194. [Google Scholar] [CrossRef] [Green Version]
- Hofstede, G. Cultures Consequences: Comparing Values, Behaviors, Institutions and Organizations across Cultures; SAGE Publications: Thousand Oaks, CA, USA, 2001. [Google Scholar]
- Hofstede, G. Dimensions do not exist: A reply to Brendan McSweeney. Hum. Relat. 2002, 55, 1355–1361. [Google Scholar] [CrossRef]
- Hofstede, G. Hofstede Insights. Available online: https://www.hofstede-insights.com (accessed on 10 November 2020).
- Purves, A. IEA—An agenda for the future. Int. Rev. Educ. 1987, 33, 103–107. Available online: http://0-www-jstor-org.brum.beds.ac.uk/stable/3444047 (accessed on 11 November 2020). [CrossRef]
- Von Kopp, B. On the question of cultural context as a factor in international academic achievement. Eur. Educ. 2003, 35, 70–98. [Google Scholar] [CrossRef]
- Bissessar, C. An application of Hofstede’s cultural dimensions among female educational leaders. Educ. Sci. 2018, 8, 77. [Google Scholar] [CrossRef] [Green Version]
- McSweeney, B. Hofstede’s model of national cultural differences and their consequences: A triumph of faith—A failure of analysis. Hum. Relat. 2002, 55, 89–118. [Google Scholar] [CrossRef]
- Jones, M. Hofstede—culturally questionable? In Oxford Business & Economics Conference; Oxford University: Oxford, UK, 2007. [Google Scholar]
- OECD. Education at a Glance 2016: OECD Indicators; OECD Publishing: Paris, France, 2016. [Google Scholar] [CrossRef]
- De Condorcet, M. Outlines of an Historical View of the Progress of the Human Mind; J. Johnson: London, UK, 1795. [Google Scholar]
- Mill, J. The Subjection of Women; Longmans, Green, Reader, and Dyer: London, UK, 1869. [Google Scholar]
- Unterhalter, E. Thinking about gender in comparative education. Comp. Educ. 2014, 50, 112–126. [Google Scholar] [CrossRef]
- OECD. TALIS 2013 Results: An International Perspective on Teaching and Learning; OECD Publishing: Paris, France, 2014. [Google Scholar] [CrossRef]
- OECD. PISA 2015 Results (Volume II): Policies and Practices for Successful Schools; OECD Publishing: Paris, France, 2016. [Google Scholar] [CrossRef]
- Schneider, C.; Wagemann, C. Set-Theoretic Methods for the Social Sciences: A Guide to Qualitative Comparative Analysis; Cambridge University Press: Cambridge, UK, 2012. [Google Scholar]
- Schneider, C.; Wagemann, C. Standards of good practice in qualitative comparative analysis and fuzzy-sets. Comp. Sociol. 2010, 9, 397–418. [Google Scholar] [CrossRef] [Green Version]
- Cohen, J. Statistical Power Analysis for the Behavioral Sciences, 2nd ed.; Erlbaum: Hillsdale, NJ, USA, 1988; ISBN 9780203771587. [Google Scholar]
- Welch, B. On the comparison of several mean values: An alternative approach. Biometrica 1951, 38, 330–336. [Google Scholar] [CrossRef]
- Fisher, R. Frequency distribution of the values of the correlation coefficient in samples of an indefinitely large population. Biometrica 1915, 10, 507–521. [Google Scholar] [CrossRef]
- R Core Team. R: A Language and Environment for Statistical Computing; R Foundation for Statistical Computing: Vienna, Austria, 2018; Available online: https://www.R-project.org (accessed on 11 November 2020).
Figure 1.
The study’s conceptual model.

Figure 2.
Venn diagrams of gender equality as a necessary condition.

Figure 3.
Venn diagrams of sufficient configurations for high PISA.

Figure 4.
Venn diagram of sufficient configuration for low PISA.

Figure 5.
Illustration of findings.


Table 1.
Indices and data sources for socio-economic factors.
| Factor | Index | Source |
|---|---|---|
| Wealth | GDP per Capita, 2015 | The World Bank |
| Human development | Human Development Index, 2015 | The United Nations Development Programme |
| Income inequality | 80/20 Index, 2015 | The World Bank, Income share highest 20% and lowest 20% |
| Economic freedom | Economic Freedom Index, 2015 | The Heritage Foundation |
| Immigration | Migrant Stock, 10–14 years old, 2015 | The United Nations Department of Economic and Social Affairs |
| Gender inequality | Gender Inequality Index, 2015 | The United Nations Development Programme |
| Gender gap | Gender Gap Index, 2015 | The World Economic Forum |
| Ethnic diversity/tension | Ethnic Fractionalization, 2003 * | Alesina, Devleeschauwer, Easterly, Kurlat, and Wacziarg [55] |
| Religious diversity/tension | Religious Fractionalization, 2003 * | |
| Language diversity/tension | Language Fractionalization, 2003 * | |
| Country population | Country Population Data, 2015 | The United Nations Department of Economic and Social Affairs |
| Democracy | Democracy Index, 2015 | The Economist Intelligence Unit |
* No more recent indices have, to date, been published.
Table 2.
Included cases and calibrated outcome sets.
| Code | Country | 2015 PISA Score | Set Membership | |||
|---|---|---|---|---|---|---|
| Mathematics | Reading | Science | HIGH_PISA (1) | LOW_PISA (2) | ||
| ALB | Albania | 413 | 405 | 427 | 0 | 1 |
| AUS | Australia | 494 | 503 | 510 | 1 | 0 |
| AUT | Austria | 497 | 485 | 495 | 0 | 0 |
| BEL | Belgium | 507 | 499 | 502 | 1 | 0 |
| BRA | Brazil | 377 | 407 | 401 | 0 | 1 |
| BGR | Bulgaria | 441 | 432 | 446 | 0 | 1 |
| CAN | Canada | 516 | 527 | 528 | 1 | 0 |
| CHL | Chile | 423 | 459 | 447 | 0 | 1 |
| COL | Colombia | 390 | 425 | 416 | 0 | 1 |
| HRV | Croatia | 464 | 487 | 475 | 0 | 0 |
| CZE | Czech Republic | 492 | 487 | 493 | 0 | 0 |
| DNK | Denmark | 511 | 500 | 502 | 1 | 0 |
| DOM | Dominican Republic | 328 | 358 | 332 | 0 | 1 |
| EST | Estonia | 519 | 519 | 534 | 1 | 0 |
| FIN | Finland | 511 | 526 | 531 | 1 | 0 |
| FRA | France | 493 | 499 | 495 | 1 | 0 |
| DEU | Germany | 506 | 509 | 509 | 1 | 0 |
| GRC | Greece | 454 | 467 | 455 | 0 | 0 |
| HUN | Hungary | 477 | 470 | 477 | 0 | 0 |
| ISL | Iceland | 488 | 482 | 473 | 0 | 0 |
| IDN | Indonesia | 386 | 397 | 403 | 0 | 1 |
| IRL | Ireland | 504 | 521 | 503 | 1 | 0 |
| ITA | Italy | 490 | 485 | 481 | 0 | 0 |
| JPN | Japan | 532 | 516 | 538 | 1 | 0 |
| LVA | Latvia | 482 | 488 | 490 | 0 | 0 |
| LTU | Lithuania | 478 | 472 | 475 | 0 | 0 |
| LUX | Luxembourg | 486 | 481 | 483 | 0 | 0 |
| MEX | Mexico | 408 | 423 | 416 | 0 | 1 |
| NLD | Netherlands | 512 | 503 | 509 | 1 | 0 |
| NZL | New Zealand | 495 | 509 | 513 | 1 | 0 |
| NOR | Norway | 502 | 513 | 498 | 1 | 0 |
| PER | Peru | 387 | 398 | 397 | 0 | 1 |
| POL | Poland | 504 | 506 | 501 | 1 | 0 |
| PRT | Portugal | 492 | 498 | 501 | 1 | 0 |
| ROU | Romania | 444 | 434 | 435 | 0 | 1 |
| RUS | Russia | 494 | 495 | 487 | 0 | 0 |
| SGP | Singapore | 564 | 535 | 556 | 1 | 0 |
| SVK | Slovak Republic | 475 | 453 | 461 | 0 | 0 |
| SVN | Slovenia | 510 | 505 | 513 | 1 | 0 |
| KOR | South Korea | 524 | 517 | 516 | 1 | 0 |
| ESP | Spain | 486 | 496 | 493 | 0 | 0 |
| SWE | Sweden | 494 | 500 | 493 | 1 | 0 |
| CHE | Switzerland | 521 | 492 | 506 | 0 | 0 |
| THA | Thailand | 415 | 409 | 421 | 0 | 1 |
| TUR | Turkey | 420 | 428 | 425 | 0 | 1 |
| GBR | United Kingdom | 492 | 498 | 509 | 1 | 0 |
| USA | United States | 470 | 497 | 496 | 0 | 0 |
| URY | Uruguay | 418 | 437 | 435 | 0 | 1 |
| VNM | Viet Nam | 495 | 487 | 525 | 0 | 0 |
| Average (all PISA countries) | 461 | 460 | 465 | n = 20 | n = 13 | |
| Average (included countries) | 473 | 476 | 478 | |||
| Average (OECD) | 490 | 493 | 493 | |||
NOTES: (1) Above OECD average in all three PISA assessments. (2) Below all country average in all three PISA assessments.
Table 3.
Truth table for outcome HIGH_PISA.
| HIGH_ GENDER_ EQUALITY | HIGH_ INCOME_ EQUALITY | HIGH_ HUMAN_ DEVELOP | HIGH_ INDIVID | Out | n | Cons. | Cases |
|---|---|---|---|---|---|---|---|
| 1 | 1 | 1 | 1 | 1 | 15 | 0.800 | AUT, BEL, CAN, DNK, FIN, FRA, DEU, IRL, ISL, NLD, NZL, NOR, SWE, CHE, GBR |
| 1 | 1 | 1 | 0 | 1 | 3 | 1.000 | JPN, SVN, KOR |
| 1 | 0 | 1 | 0 | 1 | 1 | 1.000 | SGP |
| 1 | 1 | 0 | 1 | 1 | 1 | 1.000 | EST |
| 0 | 0 | 0 | 0 | 0 | 13 | 0.000 | BRA, BGR, CHL, COL, DOM, IDN, MEX, PER, RUS, THA, TUR, URY, VNM |
| 0 | 1 | 0 | 1 | 0 | 4 | 0.250 | CZE, HUN, POL, SVK |
| 1 | 0 | 0 | 1 | 0 | 4 | 0.000 | ITA, LVA, LTU, ESP |
| 0 | 1 | 0 | 0 | 0 | 3 | 0.000 | ALB, HRV, ROU |
| 1 | 0 | 0 | 0 | 0 | 2 | 0.500 | GRC, PRT |
| 1 | 0 | 1 | 1 | 0 | 2 | 0.500 | AUS, LUX |
| 0 | 0 | 1 | 1 | 0 | 1 | 0.000 | USD |
| 0 | 0 | 0 | 1 | ? | 0 | - | |
| 0 | 0 | 1 | 0 | ? | 0 | - | |
| 0 | 1 | 1 | 0 | ? | 0 | - | |
| 0 | 1 | 1 | 1 | ? | 0 | - | |
| 1 | 1 | 0 | 0 | ? | 0 | - |
NOTE: Countries in bold are members of HIGH_PISA; Configurations for which no cases are observed are denoted?
Table 4.
Truth table for outcome HIGH_PISA.
| HIGH_ GENDER_ EQUALITY | HIGH_ HUMAN_ DEVELOP | HIGH_ INDIVID | Out | n | Cons. | Cases |
|---|---|---|---|---|---|---|
| 0 | 0 | 0 | 1 | 16 | 0.812 | ALB, BRA, BGR, CHL, COL, HRV, DOM, IDN, MEX, PER, ROU, RUS, THA, TUR, URY, VNM |
| 1 | 1 | 1 | 0 | 17 | 0.000 | AUS, AUT, BEL, CAN, DNK, FIN, FRA, DEU, ISL, IRL, LUX, NLD, NZL, NOR, SWE, CHE, GBR |
| 1 | 0 | 1 | 0 | 5 | 0.000 | EST, ITA, LVA, LTU, ESP |
| 0 | 0 | 1 | 0 | 4 | 0.000 | CZE, HUN, POL, SVK |
| 1 | 1 | 0 | 0 | 4 | 0.000 | JPN, SGP, SVN, KOR |
| 1 | 0 | 0 | 0 | 2 | 0.000 | GRC, PRT |
| 0 | 1 | 1 | 0 | 1 | 0.000 | USA |
| 0 | 1 | 1 | ? | 0 | - |
NOTE: Countries in bold are members of LOW PISA; Configurations for which no cases are observed are denoted?
Table 5.
Comparison of means and correlations when grouped by level of gender equality.
| All Countries | High Gender Equality Countries | NOT High Gender Equality Countries | Comparison between Groups | ||||||
|---|---|---|---|---|---|---|---|---|---|
| Number of Tests | Mean (sd) | Correlation with PISA Scores | Mean (sd) | Correlation with PISA Scores | Mean (sd) | Correlation with PISA Scores | Difference Means Cohens D (a) | Difference Correlations Z-Score (b) | |
| PISA scores | 147 | 475.9 (44.6) | - | 502.8 (19.1) | - | 440.2 (43.7) | - | −1.951 *** | - |
| Cumulative expenditure on education ($) | 108 | 90,484 (34,108) | 0.418 *** | 101,136 (30,401) | 0.027 | 58,529 (23,022) | 0.549 ** | 1.481 *** | −2.527 * |
| Student hours in classroom | 135 | 26.8 (1.9) | 0.025 | 26.8 (1.5) | 0.117 | 26.7 (2.5) | −0.028 | 0.041 | 0.799 |
| Class size in language of instruction class | 147 | 27.3 (6.0) | −0.451 *** | 24.8 (3.9) | 0.498 *** | 30.6 (6.7) | −0.426 *** | 1.087 *** | 5.881 *** |
| Public school enrolment rate (%) | 141 | 83.4 (17.0) | 0.075 | 82.4 (18.2) | −0.142 | 84.9 (15.3) | 0.430 *** | 0.147 | −3.459 *** |
| Private expenditure on primary and secondary education (% of total) | 105 | 8.8 (6.1) | −0.444 *** | 7.4 (5.6) | 0.163 | 12.2 (6.0) | −0.820 *** | 0.836 *** | 5.855 *** |
| Teacher salaries ($) | 102 | 36,621 (25,776) | 0.567 *** | 49,094 (23,211) | 0.334 ** | 16,472 (14,570) | 0.243 | −1.602 *** | 0.471 |
| Qualified teachers (%) | 138 | 89.5 (9.2) | 0.483 *** | 91.6 (6.0) | 0.396 *** | 86.3 (12.0) | 0.430 ** | −0.592 ** | −0.229 |
| Teacher professional development in previous 3 months (%) | 147 | 50.6 (16.5) | 0.237 ** | 53.1 (16.5) | 0.300 ** | 47.4 (16.0) | 0.108 | −0.305 * | 1.181 |
| Average years of teacher experience | 93 | 16.6 (2.7) | −0.106 | 16.4 (2.9) | −0.415 *** | 16.8 (2.4) | 0.279 | 0.136 | −3.229 ** |
| Teachers that participated in an induction program (%) | 93 | 47.2 (19.5) | 0.037 | 44.6 (22.2) | 0.324 * | 52.1 (12.2) | 0.164 | 0.389 * | 0.756 |
| Teachers that have a mentor (%) | 93 | 11.4 (9.7) | 0.095 | 11.8 (10.4) | 0.628*** | 10.7 (8.4) | −0.556 *** | −0.118 | 6.052 *** |
| Teacher non-contact hours (% of total) | 87 | 48 (11) | 0.508 *** | 51 (8) | 0.255 | 42 (14) | 0.422 * | −0.871 ** | −0.803 |
Notes: *** p < 0.001; ** p < 0.01; * p < 0.05. (a) Cohen’s D magnitude of the difference between means, Welch two sample t-test for significance of difference, (b) Fisher’s r to z transformation, and comparison of z-scores for the magnitude and significance of difference between correlations.
Table 6.
Summary of policy relationships with PISA scores, moderated by system-specific factors.
| GENDER EQUALITY | HUMAN DEVELOPMENT | INCOME EQUALITY | INDIVIDUALISM | ||
|---|---|---|---|---|---|
| 1 | Cumulative expenditure on education |   |  | | |
| 2 | Student hours in classroom | | |||
| 3 | Class size | | | | |
| 4 | Public-school enrolment | | | | |
| 5 | Private expenditure on education | | | | |
| 6 | Teacher salaries | | | | |
| 7 | Percentage of qualified teachers | | | | |
| 8 | Rate of teacher professional dev. | | | | |
| 9 | Average years of teacher experience | | | ||
| 10 | Percentage teachers received induction | | | | |
| 11 | Percentage teachers with mentor | | | | |
| 12 | Proportion of non-contact hours | | | | |
| Statistically significant difference between group means | |||||
| Statistically significant difference between group correlations | |||||
| Positive correlation in one group; Negative correlation in the other group | |||||
Publisher’s Note: MDPI stays neutral with regard to jurisdictional claims in published maps and institutional affiliations. |
© 2021 by the author. Licensee MDPI, Basel, Switzerland. This article is an open access article distributed under the terms and conditions of the Creative Commons Attribution (CC BY) license (http://creativecommons.org/licenses/by/4.0/).
Share and Cite
MDPI and ACS Style
Campbell, J.A. The Moderating Effect of Gender Equality and Other Factors on PISA and Education Policy. Educ. Sci. 2021, 11, 10. https://0-doi-org.brum.beds.ac.uk/10.3390/educsci11010010
AMA Style
Campbell JA. The Moderating Effect of Gender Equality and Other Factors on PISA and Education Policy. Education Sciences. 2021; 11(1):10. https://0-doi-org.brum.beds.ac.uk/10.3390/educsci11010010
Chicago/Turabian StyleCampbell, Janine Anne. 2021. "The Moderating Effect of Gender Equality and Other Factors on PISA and Education Policy" Education Sciences 11, no. 1: 10. https://0-doi-org.brum.beds.ac.uk/10.3390/educsci11010010
Note that from the first issue of 2016, this journal uses article numbers instead of page numbers. See further details here.