Students’ Perceived Mathematics Teacher Competence: Longitudinal Associations with Learning Outcomes and Choice of College Major


1
Center for Curriculum and Instruction Studies, Korea University, Seoul 02841, Korea
2
Center for Gifted Education, Korea University, Seoul 02841, Korea
*
Author to whom correspondence should be addressed.
Educ. Sci. 2021, 11(1), 18; https://0-doi-org.brum.beds.ac.uk/10.3390/educsci11010018
Submission received: 16 November 2020
/
Revised: 29 December 2020
/
Accepted: 30 December 2020
/
Published: 4 January 2021
(This article belongs to the Special Issue Teachers Matter—Improving Recruitment, Retention and Development of Teachers)
Abstract
:The quality of teaching and teacher plays a significant role in enhancing students’ cognitive and motivational development. The purpose of this study was to identify longitudinal trajectories of student perceptions of mathematics teachers’ professional competence, and to examine how these trajectories were related to students’ engagement and achievement in mathematics and their choice of college major. The data used for analysis were obtained from the Seoul Education Longitudinal Study, a study of 2714 secondary students who were followed up for five successive years. Results showed four heterogeneous trajectories of students’ perceptions of teacher competence, and these trajectories were associated with students’ engagement and achievement in mathematics. In addition, those who consistently perceived their mathematics teachers to be highly competent and whose perceptions of their teachers’ competence became more positive over time were more likely than other students to choose math-intensive majors. These findings imply longitudinal links between mathematics teachers’ professional competence as perceived by their students and students’ choice of college major as well as their engagement and achievement in mathematics.
1. Introduction
Teachers play a significant role in enhancing students’ cognitive and motivational development [1,2]. Consequently, training and assisting high-quality teachers is considered one of the top priorities for educational research and policy making around the world [3]. The definition of a “good” teacher, however, varies across cultures, student ages, and subjects concerned [4,5]. Traditionally, teacher quality has been assessed by teachers’ qualifications, including professional credentials, college degrees, and teacher test scores [6], because it was believed that a teacher’s qualifications were positively correlated with students’ academic success [7]. In contrast, recent studies have provided conflicting evidence regarding the relationship between teachers’ test scores and their students’ academic achievement [8,9,10]. Researchers have sought to conceptualize essential aspects of good teaching in terms of teachers’ personal characteristics (e.g., instructional knowledge and motivation [11]) and teaching quality (e.g., classroom management and learning support [12]) and found positive effects of these aspects on student learning of mathematics [13,14,15].
The quality of teaching and teacher competence is frequently measured by external observers and teachers’ self-reported teaching practices [16,17]. In addition to these measures, there is an extensive body of literature on students’ ratings of their teachers. This body of research has demonstrated that student-rated teaching quality and teacher competence are potential predictors of successful student learning [18,19,20], although some researchers argue that teaching effectiveness should not be measured only by students’ perceptions [21]. However, little is known about how students’ perceptions are associated with their academic outcomes in mathematics. Moreover, most of the previous studies were limited by cross-sectional designs; thus, we know little about how students’ perceptions of their teachers are longitudinally related to their cognitive and motivational outcomes. More importantly, although students’ motivation and achievement in mathematics significantly influence their selections of math-intensive courses and their college major [22,23], there have been few studies on how student-perceived teacher practice is associated with students’ choice of college major. In the current study, we build on and extend the existing literature by identifying distinct longitudinal trajectories of student perceptions of teacher competence and by associating these trajectories with student outcomes and college major choice.
2. Theoretical Background
2.1. Teachers’ Knowledge and Enthusiasm for Teaching
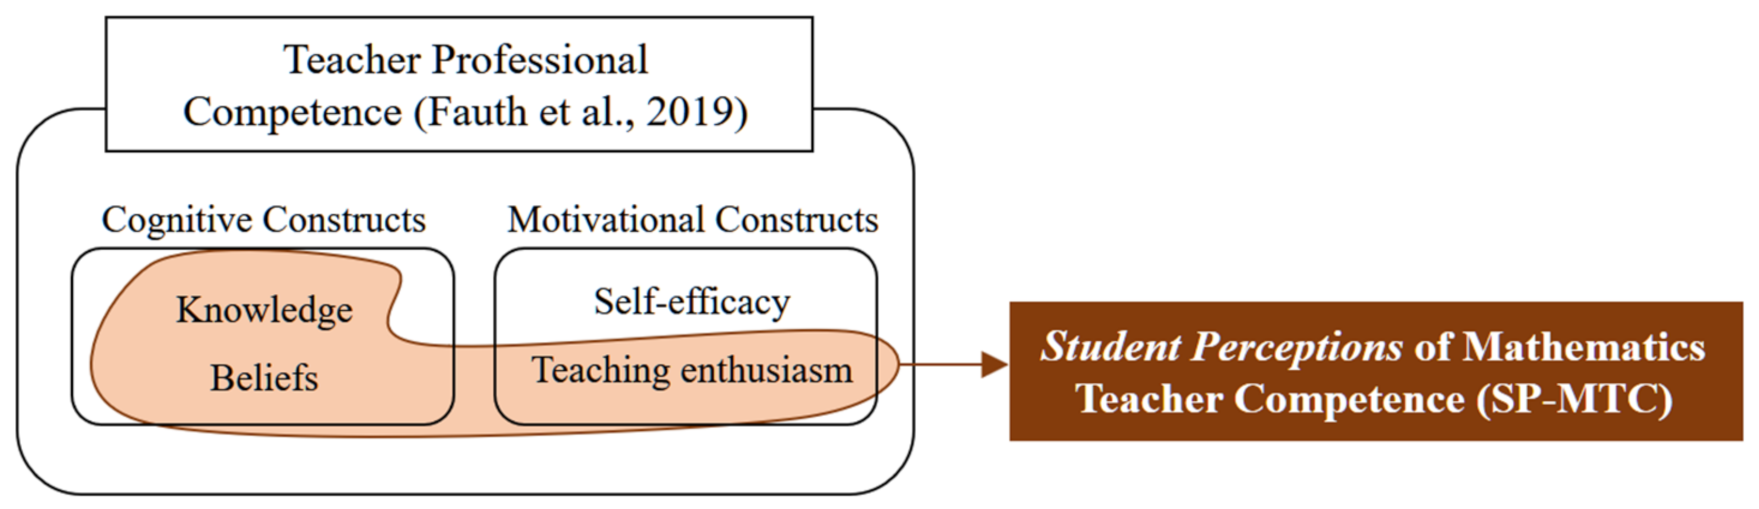
High-quality classroom instruction depends on teacher competence and teaching quality [11,15]. Distinguishing teacher competence from teaching quality, Fauth et al. [11] conceptualized teachers’ professional competence as “teachers’ personal characteristics” (p. 2), which consisted of two basic dimensions: cognitive and motivational. The cognitive dimension of teacher competence comprises teachers’ profession-specific knowledge and beliefs. The motivational dimension of teacher competence includes teachers’ self-efficacy and enthusiasm for teaching. Researchers have provided empirical evidence that these dimensions of teacher competence affect the teaching and learning of mathematics [11,15,17]. Among these subcategories of the construct of teacher professional competence, however, it is difficult to measure students’ perceptions of teachers’ self-efficacy because the construct of self-efficacy, in its nature, is almost invisible by students. Because the purpose of this study is to examine students’ perceptions of mathematics teachers’ competence (SP-MTC), the current study focuses on mathematics teachers’ knowledge, beliefs, and enthusiasm for teaching as aspects of teachers’ professional competence (Figure 1).
2.1.1. Teachers’ Mathematics Knowledge and Beliefs
Knowledge is undoubtedly one of the important indicators of successful mathematics teachers [24,25,26]. Researchers in mathematics education have found that not only teachers’ mathematics content knowledge but also mathematical knowledge for teaching (MKT) and pedagogical content knowledge (PCK) are key factors affecting student outcomes in mathematics. Using two panel datasets, Hill et al. [24] showed that teachers’ MKT positively predicted student achievement in both first and third grades. Baumert et al. [13] also revealed that secondary mathematics teachers’ PCK positively affected students’ learning gains. Teachers’ strong knowledge also led to instruction based on students’ mathematical thinking [27,28]. Dick [29], for example, demonstrated that prospective teachers’ specialized content knowledge led to greater levels of noticing of students’ mathematical thinking. As another cognitive construct of teacher professional competence, teacher beliefs directly influence teachers’ instructional decisions [30]. Bobis, Way, Anderson, and Martin [31] state that mathematics teacher beliefs need to be considered when examining the teaching and learning of mathematics because teachers’ teaching practices are shaped by what they believe about the teaching and learning of mathematics. Research has shown that mathematics teachers who believe their students have the ability to acquire new knowledge and to solve challenging mathematics problems tended to build their instructions on students’ mathematical thinking [32]. However, it was noted that teachers’ knowledge and beliefs are not sufficient for successful mathematics teaching [33]. The ability to motivate students (e.g., teacher enthusiasm for teaching) is another area that attracted many researchers’ attention due to its significant influences on student learning [11].
2.1.2. Mathematics Teachers’ Enthusiasm
Past researchers have developed two main conceptualizations of teacher enthusiasm. Some have considered teacher enthusiasm to be the demonstrated behaviors of teachers in a classroom, which Keller, Hoy, Goetz, and Frenzel [34] called displayed enthusiasm. According to this definition of teacher enthusiasm, enthusiastic teachers are dynamic and energetic (e.g., humorous) and use various non-verbal expressions (e.g., gestures and facial expressions) in order to create a learning environment that encourages students to express their ideas [35]. Others have regarded teacher enthusiasm as a dispositional characteristic or a positive affective experience of teachers while teaching, which Keller et al. called it experienced enthusiasm. In this line of research, Kunter et al. [15] conceptualized teacher enthusiasm as “the degree of enjoyment, excitement, and pleasure that teachers typically experience in their professional activities” and differentiated teacher enthusiasm for teaching from teacher enthusiasm for the subject that they teach (e.g., mathematics, science, etc.). Research showed that teachers’ enthusiasm for teaching mathematics, in contrast to their enthusiasm for mathematics as a subject, was likely to lead to higher instructional quality [11,15,36].
Frenzel et al. [14], for example, found that mathematics teachers’ enjoyment in mathematics classrooms was significantly related to student enjoyment and that teachers’ enthusiasm for teaching mediated the effect of teachers’ enjoyment on student enjoyment. The findings indicated that teachers’ enthusiasm for teaching is important for student motivation in mathematics lessons. Keller et al. [17] revealed that dispositional teacher enthusiasm, measured by teachers’ self-reported positive affect and emotional expressivity, was significantly related to students’ interest. Further analysis showed that the effect of teacher enthusiasm on student interest was mediated by student ratings of teacher enthusiasm, indicating that teacher enthusiasm was only effective in stimulating students’ interest in learning when the students actually perceived it [36].
2.2. Student Ratings of Teacher Quality
In the research on teaching quality, there is much discussion on the evaluation of teaching practices. Fraser and Walberg [37] stated that students’ joint ratings of teaching practices, when based on long experience with the teacher, are more predictive of students’ achievement than external observers’ evaluations. Student ratings of instruction are, therefore, usually considered a useful measure of teaching quality, especially in higher education [19]. Patrick et al. [20], for example, revealed that student-rated instructor enthusiasm was a significant predictor of undergraduate students’ intrinsic motivation. In contrast, ratings of secondary school students [18], as well as elementary school students [38], have been neglected in evaluating teachers’ instructional quality due to bias in student ratings based on teacher popularity [15].
However, researchers argue that secondary students’ perceptions of teaching quality can provide valid information on the different dimensions of instructional practices [39]. Furthermore, in a longitudinal study, Fauth et al. [38] found that elementary students’ ratings of teachers’ classroom management skills predicted their academic achievement and that their ratings of teachers’ cognitive activation and supportive climate predicted their interest in subjects even after the teacher popularity was controlled. These findings indicate that, even at the elementary level, student-rated teaching practices can be used as a useful measure of teacher quality, and they should therefore be taken into account when evaluating teacher effectiveness [18].
2.3. Course and Major Choice
Students’ choices of courses and majors are important steps toward their future career. Researchers in the field of education have identified significant predictors affecting students’ course and college major choices [22,23,40,41]. Based on the expectancy-value theory, Simpkins et al. [22] found that elementary school students’ beliefs, measured by their assessment of their ability, interest, and perceived importance of mathematics, predicted the number of mathematics courses that they took in high school. Musu-Gillette et al. [40] found that students who presented consistently high levels of confidence in their ability in mathematics were more likely to choose mathematics-related college majors than others who had lower confidence in their ability. Similar patterns were observed in terms of students’ interest and the perceived importance of mathematics [40].
Using a longitudinal non-parametric analysis, Ahmed [23] showed that students who presented consistently low levels of mathematics anxiety were much more likely to be employed in Science, Technology, Engineering, and Mathematics (STEM) careers than those presenting consistently high or increasing levels of anxiety over time. This finding indicated that students’ experiences with mathematics anxiety may lead them to avoid mathematics-related careers and activities in their future. Fewer studies, however, have addressed how students’ perceptions of teacher practices affected their academic choice. Shih et al. [41], for example, found that secondary students’ perceptions of being invited or encouraged to participate in learning by their mathematics teachers indirectly affected their desire to engage in mathematics in the future (i.e., math-related course taking and future career), which was mediated by students’ self-concept related to their mathematics ability.
In summary, the prior research has shown that teachers’ professional competence significantly affects students’ learning of mathematics [11,15,17]. However, secondary school students’ perceptions of their teachers’ practices, compared to college students’ perceptions, have been neglected [11,15,18]. In addition, the literature on students’ academic choices has tended to focus mostly on students’ concepts of their own ability based on the expectancy-value theory [22,23,40]. To our knowledge, no research has addressed how SP-MTC is longitudinally related to their learning engagement and achievement and their choice of college major. The current study, therefore, addresses three research questions: (a) What are the distinct longitudinal trajectories of SP-MTC? (b) How are the longitudinal trajectories of SP-MTC related to students’ mathematics achievement and engagement in mathematics? (c) Are longitudinal trajectories of SP-MTC predictive of students’ choice of college major?
3. Methods
3.1. Participants and Setting
The current study used data drawn from the Seoul Education Longitudinal Study (SELS) in Korea. The SELS study was initiated to systematically investigate various factors of education, to deal with educational issues, and to help establish effective education policies and long-term plans. Because the purpose of this study was to identify longitudinal trajectories of SP-MTC, we collected five-year longitudinal data from the beginning of eighth grade to the end of twelfth grade (from 2014 to 2018). For each year, students completed a set of SELS questionnaires and took achievement tests in mathematics. Those who missed the questionnaires for more than three years were excluded from our analysis. Data from 2714 students (about 47.6% females and 52.4% males) were finally included in this study.
3.2. Measures
3.2.1. Teacher Knowledge, Beliefs, and Enthusiasm for Teaching
In the SELS questionnaire, students were asked to rate their mathematics teachers’ professional competence related to teachers’ knowledge, beliefs, and enthusiasm for teaching. Mathematics teachers’ professional competence perceived by students was measured with seven items (sample items: “My math teacher is enthusiastic about teaching mathematics”, “My teacher has a high level of knowledge in mathematics”, and “My teacher believes that students will achieve high achievement in mathematics”). All items were rated on a five-point Likert-type scale (See Appendix A). Inter-reliabilities among the items for each grade were excellent ( from 8th to 12th grade). Therefore, the average of the seven items was used to indicate students’ ratings of their mathematics teachers’ competence.
3.2.2. Student Engagement in Mathematics Classes
Students’ engagement in mathematics classes was measured using five items (sample items: “I concentrate in math class” and “I actively participate in math class”). Students’ perceptions of their levels of engagement in mathematics classes were also rated on a five-point Likert-type scale (See Appendix B). Inter-reliabilities among the five items were good ( from 8th to 12th grade). Missing values were replaced using the expectation maximization (EM) technique.
3.2.3. Student Mathematics Achievement
Students’ mathematics achievement was measured by their scores on a standardized mathematics test (approximately 30 multiple-choice items) conducted by the SELS every year. In order to examine the extent to which a student has achieved the educational goals of school mathematics, the standardized test asks students if they know basic knowledge of school mathematics. The test is also used to identify and diagnose at-risk students in mathematics. In the current study, the EM algorithm was used to impute missing mathematics test scores. The SELS used vertical scaling, which placed scores from five different tests on the same scale in order to control for any differences in test difficulty. Vertical scaling, therefore, can facilitate the estimation of a student’s or a panel’s growth over time (see Table 1).
3.2.4. College Major Choice
Grade 12 students in 2018 were asked, “Which major do you want to study in college?” The SELS coded college majors into nine categories (1 = Humanities, 2 = Social Sciences, 3 = Math and Science, 4 = Technology and Engineering, 5 = Medicine and Pharmacy, 6 = Education, 7 = Art and Athletics, 8 = Police and Military, and 9 = Others). We collapsed three categories, Math/Science, Technology/Engineering, and Medicine/Pharmacy, into a single category, Math Intensive Major, and the other six categories into Non Math Intensive Major (i.e., Humanities, Social Science, Education, Art/Athletics, Police/Military, and Others). Note that the category others includes students whose college majors did not fall into the eight categories or who did not plan to go to college.
3.3. Data Analysis
We used a longitudinal, non-parametric approach, K-means for longitudinal data (KmL), to identify clusters with a similar longitudinal pattern regarding student perceptions of teacher competence. KmL, suggested by Genolini and Falissard [42], is a variant of the K-means algorithm, designed to take into account longitudinal data. Researchers in education have used KmL analysis to identify distinct longitudinal trajectories of students’ course-taking [43], math anxiety [23], and forum participation in a Massive Open Online Course (MOOC) [44].
The KmL approach is an iterative process: (a) once the number of clusters is predefined by researchers, each observation (In the KML algorithm, the ith observation’s trajectory regarding the y variable is denoted by , where t indicates time.) is initially assigned to a cluster; (b) the centers of each cluster (called centroids) are automatically computed; (c) each observation is reassigned to its nearest cluster based on distances (In the present study, we used the Euclidean distance, denoted by .) between the observation and different centroids; and (d) the procedure is repeated until no further changes happen [42,45]. R package KmL was used to perform the KmL analysis. To select the optimal number of clusters, we compared three non-parametric criteria (Calinski Harabatz (CH), Ray and Turi (RT), and Davies and Boudin (DB)) that were provided by the package, because there is no single criterion that helps to choose the best number of clusters [42,43,45]. Because the KmL is able to deal with intermittent missing values in longitudinal data [42], cases with missing values at more than three time points were excluded from the analysis. After the longitudinal clusters regarding SP-MTC were identified, we performed linear mixed model analyses with student engagement and achievement in mathematics as outcome variables in order to examine how the longitudinal clusters were related to the outcome variables. The R package lmerTest was used to conduct the linear mixed model analysis. Finally, binary logistic regression was conducted to explore the contribution of the longitudinal clusters in predicting math-intensive major choice.
4. Results
4.1. Trajectories of SP-MTC
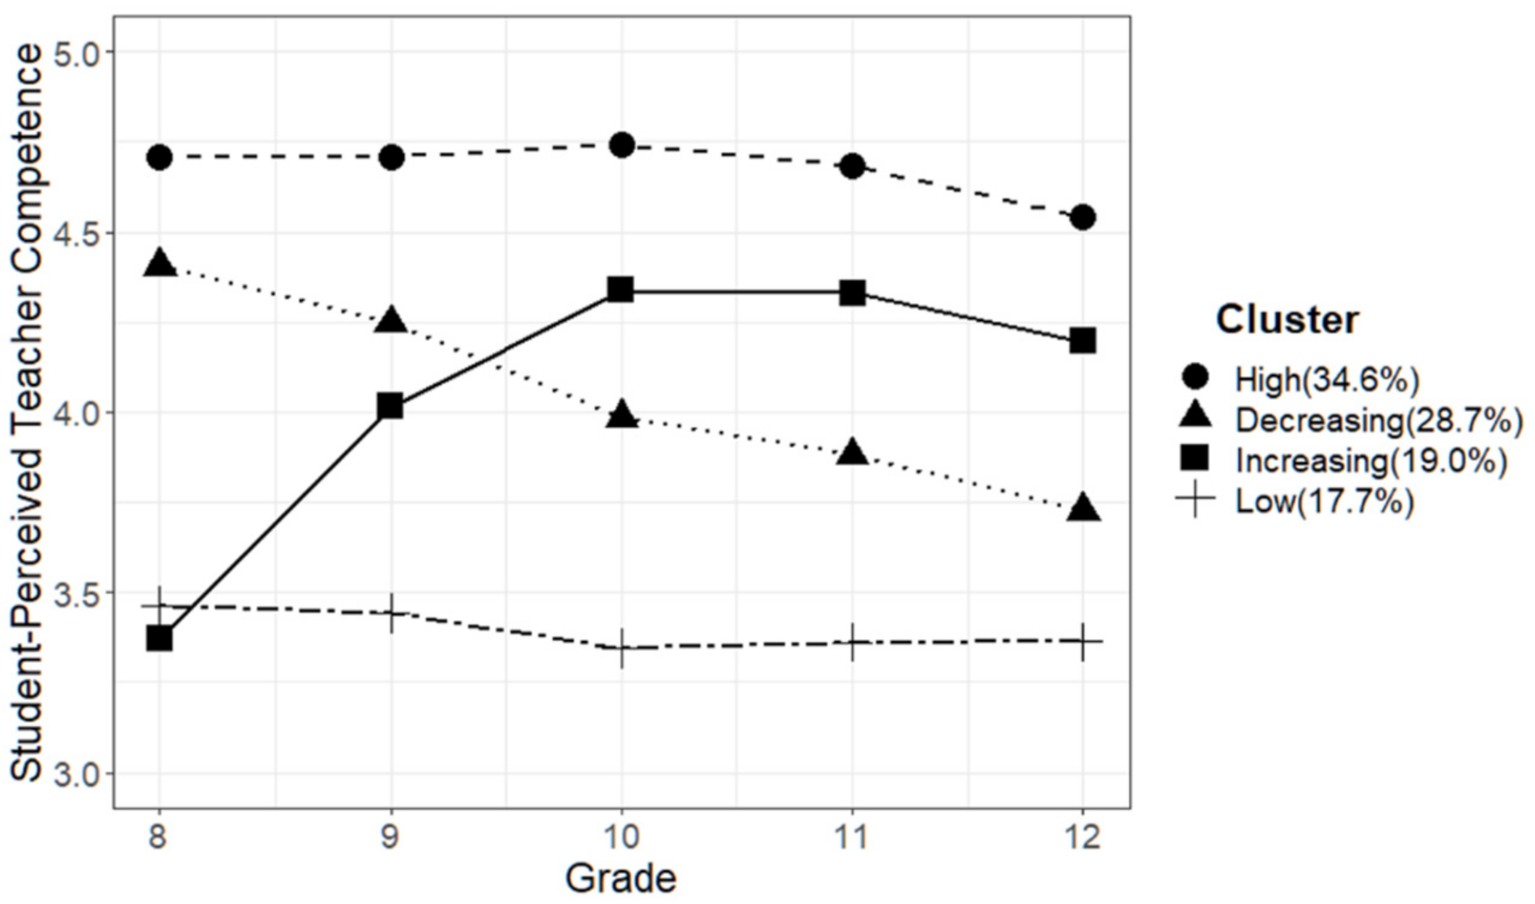
We first used the KmL approach to test different models with three to six clusters. The CH criterion favored three clusters followed by four clusters, while the RT criterion favored four clusters followed by three clusters. Finally, the DB criterion favored four clusters followed by five clusters. Based on these criteria, we selected four clusters as the optimal number of clusters. The four trajectories of SP-MTC are illustrated in Figure 2. These four clusters are labeled: high (34.6%), decreasing (28.7%), increasing (19.0%), and low (17.7%), based on their patterns over time. Students in the high and low clusters were likely to rate their mathematics teachers’ professional competence as consistently higher and lower than did those in the increasing and decreasing clusters, respectively. Students’ ratings in both the decreasing and the increasing clusters significantly changed their perceptions of teacher competence over time. Overall, students in the increasing cluster presented the opposite trajectory to those in the decreasing cluster.
The means and standard deviations (in parenthesis) of SP-MTC are shown in Table 2.
4.2. Relationship between SP-MTC and Student Learning
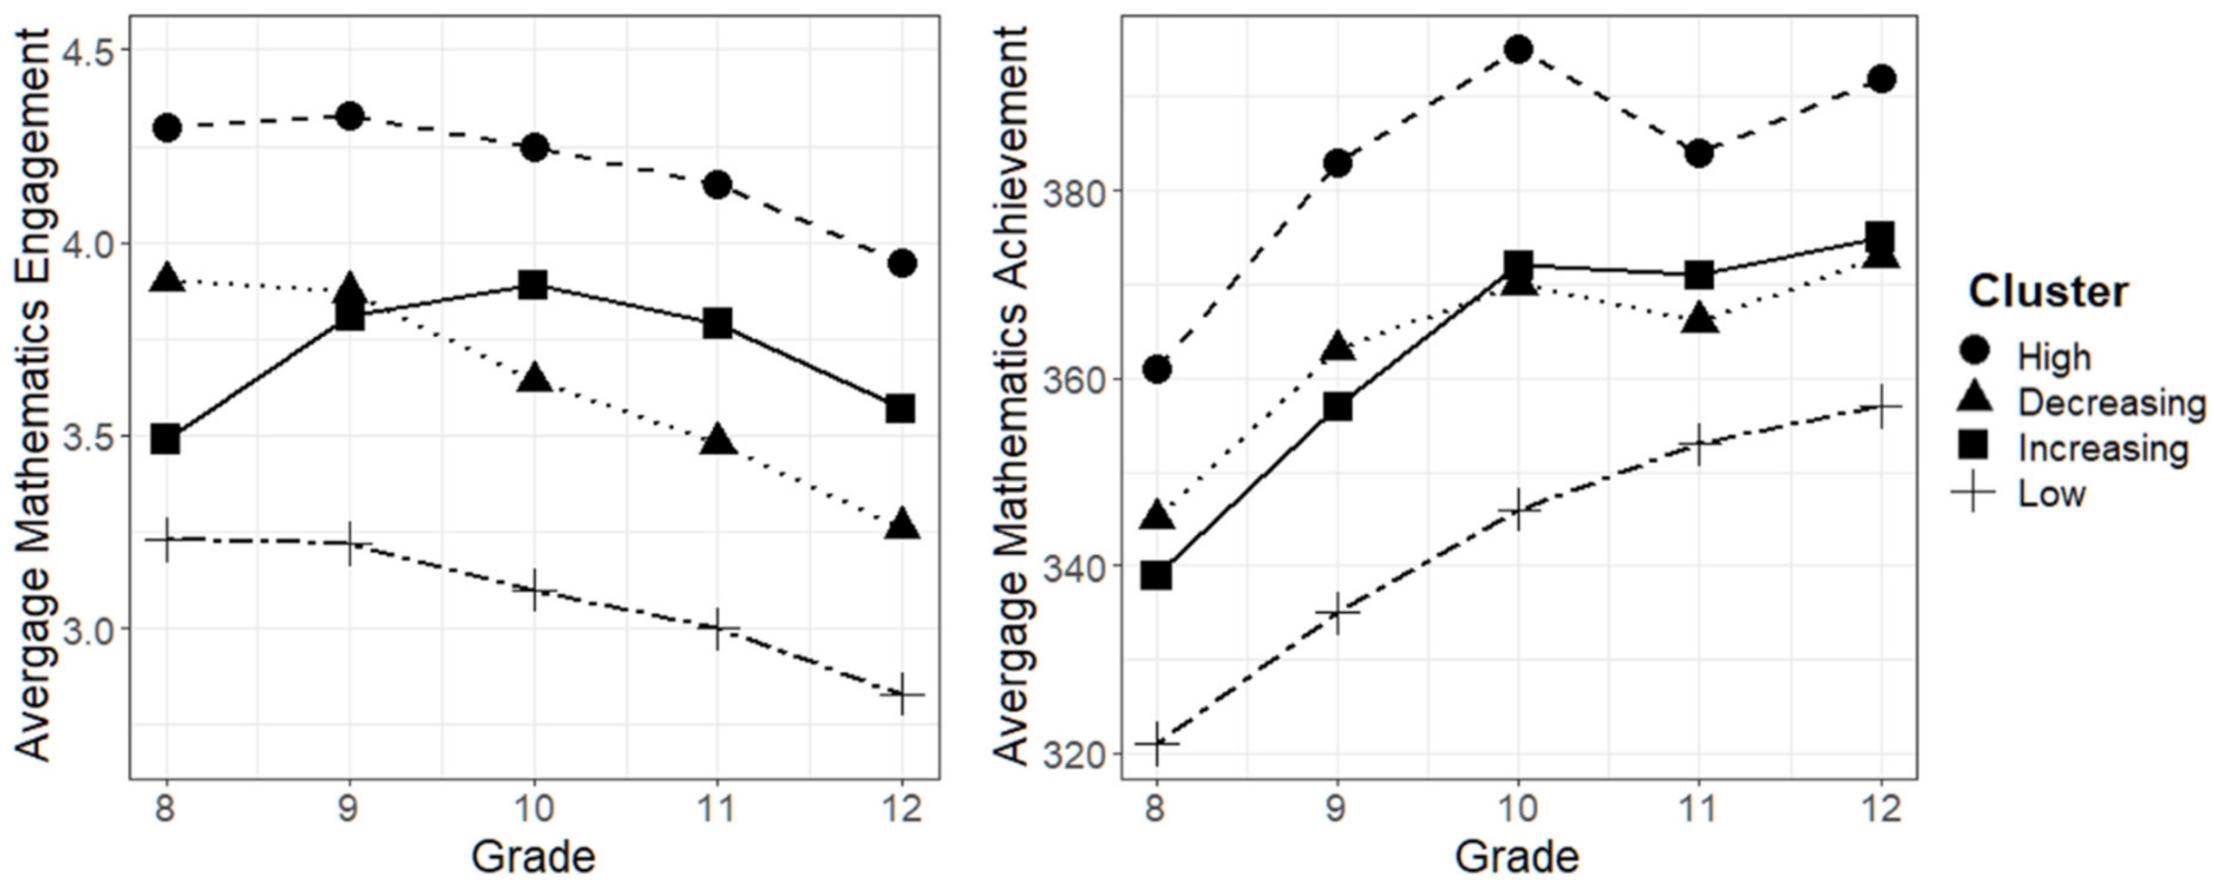
Using the four clusters identified, we examined if SP-MTC was associated with students’ engagement and achievement in mathematics. First, we drew lines to connect annual mean scores in students’ levels of engagement and achievement in mathematics and analyzed the differences among the four clusters over five years (see Figure 3).
As reported in the previous research, students’ engagement in mathematics tended to decrease [46], whereas their achievement in mathematics was likely to increase over time. However, trends in students’ engagement and achievement in mathematics among the four clusters showed a similar tendency to the changes in their perceptions of teacher competence during the five years. In general, the differences in engagement and achievement among the four clusters were bigger, but there was a minor difference in mathematics achievement between students in the decreasing and increasing clusters. To examine whether the differences are statistically significant, we conducted linear mixed model analyses. The equation of the model is as follows:
where is either mathematics engagement or mathematics achievement for a student at grade that is centered around 0, and the intercept refers to the decreasing cluster at the start of this study. We entered individual students as a random factor to account for within-student dependence and incorporated cluster, grade, and interaction into the models to understand patterns in different clusters’ mathematics engagement and achievement during the five years. The results of the linear mixed model analyses are detailed in Table 3 and Figure 3.
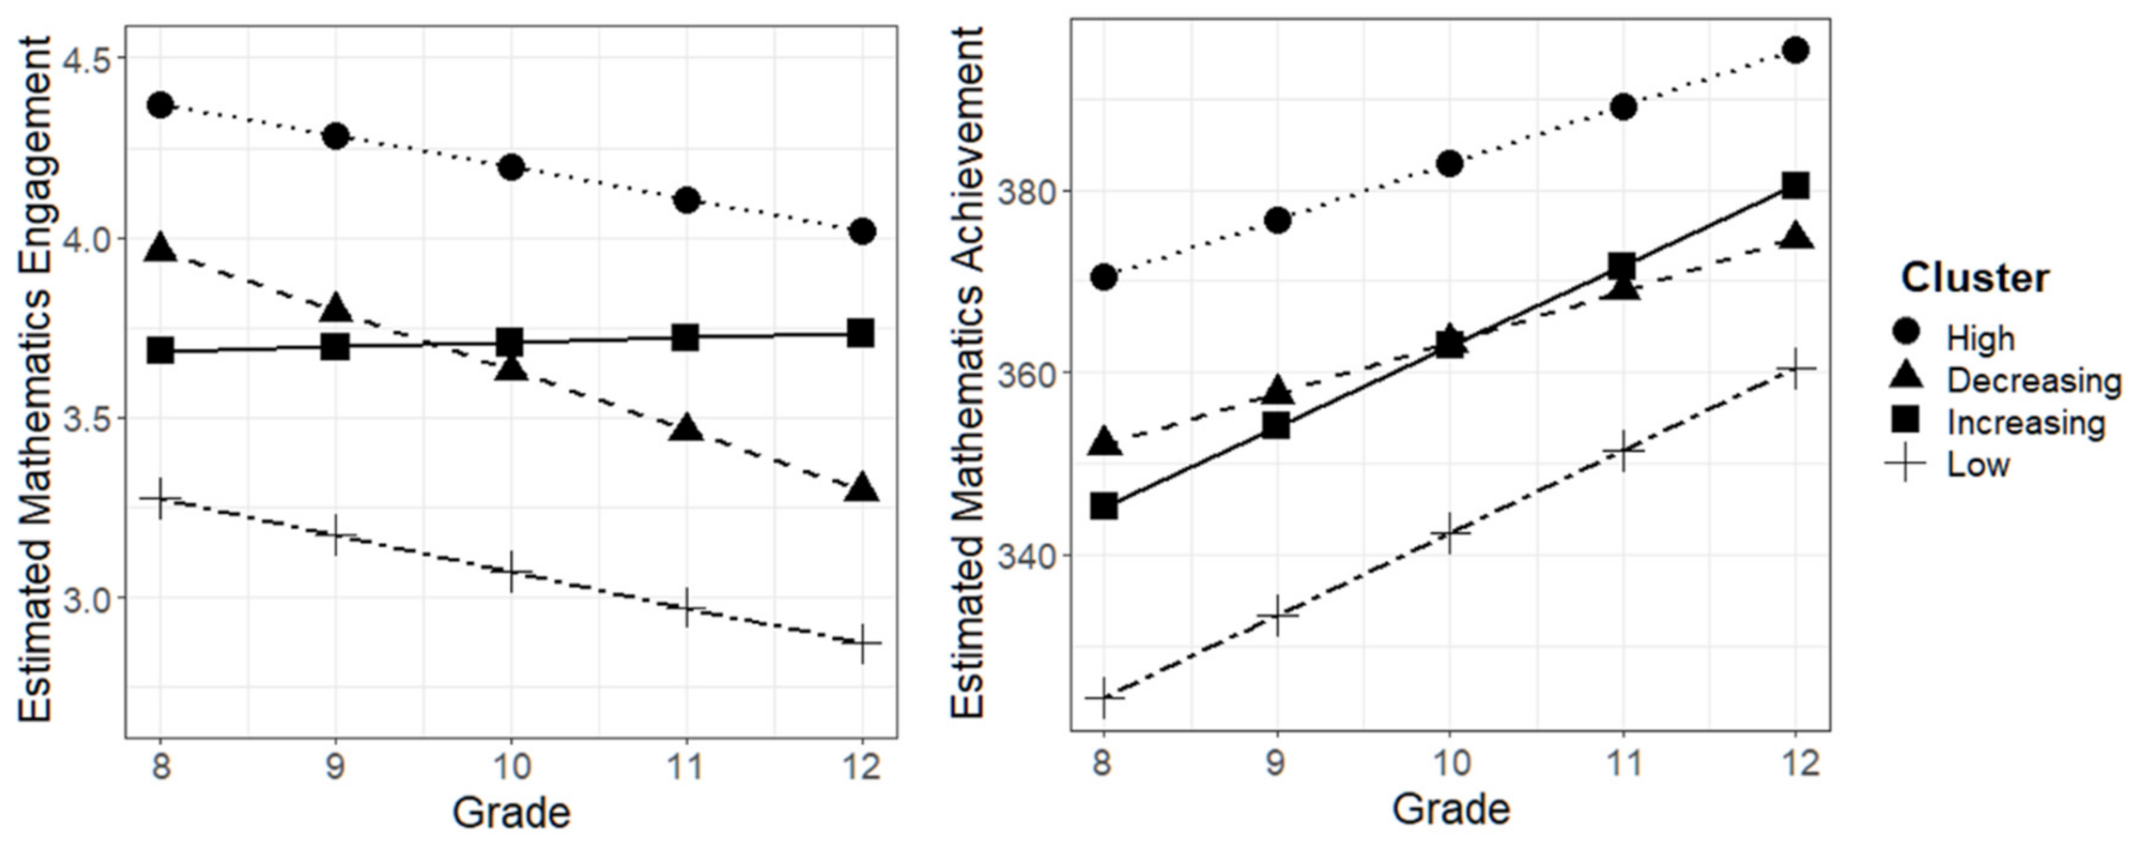
Model 1 in Table 3 suggests that, when students’ initial level of engagement in mathematics (i.e., Grade 8) was compared using the decreasing cluster as a reference group, a significantly higher engagement level was observed for the high cluster, while significantly lower engagement levels were observed for the increasing and the low clusters. The engagement of students in the increasing cluster slightly increased over time, while that of students in the decreasing cluster was significantly decreased over time (, ). Interestingly, it was found that the engagement in mathematics of students in the high cluster decreased as they advanced from one year to the next. There were significant interactions between cluster and grade such that students’ engagement significantly decreased for the decreasing cluster in comparison with the high, increasing, and low clusters over time. As seen in Figure 4, the engagement of students in the increasing cluster has been higher than that of students in the decreasing cluster since Grade 10. The statistical significances of the linear mixed model analyses for achievement in mathematics (i.e., Model 2 in Table 3) were generally similar to those for mathematics engagement (i.e., Model 1 in Table 3). The initial level of mathematics achievement in the decreasing cluster was higher than that in the increasing cluster (, ), but a significant increase was observed in the increasing cluster in comparison with the decreasing cluster even though students’ mathematics achievement in the two clusters increased with advancement to the next grade.
4.3. Relationship between SP-MTC and Math-intensive Major Choice
To examine the contribution of the longitudinal clusters in predicting students’ math-intensive college major choice, we performed binary logistic regression. As indicated in the unadjusted model (see Model 1 in Table 4), the high, increasing, and decreasing clusters were significantly different from the low cluster (reference group) in predicting students’ math-intensive major choice. Students in the high, increasing, and decreasing clusters were about 2.58, 1.94, and 1.50 times as likely to choose math-intensive majors as those in the low cluster, respectively. The results of the adjusted model in which gender was taken into account (see Model 2 in Table 4) were almost same as those of the unadjusted model. With regard to gender, male students were more likely than female students to choose math-intensive majors in college. We further fitted a logistic regression model on college major choice using the decreasing cluster as a reference group and found significant difference in math-intensive major choice between the decreasing and the increasing clusters. The odds of choosing a math-intensive major were about 1.3 times higher in the increasing cluster than in the decreasing cluster.
5. Discussion
Considering the importance of teachers to student development, the present study explored changes in SP-MTC over five years. We identified four distinct trajectories of SP-MTC and found that the trajectories of change were associated with students’ academic outcomes (i.e., engagement and achievement in mathematics) as well as their choice of a math-intensive college major. These findings suggest the construct of SP-MTC, consisting of student-perceived mathematics teacher knowledge, beliefs, and enthusiasm for teaching is a critical factor for students’ learning and future careers.
5.1. Mathematics Teachers Matter for Students’ Learning and College Major Choice
The current study found a significant relationship between SP-MTC and students’ engagement in mathematics classes. Moreover, significant differences in students’ engagement among the four clusters were found, which resonates with previous research that identified distinct profiles of students’ engagement based on teaching practices [47]. This finding indicates that students might be engaged in mathematics classes because they actually perceive their mathematics teachers to be highly enthusiastic, which extends a one-year cross-sectional study [14,17,36] by providing longitudinal links between perceived teacher competence and students’ engagement in learning mathematics.
Our study also found a positive relationship between SP-MTC and students’ mathematics achievement, which may indicate that the higher students’ ratings of teacher knowledge, beliefs, and enthusiasm are, the more likely it is that they will perform well on mathematics tests. This suggests that SP-MTC can be considered one of the core factors predicting students’ achievement in mathematics [18,38,39]. However, this finding contrasts with prior research showing that teachers’ professional competence predicts students’ interest but not their achievement [11]. These inconsistent findings could be explained by differences in measurement methods between the studies. Fauth et al. [11] measured teacher knowledge with a standardized test and teacher beliefs and enthusiasm with teachers’ self-reports, whereas the current study measured them with students’ reports of teacher knowledge, beliefs, and enthusiasm. Consistent with the findings of Keller et al. [17], this indicates that teachers’ knowledge, beliefs, and enthusiasm are important components of teachers’ professional competence, but, more importantly, these components must be perceived by students to have an impact on student achievement in a subject.
We also investigated the contributions of developmental trajectories of SP-MTC to students’ choice of a math-intensive major in college. Perhaps unsurprisingly, students in the high cluster wanted to study a math-intensive major, whereas students in the low cluster were more likely to avoid such a major. This finding is consistent with previous studies [22,41,48,49] and extends prior research [40] by showing that distinct trajectories of change in SP-MTC were differentially associated with students’ choice of a math-related major. There was also a significant difference in college major choice between the increasing and decreasing cluster; that is, students in the increasing cluster were more likely than those in the decreasing cluster to choose math-intensive majors. As discussed earlier, engagement and achievement of students in the decreasing cluster were higher than those in the increasing cluster at Grade 8 and then became similar at Grade 9. Significant changes in students’ engagement and achievement were observed between Grade 9 and Grade 10, which is the transition year from middle school to high school in South Korea; engagement and achievement of students in the increasing cluster were higher than those in the decreasing cluster from Grade 10 (see Figure 3). This finding suggests that, for students in either the increasing or decreasing cluster, the transition to high school was a critical period for selecting their college majors, which is in line with prior studies that found that 9th grade students’ perceptions of mathematics predicted their desire for math-related future careers [50].
On the contrary, several studies demonstrated different results. Li, Alfeld, Kennedy, and Putallaz [51], for example, revealed that students’ interest in mathematics in middle school has a long-term impact on their college major choice. Researchers have also argued that the early student years (before 7th grade) are important for students’ academic plans and choices in their future [22,48,52]. In this regard, the findings in the current study provide new insight into students’ career choices by helping to predict which students are likely to choose a math-intensive major. For half of the students who consistently rated their mathematics teachers’ professional competence as high (about 34.6%) or low (about 17.7%), it is likely that their early student years were a critical time to determine their math-intensive college majors and future careers because patterns of change in their perceptions (and also their engagement and achievement in mathematics) were consistent from the beginning of middle school (i.e., Grade 8). However, for the other half of the students who showed substantial changes in their perceptions as they advanced from one year to the next (i.e., the increasing and decreasing cluster), it is likely that the transition to high school was an important year for their future academic choice because significant changes occurred in their engagement and achievement in mathematics at that time. The findings of this study extend previous studies that reported an important time point for determining students’ future career and college major [22,48,50,51,52] by showing that there is no single critical time point for students’ math-intensive college major choice; rather, it depends on their perceptions of teacher competence and their learning.
Taken together, our results indicate that mathematics teachers matter, not only for their students’ learning, but also for their future career. Previous studies have consistently provided evidence that mathematics teachers’ knowledge is one of the most important factors for student learning [53]. In the current study, the SELS did not measure teachers’ knowledge, beliefs, and enthusiasm by using a standardized test, nor by observing their teaching practices, and thus we do not know whether or not the teachers were actually competent. Regardless of the teachers’ actual knowledge, beliefs, and enthusiasm for teaching, however, students’ learning could be maximized if they feel their teachers are professionally competent. As seen previously, SP-MTC among different clusters has hardly changed since the students became high school students (i.e., Grade 10). In conclusion, mathematics teachers need to identify how students perceive their teaching practices early in middle school, and additional attention (e.g., changing their teaching methods, instructional materials, or interaction with students) should be given, especially to students who were likely to rate their mathematics teachers’ competence as consistently or gradually low (i.e., students in the low and decreasing cluster), in order to prevent them from giving up learning mathematics in high school.
5.2. Limitations and Recommendations for Future Research
There were several limitations to this study, mostly due to the nature of longitudinal studies. First, the participants in the current study were not a nationally representative sample of students but were a sample from a metropolitan city, Seoul, where there is a highly competitive educational culture. Second, some data were initially excluded from our analysis, especially because they were not followed up during high school (i.e., Grade 10 to 12). This might lead to a potential underestimation of the influence of SP-MTC on students’ academic outcomes and choice of major. Third, although previous studies demonstrated that students’ individual characteristics and their previous attainment significantly affect their math-intensive major choices as well as their engagement and achievement in mathematics [36,54,55], the present study did not take those characteristics into account, except for gender. Because of these missing variables, it will be difficult to attribute students’ mathematics achievement and engagement to SP-MTC alone. Future research is needed to examine how these variables are associated with SP-MTC and students’ learning outcomes. Lastly, the findings in the study do not denote a causal relationships between SP-MTC and students’ learning and future careers. For example, high-achieving students in mathematics may tend to have positive perceptions of their teachers. Future studies, therefore, may examine how SP-MTC affects students’ learning outcomes and their choice of college major. Despite these limitations, the current study contributes to the field of student development by identifying distinct trajectories of SP-MTC and by showing that the heterogeneous trajectories are associated, not only with students’ academic success, but also with the direction of their future studies.
Author Contributions
Conceptualization, D.S.; methodology, D.S.; software, J.S.; validation, J.S. and D.S.; formal analysis, J.S. and D.S.; investigation, D.S.; data curation, D.S.; writing—original draft preparation, D.S.; writing—review and editing, J.S. and D.S.; visualization, D.S. All authors have read and agreed to the published version of the manuscript.
Funding
This research received no external funding.
Institutional Review Board Statement
Ethical review and approval were waived for this study, due to the data came from Seoul Education Longitudinal Study (SELS) and are publicly available for educational research. This means that the SELS collected the data and obtained informed content and then provided researchers to use them publicly.
Informed Consent Statement
Informed consent was obtained from all subjects involved in the study.
Data Availability Statement
Publicly available datasets were analyzed in this study. This data can be found here: https://www.serii.re.kr/.
Conflicts of Interest
The authors declare no conflict of interest.
Appendix A

Table A1.
What Do You Think about Your Math Teacher?
| Item | Strongly Disagree | Disagree | Neutral | Agree | Strongly Agree | |
|---|---|---|---|---|---|---|
| 1 | My teacher is enthusiastic about teaching math. | |||||
| 2 | My teacher has a high level of knowledge in math. | |||||
| 3 | My teacher teaches math well so that we can understand it easily. | |||||
| 4 | My teacher expects us to study hard. | |||||
| 5 | My teacher believes that we will achieve high achievement in math. | |||||
| 6 | My teacher conscientiously checks our math assignments. | |||||
| 7 | My teacher monitors how well students understand math in class. |
Appendix B
Table A2.
How Much Do You Engage in Math Class?
| Item | Strongly Disagree | Disagree | Neutral | Agree | Strongly Agree | |
|---|---|---|---|---|---|---|
| 1 | I concentrate in math class. | |||||
| 2 | I actively participate in math class. | |||||
| 3 | I do my math homework conscientiously. | |||||
| 4 | I review what I have learned in math class. | |||||
| 5 | I prepare what I will learn in math class. |
References
- Hanushek, E. Valuing teachers: How much is a good teacher worth? Educ. Next 2011, 11, 40–45. [Google Scholar]
- Rivkin, S.G.; Hanushek, E.A.; Kain, J.F. Teachers, schools, and academic achievement. Econometrica 2005, 73, 417–458. [Google Scholar] [CrossRef]
- Darling-Hammond, L. Teacher education around the world: What can we learn from international practice? Eur. J. Teach. Educ. 2017, 40, 291–309. [Google Scholar] [CrossRef]
- Lee, H.H.; Kim, G.M.L.; Chan, L.L. Good teaching: What matters to university students. Asia-Pacific J. Educ. 2015, 35, 98–110. [Google Scholar] [CrossRef]
- Burnett, P.C.; Meacham, D. Measuring the quality of teaching in elementary school classrooms. Asia Pac. J. Teach. Educ. 2002, 30, 141–153. [Google Scholar] [CrossRef]
- Goe, L. The Link between Teacher Quality and Student Outcomes: A Research Synthesis. Available online: https://files.eric.ed.gov/fulltext/ED521219.pdf (accessed on 9 November 2020).
- Clotfelter, C.T.; Ladd, H.F.; Vigdor, J.L. Teacher Credentials and Student Achievement in High School: A Cross-Subject Analysis with Student Fixed Effects. Available online: https://www.nber.org/system/files/working_papers/w13617/w13617.pdf (accessed on 9 November 2020).
- Aloe, A.M.; Becker, B.J. Teacher verbal ability and school outcomes. Educ. Res. 2009, 38, 612–624. [Google Scholar] [CrossRef]
- Kunter, M.; Klusmann, U.; Baumert, J.; Richter, D.; Voss, T.; Hachfeld, A. Professional competence of teachers: Effects on instructional quality and student development. J. Educ. Psychol. 2013, 105, 805–820. [Google Scholar] [CrossRef]
- Rockoff, J.; Jacob, B.; Kane, T.; Staiger, D. Can you recognize an effective teacher when you recruit one? Educ. Finance Policy 2011, 6, 43–74. [Google Scholar] [CrossRef] [Green Version]
- Fauth, B.; Decristan, J.; Decker, A.T.; Büttner, G.; Hardy, I.; Klieme, E.; Kunter, M. The effects of teacher competence on student outcomes in elementary science education: The mediating role of teaching quality. Teach. Teach. Educ. 2019, 86, 102882. [Google Scholar] [CrossRef]
- Rimm-Kaufman, S.; Hamre, B. The role of psychological and developmental science in efforts to improve teacher quality. Teach. Coll. Rec. 2010, 112, 2988–3023. [Google Scholar]
- Baumert, J.; Kunter, M.; Blum, W.; Brunner, M.; Voss, T.; Jordan, A.; Klusmann, U.; Krauss, S.; Neubrand, M.; Tsai, Y.M. Teachers’ mathematical knowledge, cognitive activation in the classroom, and student progress. Am. Educ. Res. J. 2010, 47, 133–180. [Google Scholar] [CrossRef] [Green Version]
- Frenzel, A.C.; Goetz, T.; Lüdtke, O.; Pekrun, R.; Sutton, R. Emotional transmission in the classroom: Exploring the relationship between teacher and student enjoyment. J. Educ. Psychol. 2009, 101, 705–716. [Google Scholar] [CrossRef] [Green Version]
- Kunter, M.; Tsai, Y.M.; Klusmann, U.; Brunner, M.; Krauss, S.; Baumert, J. Students’ and mathematics teachers’ perceptions of teacher enthusiasm and instruction. Learn. Instr. 2008, 18, 468–482. [Google Scholar] [CrossRef]
- De Jong, R.; Westerhof, K.J. The quality of student ratings of teacher behaviour. Learn. Environ. Res. 2001, 4, 51–85. [Google Scholar] [CrossRef]
- Keller, M.M.; Goetz, T.; Becker, E.S.; Morger, V.; Hensley, L. Feeling and showing: A new conceptualization of dispositional teacher enthusiasm and its relation to students’ interest. Learn. Instr. 2014, 33, 29–38. [Google Scholar] [CrossRef] [Green Version]
- Ampadu, E. Students’ perceptions of their teachers’ teaching of mathematics: The case of Ghana. Int. Online. J. Educ. Sci. 2012, 4, 351–358. [Google Scholar]
- Feldman, K.A. Identifying exemplary teachers and teaching: Evidence from student ratings. In The Scholarship of Teaching and Learning in Higher Education: An Evidence-Based Perspective; Perry, R., Smart, J., Eds.; Springer: Dordrecht, The Netherlands, 2007; pp. 93–129. ISBN 978-1-4020-4944-6. [Google Scholar]
- Patrick, B.C.; Hisley, J.; Kempler, T. “What’s everybody so excited about?”: The effects of teacher enthusiasm on student intrinsic motivation and vitality. J. Exp. Educ. 2000, 68, 217–236. [Google Scholar] [CrossRef]
- Crumbley, L.; Henry, B.K.; Kratchman, S.H. Students’ perceptions of the evaluation of college teaching. Quality assurance in Education. Qual. Assur. Educ. 2001, 9, 197–207. [Google Scholar] [CrossRef]
- Simpkins, S.D.; Davis-Kean, P.E.; Eccles, J.S. Math and science motivation: A longitudinal examination of the links between choices and beliefs. Dev. Psychol. 2006, 42, 70–83. [Google Scholar] [CrossRef]
- Ahmed, W. Developmental trajectories of math anxiety during adolescence: Associations with STEM career choice. J. Adolesc. 2018, 67, 158–166. [Google Scholar] [CrossRef]
- Hill, H.C.; Blunk, M.L.; Charalambous, C.Y.; Lewis, J.M.; Phelps, G.C.; Sleep, L.; Ball, D.L. Mathematical knowledge for teaching and the mathematical quality of instruction: An exploratory study. Cogn. Instr. 2008, 26, 430–511. [Google Scholar] [CrossRef] [Green Version]
- Tchoshanov, M.A. Relationship between teacher knowledge of concepts and connections, teaching practice, and student achievement in middle grades mathematics. Educ. Stud. Math. 2011, 76, 141–164. [Google Scholar] [CrossRef]
- Walshaw, M. Teacher knowledge as fundamental to effective teaching practice. J. Math. Teach. Educ. 2012, 15, 181–185. [Google Scholar] [CrossRef] [Green Version]
- Dreher, A.; Kuntze, S. Teachers’ professional knowledge and noticing: The case of multiple representations in the mathematics classroom. Educ. Stud. Math. 2015, 88, 89–114. [Google Scholar] [CrossRef]
- König, J.; Blömeke, S.; Klein, P.; Suhl, U.; Busse, A.; Kaiser, G. Is teachers’ general pedagogical knowledge a premise for noticing and interpreting classroom situations? A video-based assessment approach. Teach. Teach. Educ. 2014, 38, 76–88. [Google Scholar] [CrossRef]
- Dick, L.K. Investigating the relationship between professional noticing and specialized content knowledge. In Teacher Noticing: Bridging and Broadening Perspectives, Contexts, and Frameworks; Schack, E.O., Fisher, M.H., Wilhelm, J.A., Eds.; Springer International Publishing: New York, NY, USA, 2017; pp. 339–358. ISBN 978-3-319-46752-8. [Google Scholar]
- Goldin, G.; Rösken, B.; Törner, G. Beliefs—No longer a hidden variable in mathematical teaching and learning processes. In Beliefs and Attitudes in Mathematics Education: New Research Results; Maass, J., Schloeglmann, W., Eds.; Sense: Rotterdam, The Netherlands, 2009; pp. 1–18. ISBN 978-90-8790-722-8. [Google Scholar]
- Bobis, J.; Way, J.; Anderson, J.; Martin, A.J. Challenging teacher beliefs about student engagement in mathematics. J. Math. Teach. Educ. 2016, 19, 33–55. [Google Scholar] [CrossRef]
- Fennema, E.; Carpenter, T.P.; Franke, M.L.; Levi, L.; Jacobs, V.R.; Empson, S.B. A longitudinal study of learning to use children’s thinking in mathematics instruction. J. Res. Math. Educ. 1996, 27, 403–434. [Google Scholar] [CrossRef]
- Ainley, J.; Luntley, M. The role of attention in expert classroom practice. J. Math. Teach. Educ. 2008, 10, 3–22. [Google Scholar] [CrossRef]
- Keller, M.M.; Hoy, A.W.; Goetz, T.; Frenzel, A.C. Teacher enthusiasm: Reviewing and redefining a complex construct. Educ. Psychol. Rev. 2016, 28, 743–769. [Google Scholar] [CrossRef]
- Collins, M.L. Effects of enthusiasm training on preservice elementary teachers. J. Teach. Educ. 1978, 29, 53–57. [Google Scholar] [CrossRef]
- Carmichael, C.; Callingham, R.; Watt, H.M. Classroom motivational environment influences on emotional and cognitive dimensions of student interest in mathematics. ZDM Math. Educ. 2017, 49, 449–460. [Google Scholar] [CrossRef]
- Fraser, B.; Walberg, H. Psychosocial learning environment in science classrooms: A review of research. Stud. Sci. Educ. 1981, 8, 67–92. [Google Scholar] [CrossRef]
- Fauth, B.; Decristan, J.; Rieser, S.; Klieme, E.; Büttner, G. Student ratings of teaching quality in primary school: Dimensions and prediction of student outcomes. Learn. Instr. 2014, 29, 1–9. [Google Scholar] [CrossRef]
- Wagner, W.; Göllner, R.; Helmke, A.; Trautwein, U.; Lüdtke, O. Construct validity of student perceptions of instructional quality is high, but not perfect: Dimensionality and generalizability of domain-independent assessments. Learn. Instr. 2013, 28, 1–11. [Google Scholar] [CrossRef]
- Musu-Gillette, L.E.; Wigfield, A.; Harring, J.R.; Eccles, J.S. Trajectories of change in students’ self-concepts of ability and values in math and college major choice. Educ. Res. Eval. 2015, 21, 343–370. [Google Scholar] [CrossRef]
- Shih, J.; Ing, M.; Phelan, J.; Brown, R.; Maiorca, C. The influence of students’ self-perceptions and mathematics experiences on learning more mathematics in the future. Investig. Math. Learn. 2019, 11, 220–229. [Google Scholar] [CrossRef]
- Genolini, C.; Falissard, B. KmL: K-means for longitudinal data. Comput. Stat. 2010, 25, 317–328. [Google Scholar] [CrossRef]
- Wang, X.; Lee, Y.; Wickersham, K. Exploring the relationship between longitudinal course-taking patterns and in-state transfer into stem fields of study. J. High. Educ. 2019, 90, 272–297. [Google Scholar] [CrossRef]
- Tang, H.; Xing, W.; Pei, B. Exploring the temporal dimension of forum participation in MOOCs. Distance Educ. 2018, 39, 353–372. [Google Scholar] [CrossRef]
- Genolini, C.; Alacoque, X.; Sentenac, M.; Arnaud, C. kml and kml3d: R packages to cluster longitudinal data. J. Stat. Softw. 2015, 65, 1–34. [Google Scholar] [CrossRef] [Green Version]
- Plenty, S.; Heubeck, B.G. A multidimensional analysis of changes in mathematics motivation and engagement during high school. Educ. Psycho. 2013, 33, 14–30. [Google Scholar] [CrossRef]
- Watt, H.M.; Carmichael, C.; Callingham, R. Students’ engagement profiles in mathematics according to learning environment dimensions: Developing an evidence base for best practice in mathematics education. Sch. Psychol. Int. 2017, 38, 166–183. [Google Scholar] [CrossRef]
- Durik, A.M.; Vida, M.; Eccles, J.S. Task values and ability beliefs as predictors of high school literacy choices: A developmental analysis. J. Educ. Psychol. 2006, 98, 382–393. [Google Scholar] [CrossRef]
- Wang, M.T.; Willett, J.B.; Eccles, J.S. The assessment of school engagement: Examining dimensionality and measurement invariance across gender and race/ethnicity. J. Sch. Psychol. 2011, 49, 465–480. [Google Scholar] [CrossRef]
- Watt, H.M. The role of motivation in gendered educational and occupational trajectories related to maths. Educ. Res. Eval. 2006, 12, 305–322. [Google Scholar] [CrossRef]
- Li, Y.; Alfeld, C.; Kennedy, R.P.; Putallaz, M. Effects of summer academic programs in middle school on high school test scores, course-taking, and college major. J. Adv. Acad. 2009, 20, 404–436. [Google Scholar] [CrossRef]
- Eccles, J.S.; Vida, M.N.; Barber, B. The relation of early adolescents’ college plans and both academic ability and task-value beliefs to subsequent college enrollment. J. Early Adolesc. 2004, 24, 63–77. [Google Scholar] [CrossRef]
- Hill, H.C.; Rowan, B.; Ball, D. Effects of teachers’ mathematical knowledge for teaching on student achievement. Am. Educ. Res. J. 2005, 42, 371–406. [Google Scholar] [CrossRef] [Green Version]
- Nagy, G.; Trautwein, U.; Baumert, J.; Köller, O.; Garrett, J. Gender and course selection in upper secondary education: Effects of academic self-concept and intrinsic value. Educ. Res. Eval. 2006, 12, 323–345. [Google Scholar] [CrossRef]
- Wang, M.T.; Eccles, J.S.; Kenny, S. Not lack of ability but more choice: Individual and gender differences in choice of careers in science, technology, engineering, and mathematics. Psychol. Sci. 2013, 24, 770–775. [Google Scholar] [CrossRef]
Figure 1.
Conceptual framework for student perceptions of mathematics teacher competence.

Figure 2.
Four distinct trajectories of students’ perceptions of mathematics teachers’ competence (SP-MTC).
Figure 2.
Four distinct trajectories of students’ perceptions of mathematics teachers’ competence (SP-MTC).

Figure 3.
Students’ levels of engagement (left) and mathematical achievement (right).

Figure 4.
Results of linear mixed effect models for mathematics engagement and achievement.

Table 1.
Descriptive statistics for students’ mathematics achievement.
| Min | Max | Mean | SD | |
|---|---|---|---|---|
| Grade 8 | 162 | 505 | 345.22 | 59.16 |
| Grade 9 | 176 | 515 | 363.86 | 64.13 |
| Grade 10 | 190 | 533 | 373.68 | 63.64 |
| Grade 11 | 216 | 558 | 370.58 | 42.91 |
| Grade 12 | 220 | 559 | 377.04 | 53.03 |
Table 2.
Descriptive statistics for distinct trajectories.
| Grade | High | Decreasing | Increasing | Low |
|---|---|---|---|---|
| 8 | 4.71 (0.39) | 4.41 (0.46) | 3.37 (0.61) | 3.46 (0.70) |
| 9 | 4.71 (0.43) | 4.25 (0.54) | 4.01 (0.65) | 3.44 (0.66) |
| 10 | 4.74 (0.38) | 3.98 (0.54) | 4.33 (0.56) | 3.34 (0.66) |
| 11 | 4.68 (0.42) | 3.88 (0.54) | 4.33 (0.51) | 3.36 (0.59) |
| 12 | 4.54 (0.49) | 3.72 (0.57) | 4.20 (0.51) | 3.36 (0.55) |
Table 3.
Summary of linear mixed-effect models.
| Fixed | Estimate | SE | t-Value | Random | Variance | SD |
|---|---|---|---|---|---|---|
| Model 1: Mathematics Engagement | ||||||
| (intercept) | 3.96 *** | 0.03 | 144.77 | (Intercept) | 0.33 | 0.57 |
| high | 0.41 *** | 0.04 | 11.00 | Residual | 0.42 | 0.65 |
| increasing | −0.28 *** | 0.04 | −6.47 | |||
| low | −0.69 *** | 0.04 | −15.55 | |||
| grade | −0.17 *** | 0.01 | −22.71 | |||
| high × grade | 0.08 *** | 0.01 | 7.93 | |||
| increasing × grade | 0.18 *** | 0.01 | 15.42 | |||
| low × grade | 0.08 *** | 0.01 | 5.56 | |||
| Model 2: Mathematics Achievement | ||||||
| (intercept) | 352.02 *** | 2.40 | 192.90 | (Intercept) | 1840 | 42.90 |
| high | 18.45 *** | 2.47 | 7.48 | Residual | 1251 | 35.38 |
| increasing | −6.76 * | 2.89 | −2.34 | |||
| low | −27.77 *** | 2.95 | −9.41 | |||
| grade | 5.64 *** | 0.40 | 14.07 | |||
| grade | 0.56 | 0.54 | 1.03 | |||
| increasing × grade | 3.16 *** | 0.64 | 4.97 | |||
| low × grade | 3.41 *** | 0.65 | 5.25 | |||
Note: * , *** ; SE indicates standard error; Reference group is the decreasing cluster.
Table 4.
Summary of logistic regression predicting math-intensive career choice.
| Variable | Model 1: Unadjusted | Variable | Model 2: Adjusted | ||||||
|---|---|---|---|---|---|---|---|---|---|
| B | SE | OR | 95% CI | B | SE | OR | 95% CI | ||
| low | 1 | low | 1 | ||||||
| high *** | 0.95 | 0.14 | 2.58 | 1.98–3.36 | high *** | 0.93 | 0.14 | 2.54 | 1.95–3.31 |
| increasing *** | 0.67 | 0.15 | 1.94 | 1.45–2.61 | increasing *** | 0.68 | 0.15 | 1.97 | 1.46–2.64 |
| decreasing *** | 0.41 | 0.14 | 1.50 | 1.14–1.99 | decreasing *** | 0.43 | 0.14 | 1.53 | 1.16–2.03 |
| female | 1 | ||||||||
| male *** | 0.44 | 0.09 | 1.55 | 1.31–1.83 | |||||
Note. ***; B, SE, OR, and CI indicate regression coefficient, standard error, odds ratio, and confidence interval, respectively; the low cluster and female are reference groups.
Publisher’s Note: MDPI stays neutral with regard to jurisdictional claims in published maps and institutional affiliations. |
© 2021 by the authors. Licensee MDPI, Basel, Switzerland. This article is an open access article distributed under the terms and conditions of the Creative Commons Attribution (CC BY) license (http://creativecommons.org/licenses/by/4.0/).
Share and Cite
MDPI and ACS Style
Shin, D.; Shim, J. Students’ Perceived Mathematics Teacher Competence: Longitudinal Associations with Learning Outcomes and Choice of College Major. Educ. Sci. 2021, 11, 18. https://0-doi-org.brum.beds.ac.uk/10.3390/educsci11010018
AMA Style
Shin D, Shim J. Students’ Perceived Mathematics Teacher Competence: Longitudinal Associations with Learning Outcomes and Choice of College Major. Education Sciences. 2021; 11(1):18. https://0-doi-org.brum.beds.ac.uk/10.3390/educsci11010018
Chicago/Turabian StyleShin, Dongjo, and Jaekwoun Shim. 2021. "Students’ Perceived Mathematics Teacher Competence: Longitudinal Associations with Learning Outcomes and Choice of College Major" Education Sciences 11, no. 1: 18. https://0-doi-org.brum.beds.ac.uk/10.3390/educsci11010018
Note that from the first issue of 2016, this journal uses article numbers instead of page numbers. See further details here.