
Analysis of Data-Based Scientific Reasoning from a Product-Based and a Process-Based Perspective


Biology Education, Humboldt-Universität zu Berlin, D-10099 Berlin, Germany
*
Authors to whom correspondence should be addressed.
Educ. Sci. 2021, 11(10), 639; https://0-doi-org.brum.beds.ac.uk/10.3390/educsci11100639
Submission received: 15 August 2021
/
Revised: 27 September 2021
/
Accepted: 8 October 2021
/
Published: 14 October 2021
(This article belongs to the Special Issue Scientific Reasoning in Science Education: From Global Measures to Fine-Grained Descriptions of Students’ Competencies)
Abstract
:In this study, we investigated participants’ reactions to supportive and anomalous data in the context of population dynamics. Based on previous findings on conceptions about ecosystems and responses to anomalous data, we assumed a tendency to confirm the initial prediction after dealing with contradicting data. Our aim was to integrate a product-based analysis, operationalized as prediction group changes with process-based analyses of individual data-based scientific reasoning processes to gain a deeper insight into the ongoing cognitive processes. Based on a theoretical framework describing a data-based scientific reasoning process, we developed an instrument assessing initial and subsequent predictions, confidence change toward these predictions, and the subprocesses data appraisal, data explanation, and data interpretation. We analyzed the data of twenty pre-service biology teachers applying a mixed-methods approach. Our results show that participants tend to maintain their initial prediction fully or change to predictions associated with a mix of different conceptions. Maintenance was observed even if most participants were able to use sophisticated conceptual knowledge during their processes of data-based scientific reasoning. Furthermore, our findings implicate the role of confidence changes and the influences of test wiseness.
1. Introduction
Developing, understanding, and critically questioning knowledge and processes of deriving knowledge in science are key aspects of scientific reasoning [1,2]. The ability to engage in scientific reasoning requires a set of competences and knowledge entities that vary depending on the kind of problem to be solved [1,3]. Kind and Osborne [3] describe styles of reasoning that are distinguishable based on typical entities of conceptual, procedural, and epistemic knowledge. Conceptual knowledge focusses on the scientific objects of the problem’s context, procedural knowledge focusses on entities that address methods and tools used for generating information like empirical data, and epistemic knowledge focusses on entities used to justify scientific conclusions on a meta-level [1,3,4,5].
Most processes of scientific reasoning rely on empirical data derived from methods like experimentation, observation, or modeling [3]. Therefore, reasoning based on data is central in scientific practices and defined as one epistemic activity in scientific reasoning [6,7]. Especially data that are not in line with prior knowledge, so-called anomalous or contradicting data [8], are a driving force for engaging in scientific reasoning. Reasoning processes initiated by anomalous data address conceptual knowledge regarding conceptual development, procedural knowledge regarding questions of methodology, and epistemic knowledge regarding questions of credibility and limits of data-based knowledge acquisition (e.g., [8,9,10]).
Most studies investigating reasoning in the light of anomalous data focus the analysis on participants’ explanations for their reaction to the data (e.g., [8,9]), not including an analysis of the reasoning process itself. The reaction to the data can be regarded as the product from a previous reasoning process (e.g., [10,11]). Hence, studies that only focus on the reaction (e.g., change of initial theory) analyze responses to anomalous data from a product-based view. In contrast, studies that analyze the reasoning process leading to these reactions are considered to apply a process-based view (e.g., [10,11]).
Studies that investigated responses to anomalous data from a process-based view mostly used data that were self-generated by the participants in laboratory settings [10,12]. However, reasoning processes with first-hand or second-hand data differ regarding used entities of conceptual and procedural knowledge [13].
The aim of this paper is to provide an integrational perspective from a product-based and a process-based analysis of reasoning processes with second-hand anomalous and supportive data. Therefore, reasoning processes are described by applying a general model of information processing [14] resulting in the model of data-based scientific reasoning.
The results might help to gain a deeper insight into processes that occur when reasoning with anomalous and supportive data as well as the relation to the use of conceptual, procedural, and epistemic knowledge. Further research might tie in these findings, leading to instructional recommendations for data-based scientific reasoning when used in teaching and learning.
2. Theoretical Background
2.1. Data-Based Scientific Reasoning
Chinn and Brewer [15] highlight the initiating effects of anomalous data for the development of scientific knowledge by reviewing historical examples in which anomalous data played a crucial role in the investigations of scientists leading to discussions that initiated a critical reflection on initial interpretations and theories. “Anomalous evidence are data which would not be predicted by, and are inconsistent with, a person’s mental model” [8], hence they can be described as initiators of cognitive conflicts that induce conceptual development and reasoning processes [16]. However, previous studies on anomalous data show that data contradicting initial expectations are discounted in different ways [8,15,17,18]. Such responses to anomalous data rely on a variety of justifications [8,9] based on different aspects of conceptual, procedural, or epistemic knowledge [3]. Furthermore, evidence exists that shows the importance of the perception and recognition of the anomalous data for subsequent reasoning processes [10,13,19]. More recently, a study on anomalous data provided evidence that the degree of anomaly relates to the likelihood of theory change [20]. In this study, the researchers could show that an increase of shown anomalous data increases the recognition of the anomaly and subsequently decreases participants’ confidence in the initial theory. This change in confidence was furthermore connected to a tendency to change their initial theory based on the new information provided by the anomalous data presented [20].
Responses to anomalous data are often conceptualized as part of interpretational processes during data-based scientific reasoning [21]. Previous studies show a tendency for a product-based view on responses to anomalous data and a concentration on a rather meta-level appraisal of this kind of data, asking for the believability and relevance [8,22] instead of asking for the coordination between anomalous data and initial knowledge. However, knowledge about the processes involved in different situations of scientific reasoning can lead to deeper insights into the structure of reasoning processes and enhances the knowledge about scientific reasoning [3,11].
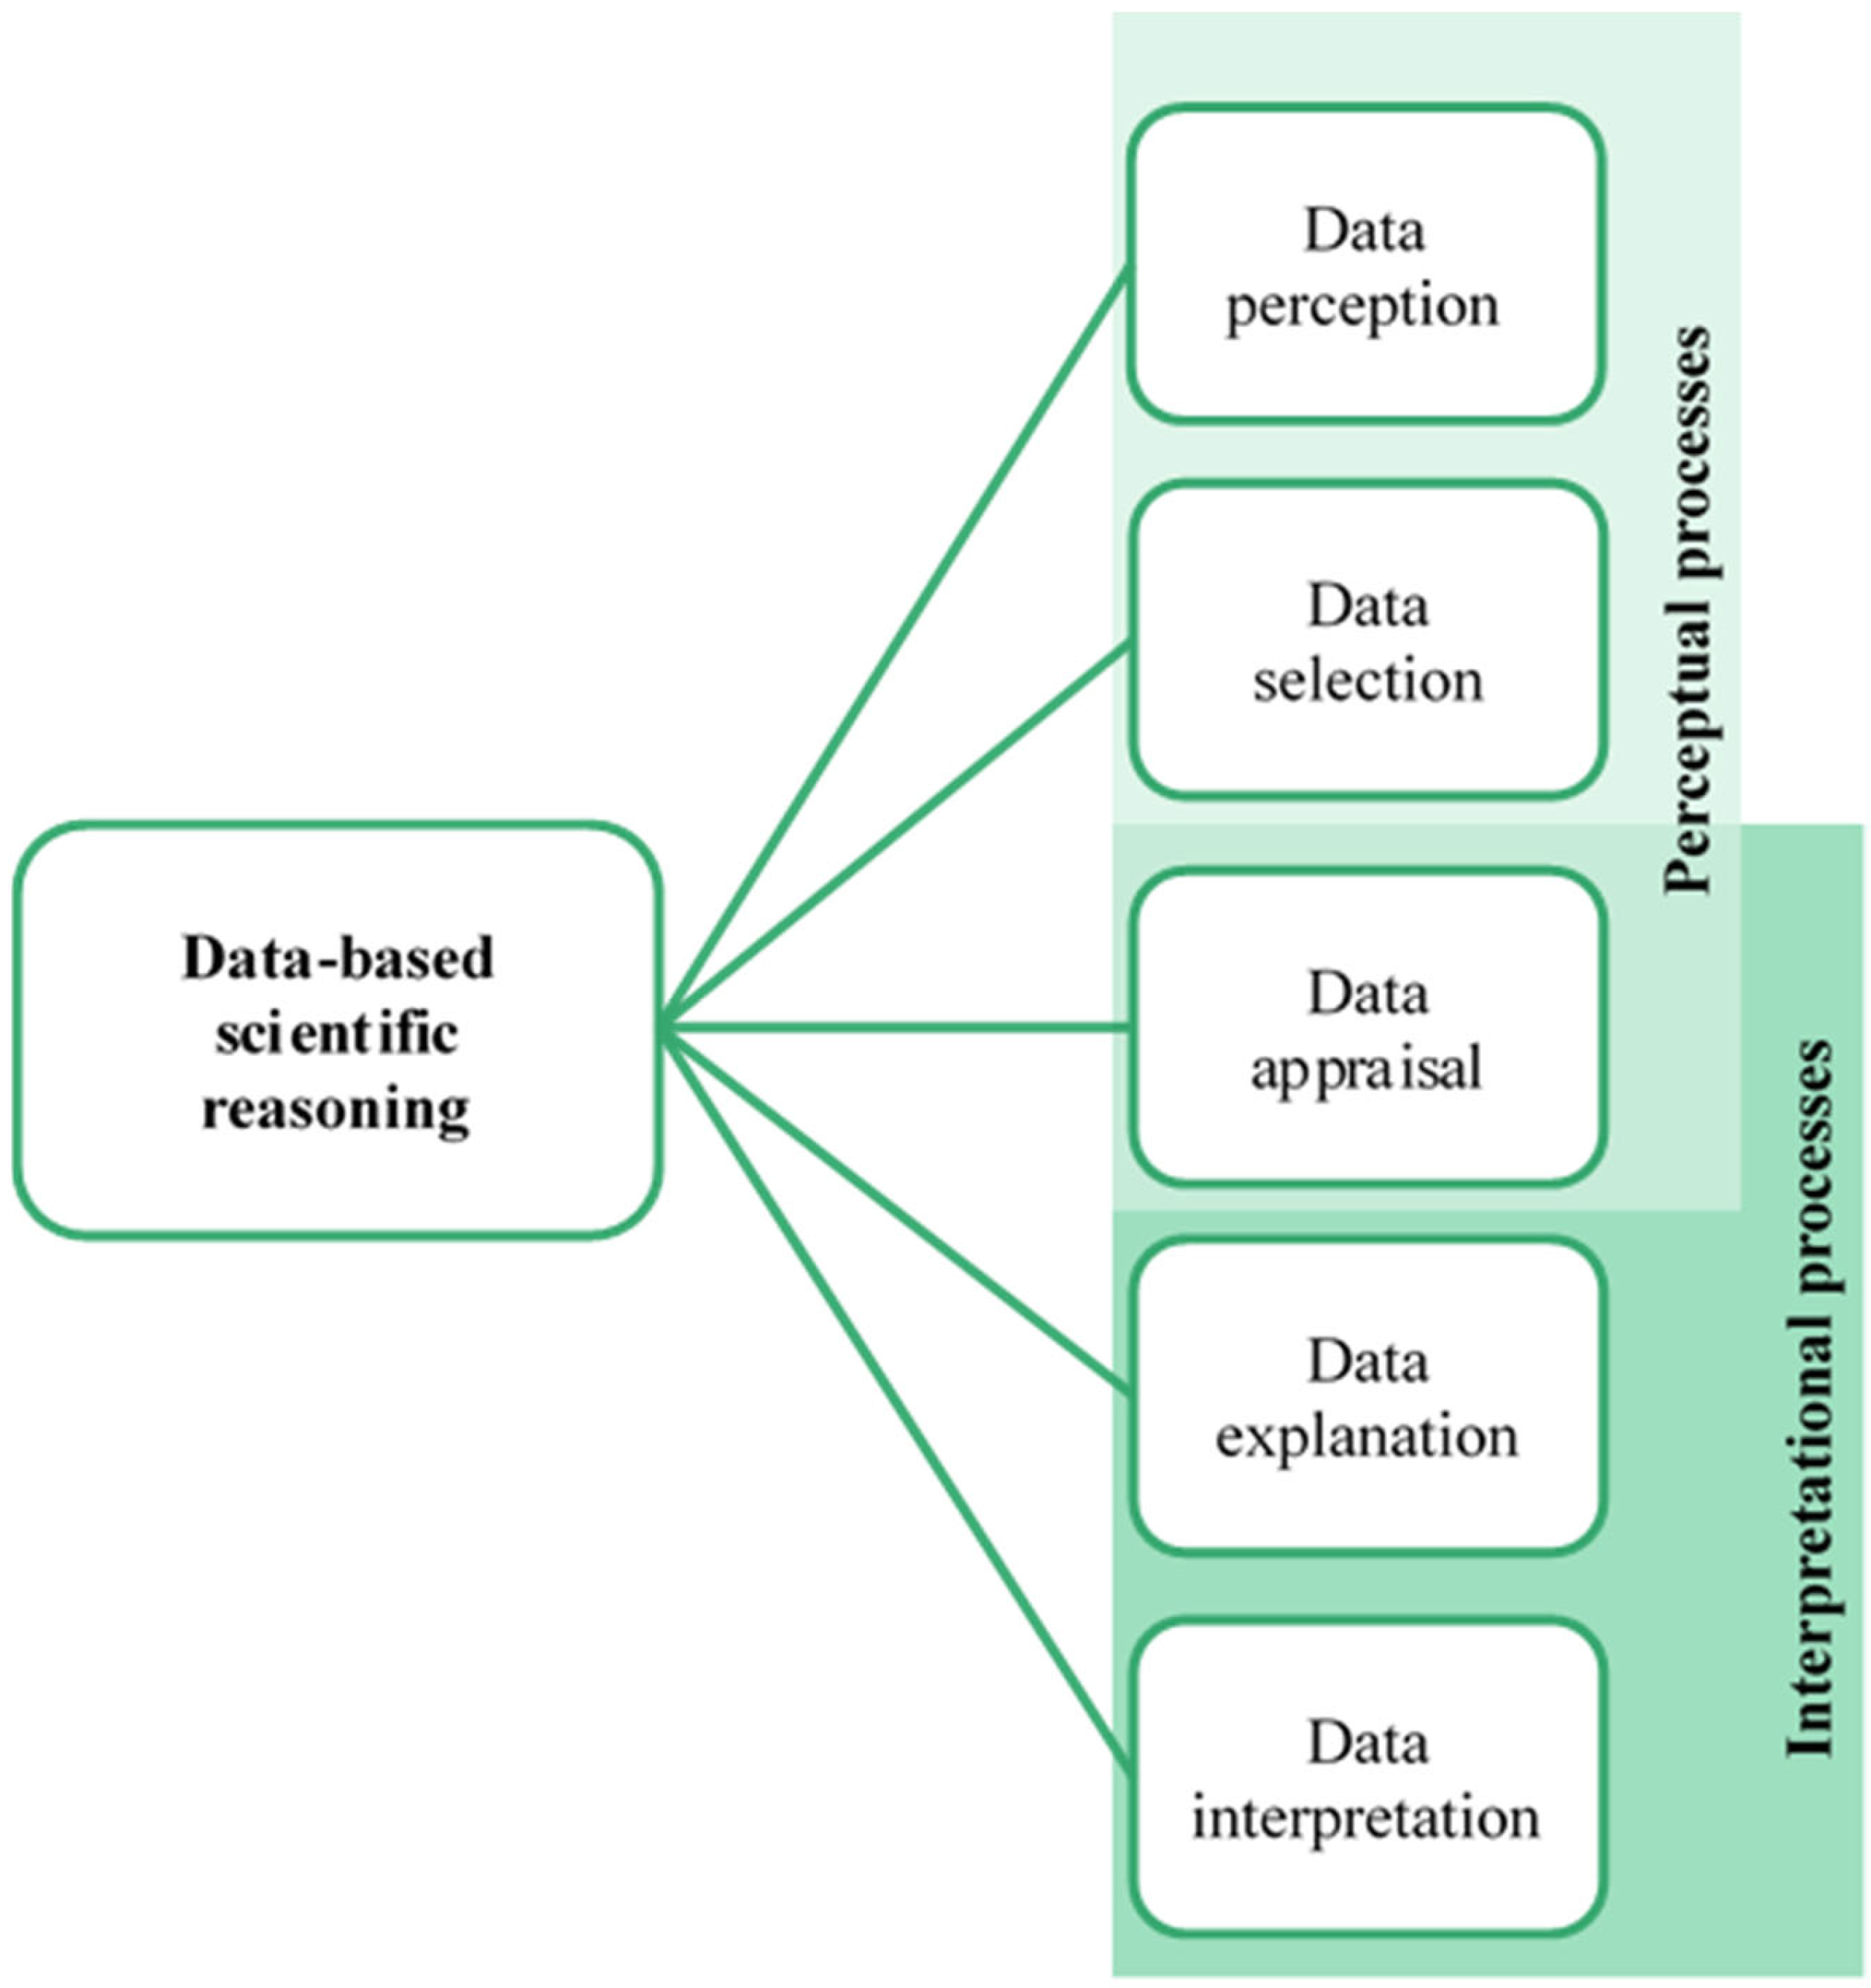
From a process-based view, reasoning initiated by anomalous data can be described based on a general model of information processing [14], emphasizing the roles of data perception, data selection, data appraisal, data explanation, and data interpretation regarding initial knowledge (Figure 1).
In this process model of data-based scientific reasoning, anomalous data function as sensory stimuli that, at first, have to be perceived [10,12,19,23] before they are selected and appraised in early reasoning processes which focus on the perception of data characteristics [24,25]. Subsequently, data are interpreted within and integrated into initial knowledge entities during interpretational reasoning processes [24,27]. Interpretational processes can be distinguished into data explanation and data interpretation. Data explanation focusses on the sense-making of the data by offering alternative causes, whereas the interpretation of the data includes the coordination of the data, the alternative explanations, and the initial hypothesis to make a claim that is justified [28]. All of these sub-processes are influenced consciously or unconsciously by initially held entities of conceptual, procedural, and epistemic knowledge [3].
Research on information processing shows that a strong tendency to confirm prior conceptions can influence each step in the information processing process [29]. Therefore, we assume that responses to anomalous data, representing a specific type of scientific information, differ qualitatively in relation to the phase of information processing. Such strategies of confirmation can occur during several processes during data-based scientific reasoning, for example: perceptually ignoring contradicting data in the process of data perception, searching for flaws in contradicting data or information in the process of data appraisal, being more willing to advance vague, nonspecific causes, or finding alternative causes in the process of data explanation [18,24]. Therefore, a detailed look at the responses to anomalous data in relation to the phases of information processing provides a deeper understanding behind the cognitive processes during data-based reasoning.
2.2. Changes of Conceptual Development with Data in the Context of Population Dynamics
The acquisition of knowledge in the context of ecology is influenced by initial conceptions that are often not in line with current scientific theories [30], such as the assumption that ecosystems have a specific equilibrium state given by nature [31]. Most of these not scientifically adequate conceptions derive from the use of the so-called Balance of Nature (BoN) metaphor [32]. Within this metaphor, ecosystems are defined as being stable, homogenous entities that regenerate to an ideal equilibrium state after disturbances. Human interactions with ecosystems are mostly seen as destructive leading to instability. According to BoN, organisms in ecosystems behave harmonically and control each other in a balanced way [32]. Conceptions on ecosystem and population dynamics that are related to BoN are prominently used in media like news, the Internet [31], and schoolbooks [33]. Therefore, it is not surprising that BoN conceptions are stable against teaching interventions [34]. The aim of teaching inventions is to initiate conceptual development by offering alternative scientifically adequate conceptions that would fit into a Flux of Nature (FoN) metaphor [31,32] and support the preference of using FoN conceptions over the BoN conception during scientific reasoning [35].
Using the example of population dynamics, the advantages, and difficulties for data-based scientific reasoning initiated by anomalous data can be shown. The development of a population in size and composition over time is a typical topic discussed in school biology and university level ecology courses [36]. However, entities of conceptual knowledge emerge from teaching interventions, but are influenced by initially held conceptions about the topic [37]. Furthermore, population dynamics are often represented by using data depicted as line graphs [38] to show, for example, the development of the population size of a species over time. Additionally, the presentation of empirical data sets is more likely to induce theory change [39]; hence, presenting anomalous data in the context of population dynamics in their typical representation as line graphs might give interesting insights for research on data-based scientific reasoning. Thus, scientific reasoning processes in this context require the use of procedural knowledge regarding handling data (e.g., knowing procedures of data generation, identifying patterns in data sets [25,26]) and interpreting graphs (diagram competence [40]). Connected to procedural knowledge, knowledge on the limits of interpreting the data are necessary for scientific reasoning, which is part of epistemic knowledge. In the case of population dynamics, represented line graphs are often connected to the use of the Lotka–Volterra equations modeling the development of populations in a prey–predator relationship hypothetically [32,41]. Therefore, epistemic knowledge associated with meta-modeling knowledge is also required during scientific reasoning in the context of population dynamics [42].
2.3. Aim and Research Questions
The aim of the following study is the identification and empirical description of reactions to anomalous and supportive data and their relation to individual processes of data-based scientific reasoning in the field of ecology. Therefore, we focused on the following research questions.
- How does anomalous data affect the change of initial predictions regarding the scientific phenomenon of population dynamics?
- How are changes of initial predictions about population dynamics related to a change in confidence towards the initial predictions?
- How are reactions regarding initial predictions about population dynamics related to presented proportions of anomalous to supportive data?
- How are reactions regarding initial predictions about population dynamics related to individual processes of data-based scientific reasoning?
3. Materials and Methods
The study is based on a mixed-methods design encompassing assessment instruments that allow the application of quantitative and qualitative analysis methods [43]. A traditional paper-and-pencil format was combined with the use of eye-tracking techniques [44]. Participants were invited to participate in the study that was conducted in a laboratory setting in the university.
3.1. Participants
In the study, twenty pre-service biology teachers (mean age = 26.25 years; SD = 5.44 years) ranging from attending first-year bachelor courses (nBachelor = 11) to attending master courses (nMaster = 9) participated voluntarily. The range of invited participants was chosen to enhance the variety of assessable responses to anomalous data during the process of data-based scientific reasoning due to their assumed differences in expertise regarding ecology and scientific reasoning [45].
3.2. Instrument
We developed a paper-and-pencil instrument in the context of population dynamics containing a set of tasks for assessing individual initial expectations and subsequently responding to anomalous and supportive data (Table 1). To interpret the answers given in the instrument, regarding responses to anomalous data, individual initial expectations on population dynamics were assessed by a prediction task in which participants graphed predicted outcomes of population development over a period of ten years and explained their prediction in an open-ended writing task. The prediction task was combined with a confidence rating scale for all scenarios prior to the remaining set of tasks (Table 1). Each of the following tasks is aiming to operationalize one of the sub-processes of the process model of data-based scientific reasoning (Figure 1). Perceptual processes of data-based scientific reasoning were operationalized in the paper-pencil instrument by the data selection task, which was combined with the assessment of eye-tracking data for validation purposes [44]. Interpretational processes were assessed by the data appraisal task, data explanation task, and data interpretation task (Table 1). Changes in the confidence regarding the initial predictions were assessed by a second confidence rating scale [20]).
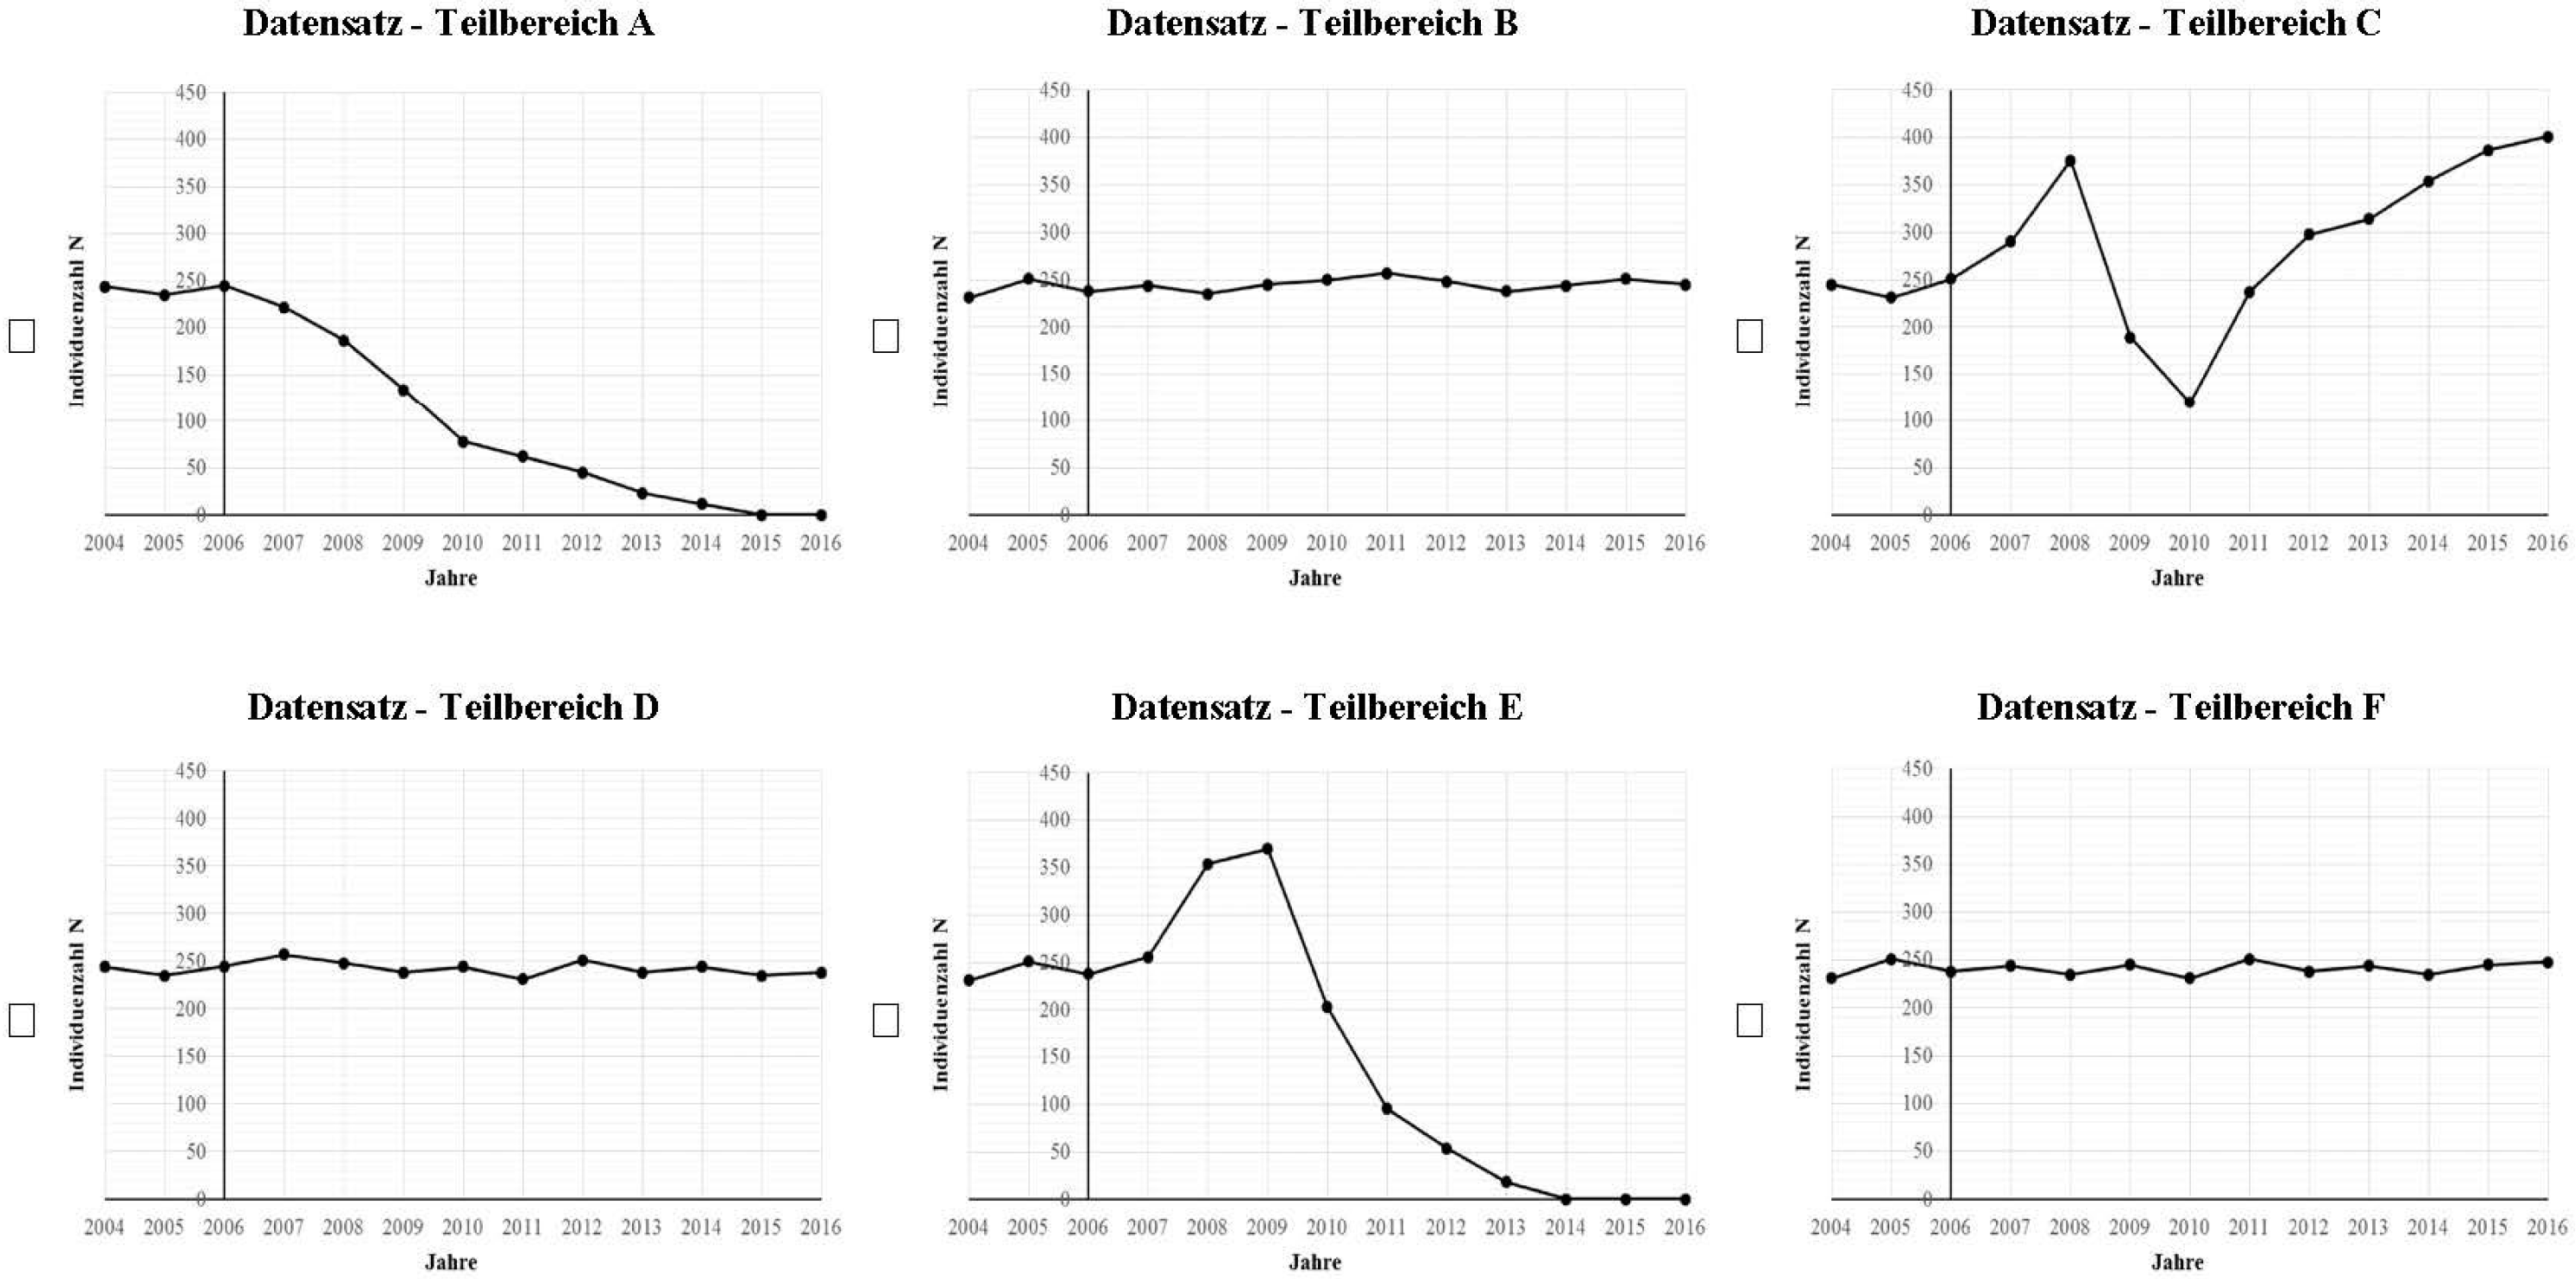
The contexts of the three scenarios were closely comparable with all introducing a population of an herbivorous mammal species (elk, deer, and goat) in a terrestrial ecosystem and a typical predator species. The scenarios varied regarding the proportion of anomalous and supportive data shown to induce the data-based scientific reasoning process. Anomalous and supportive data were operationalized as data sets represented as line graphs. Each of the line graphs was pre-defined to show either a population dynamic associated with typical BoN expectations (stable, slightly fluctuating population number) or typical FoN expectations (chaotic fluctuating population number, extinction; [41]). In each scenario (elk, deer, and goat), six of these data sets were presented as a stimulus to induce the scientific reasoning process (Figure 2).
The degree of anomaly was varied by changing the ratio between FoN and BoN associated graphs from 2:4; 3:3 to 4:2 within the three scenarios [20]. Each scenario was assigned to a specific ratio between FoN and BoN-associated graphs (deer = 3 FoN:3 BoN: goat = 2 FoN:4BoN: elk = 4 FoN:2 BoN). The sequencing of the three scenarios was randomized between the participants to avoid sequencing effects. Hence, participants responded to the set of tasks three times while processing the three scenarios in different orders.
3.3. Analyses
In this study, responses to anomalous data were analyzed from a product-based and a process-based view (e.g., [10,11]). The product-based view focuses on the change of initial predictions made by the participants after reasoning with anomalous data. Therefore, the analysis is grounded strongly in the nature of the three predictions made by the participants as part of the instrument. Therefore, we coded the type of graphed prediction and associated written explanation following a qualitative content analysis approach [46]. We developed a category system that includes deductively generated categories from the main theoretical frameworks addressing conceptual, procedural, and epistemic knowledge entities that might be used when reasoning with anomalous data in the context of population dynamics [3,24,25,26,41]. After piloting the category system, descriptions were refined and inductively generated categories included, resulting in a final category system with 26 codes for coding the answers of all tasks included in the instrument (Table A1). The first author coded all answers from the participants. To check for the objectivity of the category system, a second coder who was no expert in this field of research re-coded 20% of the material, resulting in an intercoder agreement of κ = 0.73, indicating a good objectivity. However, disagreements were subsequently discussed and coding descriptions in the coding manual adjusted. To group the given answers of the prediction task into prediction groups, we used an epistemic network analysis (ENA [47]), using an open-source online tool that quantifies, visualizes, and models networks between qualitative entities of processes such as discussions. This tool allows unraveling relations between cognitive knowledge entities and is based on theoretical frameworks for learning analytics [47]. ENA represents relations between objects in dynamic networks in which also the strength of each relation is considered [47]. Objects are represented as knot points and relations as lines between these knots varying in their thickness to indicate the strength of the relation. Objects are defined as the coded categories that indicate the use of conceptual (e.g., mentioning theories of prey–predator relationships), procedural (e.g., using statistics), and epistemic (e.g., credibility of data) knowledge entities (Appendix Table A1). Hence, each answer from the prediction task for the three scenarios per participant resulted in an individual network (N = 60), with the coding categories as objects and their co-occurrences as relations. All networks are located in a two-dimensional coordinate system; hence, all objects have the same position in the coordinate system independent from the individual network making different networks comparable [47]. Hence, similar networks are located closer to one another than networks that differ in their included objects and relations. To group the networks, we first distinguished the answers based on the type of graphed prediction into BoN-associated (Figure 3a,b), FoN-associated (Figure 3c), or FoN/BoN, when participants graphed two different predictions that were associated with both BoN and FoN [41]. These three groups were labeled as superior prediction groups indicating the superficial tendency of the conception behind the made prediction.
Within these superior prediction groups, similar individual networks were grouped, based on the co-occurrence of knowledge entities used for explaining the graphed predictions (represented in the ENA model as relations between objects) and labeled as explicit prediction groups. Based on this grouping, summary statistics that are included to ENA allow an aggregation of all networks in a group into a mean network. Hence, a mean network represents the average combination of objects and their relations for this group [47]. In this study, mean networks of an explicit prediction group showed typical combinations of used knowledge entities for explaining the made prediction regarding population development. Furthermore, ENA offers the calculation of t-tests (e.g., Mann–Whitney test) to check for a statistically significant difference between the mean networks of different groups [47].
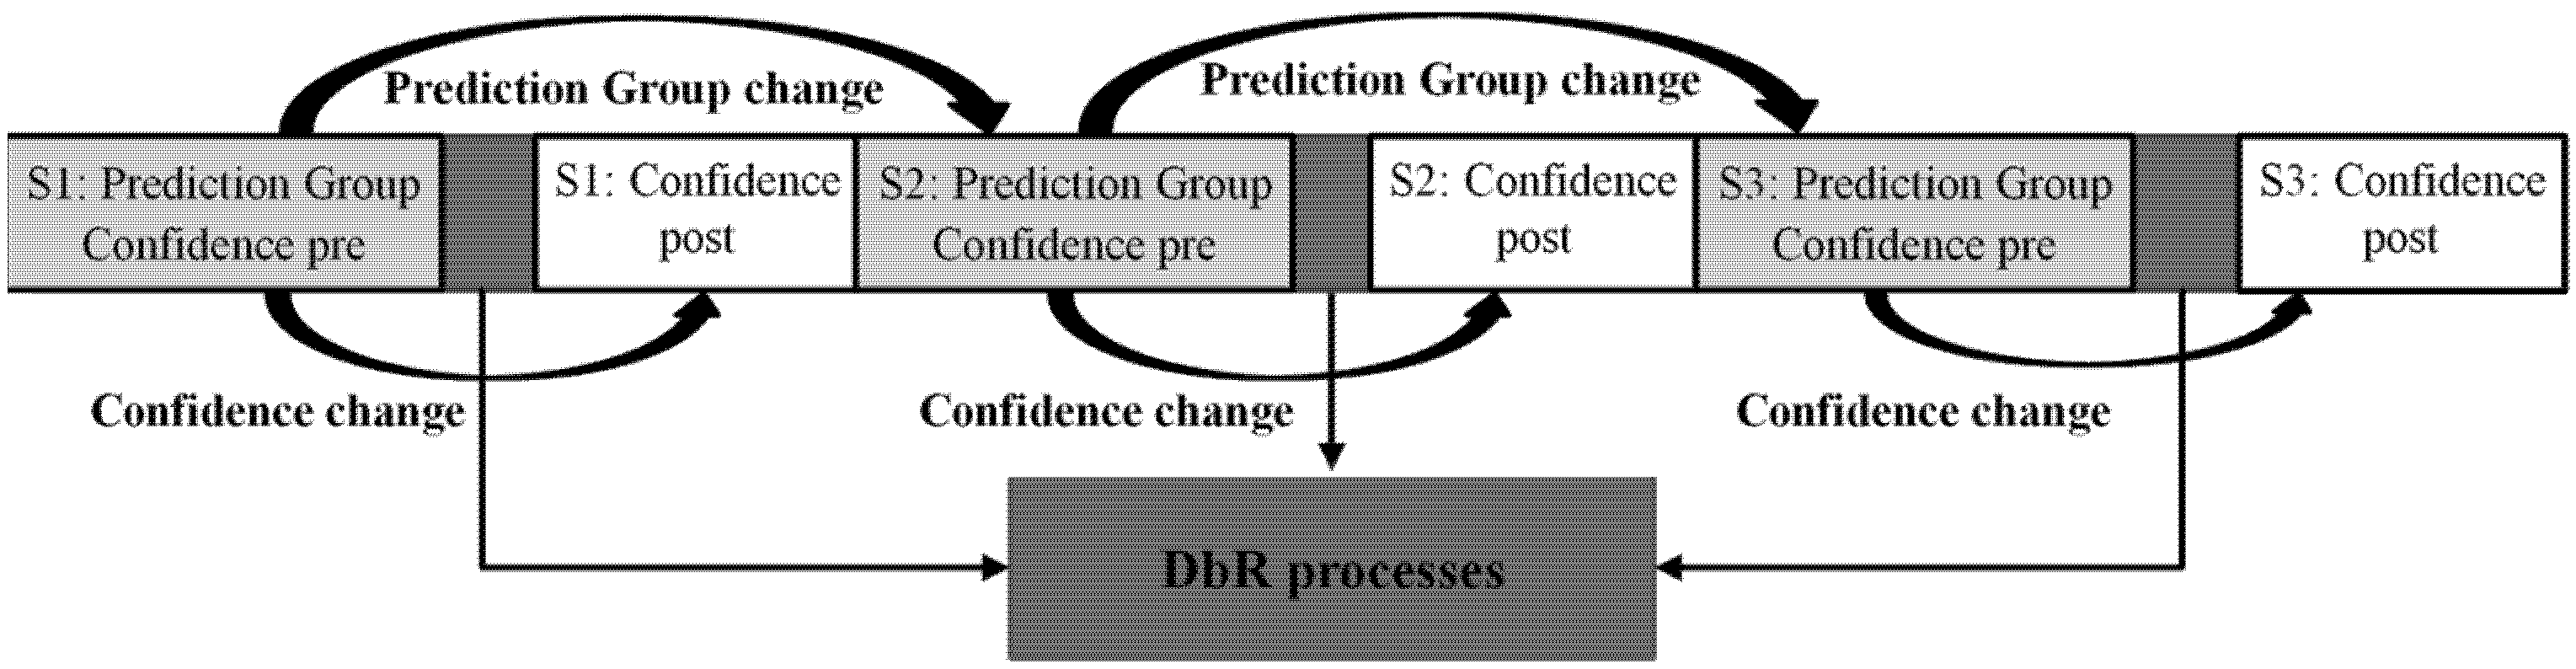
Based on the found prediction groups, we observed if participants changed the prediction group for the second and third scenario in the instrument after reasoning with anomalous and supportive data regarding their initial prediction (Figure 4; prediction group change). Furthermore, changes of confidence in the initial prediction (Figure 4; confidence change) and the relation to the presented proportion of anomalous to supportive data were taken into consideration as factors that might influence the responses to anomalous data.
Subsequently to this product-based view of analysis, we analyzed the data-based reasoning processes that occurred between the prediction group changes and confidence changes (Figure 1 DbR processes). For this process-based analysis (e.g., [10,11], answers to the data appraisal task, data explanation task, and data interpretation task were analyzed for the first and second scenario of each participant. We excluded the third scenario in this analysis since we did not assess a further prediction change after the reasoning process during the third scenario due to the test construction. The answers of the rating scales in the data appraisal task were subsumed into five groups. If participants rated the credibility and the relevance of the perceived anomalous data as low (1 or 2 on the rating scale) they were assigned to skeptical general. When participants rated the perceived anomalous data as only low on the credibility scale, they were assigned to skeptical credibility; in the case of the relevance scale this led to skeptical relevance. Participants who rated both scales in the middle (3 on the rating scale), were assigned to undecided, and participants who rated high on both scales (4 and 5 on the rating scale) were assigned to not skeptical. After coding the answers to the open-ended questions from the data explanation task and data interpretation task, we compared the used conceptual knowledge entities with the ones the participants used for their prediction in each scenario. Based on this comparison, two groups were defined as new conceptual knowledge and initial conceptual knowledge. New conceptual knowledge encompasses cases in which participants used new conceptual knowledge entities in addition to the initial conceptual knowledge entities, for example, when a participant used theories of prey–predator relationships for their prediction only but explained or interpreted the data by considered environmental factors like natural resources. Initial conceptual knowledge encompasses cases in which participants only used initial conceptual knowledge entities, for example, when the previous mentioned participant used theories of prey–predator relationships during data explanation and interpretation as the single explanation option. If participants additionally used procedural or epistemic knowledge entities for explaining and interpreting data, they were assigned to the sub-groups plus procedural or epistemic knowledge. Participants that answered without using conceptual, procedural, or epistemic knowledge to explain or interpret data were assigned to no explanation. Based on this grouping, participants’ data-based scientific reasoning processes were assigned into a dimensional matrix with data appraisal on one dimension and data explanation/interpretation on the other dimension.
4. Results
Each of the participants (N = 20) answered the prediction and data-based scientific reasoning tasks (Table 1) for the three scenarios leading to a total amount of 60 answers for each task. For the open-ended writing tasks that were coded by a qualitative content analysis, a total of N = 868 codes were assigned, ranging from 19 to 59 codes between participants.
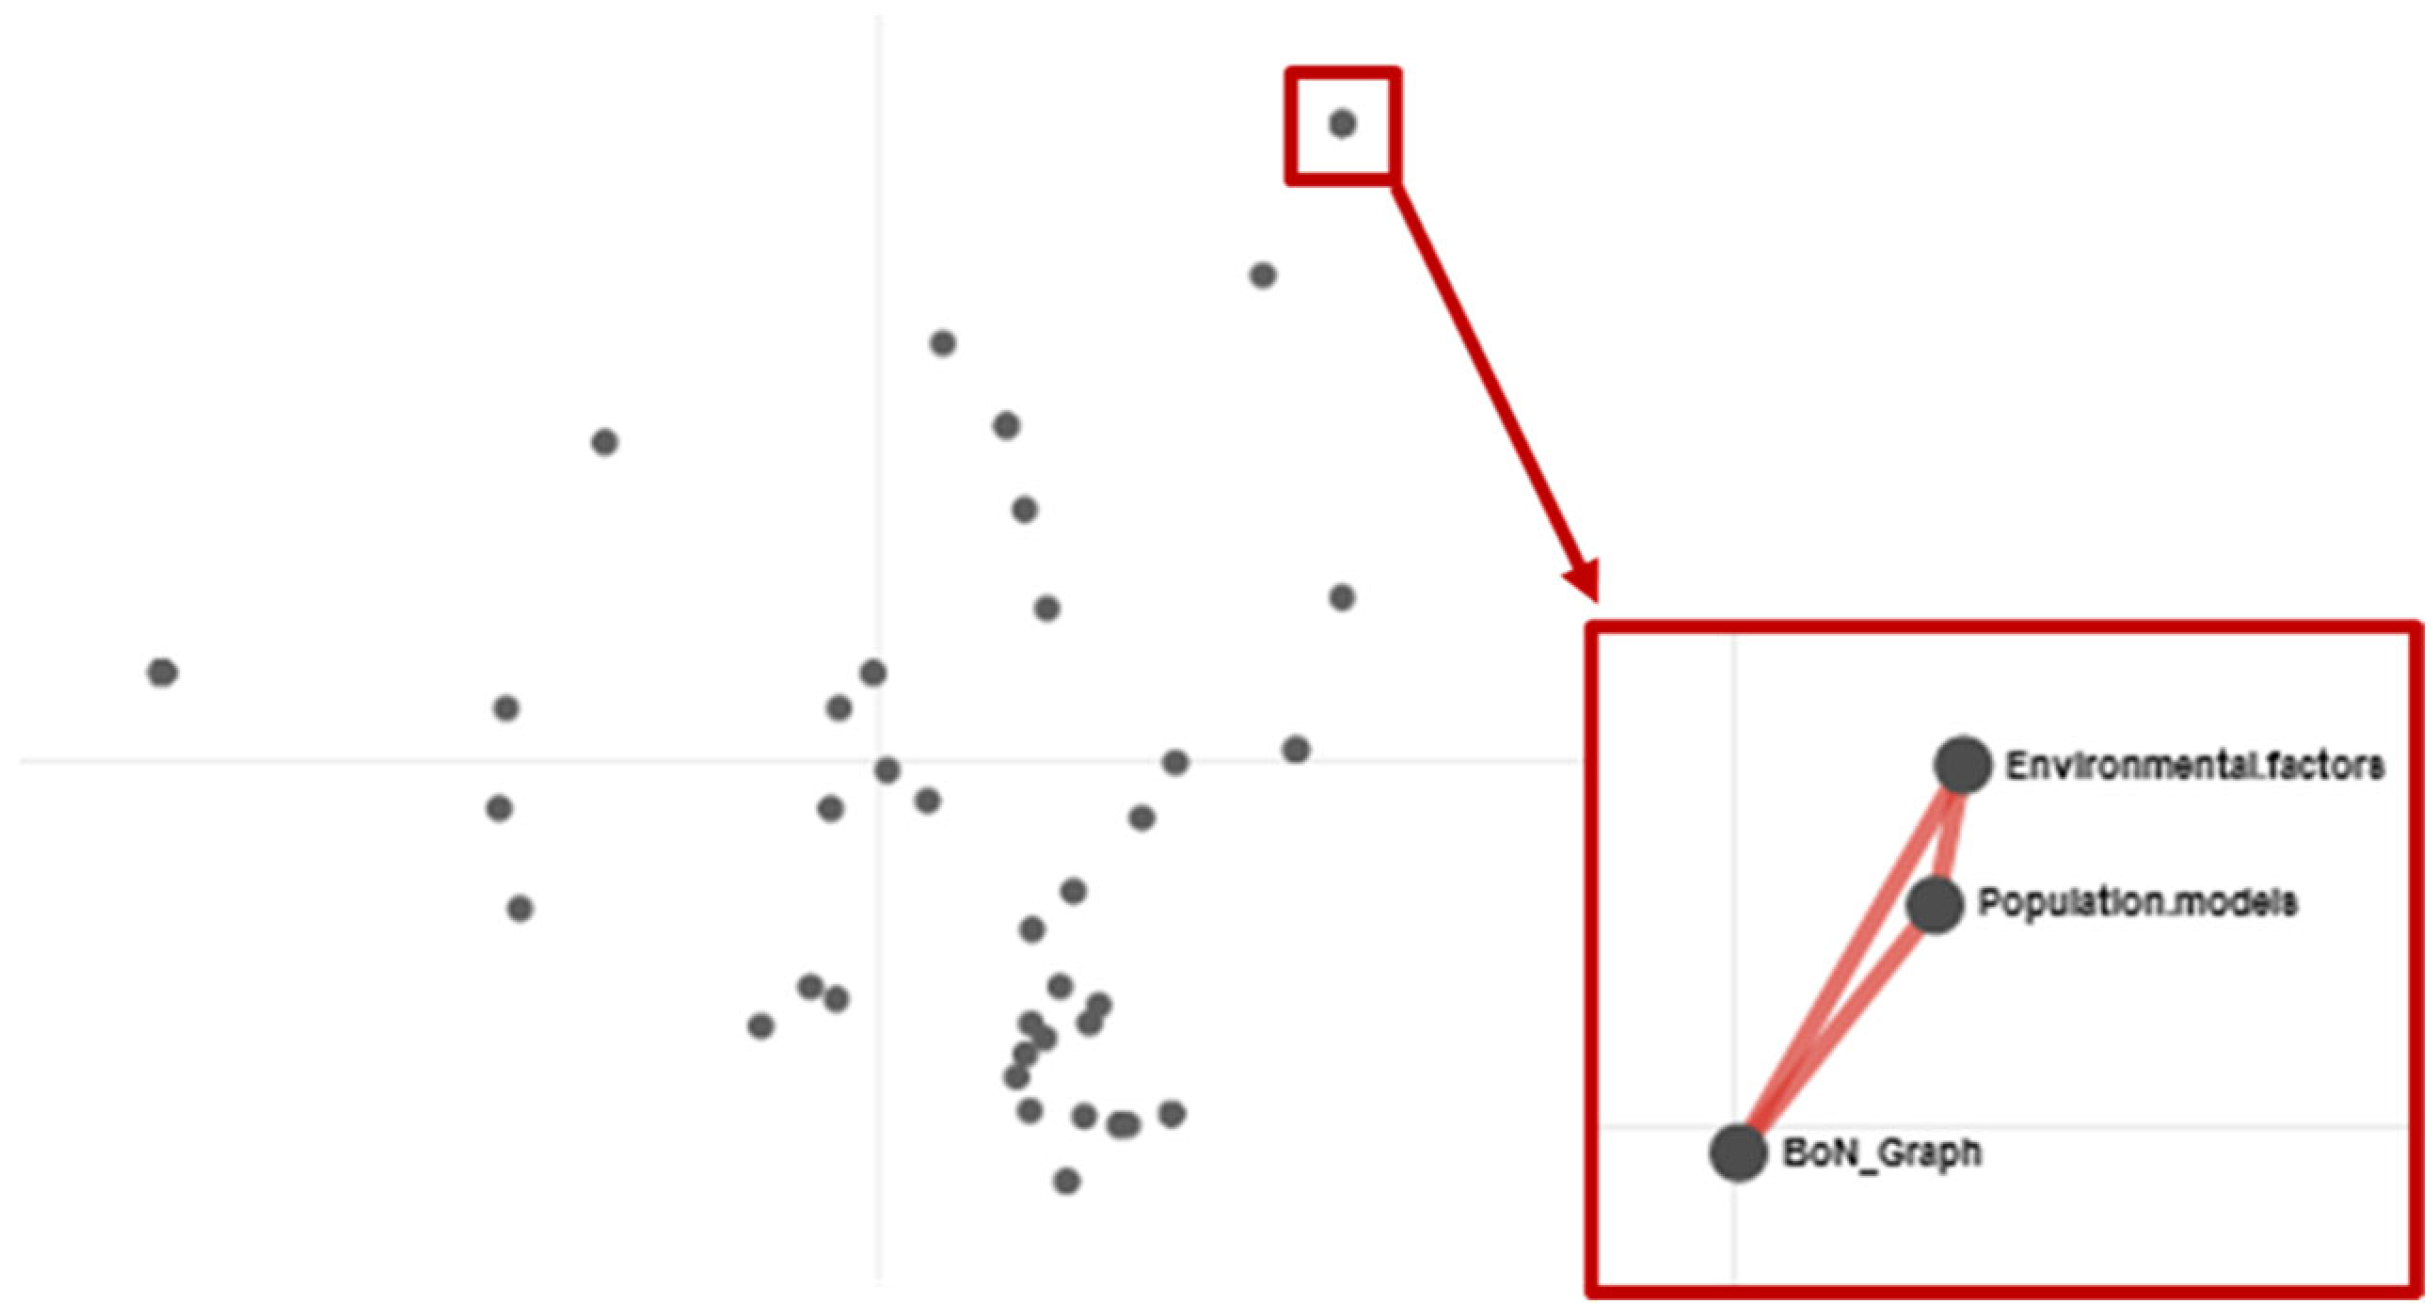
First, the results regarding the prediction groups found by ENA are presented. All individual networks for the answers of the prediction tasks in the three scenarios per participants (N = 60) were modeled into a dynamics network by ENA as shown in Figure 5.
From these individual networks presented as dots, seven explicit prediction groups were defined (Table 2). However, in ten individual networks that represent answers to the prediction task in the second and third scenario, the main explanation for the made prediction was test wiseness. Test wiseness is operationalized as identifying participants’ statements that present experiences from the previous tasks of the test instrument as the main reasons for the task performance under consideration instead of answering the task based on conceptional, epistemic, or procedural knowledge. Test wiseness is often used to improve test performance [48]. For example: “A stable graph was shown in the previous scenario. I want to cover every option”.
The Mann–Whitney test showed that explicit prediction groups within their superior group were statistically different at the alpha = 0.05 level in at least one dimension of the coordinate system, except for divergent prey–predator relation conceptions and mixed conceptions and human disturbance in the FoN/BoN group (Table 2). Based on the theoretical background, both groups represent different aspects of conceptions associated with the BoN metaphor [30,32]; hence, we maintained both explicit prediction groups.
Most predictions given by the participants indicate a tendency towards BoN conceptions (n = 28; 46.7%) or a mix of BoN and FoN conceptions (n = 17; 28.3%). Therefore, BoN-associated data sets presented in the instrument are assumed to be perceived as supportive, while FoN-associated data sets are assumed to be perceived as anomalous data. This assumption is supported by the decrease of frequencies for BoN prediction groups and an increase of FoN/BoN prediction groups after the first scenario (Table 2).
4.1. Prediction Group Changes
Based on the assignment of participants’ answers given to the prediction task to the prediction groups for each scenario, the changes of prediction groups between scenarios were analyzed. Prediction group changes were expected between the scenarios as a reaction to reasoning with anomalous and supportive data regarding the initial prediction made in the previous scenario. Table 3 shows how many participants maintained or changed their superior prediction group from the first to second and second to third scenario.
In most possible changes () the initial prediction groups were maintained, especially when BoN conceptions (n = 14; 35%) or a mix of FoN and BoN conceptions (n = 11; 27.5%) were used initially in the prediction task. Changes of prediction groups between the scenarios occurred fifteen times (37.5%). Most of the changes occurred from prediction groups associated with BoN conceptions to prediction groups associated to a mix of FoN and BoN conceptions (n = 7; 17.5%). In four cases (10%), a change from an FoN or mixed-associated prediction to a more BoN-associated prediction occurred. In particular, changes to and the maintenance of an FoN/BoN prediction group were related to the effect of test wiseness. When participants maintained the superior prediction group, they also maintained their explicit prediction group with one case as an exception.
4.2. Reactions to Anomalous Data
For each scenario, the participants rated their confidence in their prediction before and after dealing with anomalous and supportive data sets on a percentage scale. The difference between the two ratings represents the confidence change. Based on the found differences, five options of confidence change were identified: steady confidence when confidence remained above 50% on the rating scale, steady unconfidence when confidence remained under 50% on the rating scale, confidence in abeyance when confidence remained on 50% on the rating scale, increase to confidence when confidence changed from under 50% to above 50% on the rating scale, and decrease to unconfidence when confidence changed from above 50% to under 50% on the rating scale. Table 4 shows the frequencies of each option across the three scenarios to which the participants gave answers.
The data-based scientific reasoning process with anomalous and supportive data sets in the first scenario led to a wide range of responses regarding the confidence in the initial prediction. While some participants maintained their initial rating of confidence, either as confident or as unconfident, six participants increased their confidence in their prediction after dealing with the data. Furthermore, three participants decreased their confidence, and four participants were undecided about their confidence. In contrast, the frequencies of the confidence change options for the second and third scenarios show a tendency to maintain the rated confidence, either as confident or as unconfident, after dealing with the shown data sets representing population dynamics.
To check relations between confidence change and prediction group change, the presented frequencies shown in Table 3; Table 4 were integrated. Data from Table 4 were limited to the columns for the first and second scenarios because we assessed no further change of the prediction group after participants answered the instrument for the third scenario. Based on this data integration, we defined six possible reactions after dealing with the shown anomalous and supportive data sets (Table 5).
Mostly, participants that maintained their prediction group were confident in their prediction after data-based scientific reasoning (n = 14; 35%). Still, twenty percent of participants maintained their prediction group even if they stated that they are unconfident about their prediction. If participants changed the prediction group by modifying their prediction between the first and second scenario or second and third scenario, they mostly stated to be unconfident towards their initial prediction (n = 7; 17.5%).
4.3. Relation to the Proportion between Anomalous Data and Supportive Data
All participants gave predictions for each of the three scenarios that differ in the proportion between presented BoN and FoN-associated data sets; hence, the proportion of perceived supportive and anomalous data varies. The three scenarios were randomly sequenced between the participants. Table 6 shows the frequencies of reactions to the data in relation to the different proportions between supportive and anomalous data also labeled as the anomalous data ratio.
For both types of reactions to the data, confirmation or modification of the initial prediction, the differences between the frequencies per anomalous data ratio are rather ambiguous showing no statistical difference. However, for confirmation, a tendency of an increasing confidence when confronted with a higher or equal proportion of FoN-associated data sets to BoN-associated data sets can be found.
4.4. Role of Data-Based Reasoning Process
In Table 7, participants’ data-based scientific reasoning processes for the first and second scenario are represented as cells in a two-dimensional system with their assignment to the data appraisal groups in the one dimension and the assignment to the explanation/interpretation groups in the other dimension.
Based on this, it is shown that most of the data-based scientific reasoning processes leading to confirmation were characterized by an undecided or not skeptical appraisal of the data combined with the use of new conceptual knowledge entities in addition to the initial conceptual knowledge entities (n = 15; 60%). Generally, all data-based scientific reasoning processes leading to confirmation were related to the use of new conceptual knowledge entities when explaining/interpreting the data. For a deeper insight into this finding, we first looked for the assigned superior prediction groups of these cases (n FoN/BoN = 11; n BoN = 14). For those cases that maintained an FoN/BoN prediction group, most of the presented data sets were not anomalous, hence, there was no need for modifying the initial prediction as it was not induced by the processed data. This is illustrated by the example of Sascha (Table 8).
When participants maintained their BoN prediction group, they explained or interpreted the data by using different conceptional knowledge entities but were undecided or skeptical regarding the FoN data sets (anomalous data) by tendency. The confirmation of the initial prediction was often explained by arguing with the higher ratio of supporting data sets (statistical reasoning), as exemplified by the case of Chris (Table 9).
Participants who modified their initial prediction showed different data-based scientific reasoning processes. For describing these cases, the direction of modification was considered (n FoN direction = 10; n BoN direction = 5). Almost all modifications of predictions into the FoN direction were related to data-based scientific reasoning processes in which new conceptual knowledge was used, shown by the example of Mika (Table 10).
Modifications of predictions into the BoN direction were related to data-based scientific reasoning processes with a stronger focus on procedural or epistemic knowledge like looking for statistical patterns or argumentations considering the probability of the data. This is illustrated by the example of Nicola (Table 11).
However, for some cases of both reaction types of confirmation and modification, test wiseness had an influence, indicating the tendency to answer the tasks of the instrument in a way that was perceived as the expected one by these participants.
5. Discussion
In this study, our aim was to investigate how participants reason with supportive and anomalous data in the context of population dynamics. In particular, we were interested in the way they confirmed or modified an initial prediction after dealing with different data sets represented as line graphs (Figure 2) by answering tasks coherent to the sub-processes of a data-based scientific reasoning process (Figure 1). For this, we integrated analyses with a product-based and a process-based view.
The first finding supports previous studies investigating conceptions about ecosystems and populations dynamics [30,34,49]. Most of the participants explained their predictions about the development of a population by using conceptions associated with the BoN metaphor (Table 2). Some participants showed a mix of BoN and the scientifically more adequate FoN metaphor-associated conceptions. Furthermore, it is shown that the frequencies of used mixed conceptions increased after the first scenario while using pure BoN conceptions decreased for making a prediction (Table 2). However, most participants maintained their initial predictions (Table 3). This finding supports the theory that conceptions are not replaced by one another, but different conceptions for a phenomenon exist parallel to each other, for example, naïve and scientifically adequate explanations for population dynamics [35]. Which conception is used in a situation depends on the characteristics of the situation itself, as this can inhibit or promote the prevalence of a specific conception [35]. In this study, participants’ conceptions associated with FoN might have been activated with the presentation of the corresponding data sets in the first scenario.
From this product-based view on the results of the study [3], we can distinguish the reactions of participants to the presented data into the confirmation or modification of the initial prediction. Both reactions are related to the confidence participants had in their initial prediction (Table 5). While confirmation is by tendency related to a high confidence in the initial prediction, modification mostly relates to a stated unconfidence in the initial prediction. These findings are consistent with the results of the study by Hemmerich and colleagues [20] in which they found that a decrease in confidence will increase the probability to change the initial theory. However, they found evidence to support the Incremental Change Hypothesis which states that the proportion of anomalous data to supportive data will influence confidence change [20]. In our study, we found by tendency opposite findings regarding the Incremental Change Hypothesis for the reaction of confirmation (Table 6). More or an equivalent proportion of FoN-associated data sets to BoN-associated data sets presented as line graphs led, by tendency, to an increased confidence in the initial prediction. However, a higher proportion of BoN-associated data sets had the opposite effect (Table 6). We assume two causes for this finding. First, predefined FoN-associated data sets, that represent a chaotic fluctuation of the population dynamic, were often interpreted in line with assumed harmonic-fluctuations and hence were perceived as supportive data for BoN predictions. This observation fits with findings of other studies which showed that some people tend to reinterpret anomalous data as fitting with their initial expectation, and hence, perceiving no anomaly at all [8]. Second, in 44% of the cases in which the initial prediction was confirmed in a subsequent scenario, the prediction was assigned into the superior prediction group FoN/BoN. Therefore, data sets that might have been perceived as anomalous were mostly limited to the data sets representing an extinction event. Furthermore, the modification of the initial prediction does not show a relation to the options of confidence change. One important reason might be that one third of the cases in which modification of the prediction occurred were based on test wiseness. Therefore, the modification shown by the participants was not motivated by processing the data in the scenario in a scientific way, but by copying the data sets as predictions to fit an expected outcome in the tasks of the subsequent scenarios. According to the finding for confidence change, this supports previous findings that show how participants’ confidence is more related to the individual perception of acceptance by other people than the ability to refer to evidential considerations [50].
However, besides the effect of test wiseness during the product-based analysis, we do not know how the processing of the data sets during data-based scientific reasoning relates to the reactions regarding the initial predictions. Hence, the analyses of the tasks operationalizing the sub-processes of data-based scientific reasoning, with a focus on the interpretational processes, gave a deeper insight. Based on this, we found that the participants used mostly a combination of conceptual, procedural, and epistemic knowledge to explain and interpret data. In addition, most of them seemed undecided or not skeptical when appraising the data regarding relevance and credibility. Compared to previous studies that investigated responses to anomalous data, our study design favors responses which try to explain the data on a conceptual basis, like reinterpretation, peripheral theory change, and theory change in the taxonomy of responses to anomalous data [8], or use of theoretical concepts in the categories of justifications to hold or reject a hypothesis [9]. This is consistent with the methodological differences between our and the cited studies. First, we explicitly instructed the participants to explain each data set and interpret the data sets regarding their initial prediction. However, Chinn and Brewer [8] asked their participants to rate the believability and consistency to an initial theory of the presented data and explain their ratings. These instructions focus rather on the sub-process of data appraisal; hence, a tendency towards response types that are more on ‘the data side of the [explanation] model’ are expectable [24]. Second, in our study we presented second-hand data represented as line graphs. Compared to Chinn and Brewer [8] who used textual descriptions of evidence, the presentation of empirical data is typical of scientific domains. Furthermore, the representation of data as text passages [8,17], charts [51], or graphs [52] will influence the ambiguity of the perceived anomality. For example, Masnick and colleagues [39] gave empirical support that reasoning with numerical data initiate and support processes of conceptual change which need the activation of conceptual knowledge to formulate alternative explanations. Ludwig and colleagues [9] let participants generate data in laboratory settings or with computer simulations; therefore, they found a variety of justifications to hold or reject a hypothesis that are connected to the methodological issues of the data generation. This fits with findings of studies investigating the effect of first-hand or second-hand data on scientific reasoning. Hug and McNeill [13] concluded that first-hand data support the awareness of limitations and error in data, as well as learners’ understanding of the role of data for knowledge generation in science. This is also supported by findings from other studies, investigating responses to anomalous data during experimentation and modeling activities [10,12]. Second-hand data, in turn, are perceived as authoritative by learners and support more sophisticated reasoning skills like identifying patterns, drawing conclusions, and considering content knowledge, due to being often rather complex compared to first-hand data [13]. These conclusions were supported by our findings that conceptual, procedural, and epistemic knowledge were central during participants’ data-based scientific reasoning processes.
Nevertheless, sophisticated data-based scientific reasoning processes in which new conceptual knowledge is used to explain data do not lead to a change of the initial prediction per se. Hence, in almost all analyzed reasoning processes, new conceptual knowledge was used independent from the subsequent reaction of confirmation or modification regarding the initial prediction. Our analysis approach to integrate a product-based with a process-based view on responses to supportive and anomalous data showed that initial conceptions are strongly held and repeated even if alternative conceptions and explanations are available but are perceived as less likely due to arguments based on epistemic and procedural knowledge.
In general, scientific reasoning is proposed to rely on conceptual, procedural, and epistemic knowledge independent of the used style of reasoning that may be associated with data-based scientific reasoning or not [3]. Hence, our findings suggest that the interdependency between these forms of knowledge might be of crucial interest for future research on scientific reasoning. The role of conceptual knowledge is one aspect that has been extensively discussed lately [53]. Furthermore, a lot of research on the nature of science has been done, a construct that includes many aspects of epistemic knowledge and is related to scientific reasoning skills [54]. However, data-based scientific reasoning might be essential for most scientific reasoning styles, and it is important for all people to engage in data-based argumentation and decision making in the context of socio-scientific and controversial science issues [55].
The interpretation and generalization of the findings of this study have limitations because of methodological decisions. Due to the amount of different data sources to enable the integrational analysis, the sample size was limited. Hence, all interpretations made from the data show tendencies that need to be tested in further studies. However, with this mixed-method approach new hypotheses can be built and tested in subsequent studies. For instance, it would be interesting to observe possible causes for the tendency to maintain an initial expectation and its conceptual explanation, even if other explanations are known, but maybe seen as less likely. In addition, it might be interesting to investigate how other factors regarding data characteristics, besides the proportion between anomalous and supportive data, relate to the data-based scientific reasoning process and their outcomes. This might be moderated by a change of skepticism regarding the data. Additionally, we decided to focus the analysis of this study on the prediction group changes and corresponding data-based scientific reasoning processes, hence we presented the results of the data-based scientific reasoning processes for the first and second scenario. Furthermore, our model of data-based scientific reasoning encompasses and highlights the role of perception. This study focused on the interpretational processes during data-based scientific reasoning; however, the role of perceptual processes is still important for gaining further insights into ongoing cognitive processes. Therefore, the analyzing of additional data assessed with eye-tracking techniques [44] will be the focus of our future research.
Author Contributions
Conceptualization, S.M. and A.U.z.B.; methodology, S.M.; formal analysis, S.M.; investigation, S.M.; writing—original draft preparation, S.M.; supervision, A.U.z.B. All authors have read and agreed to the published version of the manuscript.
Funding
This research received no external funding.
Informed Consent Statement
The respondents agreed to data use for research.
Data Availability Statement
The datasets are not publicly available.
Conflicts of Interest
The authors declare no conflict of interest.
Appendix A

Table A1.
Category System.
| Category | Subcategory | Code | Description |
|---|---|---|---|
| Type of graphed prediction | BoN Graph | The graph shows a trend that represents a stable population development. Stable is defined as linear horizontal or around a mean value fluctuating lines. The fluctuation is mostly uniform, and the amplitudes are low. | |
| FoN Graph | The graph shows an unstable, chaotic trend. FoN graphs include increasing, decreasing, and chaotic or with high amplitudes fluctuating graphs. | ||
| Conceptual knowledge | BoN conceptions | Stability | The general assumption of a stable development or that disturbances are not expected is stated. |
| Human disturbances | Human caused disturbances are named as reasons for instability. | ||
| Harmonic prey–predator relationship (PPR) | A harmonic regulation by prey–predator relationship is stated as a reason for stability. | ||
| FoN conceptions | Instability | An unpredictable/instable development is described. | |
| Natural causes | Natural causes (e.g., disturbances like epidemics, fires, and invasive species; climate changes; change of environmental resource; imi- and emigration) are described as reasons for an instable development. | ||
| Inharmonic PPR | Predator caused changes that may also cause extinction are stated. | ||
| Content knowledge | Population models | Biological models like capacity limit, logarithmic population development, or prey–predator models (Lotka–Volterra) are named. | |
| Patch dynamics | Aspects of a heterogeneous ecosystem like naturally changing resources or imi- and emigration of populations are named. | ||
| Disturbances | The chance and importance of disturbances for development in ecosystems are named. | ||
| Biodiversity | Aspects of biodiversity (also genetics) are named. | ||
| Environmental factors | Change of biotic and/or abiotic factors are named. | ||
| Procedural knowledge | Statistics | The data are statistically treated (e.g., comparison of means/data points, calculating/estimating mean values). | |
| CVS | Aspects of the importance to control variables are stated. | ||
| Patterns | The identification of patterns in the data is stated. | ||
| Diagram competence | Represent | The data sets represented as line graphs are described superficially without explaining the shown relation. | |
| Syntactic | The data sets represented as line graphs are described by stating aspects of the shown relation, trend or single data points, no connection to the phenomenon/conceptual knowledge is given. Data sets are compared superficially. | ||
| Semantic | The data sets represented as line graphs are described by stating aspects of the shown relation, trend, or single data points and a connection to the phenomenon/conceptual knowledge is given. Data sets are compared with relation to the phenomenon. | ||
| Epistemic knowledge | Limits of models | Aspects of the limits or hypothetical nature of models are named. | |
| Probability | Aspects of probability and significance are named. | ||
| Credibility | Aspects of credibility or believability of the data are stated. | ||
| Quality | Aspects of quality of the data are stated (e.g., reliability of measurement, replication, experimentation bias). | ||
| Others | Uncertainty | Aspects of uncertainty (e.g., need for more information) are stated. | |
| Test wiseness | Experiences from previous tasks are stated as reasons for any task performance. | ||
| General prior knowledge/Intuition | General prior knowledge (e.g., memorizing from schoolbooks) or intuition are stated as reasons for any task performance. |
References
- Fischer, F.; Kollar, I.; Ufer, S.; Sodian, B.; Hussmann, H.; Pekrun, R.; Eberle, J. Scientific reasoning and argumentation: Advancing an interdisciplinary research agenda in education. Frontline Learn. Res. 2014, 2, 28–45. [Google Scholar]
- Zimmerman, C.; Croker, S. Learning science through inquiry. In Handbook of the Psychology of Science; Feist, G.J., Gorman, M.E., Eds.; Springer Publishing Company: New York, NY, USA, 2013; pp. 49–70. [Google Scholar]
- Kind, P.; Osborne, J. Styles of scientific reasoning: A cultural rationale for science education? Sci. Educ. 2017, 101, 8–31. [Google Scholar] [CrossRef] [Green Version]
- Lehrer, R.; Schauble, L. The development of scientific thinking. In Handbook of Child Psychology and Developmental Science: Cognitive Processes; Liben, L.S., Müller, U., Lerner, R.M., Eds.; John Wiley & Sons, Inc.: Hoboken, NJ, USA, 2015; pp. 671–714. [Google Scholar]
- Zimmerman, C. The development of scientific thinking skills in elementary and middle school. Dev. Rev. 2007, 27, 172–223. [Google Scholar] [CrossRef]
- NGSS Lead States. Next Generation Science Standards: For States, by States; The National Academy Press: Washington, DC, USA, 2013. [Google Scholar]
- Samarapungavan, A. Construing scientific evidence: The role of disciplinary knowledge in reasoning with and about evidence in scientific practice. In Scientific Reasoning and Argumentation: The Roles of Domain-Specific and Domain-General Knowledge; Fischer, F., Chinn, C.A., Engelmann, K., Osborne, J., Eds.; Routledge: London, UK, 2018; pp. 66–86. [Google Scholar]
- Chinn, C.A.; Brewer, W.F. An empirical test of a taxonomy of responses to anomalous data in science. J. Res. Sci. Teach. 1998, 35, 623–654. [Google Scholar] [CrossRef]
- Ludwig, T.; Priemer, B.; Lewalter, D. Assessing secondary school students’ justifications for supporting or rejecting a scientific hypothesis in the physics lab. Res. Sci. Educ. 2019, 51, 1–26. [Google Scholar] [CrossRef] [Green Version]
- Meister, S.; Krell, M.; Göhner, M.; Upmeier zu Belzen, A. Pre-service biology teachers’ responses to first-hand anomalous data during modelling processes. Res. Sci. Educ. 2020, 52, 1–21. [Google Scholar] [CrossRef] [Green Version]
- Göhner, M.; Krell, M. Preservice science teachers’ strategies in scientific reasoning: The case of modeling. Res. Sci. Educ. 2020, 1–20. [Google Scholar] [CrossRef]
- Crujeiras-Pérez, B.; Jiménez-Aleixandre, M.P. Students’ progression in monitoring anomalous results obtained in inquiry-based laboratory tasks. Res. Sci. Educ. 2019, 49, 243–264. [Google Scholar] [CrossRef]
- Hug, B.; McNeill, K.L. Use of first-hand and second-hand data in science: Does data type influence classroom conversations? Int. J. Sci. Educ. 2008, 30, 1725–1751. [Google Scholar] [CrossRef]
- Johnstone, A.H.; Sleet, R.J.; Vianna, J.F. An information processing model of learning: Its application to an undergraduate laboratory course in chemistry. Stud. Higher Educ. 1994, 19, 77–87. [Google Scholar] [CrossRef]
- Chinn, C.A.; Brewer, W.F. The role of anomalous data in knowledge acquisition: A theoretical framework and implications for science instruction. Rev. Educ. Res. 1993, 63, 1–49. [Google Scholar] [CrossRef]
- Limón, M. On the cognitive conflict as an instructional strategy for conceptual change: A critical appraisal. Learn. Instr. 2001, 11, 357–380. [Google Scholar] [CrossRef]
- Mason, L. Responses to anomalous data on controversial topics and theory change. Learn. Instr. 2001, 11, 453–483. [Google Scholar] [CrossRef]
- Lin, J.-Y. Responses to anomalous data obtained from repeatable experiments in the laboratory. J. Res. Sci. Teach. 2007, 44, 506–528. [Google Scholar] [CrossRef]
- Chinn, C.A.; Malhotra, B.A. Children’s responses to anomalous scientific data: How is conceptual change impeded? J. Educ. Psychol. 2002, 94, 327–343. [Google Scholar] [CrossRef]
- Hemmerich, J.A.; Van Voorhis, K.; Wiley, J. Anomalous evidence, confidence change, and theory change. Cognit. Sci. 2016, 40, 1534–1560. [Google Scholar] [CrossRef]
- Jeong, H.; Songer, N.B.; Lee, S.-Y. Evidentiary Competence: Sixth Graders’ Understanding for Gathering and Interpreting Evidence in Scientific Investigations. Res. Sci. Educ. 2007, 37, 75–97. [Google Scholar] [CrossRef]
- Kang, S.; Scharmann, L.C.; Noh, T. Reexamining the role of cognitive conflict in science concept learning. Res. Sci. Educ. 2004, 34, 71–96. [Google Scholar] [CrossRef]
- Brewer, W.F. Perception is theory laden: The naturalized evidence and philosophical implications. J. Gen. Philos. Sci. 2015, 46, 121–138. [Google Scholar] [CrossRef]
- Chinn, C.A.; Brewer, W.F. Models of data: A theory of how people evaluate data. Cognit. Instr. 2001, 19, 323–393. [Google Scholar] [CrossRef]
- Roberts, R.; Johnson, P. Understanding the quality of data: A concept map for ‘the thinking behind the doing’ in scientific practice. Curriculum J. 2015, 26, 345–369. [Google Scholar] [CrossRef] [Green Version]
- Duncan, R.G.; Chinn, C.A.; Barzilai, S. Grasp of evidence: Problematizing and expanding the next generation science standards’ conceptualization of evidence. J. Res. Sci. Teach. 2018, 55, 907–937. [Google Scholar] [CrossRef]
- Chan, C.; Burtis, J.; Bereiter, C. Knowledge building as a mediator of conflict in conceptual change. Cognit. Instr. 1997, 15, 1–40. [Google Scholar] [CrossRef] [Green Version]
- A Osborne, J.F.; Patterson, A. Scientific argument and explanation: A necessary distinction? Sci. Educ. 2011, 95, 627–638. [Google Scholar] [CrossRef]
- Kane, J.E.; Webster, G.D. Heuristics and Biases That Help and Hinder Scientists: Toward a Psychology of Scientific Judgment and Decision Making. In Handbook of the Psychology of Science; Feist, G.J., Gorman, M., Gorman, M.E., Eds.; Springer Publishing Company: New York, NY, USA, 2013; pp. 437–459. [Google Scholar]
- Sander, E.; Jelemenská, P.; Kattmann, U. Towards a better understanding of ecology. J. Biol. Educ. 2004, 40, 119–123. [Google Scholar] [CrossRef]
- Ladle, R.J.; Gillson, L. The (im)balance of nature: A public perception time-lag? Publ. Underst. Sci. 2009, 18, 229–242. [Google Scholar] [CrossRef]
- Cuddington, K. The “Balance of Nature” Metaphor and Equilibrium in Population Ecology: Biology and Philosophy. Biol. Philos. 2001, 16, 463–479. [Google Scholar] [CrossRef]
- Korfiatis, K.J.; Stamou, A.G.; Paraskevopoulos, S. Images of nature in Greek primary school textbooks. Sci. Educ. 2004, 88, 72–89. [Google Scholar] [CrossRef]
- Zimmerman, C.; Cuddington, K. Ambiguous, circular and polysemous: Students’ definitions of the \”balance of nature\” metaphor. Publ. Underst. Sci. 2007, 16, 393–406. [Google Scholar] [CrossRef]
- Potvin, P. The Coexistence Claim and Its Possible Implications for Success in Teaching for Conceptual “Change”. Eur. J. Sci. Math. Educ. 2017, 5, 55–66. [Google Scholar] [CrossRef]
- Smith, R.L. Ecology and Field Biology, 5th ed.; HarperCollins: New York, NY, USA, 1996. [Google Scholar]
- Sandoval, J. Teaching in subject matter areas: Science. Annu. Rev. Psychol. 1995, 46, 355–374. [Google Scholar] [CrossRef]
- Roth, W.-M.; Bowen, G.M.; McGinn, M.K. Differences in graph-related practices between high school biology textbooks and scientific ecology journals. J. Res. Sci. Teach. 1999, 36, 977–1019. [Google Scholar] [CrossRef]
- Masnick, A.M.; Klahr, D.; Knowles, E.R. Data-driven belief revision in children and adults. J. Cognit. Dev. 2017, 18, 87–109. [Google Scholar] [CrossRef]
- Nitz, S.; Meister, S.; Schwanewedel, J.; Upmeier zu Belzen, A. Kompetenzraster zum Umgang mit Liniendiagrammen: Ein Beispiel für Diagnostik im Lehr-Lern-Labor. MNU J. 2018, 6, 393–400. [Google Scholar]
- Meister, S.; Zimmerman, C.; Upmeier zu Belzen, A. Visualizing pre-service biology teachers’ conceptions about population dynamics in ecosystems. Sci. Educ. Rev. Lett. 2018. [Google Scholar] [CrossRef]
- Upmeier zu Belzen, A.; Engelschalt, P.; Krüger, D. Modeling as Scientific Reasoning—The Role of Abductive Reasoning for Modeling Competence. Educ. Sci. 2021, 11, 495. [Google Scholar] [CrossRef]
- Sale, J.E.; Lohfeld, L.H.; Brazil, K. Revisiting the quantitative-qualitative debate: Implications for mixed-methods research. Qual. Quant. 2002, 36, 43–53. [Google Scholar] [CrossRef] [PubMed]
- Holmqvist, K.; Nyström, M.; Andersson, R.; Dewhurst, R.; Jarodzka, H.; Van de Weijer, J. Eye Tracking: A Comprehensive Guide to Methods and Measures; OUP Oxford: Oxford, UK, 2011. [Google Scholar]
- Hartmann, S.; Upmeier zu Belzen, A.; Krüger, D.; Pant, H. Scientific reasoning in higher education. Z. Psychol. 2015, 223, 47–53. [Google Scholar] [CrossRef]
- Mayring, P. Qualitative Content Analysis: Theoretical Foundation, Basic Procedures and Software Solution; Theoretical Foundation, Basic Procedures and Software Solution: Klagenfurt, Austria, 2014. [Google Scholar]
- Shaffer, D.W.; Ruis, A.R. Epistemic network analysis: A worked example of theory-based learning analytics. In Handbook of learning analytics; Lang, C., Siemens, G., Wise, A.F., Gasevic, D., Eds.; Society for Learning Analytics Research: Edmonton, AL, USA, 2017; pp. 175–187. [Google Scholar]
- Roberson, D.B. Test-Wiseness and Background Knowledge: Their Relative Contributions to High Test Performance; Mississippi State University: Mississippi State, MS, USA, 2020. [Google Scholar]
- Ampatzidis, G.; Ergazaki, M. Challenging Students’ Belief in the ‘Balance of Nature’ Idea. Sci. Educ. 2018, 27, 895–919. [Google Scholar] [CrossRef]
- Shtulman, A. Confidence without Competence in the Evaluation of Scientific Claims. In Proceedings of the Annual Meeting of the Cognitive Science Society, Portland, OR, USA, 11–14 August 2010; Volume 32. [Google Scholar]
- Masnick, A.M.; Morris, B.J. Investigating the development of data evaluation: The role of data characteristics. Child Dev. 2008, 79, 1032–1048. [Google Scholar] [CrossRef] [PubMed] [Green Version]
- Berland, L.K.; Lee, V.R. Anomalous graph data and claim revision during argumentation. In Proceedings of the ICLS 2010 Conference Proceedings—9th International Conference of the Learning Sciences, Chicago, IL, USA, 29 June–2 July 2010; Volume 2, pp. 314–315. [Google Scholar]
- Fischer, F.; Chinn, C.A.; Engelmann, K.; Osborne, J. (Eds.) Scientific Reasoning and Argumentation: The Roles of Domain-Specific and Domain-General Knowledge; Routledge: New York, NY, USA, 2018. [Google Scholar]
- Mahler, D.; Bock, D.; Bruckermann, T. Preservice Biology Teachers’ Scientific Reasoning Skills and Beliefs about Nature of Science: How Do They Develop and Is There a Mutual Relationship during the Development? Educ. Sci. 2021, 11, 558. [Google Scholar] [CrossRef]
- Beniermann, A.; Mecklenburg, L.; Upmeier zu Belzen, A. Reasoning on Controversial Science Issues in Science Education and Science Communication. Educ. Sci. 2021, 11, 522. [Google Scholar] [CrossRef]

Figure 2.
Example stimulus showing the six line graphs that represent different outcomes for the population development of a specific species in a defined ecosystem. Three line graphs are pre-defined as BoN-associated (B,D,F) and three line graphs are pre-defined as FoN-associated (A,C,E).
Figure 2.
Example stimulus showing the six line graphs that represent different outcomes for the population development of a specific species in a defined ecosystem. Three line graphs are pre-defined as BoN-associated (B,D,F) and three line graphs are pre-defined as FoN-associated (A,C,E).

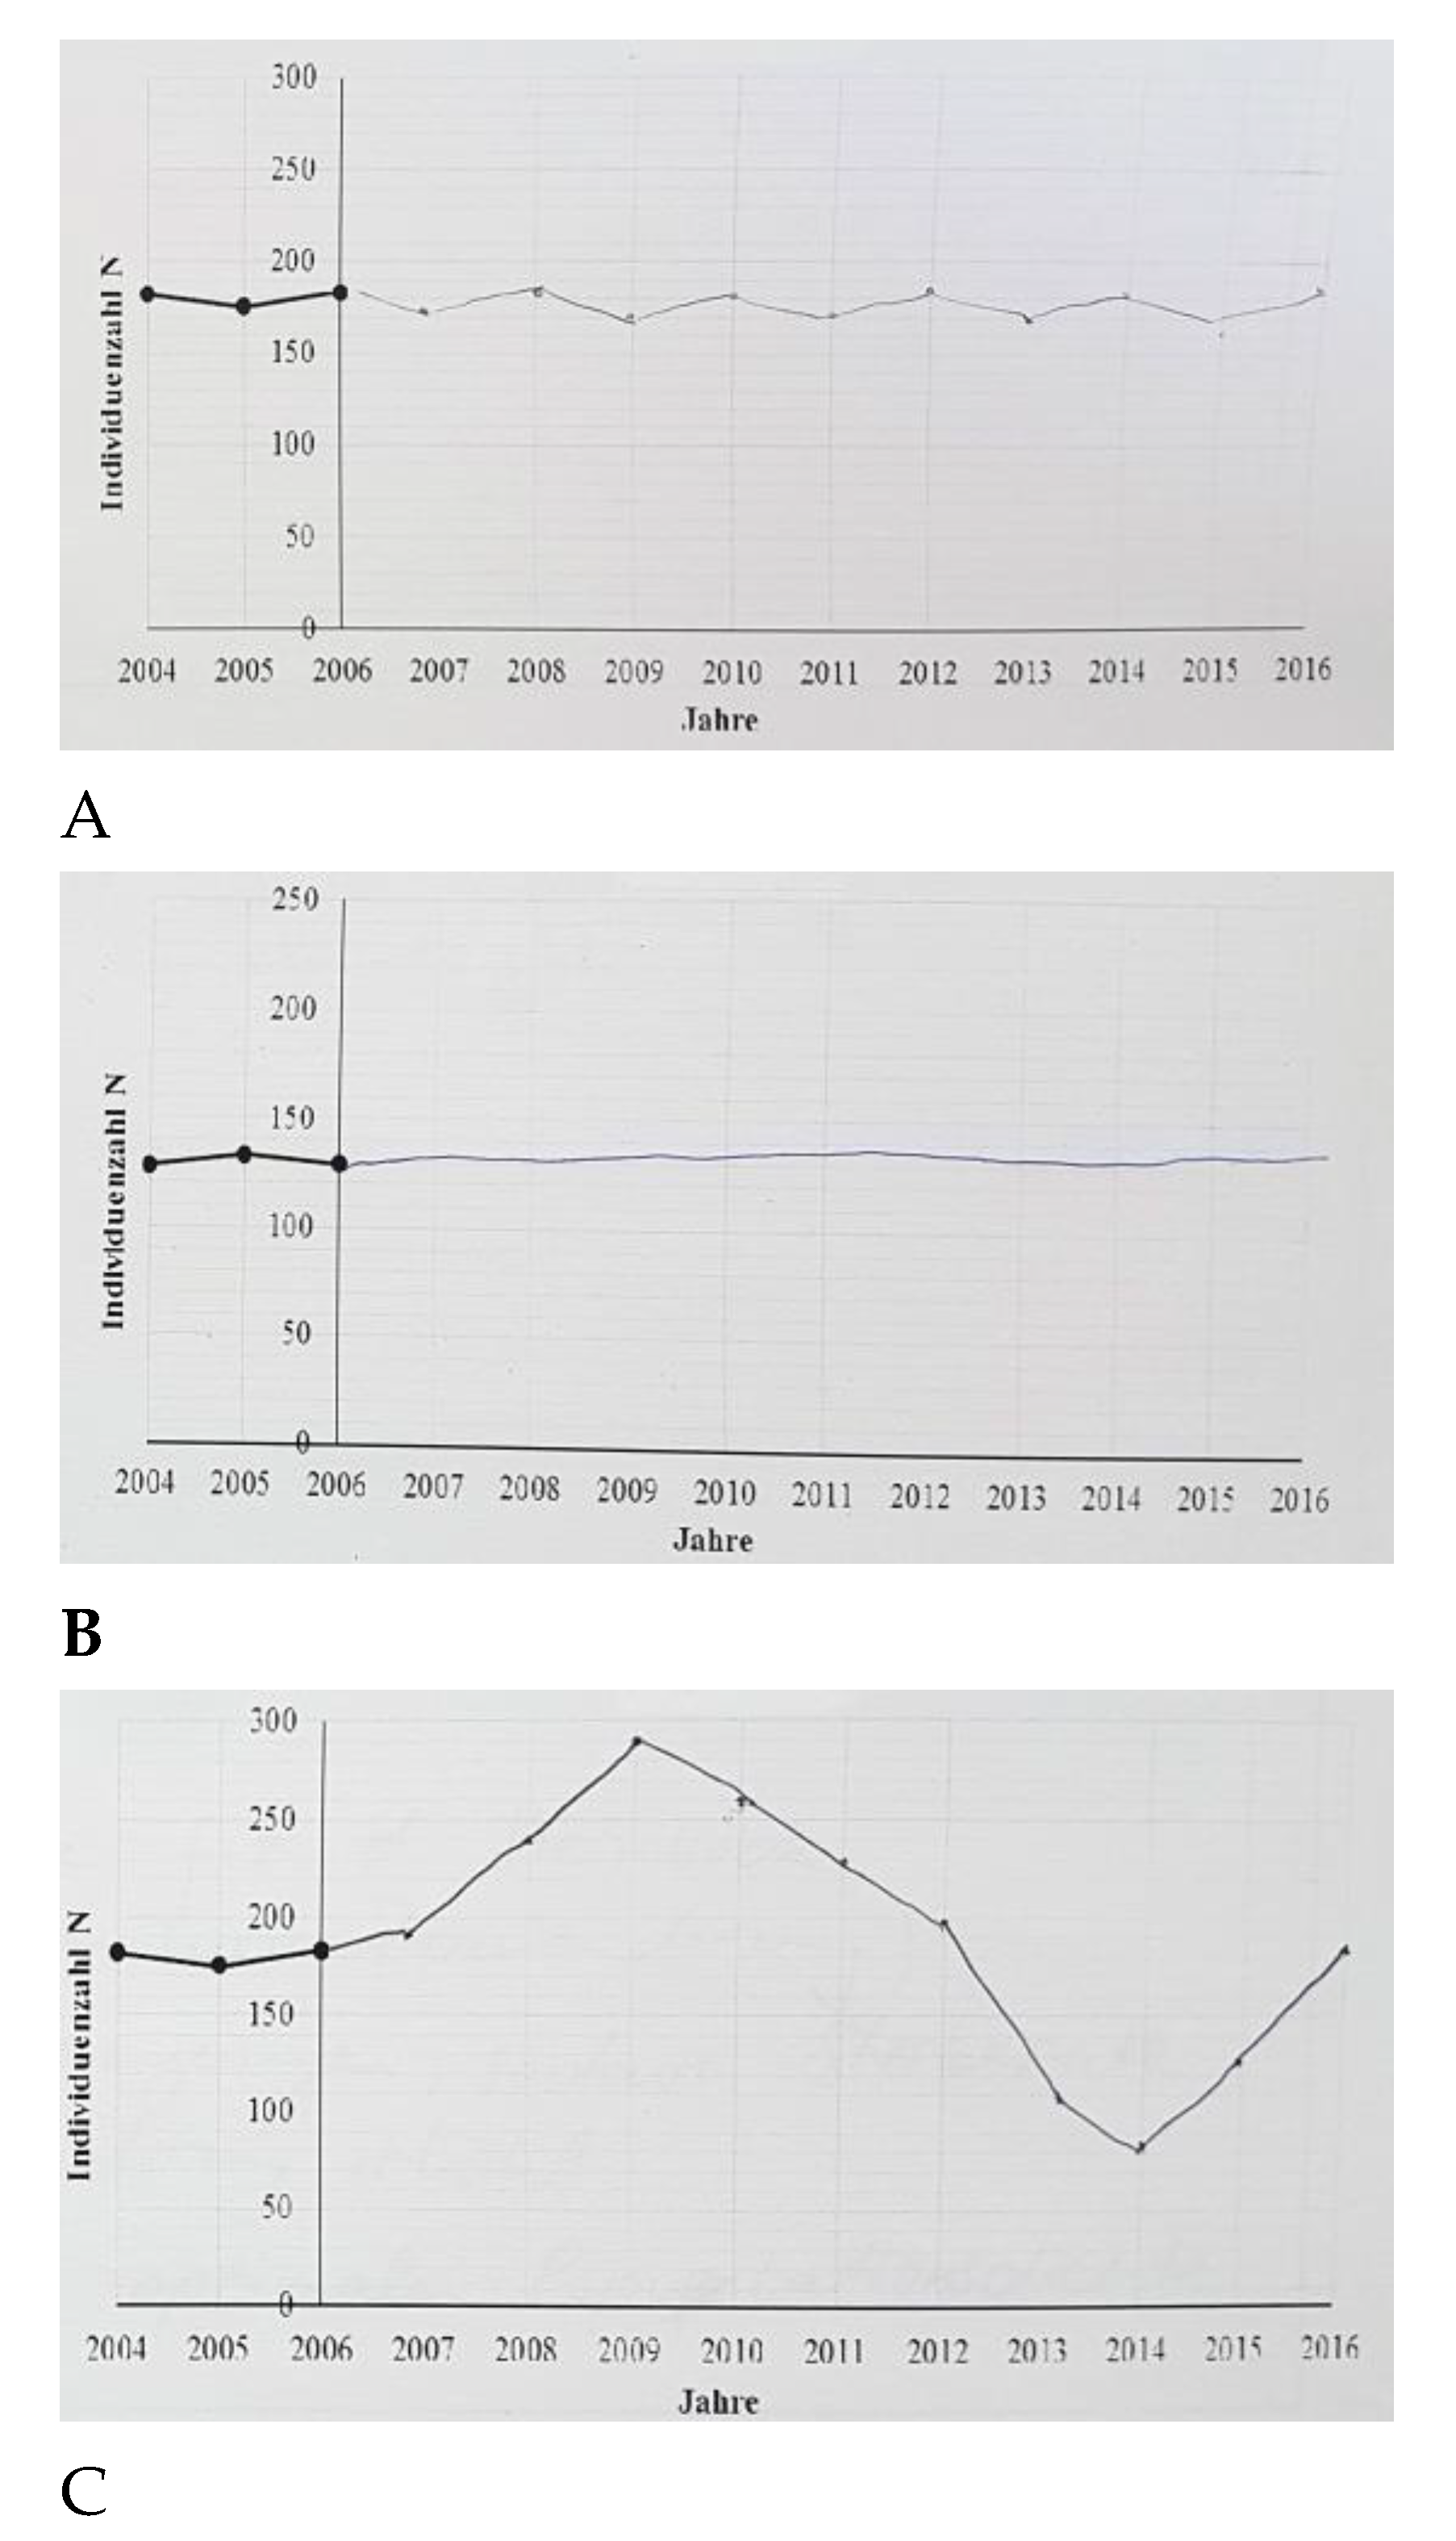
Figure 3.
(a,b) Examples of graphed predictions for the population development of a specific species in a defined ecosystem that were assigned into BoN-associated. (c) Example of a graphed prediction for the population development of a specific species in a defined ecosystem that was assigned into FoN-associated.

Figure 4.
Schematic representation of the analysis processes for this study.

Figure 5.
Individual networks for all predictions made by the participants in a two-dimensional system modeled with ENA.
Figure 5.
Individual networks for all predictions made by the participants in a two-dimensional system modeled with ENA.

Table 1.
Overview of the used tasks and their corresponding sub-processes of the model of data-based scientific reasoning.
Table 1.
Overview of the used tasks and their corresponding sub-processes of the model of data-based scientific reasoning.
| Sub-Process/Task | Task Content | Format of Data Assessment |
|---|---|---|
| Prediction | Making predictions about population development | Open-ended graphing task combined with open-ended writing task for explanation |
| Rating the confidence in the made predictions | Rating scale: percentage scale from 0% (totally unconfident) to 100% (totally confident) | |
| Data visual perception (perceptual) | Looking on the presented data sets without a further instruction. | Eye tracking experiment |
| Data selection (perceptual) | Selecting data sets | Multiple-choice task |
| Data appraisal (perceptual/interpretational) | Rating credibility, relevance, and fit of each data set | Rating scales from 1 (credible/relevant/fitting) to 5 (non-credible/irrelevant/not fitting) |
| Data explanation (interpretational) | Explaining each data set | Open-ended writing task |
| Data interpretation (interpretational) | Interpreting data sets regarding initial conceptions | Open-ended writing task |
| Rating the confidence in the made predictions retrospectively | Rating scale: percentage scale from 0% (totally unconfident) to 100% (totally confident) |
Table 2.
Descriptions and absolute frequencies per scenario (N 1st; N 2nd; N 3rd) of superior prediction groups and explicit prediction groups found with ENA.
Table 2.
Descriptions and absolute frequencies per scenario (N 1st; N 2nd; N 3rd) of superior prediction groups and explicit prediction groups found with ENA.
| Superior Prediction Groups | Explicit Prediction Groups | Mean Network Model | Description | N 1st | N 2nd | N 3rd |
|---|---|---|---|---|---|---|
| BoN | Harmonic prey–predator relation (PPR) conception |  | Participants assigned to this group graphed BoN predictions and explained their predictions with their content knowledge about population models that they connected with conceptions about stability and harmonic prey–predator relationships. | 4 | 3 | 1 |
| Stability conception |  | Participants assigned to this group graphed BoN predictions and explained their predictions with a general stability conception. | 7 | 3 | 4 | |
| Content knowledge |  | Participants assigned to this group graphed BoN predictions and explained their predictions with biological content knowledge. They mentioned population models and environmental factors, without connecting these with stability conceptions. | 3 | 2 | 1 | |
| FoN/BoN | Mixed conceptions and content knowledge |  | Participants assigned to this group graphed BoN predictions and FoN predictions. They explained their predictions with biological content knowledge. They connected their knowledge with divergent conceptions addressing both FoN (natural causes, inharmonic PPR) and BoN (stability, harmonic PPR). | 3 | 4 | 2 |
| Divergent prey–predator relation conceptions |  | Participants assigned to this group graphed BoN predictions and FoN predictions. They explained their predictions with divergent conceptions about prey–predator relationships addressing both FoN and BoN. | 0 | 1 | 2 | |
| Mixed conceptions and human disturbance |  | Participants assigned to this group graphed FoN predictions. They explained their predictions with biological content knowledge and FoN related conceptions. They also mentioned human disturbance when explaining their predictions. | 1 | 3 | 1 | |
| FoN | FoN conceptions and content knowledge |  | Participants assigned to this group graphed FoN predictions. They explained their predictions with biological content knowledge, mostly mentioning population models. They connected their knowledge with FoN-related conceptions. | 2 | 0 | 3 |
Table 3.
Absolute frequencies of superior prediction group changes between the first and second scenario and the second and third scenario.
Table 3.
Absolute frequencies of superior prediction group changes between the first and second scenario and the second and third scenario.
| To From | BoN | FoN/BoN | FoN |
|---|---|---|---|
| BoN | n1st-2nd = 8 (* = 1) n2nd-3rd = 6 (* = 1) | n1st-2nd = 6 (* = 3) n2nd-3rd = 1 | n1st-2nd = 0 n2nd-3rd = 2 |
| FoN/BoN | n1st-2nd = 0 n2nd-3rd = 3 (* = 2) | n1st-2nd = 4 n2nd-3rd = 7 (* = 3) | n1st-2nd = 0 n2nd-3rd = 1 |
| FoN | n1st-2nd = 1 n2nd-3rd = 0 | n1st-2nd = 1 n2nd-3rd = 0 | n1st-2nd = 0 n2nd-3rd = 0 |
* Frequencies of cases in which test wiseness was included into the explanations for a made prediction.
Table 4.
Absolute frequencies of options for confidence change which occurred within the first, second, and third scenarios.
Table 4.
Absolute frequencies of options for confidence change which occurred within the first, second, and third scenarios.
| Confidence Change Options | N (1st Scenario) | N (2nd Scenario) | N (3rd Scenario) |
|---|---|---|---|
| Steady confidence | 4 | 8 | 9 |
| Steady unconfidence | 4 | 5 | 4 |
| Confidence in abeyance | 4 | 4 (+1) | 5 |
| Increase to confidence | 5 (+1) 1 | 1 | 1 |
| Decrease to unconfidence | 3 | 2 | 1 (+1) |
1 One participant made two different predictions and rated them separately.
Table 5.
Absolute frequencies and percentages of reactions to anomalous data shown by the participants.
Table 5.
Absolute frequencies and percentages of reactions to anomalous data shown by the participants.
| Reactions | N |
|---|---|
| Confident confirmation | 14 (* = 3; 35%) |
| Undecided confirmation | 4 (10%) |
| Unconfident confirmation | 7 (* = 2; 17.5%) |
| Confident modification | 4 (* = 1; 10%) |
| Undecided modification | 4 (* = 1; 10%) |
| Unconfident modification | 7 (* = 3; 17.5%) |
* Frequencies of cases in which test wiseness was included into the explanations for a made prediction.
Table 6.
Absolute frequencies and percentages of reactions to anomalous and supportive data shown by the participants in relation to the anomalous data ratio within the three scenarios.
Table 6.
Absolute frequencies and percentages of reactions to anomalous and supportive data shown by the participants in relation to the anomalous data ratio within the three scenarios.
| Reactions | Anomalous Data Ratio (BoN:FoN) | ||
|---|---|---|---|
| 2:4 | 3:3 | 4:2 | |
| Confident confirmation | n = 5 (* = 1) | n = 6 (* = 2) | n = 3 |
| Undecided confirmation | n = 2 | n = 0 | n = 2 |
| Unconfident confirmation | n = 2 | n = 1 | n = 4 (* = 2) |
| Confirmation (N = 25) | n = 9 (* = 1; 36%) | n = 7 (* = 2; 28%) | n = 9 (* = 2; 36%) |
| Confident modification | n = 2 (* = 1) | n = 1 | n = 1 |
| Undecided modification | n = 0 | n = 3 (* = 1) | n = 1 |
| Unconfident modification | n = 3 (* = 2) | n = 2 (* = 1) | n = 2 |
| Modification (N = 15) | n = 5 (* = 3; 33.3%) | n = 6 (* = 2; 40%) | n = 4 (26.7%) |
* Frequencies of cases in which test wiseness was included into the explanations for a made prediction.
Table 7.
Assignment of participants’ data-based scientific reasoning processes into the two dimensions data appraisal and data explanation/interpretation based on their answers for the first and second scenario. Participants’ reactions regarding their initial prediction are highlighted with italic letters when assigned to confirmation (n = 25; * = 5) and bold letters when assigned to modification (n = 15; * = 5).
| New Conceptual Knowledge | Initial Conceptual Knowledge | No Explanation | |||
|---|---|---|---|---|---|
| Only | Plus Procedural and/or Epistemic Knowledge | Only | Plus Procedural and/or Epistemic Knowledge | ||
| Skeptical general | Finn_1st Sam_2nd | ||||
| Skeptical credibility | Alex_1st Andrea_2nd Andy_2nd | ||||
| Skeptical relevance | Jamie_1st Quinn_2nd | ||||
| Undecided | Andrea_1st Bente_2nd * Jona_2nd Kay_2nd Noah_1st Noah_2nd | Bente_1st * Chris_1st Chris_2nd Finn_2nd Kim_1st Luca_1st Luca_2nd Quinn_1st Sam_1st | Nicola_2nd | Nicola_1st | |
| Not skeptical | Charlie_2nd Jona_1st Kim_2nd * Mika_2nd Toni_1st * | Alex_2nd * Andy_1st Charlie_1st * Jamie_2nd * Kay_1st Mika_1st Robin_1st * Robin_2nd * Sascha_1st Sascha_2nd | Toni_2nd * | ||
* Participants’ cases in which they used test wiseness as an explanation for their made prediction.
Table 8.
Illustration of the prediction group change and data-based scientific reasoning process of Sascha in the first scenario.
Table 8.
Illustration of the prediction group change and data-based scientific reasoning process of Sascha in the first scenario.
| Prediction Group 1st Scenario | Data Interpretation (Extract) | Prediction Group 2nd Scenario |
|---|---|---|
Mixed conceptions and content knowledge | “During this time, factors exist that influenced the population density in a negative way (e.g., predators, disasters).” “Similar to prediction, only time period for regeneration of the population density was not correct.” “Confidence highly increased due to the similarities to the data.” | Mixed conceptions and content knowledge |
Table 9.
Illustration of the prediction group change and data-based scientific reasoning process of Chris in the second scenario.
Table 9.
Illustration of the prediction group change and data-based scientific reasoning process of Chris in the second scenario.
| Prediction Group 2nd Scenario | Data Interpretation (Extract) | Prediction Group 3rd Scenario |
|---|---|---|
Stability conception | “Massive changes of environmental circumstances led to the extinction or extreme population fluctuations.” “In 2/3 of the areas, my prediction was the case.” “Without further information about environmental factors, my confidence regarding my prediction will not increase.” | Stability conception |
Table 10.
Illustration of the prediction group change and data-based scientific reasoning process of Mika in the first scenario.
Table 10.
Illustration of the prediction group change and data-based scientific reasoning process of Mika in the first scenario.
| Prediction Group 1st Scenario | Data Interpretation (Extract) | Prediction Group 2nd Scenario |
|---|---|---|
Stability conception | “4 of 6 data sets are supporting my prediction, because of a stable prey-predator relationship.” “2 of 6 data sets show massive fluctuations. Imbalance of prey-predator relationship could also be influenced by other factors.” “Unconfidence due to wrong assumptions and the fact, that population growth cannot be explained only by considering prey-predator relationships.” | Divergent prey-predator-relation conceptions |
Table 11.
Illustration of the prediction group change and data-based scientific reasoning process of Nicola in the first scenario.
Table 11.
Illustration of the prediction group change and data-based scientific reasoning process of Nicola in the first scenario.
| Prediction Group 1st Scenario | Data Interpretation (Extract) | Prediction Group 2nd Scenario |
|---|---|---|
FoN conceptions and content knowledge  | “My prediction did not include extreme events like diseases or influences of weather, but only the development based on prey-predator-relationships.” “My confidence did not change, because some data represent extreme events that were not included into my prediction.” | Harmonic prey–predator relation conception  |
Publisher’s Note: MDPI stays neutral with regard to jurisdictional claims in published maps and institutional affiliations. |
© 2021 by the authors. Licensee MDPI, Basel, Switzerland. This article is an open access article distributed under the terms and conditions of the Creative Commons Attribution (CC BY) license (https://creativecommons.org/licenses/by/4.0/).
Share and Cite
MDPI and ACS Style
Meister, S.; Upmeier zu Belzen, A. Analysis of Data-Based Scientific Reasoning from a Product-Based and a Process-Based Perspective. Educ. Sci. 2021, 11, 639. https://0-doi-org.brum.beds.ac.uk/10.3390/educsci11100639
AMA Style
Meister S, Upmeier zu Belzen A. Analysis of Data-Based Scientific Reasoning from a Product-Based and a Process-Based Perspective. Education Sciences. 2021; 11(10):639. https://0-doi-org.brum.beds.ac.uk/10.3390/educsci11100639
Chicago/Turabian StyleMeister, Sabine, and Annette Upmeier zu Belzen. 2021. "Analysis of Data-Based Scientific Reasoning from a Product-Based and a Process-Based Perspective" Education Sciences 11, no. 10: 639. https://0-doi-org.brum.beds.ac.uk/10.3390/educsci11100639
Note that from the first issue of 2016, this journal uses article numbers instead of page numbers. See further details here.