
Universal Design for Learning: The More, the Better?


Institute for Science Education, Leibniz Universität Hannover, 30167 Hannover, Germany
*
Author to whom correspondence should be addressed.
Educ. Sci. 2021, 11(4), 164; https://0-doi-org.brum.beds.ac.uk/10.3390/educsci11040164
Submission received: 4 March 2021
/
Revised: 22 March 2021
/
Accepted: 27 March 2021
/
Published: 1 April 2021
(This article belongs to the Section Special and Inclusive Education)
Abstract
:An experimental study investigated the effects of applying principles of the Universal Design for Learning (UDL). Focusing on epistemic beliefs (EBs) in inclusive science classes, we compared four groups who worked with learning environments based more or less on UDL principles and filled out an original version of a widely used EBs questionnaire or an adapted version using the Universal Design for Assessment (UDA). Based on measurement invariance analyses, a multiple indicator, and multiple cause (MIMIC) approach as well as multi-group panel models, the results do not support an outperformance of the extensive UDL environment. Moreover, the UDA-based questionnaire appears to be more adequately suited for detecting learning gains in an inclusive setting. The results emphasize how important it is to carefully adopt and introduce the UDL principles for learning and to care about test accessibility when conducting quantitative research in inclusive settings.
1. Introduction
The Universal Design for Learning (UDL) provides a theoretical framework for the conception of teaching that addresses the accessibility of learning content and welcoming students’ diversity. Accessibility is thought of here in terms of minimizing barriers—an idea that is central to many approaches to implementing inclusive teaching in order to achieve participation in learning for all students [1]. Participation in education for all students is a current social and political challenge. The increasing diversity of learners should be met positively and serve as a resource. In this context, inclusion is defined as a term for an appreciative and welcoming approach to diversity [2,3]. UNESCO also mentions education with the Sustainable Development Goals. It explicitly addresses inclusive education. By 2030, education systems worldwide should be adapted to be more equitable to the diversity of learners. All people, regardless of background, should have access to education and be able to participate in it. This will also realize the right to education [4].
The basic assumption of UDL is that monomodal teaching approaches tend to focus on the “average student” and lead to barriers for many other students. Multimodality of a learning environment is created by multiple forms of representation, processing, and motivational or motivation-maintaining elements in the learning environment [5]. Metaphorically speaking, UDL puts the what, the how, and the why of learning in the focus of lesson planning. The concept of UDL has been widely used in many approaches all around the world [6,7,8,9]. It can be shown that all students—not just those with special education needs—can benefit from a UDL based learning environment [10]. It has also been a guideline for systemic educational reform after the COVID-19 pandemic [11].
However, UDL is not free from criticism. It is seen as a very complex framework that is, on the one hand, very inspiring to educators but can, on the other hand, also be arbitrary when it comes to concretizing and operationalizing the guidelines [12,13]. It is in question whether UDL is adequately defined to derive clear interventions and to isolate the active components to make UDL effective. Moreover, what remains unclear is “the dosage of UDL intervention needed to achieve access, engagement, and success” [14] (p. 1). One of the main points of critique is that evidence from clear-cut, rigorous studies focusing on the impacts of UDL are missing to a large extent [15]. While studies often report a positive perception of the subjects’ learning process and the teaching material [9], the meta-analysis by Capp [7] shows that there are hardly any studies reporting on the learning gains, and UDL research focuses primarily on the principles of multiple representations—only one of three principles of the UDL guidelines [5]. Al-Azawei et al. [6] came to a similar conclusion. This is problematic because UDL does not necessarily require implementing all principles, guidelines, and checkpoints. However, UDL wants to see itself as a holistic model for lesson planning, “the learning outcomes associated with the implementation of UDL need to be demonstrated through experimental studies within curriculum areas” [7] (p. 804).
With this regard, we report a quasi-experimental study on the impacts of systematically varying the number of UDL principles applied to students’ learning gains. With a science education background, we focus on fostering students’ epistemology in science which is considered an important learning goal on an international level [16,17].
2. Theoretical Background
2.1. Epistemic Beliefs in Science
Epistemic beliefs (EBs) are individual beliefs about the nature of knowledge (beliefs about what knowledge is) and the nature of knowing [18]. Epistemic beliefs are conceptually close to the students’ views on the nature of science [19]. They are part of students’ epistemic cognition which can be described as, “the thinking people do about what and how they know” [20] (p. 457).
One line of conceptualizing EBs in science consists of defining multiple dimensions [21]. Although there is still an ongoing debate on the specific dimensions that can be defined [22], we referred to the widely used four-dimensional approach of epistemic beliefs in science as described by Conley et al. [23]. According to this approach, epistemic beliefs comprise beliefs about the certainty, development, source, and justification of knowledge in science. For all four dimensions, a span can be assigned to the extent to which the corresponding factor is pronounced. The span ranges in each case from a naïve to a sophisticated level (Table 1) [24].
These dimensions have been used in a whole range of studies. There is a body of evidence supporting their importance for learning processes [25], for their dimensional structure [18,26], as well as the relations to academic achievement [27]. Recent meta-analytical perspectives support the assumption that EBs can be fostered during intervention studies being either the focus of an intervention or playing the role of a co-construct that supports learning processes [28].
Fostering students’ epistemic cognition is one of the grand goals of science education efforts all around the world. Rather sophisticated EBs can be seen as a prerequisite to understanding fundamental aspects of science and of how science is represented and discussed in—and influences—society. This is one part of enabling societal participation [29,30]. Having this in mind, EBs appear particularly important for an inclusive science education that focuses on helping all students participate in a society that is, to a large extent, shaped by science and technology and does not only aim at providing a later STEM workforce for economic or academic purposes. For these reasons, we decided to focus on fostering EBs in inclusive science classrooms, comparing an extensive and focused UDL-setting.
2.2. Universal Design of Learning
The Universal Design for Learning (UDL) was developed by the Center for Applied Special Technology (CAST) [5]. UDL offers several instructional adaptation options to reach every student regardless of their prerequisite. UDL-based instruction provides multiple ways to present information (“what” of learning), process information and present learning outcomes (“how” of learning), and promote learning engagement and learning motivation (“why” of learning) [5,31]. The three principles are subdivided into nine guidelines, which are described in Table 2. The focus is on the individual so that the barriers to accessibility are minimized. Thus, it is not the learner who must adapt, but the classroom [2,5]. Educators can use UDL principles to create flexible learning pathways for learners to achieve their learning goals. This allows all learners to be addressed by choosing different methods, materials, and assessments based on their individual needs [32]. The UDL principles application does not have to be digital because the educational effort to reach all learners is the focus. However, UDL promises the advantage of reaching the learner in different ways, for example, by reading a text aloud or using videos to convey the learning content [33].
2.3. Universal Design of Assessment
While UDL offers the opportunity to minimize barriers in learning environments, the assessments used for evaluating have barriers again that can significantly influence the results. Capp [7], Edyburn [12,14], and Gregg and Nelson [34] explicitly point out that the assessment should receive more attention when integrating UDL into learning environments. One way to minimize these barriers and increase accessibility is through the Universal Design for Assessment (UDA) framework [35,36,37]. UDA is designed to enable participants to achieve the best possible test scores regardless of personal characteristics which are irrelevant according to the test construct. In doing so, UDA focuses on decreasing the construct irrelevant variance [38]. Similar to UDL, essential elements can also be formulated in UDA (Table 3).
3. Research Question
All in all, our aim was to carry out a quasi-experimental study that investigates the impact of using an extensive and a focused UDL-setting on the development of EBs in science. We therefore designed and compared two learning environments based on a different amount of UDL principles. We also tried to be sensitive to barriers in research in inclusive settings that might affect research results and hinder participation in testing. Thus, we aimed at testing the effect of adapting an internationally published epistemic beliefs questionnaire using the concept of UDA. More concretely, we focused on the following research questions:
- Does the adaption of UDA on a widely used instrument affect the results of the study?
- To what extent can epistemic beliefs be fostered in inclusive science classes using the concept of UDL?
- How does an extensive or a more focused use of UDL principles impact learning outcomes in the field of epistemic beliefs?
This study was part of the dissertation project of one of the authors where further information can be found [39].
4. Materials and Methods
4.1. Description of the Learning Environments
Both learning environments were based on the UDL principles. While one only referred to the principle of multiple representations (“MR environment”) and contained a video, the second learning environment addressed more UDL principles (“UDL-environment”). The extended UDL environment included a comic and interactive pop-up text in addition to the video from the MR learning environment. It contained more features and customizations, as shown in Table 4. The operationalization of the UDL guidelines drew on research findings from test development and evaluation [38,40] and research on digital learning environments [41]. The learning environment was created via iBooks author in e-book format [42] and is described more concretely in an article addressing educators in practice [43]. Furthermore, one operationalization can be contributed to several UDL guidelines.
Both learning environments showed two scientists holding different hypotheses about the question being addressed: Does the same amount of a substance also have the same weight? This question was related to everyday experiences as well as to the concept of density. This fundamental science concept was rather abstract. The learning environment aimed to teach the experiment’s purpose (testing hypotheses) and the experiment’s planning. Learners were given an overview at the beginning of the learning environment with the intended goals they were learning: (1) with experiments, chemists answer their questions, (2) ideas are possible answers to the questions, (3) with experiments, chemists test their ideas, (4) scientists plan an experiment. The learning environment can be seen in Figure 1. However, students in the country and federal state of Lower Saxony, Germany, where this study took place, should be in contact with density while learning about sinking and floating. Using a self-assessment tool, the students started to reflect on how the scientists proceed to figure out whose hypothesis should be accepted. Students then engaged in a hands-on activity using everyday materials. They generated data and reflected on the hypotheses as well as the procedures they and the scientists used to generate knowledge. Beliefs such as the experiments were used to test ideas and those experiments justifying scientific knowledge were fostered. Also, the reflection on data from experiments was used for justification purposes. Thus, the justification of scientific knowledge was the main dimension of the EBs fostered. However, students also had opportunities to reflect upon further EB dimensions: the controversy of science determined by the experiments of the students may also foster beliefs that scientific knowledge is subject to change (development), that the students can test scientific knowledge for themselves and they do not have to rely on authorities (source), as well as knowing that scientific knowledge should be reflected from more than one perspective (certainty).
The learning environments were based on the theoretical framework of easy language [44]. With the selected materials for the experiment, both hypotheses, “equal amount is not necessarily equal weight” and “equal amount is also equal weight,” could be investigated. The following utensils were provided for this purpose: Sand, salt, sugar, measuring cylinders (plastic), scales, and spatulas.
4.2. Preliminary Study
As part of a pre-study, guided interviews were conducted to develop and evaluate the learning environments and the three content representation forms (video, comic, and interactive pop-up text). The accessibility of the learning environment was tested through this approach. The data were analyzed with a qualitative content analysis [45]. The pre-and post-interview lasted 10 min each. Working with the learning environment lasted 30 min.
For the preliminary study, 36 learners from 5th to 7th grade were interviewed in a guideline-based approach. Nine of them indicate a diagnosed need for special educational support. The intervention was carried out in groups of four, while the pre-and post-interviews were conducted individually. Learners were assigned in equal numbers to representational forms: video, text, and comic. The basis for the evaluation was the coding manual of Carey et al. [46]. When intraindividual changes were included, the results show that the video-based representation had advantages over the pop-up text, but not over the comic-based one. In the framework of a correlation analysis, it can be concluded that the video was not superior when the distribution of levels was examined in the learning environment.
4.3. Design of the Main Study
A 2 × 2 between-subjects design was selected for the main quantitative study with a pre-post assessment (Table 5). This approach allows differences in learning environments and assessments to be examined. Learners are randomly assigned to one of the experimental groups. This ensured that each study condition was represented in each school class. The intervention lasted 90 min.
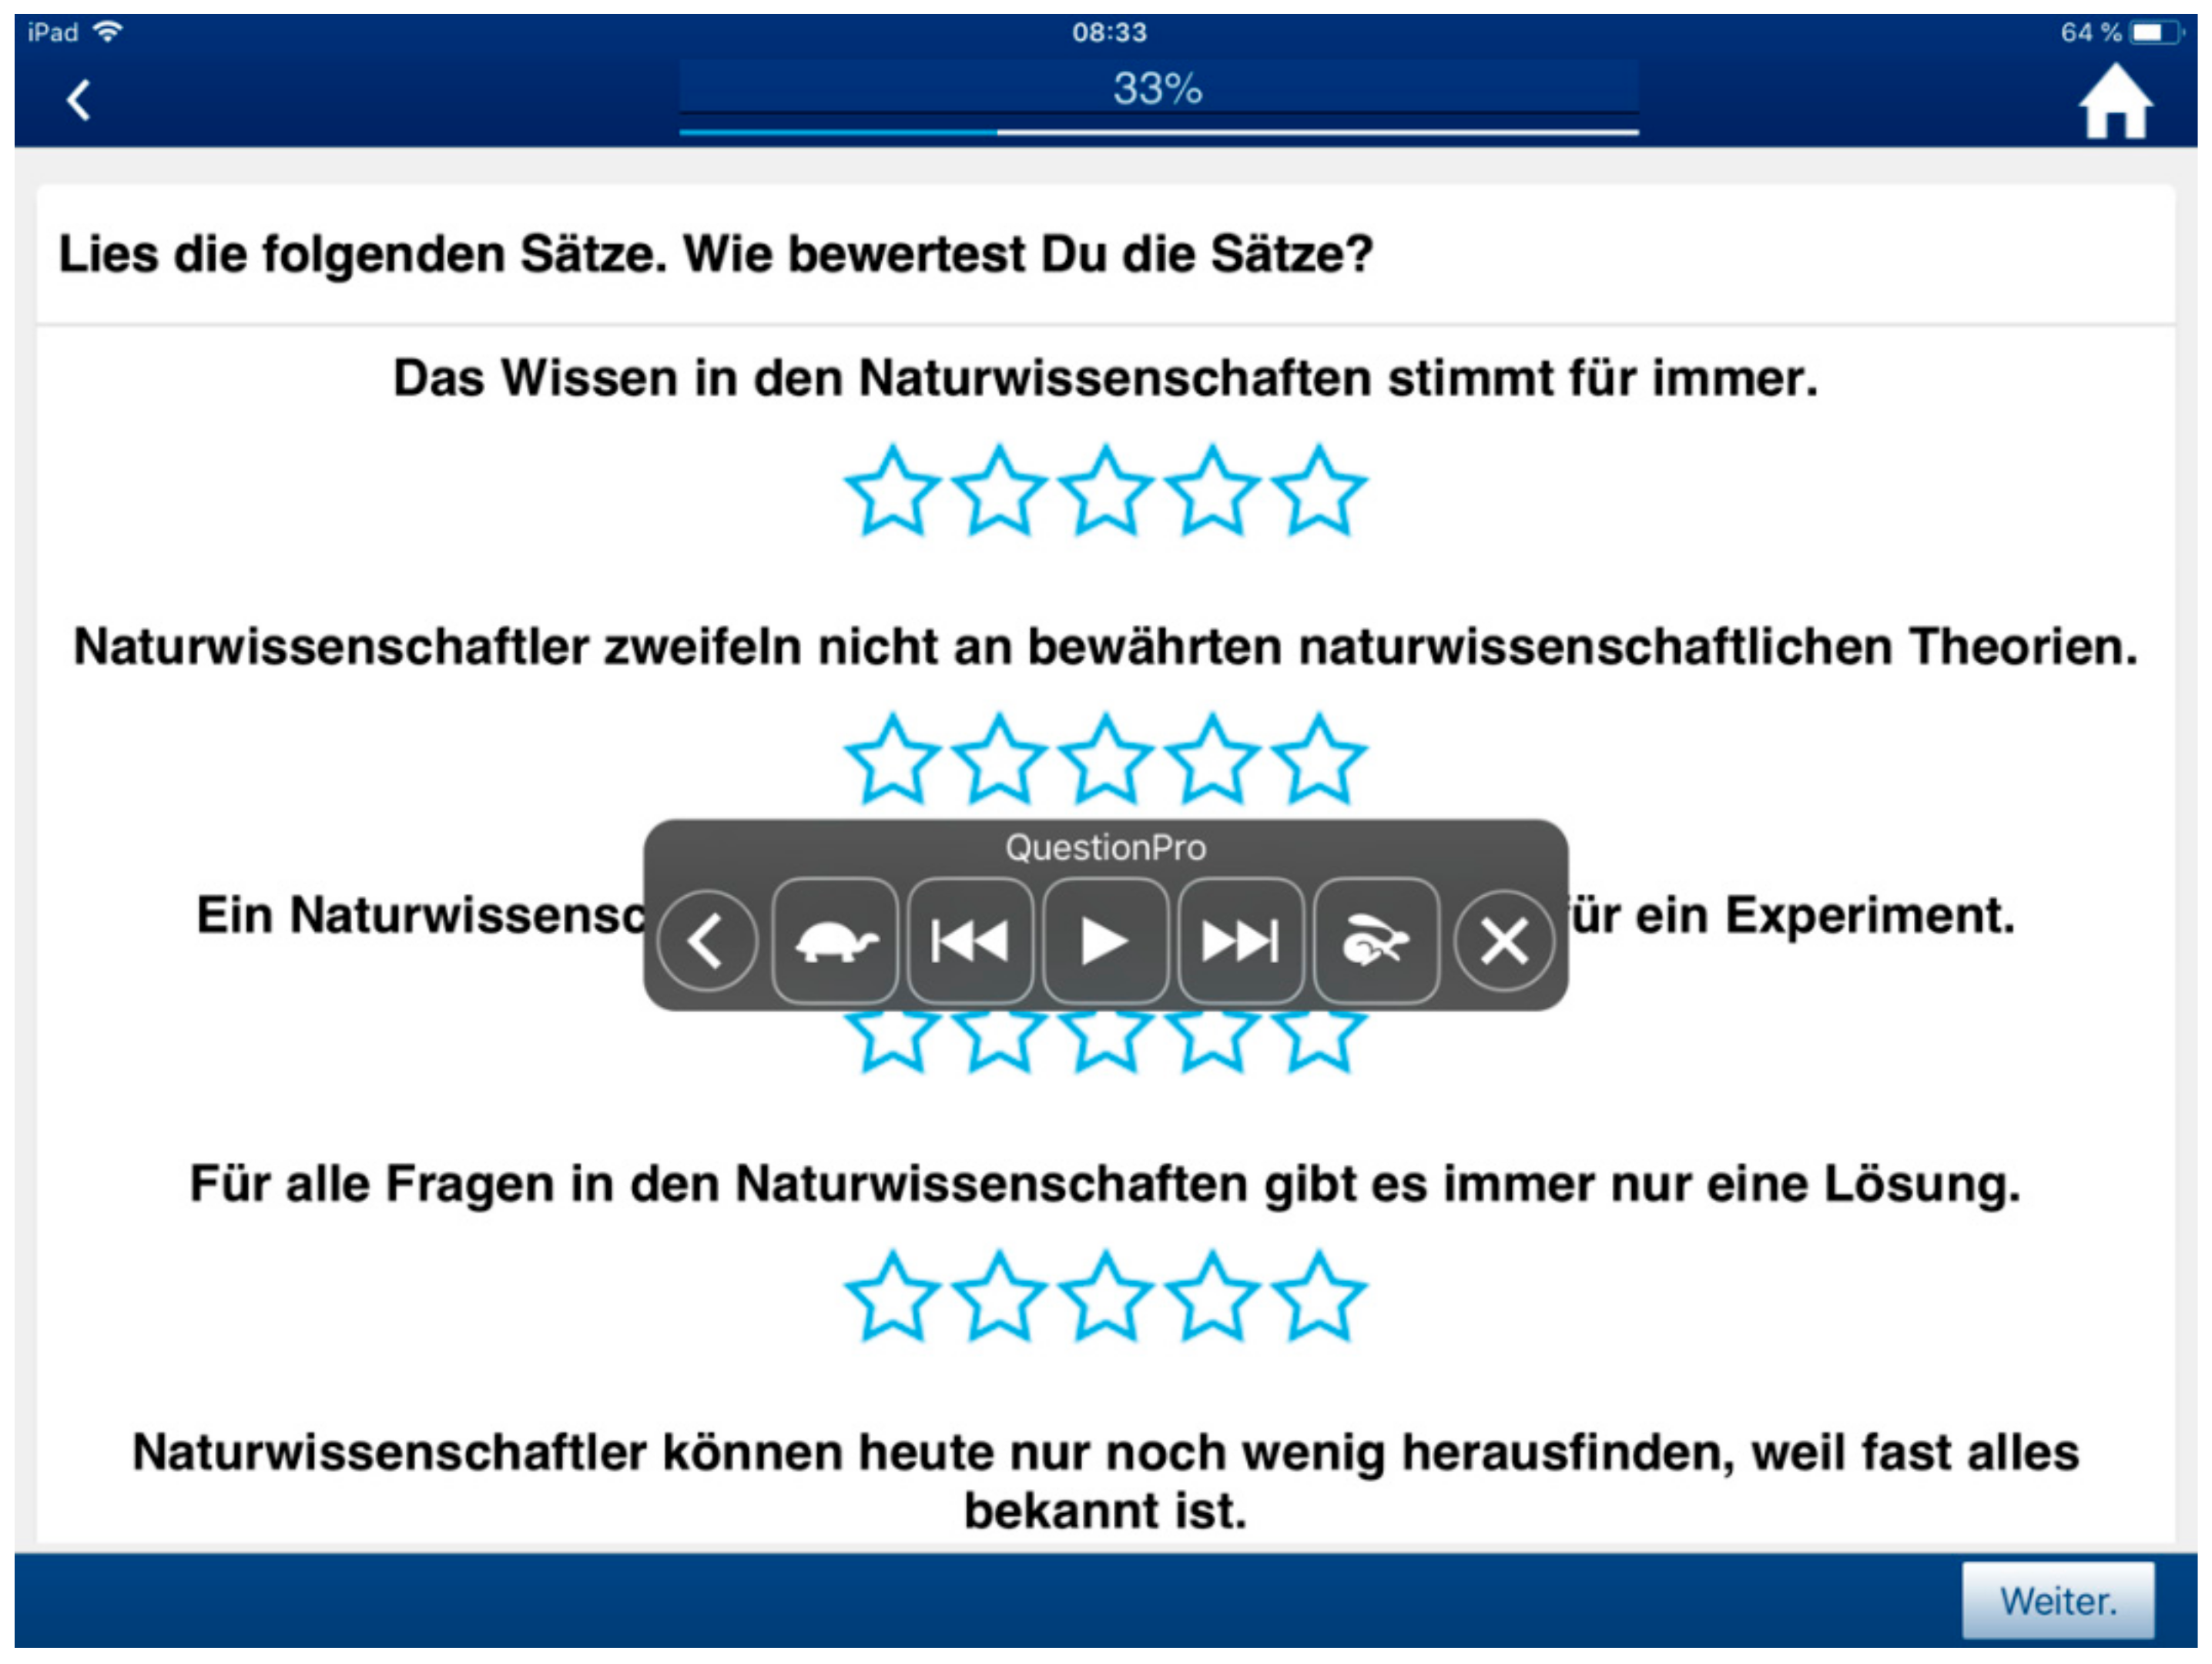
The standard assessment of Kampa et al. [24] was used to capture all four EB dimensions. In a further step, this assessment was adapted to create conformity with the UDA. For this purpose, the concept of easy language was utilized [44] and experts (two from German studies, two from special needs education, and two from science education) were consulted to verify the linguistic and content accuracy. The comparability of both assessment forms was secured in this way. Furthermore, a larger text layout and a more everyday response format in the form of stars were chosen (Figure 2). The exemplary wording of the justification scale UDA assessment items can be found in Table 6.
For an extended evaluation, additional learner characteristics were collected via a paper-pencil test and iPad-based tests. The selection of learner characteristics is theory-based and is necessary for a broad understanding of inclusion, as it is not sufficient to focus only on special educational needs. In addition to reading ability and cognitive skills, socioeconomic status, cognitive activation, perception of learning success, as well as gender, age, and diagnosed support needs were assessed (Table 7). We chose these characteristics as they were particularly suitable for describing and quantifying the diversity of the learning groups who participated in this study. We are aware that these characteristics may play a part in categorizing children, contradicting the basic idea of inclusion. However, at least in Germany, characteristics like reading literacy or socioeconomic status show a major impact on school success. Nevertheless, we decided to include these characteristics in our study as the information gained may help advance inclusive teaching.
4.4. Sample
The main study included 348 learners (male = 189; female = 193; mean age 12.2 (SD 0.74)). The learners were from integrated comprehensive schools (IGS) in Lower Saxony, Germany. IGSs stand out in Germany for being the first schools to implement inclusive education. Sixteen learners required special needs education (learning = 12, language = 4), corresponding to a proportion of 4.6% and therefore above average compared to the 3.9% at general education schools in Lower Saxony in the school year 2014/15 [53].
4.5. Procedures of Data Analysis
As a first step, we compared the original with the UDA-test version and tried to figure out a set of items equally existing in both versions to evaluate the development of EBs. For this purpose, we calculated and compared McDonalds-ω as a reliability coefficient [54] and conducted analyses of measurement invariance using longitudinal confirmatory factor analyses (LCFA). We also checked for instructional sensitivity [55] by using a multiple indicator, multiple cause approach (MIMIC approach; as applied, for example, in Sideridis et al. [56]). By introducing a variable representing the type of learning environment as a predictor on the latent factor as well as on the items into the longitudinal model (pre- and post-test), the MIMIC approach is suitable for indicating differences between both test versions in measuring the development of EBs. We also used t-tests on the item level to check for differences between pre- and post-test. Based on these analyses, we identified a comparable set of items for further analyzing the effects of the learning environments.
To gain insights into the UDA-implementation, in a second step we used this set of items to re-check measurement invariance and to compare the accessibility of the assessment versions using a graphical analysis for differential item functioning (DIF). We compared item difficulty for each subgroup by using the learner characteristics data to build up subgroups within the sample. The mean scores for reading literacy, intelligence, and socioeconomic status were calculated. The proportion with special educational needs in the sample, however, was too small for a separate evaluation. A difference of one standard deviation from the mean was chosen as the cut-off criterion for forming groups. Differences in item difficulty for a particular subgroup would indicate differences in test accessibility in regards to an important trait for the diversity of learners [36].
In a third step, we specified a multi-group panel model that included pre- and post-tests as well as the learner characteristics and the type of learning environment (UDL or MR) as covariates. This allows us to model the learning gains in the context of EBs, the impacts of the learner characteristics, and the impact of the type of learning environment as well in one step. If the covariate learning environment indicates a significant correlation to the EB measures this would be an indicator for an outperformance of the UDL environment (as the UDL environment was coded with one). In order to acknowledge the students’ individual learning gains in this quantitative setting, longitudinal plots were calculated. These plots give one line for each measurement point of a student showing the whole range of sample as well as a medium line indicating the mean learning gain of the whole sample.
As the learning environments mainly focused on fostering the justification dimension, we will mainly present the results for this dimension. This will then be discussed to provide consistent and structured insight into the presentation of results. All further results will be provided in Appendix A.
5. Results
5.1. Step One: Item Selection
In the very first analysis, the items of the scales were analyzed and evaluated in the process described above. The analyses showed that items with a low factor loading are those that do not show a significant mean change in either assessment form (Table 8). Items with a sufficiently high standardized factor loading were selected for the scales’ new formation and items with significant mean changes despite a low standardized factor loading were also included. Consequently, items 2, 3, 4, and 6 of the justification scale were relevant for further analysis and were converted into a short scale. The results of the selection process are documented in Appendix A. The other three scales were analyzed accordingly, and the number of items was reduced in the form of a short scale.
The internal consistency of the short scales showed an acceptable to good range. The exception was the justification scale in the original assessment. An increase in the consistencies from the first to the second measurement point can be seen (Table 9).
5.2. Step Two: Checking Test Accessibility of Both Versions
Longitudinal measurement invariance (MI) testing of the justification short scale showed that the data supported configural, metric (∆CFI = −0.007; ∆χ2 = 5.87, p = n.s.), and full scalar MI (∆CFI = 0.002; ∆χ2 = 8.55, p = n.s.). The quality criterion for strict MI was not met (∆CFI = 0.013), but the χ2-difference test established a significant difference for the model and data structures in contrast (∆χ2 = 12.73, p = n.s.). The remaining fit indices were in the good to very good range. Consequently, it can be assumed that the data supported strict MI (Table 10).
For the test accessibility, the data from the short scales were used at the first measurement point, since at the second measurement point, there was already an influence of the learning environment. The learner characteristics reading literacy, intelligence, gender, and socioeconomic status were used to examine the items’ group dependency. We chose a standard deviation from the mean as a cut-off parameter to form groups for the analysis.
Regarding the statistical parameters, no significant differences can be observed for the item difficulty of both assessment versions (reading literacy: t(328) = 1.65, p = n.s.; intelligence: t(337) = 1.34, p = n.s.; socioeconomic status: t(332) = 0.21, p = n.s.). Using these criteria, a total of 137 at-risk learners can be identified who meet at least one criterion. This corresponded to 40% of the total sample.
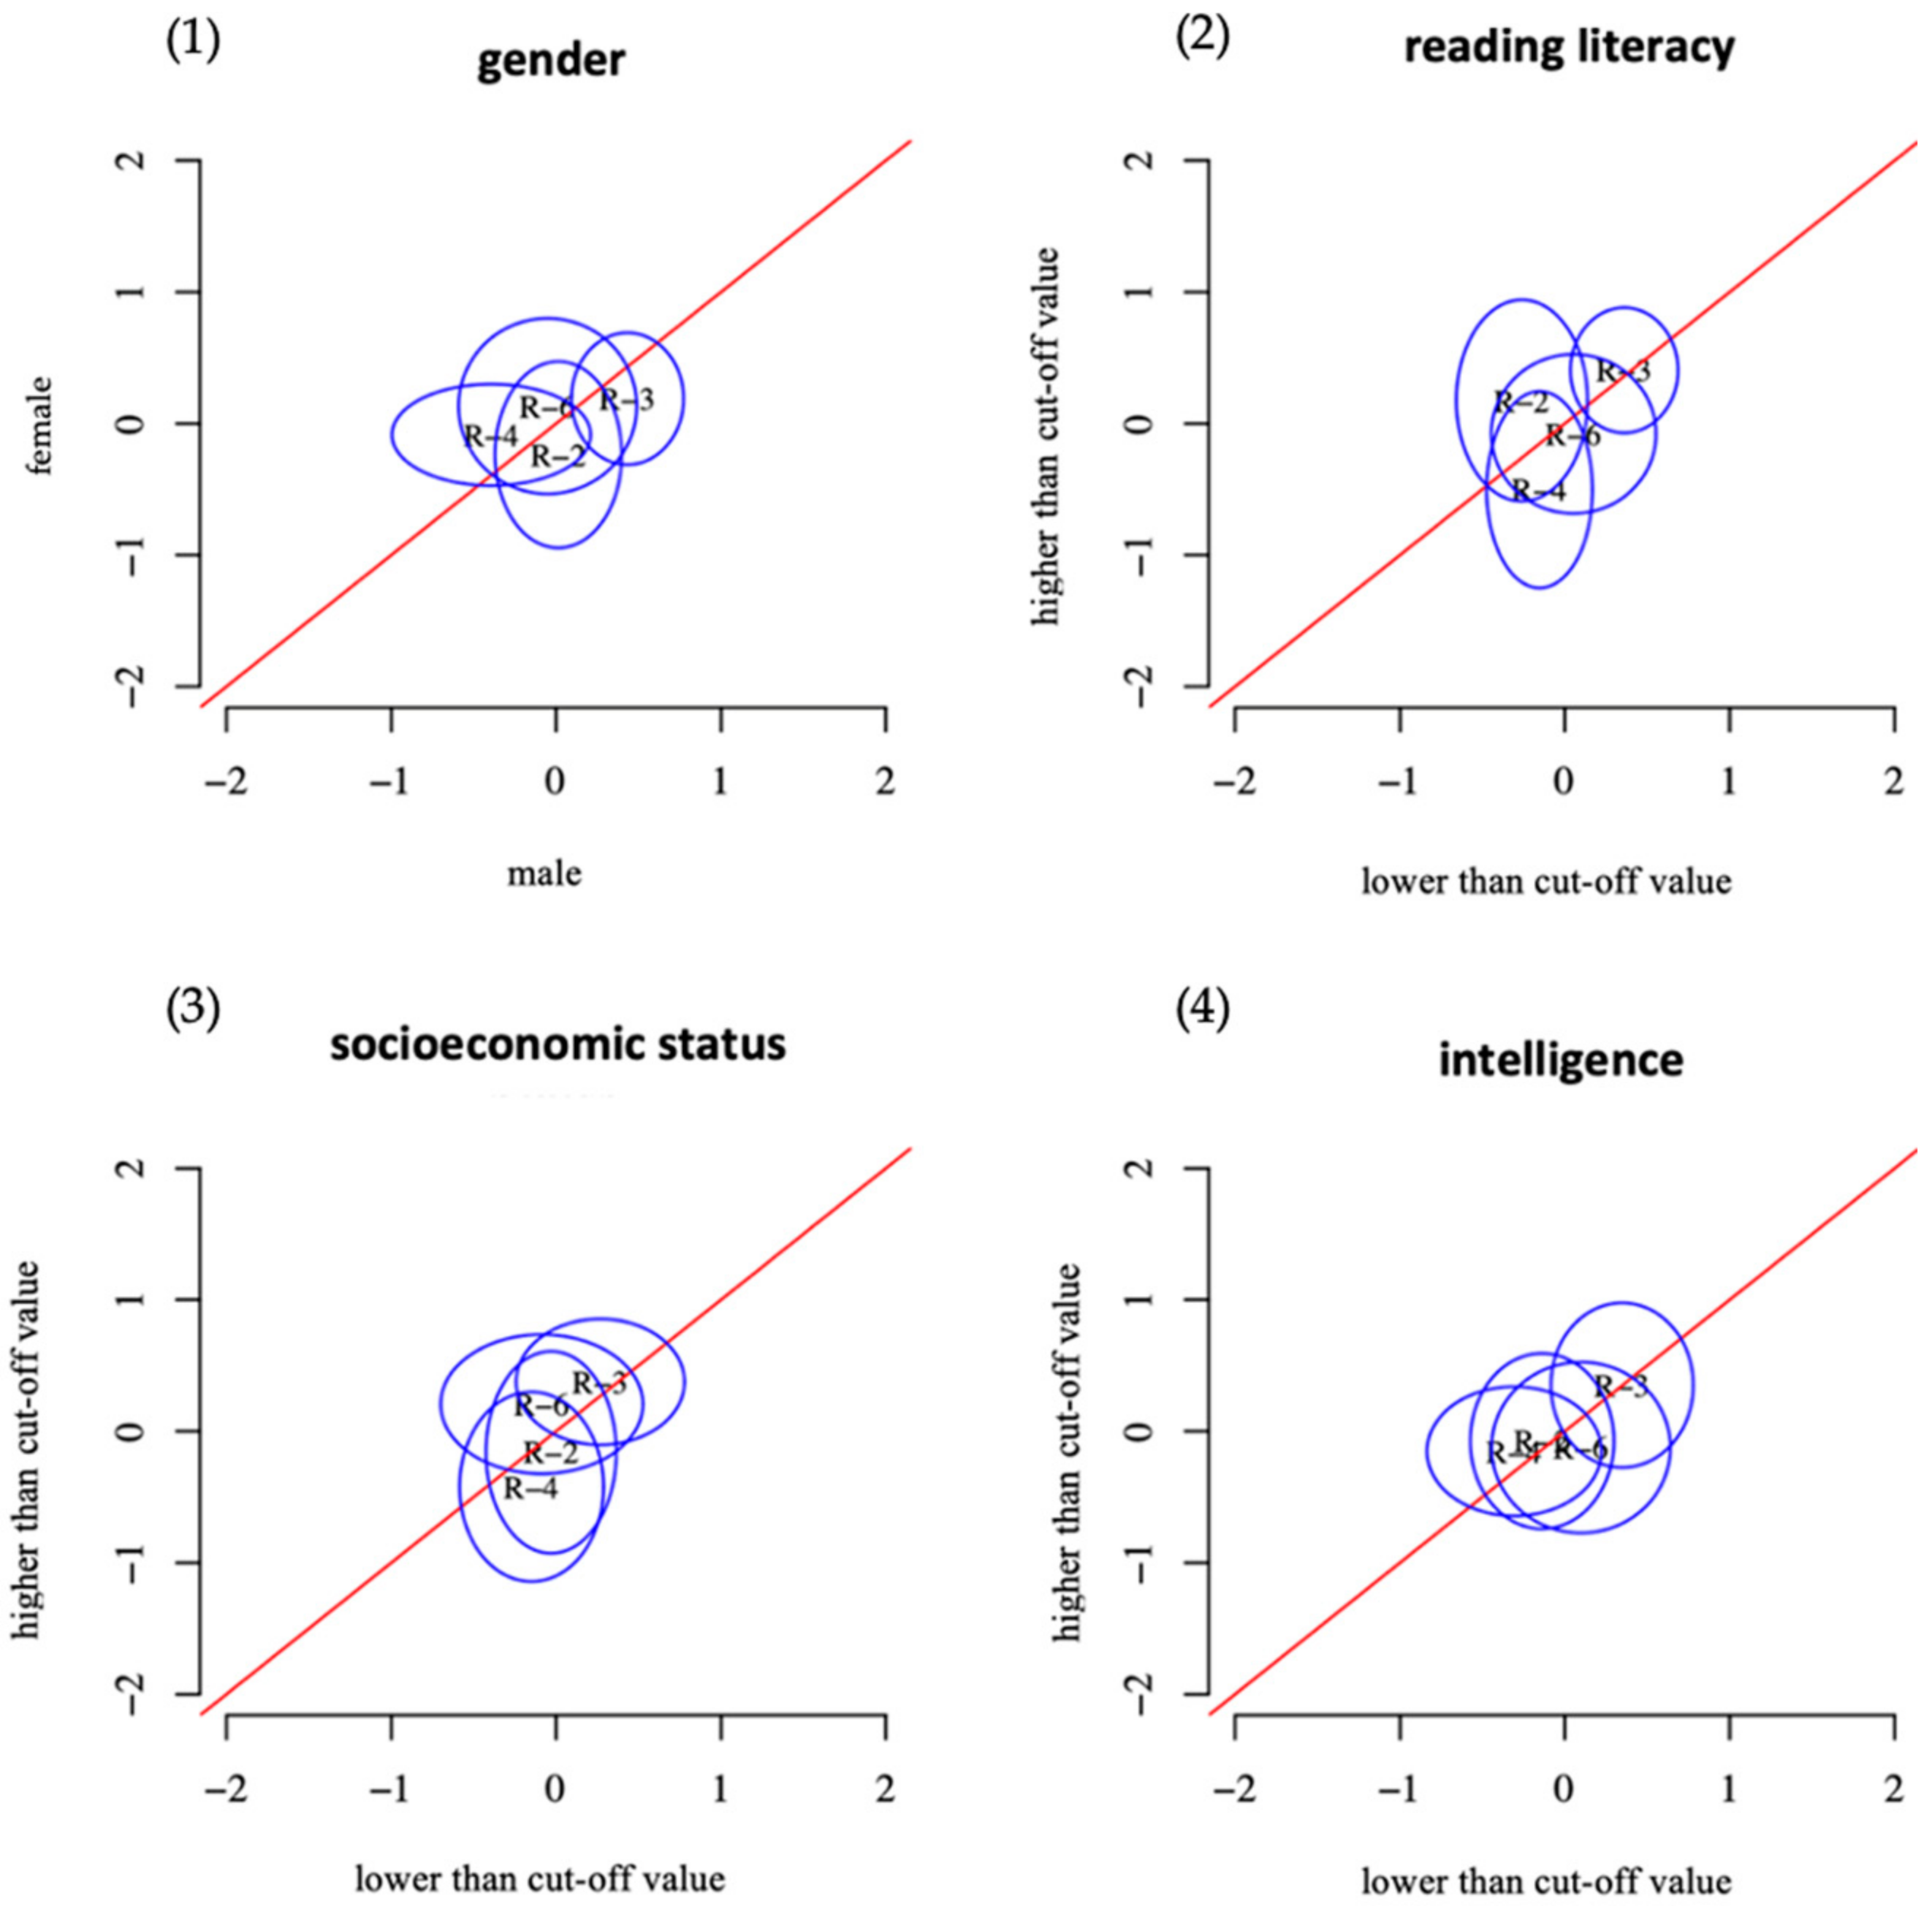
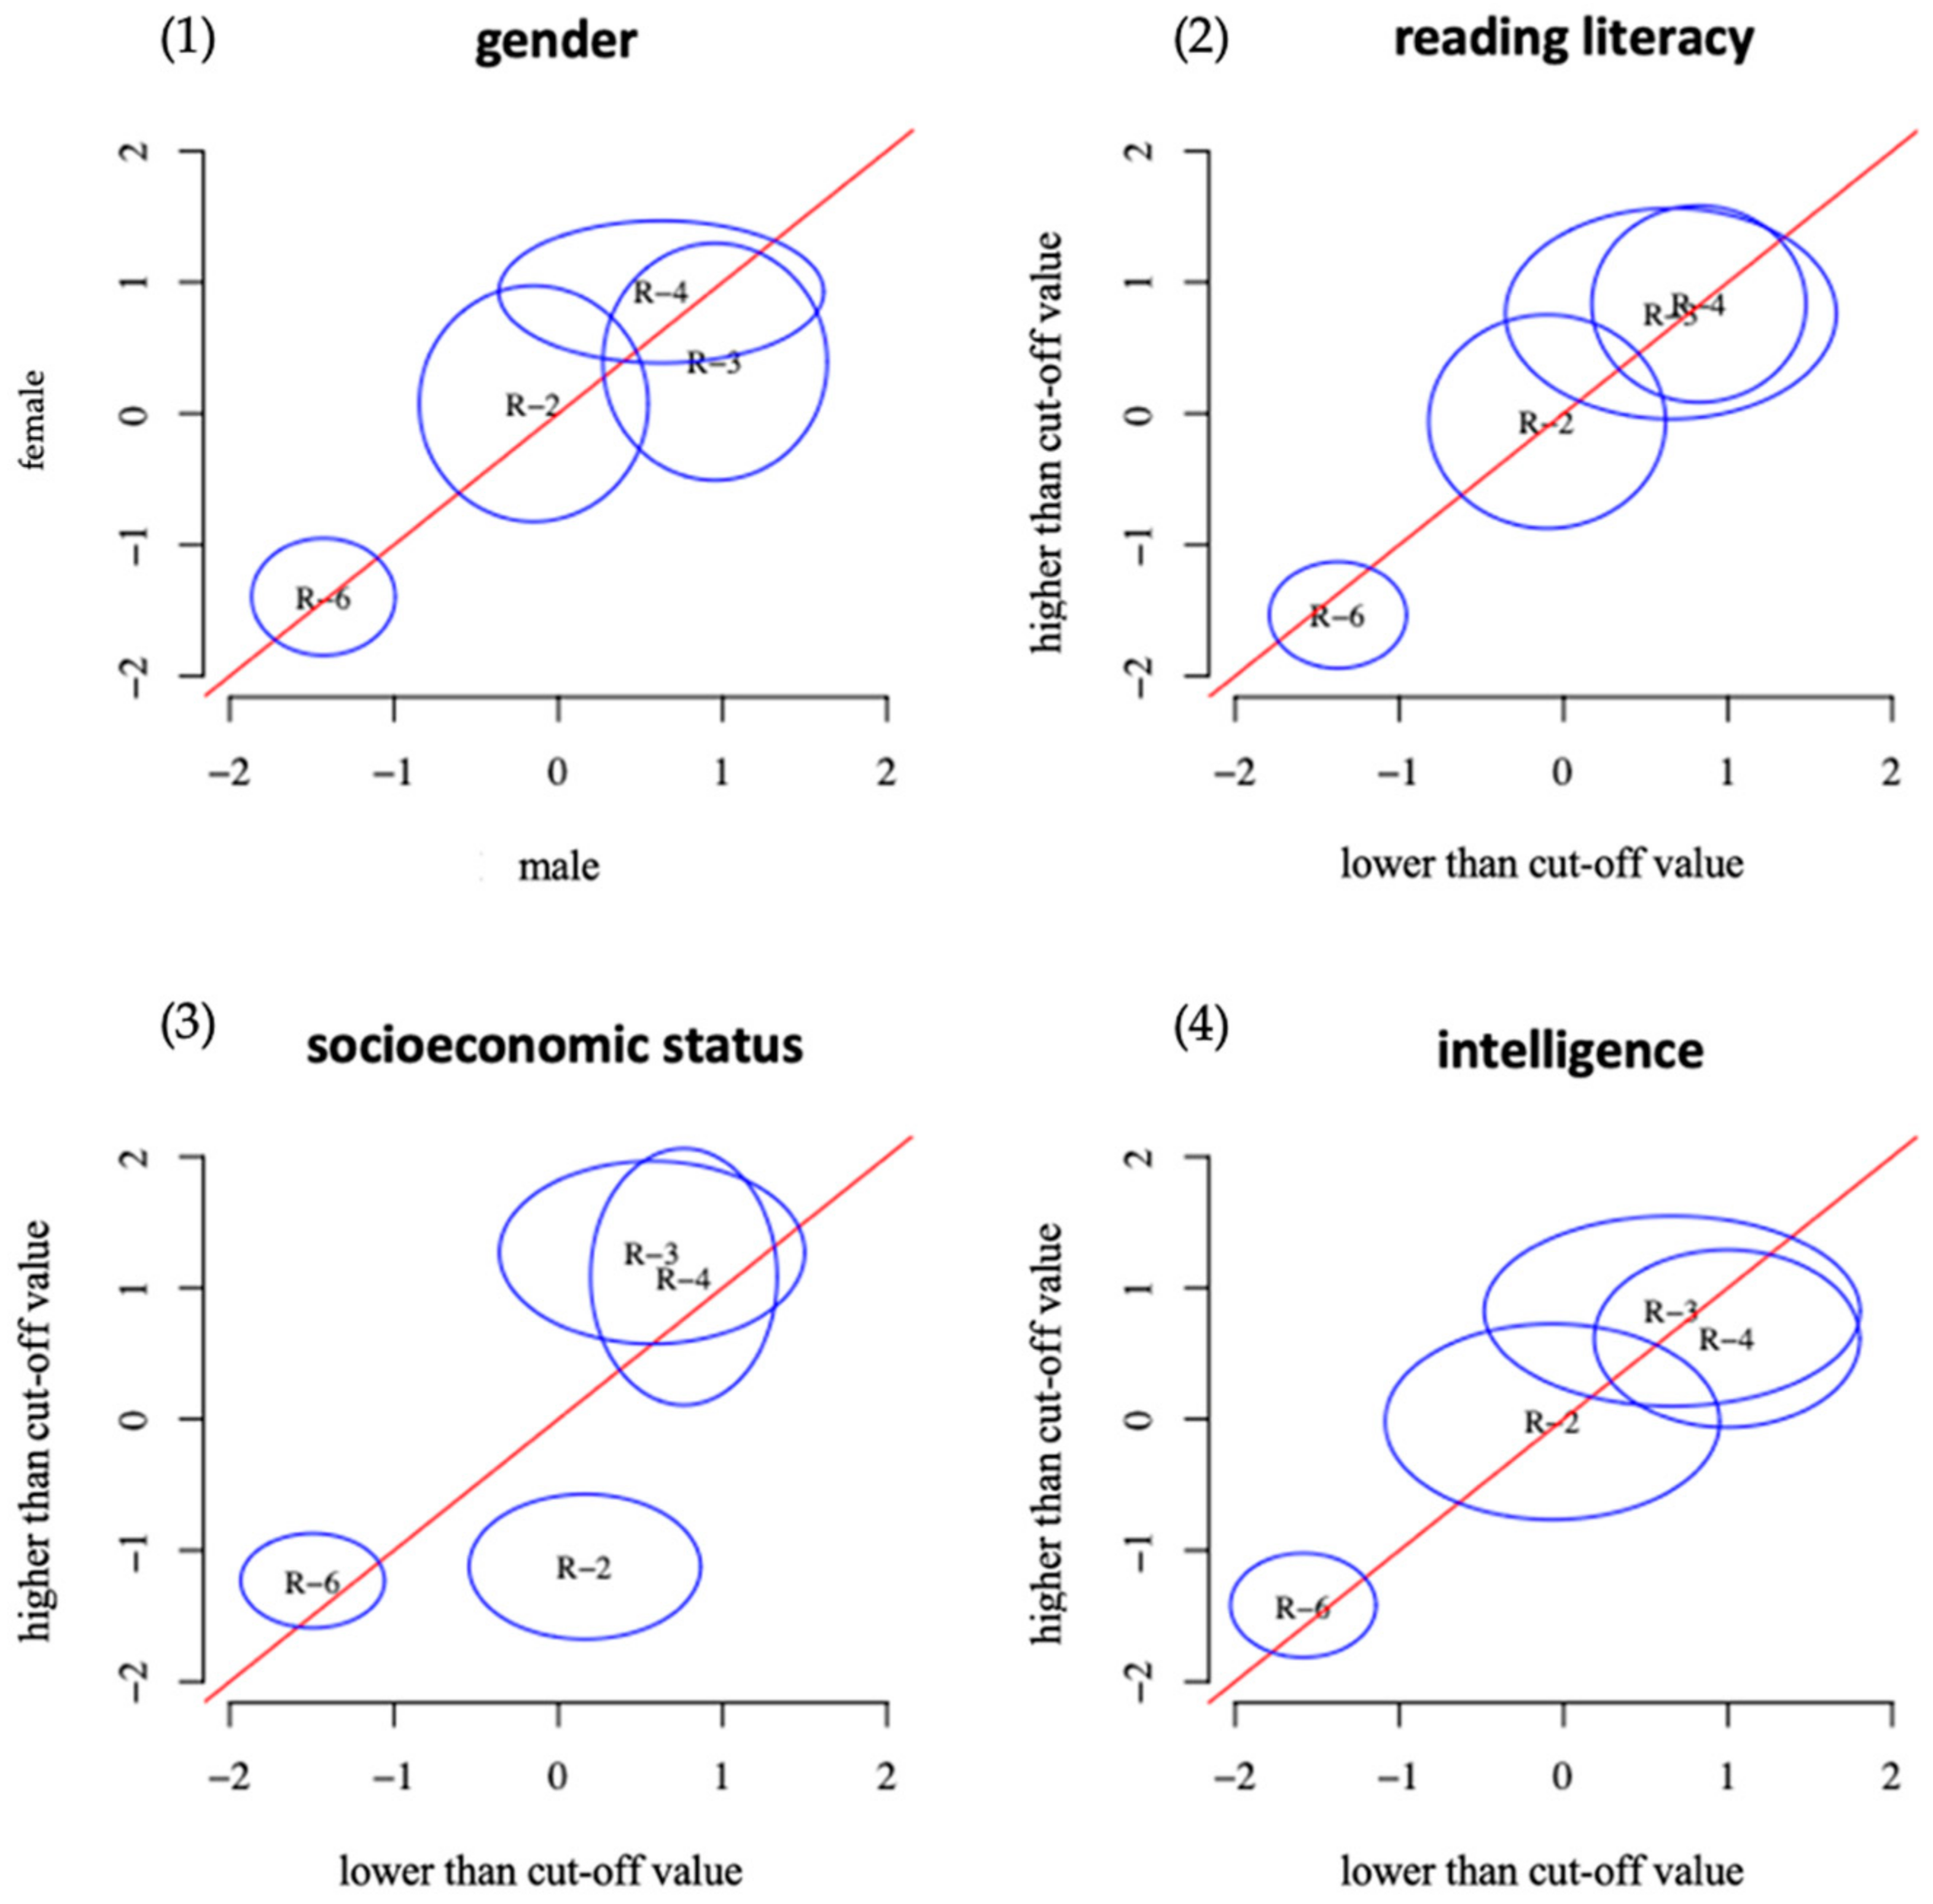
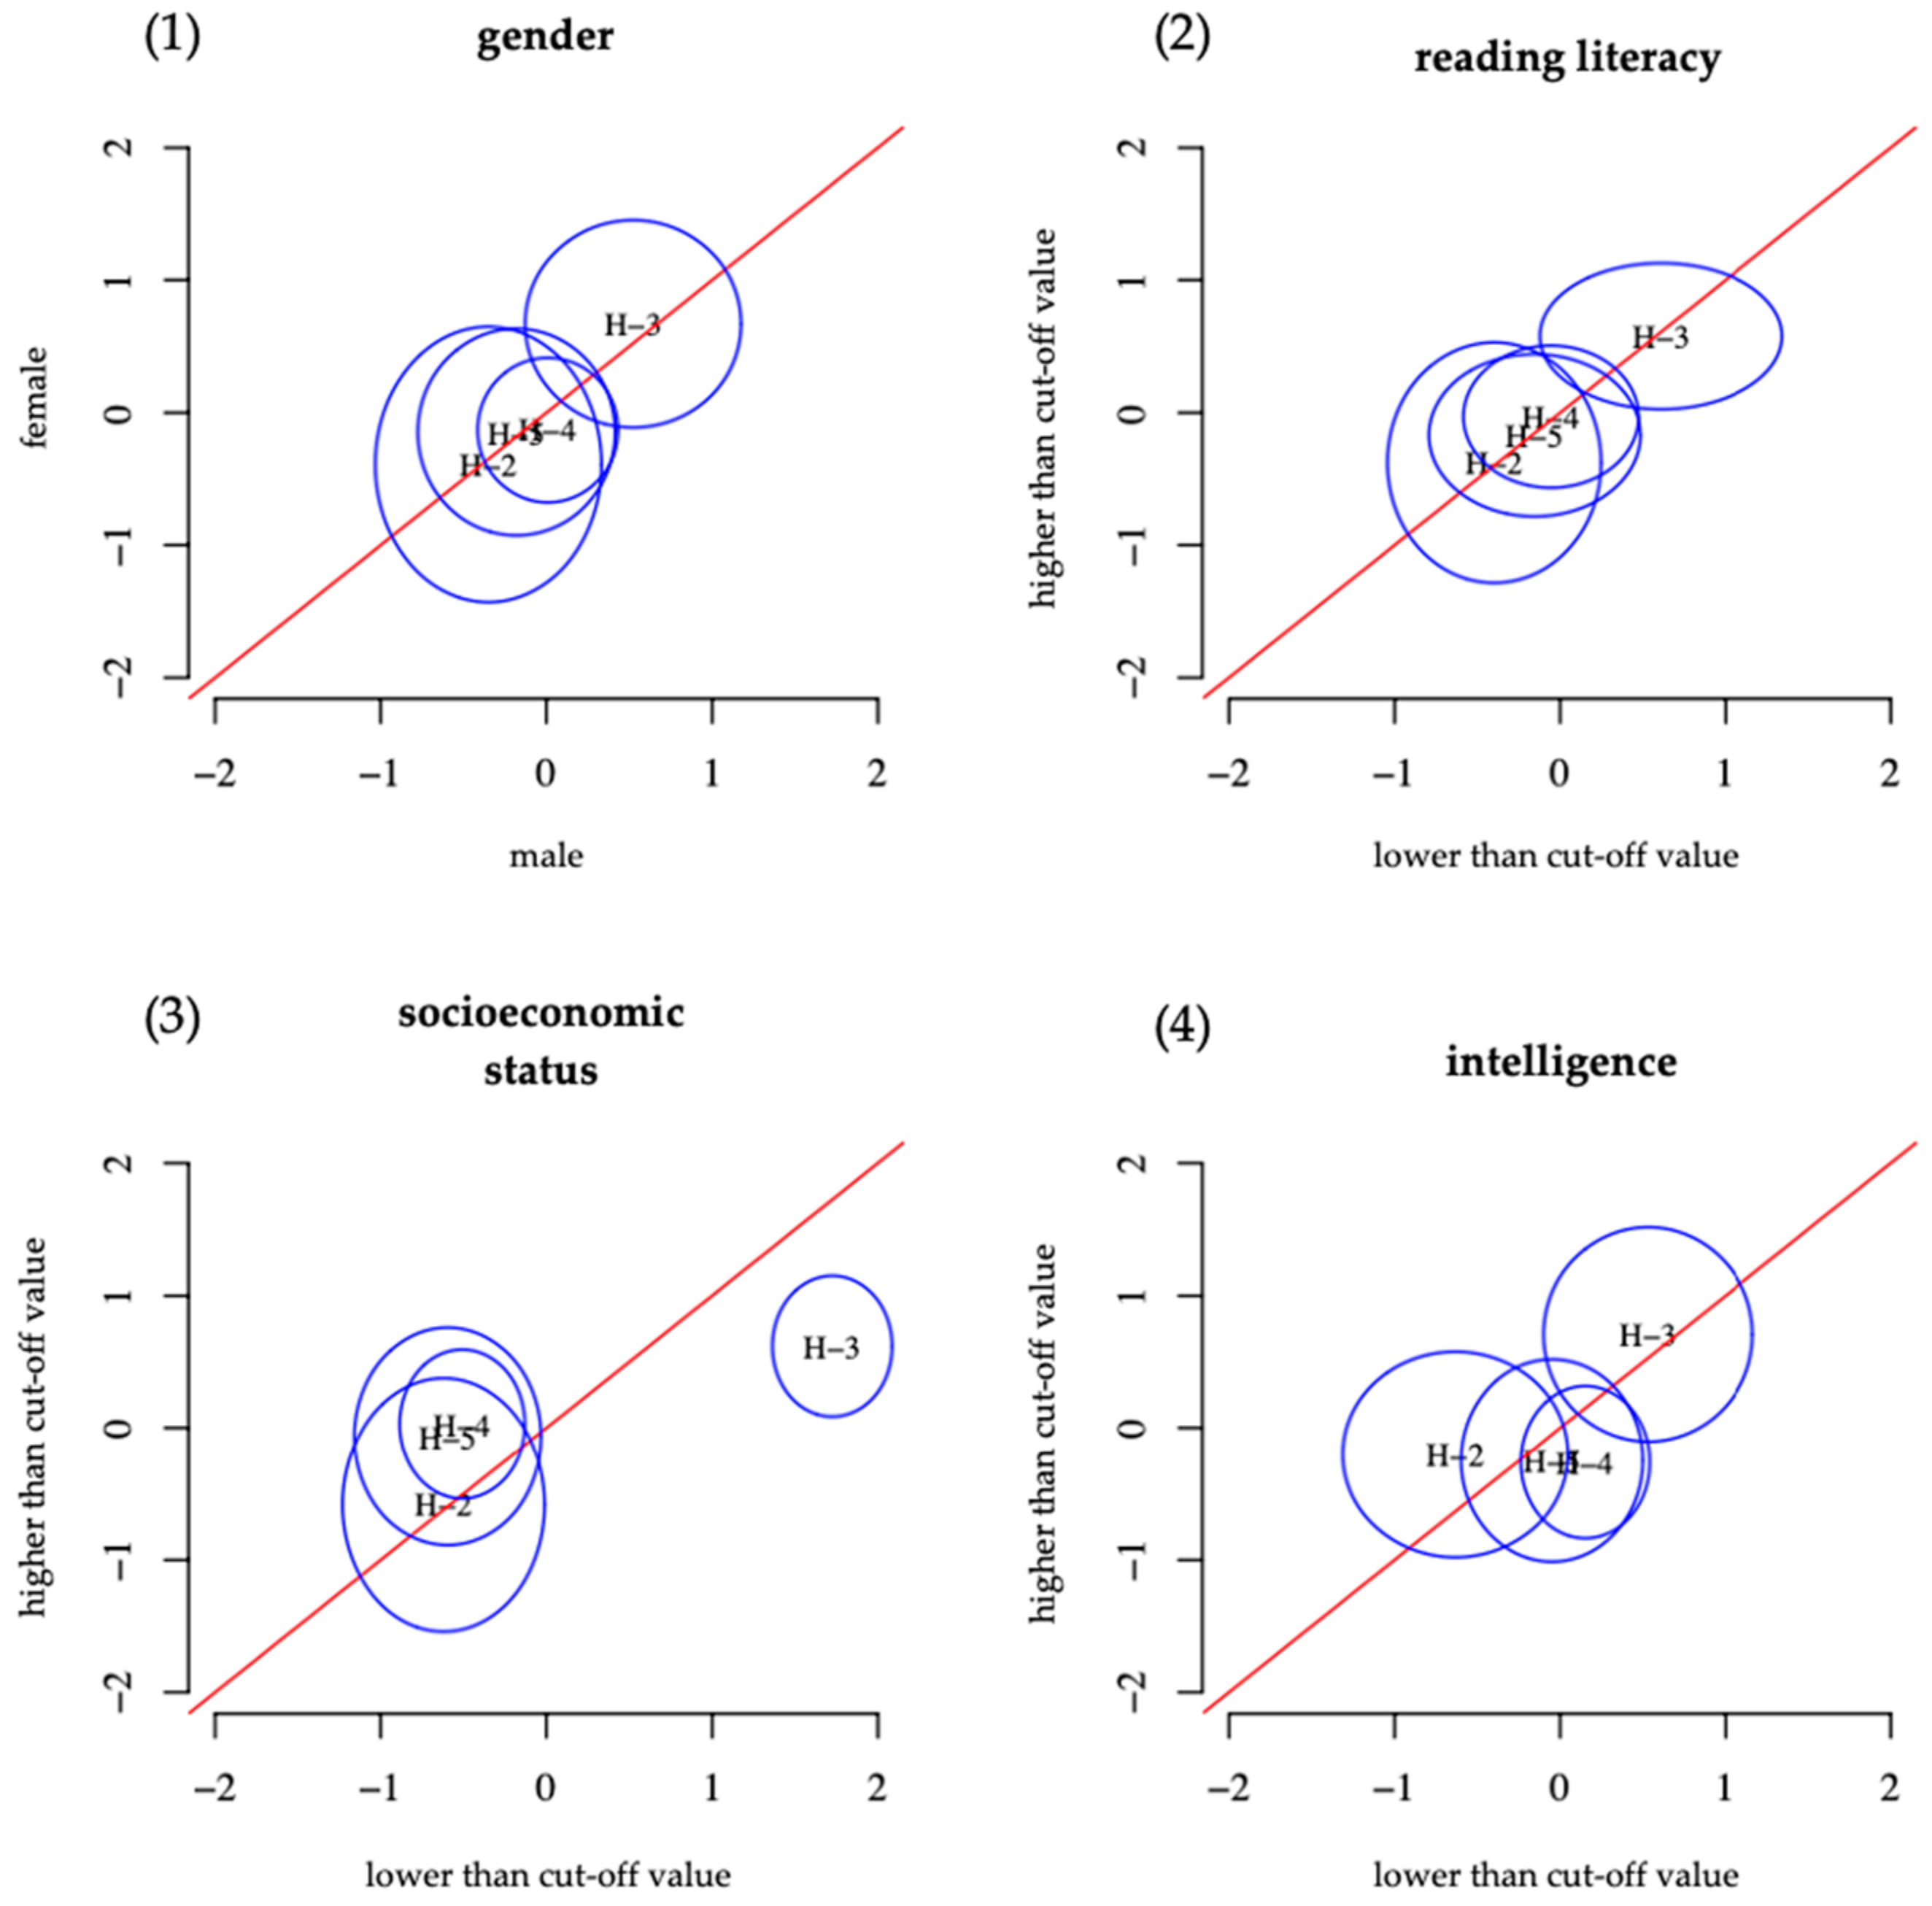
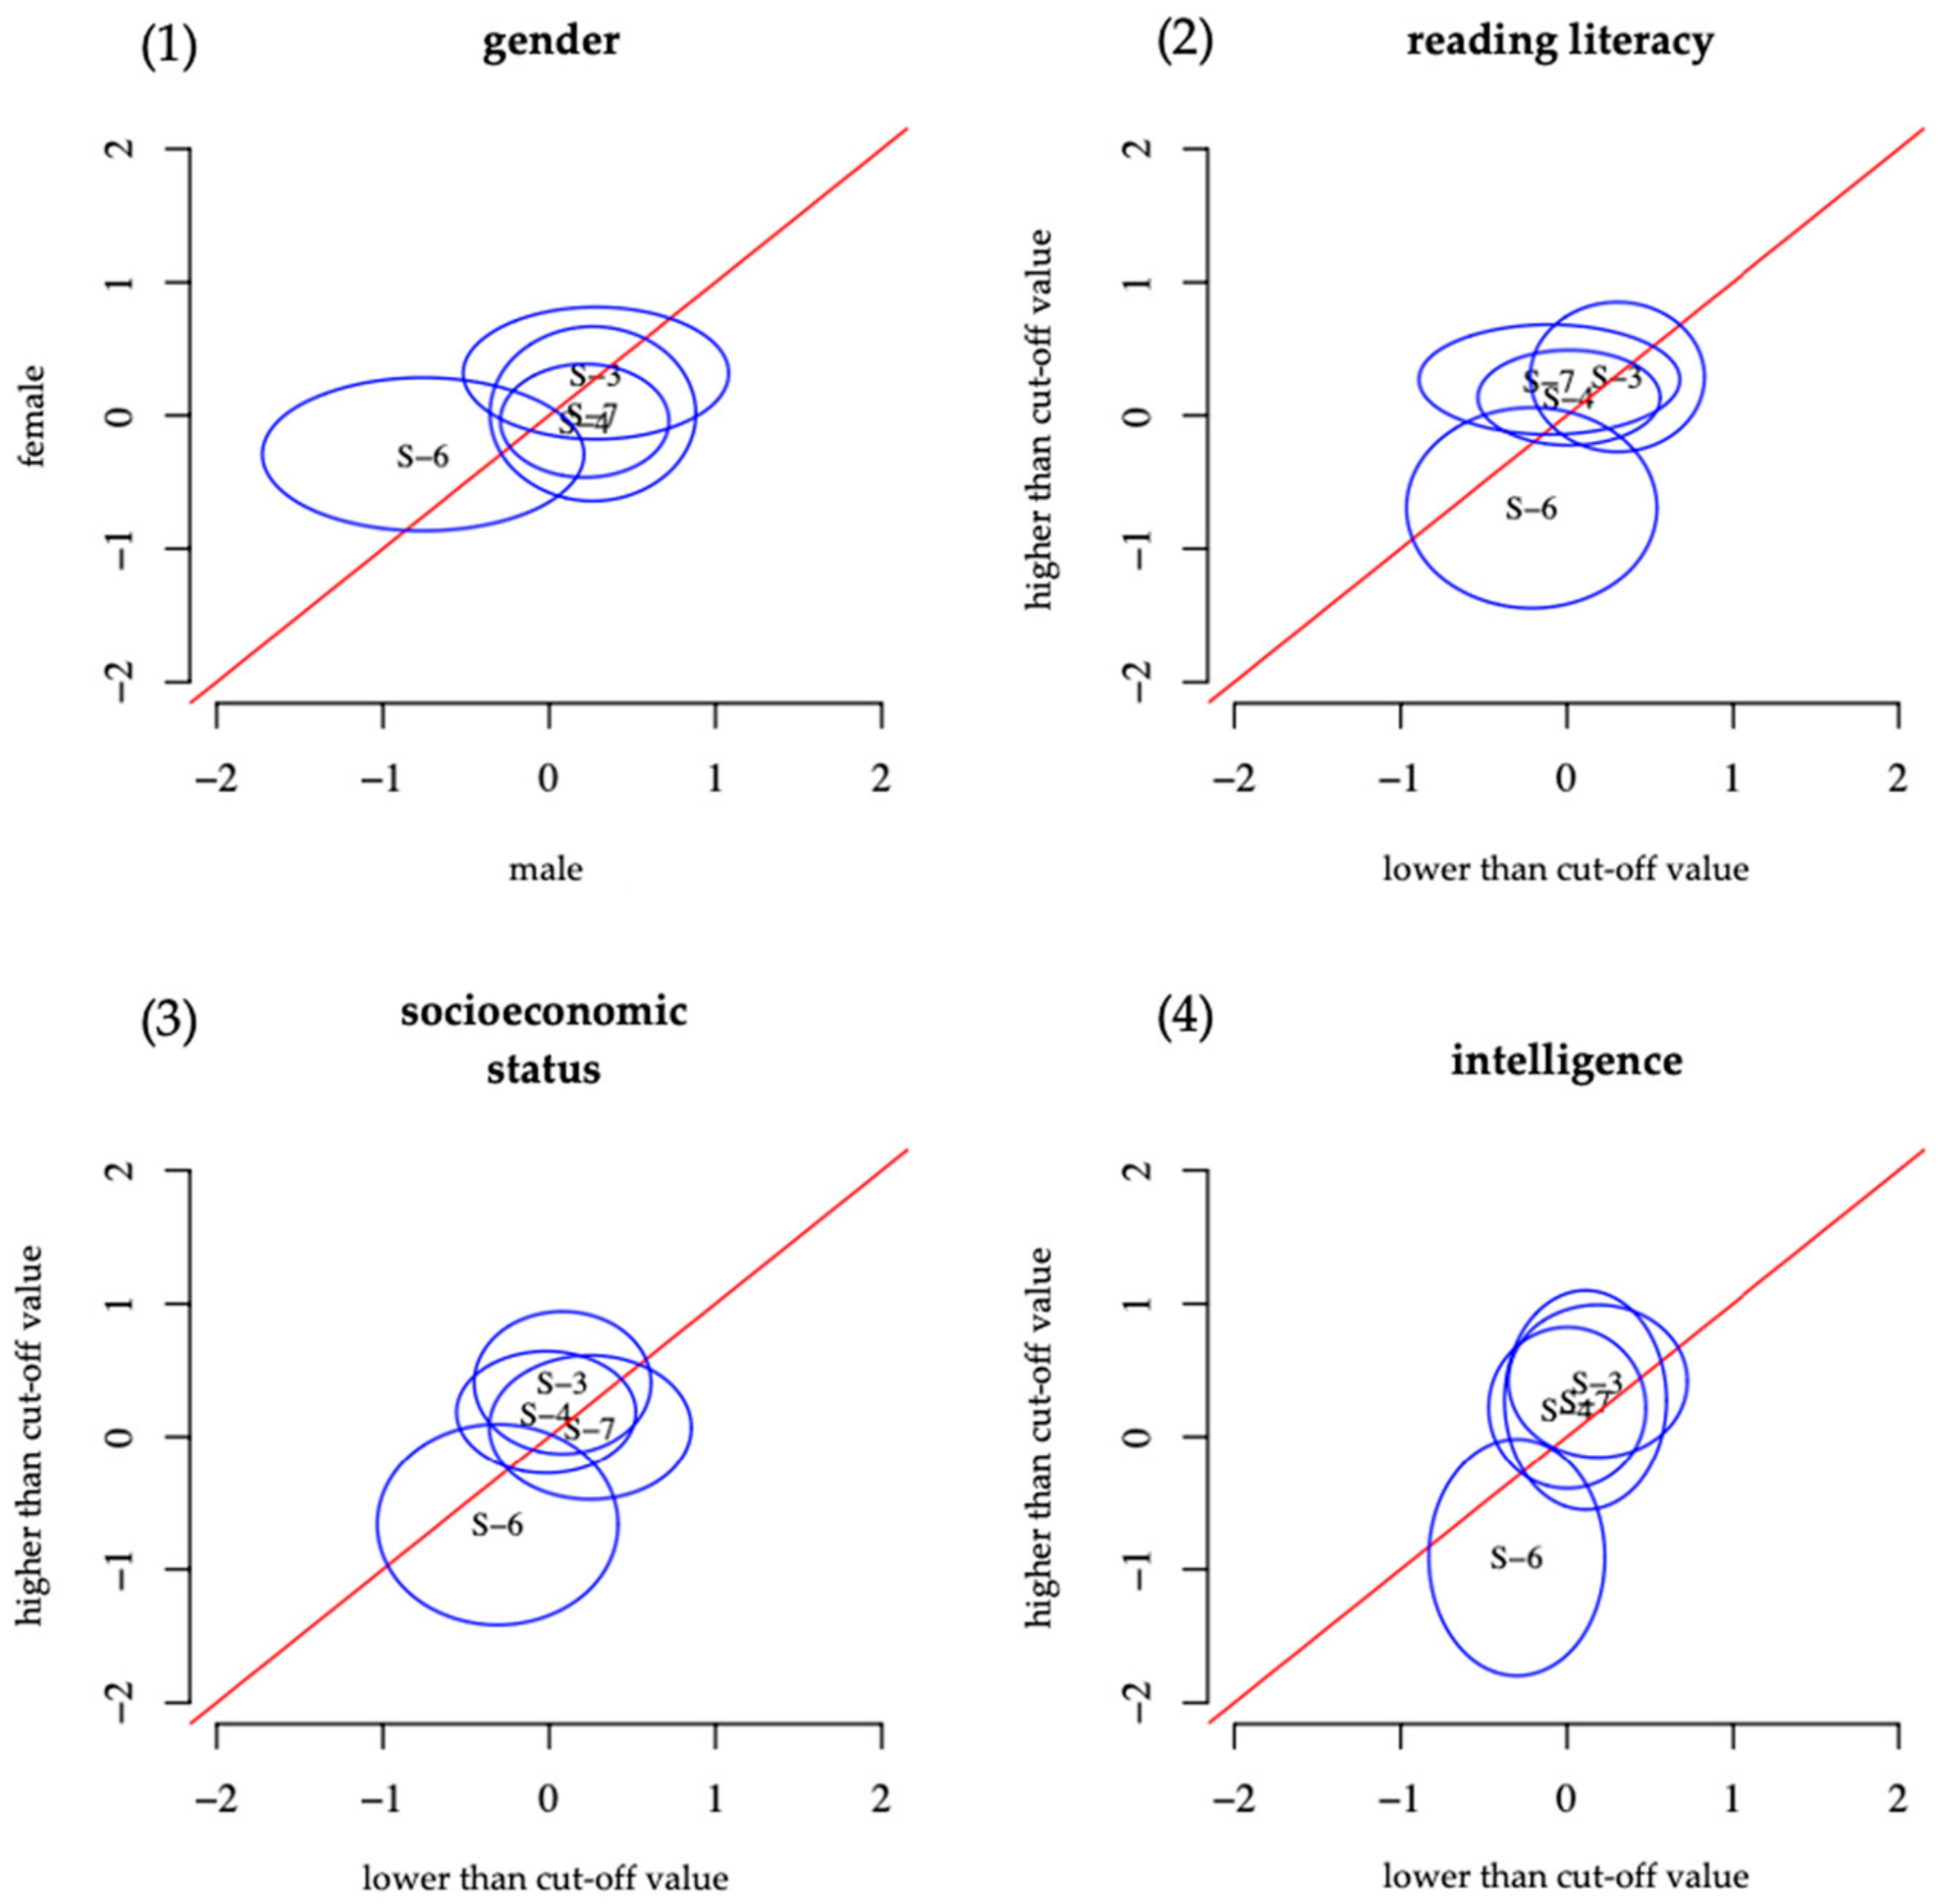
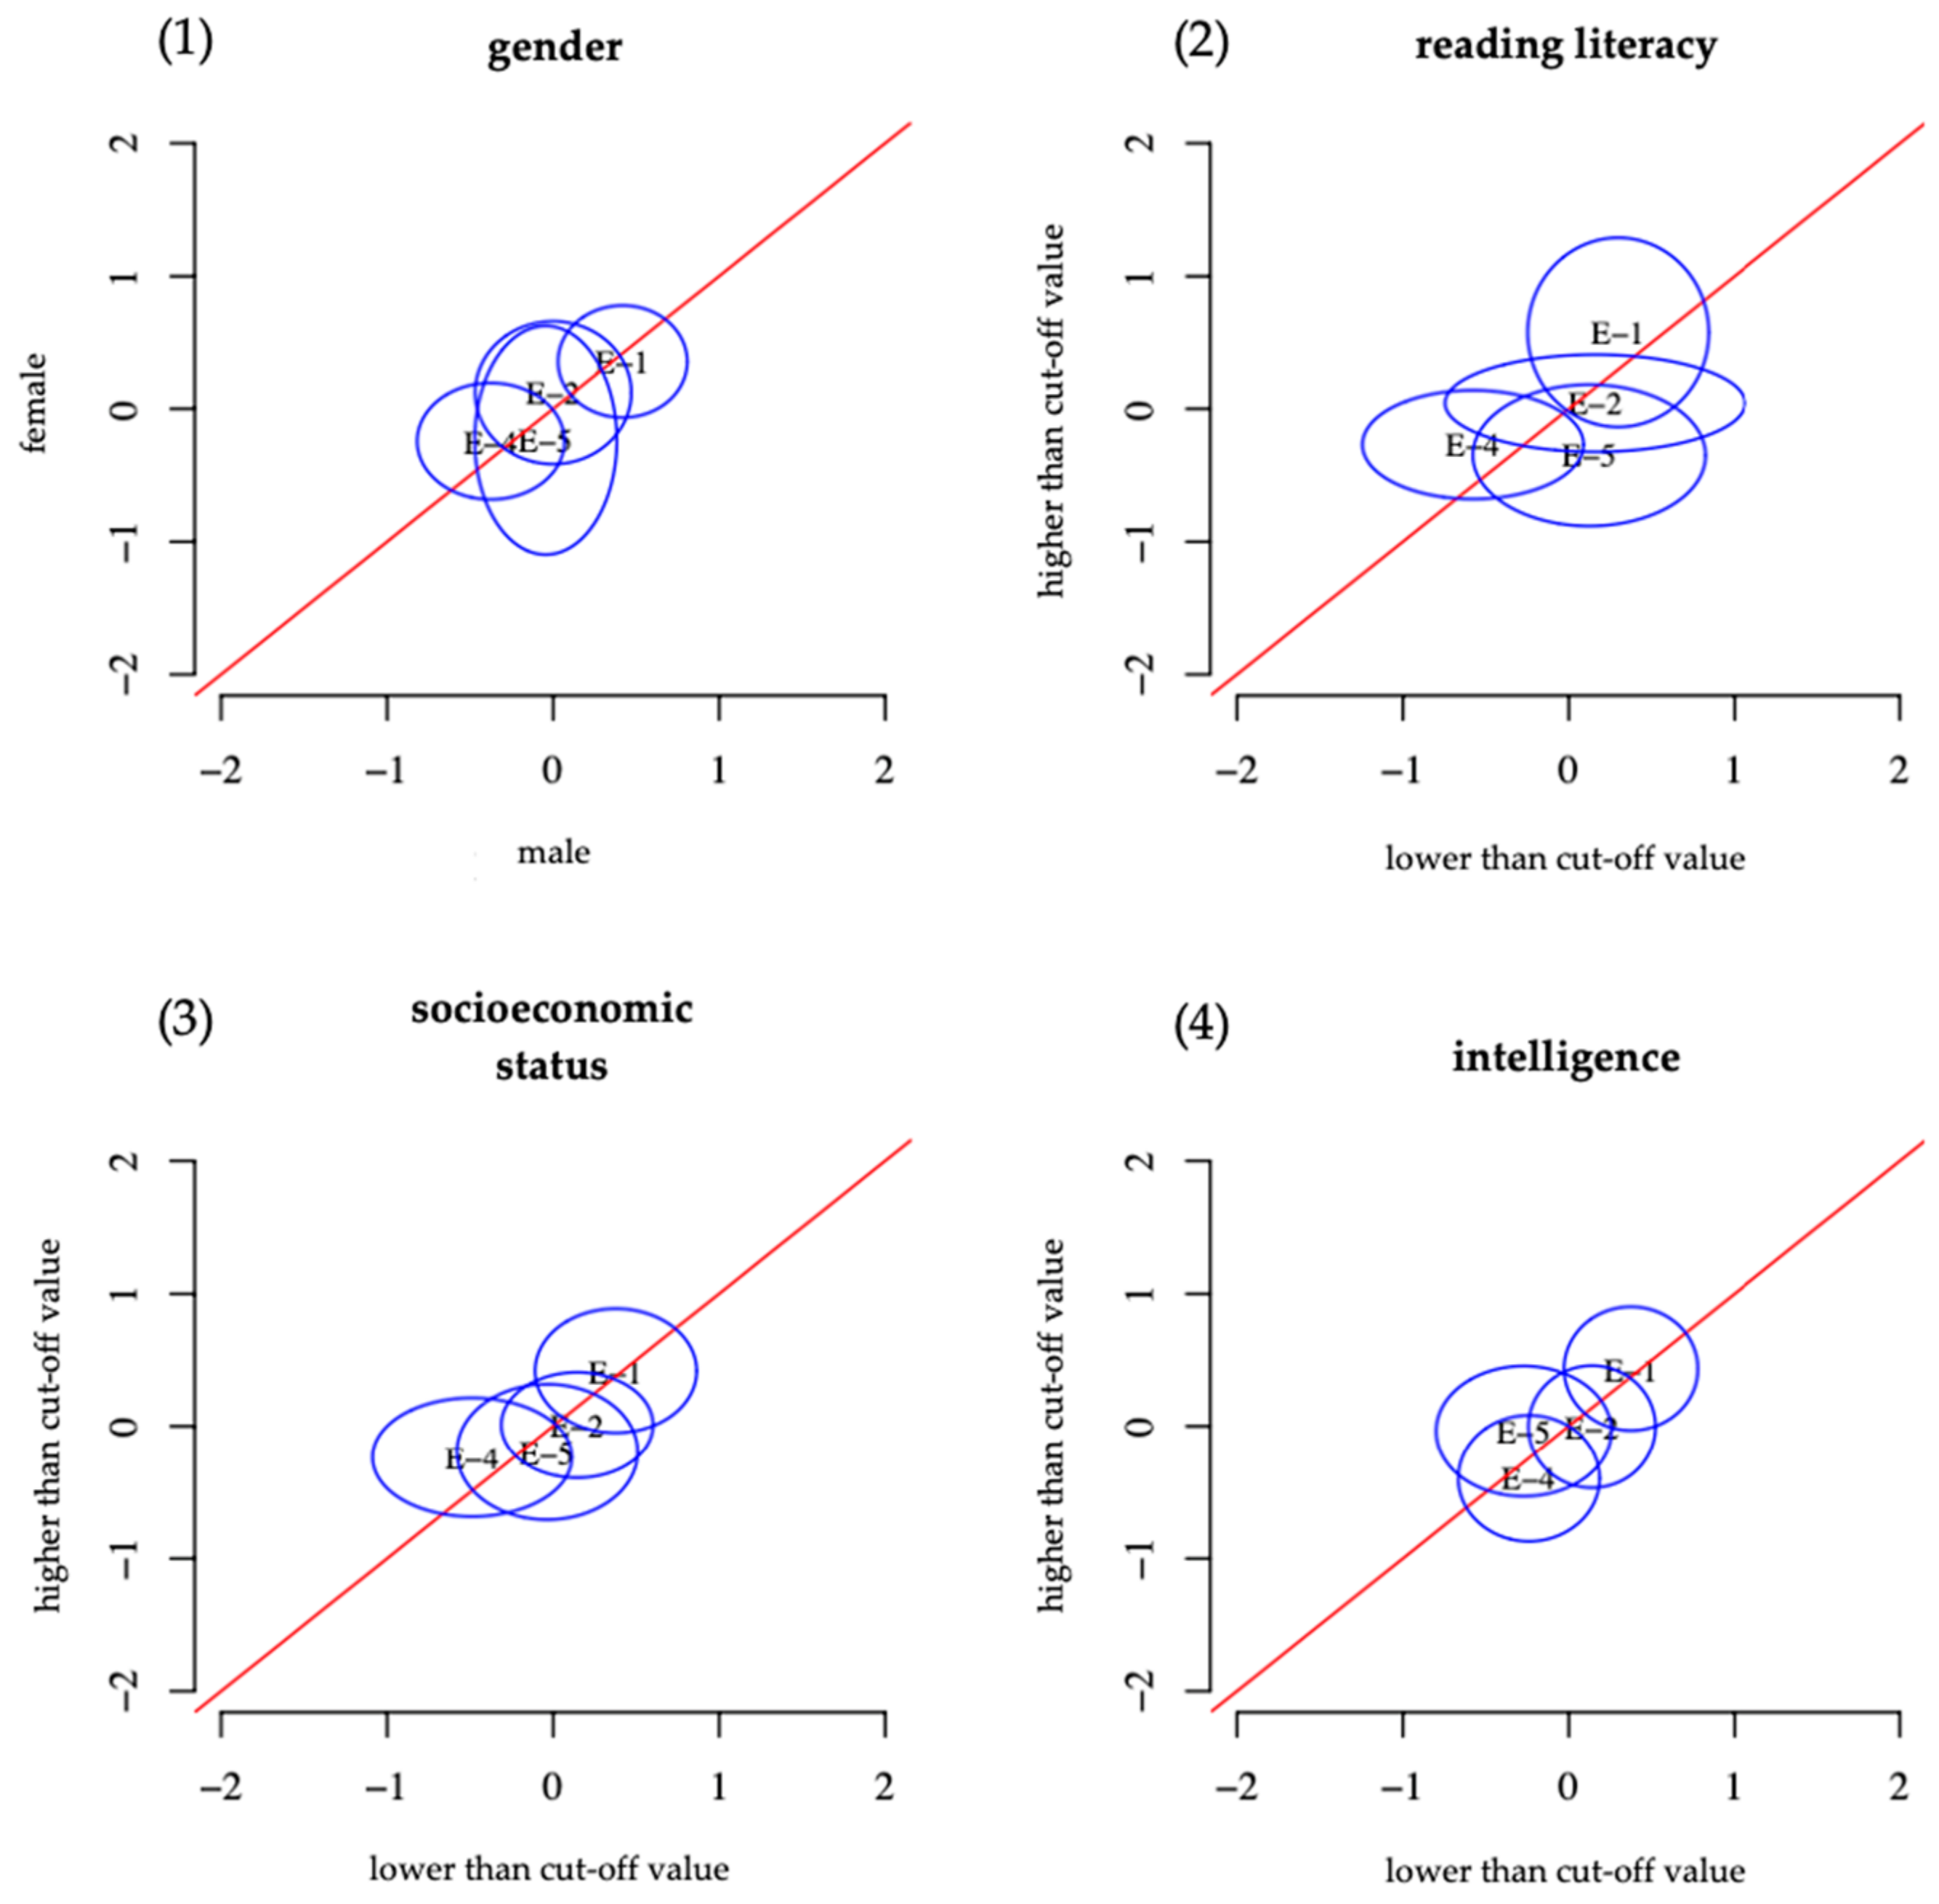
The items of the justification scale of the UDA assessment showed measurement invariance in all four group comparisons (Figure 3). The original assessment showed a similar situation except for item 2. There, students with higher intelligence were more successful than those with lower intelligence (Figure 4). Besides, a lower socioeconomic status led to a higher solution probability. Overall, the UDA assessment was minimally more accessible than the original assessment at the first measurement point regarding the justification scale.
5.3. Step Three: Checking on Learning Gains and Differences between UDL and MR Environment
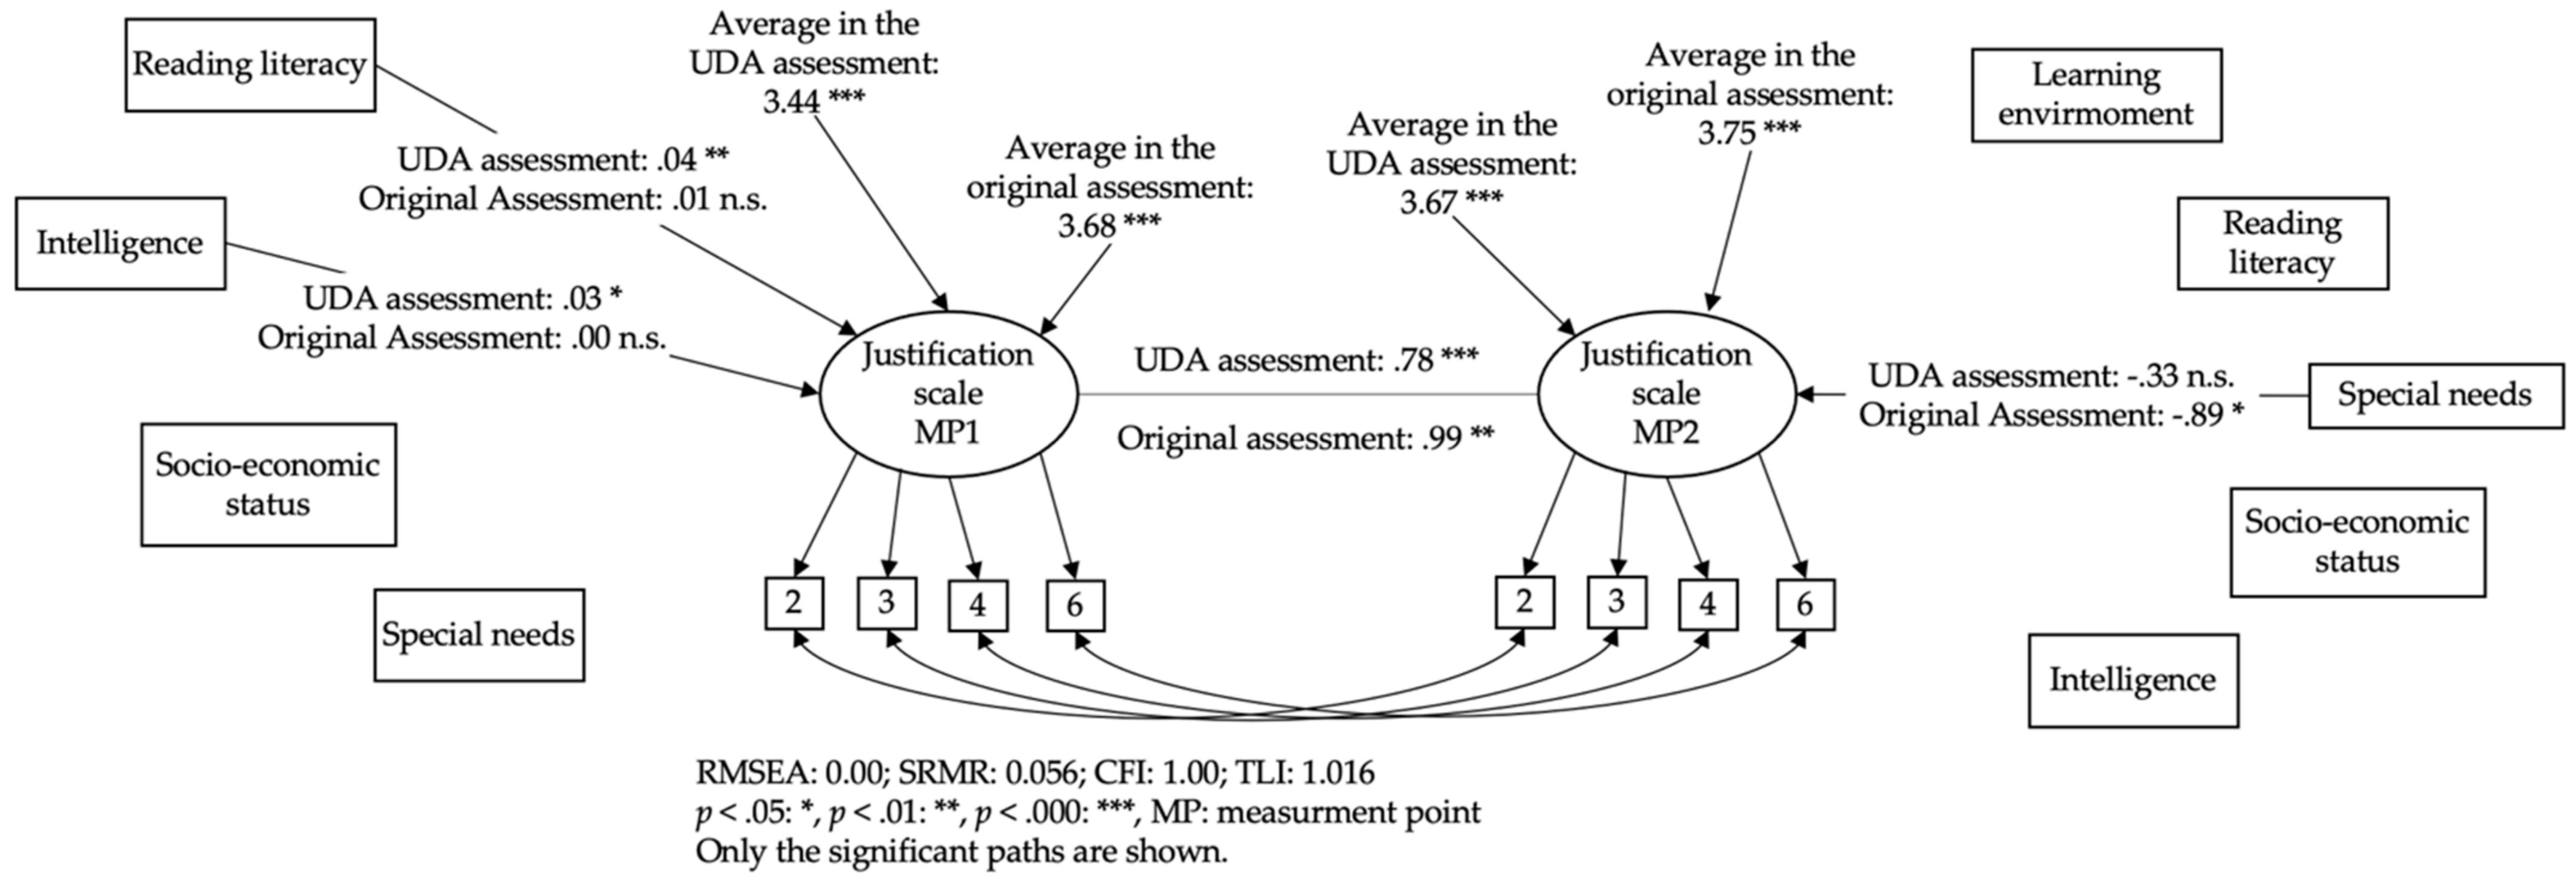
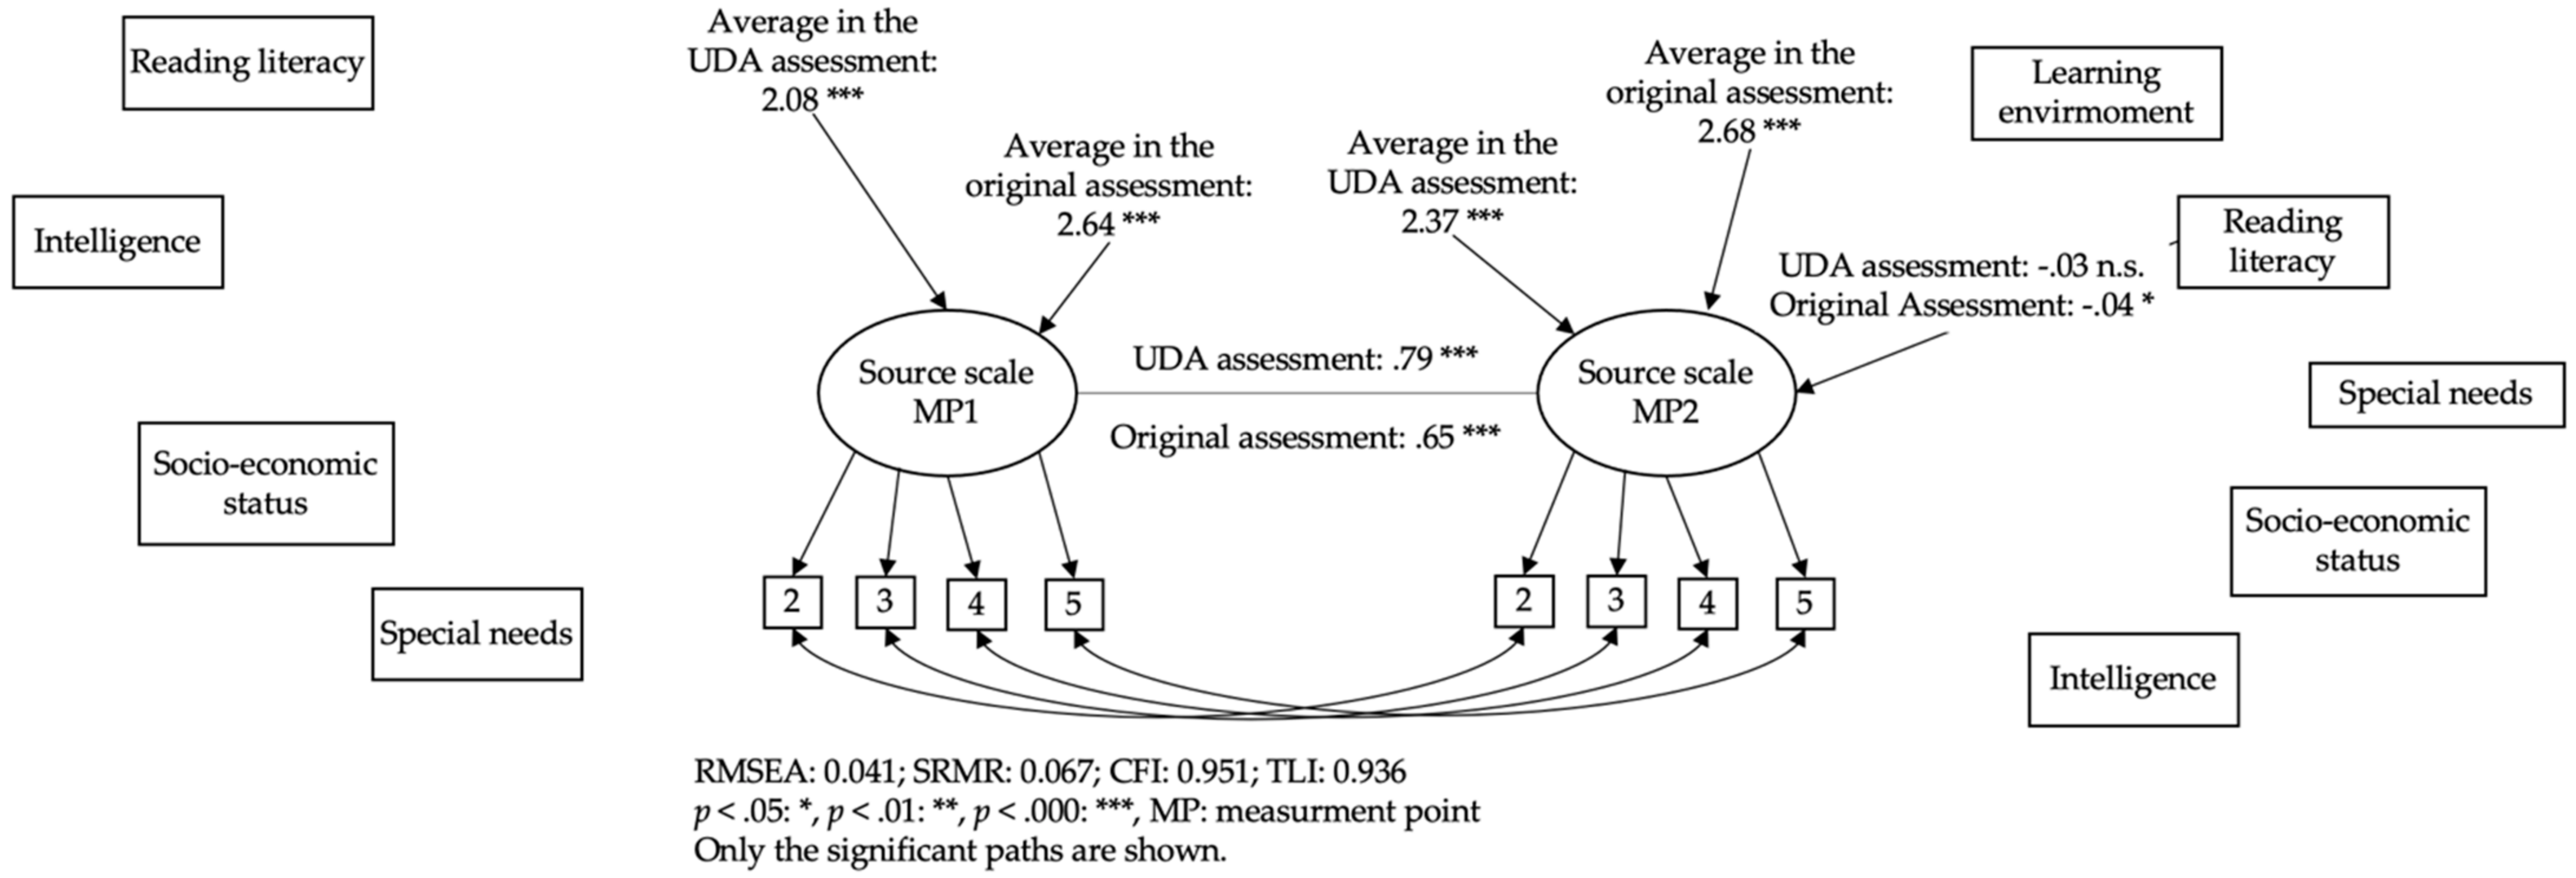
Figure 5 shows the multi-group panel model of interindividual changes in the justification scale. It takes into account the learner characteristics as well as the impact of the learning environment for the UDA and the original test version. Only significant paths are shown. In the EB dimension justification, the mean increases significantly (measurement point 1: UDA assessment M = 3.44, original assessment M = 3.68; measurement point 2: UDA assessment M = 3.67, original assessment M = 3.75) (Figure 5). At the first measurement time point, the regressions on intelligence and reading literacy on the latent construct are significant. The regressions of the constructs on each other are the largest of all comparisons. Students with special educational needs at the second measurement point show lower scores on the original assessment than those without special educational needs. Most importantly for research question three, no significant impact on the learning environment can be established. Students learning with the UDL environment did not outperform students learning in the MR environment. The learning gains measured by the original test version were not as high as those measured by the UDA version.
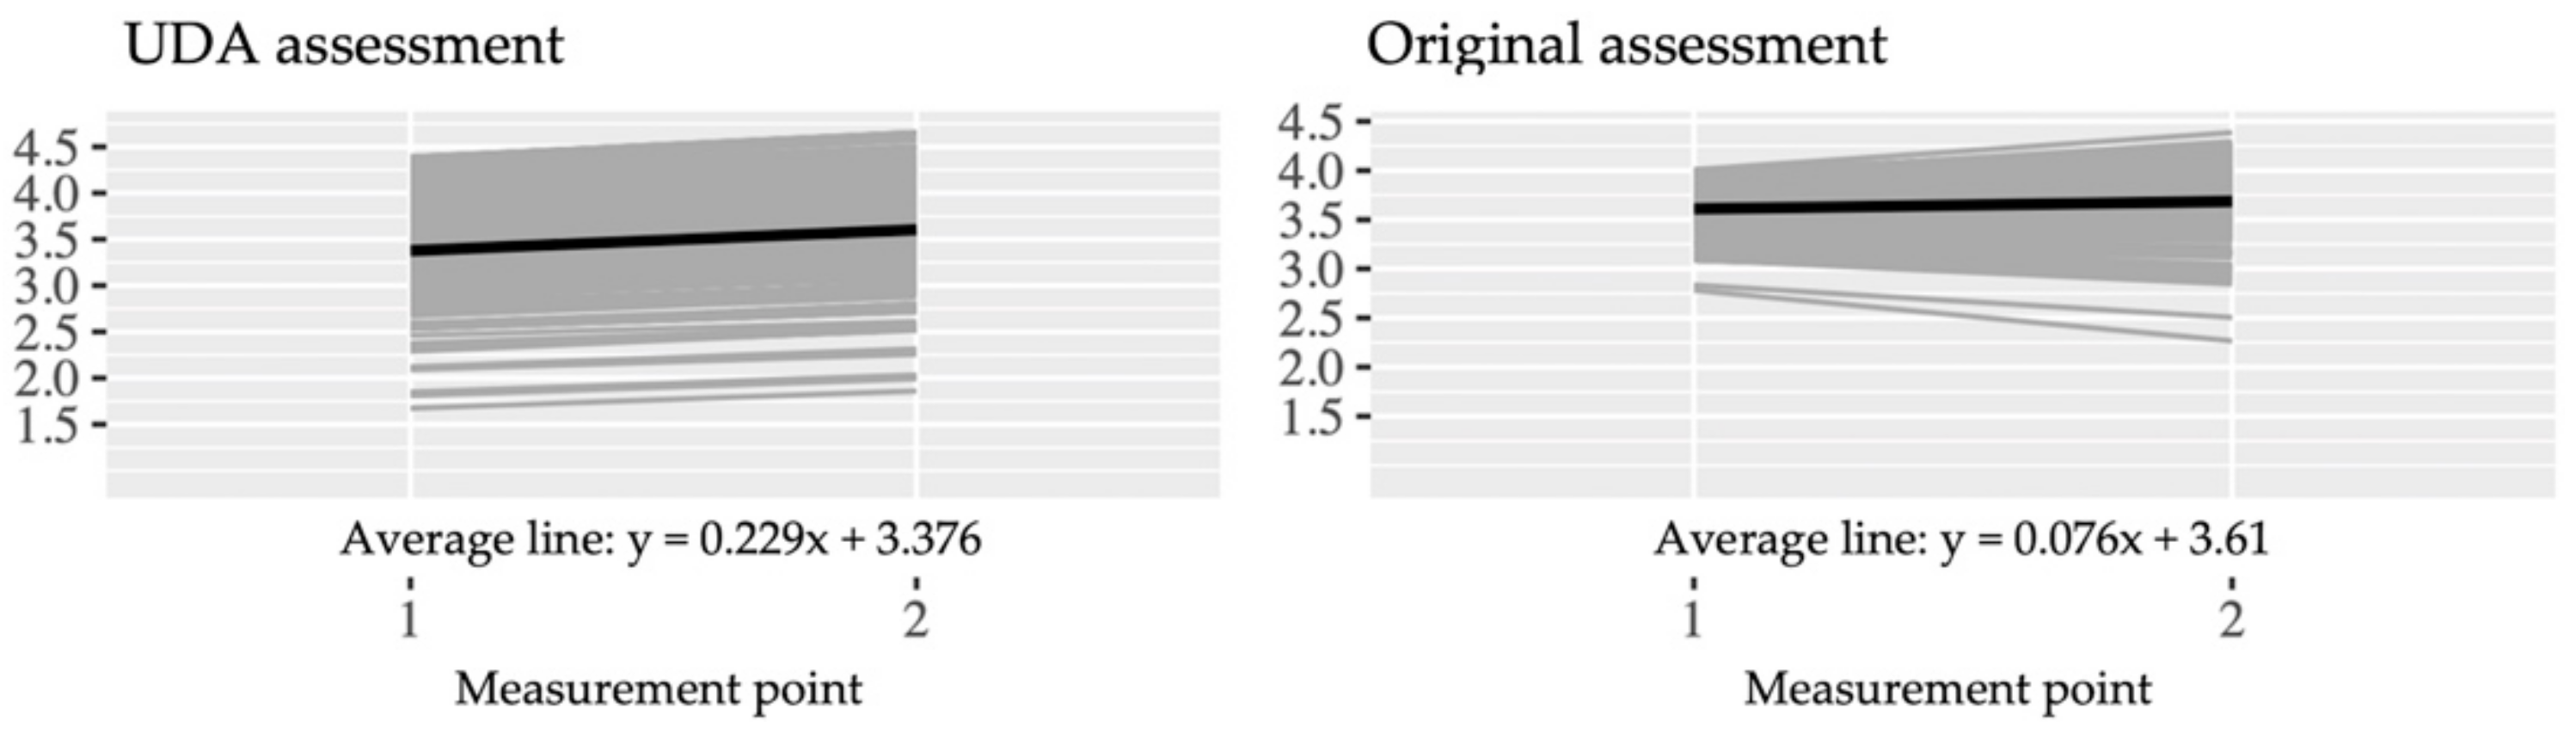
Furthermore, the longitudinal plots of the justification scale are shown below. In both assessment variants, the average increases from the first to the second measurement time point (UDA assessment: y = 0.229 × x + 3.376; M1 = 3.61, M2 = 3.83; original assessment: y = 0.076 × x + 3.61; M1 = 3.69, M2 = 3.76) (Figure 6). The UDA version indicated a comparable increase in EB development whereas the original version showed increases as well as decreases.
6. Discussion
Summarizing the Results and Answering the Research
Using a quasi-experimental study, we investigated the impact of using an extensive and a focused UDL-setting on the development of epistemic beliefs in science. We used a 2 × 2-between-subject design to examine the impact of adapting an EB questionnaire for researching in inclusive settings.
Regarding the first research questions, our results show that the UDA version has more adequately tested statistic values. The UDA assessment has a higher overall inter-item correlation than the original one. Furthermore, the internal consistency of both assessment variants increases towards the second measurement point. Yet with the UDA assessment, a higher consistency can already be assumed at the first measurement point due to McDonalds-w. However, comparing the learning gains, the UDA-based version indicates increased acceptance of sophisticated views on the justification of scientific knowledge, whereas the original version indicates an increased variance with a comparable stable mean. Students showed an increased as well as decreased acceptance of sophisticated views.
We assume that this effect is due to test barriers in the original questionnaire. We think that students working with the UDA version understand the items better in the first measurement point. Some students with the original version might need the learning environment to elaborate on their understanding. They might answer the original version in what they deem a purposeful manner in the second measurement point. This might lead to a decreased acceptance of sophisticated beliefs so the original version might not show all in all the elaboration of beliefs. To follow this finding, qualitative studies involving cognitive interviews such as proposed by Kuusela and Paul [57] or Ryan, Gannon-Slater, and Culbertson [58] might be fruitful. They would have to reflect, however, the diversity of students in inclusive learning settings.
Regarding the second and the third research questions, the UDA version of the questionnaire indicates an elaboration of students’ views on the justification of scientific knowledge. However, the multi-group panel models do not significantly impact the variable “learning environment.” This means that we could not detect students learning in the extensive UDL environment who outperformed those who learned in the MR environment.
We discuss these findings with regard to four implications:
Implication no. 1: In inclusive settings where quantitative research is conducted, test accommodation plays a significant role. Quantitative instruments should be used with care.
Aiming at a barrier minimized learning environment is undoubtedly a good step toward enabling all students to participate. For conducting research, barriers can be set up again, which can disadvantage particular students and lead to biased research results. Adjustments such as extending the processing time or reducing the number of items do not seem appropriate [59,60,61]. However, the principles of the UDA allow the barriers to be minimized without changing the target construct. If researchers minimized barriers in the assessment, it is important not to change the actual target construct to avoid unsystematic scoring patterns [62]. Within the framework of UDA, further adjustments are also possible and also beneficial. Zydney, Hord, and Koenig [63] show that video-based assessments for students with learning disabilities may be an excellent way to minimize barriers. Furthermore, there is a need to investigate accessibility through auditory representations [64].
Future projects in UDL-oriented research that contain quantitative approaches might benefit from adding qualitative research on the assessment, the processes of working with the assessment tool, and its possible barriers.
Implication no. 2: The UDL principles should be applied with care. “The more, the better” does not seem to be applicable.
This study could not detect significant advantages of the extensive UDL learning environment. Of course, non-significant findings might be explained by methodological effects such as too much error variance in the data. The reliability and DIF analyses, however, indicate a relatively acceptable amount of noise in the data. The effect of applying more UDL principles does not seem strong enough to hold its ground against the remaining data noise.
It is more likely that using a video as a tool containing multiple representations might be enough to decrease barriers for elaborating EBs. This was also shown in the preliminary study where interviews indicated that the embedded video already had advantages over the other representations. Since both learning environments use the video, the advantages of the UDL over the MR learning environment may be leveled out.
Implication no. 3: The UDL principles should be introduced with care. The more, the better might not be applicable in the long run. UDL also means changing a learning culture.
As this study was carried out with students in inclusive schools who did not work with UDL, the UDL learning environment might have been too complex to outperform the MR framework in the first place. We do not have any data on when students become familiar with learning with UDL environments. Since UDL is fundamentally different from monomodal teaching, its integration into the school routine may need to be ritualized over a longer period to unleash the full potential.
Implication no. 4: An unanswered question is how students’ learning behavior in a UDL learning environment leads to an increased outcome for all students. Learning analytics could fill this gap in research.
The learning environment was technically realized with an eBook app. When the study was carried out, it was not possible to track the students’ learning progress. Qualitative research might be one way to gain more insights into the learning processes. Against the multitude of students’ characteristics, future research may be able to draw on technological advances in learning analytics and machine learning in the sense of collecting and analyzing page view times, general usage of the eBook contents, or clickstreams. This makes it possible to “intelligently” process vast amounts of data beyond human capability. Thus, patterns can be detected, learning paths can be recorded, and extensive analysis can be performed. One challenge that future research will face is balancing the individuality of students’ learning and the categories that learning analytics and machine learning systems would use to make sense of students’ learning. Currently, there are already existing systems that can track the learning path of students with machine learning. With the help of log files, it is possible to identify students’ behavior regarding “gaming” the system [65] or the potential to identify student modeling practices more extensively in a way that has not been possible before thanks to machine learning [66]. Nevertheless, the need and benefit for systems that use machine learning are also evident concerning UDA. Through an “intelligent” system, future systems could adapt the assessment individually to the student [63].
All in all, this study might be a confirmatory approach to the UDL literature that focuses on an important research gap [6,7,13]. Our results might contribute to raising even more questions than we can answer in one study. Therefore, proposition #10 stated by Edyburn in 2010 [9] (p. 40) “UDL Is Much More Complex Than We Originally Thought” still seems applicable.
Author Contributions
Conceptualization, M.R., M.W. and A.N.; formal analysis, M.W.; investigation, M.W.; writing—original draft preparation, M.R.; writing—review and editing, M.W. and A.N. All authors have read and agreed to the published version of the manuscript.
Funding
This research received no external funding.
Data Availability Statement
For further data, please contact the authors.
Acknowledgments
A special thanks belong to the project “Didaktische Forschung”.
Conflicts of Interest
The authors declare no conflict of interest.
Appendix A.
Appendix A.1. Process of Item Selection at the Justification Scale

Table A1.
The Internal consistency of the justification scale before we shortened the item set [39].
Table A1.
The Internal consistency of the justification scale before we shortened the item set [39].
| EBs-Scale | Measurement Point 1 | Measurement Point 2 | Both Measurement Point |
|---|---|---|---|
| UDA Assessment | |||
| Source | 0.59 | 0.83 | 0.76 |
| Certainty | 0.81 | 0.87 | 0.87 |
| Development | 0.86 | 0.89 | 0.9 |
| Justification | 0.83 | 0.84 | 0.87 |
| Original Assessment | |||
| Source | 0.7 | 0.76 | 0.79 |
| Certainty | 0.78 | 0.85 | 0.87 |
| Development | 0.83 | 0.9 | 0.89 |
| Justification | 0.52 | 0.77 | 0.74 |
Table A2.
Measurement invariance of the justification scale before we shortened the item set [39].
Table A2.
Measurement invariance of the justification scale before we shortened the item set [39].
| Fit Values | ||||||||
|---|---|---|---|---|---|---|---|---|
| Stage | Chi-Square | dF | p | RMSEA | CFI | TLI | SRMR | Accepted? |
| Configural | 206.6 | 138 | <0.05 | 0.065 | 0.929 | 0.906 | 0.061 | Yes |
| Metric | 227.48 | 156 | <0.05 | 0.062 | 0.926 | 0.914 | 0.077 | Yes |
| Scalar | 274.02 | 174 | <0.05 | 0.07 | 0.896 | 0.892 | 0.083 | No |
| Partial scalar | 259.89 | 172 | <0.05 | 0.066 | 0.909 | 0.904 | 0.083 | Yes |
| Strict | 285.33 | 190 | <0.05 | 0.065 | 0.901 | 0.905 | 0.086 | Yes |
Explanatory note: dF: degrees of freedom; CFI: Comparative-Fit-Index; RMSEA: Root-Mean-Square-Error of Approximation; TLI: Trucker-Lewis-Index; SRMR: Standardized Root Mean Square Residual; Partial scalar: Restriction for the mean values of item 3 removed.
Table A3.
Regressions in the MIMIC approach to the justification scale. Shown are the regressions of the learning environment on the latent factor and manifest indicators in a configural measurement invariance model [39].
Table A3.
Regressions in the MIMIC approach to the justification scale. Shown are the regressions of the learning environment on the latent factor and manifest indicators in a configural measurement invariance model [39].
| Original Assessment | UDA Assessment | |||
|---|---|---|---|---|
| Items | Estimate | p-Value | Estimate | p-Value |
| Latent factor | −0.05 | 0.56 | −0.16 | 0.09 |
| Item 1 | 0.19 | 0.30 | −0.21 | 0.21 |
| Item 2 | 0.11 | 0.48 | 0.00 | 0.97 |
| Item 3 | 0.07 | 0.63 | 0.00 | 0.97 |
| Item 4 | 0.10 | 0.40 | 0.03 | 0.82 |
| Item 5 | −0.05 | 0.66 | 0.18 | 0.19 |
| Item 6 | −0.20 | 0.07 | 0.04 | 0.77 |
| Item 7 | −0.12 | 0.34 | −0.14 | 0.26 |
Explanatory note: CFI: 0.924; TLI: 0.892; RMSEA: 0.00; SRMR: 0.062.
Table A4.
Significant mean change of items in both assessments to the justification scale (Bonferroni correction performed) [39].
Table A4.
Significant mean change of items in both assessments to the justification scale (Bonferroni correction performed) [39].
| Original Assessment | UDA Assessment | |||
|---|---|---|---|---|
| Items | MP 2-MP 1 | p | MP 2-MP 1 | p |
| Item 1 | 0.45 | <0.05 | −0.02 | 1.000 |
| Item 2 | 0.12 | 1.000 | −0.24 | 0.378 |
| Item 3 | 0.17 | 1.000 | 0.00 | 1.000 |
| Item 4 | 0.44 | <0.05 | 0.18 | 1.000 |
| Item 5 | 0.22 | 0.297 | 0.04 | 1.000 |
| Item 6 | −0.09 | 1.000 | 0.01 | 1.000 |
| Item 7 | 0.17 | 1.000 | 0.10 | 1.000 |
Explanatory note: MP: Measurement point.
Appendix A.2. Results of the Source, Certainity and Development Scales
Table A5.
Measurement invariance of the source scale before we shortened the item set [39].
Table A5.
Measurement invariance of the source scale before we shortened the item set [39].
| Fit Values | ||||||||
|---|---|---|---|---|---|---|---|---|
| Stage | Chi-Square | dF | p | RMSEA | CFI | TLI | SRMR | Accepted? |
| Configural | 103.43 | 58 | <0.05 | 0.08 | 0.929 | 0.889 | 0.057 | Yes |
| Metric | 119.13 | 70 | <0.05 | 0.076 | 0.923 | 0.901 | 0.07 | Yes |
| Scalar | 180.01 | 82 | <0.05 | 0.099 | 0.846 | 0.831 | 0.089 | No |
| Partial scalar | 131.39 | 79 | <0.05 | 0.074 | 0.918 | 0.906 | 0.072 | Yes |
| Strict | 169.78 | 88 | <0.05 | 0.087 | 0.872 | 0.869 | 0.086 | No |
Explanatory note: dF: degrees of freedom; CFI: Comparative-Fit-Index; RMSEA: Root-Mean-Square-Error of Approximation; TLI: Trucker-Lewis-Index; SRMR. Standardized Root Mean Square Residual; Partial scalar: Restriction for the mean values of item 3 removed.
Table A6.
Regressions in the MIMIC approach to the source scale. Shown are the regressions of the learning environment on the latent factor and manifest indicators in a configural measurement invariance model [39].
Table A6.
Regressions in the MIMIC approach to the source scale. Shown are the regressions of the learning environment on the latent factor and manifest indicators in a configural measurement invariance model [39].
| Original Assessment | UDA Assessment | |||
|---|---|---|---|---|
| Items | Estimate | p-Value | Estimate | p-Value |
| Latent factor | −0.17 | 0.07 | 0.15 | 0.26 |
| Item 1 | −0.21 | 0.27 | 0.27 | 0.12 |
| Item 2 | −0.03 | 0.85 | 0.09 | 0.49 |
| Item 3 | 0.05 | 0.68 | −0.14 | 0.36 |
| Item 4 | 0.05 | 0.70 | 0.10 | 0.42 |
| Item 5 | 0.19 | 0.15 | −0.12 | 0.44 |
Explanatory note: CFI: 0.911; TLI: 0.861; RMSEA: 0.075; SRMR: 0.067.
Table A7.
Measurement invariance of the certainty scale before we shortened the item set [39].
Table A7.
Measurement invariance of the certainty scale before we shortened the item set [39].
| Fit Values | ||||||||
|---|---|---|---|---|---|---|---|---|
| Stage | Chi-Square | dF | p | RMSEA | CFI | TLI | SRMR | Accepted? |
| Configural | 253.86 | 138 | <0.05 | 0.083 | 0.904 | 0.873 | 0.064 | Yes |
| Metric | 275.62 | 156 | <0.05 | 0.079 | 0.901 | 0.884 | 0.073 | Yes |
| Scalar | 412.36 | 174 | <0.05 | 0.106 | 0.803 | 0.793 | 0.103 | No |
| Partial scalar | 328.45 | 165 | <0.05 | 0.09 | 0.865 | 0.851 | 0.086 | No |
| Strict | 348.82 | 181 | <0.05 | 0.087 | 0.861 | 0.86 | 0.089 | No |
Explanatory note: dF: degrees of freedom; CFI: Comparative-Fit-Index; RMSEA: Root-Mean-Square-Error of Approximation; TLI: Trucker-Lewis-Index; SRMR. Standardized Root Mean Square Residual; Partial scalar: Restriction for the mean values of item 3 removed.
Table A8.
Regressions in the MIMIC approach to the certainity scale. Shown are the regressions of the learning environment on the latent factor and manifest indicators in a configural measurement invariance model [39].
Table A8.
Regressions in the MIMIC approach to the certainity scale. Shown are the regressions of the learning environment on the latent factor and manifest indicators in a configural measurement invariance model [39].
| Original Assessment | UDA Assessment | |||
|---|---|---|---|---|
| Items | Estimate | p-Value | Estimate | p-Value |
| Latent factor | 0.02 | 0.89 | 0.20 | 0.10 |
| Item 1 | −0.01 | 0.96 | 0.20 | 0.21 |
| Item 2 | 0.06 | 0.69 | 0.39 | 0.01 |
| Item 3 | 0.07 | 0.63 | 0.23 | 0.10 |
| Item 4 | 0.04 | 0.79 | −0.21 | 0.18 |
| Item 5 | 0.05 | 0.74 | −0.02 | 0.87 |
| Item 6 | 0.23 | 0.08 | −0.41 | 0.00 |
| Item 7 | −0.16 | 0.28 | 0.18 | 0.23 |
Explanatory note: CFI: 0.902; TLI: 0.861; RMSEA: 0.00; SRMR: 0.063.
Table A9.
Measurement invariance of the development scale before we shortened the item set [39].
Table A9.
Measurement invariance of the development scale before we shortened the item set [39].
| Fit Values | ||||||||
|---|---|---|---|---|---|---|---|---|
| Stage | Chi-Square | dF | p | RMSEA | CFI | TLI | SRMR | Accepted? |
| Configural | 343.39 | 190 | <0.05 | 0.085 | 0.903 | 0.878 | 0.065 | Yes |
| Metric | 360.14 | 211 | <0.05 | 0.08 | 0.906 | 0.893 | 0.072 | Yes |
| Scalar | 452.79 | 232 | <0.05 | 0.093 | 0.861 | 0.856 | 0.081 | No |
| Partial scalar | 391.18 | 223 | <0.05 | 0.082 | 0.894 | 0.886 | 0.077 | No |
| Strict | 508.56 | 241 | <0.05 | 0.1 | 0.831 | 0.832 | 0.09 | No |
Explanatory note: dF: degrees of freedom; CFI: Comparative-Fit-Index; RMSEA: Root-Mean-Square-Error of Approximation; TLI: Trucker-Lewis-Index; SRMR. Standardized Root Mean Square Residual; Partial scalar: Constraint for the factor loadings for Items 1 and 6 at both measurement time points 1 and 2.
Table A10.
Regressions in the MIMIC approach to the development scale. Shown are the regressions of the learning environment on the latent factor and manifest indicators in a configural measurement invariance model [39].
Table A10.
Regressions in the MIMIC approach to the development scale. Shown are the regressions of the learning environment on the latent factor and manifest indicators in a configural measurement invariance model [39].
| Original Assessment | UDA Assessment | |||
|---|---|---|---|---|
| Items | Estimate | p-Value | Estimate | p-Value |
| Latent factor | −0.09 | 0.45 | 0.11 | 0.34 |
| Item 1 | −0.19 | 0.86 | −0.03 | 0.86 |
| Item 2 | 0.06 | 0.65 | −0.05 | 0.73 |
| Item 3 | 0.03 | 0.75 | 0.09 | 0.57 |
| Item 4 | 0.06 | 0.59 | -0.08 | 0.55 |
| Item 5 | −0.02 | 0.90 | −0.11 | 0.39 |
| Item 6 | −0.03 | 0.82 | 0.01 | 0.97 |
| Item 7 | 0.01 | 0.91 | 0.22 | 0.17 |
| Item 8 | 0.08 | 0.45 | 0.11 | 0.52 |
Explanatory note: CFI: 0.894; TLI: 0.859; RMSEA: 0.051; SRMR: 0.068.
Table A11.
Significant mean change of items in both assessments to the source, certainty and development scales (Bonferroni correction performed) [39].
Table A11.
Significant mean change of items in both assessments to the source, certainty and development scales (Bonferroni correction performed) [39].
| Original Assessment | UDA Assessment | |||
|---|---|---|---|---|
| Items | MP 2-MP 1 | p | MP 2-MP 1 | p |
| Source scale | ||||
| Item 1 | −0.19 | 1.000 | 0.06 | 1.000 |
| Item 2 | −0.35 | 0.108 | −0.04 | 1.000 |
| Item 3 | 0.61 | <0.05 | 0.35 | <0.05 |
| Item 4 | −0.17 | 1.000 | −0.24 | 0.378 |
| Item 5 | −0.54 | <0.05 | −0.03 | 1.000 |
| Certainty scale | ||||
| Item 1 | −0.11 | 1.000 | 0.07 | 1.000 |
| Item 2 | −0.38 | <0.05 | −0.11 | 1.000 |
| Item 3 | −0.11 | 1.000 | −0.01 | 1.000 |
| Item 4 | −0.39 | <0.05 | −0.10 | 1.000 |
| Item 5 | −0.34 | <0.05 | −0.16 | 1.000 |
| Item 6 | −0.75 | <0.05 | −0.06 | 1.000 |
| Item 7 | −0.49 | <0.05 | −0.16 | 1.000 |
| Development scale | ||||
| Item 1 | 0.49 | <0.05 | 0.16 | 1.000 |
| Item 2 | 0.47 | <0.05 | 0.26 | 0.135 |
| Item 3 | 0.46 | <0.05 | −0.11 | 1.000 |
| Item 4 | 0.11 | 1.000 | 0.08 | 1.000 |
| Item 5 | 0.26 | 0.243 | 0.19 | 0.729 |
| Item 6 | 0.27 | 0.189 | 0.07 | 1.000 |
| Item 7 | −0.21 | 1.000 | −0.22 | 0.513 |
| Item 8 | −0.12 | 1.000 | −0.12 | 1.000 |
Table A12.
Reformulated source, certainty and development short scales with the standard factor loadings, mean differences and associated Bonferroni-corrected significances [39].
Table A12.
Reformulated source, certainty and development short scales with the standard factor loadings, mean differences and associated Bonferroni-corrected significances [39].
| Original Assessment | UDA Assessment | |||||||
|---|---|---|---|---|---|---|---|---|
| Standardized Factor Loadings | Mean Values | Standardized Factor Loadings | Mean Values | |||||
| MP 1 | MP 2 | MP 2-MP1 | p | MP 1 | MP 2 | MP 2-MP1 | p | |
| Source scale | ||||||||
| Item 2 | 0.50 | 0.66 | −0.04 | 0.71 | 0.27 | 0.77 | −0.35 | 0.00 |
| Item 3 | 0.37 | 0.71 | 0.35 | 0.00 | 0.54 | 0.65 | 0.61 | 0.00 |
| Item 4 | 0.78 | 0.78 | −0.24 | 0.01 | 0.60 | 0.79 | −0.17 | 0.16 |
| Item 5 | 0.69 | 0.63 | −0.03 | 0.74 | 0.52 | 0.69 | −0.54 | 0.00 |
| Certainty scale | ||||||||
| Item 3 | 0.66 | 0.70 | −0.01 | 0.90 | 0.65 | 0.75 | −0.11 | 0.29 |
| Item 4 | 0.55 | 0.70 | −0.10 | 0.33 | 0.82 | 0.73 | −0.39 | 0.00 |
| Item 6 | 0.63 | 0.63 | −0.06 | 0.50 | 0.64 | 0.71 | −0.75 | 0.00 |
| Item 7 | 0.66 | 0.62 | −0.16 | 0.10 | 0.62 | 0.73 | −0.49 | 0.00 |
| Development scale | ||||||||
| Item 1 | 0.56 | 0.66 | 0.16 | 0.10 | 0.72 | 0.70 | 0.12 | 0.26 |
| Item 2 | 0.64 | 0.71 | 0.26 | 0.00 | 0.52 | 0.60 | 0.17 | 0.08 |
| Item 4 | 0.65 | 0.76 | 0.08 | 0.41 | 0.63 | 0.69 | 0.44 | 0.00 |
| Item 5 | 0.67 | 0.65 | 0.19 | 0.03 | 0.66 | 0.68 | −0.09 | 0.36 |
Explanatory note: MP: measurement point.
Table A13.
Measurement invariance models for EB short scale source [39].
Table A13.
Measurement invariance models for EB short scale source [39].
| Fit Values | ||||||||
|---|---|---|---|---|---|---|---|---|
| Stage | Chi-Square | dF | p | RMSEA | CFI | TLI | SRMR | Accepted? |
| Configural | 37.35 | 30 | 0.167 | 0.045 | 0.985 | 0.972 | 0.041 | Yes |
| Metric | 53.18 | 39 | 0.065 | 0.054 | 0.971 | 0.958 | 0.068 | Yes |
| Scalar | 114.8 | 48 | <0.05 | 0.106 | 0.863 | 0.84 | 0.094 | No |
| Partial scalar | 64.15 | 46 | <0.05 | 0.057 | 0.963 | 0.955 | 0.074 | Yes |
| Strict | 136.96 | 58 | <0.05 | 0.105 | 0.838 | 0.844 | 0.096 | Yes |
Explanatory note: dF: degrees of freedom; CFI: Comparative-Fit-Index; RMSEA: Root-Mean-Square-Error of Approximation; TLI: Trucker-Lewis-Index; SRMR. Standardized Root Mean Square Residual; Partial scalar: Restriction for the mean values of item 3 removed; Measurement time canceled.
Table A14.
Measurement invariance models for EB short scale certainty [39].
Table A14.
Measurement invariance models for EB short scale certainty [39].
| Fit Values | ||||||||
|---|---|---|---|---|---|---|---|---|
| Stage | Chi-Square | dF | p | RMSEA | CFI | TLI | SRMR | Accepted? |
| Configural | 55.46 | 30 | <0.05 | 0.083 | 0.957 | 0.92 | 0.049 | Yes |
| Metric | 71.53 | 39 | <0.05 | 0.082 | 0.945 | 0.921 | 0.068 | Yes |
| Scalar | 119.1 | 48 | <0.05 | 0.109 | 0.88 | 0.86 | 0.098 | No |
| Partial scalar | 76.69 | 44 | <0.05 | 0.077 | 0.945 | 0.93 | 0.071 | Yes |
| Strict | 87.18 | 56 | <0.05 | 0.067 | 0.948 | 0.948 | 0.067 | Yes |
Explanatory note: dF: degrees of freedom; CFI: Comparative-Fit-Index; RMSEA: Root-Mean-Square-Error of Approximation; TLI: Trucker-Lewis-Index; SRMR. Standardized Root Mean Square Residual; Partial scalar: Restriction for the mean values of item 3 and 6 removed; Measurement time canceled.
Table A15.
Measurement invariance models for EB short scale development [39].
Table A15.
Measurement invariance models for EB short scale development [39].
| Fit Values | ||||||||
|---|---|---|---|---|---|---|---|---|
| Stage | Chi-Square | dF | p | RMSEA | CFI | TLI | SRMR | Accepted? |
| Configural | 41.31 | 30 | 0.082 | 0.053 | 0.984 | 0.971 | 0.034 | Yes |
| Metric | 48.93 | 39 | 0.132 | 0.043 | 0.986 | 0.98 | 0.046 | Yes |
| Scalar | 69.95 | 48 | <0.05 | 0.058 | 0.969 | 0.964 | 0.057 | No |
| Partial scalar | 63.19 | 46 | <0.05 | 0.052 | 0.976 | 0.971 | 0.054 | Yes |
| Strict | 87.18 | 56 | <0.05 | 0.067 | 0.948 | 0.948 | 0.067 | No |
Explanatory note: dF: degrees of freedom; CFI: Comparative-Fit-Index; RMSEA: Root-Mean-Square-Error of Approximation; TLI: Trucker-Lewis-Index; SRMR. Standardized Root Mean Square Residual; Partial scalar: Restriction for factor loading of item 2 at the first measurement time point.
Figure A1.
DIF analysis of the source scale from the UDA assessment concerning (1) gender, (2) reading literacy, (3) socioeconomic status, and (4) intelligence [39].
Figure A1.
DIF analysis of the source scale from the UDA assessment concerning (1) gender, (2) reading literacy, (3) socioeconomic status, and (4) intelligence [39].

Figure A2.
DIF analysis of the source scale from the original assessment concerning (1) gender, (2) reading literacy, (3) socioeconomic status, and (4) intelligence [39].
Figure A2.
DIF analysis of the source scale from the original assessment concerning (1) gender, (2) reading literacy, (3) socioeconomic status, and (4) intelligence [39].

Figure A3.
DIF analysis of the certainty scale from the UDA assessment concerning (1) gender, (2) reading literacy, (3) socioeconomic status, and (4) intelligence [39].
Figure A3.
DIF analysis of the certainty scale from the UDA assessment concerning (1) gender, (2) reading literacy, (3) socioeconomic status, and (4) intelligence [39].

Figure A4.
DIF analysis of the certainty scale from the original assessment concerning (1) gender, (2) reading literacy, (3) socioeconomic status, and (4) intelligence [39].
Figure A4.
DIF analysis of the certainty scale from the original assessment concerning (1) gender, (2) reading literacy, (3) socioeconomic status, and (4) intelligence [39].

Figure A5.
DIF analysis of the development scale from the UDA assessment concerning (1) gender, (2) reading literacy, (3) socioeconomic status, and (4) intelligence [39].
Figure A5.
DIF analysis of the development scale from the UDA assessment concerning (1) gender, (2) reading literacy, (3) socioeconomic status, and (4) intelligence [39].

Figure A6.
DIF analysis of the development scale from the original assessment concerning (1) gender, (2) reading literacy, (3) socioeconomic status, and (4) intelligence [39].
Figure A6.
DIF analysis of the development scale from the original assessment concerning (1) gender, (2) reading literacy, (3) socioeconomic status, and (4) intelligence [39].

Figure A7.
Simplified multi-group panel model of interindividual changes in the source scale taking into account learner characteristics. Only significant paths are shown [39].
Figure A7.
Simplified multi-group panel model of interindividual changes in the source scale taking into account learner characteristics. Only significant paths are shown [39].

Figure A8.
Simplified multi-group panel model of interindividual changes in the certainty scale taking into account learner characteristics. Only significant paths are shown [39].
Figure A8.
Simplified multi-group panel model of interindividual changes in the certainty scale taking into account learner characteristics. Only significant paths are shown [39].

Figure A9.
Simplified multi-group panel model of interindividual changes in the development scale taking into account learner characteristics. Only significant paths are shown [39].
Figure A9.
Simplified multi-group panel model of interindividual changes in the development scale taking into account learner characteristics. Only significant paths are shown [39].

Figure A10.
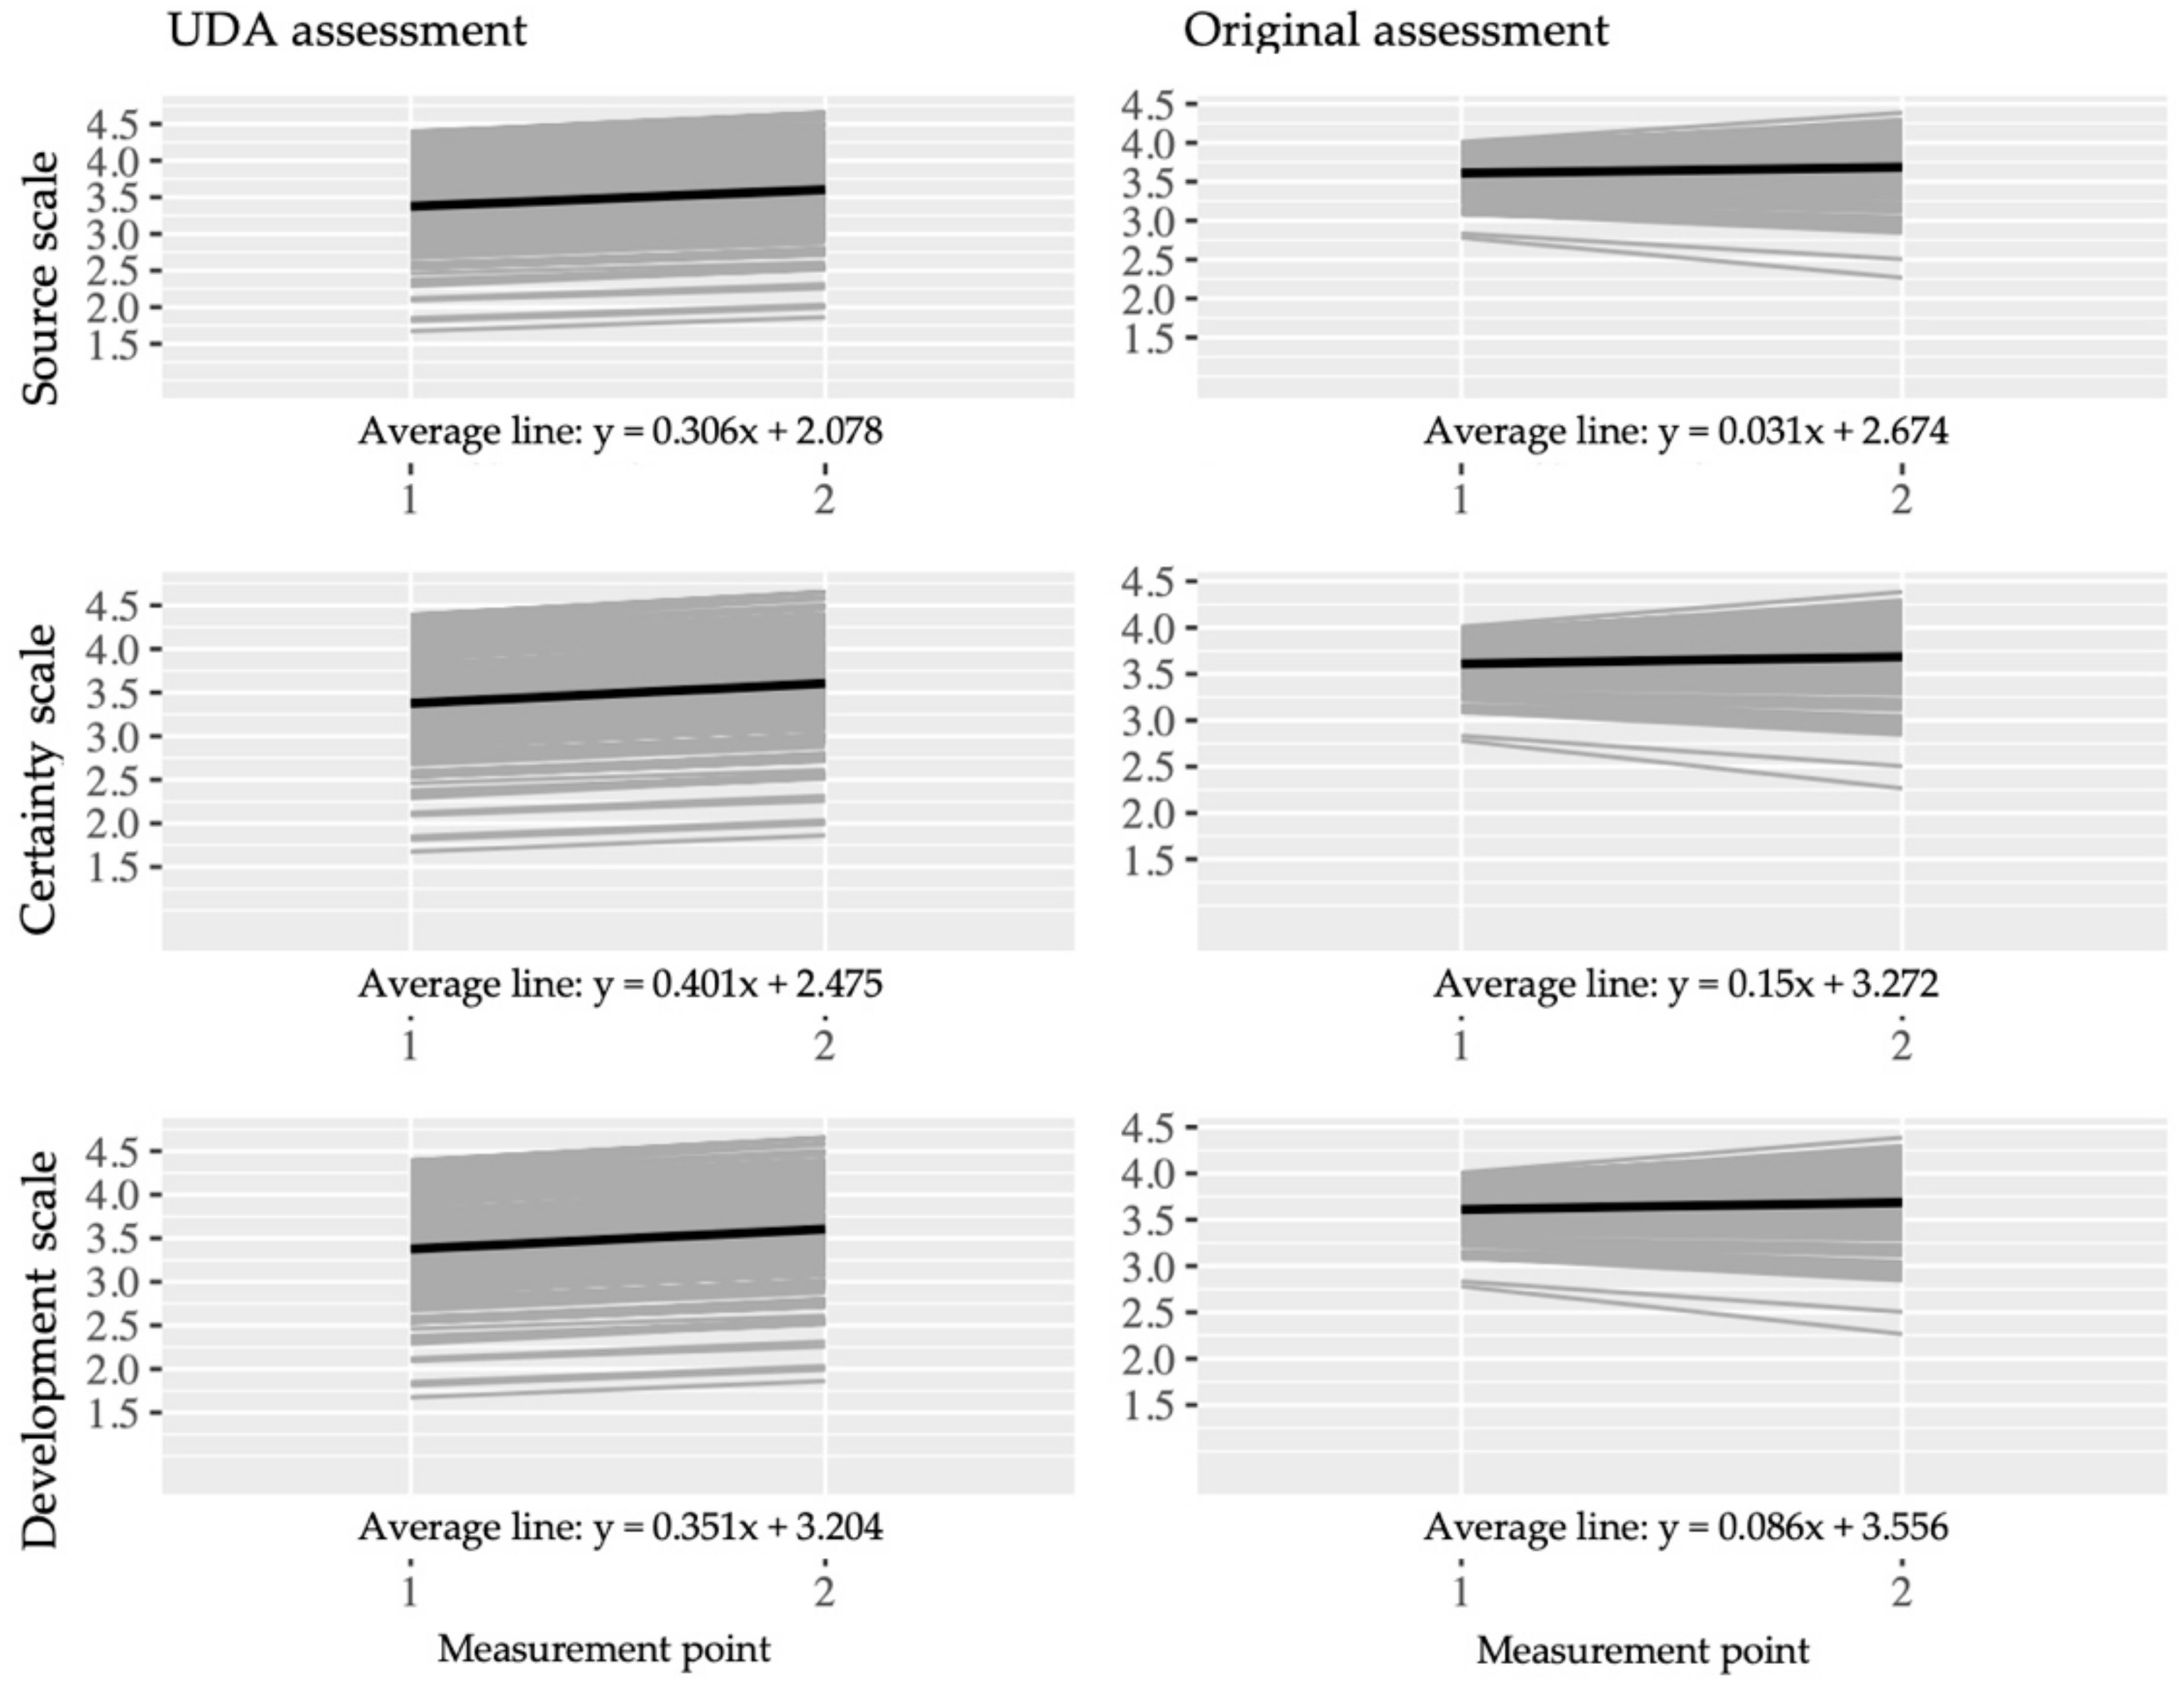
Longitudinal plots to trajectories of all students to the source, certainty and development scales from both assessments (UDA assessment n = 175; original assessment= 165). The average is shown in black [39].
Figure A10.
Longitudinal plots to trajectories of all students to the source, certainty and development scales from both assessments (UDA assessment n = 175; original assessment= 165). The average is shown in black [39].

References
- Stinken-Rösner, L.; Rott, L.; Hundertmark, S.; Menthe, J.; Hoffmann, T.; Nehring, A.; Abels, S. Thinking Inclusive Science Education from Two Perspectives: Inclusive Pedagogy and Science Education. Res. Subj. Matter Teach. Learn. 2020, 3, 30–45. [Google Scholar]
- Brownell, M.T.; Smith, S.J.; Crockett, J.B.; Griffin, C.C. Inclusive Instruction EvidenceBased Practices for Teaching Students with Disabilities; The Guilford Press: New York, NY, USA, 2012. [Google Scholar]
- Sliwka, A. Diversität als Chance und als Ressource in der Gestaltung wirksamer Lernprozesse. In Das Interkulturelle Lehrerzimmer; VS Verlag für Sozialwissenschaften: Wiesbaden, Germany, 2012. [Google Scholar]
- UNESCO. Education 2030: Incheon Declaration and Framework for Action for the Implementation of Sustainable Development Goal 4: Ensure Inclusive and Equitable Quality Education and Promote Lifelong Learning Opportunities for All; UNESCO: Paris, France, 2016. [Google Scholar]
- CAST. Universal Design for Learning (UDL) Guidelines Version 2.2. 2018. Available online: https://udlguidelines.cast.org/ (accessed on 22 January 2021).
- Al-Azawei, A.; Serenelli, F.; Lundqvist, K. Universal Design for Learning (UDL): A Content Analysis of Peer Reviewed Journals from 2012 to 2015. J. Sch. Teach. Learn. 2016, 16, 39–56. [Google Scholar] [CrossRef] [Green Version]
- Capp, M.J. The effectiveness of universal design for learning: A meta-analysis of literature between 2013 and 2016. Int. J. Incl. Educ. 2017, 21, 791–807. [Google Scholar] [CrossRef]
- García-Campos, M.D.; Canabal, C.; Alba-Pastor, C. Executive functions in universal design for learning: Moving towards inclusive education. Int. J. Incl. Educ. 2018, 24, 660–674. [Google Scholar] [CrossRef]
- Rao, K.; Ok, M.W.; Bryant, B.R. A Review of Research on Universal Design Educational Models. Remedial Spéc. Educ. 2013, 35, 153–166. [Google Scholar] [CrossRef]
- Baumann, T.; Melle, I. Evaluation of a digital UDL-based learning environment in inclusive chemistry education. Chem. Teach. Int. 2019, 1, 1–13. [Google Scholar] [CrossRef] [Green Version]
- Basham, J.D.; Blackorby, J.; Marino, M.T. Opportunity in Crisis: The Role of Universal Design for Learning in Educational Redesign. Learn. Disabil. Contemp. J. 2020, 18, 71–91. [Google Scholar]
- Edyburn, D.L. Would You Recognize Universal Design for Learning if You Saw it? Ten Propositions for New Directions for the Second Decade of UDL. Learn. Disabil. Q. 2010, 33, 33–41. [Google Scholar] [CrossRef] [Green Version]
- Hollingshead, A.; Lowrey, K.A.; Howery, K. Universal Design for Learning: When Policy Changes Before Evidence. Educ. Policy 2020, 1–27. [Google Scholar] [CrossRef]
- Edyburn, D. Ten Years Later: Would You Recognize Universal Design for Learning If You Saw It? Interv. Sch. Clin. 2020, 1–2. [Google Scholar] [CrossRef]
- Murphy, M.P. Belief without evidence? A policy research note on Universal Design for Learning. Policy Futur. Educ. 2021, 19, 7–12. [Google Scholar] [CrossRef]
- Bybee, R.W. Scientific Inquiry and Science Teaching BT: Scientific Inquiry and Nature of Science: Implications for Teaching, Learning, and Teacher Education. In Scientific Inquiry and Nature of Science; Flick, L.B., Lederman, N.G., Eds.; Springer: Dordrecht, The Netherlands, 2006; pp. 1–14. [Google Scholar]
- Hodson, D. Learning Science, learning about Science, Doing Science: Different goals demand different learning methods. Int. J. Sci. Educ. 2014, 36, 2534–2553. [Google Scholar] [CrossRef]
- Hofer, B.K.; Pintrich, P.R. The Development of Epistemological Theories: Beliefs About Knowledge and Knowing and Their Relation to Learning. Rev. Educ. Res. 1997, 67, 88–140. [Google Scholar] [CrossRef]
- Neumann, I.; Kremer, K. Nature of Science Und Epistemologische Überzeugungen: Ähnlichkeiten Und Unterschiede. Ger. J. Sci. Educ. 2013, 19, 209–232. [Google Scholar]
- Sandoval, W.A.; Greene, J.A.; Bråten, I. Understanding and Promoting Thinking About Knowledge. Rev. Res. Educ. 2016, 40, 457–496. [Google Scholar] [CrossRef]
- Hofer, B.K. Personal epistemology as a psychological and educational construct: An introduction. In Personal Epistemology: The Psychology of Beliefs about Knowledge and Knowing; Routledge: New York, NY, USA, 2002; pp. 3–14. [Google Scholar]
- Chinn, C.A.; Buckland, L.A.; Samarapungavan, A. Expanding the Dimensions of Epistemic Cognition: Arguments from Philosophy and Psychology. Educ. Psychol. 2011, 46, 141–167. [Google Scholar] [CrossRef]
- Conley, A.M.; Pintrich, P.R.; Vekiri, I.; Harrison, D. Changes in epistemological beliefs in elementary science students. Contemp. Educ. Psychol. 2004, 29, 186–204. [Google Scholar] [CrossRef]
- Kampa, N.; Neumann, I.; Heitmann, P.; Kremer, K. Epistemological beliefs in science—a person-centered approach to investigate high school students’ profiles. Contemp. Educ. Psychol. 2016, 46, 81–93. [Google Scholar] [CrossRef] [Green Version]
- Mason, L. Psychological perspectives on measuring epistemic cognition. In Handbook of Epistemic Cognition; Routledge: Oxfordshire, UK, 2016. [Google Scholar]
- Elder, A.D. Characterizing fifth grade students’ epistemological beliefs in science. In Personal Epistemology: The Psychology of Beliefs about Knowledge and Knowing; Hofer, B.K., Pintrich, P.R., Eds.; Lawrence Erlbaum Associates Publishers: Mahwah, NJ, USA, 2002; pp. 347–363. [Google Scholar]
- Greene, J.A.; Cartiff, B.M.; Duke, R.F. A meta-analytic review of the relationship between epistemic cognition and academic achievement. J. Educ. Psychol. 2018, 110, 1084–1111. [Google Scholar] [CrossRef]
- Cartiff, B.M.; Duke, R.F.; Greene, J.A. The effect of epistemic cognition interventions on academic achievement: A meta-analysis. J. Educ. Psychol. 2020. [Google Scholar] [CrossRef]
- Bybee, R.W. Achieving Scientific Literacy: From Purposes to Practices; Heinemann: Portsmouth, NH, USA, 1997. [Google Scholar]
- Brass, J. Historicizing the Role of Education Research in Reconstructing English for the Twenty-first Century. Chang. Engl. 2009, 16, 275–286. [Google Scholar] [CrossRef]
- Schlüter, A.K.; Melle, I.; Wember, F. Unterrichtsgestaltung in Klassen Des Gemeinsamen Lernens: Universal Design for Learning. Sonderpädag. Förd. 2016, 3, 270–285. [Google Scholar] [CrossRef]
- Rao, K.; Meo, G. Using Universal Design for Learning to Design Standards-Based Lessons. SAGE Open 2016, 6, 1–12. [Google Scholar] [CrossRef]
- King-Sears, M. Universal Design for Learning: Technology and Pedagogy. Learn. Disabil. Q. 2009, 32, 199–201. [Google Scholar] [CrossRef]
- Gregg, N.; Nelson, J.M. Meta-analysis on the Effectiveness of Extra time as a Test Accommodation for Transitioning Adolescents with Learning Disabilities. J. Learn. Disabil. 2010, 45, 128–138. [Google Scholar] [CrossRef] [PubMed]
- Beddow, P. Beyond Universal Design: Accessibility Theory to Advance Testing for All Students. In Assessing Students in the Margin: Challenges, Strategies and Techniques; Information Age Publishing: Charlotte, NC, USA, 2011. [Google Scholar]
- Lovett, B.J.; Lewandowski, L.J. Testing Accommodations for Students with Disabilities; American Psychological Association: Washington, DC, USA, 2015. [Google Scholar]
- Thompson, S.; Thurlow, M.; Malouf, D.B. Creating Better Tests for Everyone through Universally Designed Assessments. J. Appl. Test. Technol. 2004, 6, 1–15. [Google Scholar]
- Thompson, S.J.; Johnstone, C.J.; Thurlow, M.L. Universal Design Applied to Large Scale Assessments; National Center on Educational Outcomes: Minneapolis, MN, USA, 2002. [Google Scholar]
- Walkowiak, M. Konzeption Und Evaluation von Universell Designten Lernumgebungen Und Assessments Zur Förderung Und Erfassung von Nature of Science Konzepten, Gottfried Wilhelm Leibniz Universität. 2019. Available online: https://www.repo.uni-hannover.de/handle/123456789/5192 (accessed on 22 January 2021).
- Salvia, J.; Ysseldyke, J.; Witmer, S. What Test Scores Mean. In Assessment in Special and Inclusive Education; Cengage Learning, Inc.: Boston, MA, USA, 2016. [Google Scholar]
- Clark, R.C.; Mayer, R.E. Introduction: Getting the Most from this Resource. In e-Learning and the Science of Instruction; John Wiley & Sons, Inc.: Hoboken, NJ, USA, 2012. [Google Scholar]
- Apple Inc. IBooks Author: Per Drag & Drop Ist Das Buch Schnell Erstellt. Available online: https://www.apple.com/de/ibooks-author/ (accessed on 15 November 2017).
- Nehring, A.; Walkowiak, M. Digitale Materialien Nach Dem Universial Design for Learning. Schule Inklusiv 2020, 8, 28–32. [Google Scholar]
- Inclusion Europe. Information for Everyone: European Rules on How to Make Information Easy to Read and Understand; Inclusion Europe: Brussels, Belgium, 2016. [Google Scholar]
- Mayring, P. Einführung in Die Qualitative Sozialforschung; Beltz Verlag: Weinheim, Germany, 2016. [Google Scholar]
- Carey, S.; Evans, R.; Honda, M.; Jay, E.; Unger, C. An experiment is when you try it and see if it works: A study of grade 7 students’ understanding of the construction of scientific knowledge. Int. J. Sci. Educ. 1989, 11, 514–529. [Google Scholar] [CrossRef]
- Labudde, P. Fachdidkatik Naturwissenschaft. 1–9. Schuljahr; UTB: Stuttgart, Germany, 2010. [Google Scholar]
- Mayring, H.; Wimmer, H. Salzburger Lese-Screening Für Die Schulstufen 2–9; Hogrefe: Gottingen, Germany, 2014. [Google Scholar]
- Heller, K.; Perleth, C. Kognitiver Fähigkeitstest Für 4. Bis 12. Klassen, Revision; Beltz & Gelberg: Weinheim, Germany, 2000. [Google Scholar]
- Torsheim, T.; the FAS Development Study Group; Cavallo, F.; Levin, K.A.; Schnohr, C.; Mazur, J.; Niclasen, B.; Currie, C.E. Psychometric Validation of the Revised Family Affluence Scale: A Latent Variable Approach. Child Indic. Res. 2016, 9, 771–784. [Google Scholar] [CrossRef] [Green Version]
- Fauth, B.; Decristan, J.; Rieser, S.; Klieme, E.; Büttner, G. Student ratings of teaching quality in primary school: Dimensions and prediction of student outcomes. Learn. Instr. 2014, 29, 1–9. [Google Scholar] [CrossRef]
- Sprague, E.W.; Dahl, D.W. Learning to Click. J. Mark. Educ. 2009, 32, 93–103. [Google Scholar] [CrossRef] [Green Version]
- Werning, R.; Thoms, S. Anmerkungen Zur Entwicklung Der Schulischen Inklusion in Niedersachsen. Z. Inkl. 2017, 2, 1–4. [Google Scholar]
- Lucke, J.F. The α and the ω of Congeneric Test Theory: An Extension of Reliability and Internal Consistency to Heterogeneous Tests. Appl. Psychol. Meas. 2005, 29, 65–81. [Google Scholar] [CrossRef]
- Naumann, A.; Hartig, J.; Hochweber, J. Absolute and Relative Measures of Instructional Sensitivity. J. Educ. Behav. Stat. 2017, 42, 678–705. [Google Scholar] [CrossRef]
- Sideridis, G.D.; Tsaousis, I.; Al-Harbi, K.A. Multi-Population Invariance with Dichotomous Measures. J. Psychoeduc. Assess. 2015, 33, 568–584. [Google Scholar] [CrossRef]
- Kuusela, H.; Paul, P. A Comparison of Concurrent and Retrospective Verbal Protocol Analysis. Am. J. Psychol. 2000, 113, 387–404. [Google Scholar] [CrossRef]
- Ryan, K.E.; Gannon-Slater, N.; Culbertson, M.J. Improving Survey Methods with Cognitive Interviews in Small and Medium-Scale Evaluations. Am. J. Eval. 2012, 33, 414–430. [Google Scholar] [CrossRef] [Green Version]
- Anderson, D.; Lai, C.F.; Alonzo, J.; Tindal, G. Examining a Grade-Level Math CBM Designed for Persistently Low-Performing Students. Educ. Assess. 2011, 16, 15–34. [Google Scholar] [CrossRef]
- Bridgeman, B.; Trapani, C.; Curley, E. Impact of Fewer Questions per Section on SAT I Scores. J. Educ. Meas. 2004, 41, 291–310. [Google Scholar] [CrossRef]
- Wise, S.L.; Kingsbury, G.G. Modeling Student Test-Taking Motivation in the Context of an Adaptive Achievement Test. J. Educ. Meas. 2016, 53, 86–105. [Google Scholar] [CrossRef]
- Lamprianou, I.; Boyle, B. Accuracy of Measurement in the Context of Mathematics National Curriculum Tests in England for Ethnic Minority Pupils and Pupils Who Speak English as an Additional Language. J. Educ. Meas. 2004, 41, 239–259. [Google Scholar] [CrossRef]
- Zydney, J.; Hord, C.; Koenig, K. Helping Students with Learning Disabilities Through Video-Based, Universally Designed Assessment. eLearn 2020, 2020. [Google Scholar] [CrossRef]
- Johnstone, C.; Higgins, J.; Fedorchak, G. Assessment in an era of accessibility: Evaluating rules for scripting audio representation of test items. Br. J. Educ. Technol. 2018, 50, 806–818. [Google Scholar] [CrossRef]
- Muldner, K.; Burleson, W.; Van De Sande, B.; VanLehn, K. An analysis of students’ gaming behaviors in an intelligent tutoring system: Predictors and impacts. User Model. User Adapt. Interact. 2011, 21, 99–135. [Google Scholar] [CrossRef]
- Quigley, D.; Ostwald, J.L.; Sumner, T. Scientific modeling. In Proceedings of the 7th International Learning Analytics & Knowledge Conference, Vancouver, BA, Canada, 13–17 March 2017; Association for Computing Machinery: New York, NY, USA; pp. 329–338. [Google Scholar]
Figure 1.
Extract of the learning environment where two female researchers present the research question.
Figure 1.
Extract of the learning environment where two female researchers present the research question.

Figure 2.
Illustration of the Universal Design for Assessment (UDA) assessment with the implemented read-aloud function in the original language (German) [39].
Figure 2.
Illustration of the Universal Design for Assessment (UDA) assessment with the implemented read-aloud function in the original language (German) [39].

Figure 3.
Differential item functioning (DIF) analysis of the justification scale from the UDA assessment concerning (1) gender, (2) reading literacy, (3) socioeconomic status, and (4) intelligence [39].
Figure 3.
Differential item functioning (DIF) analysis of the justification scale from the UDA assessment concerning (1) gender, (2) reading literacy, (3) socioeconomic status, and (4) intelligence [39].

Figure 4.
DIF analysis of the justification scale from the original assessment concerning (1) gender, (2) reading literacy, (3) socioeconomic status, and (4) intelligence [39].
Figure 4.
DIF analysis of the justification scale from the original assessment concerning (1) gender, (2) reading literacy, (3) socioeconomic status, and (4) intelligence [39].

Figure 5.
Simplified multi-group panel model of interindividual changes in the justification scale taking into account learner characteristics. Only significant paths are shown [39].
Figure 5.
Simplified multi-group panel model of interindividual changes in the justification scale taking into account learner characteristics. Only significant paths are shown [39].

Figure 6.
Longitudinal plots to trajectories of all students to the justification scale from both assessments (UDA assessment n = 175; original assessment n = 165). The average is shown in black [39].
Figure 6.
Longitudinal plots to trajectories of all students to the justification scale from both assessments (UDA assessment n = 175; original assessment n = 165). The average is shown in black [39].

Table 1.
The four dimensions of epistemic beliefs (EBs) in dependence on their expression [24].
Table 1.
The four dimensions of epistemic beliefs (EBs) in dependence on their expression [24].
| Dimensions of EBs | Naïve | Sophisticated |
|---|---|---|
| Nature of knowledge | ||
| Certainty | Scientific knowledge is either right or wrong | Scientific knowledge consists of the reflection of several perspectives |
| Development | Scientific knowledge is a static and unchangeable subject | Scientific ideas and theories change in the light of new evidence |
| Nature of knowing | ||
| Source | Knowledge resides in external authorities such as teachers or scientists | Knowledge is created by the student |
| Justification | Phenomena are discovered through scientific investigation, such as experiment or observation | Knowledge is created through arguments, thinking, multiple experimentation, and observation |
Table 2.
Universal Design for Learning (UDL) principles and guidelines [5].
Table 2.
Universal Design for Learning (UDL) principles and guidelines [5].
| Provide Multiple Means of Engagement | Provide Multiple Means of Representation | Provide Multiple Means of Action & Expression |
|---|---|---|
| 1. Support possibilities for the perception of the learning content | 4. Various ways to interact with the learning content | 7. Various offers to arouse the interest in learning |
| 2. Support possibilities for the representations of linguistic and symbolic information of the learning content | 5. Various ways to express and communicate about the learning content | 8. Support options to maintain engaged learning |
| 3. Support options for a better understanding of the learning content | 6. Support options for processing the learning content | 9. Support options for self-regulated learning |
Table 3.
Elements of a universally designed test [37].
Table 3.
Elements of a universally designed test [37].
| Element | Description |
|---|---|
| 1. Inclusive Assessment Population | Tests designed for state, district, or school accountability must include every student except those in the alternate assessment, and this is reflected in assessment design and field-testing procedures. |
| 2. Precisely Defined Constructs | The specific constructs tested must be clearly defined so that all construct irrelevant cognitive, sensory, emotional, and physical barriers can be removed. |
| 3. Accessible, Non-Biased Items | Accessibility is built into items at the beginning, and bias review procedures ensure that quality is retained in all items. |
| 4. Amenable to Accommodations | The test design facilitates the use of needed accommodations (e.g., all items can be Brailled). |
| 5. Simple, Clear, and Intuitive Instructions and Procedures | All instructions and procedures are simple, clear, and presented in understandable language. |
| 6. Maximum Readability and Comprehensibility | A variety of readability and plain language guidelines are followed (e.g., sentence length and number of difficult words are kept to a minimum) to produce readable and comprehensible text. |
| 7. Maximum Legibility | Characteristics that ensure easy decipherability are applied to text, tables, figures, and illustrations, and to response formats. |
Table 4.
Operationalization of the UDL learning environment.
| Operationalization | UDL-Guideline |
|---|---|
| MS Sans Serif 18 | 1. |
| Line spacing 2.0 | 1. |
| Easy language | 1./2. |
| Pictorial support to distinguish text types (learning objectives, tasks, learning information) | 2. |
| Selection of the content representation form (pop-up text, comic, video) | 3./7. |
| Read aloud function | 3. |
| Page organization | 8./9. |
| Working with a checklist | 6. |
| Self-assessment on the learning content | 5./9. |
| Working on real objects | 4. |
| iPad-based | 4. |
| Group work/peer tutoring | 5. |
Table 5.
The 2×2-Between-Subject-Design.
| Assessment | Learning Environment | |
|---|---|---|
| UDL learning environment | MR learning environment | |
| UDA assessment | Group 1 | Group 2 |
| Standard assessment | Group 3 | Group 4 |
Table 6.
The wording of the justification scale items in the UDA assessment.
| Items | Wording |
|---|---|
| Item 1 | Scientists carry out experiments several times in order to secure the result. |
| Item 2 | When natural scientists conduct experiments, natural scientists determine important things beforehand. |
| Item 3 | Scientists need clear ideas before researchers start experimenting. |
| Item 4 | Scientists get ideas for science experiments by being curious and thinking about how something works. |
| Item 5 | An experiment is a good way to find out if something is true. |
| Item 6 | Good theories are based on results from many different experiments. |
| Item 7 | Natural scientists can test their ideas in various ways. |
Table 7.
Collected learner characteristics.
| Test Type | Construct |
|---|---|
| Paper-pencil test | Reading: Salzburger-Lesescreening 2–9 [48] |
| Cognitive skills: KFT 4-12+R-N2 [49] | |
| iPad | Socioeconomic status [50] |
| Cognitive activation [51] | |
| Perception of learning success [52] | |
| Gender | |
| Age | |
| Diagnosed special needs |
Table 8.
Reformulated justification short scale with the standard factor loadings, mean differences, and associated Bonferroni-corrected significances.
Table 8.
Reformulated justification short scale with the standard factor loadings, mean differences, and associated Bonferroni-corrected significances.
| Original Assessment | UDA Assessment | |||||||
|---|---|---|---|---|---|---|---|---|
| Standardized Factor Loadings | Mean Values | Standardized Factor Loadings | Mean Values | |||||
| MP 1 | MP 2 | MP 2-MP 1 | p | MP 1 | MP 2 | MP 2-MP 1 | p | |
| Item 2 | 0.25 | 0.38 | −0.24 | 0.01 | 0.72 | 0.70 | 0.12 | 0.26 |
| Item 3 | 0.21 | 0.46 | 0.00 | 1.00 | 0.52 | 0.60 | 0.17 | 0.08 |
| Item 4 | 0.44 | 0.71 | 0.18 | 0.06 | 0.63 | 0.69 | 0.44 | 0.00 |
| Item 6 | 0.50 | 0.73 | 0.01 | 0.88 | 0.66 | 0.68 | −0.09 | 0.36 |
Explanatory note: MP: measurement point.
Table 9.
Internal consistencies of the short scales: McDonalds-w.
| EBs-Scale | MP 1 | MP 2 | MP 1 and MP 2 |
|---|---|---|---|
| UDA Assessment | |||
| Source | 0.86 | 0.89 | 0.9 |
| Certainty | 0.8 | 0.81 | 0.85 |
| Development | 0.78 | 0.85 | 0.87 |
| Justification | 0.74 | 0.78 | 0.8 |
| Original Assessment | |||
| Source | 0.83 | 0.9 | 0.89 |
| Certainty | 0.74 | 0.75 | 0.81 |
| Development | 0.75 | 0.79 | 0.82 |
| Justification | 0.41 | 0.66 | 0.62 |
Explanatory note: MP: measurement point.
Table 10.
Measurement invariance models for EB short scale justification.
| Fit Values | ||||||||
|---|---|---|---|---|---|---|---|---|
| Stage | Chi-Square | dF | p | RMSEA | CFI | TLI | SRMR | Accepted? |
| Configural | 41.31 | 30 | 0.082 | 0.053 | 0.984 | 0.971 | 0.034 | Yes |
| Metric | 43.47 | 39 | 0.287 | 0.03 | 0.991 | 0.987 | 0.054 | Yes |
| Scalar | 69.95 | 48 | <0.05 | 0.058 | 0.969 | 0.964 | 0.057 | Yes |
| Strict | 70.96 | 59 | 0.137 | 0.039 | 0.976 | 0.977 | 0.073 | Yes |
Explanatory note: dF: degrees of freedom; CFI: Comparative-Fit-Index; RMSEA: Root-Mean-Square-Error of Approximation; TLI: Trucker-Lewis-Index; SRMR. Standardized Root Mean Square Residual.
Publisher’s Note: MDPI stays neutral with regard to jurisdictional claims in published maps and institutional affiliations. |
© 2021 by the authors. Licensee MDPI, Basel, Switzerland. This article is an open access article distributed under the terms and conditions of the Creative Commons Attribution (CC BY) license (https://creativecommons.org/licenses/by/4.0/).
Share and Cite
MDPI and ACS Style
Roski, M.; Walkowiak, M.; Nehring, A. Universal Design for Learning: The More, the Better? Educ. Sci. 2021, 11, 164. https://0-doi-org.brum.beds.ac.uk/10.3390/educsci11040164
AMA Style
Roski M, Walkowiak M, Nehring A. Universal Design for Learning: The More, the Better? Education Sciences. 2021; 11(4):164. https://0-doi-org.brum.beds.ac.uk/10.3390/educsci11040164
Chicago/Turabian StyleRoski, Marvin, Malte Walkowiak, and Andreas Nehring. 2021. "Universal Design for Learning: The More, the Better?" Education Sciences 11, no. 4: 164. https://0-doi-org.brum.beds.ac.uk/10.3390/educsci11040164
Note that from the first issue of 2016, this journal uses article numbers instead of page numbers. See further details here.