
The Demographic Transformation of the Teaching Force in the United States †
by
Richard Ingersoll
1,*, 
Elizabeth Merrill
2,
Daniel Stuckey
3,
Gregory Collins
4 and
Brandon Harrison
1 1
Graduate School of Education, University of Pennsylvania, Philadelphia, PA 19104, USA
2
Research Alliance, New York City Schools, New York University, New York, NY 10012, USA
3
Relay Graduate School of Education, New York, NY 10004, USA
4
Department of Accounting, Business, Economics, and Finance, Muhlenberg College, Allentown, PA 18104, USA
*
Author to whom correspondence should be addressed.
†
This article draws from, expands, and updates, earlier reports of this ongoing study (Ingersoll and Merrill 2017; Ingersoll, Merrill & Stuckey, 2018; Ingersoll, Merrill, Stuckey, & Collins, (2018)).
Educ. Sci. 2021, 11(5), 234; https://0-doi-org.brum.beds.ac.uk/10.3390/educsci11050234
Submission received: 15 February 2021
/
Revised: 30 April 2021
/
Accepted: 3 May 2021
/
Published: 14 May 2021
(This article belongs to the Special Issue Teachers Matter—Improving Recruitment, Retention and Development of Teachers)
Abstract
:This article summarizes the results of an exploratory research project that investigated what demographic trends and changes have, or have not, occurred in the elementary and secondary teaching force in the U.S. over the past three decades, from 1987 to 2018. Our main data source was the Schools and Staffing Survey and its successor, the National Teacher Principal Survey, collectively the largest and most comprehensive source of data on teachers available in the U.S. These surveys are conducted by the National Center for Education Statistics (NCES), the statistical arm of the U.S. Department of Education. The results show that the teaching force has been, and is, greatly changing; yet, even the most dramatic trends appear to have been little noticed or understood by researchers, policy makers, and the public. This article summarizes seven of the most prominent trends and changes that we found. The U.S. teaching force is: larger; older; less experienced; more female; more diverse, by race/ethnicity; consistent in academic ability; unstable. For each of the trends, we explore two broad questions: 1. What are the reasons for and sources of the trend? 2. What are the implications and consequences of the trend?
1. Introduction
Has the elementary and secondary teaching force in the United States changed in recent decades? And, if so, how? Have the types and kinds of individuals going into teaching changed? Have the demographic characteristics of those working in classrooms altered? To answer these questions, we embarked on an exploratory research project to try to discover what trends and changes have, or have not, occurred in the teaching force over recent decades. We were surprised by what we found. We discovered that the teaching force has been, and is, greatly changing; yet, even the most dramatic trends appear to have been little noticed by researchers, policy makers, and the public. To explore these questions, we undertook analyses of nationally representative data on teachers in the U.S. collected over the three-decade period from 1987 to 2018. In this article, we summarize seven of the most prominent trends and changes; we found the U.S. teaching force to be:
- Larger;
- Older;
- Less experienced;
- More female;
- More diverse, by race/ethnicity;
- Consistent in academic ability;
- Unstable.
For each of the trends, two significant questions arise:
- What are the reasons for and sources of the trend?
- What are the implications and consequences of the trend?
We will offer some possible answers to these questions. But our objective is not to provide an in-depth investigation of any of the seven trends. We do not seek to provide a full account of the sources behind these trends, nor do we seek to assess the many possible benefits and costs, advantages, and disadvantages of each trend. That is, our intent here is not to arrive at closure on the above two questions; that would require far more extensive analyses.
Our intent is to provide a broad and system-level “bird’s eye” portrait of some key recent developments in the U.S. teaching force. Rather than explanatory and evaluative, our work here is largely exploratory and suggestive. In short, we ask more questions than we are able to answer. We believe that further research is both necessary and warranted to rectify that.
Moreover, we do not attempt to provide an exhaustive review of the research and policy literatures that pertain to each of the trends we highlight. Given our wide purview to describe seven very different trends, and to raise questions about both the sources and consequences of each trend, our findings touch upon a very wide range of different theories, empirical studies, policies and reforms regarding teachers and education. While we attempt to make a number of key connections, addressing the full range of relevant literatures and reforms is beyond the scope of this article.
Finally, our purpose is neither normative nor prescriptive; while we personally feel strongly about some of these trends and if and how they might be addressed, our purpose here is descriptive and analytic. That is, our objective is to describe and analyze seven major demographic trends that have happened to the U.S. teaching force in recent decades.
This article builds on, updates and expands earlier reports on our ongoing study of demographic changes in the teaching force. The first report of our study, released in 2012, presented data up to 2007–2008—the most current data then available. Since then, we have released several updated reports of our study as newer cycles of the data became available [1,2,3]. This new 2021 article updates our prior work by presenting the results of our analyses of newly released national data, and also expands on our prior work by introducing new types of data relevant to several of the trends. A key finding of this article is that the most recent data document that the trends we originally uncovered continue to hold true—even after 3 decades.
2. Materials and Methods
Our study entailed secondary analysis of large-scale nationally representative data on teachers in the United States. Our primary source of data is the Schools and Staffing Survey (SASS), which is the largest and most comprehensive source of data on teachers available in the U.S. These data are collected by the National Center for Education Statistics (NCES), the statistical arm of the U.S. Department of Education. The NCES has administered nine cycles of this survey over a 30 year period—1987–1988, 1990–1991, 1993–1994, 1999–2000, 2003–2004, 2007–2008, 2011–2012, 2015–2016 and 2017–2018. The most recent two cycles, administered in the periods 2015–2016 and 2017–2018, were renamed the National Teacher Principal Survey (NTPS).
In each cycle, NCES administers questionnaires to a nationally representative sample of 40,000 to 50,000 teachers, and 9000 to 11,000 school-level administrators, collecting an unusually rich array of information on teachers, their students, and their schools. The data represent all teachers for grades prekindergarten through 12, part time and full time, and from all types of schools, including public, charter, and private. This analysis uses data from all cycles of the SASS/NTPS available, over the three-decade period from 1987 to 2018, but, in particular, focuses on the most recent data cycle—the 2017–2018 NTPS. For information on the SASS/NTPS, see references [4,5]. With the addition of the 2017–2018 NTPS data, we have been able to update almost all of our findings for this new 2021 edition of our study.
In addition, all those teachers in the SASS sample who departed from their schools in the year subsequent to the administration of the initial SASS survey questionnaire were contacted to obtain information on their departures. This nationally representative supplemental sample—the Teacher Follow-Up Survey (TFS)—contains approximately 7000 teachers. The TFS captures all teacher departures from schools, including both major components of total turnover—migration (teachers who move between local school districts and schools) and attrition (those who leave teaching altogether). We analyze TFS data items on the rates, variations and reasons for, teacher turnover. The analysis uses data from all seven cycles of the TFS available, but in particular from the most recent TFS, administered in the period 2012–2013, which only included public school teachers (for more information on the 2012–2013 TFS, see references [6].
We took advantage of both the depth and duration of the SASS/NTPS/TFS data to explore what changes have taken place in the teaching force and teaching occupation over the three decades from 1987 to 2018. We primarily used basic statistical analytic techniques to generate descriptive data estimates. This analysis uses data weighted to compensate for the over- and under-sampling of the complex stratified survey design. Each observation is weighted by the inverse of its probability of selection in order to obtain unbiased estimates of the national population of schools and teachers in the U.S. in the year of the survey.
3. Results
3.1. Trend 1: Larger
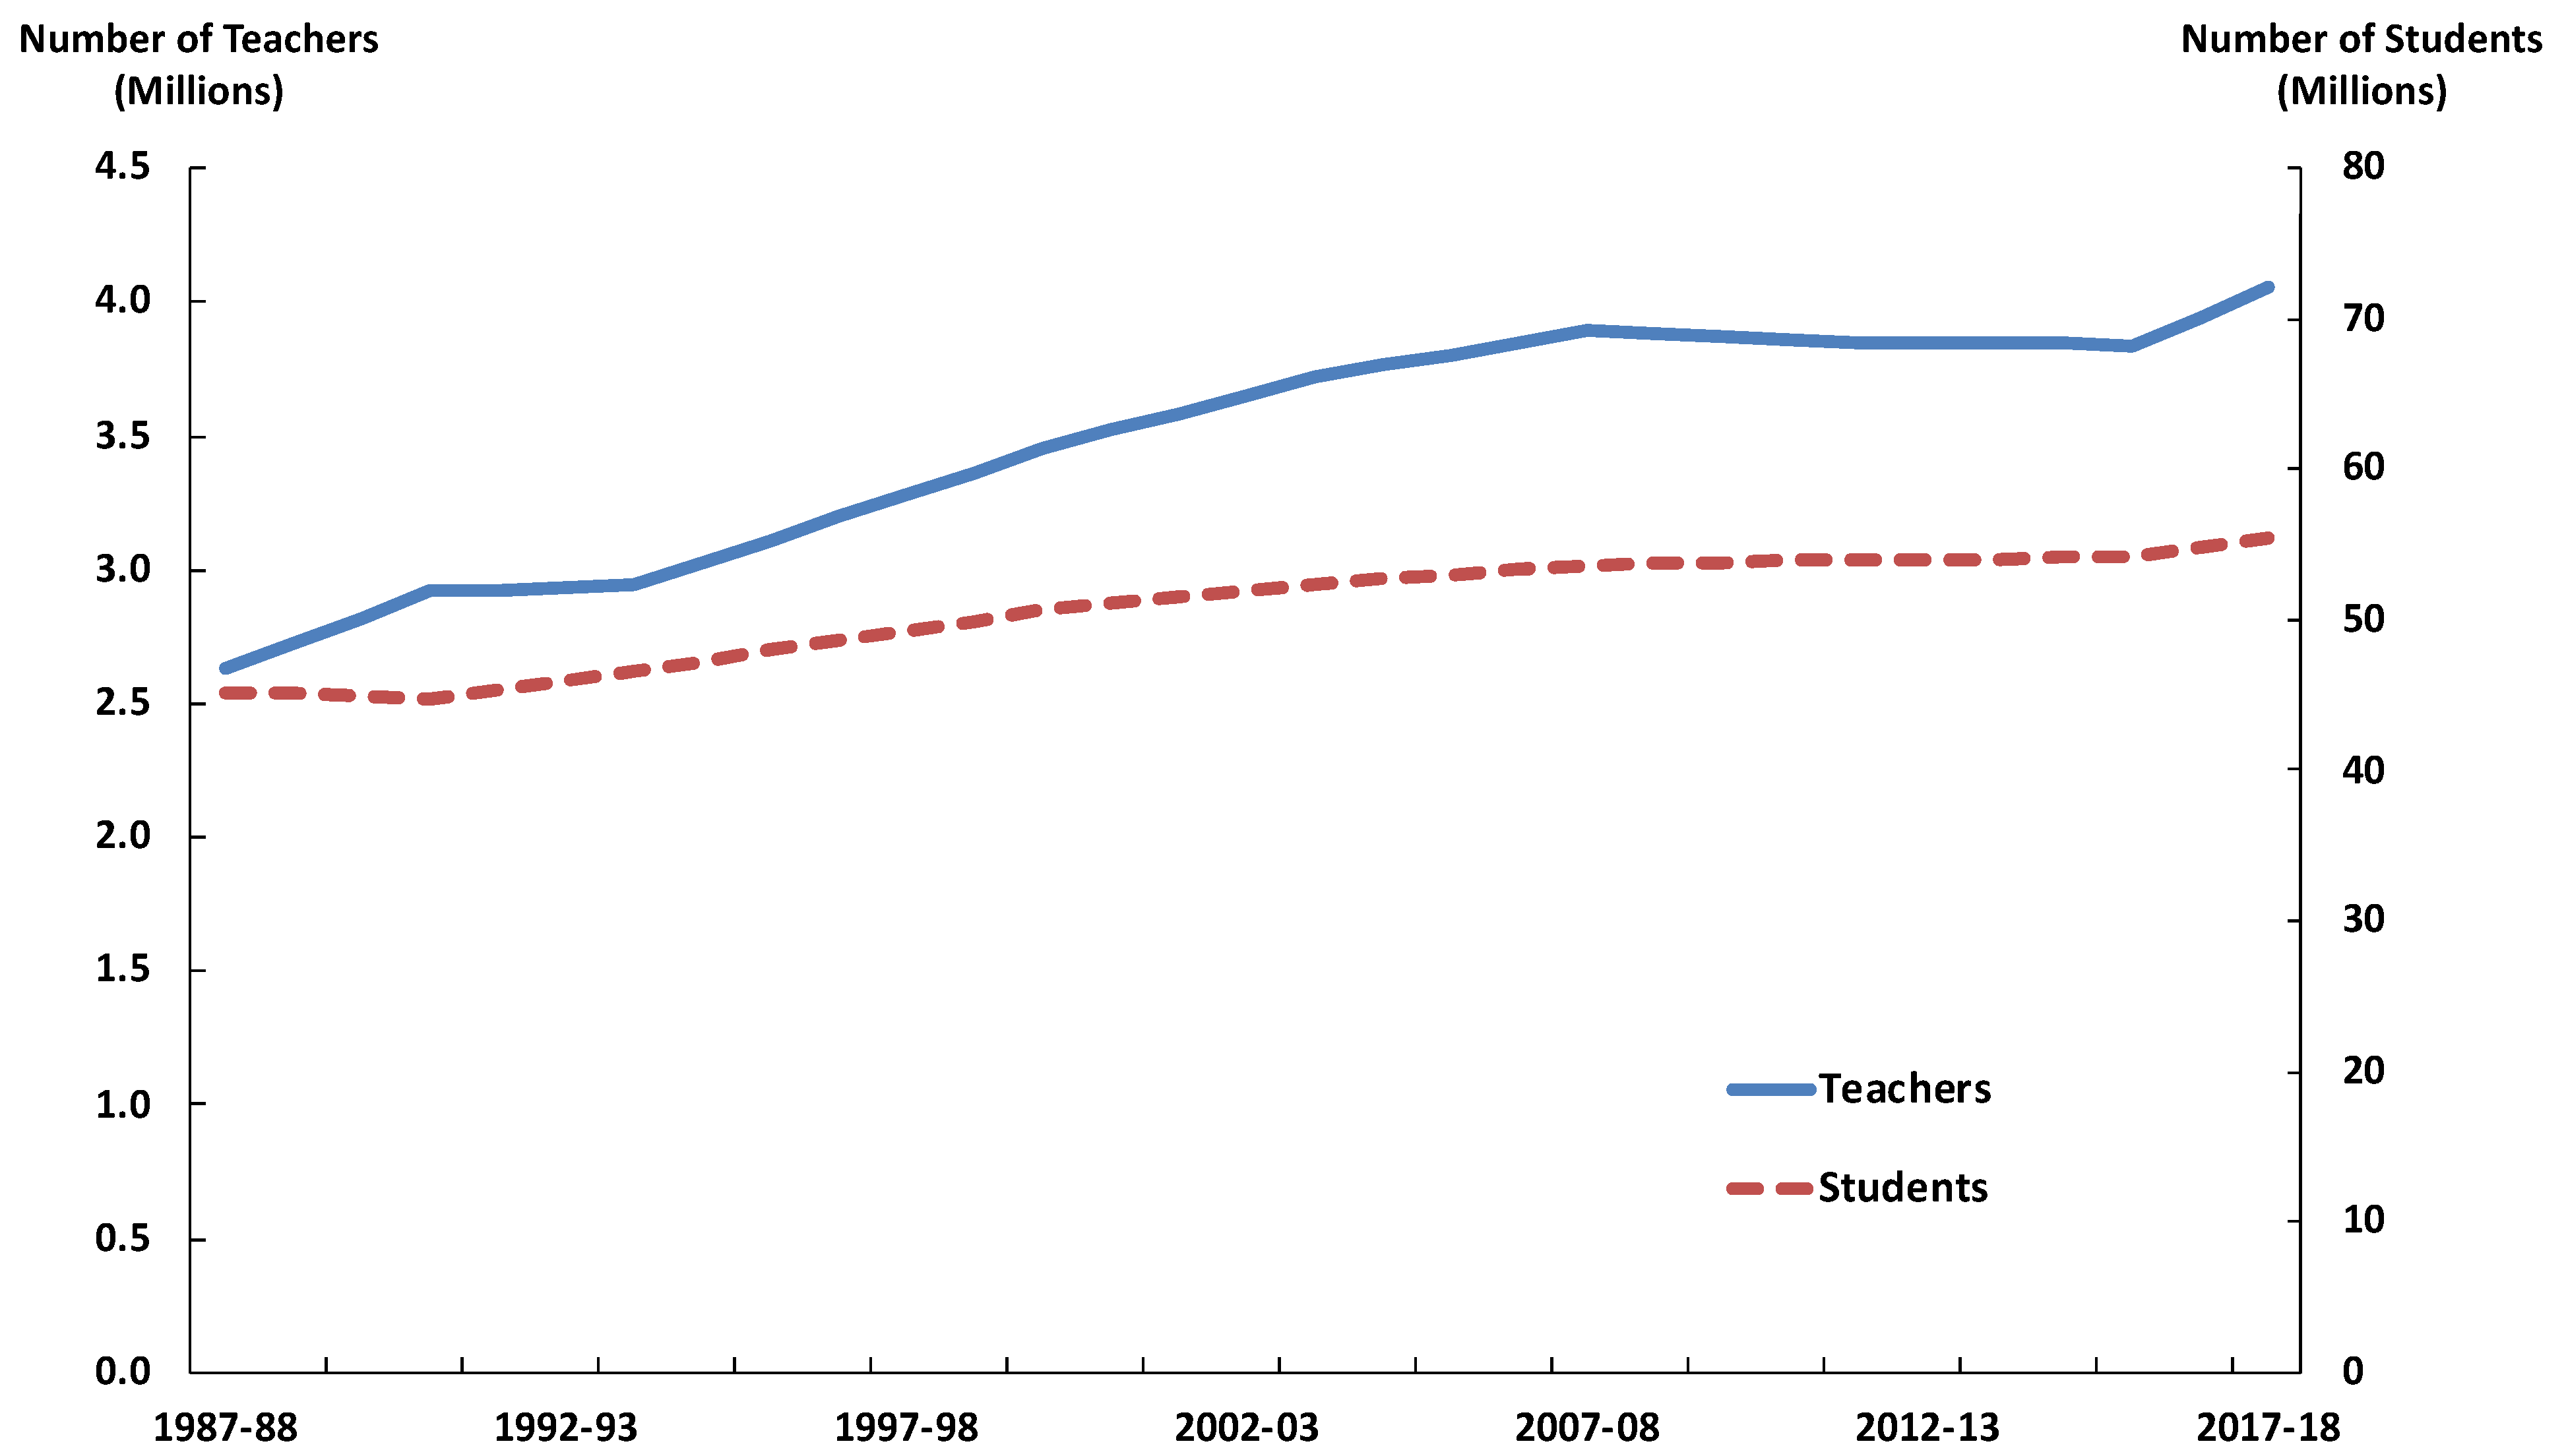
The elementary and secondary teaching force in the U.S. has increased in size—a trend we refer to as “ballooning.” The U.S. Census Bureau indicates that PreK-12 teachers form one of the largest occupational groups in the nation [7], and the teaching force is growing even larger. Growth in the numbers of students and teachers is not new. The numbers of both students and teachers grew throughout the 20th century, and the rate of growth for both groups began to soar in the late 1940s with the post–World War II baby boom. Student enrollment peaked by 1970 and then declined until the mid-1980s. During this period, the numbers of teachers also peaked, and then leveled off. In the mid-1980s, elementary and secondary student enrollment again began to grow. Since then, the teaching force has also been increasing in size (see Figure 1).
The rate of these increases has not matched the magnitude of the baby boom years—with one large difference. In recent decades, the rate of increase for teachers has far outpaced the rate of increase for students—that is, the number of teachers has been going up far faster than the number of students.
As illustrated in Figure 1, from the late 1980s to 2008, the teaching force increased at a more rapid pace than the student population. Then during the economic downturn after 2008, growth in the teaching force leveled off. Between 2007–2008 and 2015–2016, while the student population slightly increased (by 1 percent), the teaching force slightly decreased (by approximately 1.6 percent). It is unclear how much of this decrease in teachers was due to layoffs or to hiring freezes combined with teacher attrition. After 2016, growth picked up again.
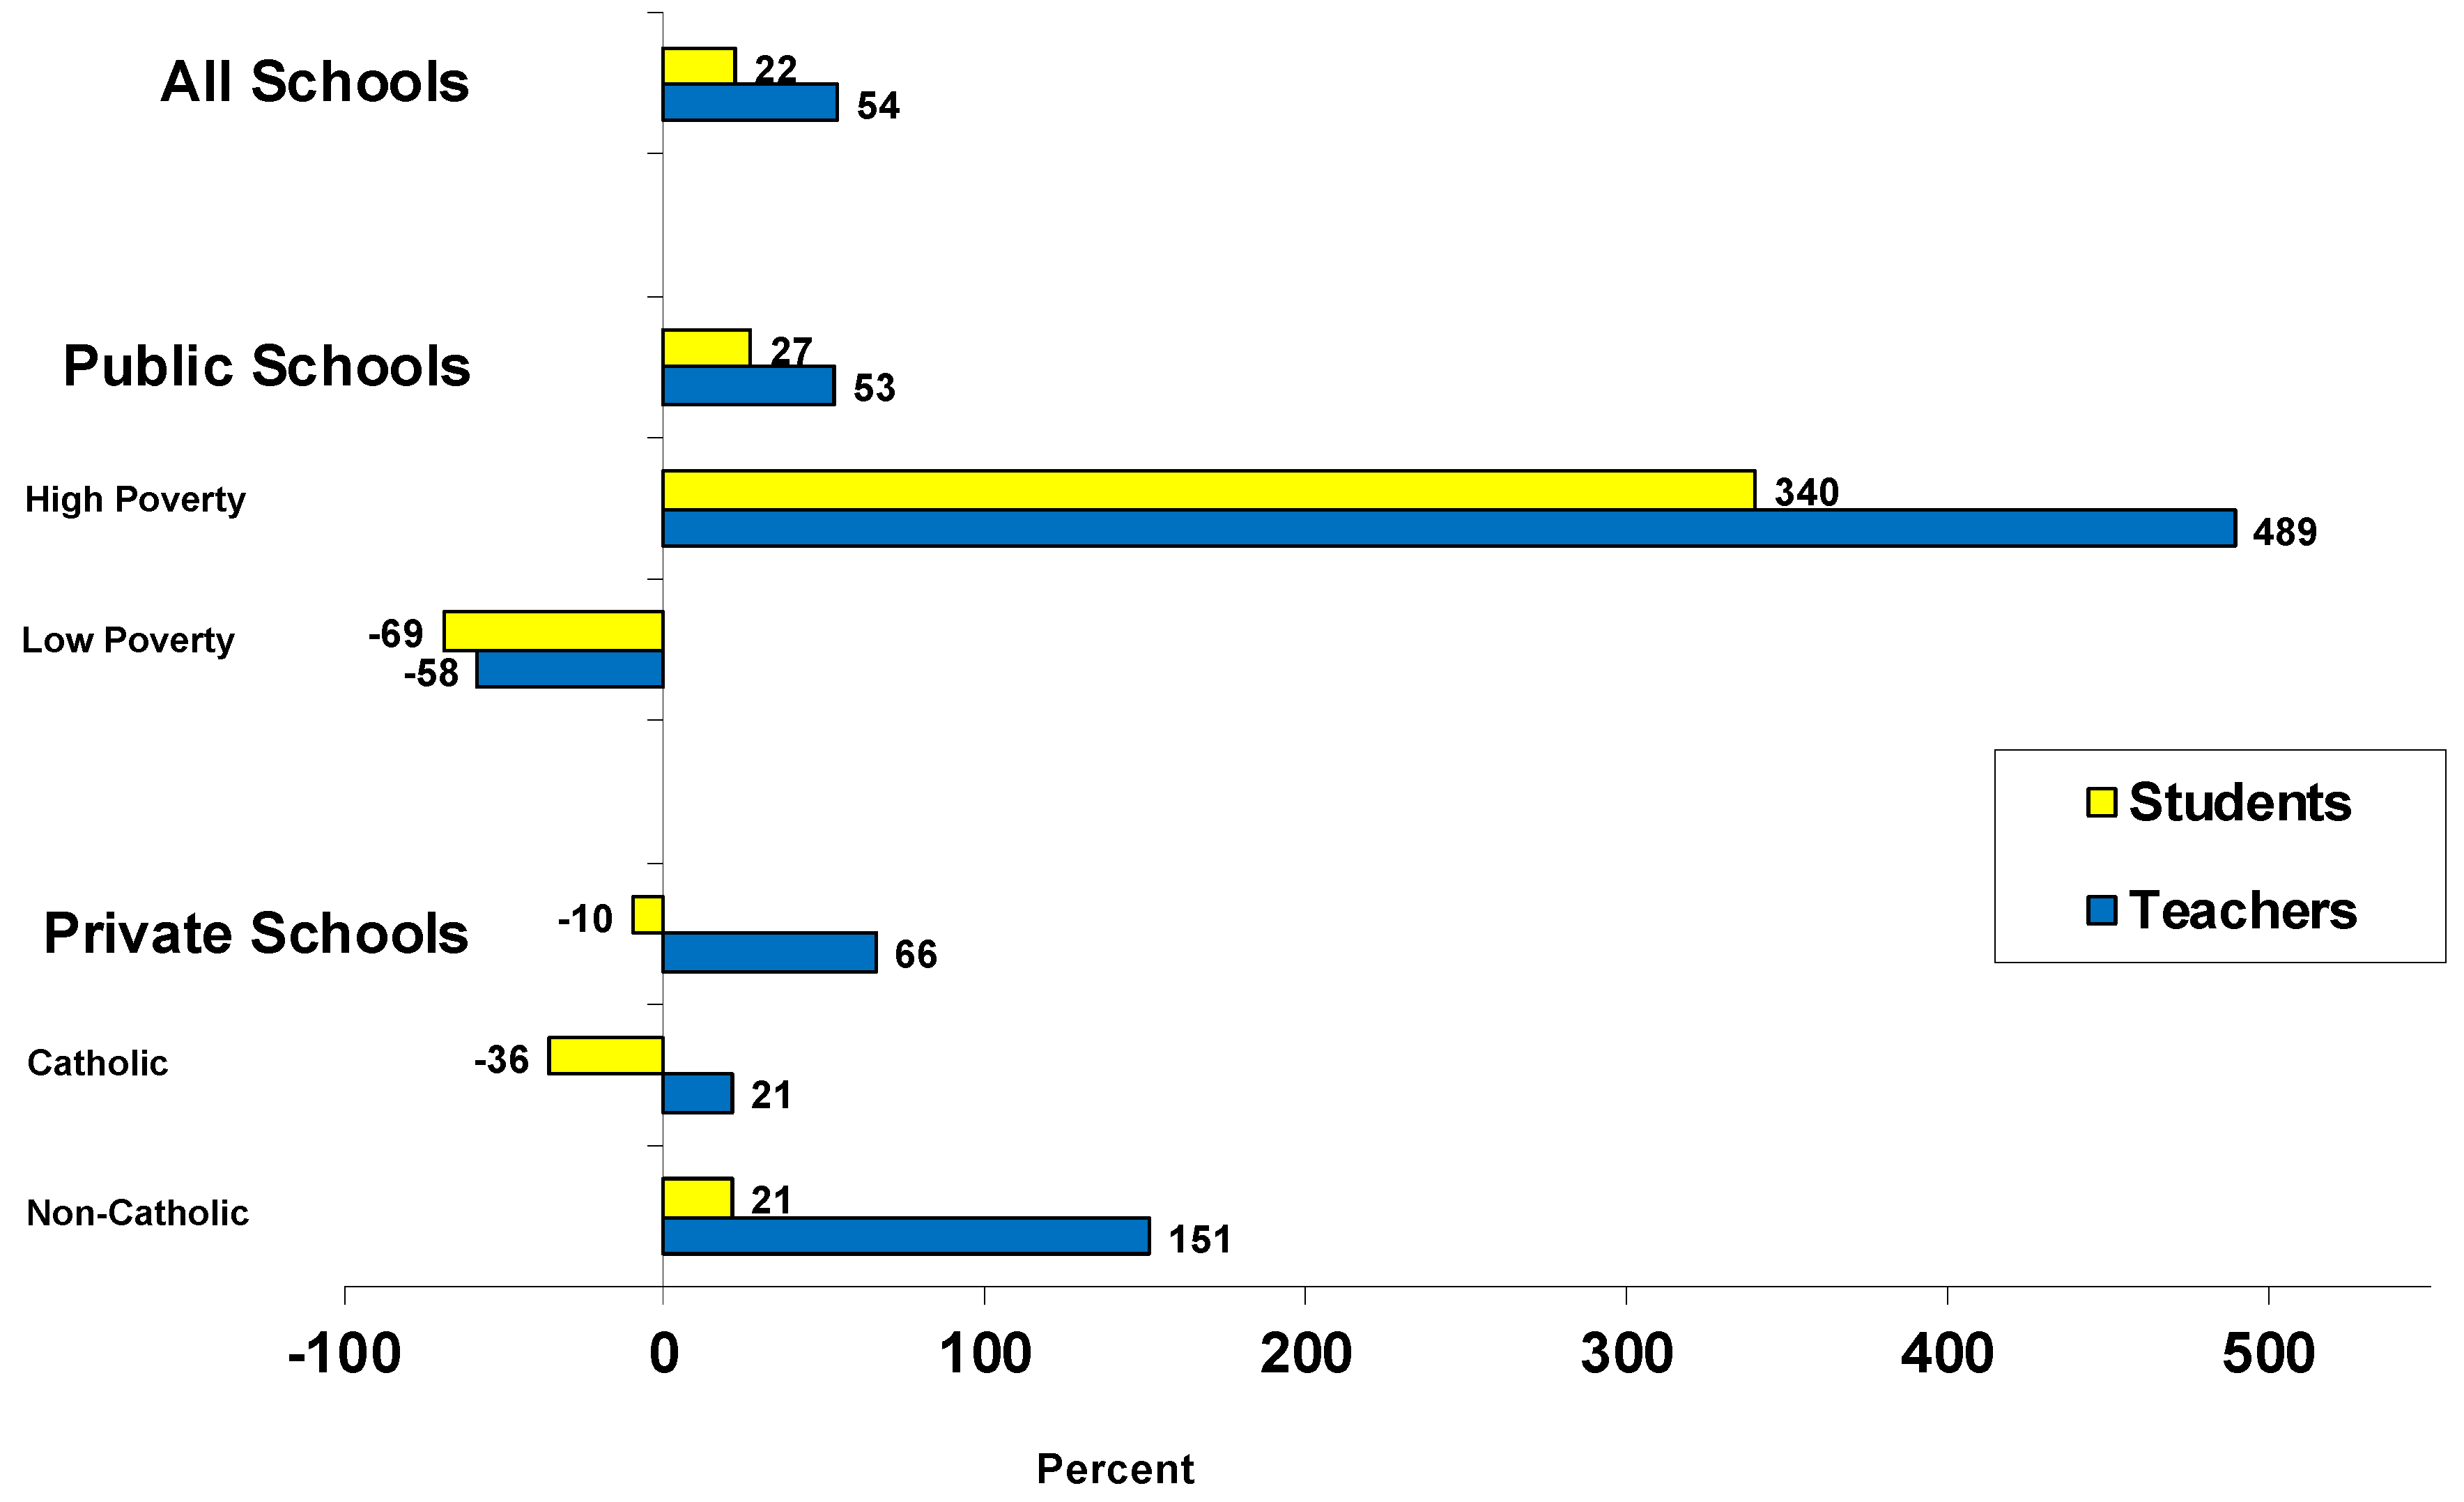
As the top of Figure 2 summarizes, from 1987–1988 to 2017–2018 total K-12 student enrollment in all U.S. schools went up by 22 percent. During the same period, the teaching force employed in schools increased at over double that rate, by 54 percent. This resulted in a sharp decrease in the overall pupil–teacher ratio in schools.
What accounts for this ballooning of the teaching force between the late 1980s and 2018?
As shown in Figure 2, the growth in the number of both students and teachers has not been evenly distributed across schools. In the U.S., approximately one-fifth of elementary and secondary schools are privately owned and operated institutions. Approximately one-third of private schools are non-sectarian and the remainder are operated by religious groups. Among the latter, Catholic schools comprise the largest group. Interestingly, the number of teachers employed in private schools as a whole has increased at a faster rate than in public schools relative to the student population (bottom of Figure 2). But, surprisingly, while the total number of teachers in private schools has increased, the number of students in private schools has decreased. This also varies by type of private school. The three decades from 1987 to 2018 saw a 21 percent increase in the number of teachers employed in Catholic schools, while there was a 27 percent decrease in the number of Catholic schools and a 36 percent decrease in the total number of students enrolled in them. On the other hand, there were increases in the total number of schools, students, and teachers in the non-Catholic religious private school sector and in the non-sectarian private school sector. The overall result has been a sharp decrease in the average pupil–teacher ratio and average class sizes in private schools as a whole, which were already lower than in public schools. However, this increase in private sector teachers and reduction in the student-to-teacher load in private schools does not account for much of the overall ballooning because private schools account only for a small portion of the student population (approximately 8 percent) and of the teaching force (approximately 13 percent).
Growth in the number of teachers was also not even among public schools. The number of students from poverty-level families, and hence who qualify for the National School Lunch Program (NSLP) has dramatically increased over the past three decades (middle of Figure 2). (The National School Lunch Program is a federal program that offers free and reduced-price school lunches to school-age children from poverty-level families and it is widely used as a measure of the poverty level of students in schools in the U.S.). It is unclear whether this is due to increases in overall poverty, increases in poverty among families with school-age children, or changes in either student applications or the eligibility requirements for the NSLP. But the result is that there have been large increases in the number of high-poverty public schools (defined as those in which three-quarters or more of the students were eligible for the lunch program) and in the numbers of students and teachers in such schools. Over half of the total increase in the number of teachers in public schools during this period took place in high-poverty schools. This group went from 10 percent of all public schools in the period 1987–1988 to over one-third of all public schools by 2017–2018. On the other hand, there have been large decreases in the number of lower-poverty public schools (defined as those in which less than 15% of the students were eligible for the lunch program) and in the numbers of students and teachers in such schools.
Charter schools are publicly funded schools that are granted a greater degree of autonomy from governmental regulations than traditional public schools. They are a relatively new model of schooling in the U.S that have dramatically grown in number over the past couple of decades. But they account for only a small portion of the ballooning of the teaching force because they represent a small segment of all schools (approximately 7.9 percent in the period 2017–2018) and of the teaching force (approximately 5.8 percent).
Another possible explanation for the ballooning is that a reduction in teachers’ workloads—class sizes, hours worked, or classes taught per day—necessitated an increase in the number of teachers employed. For instance, some states, such as California, implemented class size reduction reforms to great fanfare, leading to a demand for more teachers.
On close examination, this explanation does account for part of the ballooning of teachers, but not as much as one might expect. Elementary-level class size did decrease by 18 percent during this period (late 1980s to 2017–2018), from an average of 25.6 to 21 students per general elementary school classroom. Accordingly, the number of general elementary school teachers increased, and because elementary teachers comprise the largest field in teaching—almost one-third of the entire teaching force—their increase explains approximately 27 percent of the ballooning in the school system.
However, in contrast to elementary classrooms, typical subject-area teachers at middle and secondary schools experienced, if anything, increases in their workloads. Average class sizes at these levels went up slightly during this period. The average number of classes taught per day changed little, and, at all grade levels, the average number of instructional hours that teachers work per week slightly increased.
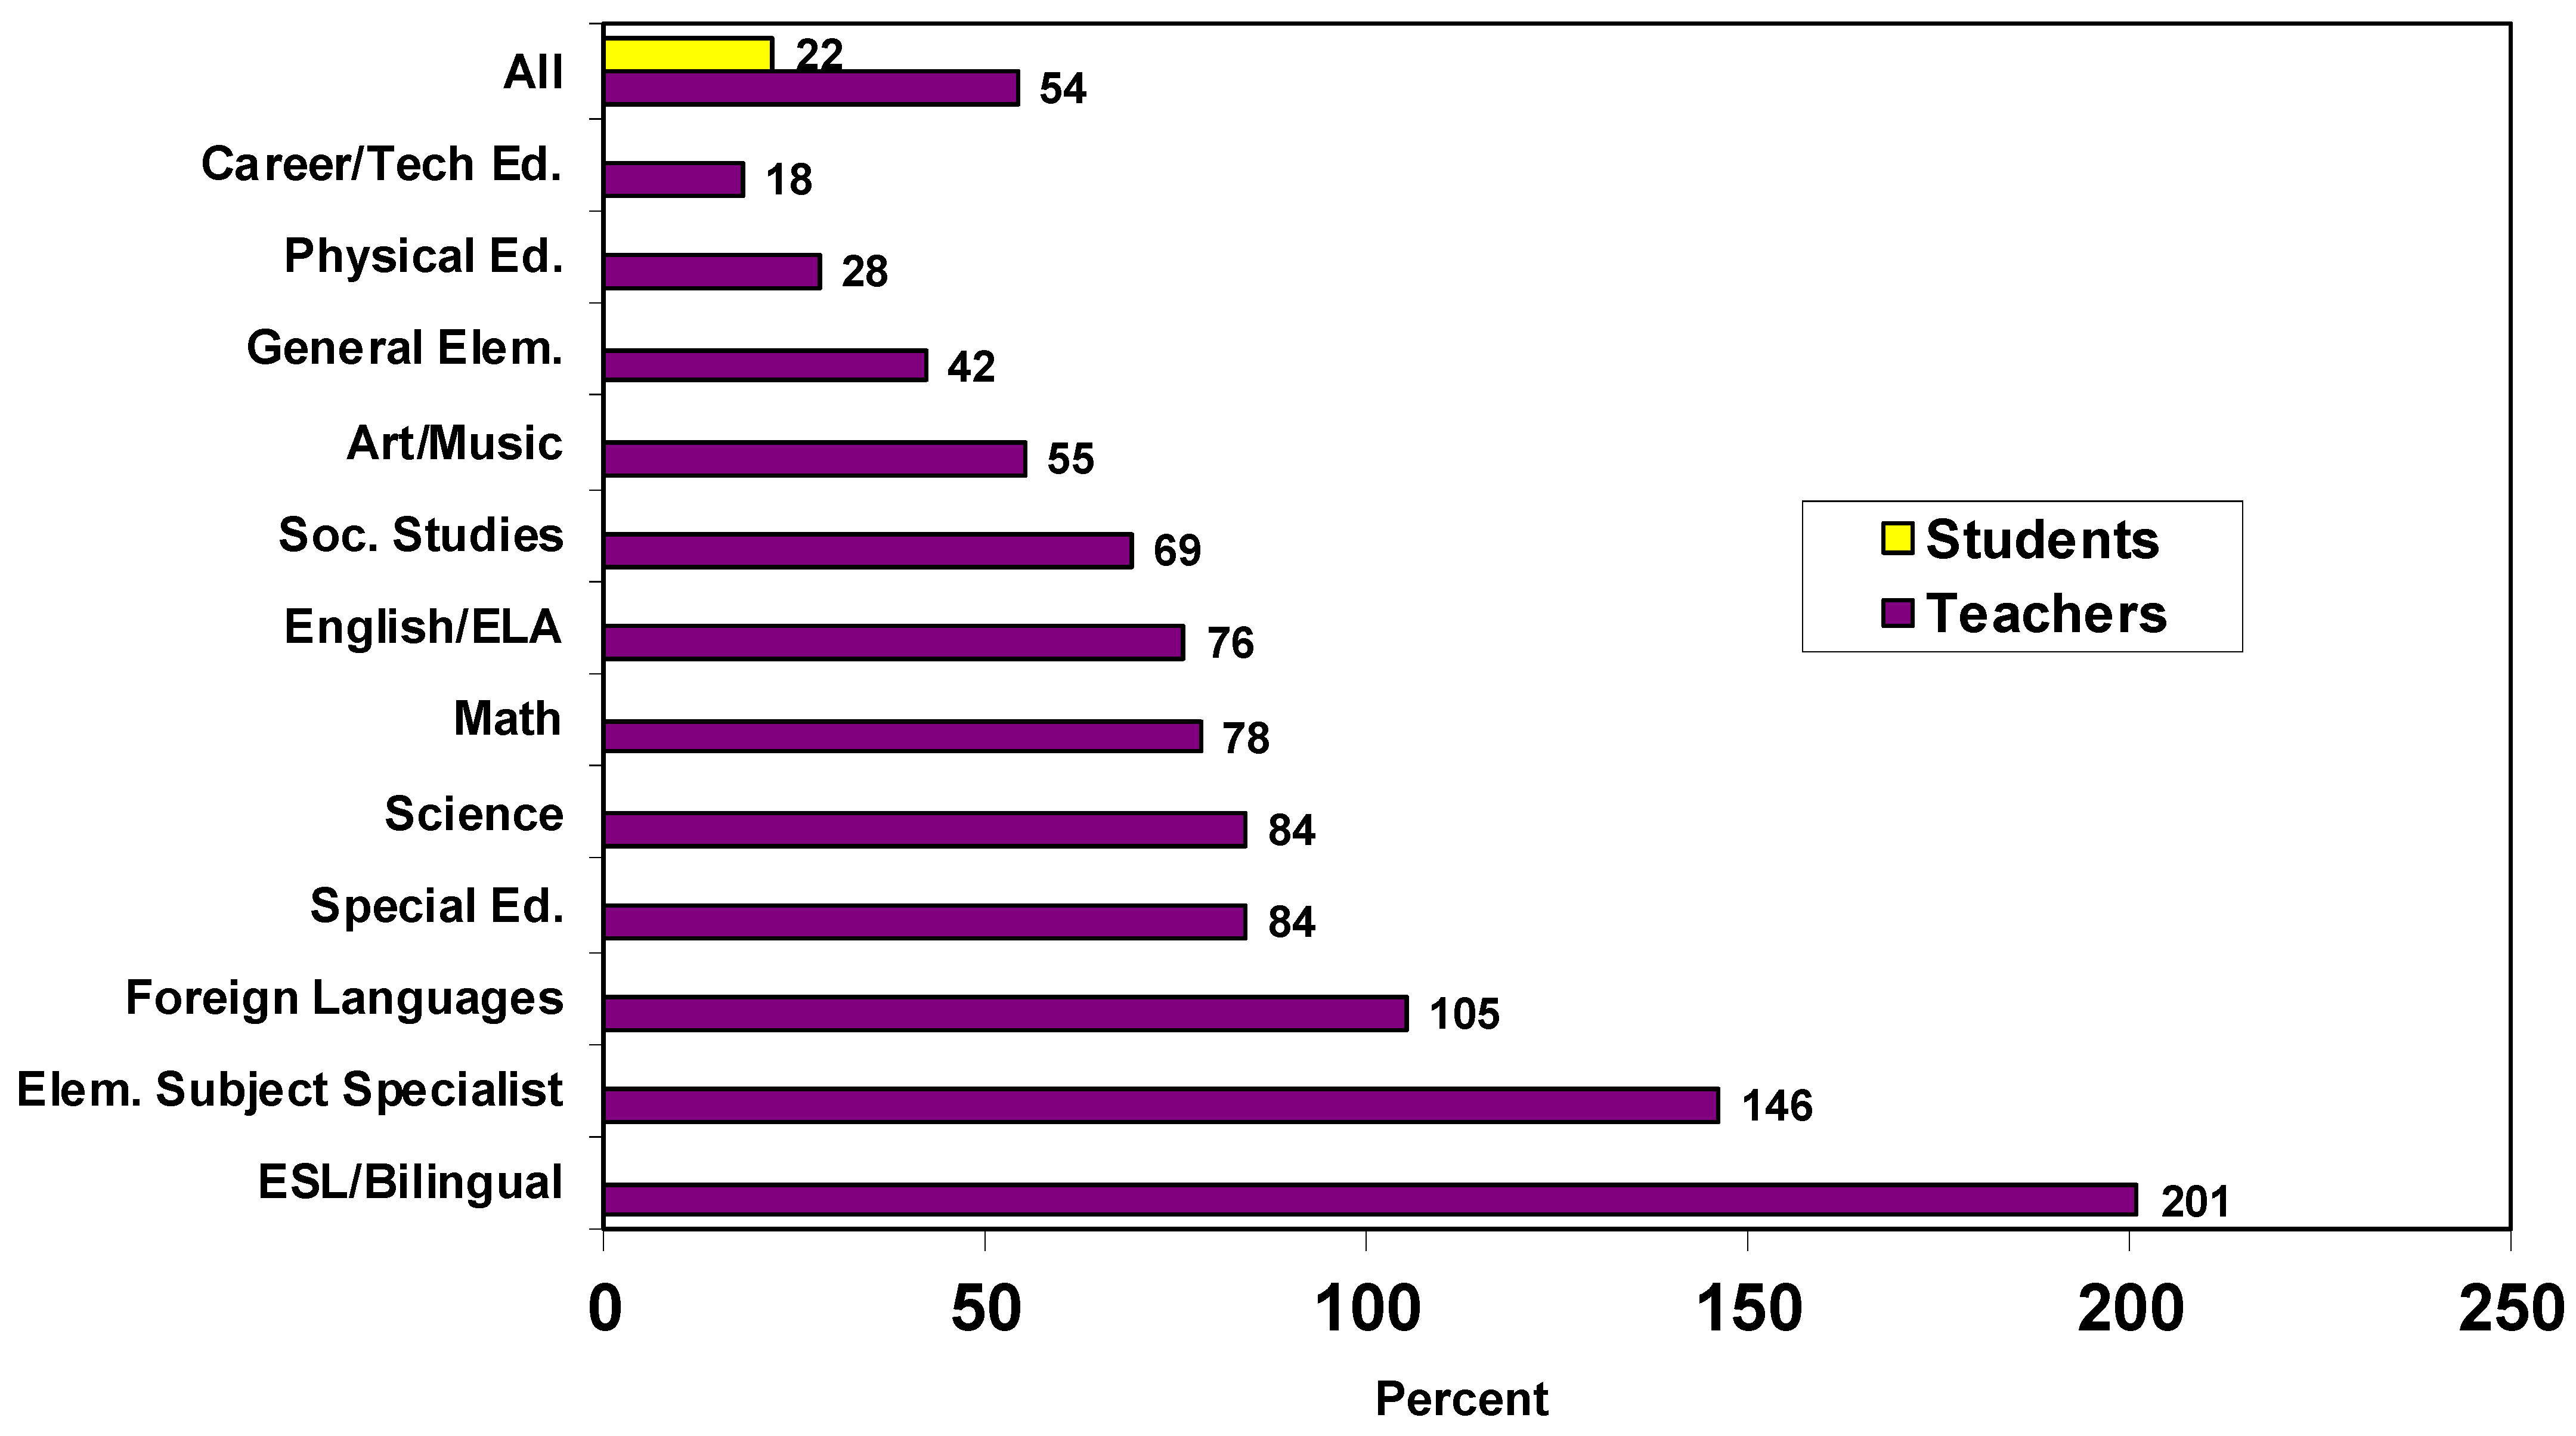
As shown in Figure 3, there have also been large differences in the growth rates of different teaching fields. In particular, there have been dramatic increases in the number of teachers whose main field was bilingual or English as a second language (ESL), and those whose main assignment was elementary enrichment/elementary subject specialist (these are teachers who teach only one subject, such as art, music, physical education, computer science, or mathematics, to different classes of students in an elementary school). (The increase in teachers in the field of elementary enrichment/subject specialist is from 1990–1991 to 2017–2018. This question was not included in the 1987–1988 SASS.)
It is important to also note that these data on percentage increases in fields do not take into account the relative size of fields and can be misinterpreted if a large percentage increase occurs in a small field, or vice versa. In the case of the above two fields of teaching (bilingual/ESL and elementary subject specialists), while each is undergoing dramatic growth, combined, they remain a small segment of the teaching force, and hence, their rapid increases together account for only approximately 16 percent of the increase in teachers during this three-decade period.
The data also indicate that a significant source of the ballooning has been the growth of the field of special education, likely linked to changes in the Individuals with Disabilities Education Act, the main U.S. special education legislation. As Figure 3 shows, the number of teachers whose main field was special education increased by 84 percent, compared to 42 percent for general elementary school teachers. Special education classes average approximately half the size of typical classes in elementary and secondary schools, and special education is a relatively large field (11% of all teachers). Hence, the increase in special education teachers alone accounts for approximately 15 percent of the increase in the teaching force.
As the teaching force has grown, it has also experienced large shifts at the middle and secondary levels during this period. Overall, the number of typical subject-area teachers at the middle and secondary school level has increased by 59 percent. But there has also been a large redistribution of these teachers across fields, with some growing far faster than others. Among those growing the slowest from the late 1980s to 2018 were career/technical education (CTE), art, music, and physical education. Among those growing the fastest, besides special education and bilingual education, were the core academic subjects of English/language arts, foreign languages, mathematics, and science. For example, the number of teachers whose main field was English/English language arts increased by 76 percent. This is one of the largest fields and comprises a variety of subfields, such as literature, composition, reading, and language arts. The number of teachers whose main field was reading increased by 80 percent during this period.
The number of teachers of mathematics went up by 78 percent. The number of teachers of science went up by 84 percent. Although there are two and a half times as many general elementary teachers as mathematics and science teachers, the increase in math and science teachers accounts for approximately 20 percent of the overall ballooning in public schools. A major factor in the growth in the number of mathematics and science teachers appears to be changes in secondary school graduation requirements across the nation. While the number of courses required for graduation went up slightly for English, social studies, and foreign languages, they increased far more for mathematics and science during this period. This change meant that students took more mathematics and science courses. The data show that the number of 9th- through 12th-grade students enrolled in mathematics and science went up dramatically, in turn driving the large increase in the employment of teachers qualified in those subjects during this period.
However, we have not yet uncovered all of the reasons for, and sources behind, the ballooning of the teaching force. One possible set of factors behind the ballooning could be ongoing increases in the number and range of programs, courses, and curricula that schools are required to offer, especially at the secondary level. Educational historians tell us that programmatic expansion has been going on for a century, as schools have continually been asked to take on more and more goals and tasks that were once the responsibility of parents, families, and communities, and as our schools are continually asked to address larger problems and changes of our society and economy [8,9](Kirst, 1984; Vollmer, 2010). Indeed, it is important to note that the hiring of more math, science, special education, ESL/bilingual, foreign language, reading, and elementary enrichment/specialist teachers is simply in response to what the public wants. These are fields that have been in high demand.
There are, however, good reasons to further investigate the sources of the rapid growth in the teaching force, given the broad implications. For instance, the expansion of the teaching force, while in response to public demand, and to many of course entirely beneficial, has not been cost free, especially considering that teacher salaries are the largest item in school budgets. To illustrate the overall cost of teacher salaries, we aggregated the base salaries paid to teachers in the 2017–2018 NTPS teacher sample, by teachers’ fields. To give several examples, the total of the base salaries paid to mathematics teachers in the U.S. in the period 2017–2018 was almost $29 billion; for special education teachers, it was just over $26 billion; for physical and health education teachers, it was just over $10 billion; for career/technical education, it was just over $8 billion; and for ESL/bilingual teachers, it was just over $4 billion.
How much has the ballooning itself cost the U.S. in additional teacher salaries? In other words, how much has it cost to hire teachers at a rate beyond what would have been necessary to have simply kept pace with student enrollment increases?
To answer these questions, we undertook an analysis to estimate the increase in aggregate salaries for teachers across the nation due to the ballooning in the number of teachers. Our approximate and conservative estimate is that in the almost three-decade period between 1987–1988 and 2015–2016 the additional aggregate cost of salaries due to hiring more teachers, beyond what would have been necessary to have kept pace with student enrollment increases, was over 40 billion dollars.
Our point is not that ballooning has been unnecessary or excessive or that the additional funds were not well spent. Indeed, having more teachers per students appears to be what the public wants. Our point is simply that the ballooning trend also leaves us with sobering questions: how have school systems been able to cope with such an increase in their largest budget item, who has been paying for it and what will this ballooning mean for the possibility of future increases in teachers’ salaries—as proposed by reformers?
The ballooning of the teaching force also raises related questions regarding the performance and cost-effectiveness of the school system. Economists have long pointed out that, through technological advances, employees in many industries and occupations have become far more productive. A key example is the remarkable changes in agricultural production over the past century—far fewer farmers produce far more produce. Our data raise the question of whether the opposite has been true for teachers. That is, does a decrease in the pupil–teacher ratio mean that teachers have become less “productive”?
A closer look suggests that more teachers per student does not necessarily mean that there has been a decrease in teacher “output”. For instance, a portion of the ballooning is accounted for by the increased demand for, and employment of, bilingual/ESL and special education teachers. These fields appear to require a more intensive teaching process and smaller class sizes. Hence, fewer students per teacher in these fields does not necessarily mean that there has been a decline in the output of teachers.
Moreover, it is important to note that teaching is not the only occupation in which the number of practitioners has been increasing at a faster rate than the client base. For example, data from the U.S. Bureau of Labor Statistics (2020) show that the number of nurses, dentists, and pharmacists have all increased in recent decades at a faster rate than the populations they serve [7]. It is unclear why this has happened, but such increases do not necessarily mean that nurses, pharmacists and dentists are less productive than in the past.
Another implication of the ballooning is for the much-heralded teacher shortages, especially in mathematics and science. We have explored this issue in depth elsewhere [10,11,12,13,14]. As shown in Figure 3, these have been relatively high-growth fields. Among other findings from our research on shortages, our data analyses show that, contrary to conventional wisdom, the growth in the new supply and employment of qualified mathematics and science teachers has not only more than kept pace with increases in mathematics and science student enrollments, but also with mathematics and science teacher retirement increases—a point we address in Trend 2.
The significant increase in teachers over the past few decades has often been missed or misunderstood by commentators on both sides of the ideological and political spectrum. For instance, some liberal-left economists argued that the economic recession that began in 2008 could have been kick-started into recovery if those teachers who were laid off beginning in 2008 had simply been rehired [15]. Rehiring teachers as a means to stimulate the economy during the economic recession may well have been a worthwhile initiative. But it is important to recognize that the decline in the size of the teaching force from 2007–2008 to 2015–2016 (see Figure 1) was modest compared to the ballooning of previous decades. Our data show that the teaching force increased by approximately 1.3 million from 1987–1988 to 2007–2008, but only declined by approximately 64,000 teachers between 2007–2008 and 2015–2016, over half of which were from private schools. In other words, put into a historical context, reductions in the teaching force were neither large nor severe.
On the right side of the political spectrum, some advocates of education reform have cited the ballooning of the teaching force as evidence of “bureaucratic bloat” and “negative productivity” in the public sector [16,17]. This view holds that ballooning is evidence of a reduction in teacher productivity—more teachers per students, coupled with little change in test scores. The solution this view espouses is school choice and enhanced competition or privatization, based on the argument that private schools (and charter schools) are in a competitive, market environment, are leaner and more efficient, and hence marked by greater teacher productivity—in other words, they get better student achievement with fewer teachers.
However, these critics overlook the larger ballooning of the teacher force in private schools. Private schools have long had lower pupil–teacher ratios and smaller average class sizes—no doubt in response to what their market and clients want. But, as we show in Figure 2, it is important to recognize that not only has the teaching force grown faster in private schools than in public schools since the late 1980s, this has happened while the overall number of students in private schools has decreased. In other words, overall, the private school sector has been employing more teachers to serve fewer students. Not surprising, average full tuition at private schools rose 137 percent (after adjusting for inflation) during the 24 year period from 1987–1988 to 2011–2012.
The ballooning of the U.S. teaching force is a dramatic trend, and it is no surprise that a variety of commentators have noticed this trend and have offered explanations for it. However, the reasons for, and implications of, this dramatic growth are still unclear. We hope to address these questions with further research.
3.2. Trend 2: Older
The U.S. teaching force has been getting older. We have often heard about this trend because of its link to teacher shortages. Since the mid-1980s, numerous highly publicized reports have warned of a coming educational crisis caused by severe teacher shortages in elementary and secondary schools [18,19,20,21,22,23,24,25,26,27]. These reports predicted a dramatic increase in the demand for new teachers, primarily as a result of two converging demographic trends—increasing student enrollments and increasing teacher retirements due to a “graying” teaching force. Shortfalls of teachers, the argument surmised, would force many school systems to resort to lowering standards to fill teaching openings, inevitably resulting in high numbers of underqualified teachers and low school performance.
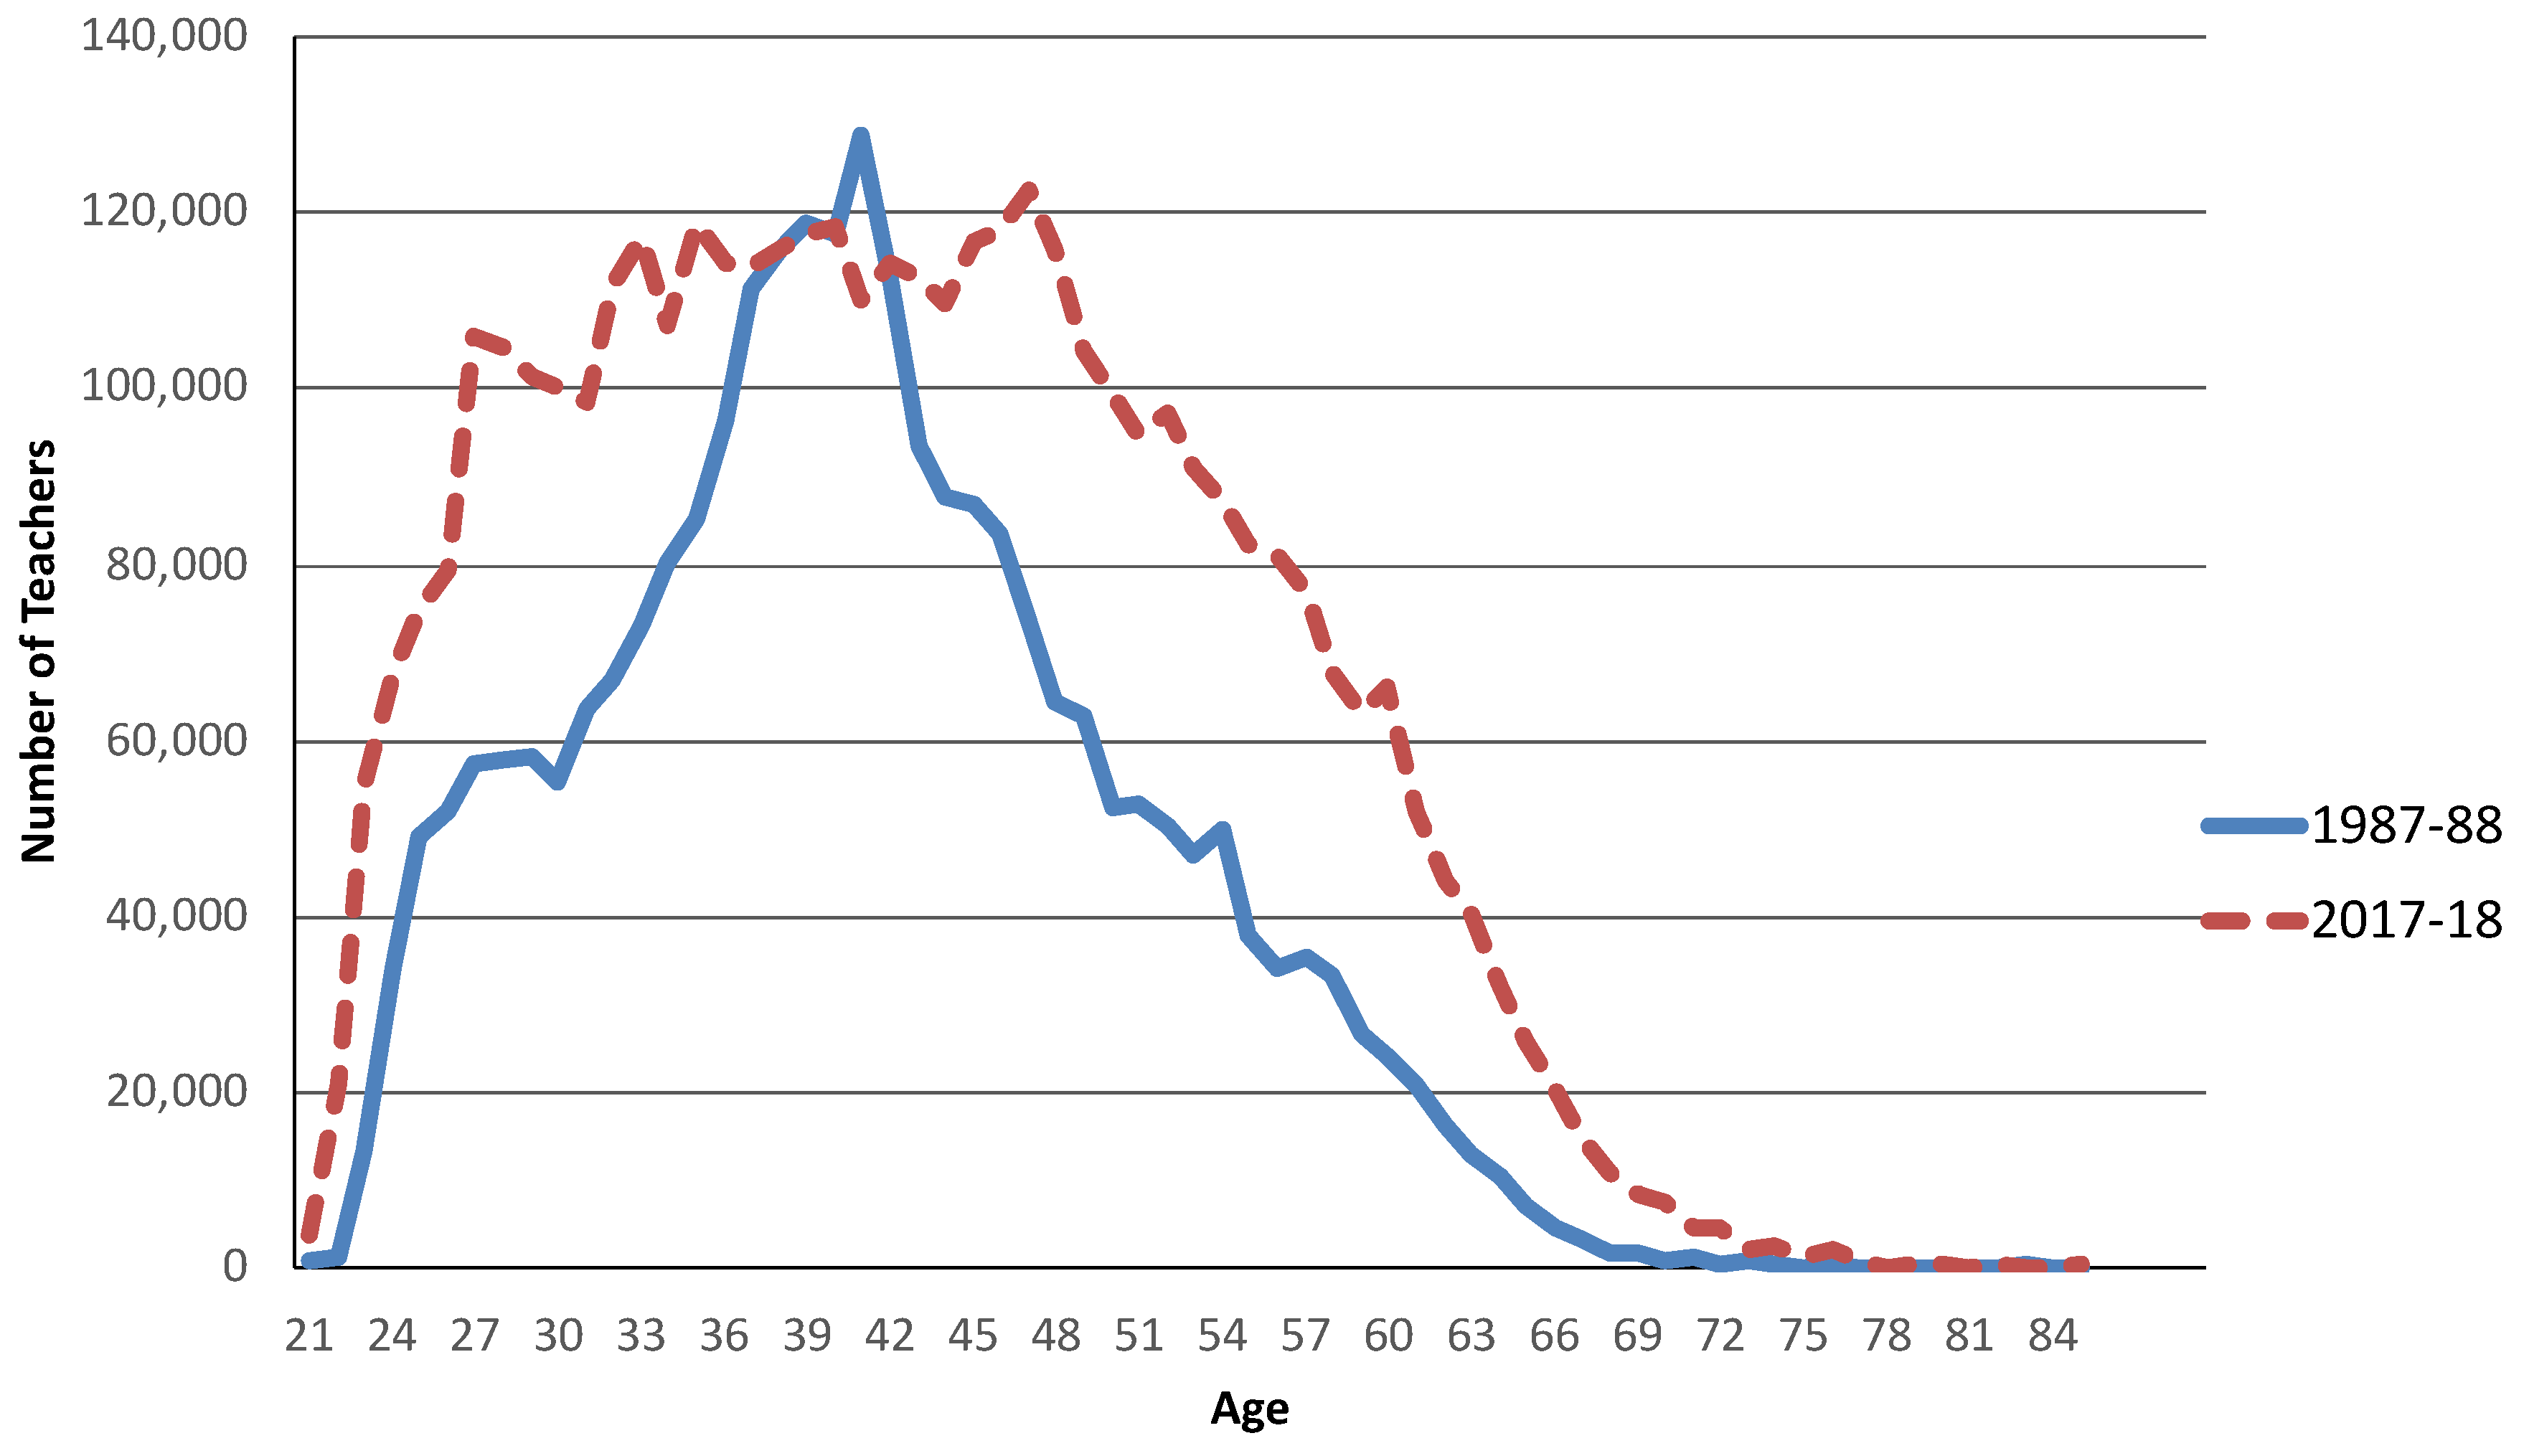
Our data confirm this demographic trend: the teaching force has gotten older, and teacher retirements have steadily increased. But our analyses also show that the aging trend is largely over. As Figure 4 shows, in the period 1987–1988 the age distribution of teachers was shaped like a tall peak. The modal, or most common, age was 41. As the years went by this group continued to age, and by 2007–2008 the modal age of teachers rose to 55. However, by 2017–2018 the most common age of teachers had spread out—with the modal age ranging from the low 30s to the high 40s.
Likewise, the number of teachers 50 years or older increased, from approximately 529,000 in 1988 to a peak of 1,271,000 in 2008. However, by 2017–2018 the number of teachers 50 or older had decreased to approximately 996,000 (see Figure 5 for percentage changes).
What are the implications of this trend?
The aging of the teaching force has had large cost implications for both school budgets and for state pension systems—an issue that has received much media and policy attention in recent decades. Veteran teachers earn higher salaries, which, in turn, can strain school and district budgets. Increases in the number of retirees mean larger outlays from state pension plans [28,29].
But in discussions of the dire future for pension systems, another factor has been underemphasized: if schools replace retirees with new teachers, who earn lower salaries and who also pay into state pension plans, these additional costs could be lessened. As we discuss in Trend 3, not only have retirees been replaced with newcomers, but the flow of newcomers has become a flood.
Another implication of aging is its impact on the supply of teachers. Conventional wisdom has long held that retirements are a major factor behind teacher shortages. But teacher retirements have always represented only a small portion of all of those leaving teaching—less than one-third in recent years. And, if we examine all departures of teachers from schools (both those moving between schools and those leaving teaching altogether), retirement is only approximately 14 percent of the total outflow. In our research on the math and science teacher shortage, as mentioned above, we have found that, contrary to the conventional wisdom, the new supply of qualified math and science teachers has been more than sufficient to cover student enrollment increases and teacher retirement increases in these subjects. In contrast, the main, but under-recognized, source of mathematics and science teacher staffing problems is pre-retirement voluntary turnover [10,12,13], an issue to which we return in Trend 7.
3.3. Trend 3: Less Experienced
Graying is not the only change in the age and experience of the U.S. teaching force. Another opposite and unrecognized trend has occurred simultaneously. As Figure 4 shows, by 2017–2018, the teacher age distribution had spread out, with multiple peaks. As the number of older, veteran teachers increased, so has the number of beginning teachers. The increase in beginning teachers is largely driven by the ballooning trend, that is, by the huge increase in new hires.
Most of these new hires are young, recent college graduates; however, a significant number are older, but inexperienced, beginning teachers. For instance, in the period 2017–2018, approximately 36 percent of new teachers in schools were over age 29, and approximately 15 percent were over 40—the phenomenon often referred to as mid-career switching. This has been fostered by recruitment programs such as Troops-to-Teachers. But mid-career switching into teaching is neither new nor an upward trend. Indeed, despite an increase in the number of older new hires, the current proportion of new hires age 29 or older is little different from that in the late 1980s.
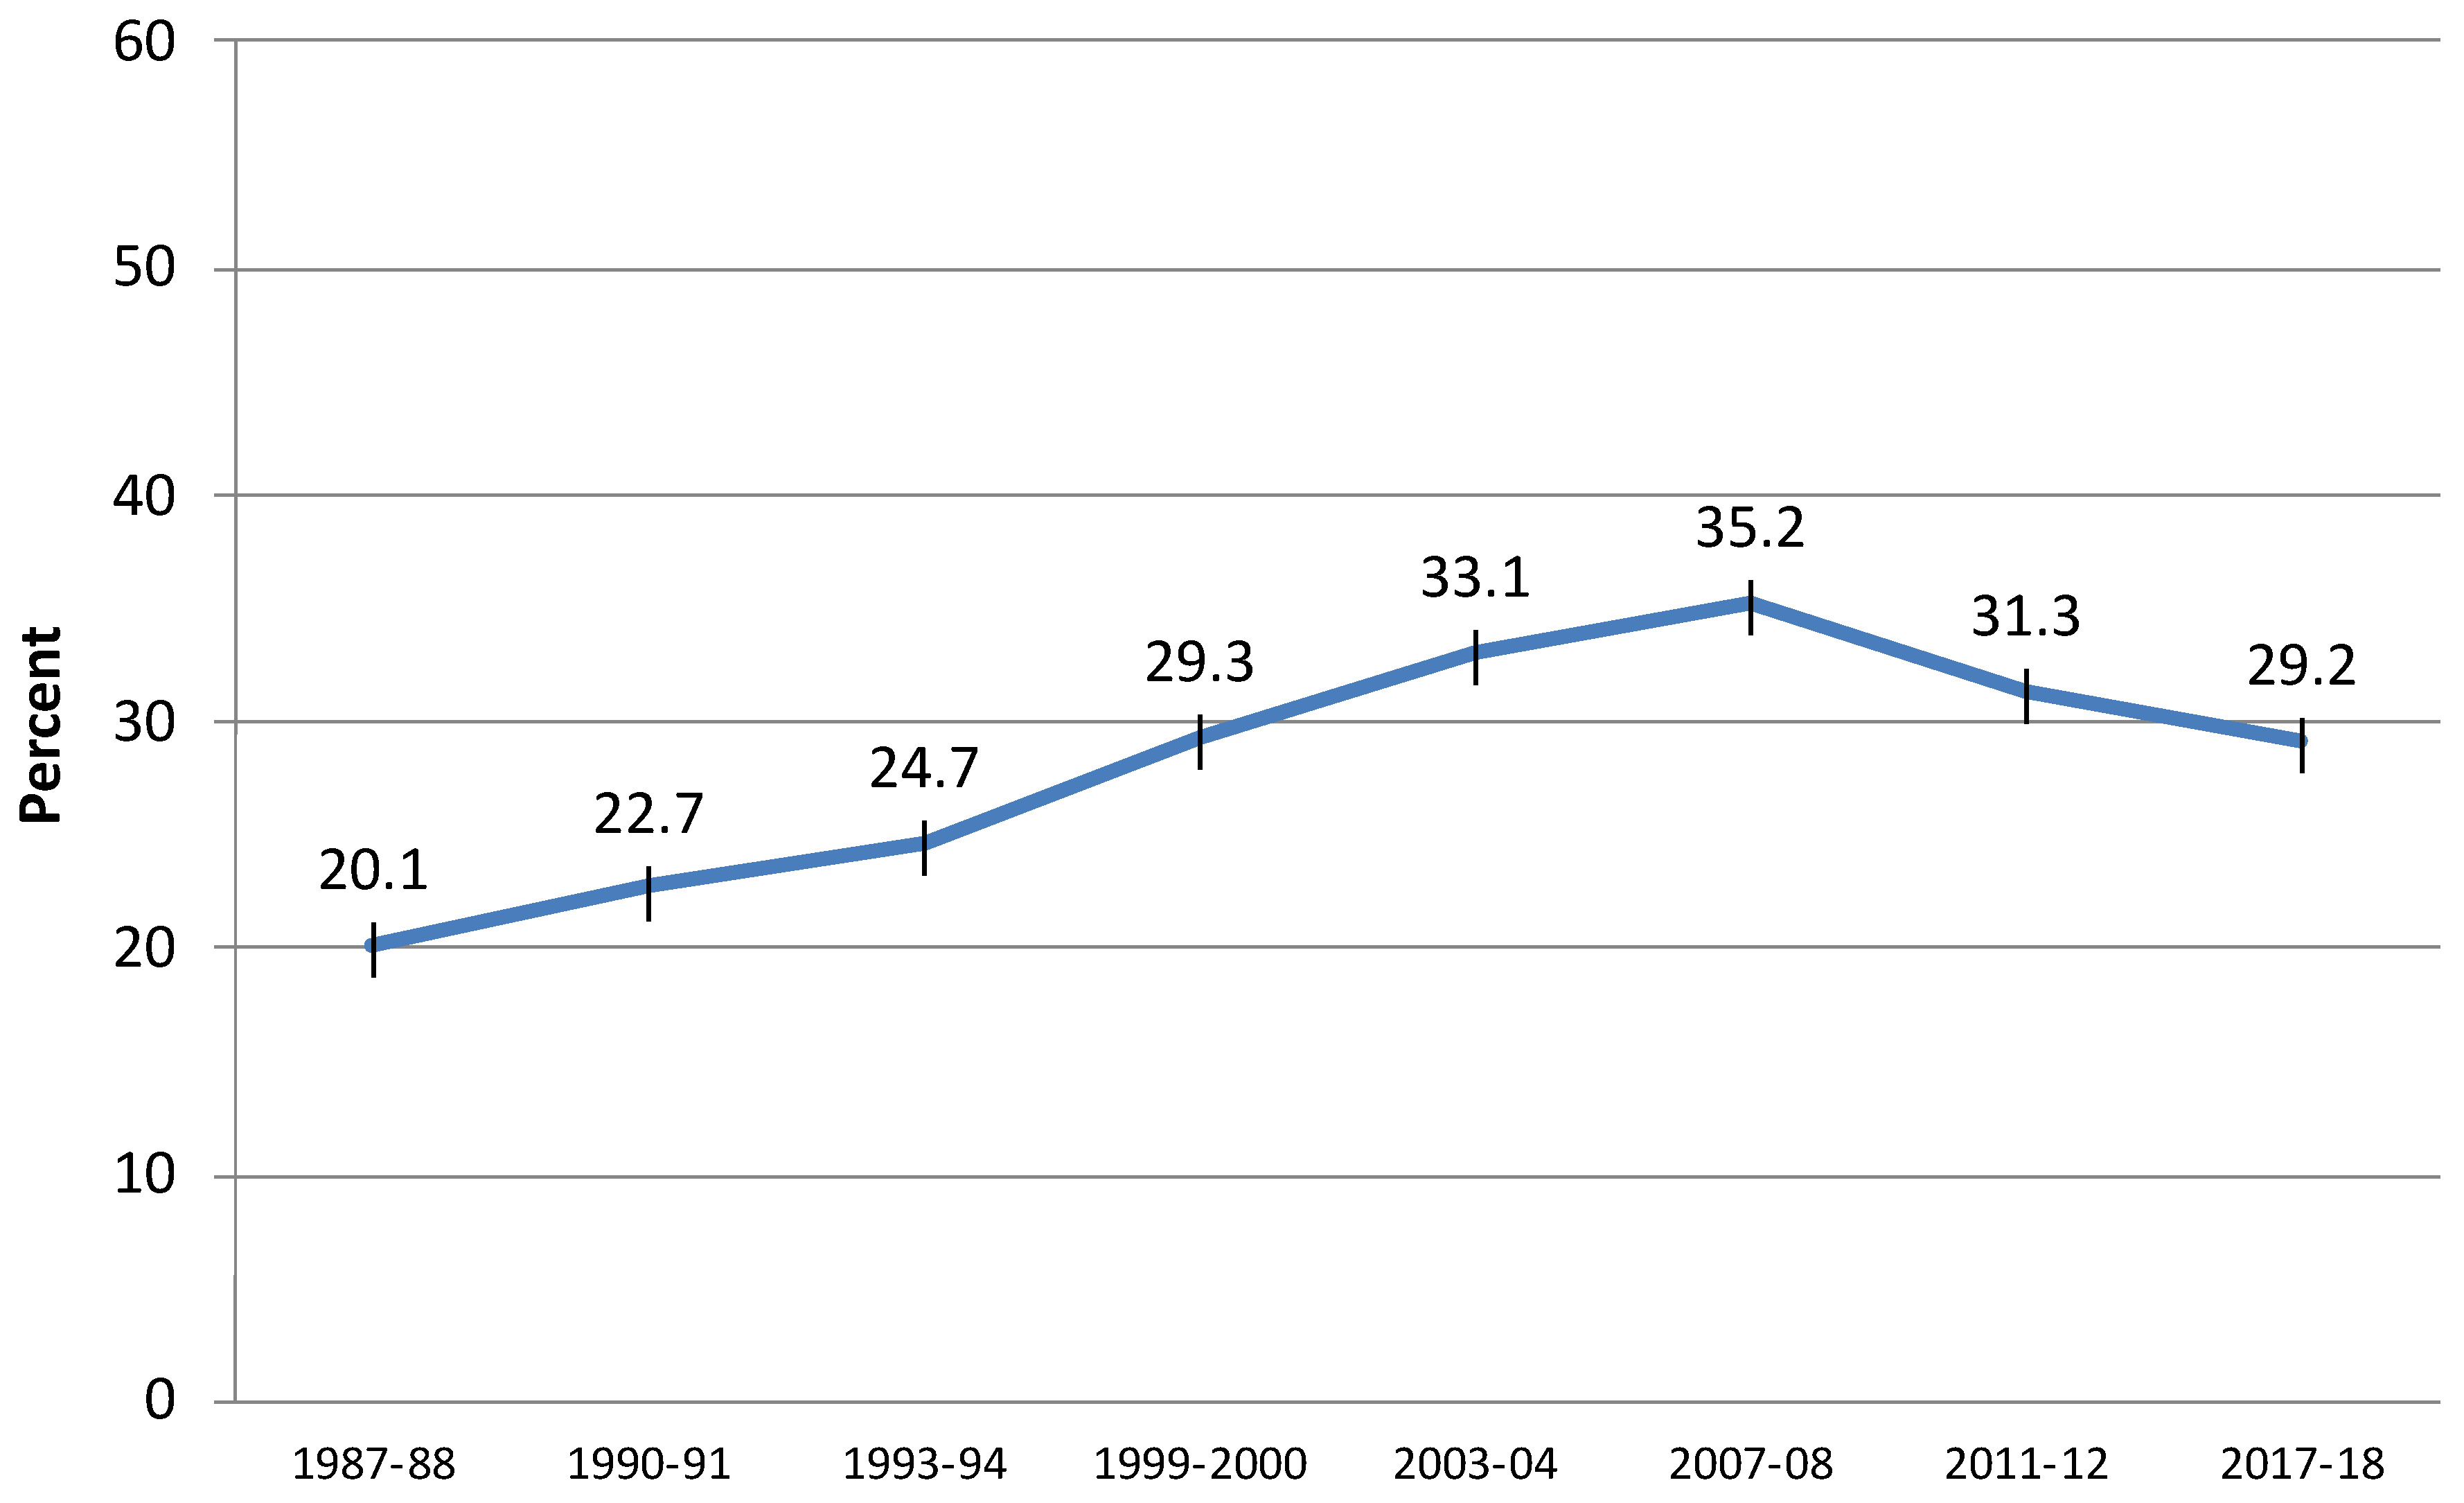
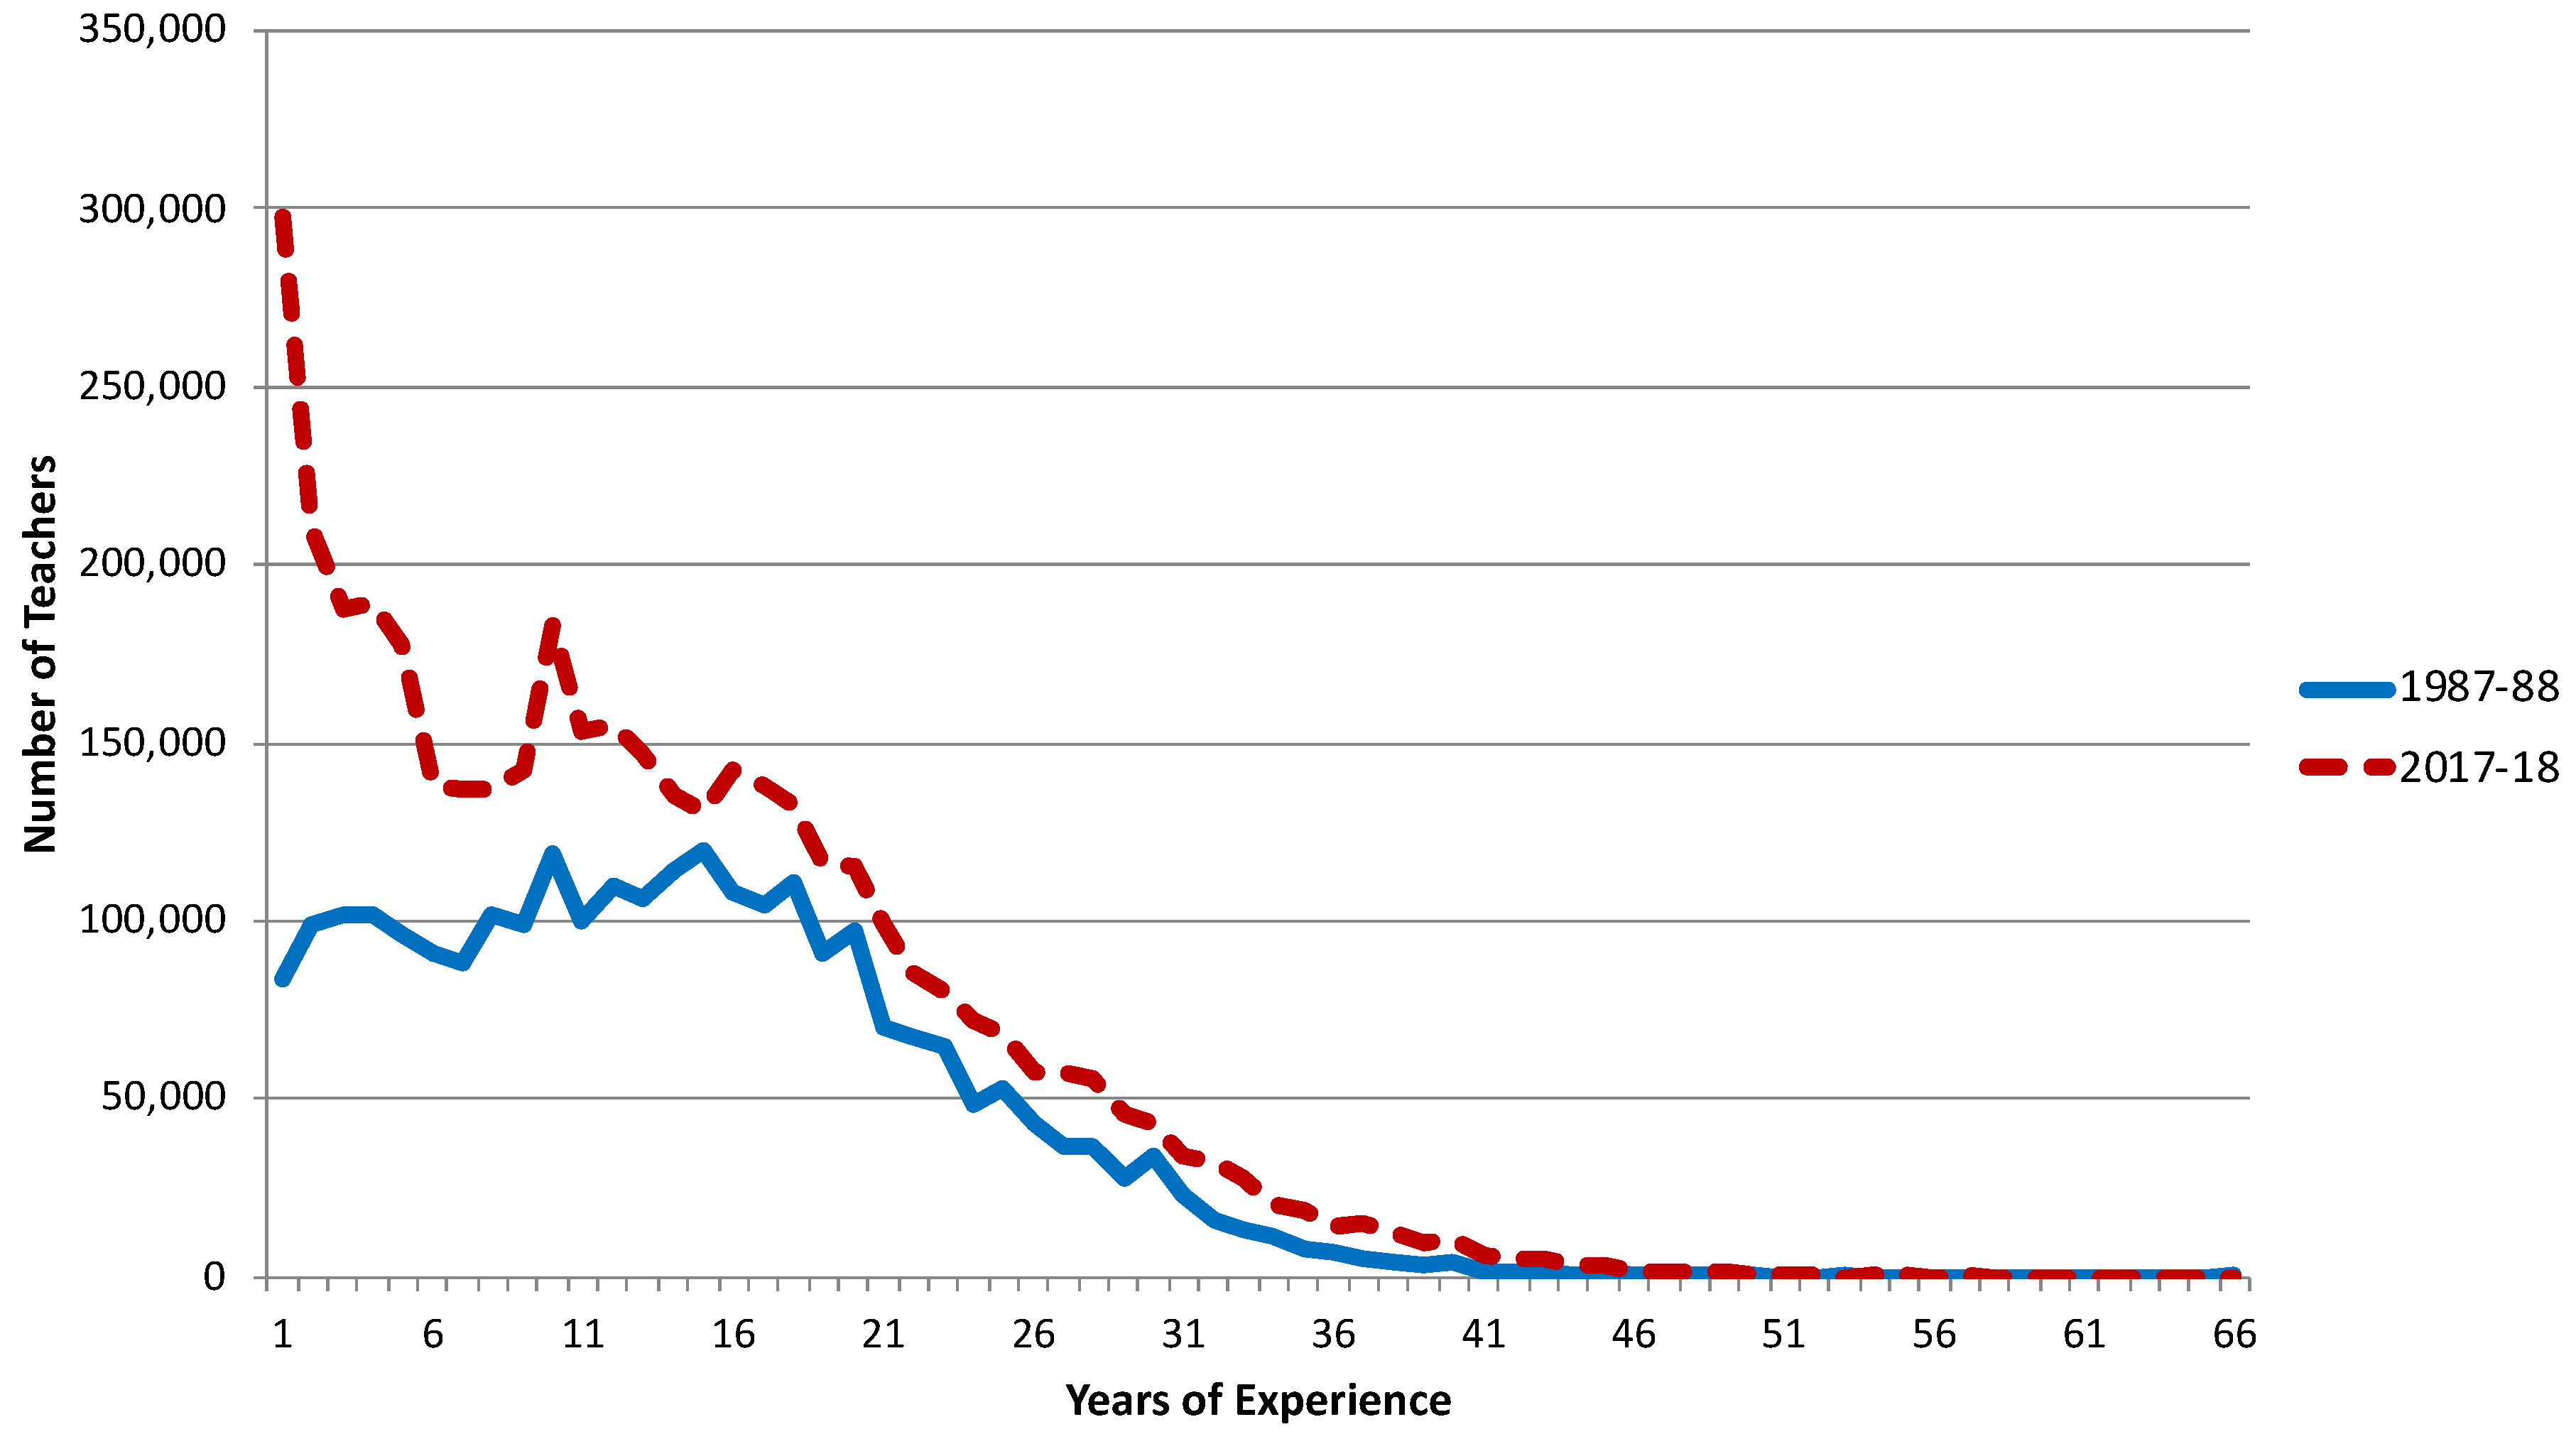
Regardless of their age, these many new hires have resulted in a third trend—a dramatic increase in the number of teachers who are beginners—which we have labeled the “greening” of the teaching force. This trend is illustrated by the distribution of teachers by their years of teaching experience. In the period 1987–1988, the modal, or most common, teacher had 15 years of teaching experience under his or her belt, and the shape of the distribution was a single peak, as shown in Figure 6. By 2007–2008, the modal teacher was not a gray-haired veteran; he or she was a beginner in his or her first year of teaching. With the advent of the economic downturn beginning in the period 2007–2008 and the subsequent decrease in hiring, which was accompanied by layoffs—usually of beginners [30,31]—this greening of the teaching force slowed down. Hence, by 2011–2012, the modal teacher was someone in his or her fifth year. However, with the pickup in hiring, by 2017–2018, the modal teacher was again a beginner—in their first year.
There are, of course, still large numbers of veteran teachers—in the period 2017–2018, approximately one-quarter of all teachers had 20 years or more of teaching experience. But it is useful to recognize that the percentages on greening included above do not take into account the ballooning of the teaching force. Because the teaching force has dramatically grown, numerically there are far more beginners than before. For example, in the period 1987–1988, there were approximately 84,000 first-year teachers; by 2017–2018, there were approximately 300,000 first-year teachers. Similarly, in the period 1987–1988, approximately 1 million teachers (approximately 37 percent of all teachers) had 10 or fewer years of teaching experience; in the period 2017–2018, there were over 1.8 million teachers (approximately 44 percent of the teaching force) with 10 or fewer years of experience.
What are the implications of this trend?
New teachers can be a source of fresh ideas and energy, and it can be beneficial to have new faculty coming into schools. On the other hand, having an increasing number of beginners, along with a decreasing number of veterans, in a school could also have a negative impact. Being taught by more experienced teachers, for example, can make a positive difference for students’ academic achievement. A growing number of empirical studies document what is common sense among those who have taught—that teachers’ effectiveness at improving their students’ test scores usually increases significantly through their first several years on the job [32,33]. Beyond academic instruction, as they collect more experience, teachers also have more opportunity to develop many other skills crucial to teaching, such as how to deal with student behavior problems, how to teach students with diverse backgrounds and abilities, how to work and communicate with parents, how to best promote good work habits in students, and how to nurture students’ self-esteem. Having sufficient numbers of veteran teachers in a school can also make a positive difference for beginning teachers. A solid body of empirical research documents that support, including mentoring by veteran teachers, has a positive effect on beginning teachers’ quality of instruction, retention, and capacity to improve their students’ academic achievement [34].
Greening also has large financial implications for several reasons. First, greening has implications for overall teacher salary costs. A teaching force with an increasingly large portion of beginners at the low end of the pay scale is less expensive, and this could ameliorate some of the increased payroll costs of the ballooning trend mentioned above. For instance, our analyses of the NTPS data show that in the period 2015–2016, the average starting salary for public school teachers with a college degree and no teaching experience was approximately $38,800; while that same year, the average salary for veteran public-school teachers, with over 15 years of experience and a master’s degree, was approximately $66,500.
Second, greening has implications for pension systems. Greening may defray some of the increased pension costs resulting from the graying trend. Economic analysts have been arguing that there has been an alarming decrease in the ratio of new employees who pay into pension systems and Social Security, compared to retired employees who withdraw from pension systems and Social Security [28,29]. This imbalance does not appear to be the case for teaching, which is one of the largest occupational groups in the nation. As Figure 4 and Figure 6 illustrate, both the proportion and the numbers of younger and less experienced teachers have increased, not decreased.
Moreover, as we will show in Trend 7, early attrition has remained high among this growing number of beginners, meaning that a significant number will never withdraw all of the funds accrued in their school system’s pension plan. In many states it can take 5 to 10 years for a teacher to become fully vested, and hence eligible, upon leaving a school system, to receive any funds contributed by their employers to their pension plan [35,36,37]. In addition, school system pension plans are sometimes backloaded: pension payout levels do not increase evenly with each year of increased classroom experience. Rather, payouts are often relatively small until a teacher has accumulated two or three decades of classroom experience, after which they suddenly jump. High attrition combined with delayed vesting and pension backloading could result in a reduction in payouts from state pension plans, for more detailed discussion, see references [28,29].
In sum, greening (along with high attrition) means more of the teaching force is less expensive and more teachers are paying into pension plans, while fewer of them will fully withdraw from pension systems.
3.4. Trend 4: More Female
Educational historians and scholars have documented that when the public school system was created in the U.S. at the end of the 19th century, teaching was intentionally designed to be a predominantly female occupation [38,39,40,41,42]. There were a number of reasons for this, among them were that, since women had fewer other employment options compared to men, and generally paid less, they were less expensive for school districts to employ than men. Moreover, teaching seemed to fit the traditional gender-role stereotype—that women are assumed more naturally suited to child rearing and caregiving than men [43]. As a result, in this view, historically, in the U.S., K-12 teaching became stereotyped as lower-paid “women’s work”.
For the same reasons, both financial and social, these scholars have held, teaching became less attractive to males. Unlike women, males had more and better-paid occupational options, hence becoming a teacher entailed greater financial “wage sacrifice”, “alternatives foregone”, and “opportunity costs” for males [44]. Hence, males were less likely to both enter and to stay in the teaching occupation. Indeed, some have concluded that women essentially subsidized the education system for most of the previous century because they were relatively well-qualified employees working for relatively low wages [43,45,46].
However, in recent decades, educational scholars have predicted that this would change as gender stereotypes softened, many occupations became less sex-segregated, and women’s employment options and career opportunities expanded [47,48,49]. Over the past four decades, many occupations and professions that traditionally have been predominantly male have opened up to women. For instance, data from the Bureau of Labor Statistics show that in 1972, only 10 percent of physicians, 4 percent of lawyers, 2 percent of dentists, and 13 percent of pharmacists were female; by 2019, these proportions had risen to 41 percent (physicians), 37 percent (lawyers), 36 percent (dentists), and 63 percent (pharmacists) [7]. With career and employment alternatives increasingly available, especially in higher-paid, and/or more prestigious occupations and professions, some have predicted that fewer women would enter lines of work that traditionally have been predominantly female.
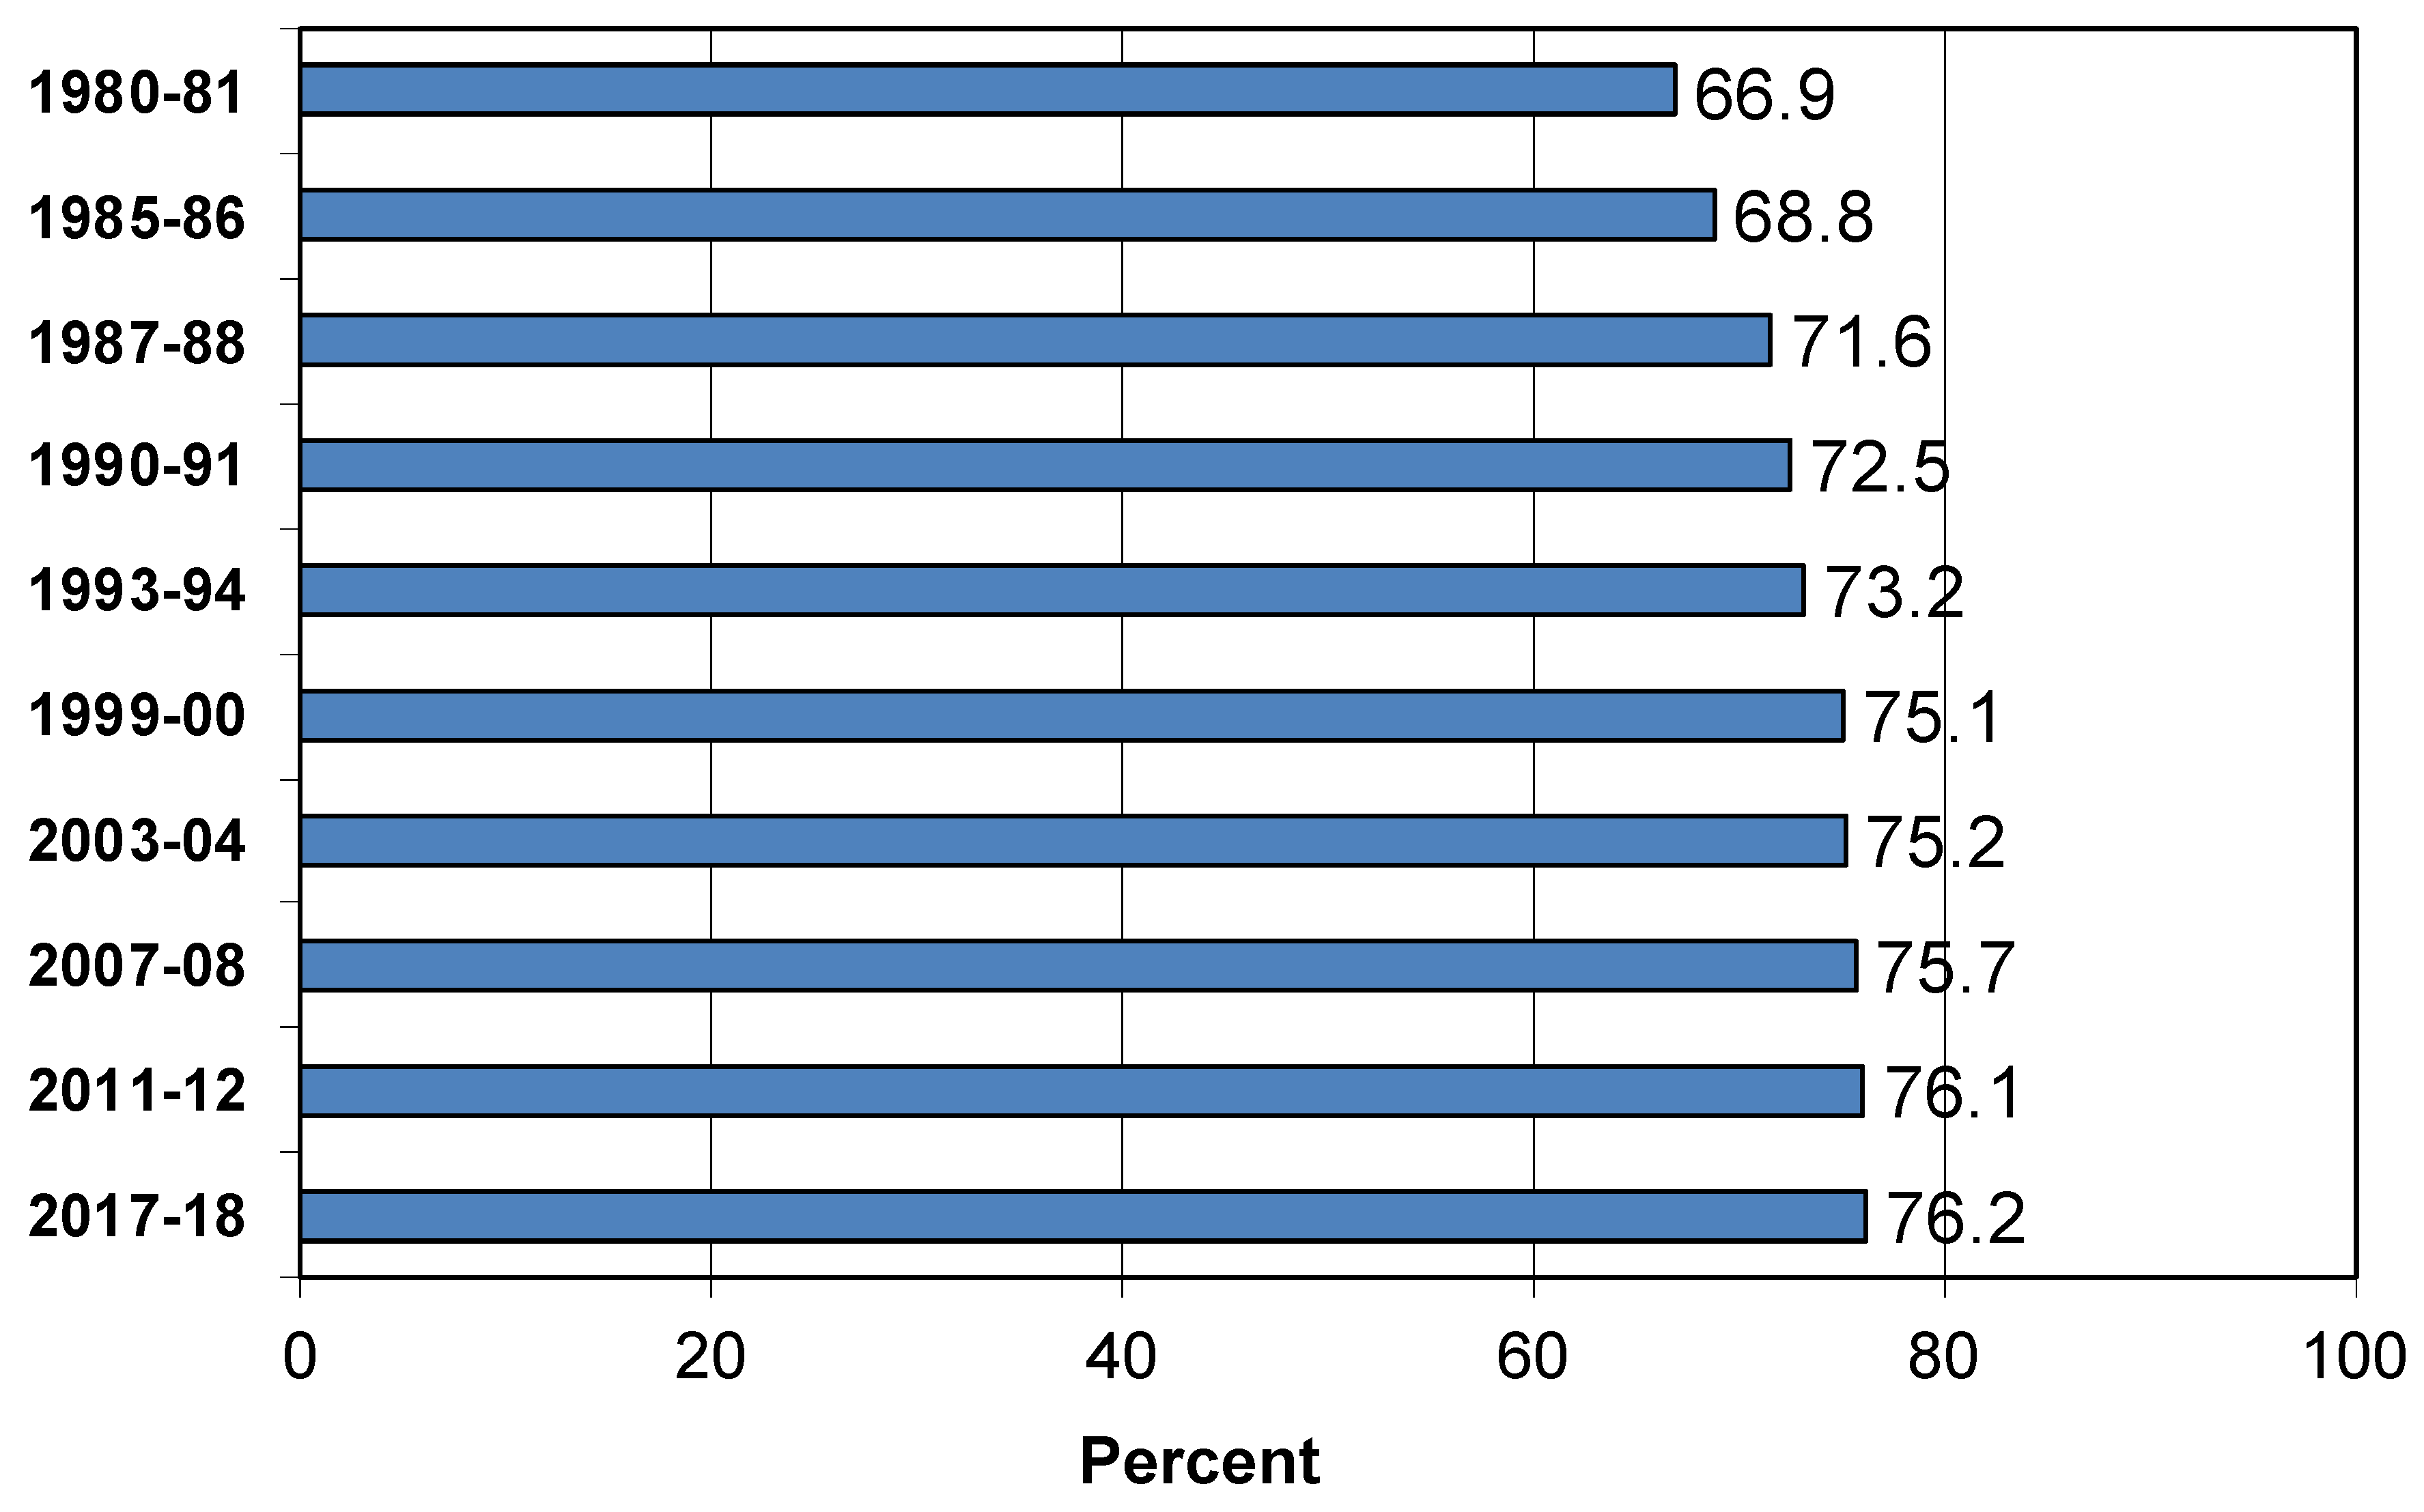
Perhaps surprisingly, this has not happened for teaching in the U.S. Both the number of women entering teaching and the proportion of teachers who are female have gone up. The SASS data, along with other NCES data, show that since the early 1980s there has been a slow but steady increase in the proportion of teachers who are female, from 67 percent in the period 1980–1981 to over 76 percent in the period 2017–2018 (see Figure 7).
It is unclear why this increase has occurred. Here we will offer four possible hypotheses for this increase in the female-to-male ratio in teaching. These hypotheses are neither exhaustive nor mutually exclusive.
(1). One possible hypothesis for the increase in the female-to-male ratio in teaching is that teaching has continued to be less attractive and less welcoming to men than women because of the persistence of traditional gender roles and segregation as well as issues with financial rewards, occupational status, and social pressures associated with these roles.
For example, some analysts have argued that males continue to be discouraged from entering teaching due to the persistence of a “wage sacrifice”—as men continue to be able to earn substantially more in other lines of work. For an insightful summary, see references [49,50].
Along with financial disincentives, researchers have held that males continue to be faced with a “prestige penalty” if they enter teaching [51]. The occupational status and stature of teaching has long been a source of both hope and frustration for educational reformers. Historically, during the development of the school system, elementary and secondary teaching was viewed as requiring less ability, skill and training, and in turn, was afforded less pay and less occupational prestige than the well-established professions, such as medicine, law, academia, engineering, dentistry, and accounting. For example, in his classic work, The Sociology of Teaching, published in 1932, Willard Waller, noted that, “The difficulties of the teacher … are greatly increased by the low social standing of the teaching profession and its’ general disrepute in the community at large … Concerning the low social standing of teachers much has been written. The teacher in our culture has always been among the persons of little importance and his place has not changed for the better in the last few decades” [52] (pp. 11, 58). Similarly, C. Wright Mills (1951, pp. 129) in his classic study White Collar published in 1951, referred to schoolteachers as the “proletarians of the professions” in the U.S. [53] (p. 129).
Not surprisingly, in response, educational reformers have repeatedly sought to promote the view that elementary and secondary teaching is in reality a highly complex kind of work, requiring specialized knowledge and skill, and deserving of the same status, pay and standing as highly regarded professions, like law, academia and medicine. These aspirations have yielded mixed results. Scholars have found that, as far as prestige and status, elementary and secondary teaching in the U.S. lies in the middle—compared with a wide cross-section of occupations and professions. As documented in the General Social Surveys over the past half century the prestige and stature of K-12 teaching has been well below that of professionals, such as doctors, lawyers, professors, dentists and engineers, has been slightly higher than that of the skilled trades, such as plumbers, electricians, and well above that of the lowest status types of work, such as secretaries, waiters and barbers [54,55]. However, when compared solely to the subset of white-collar occupations and professions, teaching lies near the bottom, at a similar level as nurses, police, librarians and social workers.
International comparisons of the stature of teachers have also confirmed this finding. In the recent Global Teacher Status Index, teachers were ranked against 14 other white-collar occupations in 35 nations [56]. On average, teachers’ status was ranked near the bottom of the 14, well below doctors, engineers, lawyers and accountants and only above librarians, social workers and web designers. There were also large differences across nations; China, Malaysia, Taiwan and Indonesia respect their teachers more than other countries, Brazil and Israel were at the lower end of the Teacher Status Index, and the U.S was in the middle.
Given this relative lack of professional legitimacy and prestige, social scientists have argued that the status and social role of teaching has been akin to that of a “semi-profession” in the U.S. [57,58,59]. The persistence of this view may discourage some males from entering teaching.
In addition to financial and status factors, the persistence of social pressures surrounding the gender roles could also be a factor discouraging males from becoming teachers—especially at the elementary school level. An insightful field study conducted over three decades ago found that enduring gender stereotypes made it very difficult for males to teach in elementary schools, despite a strong desire from the public to employ more male teachers in elementary schools [60]. Male elementary school teachers faced suspicion and distrust, especially from female teachers, who felt that men were simply not suited to work with young children. It is unclear whether such attitudes still persist and it might be illuminating if this study were to be updated and replicated in today’s schools. Interestingly, some recent research has found that socialization factors such as parental influence may be partly responsible for the continued gender homogeneity of the teaching profession, as the children of teachers are disproportionately likely to also become teachers [61].
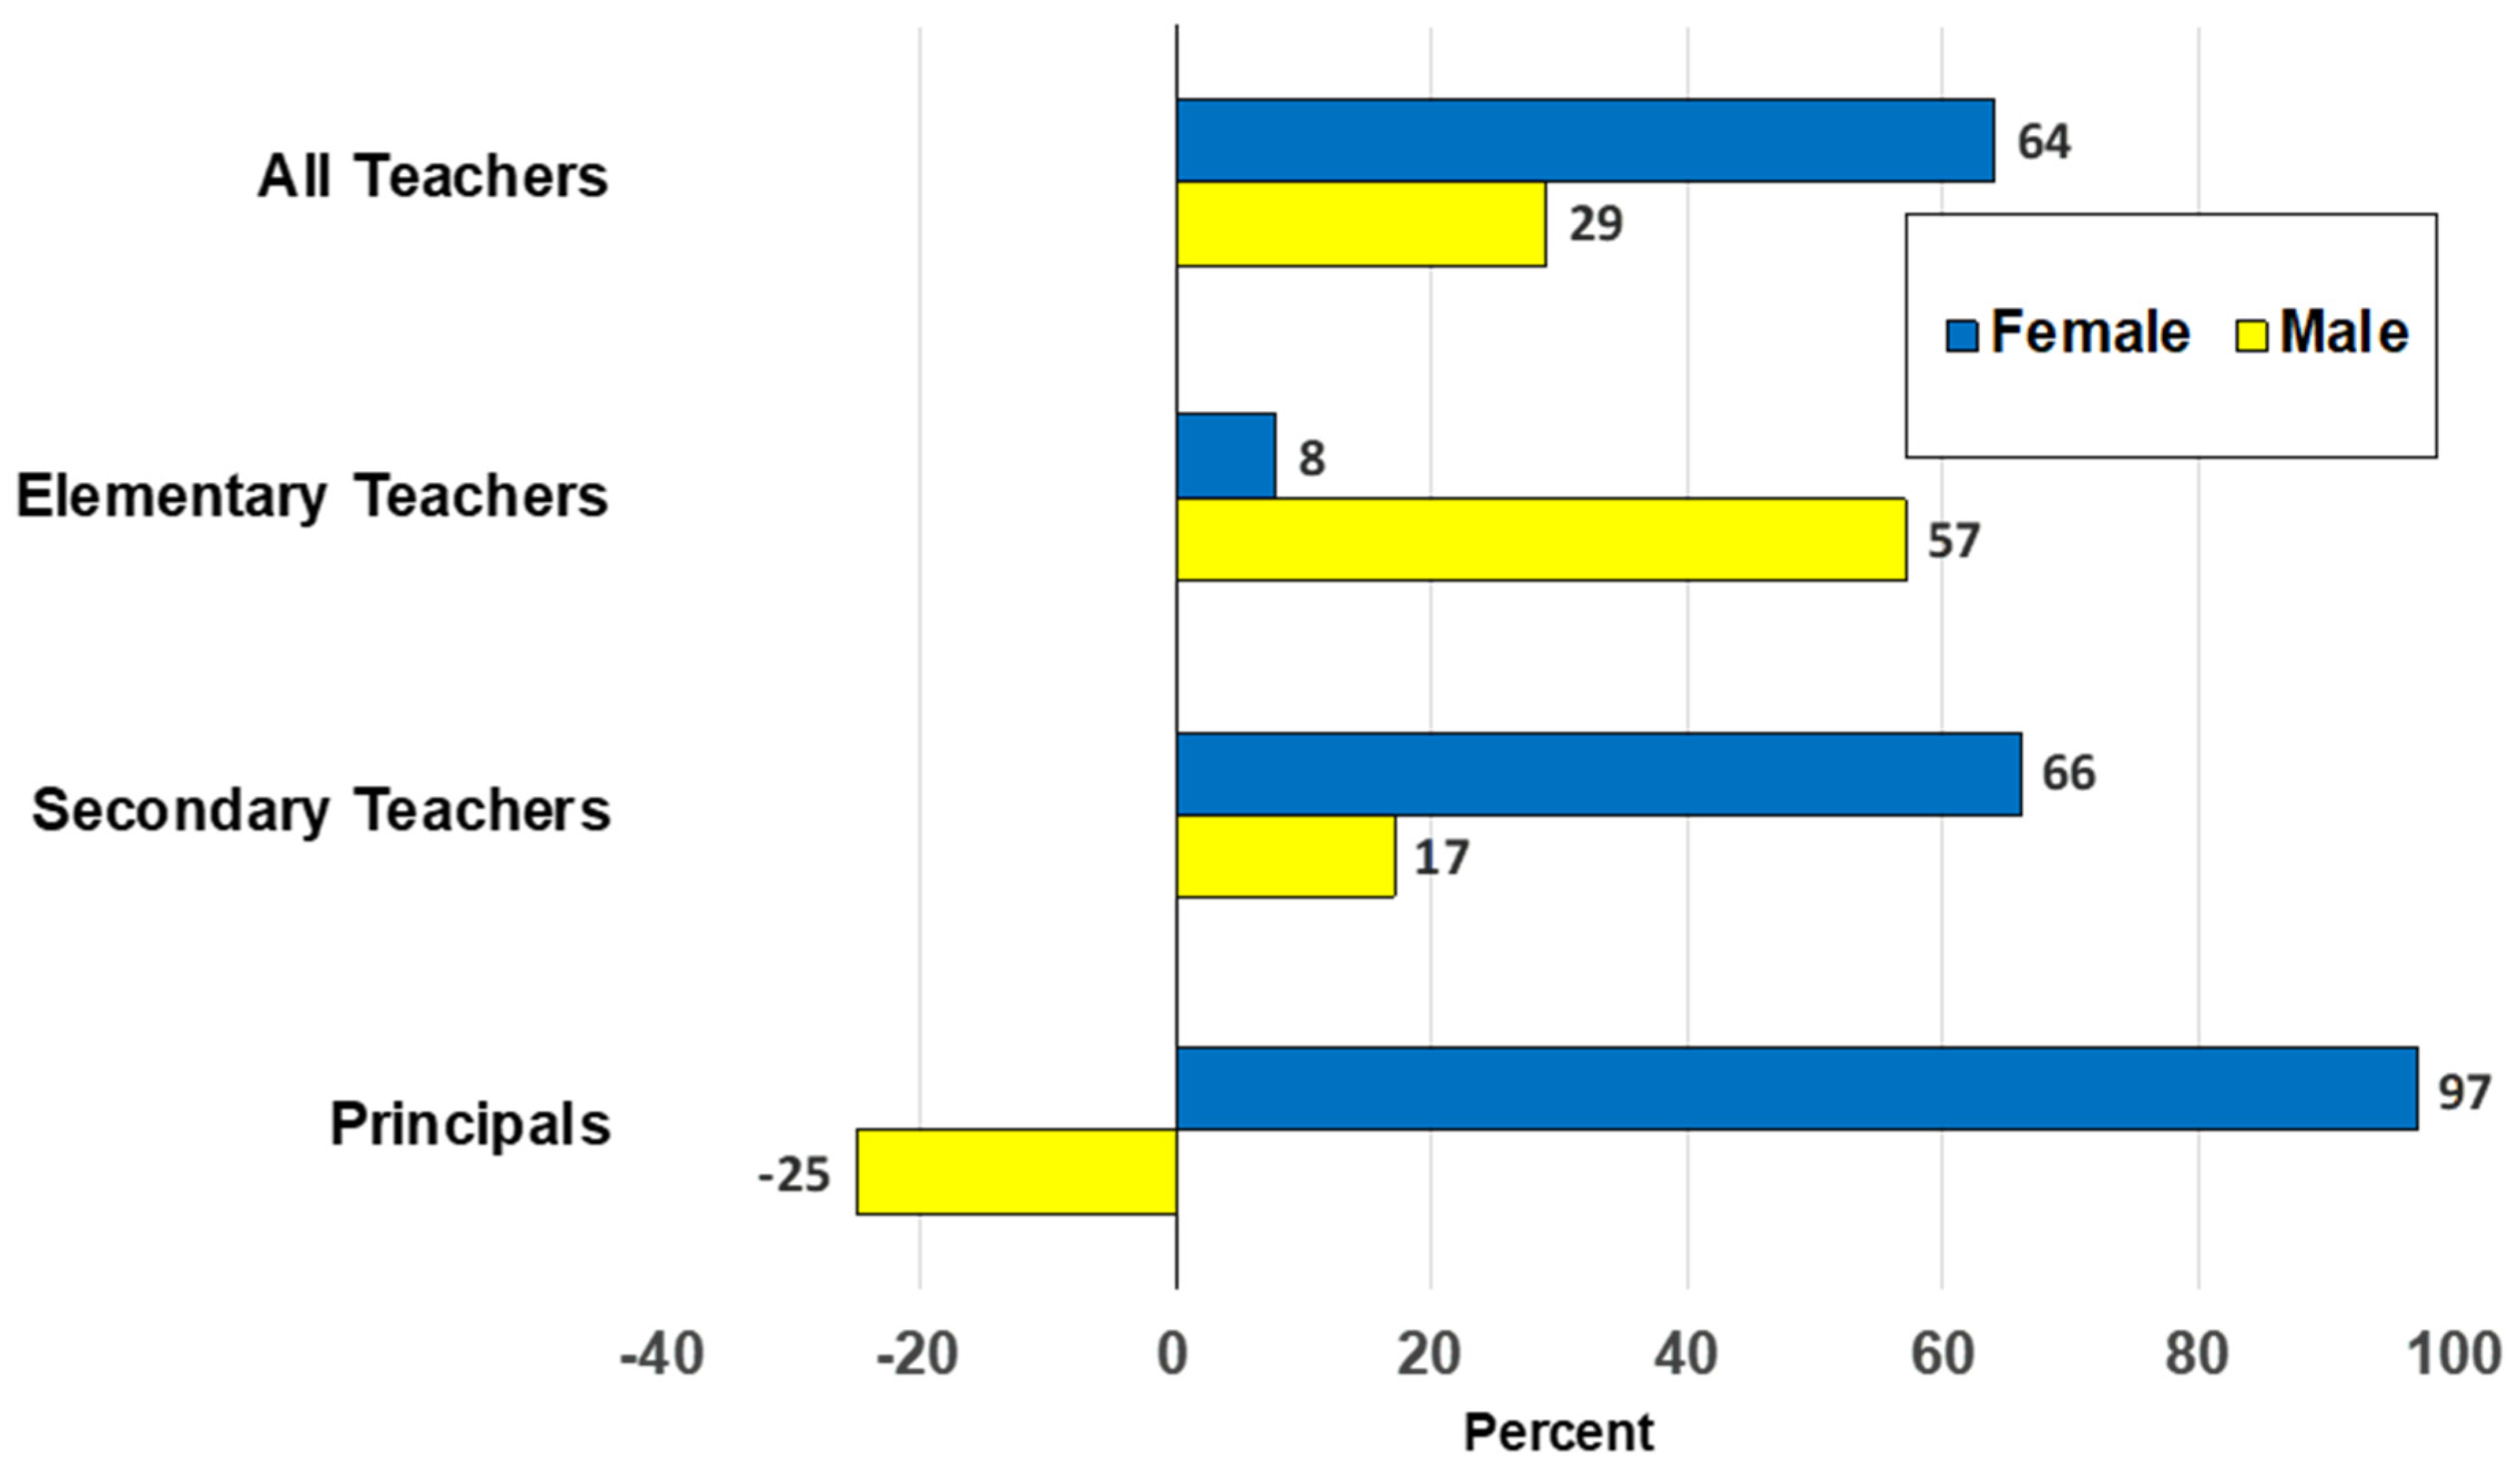
However, it is possible the influence of gender roles and their associated financial, status, and social pressures, in dissuading males from entering teaching, has diminished over time. The data show that the increase in the female-to-male ratio in teaching is not due to a decrease in males entering, or an increase in males exiting, the occupation. While the data show that the elementary school teaching force remains overwhelmingly female (89% in 2017–2018), there has been a strong increase (57%) in the number of male teachers employed in elementary schools in the past three decades (Figure 8). Many of these males are employed as elementary enrichment/subject specialists, a high-growth field (see Figure 3). Moreover, the TFS data show that there is little difference in the turnover rates of male and female teachers. The number of male teachers employed in schools has grown overall by 29 percent since the late 1980s, which is also faster than the rate of increase in the student population (22%). The increase in the female-to-male ratio in teaching is because the number of females in teaching has increased at over twice the rate of males (see Figure 8). Rather than males being increasingly “pushed back”, or “pushed out”, it may be that females are increasingly being “pulled into” teaching.
(2). A second possible hypothesis for the increase in the female-to-male ratio in teaching could be a variant of the above mentioned increasing-career-opportunities hypothesis—females have other employment options in general, but also growing opportunities in the educational sector, both at the secondary level and in leadership. The increase in female teachers is not spread evenly across teaching fields, levels and roles within schools. As shown in Figure 8, increases in the proportion of female teachers have been concentrated at the secondary level, where the majority of teachers were male until the late 1970s. The largest increase in the representation of females in particular fields has been in mathematics and science. In the period 1987–1988, these were both male-dominated fields. By 2017–2018 approximately two-thirds of math and science teachers were female. Moreover, as shown in Figure 3, these have both been high-growth fields.
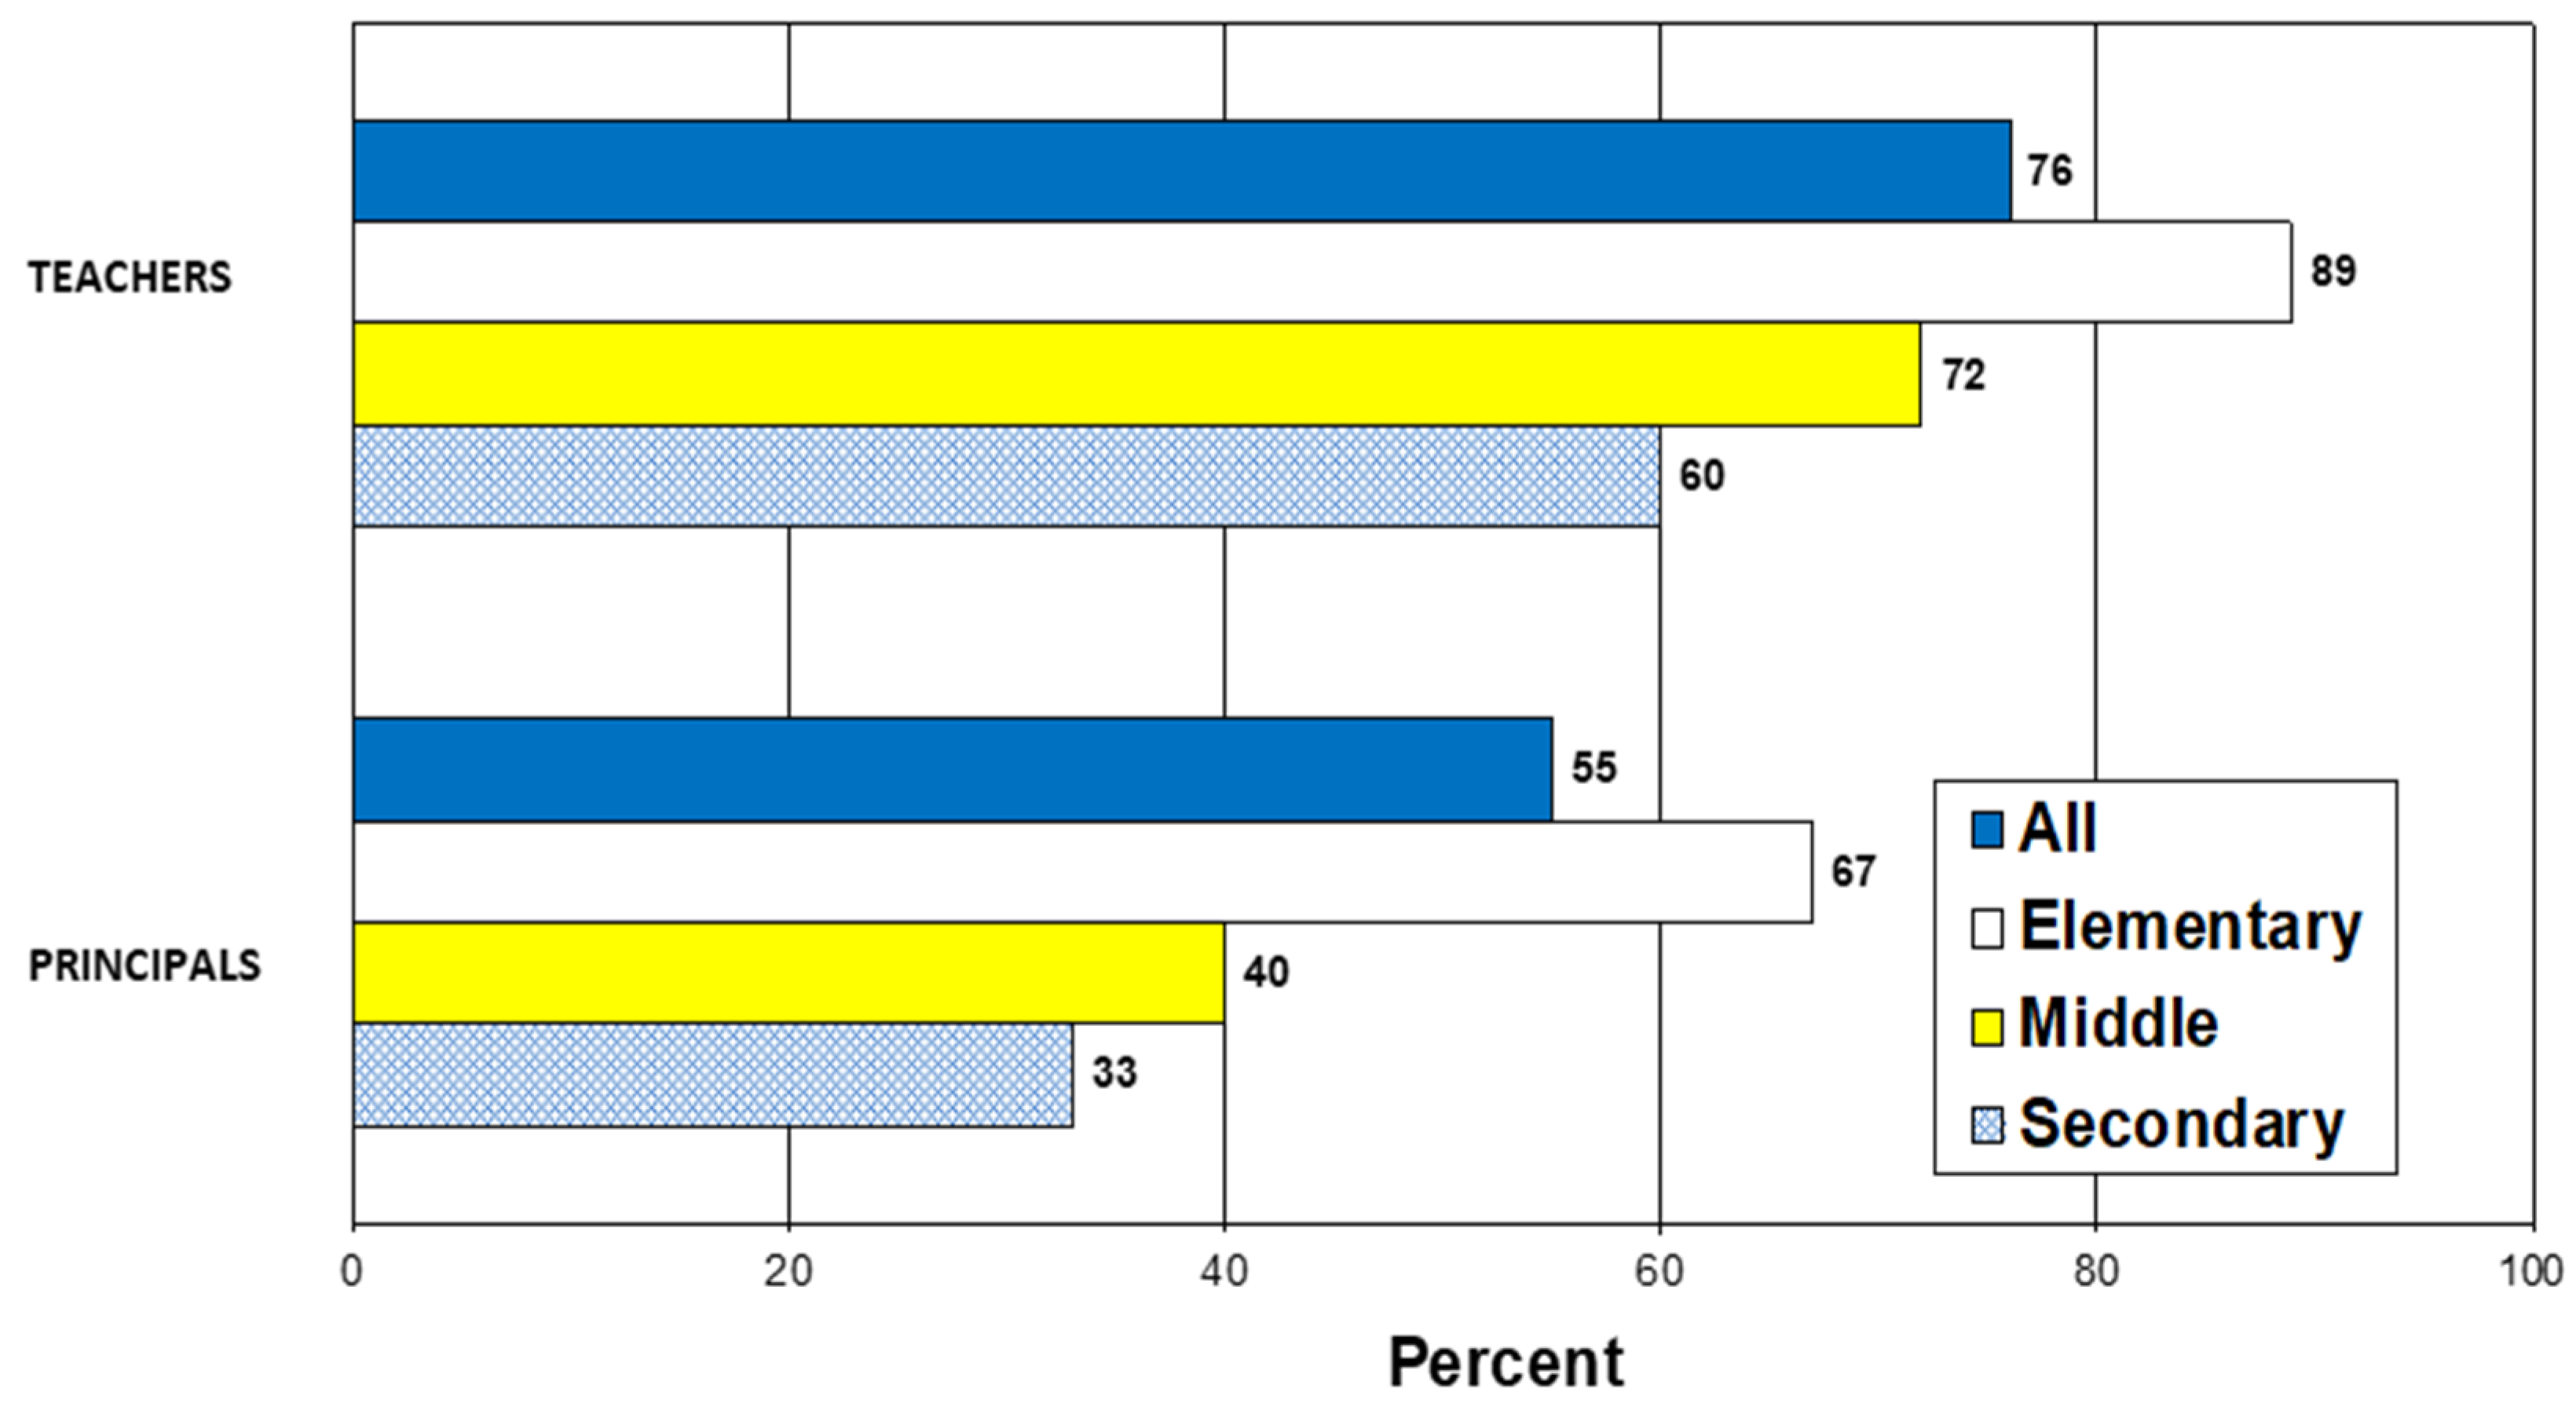
As also shown in Figure 8, there have been far sharper increases in the proportion of female school heads—principals. By 2017–2018, over half of all school principals were female, up from 31 percent in the period 1987–1988, although the distribution of female principals varies by school level, as it does for teachers (see Figure 9). There has also been a similar increase in females at the position at top of the hierarchy in local educational agencies—school superintendents. Data from the American Association of School Administrators show that, while superintendents remain predominantly male, there has been an increase in the numbers of females holding these positions over the past five decades—from 1.2 percent in 1982 to 27 percent in 2020 [62].
The trend in female school leaders could be a factor in the recruitment, as well as the retention, of females, including those of high academic ability—an issue we address in Trend 6. Historically, while teaching was designed as a predominantly female occupation, educational administration was designed to be “men’s work” [38,40]. Part of the rationale was that the recruitment and retention of capable males in schools required a career ladder with opportunities for advancement and enhancement in status, pay, and authority. Likewise, the contemporary opening up of educational management and leadership to women—demonstrated by the rapid growth in the numbers of female school leaders—could be one possible explanation for the continuing attraction of teaching and education careers for women, despite the growth of other employment opportunities.
(3). A third hypothesis to explain the increase in the female-to-male ratio in teaching might be that the overall proportion of adult women obtaining college degrees, and entering the paid workforce, has dramatically increased over the past four decades. Hence, while women have more job choices than in the past, the large overall increase in women with college degrees and women seeking employment may be partly responsible for the increase in females entering teaching.
Data from the NCES’ Integrated Postsecondary Education Data System show that since the late 1990s over half of college Bachelor’s degrees in any given year are awarded to women [63]. This is especially the case for degrees in education. In 2018, approximately 43 percent of all Bachelor’s degrees awarded in the U.S. went to males, while only approximately 18 percent of Bachelor’s degrees in education awarded went to males. Moreover, the above cited data from the Bureau of Labor Statistics indicate that in a number of specific occupations and professions the number of women has gone up at a faster rate than in teaching [7].
But the data also show that the number of women in teaching has continued to increase at a rapid rate. The number of women employed in the U.S. labor force overall increased by 36 percent between 1988 and 2016, from 55 million to 74 million. However, the number of women in K-12 public school teaching increased by more than twice that rate during the same period. The proportion of all employed females who were teachers rose from 3 percent to 3.9 percent during the same period. That is, teaching’s share of employed women has gone up, not down, during the same time that the number of women dramatically increased in many male-dominated occupations and professions. It appears that the increase in women in teaching is more than simply a result of more women obtaining college degrees and entering the labor force.
(4). Finally, a fourth possible hypothesis for the increasing proportion of female teachers might have to do with negotiating the dual roles of homemaker and breadwinner—the fit between work-life and family life. Scholars have long held that an important factor behind the high proportion of women in teaching over the past century was the perception of a relatively workable fit between the job of teaching and the work of child rearing [38,39,40,41,49]. Compared to many lines of work, teaching has long been characterized as a relatively flexible, easy entry/easy exit/easy re-entry occupation, with fewer career and financial penalties for temporary leaves, such as for raising children [44,48,64]. Moreover, given the perception of a shorter workday and summers off, caring for family was thought to be more manageable for teachers than for those in many other jobs and careers. Given the continuing disproportionate responsibility on the part of women for the domestic labor and childrearing in families [50,65], this perceived workday structure may still be disproportionately attracting women to teaching and hence a factor in the increase in the female-to-male ratio. But it is also important to recognize that teaching may not be as amenable to family life as this perception and stereotype holds, given the SASS/NTPS data documenting that teachers in the U.S. typically work more than a 40 hour week and many seek additional employment during the school year and in the summer.
What are the implications of this trend?
One set of questions raised by the data concerns the possible implications for students of the increasing female-male ratio in teaching. If the trend continues, 8 of 10 teachers in the U.S. may soon be female. A large percentage of elementary schools will have few, if any, male teachers. An increasing number of students may encounter few male teachers during their time in either elementary or secondary school. Given the importance of teachers as role models, and even as surrogate parents for some students, certainly some may see this trend as a problem and a policy concern.
Another set of questions raised by the data concerns the implications of an increase in the female-male ratio for the stereotype of teaching as “women’s work” and for the future status and standing of teaching as an occupation. The direction of causality and of the relationships between gender, pay and occupational status are a source of debate, but as discussed above, scholars have long documented that female-dominated occupations are more likely to have lower salaries and more likely to be held in lower esteem than many male-dominated well-established professions [45,46,50,51,59,61]. This raises a troubling question: if teaching continues to become an increasingly female-dominated occupation, would this lead to a further solidification of the stereotype of teaching as “women’s work”, and in turn, make it harder in the future for teaching to improve its pay and its’ status as a respected profession in the U.S.?
3.5. Trend 5: More Diverse, by Race/Ethnicity
While the teaching force is becoming more homogenous gender-wise, the opposite is true for the race/ethnicity of teachers. At first this finding may also seem surprising. For several decades, shortages of minority teachers have been a major issue for U.S schools. It is widely held that, as the nation’s population and students have grown more racially/ethnically diverse, the teaching force has not kept pace. The result, in this view, is that minority students in the nation’s schools increasingly lack minority adult role models, lack contact with teachers who understand their racial and cultural background, and often lack access to qualified teachers of any background, because white teachers eschew schools with large percentages of minorities [66,67,68,69,70,71,72,73]. This minority teacher shortage, in turn, is widely viewed as one of a number of key factors behind the minority achievement gap and, ultimately, unequal occupational and life outcomes for minority students [74,75,76,77]. In response, in recent decades, numerous government and nongovernment organizations have instituted and funded a variety of programs and initiatives to recruit minorities into teaching. Moreover, often these efforts seek to place these new teachers in schools serving disadvantaged and minority student populations. By 2008, over half of the states had some kind of minority teacher recruitment policies or programs in place. (Throughout this report, we use U.S. Census Bureau classifications of race/ethnicity: “Minority” includes those identified as: Black/African American; native Hawaiian/Pacific/Islander and Asian; Native American/Indian/Alaska Native; Hispanic/Latino; and those of multiple races. “Hispanic/Latino” refers to ethnicity and includes those of all races. Over half of those identifying as Hispanic also identify as White. Hence, the term “person of color” is not synonymous with minority, and, following Census Bureau usage, we will not use the former term.)
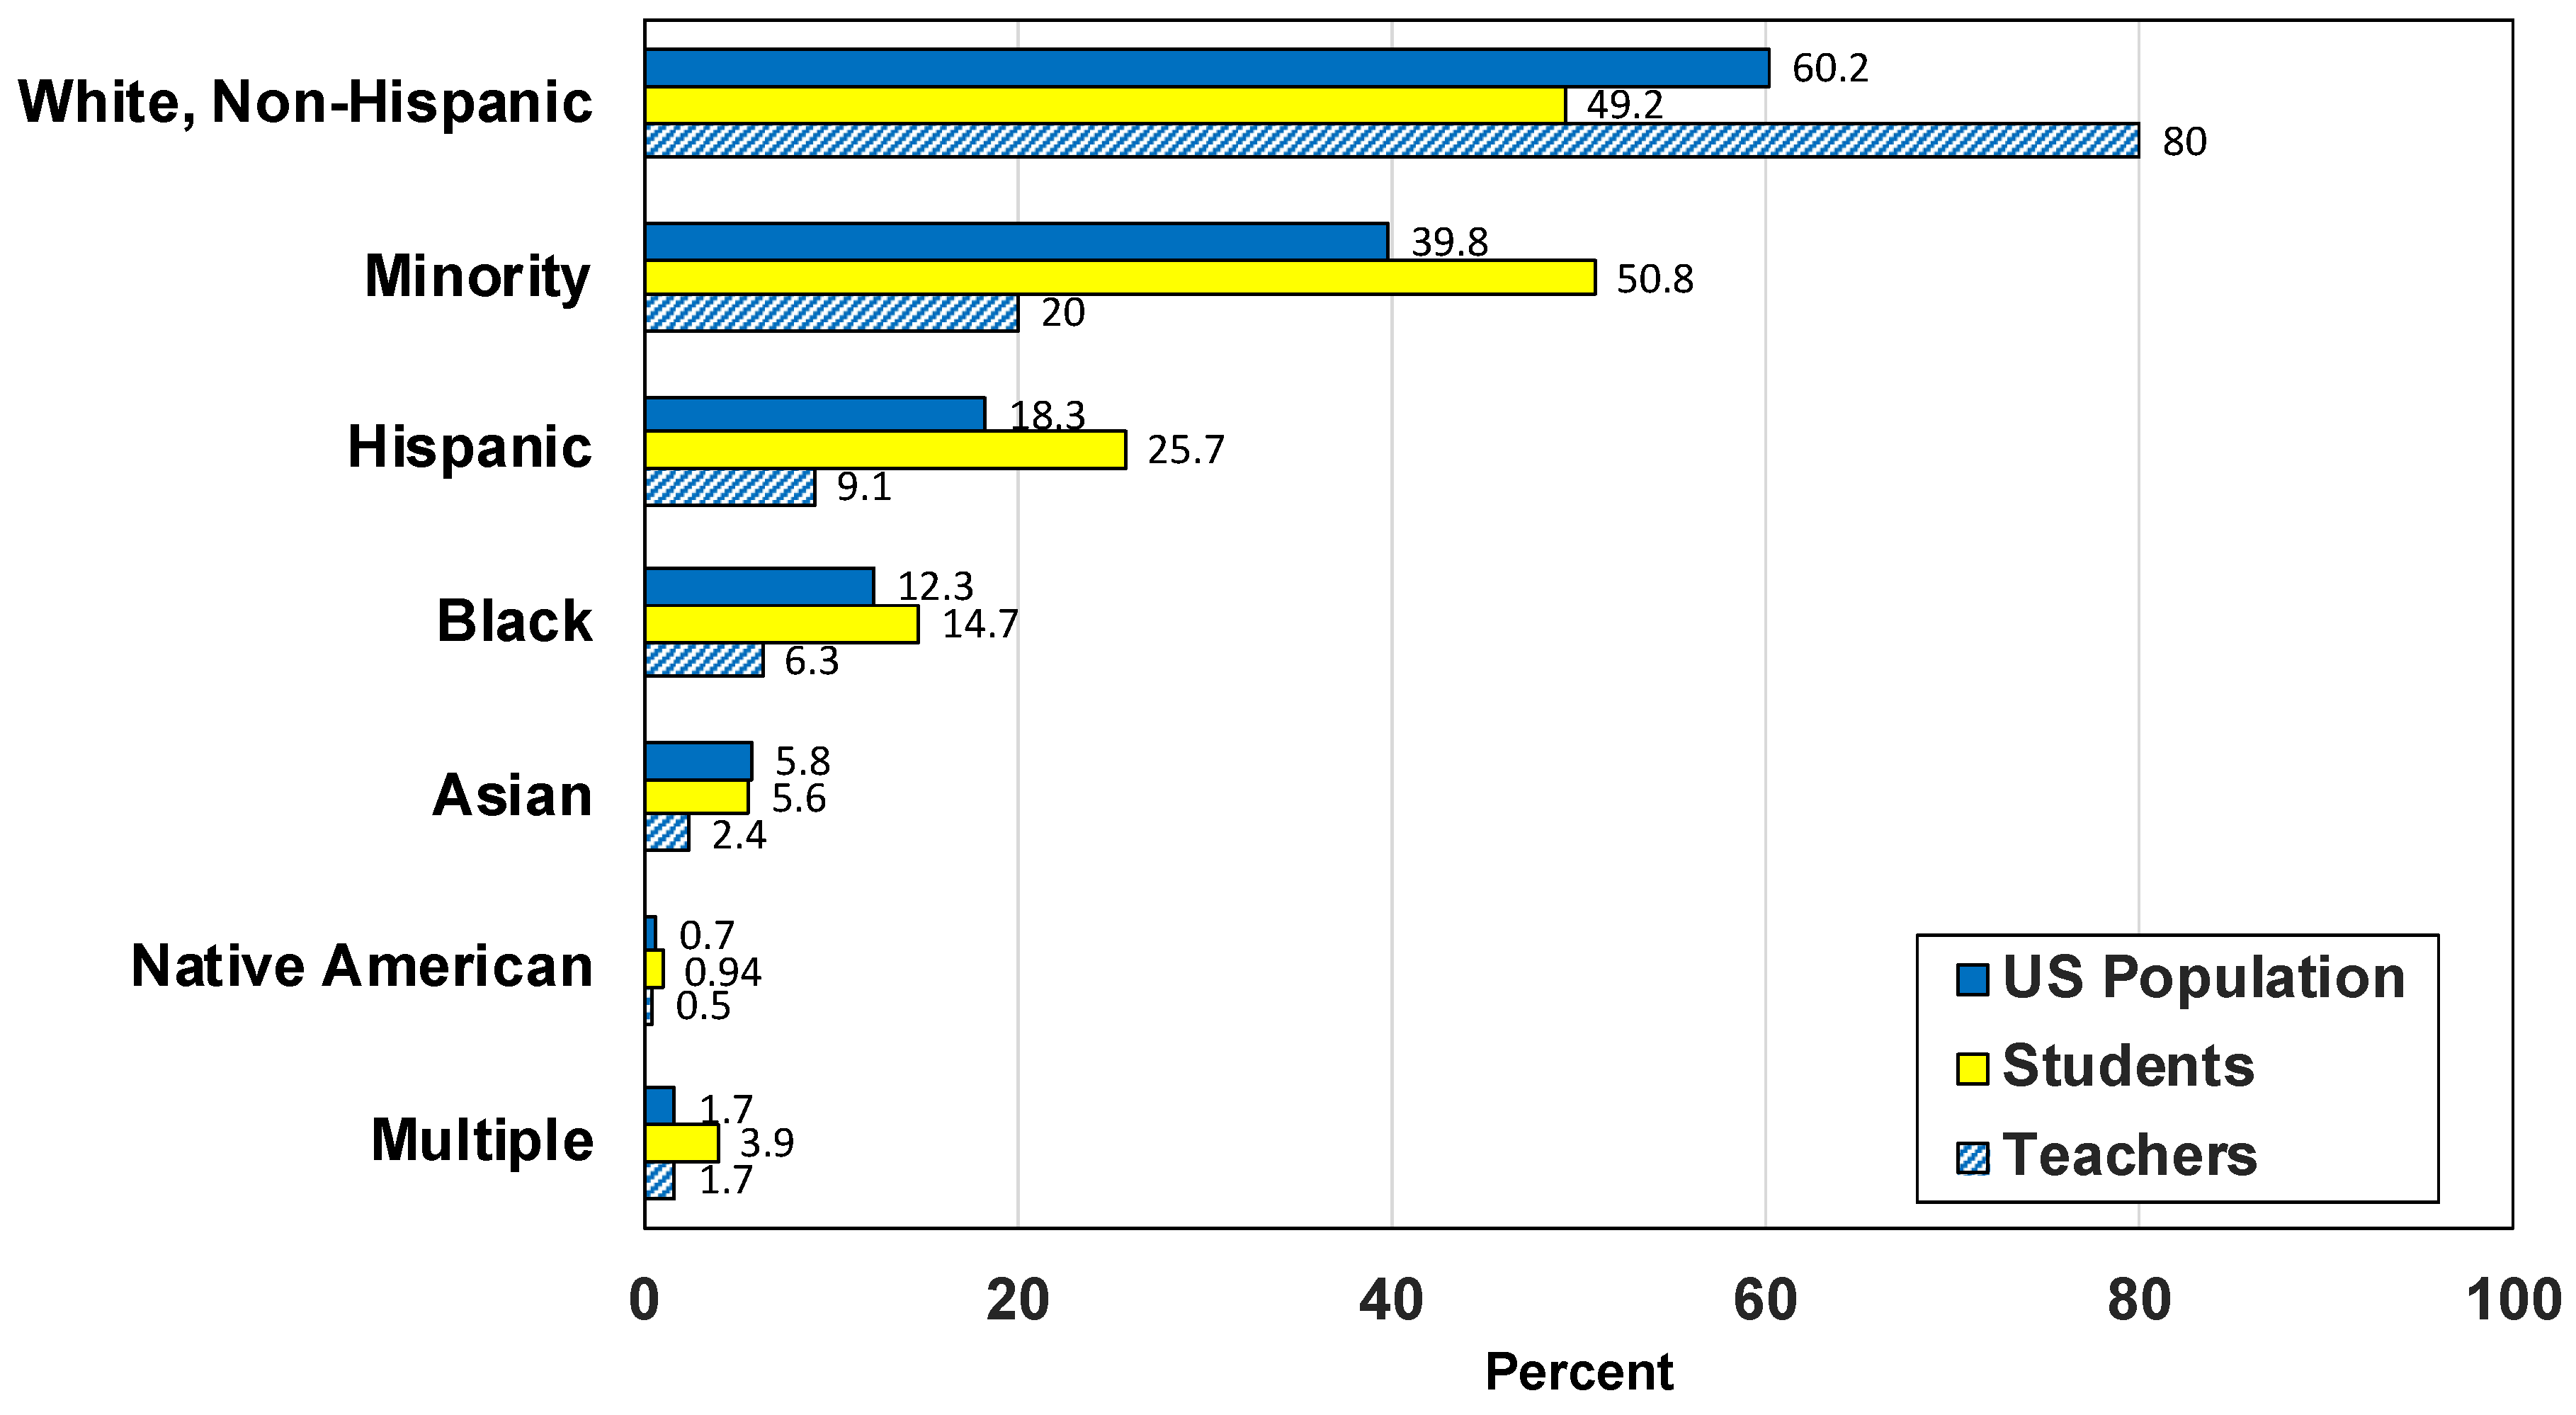
However, our extensive analysis of national data show that this portrait is changing [78,79]. Our data analyses confirm that teachers remain a primarily White, non-Hispanic workforce and that a parity gap continues to persist between the percentage of minority students and the percentage of minority teachers in U.S. schools. For instance, in the 2017–2018 school year, approximately 40 percent of the nation’s population belonged to minority groups, 51 percent of all elementary and secondary school students were minority, but only 20 percent of all elementary and secondary school teachers were minority (see Figure 10). Moreover, this gap between percentages of students and teachers holds for each of the main minority groups—Black, Hispanic, Asian, and Native American.
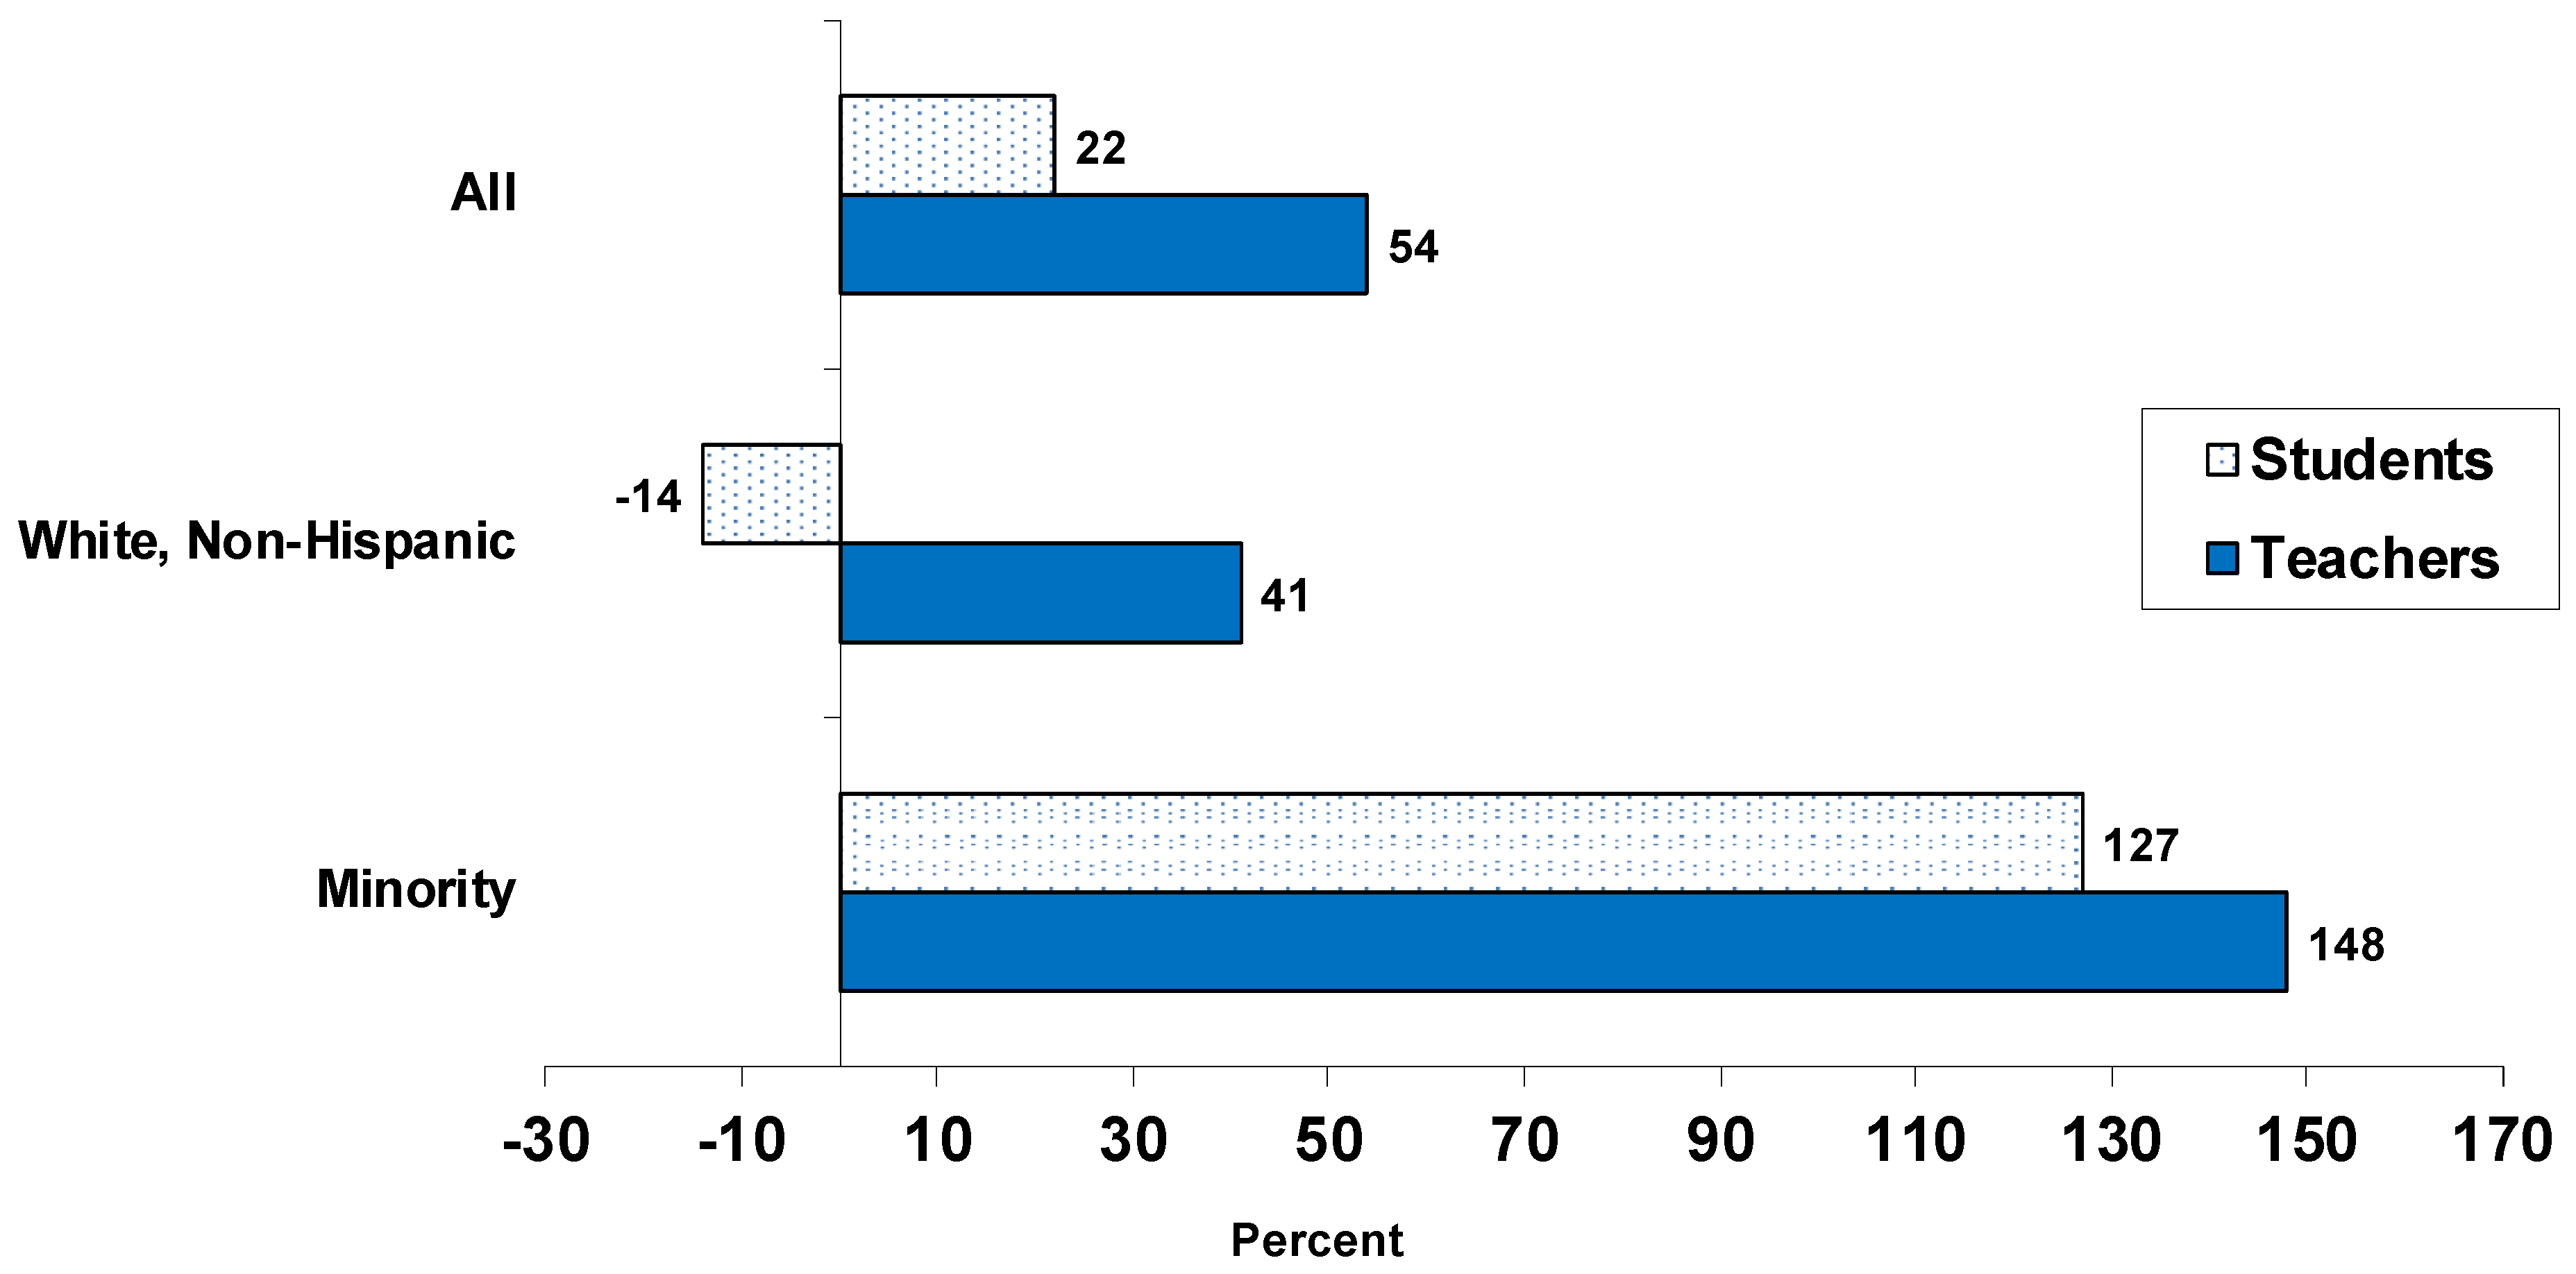
But the data also show that this parity gap is not due to a failure to recruit minority teachers. The gap has persisted in recent years largely because the number of white, non-Hispanic students has decreased, while the number of minority students has increased. The percent of all teachers who belonged to minority groups increased from 12.5 percent in the period 1987–1988 to 20 percent in the period 2017–2018. Growth in the number of minority teachers outpaced growth in the number of minority students and was more than three times the growth rate of white teachers (see Figure 11). Moreover, during this period, increases in teachers outpaced increases in students for Blacks, Hispanics, and Asians. However, the data also show large differences in the pace of these teacher increases by group. For instance, the number of Black teachers increased by 29 percent, the number of Asian teachers increased by 263 percent, while the number of Hispanic teachers increased by 373 percent [78,79].
Moreover, these percentages do not take into account the ballooning of the teaching force. Since the teaching force has dramatically grown, numerically there are far more minority teachers than before. In the period 1987–1988, there were approximately 327,000 minority teachers employed in public and private schools; by 2017–2018, there were over 810,000 minority teachers. Our data also show that the increase in the number of minority teachers has not been even across different types of schools. Most of the increase has been in higher-poverty public schools [1]. Minority teachers are two to three times more likely than white teachers to work in hard-to-staff schools serving high-poverty, high-minority, and urban communities.
This increase in the number of minority teachers has been something of an unheralded victory. Commentators and researchers have tended to discuss the minority teacher shortage and the outcome of minority recruitment efforts in dire and pessimistic terms. However, although the proportion of minority students in schools is still far greater than the proportion of minority teachers (Figure 10), the teaching force has in fact grown more diverse. While we have not evaluated the efficacy of particular programs, our data suggest that the widespread efforts over recent decades to recruit more minority teachers and place them in schools serving disadvantaged and minority student populations appear to have made a difference. Moreover, given the continued parity gap, the data suggest that it would be worthwhile to continue such efforts.
However, while minority candidates have entered teaching at higher rates than whites in recent decades, the data also show that the rates at which minority teachers depart from schools is higher, at a statistically significant level, than that of white teachers, and has also been increasing. In the decades from the late 1980s to 2012–2013, the annual rate of minority teacher turnover from public schools increased by 45 percent, undermining minority teacher recruitment efforts [78,79]. Indeed, the diversification of the teaching force is all the more remarkable because it has occurred in spite of the high turnover rate among minority teachers. Our data suggest that ameliorating the minority teacher shortage will require focusing on both minority teacher recruitment and teacher retention. We return to the issue of minority teacher turnover in Trend 7.
3.6. Trend 6: Consistent Academic Ability
It has long been held that higher academic achieving college students—“the best and brightest”—are likely to find elementary and secondary teaching less attractive than other career and job options in the U.S. [19,44,47], as well as England [80]. Over the years, data from different sources have seemed to confirm this. For instance, based on the assumption that academic ability is accurately captured by standardized tests, a number of analyses have shown that the Scholastic Assessment Test (SAT)/American Collegiate Test (ACT) and other standardized college entrance exam scores of college graduates going into teaching have long been well below the average for college graduates [81]. In our own analyses of national data on college seniors from the NCES’ Baccalaureate and Beyond Survey (in both 1999–2000 and 2007–2008), we found that this was especially true for those majoring in Education, who tended to have among the lowest average SAT scores. Moreover, within most fields and majors, we found that those who became teachers had lower SAT scores than those in the same field/major who did not go into teaching.
Not only do teachers tend to have below-average academic test scores, some researchers and commentators maintain that the academic ability of teachers has been declining over time—and that gender is at the root of the issue. While the number of women going into teaching has increased, as discussed in Trend 4, proponents of this view have argued that the academic quality of women who choose to go into teaching has gone down. With alternative careers and jobs increasingly available, this view holds that the “best and brightest” women have decreasingly entered traditionally female-dominated occupations and professions, such as teaching [82,83]. As mentioned, some have argued that women essentially subsidized the U.S. education system for most of the previous century because they were relatively high-ability employees working for relatively low wages. But, the argument continues, this subsidy has stopped, and as a result, the academic caliber of the female portion of the teaching force has declined in recent years [47,48].
In the data, however, support for this proposition appears to be mixed. For instance, using longitudinal survey data of birth cohorts from the 1940s to 1990, Bacolod (2007) found that females within the top quintile of standardized test results increased as a share of professionals while decreasing as a share of teachers. Similarly, another study looking at trends in female standardized test scores from the 1960s to 2000 found a decline in the proportion of female teachers who scored in the high deciles [83]. But another study with data from the Educational Testing Service (ETS) showed no decline in SAT scores of teachers as a whole from the mid-1990s to the mid-2000’s [84].
Of course, we cannot assume that either the “best and brightest,” or those scoring higher on standardized tests, are the best or the most effective teachers. Accurately measuring both academic ability and teaching quality are subjects of controversy. Moreover, the relationship between them is unclear. But academic ability is often assumed to be an important indicator of both the caliber of employees in any line of work and the attractiveness of an occupation or profession.
We examined these trends using another possible measure of academic ability—the selectivity or competitiveness of one’s undergraduate institution, which is no doubt correlated with SAT/ACT and other standardized college entrance exam scores. The measure we used is Barron’s six-category ranking of colleges and universities: most competitive, highly competitive, very competitive, competitive, less competitive, not competitive [85]. The top two categories have accounted for approximately 14 percent of institutions and approximately 21 percent of undergraduates. The bottom two categories have accounted for approximately 19 percent of institutions and approximately 13 percent of undergraduates.
What did we find?
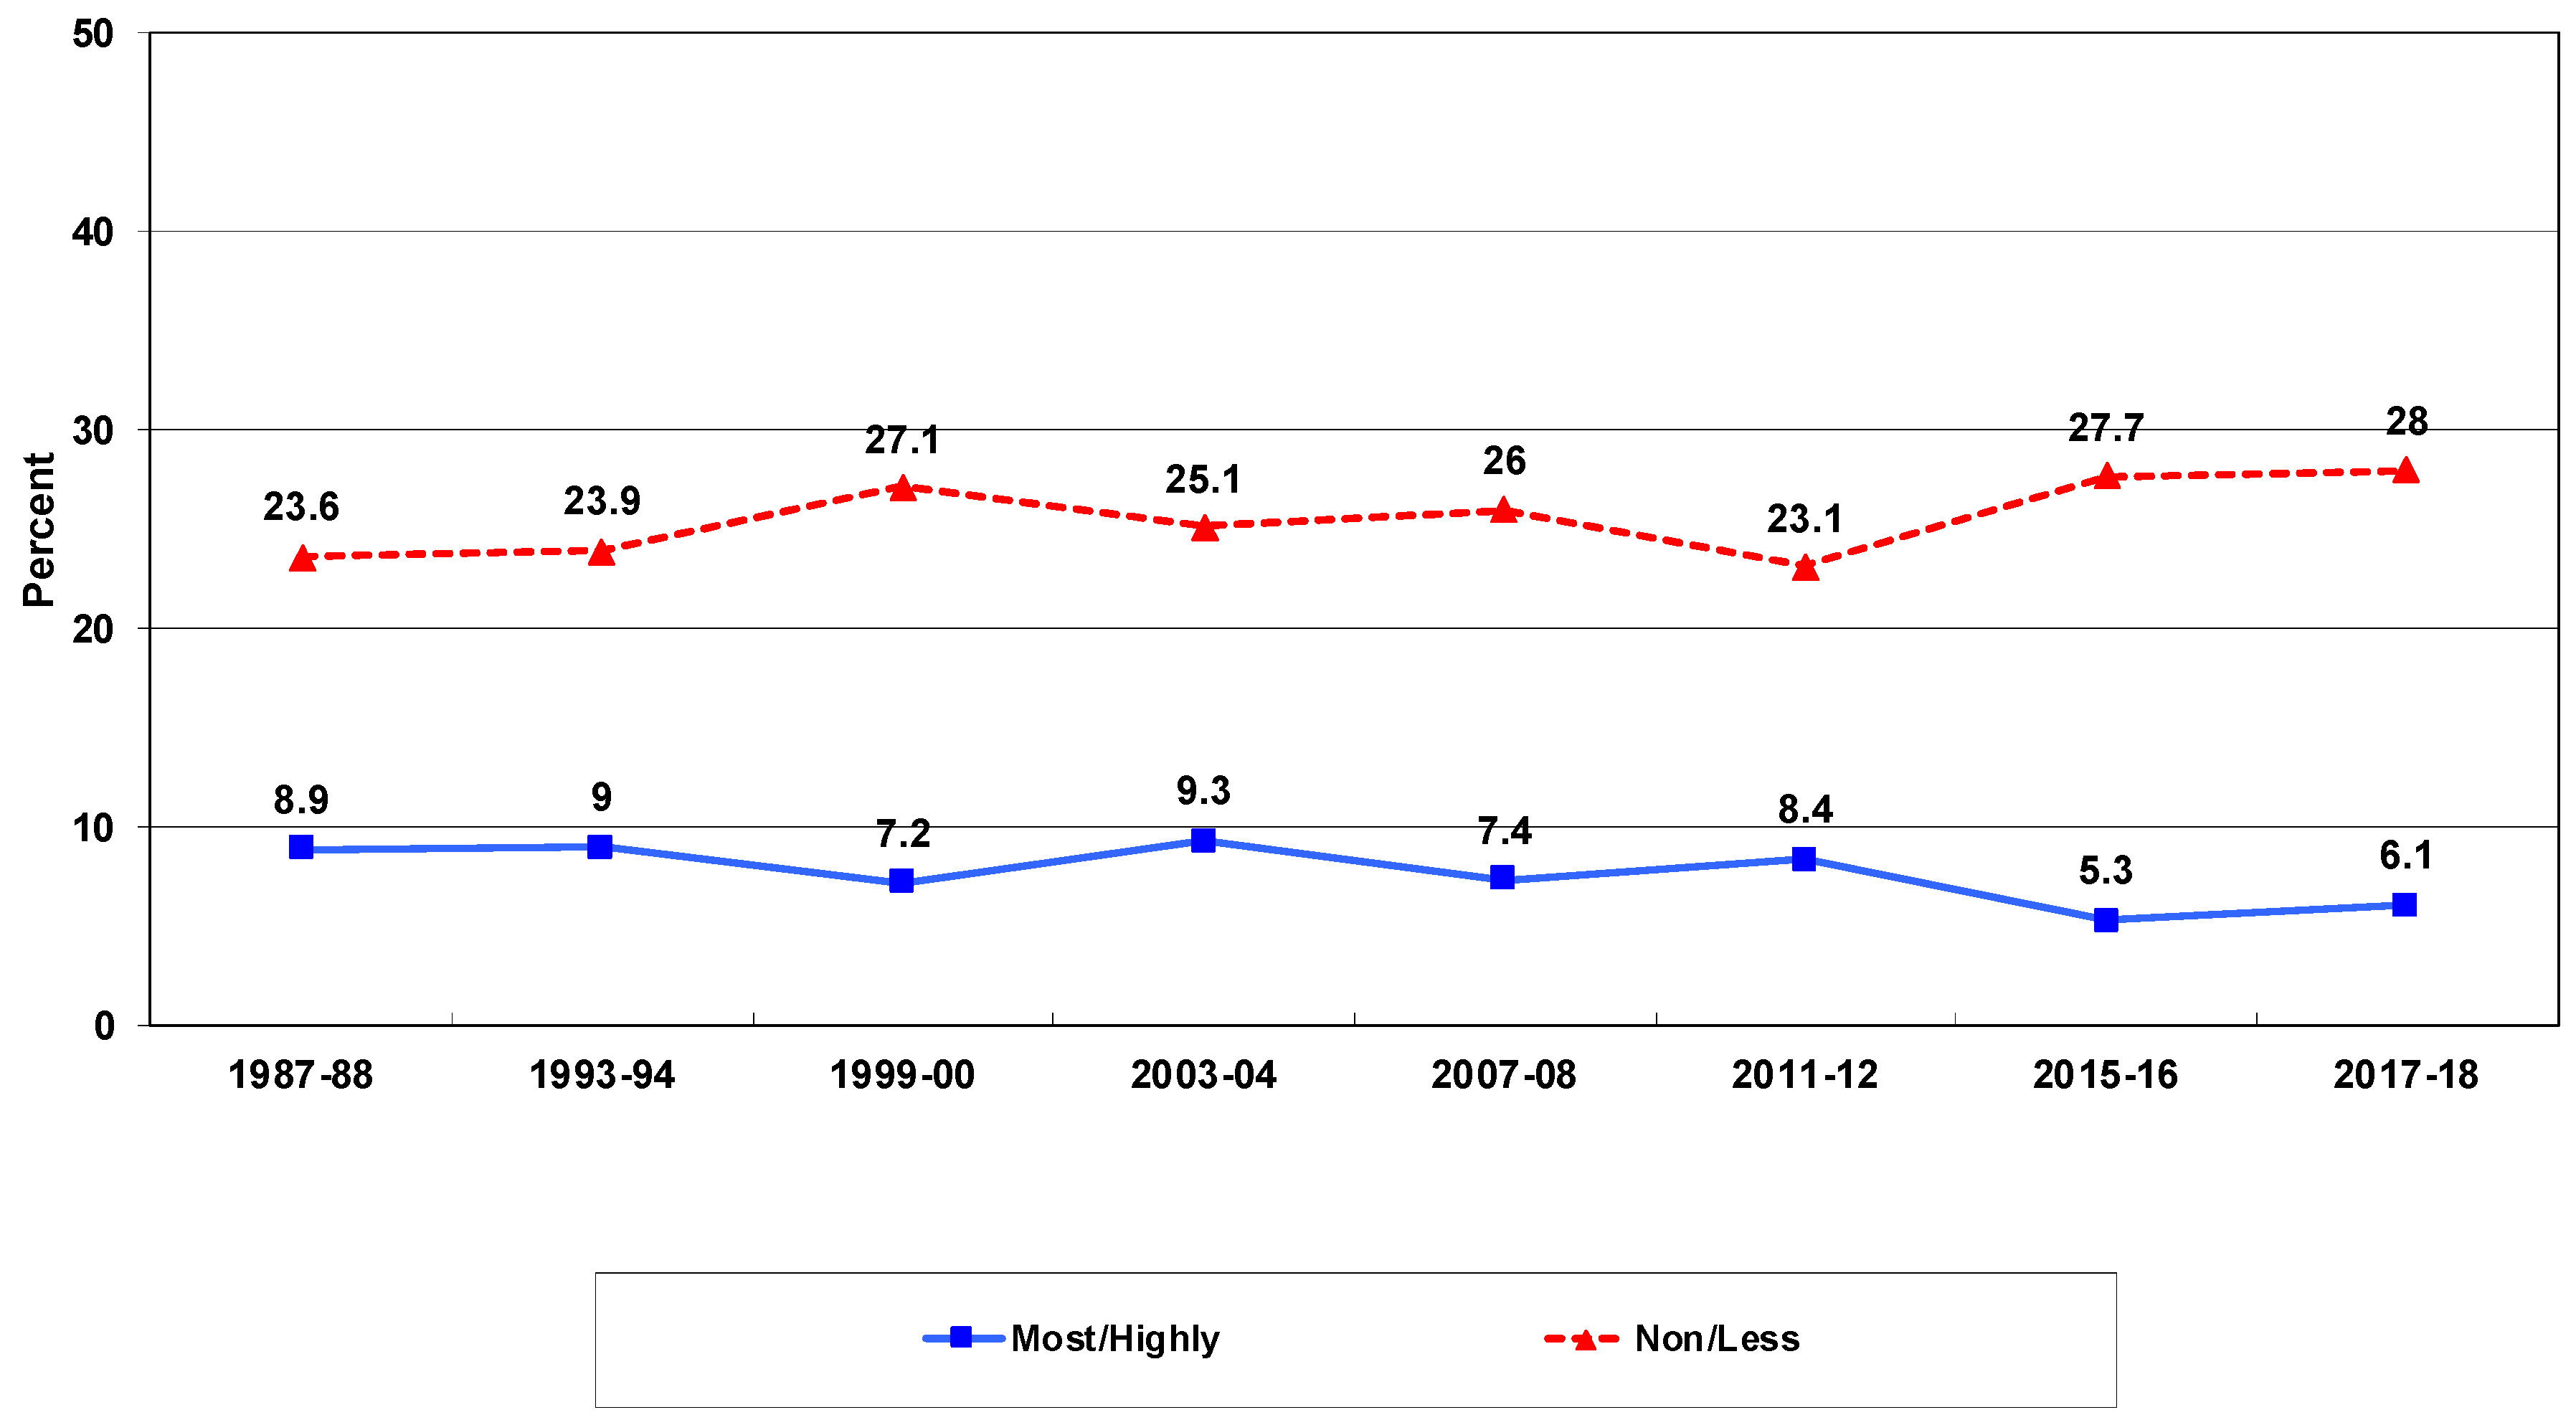
Under one tenth of newly hired first-year public school teachers come from the top two categories of higher education institutions. Because in some of the data cycles there is a large amount of missing data on undergraduate institutions for private teachers, for this trend we only report data for public school teachers. Approximately one-quarter come from the bottom two categories. Approximately two-thirds of first-year teachers come from middle-level institutions. From 1988 to 2018 these proportions tended to fluctuate both up and down slightly, but over this three decade period, it appears that there has been a slight overall increase in the proportion of new teachers from the least selective colleges and a slight overall decrease in the proportion from the most selective schools (see Figure 12).
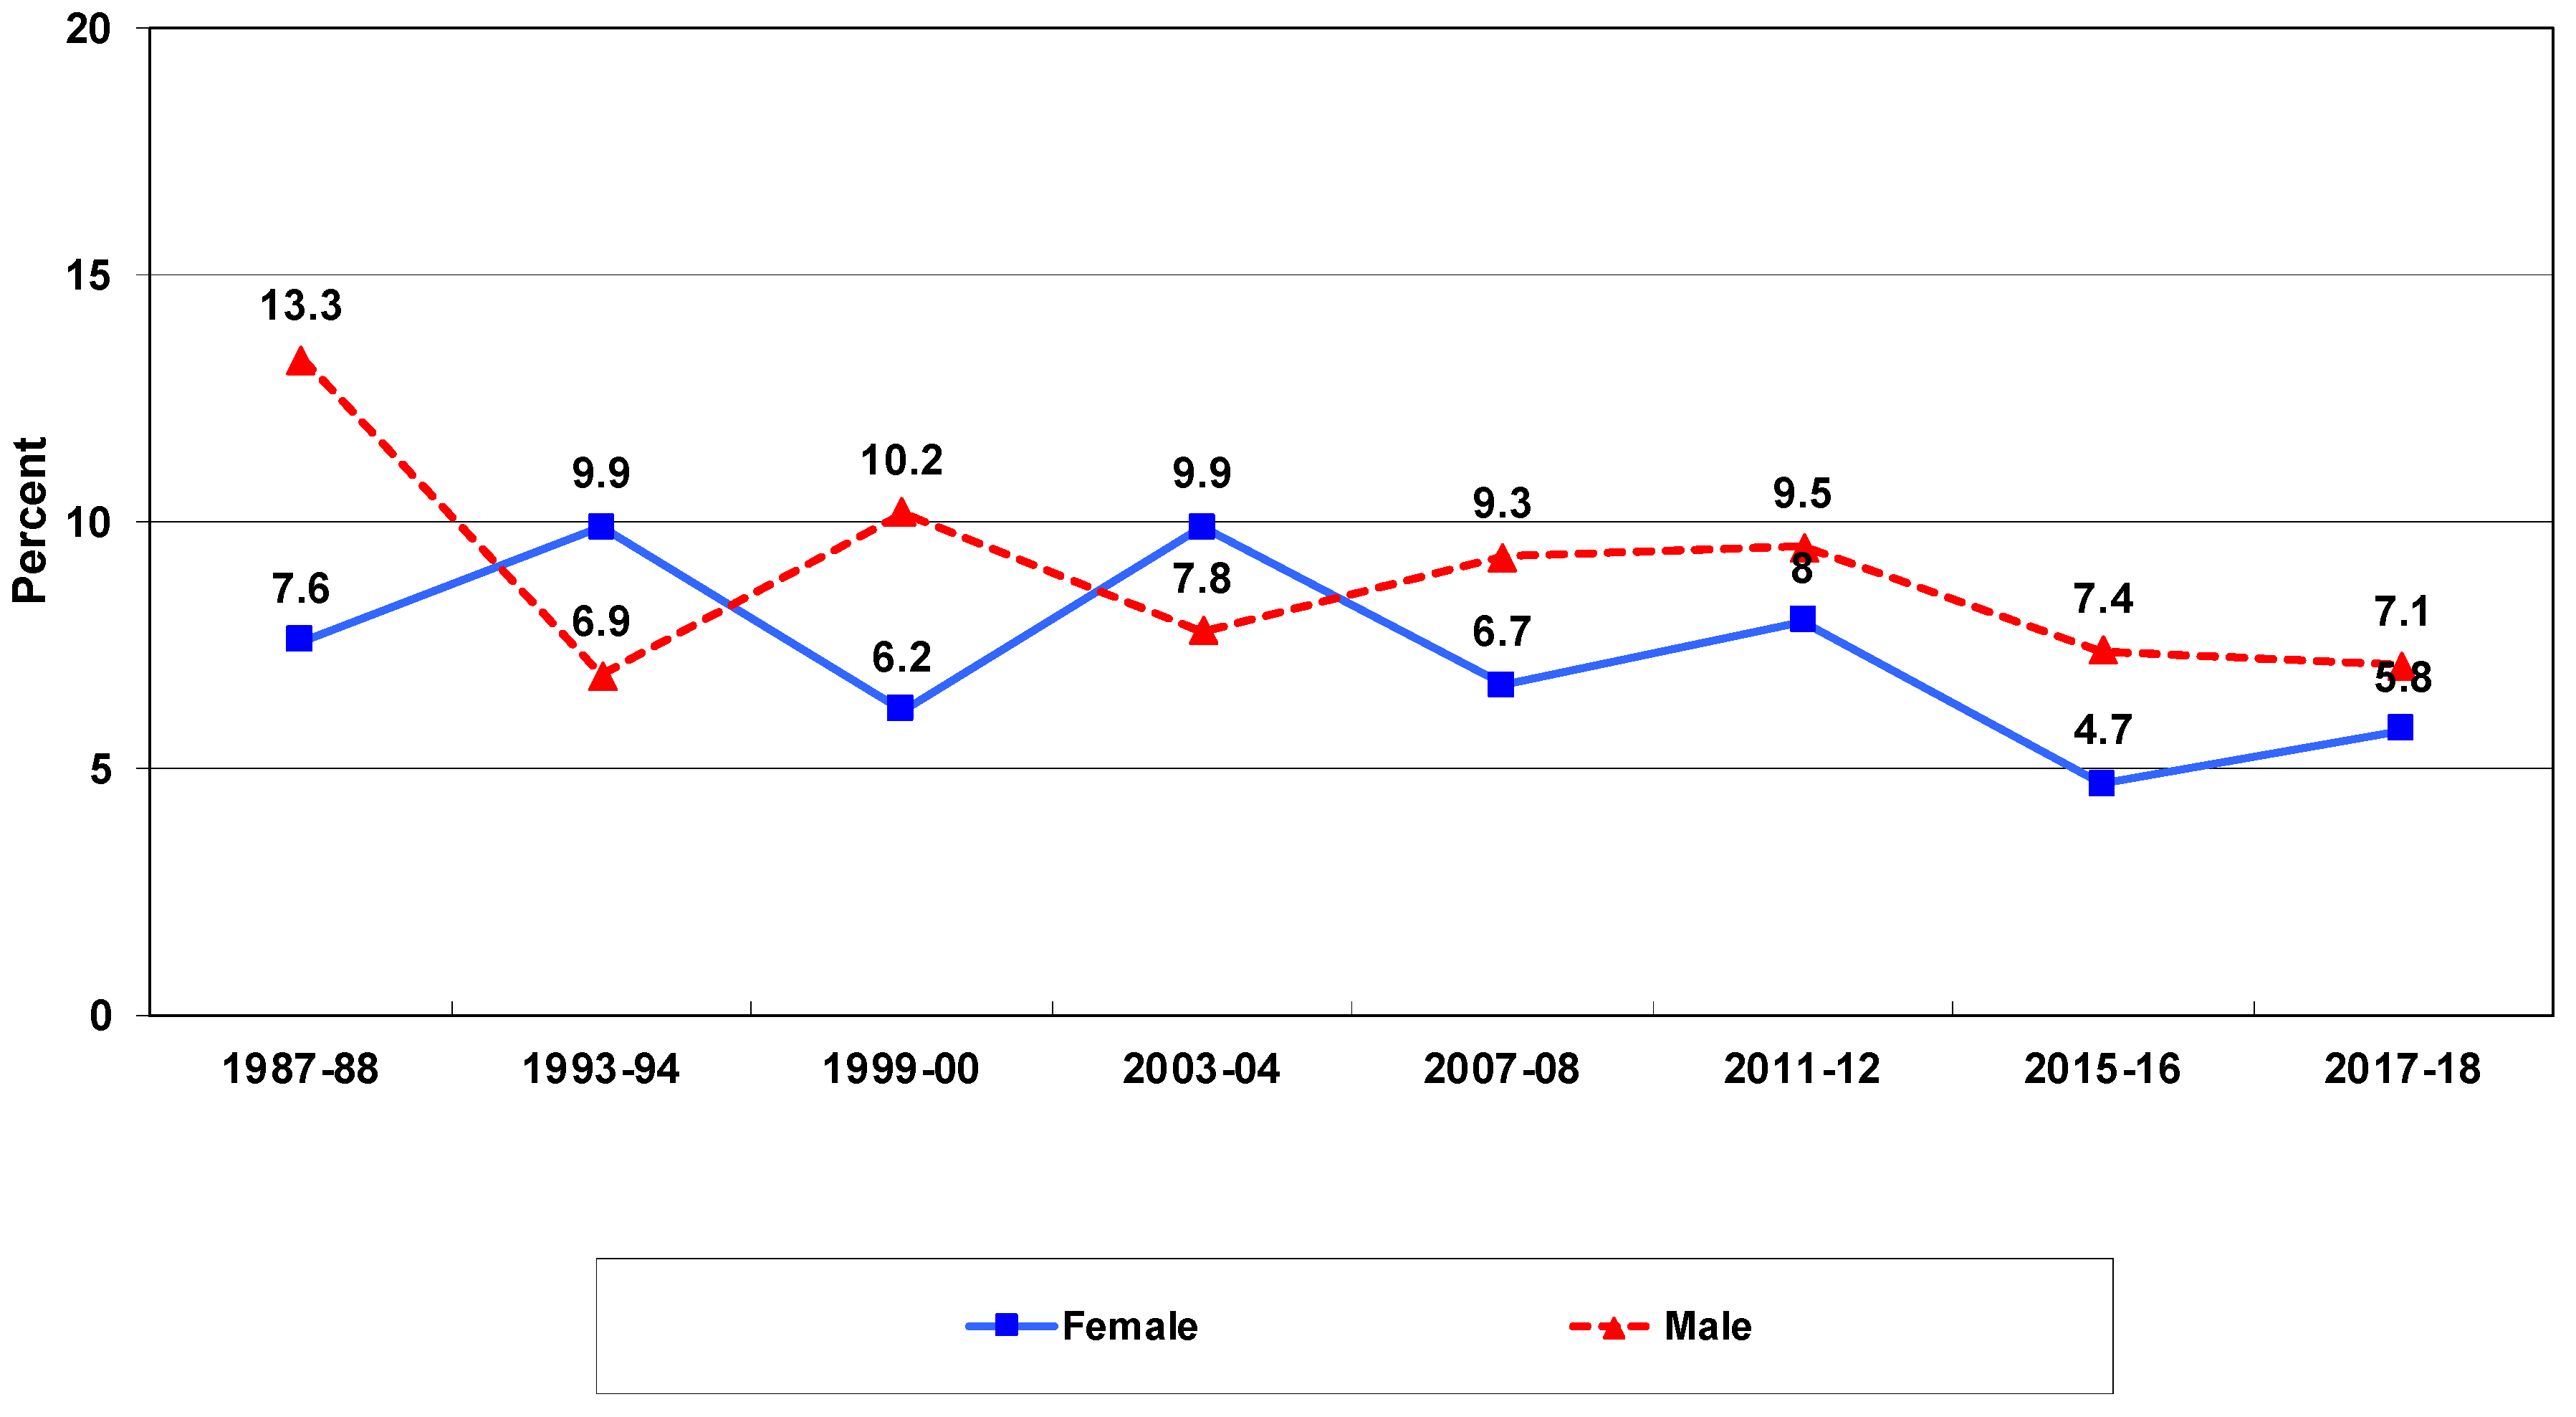
There are, however, differences in college selectivity by gender. Interestingly, beginning male teachers in public schools have often been slightly more likely to come from top-ranked institutions than have female teachers (see Figure 13). And, while the levels fluctuated between 1987–1988 and 2017–2018, there appears to have been an overall decrease in the proportion of first-year male teachers in public schools coming from the top two ranks of institutions—from 13 percent in the period 1987–1988, to 10 percent in the period 2011–2012, and to 7 percent in the period 2017–2018.
For first-year female teachers in public schools the proportion coming from the top two categories of institutions has also slightly fluctuated from year to year. There also appears to have been a decrease in the proportion of first-year female teachers in public schools from the top two ranks of institutions—from 2011–2012 to 2017–2018. However, this decrease—from 8 to 6 percent—has been less than for male teachers.
Once again, however, these percentages do not tell the whole story. Although the percentage of female teachers from top institutions has not changed much since the late 1980s, because the teaching force has ballooned (Trend 1) and has also become more female (Trend 4), numerically teaching has been employing far more female candidates from all of higher education, including top colleges and universities.
Hence, assuming our college selectivity measure of academic ability is valid, our data show that there has been a decrease in the proportion of male teachers from top institutions since the late 1980s. But these data also show that this trend has been less true of female teachers. Perhaps we should call the latter a non-trend. So, contrary to the view that there has been a sharp decline in the academic caliber of female teachers, our data suggest that this has not been true in the past three decades.
Along with the increase in the numbers and proportions of female teachers, we do not know the reasons for the apparent stability in the academic ability of females entering teaching in recent decades. As we suggested in Trend 4, perhaps the increased opportunities for women in school leadership and positions in secondary schools (see Figure 8) have been attractive incentives for able and ambitious females to enter education.
3.7. Trend 7: Unstable
Elementary and secondary teaching in the U.S. has long been marked by relatively high rates of annual departures of teachers from schools and from teaching altogether [38,44,86], and especially in the past three decades, there has been a burgeoning of empirical research on a wide variety of aspects of teacher turnover, mobility, and attrition [10,87,88,89,90,91]. Here we will draw from our own extensive research findings on teacher turnover—especially focusing on trends for beginning teachers.
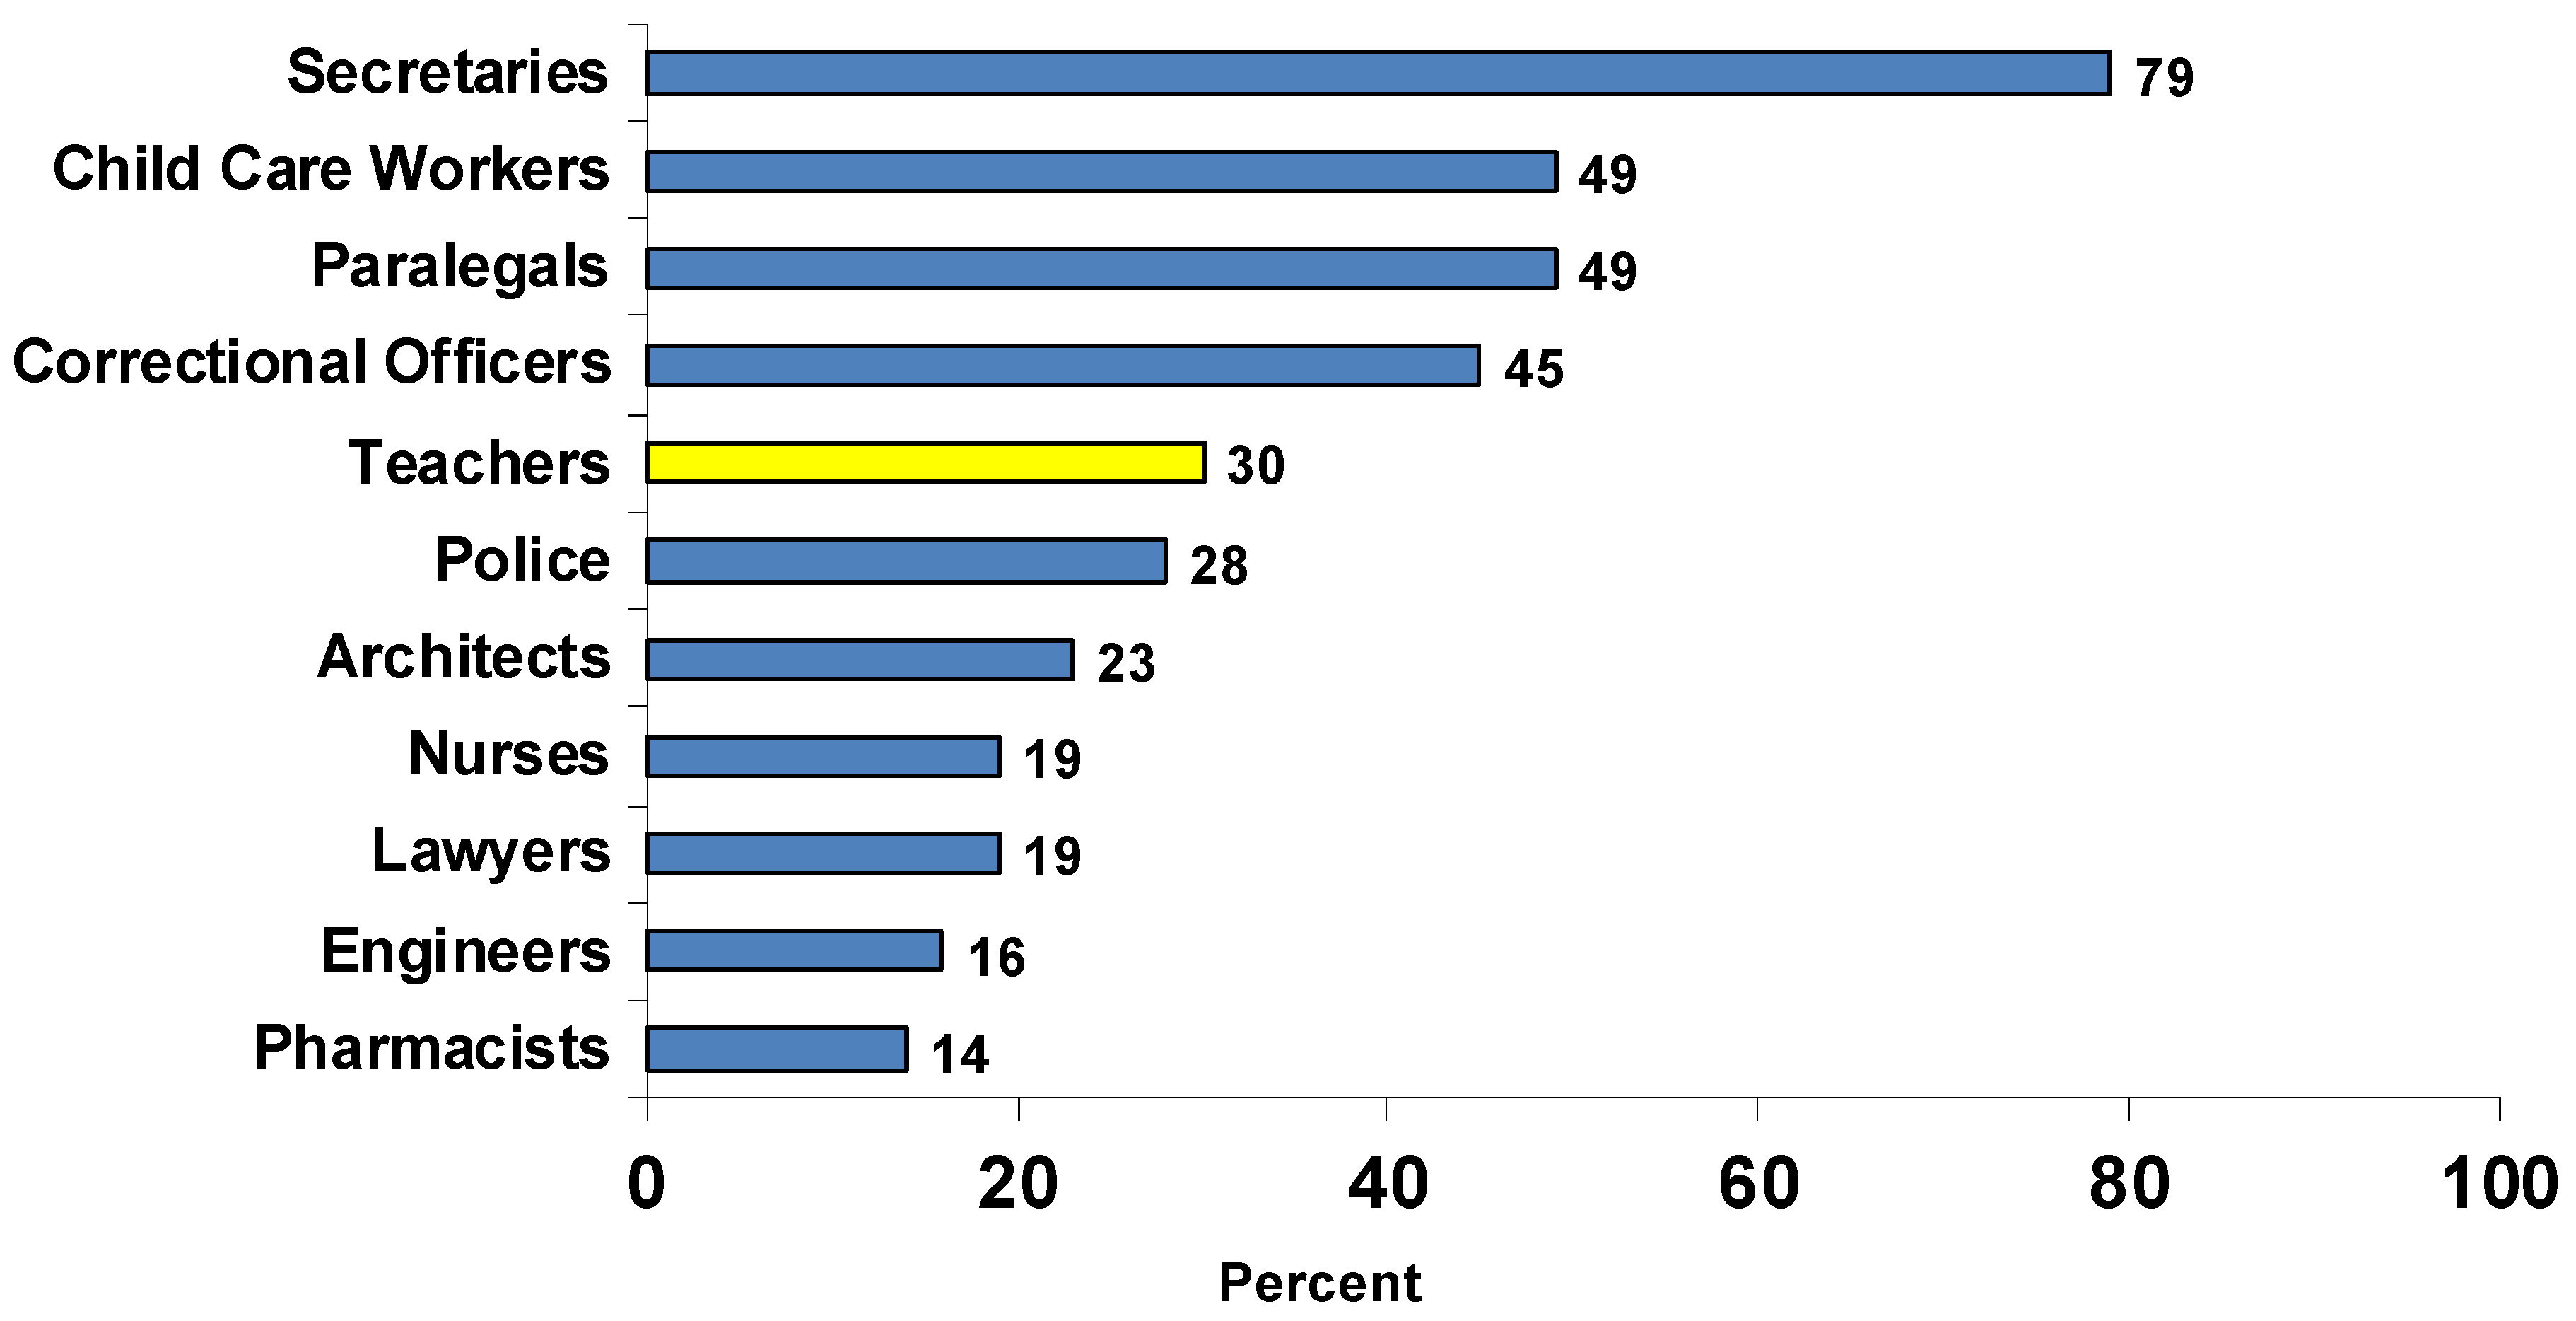
To contextualize the stability of teachers we empirically investigated how attrition for teachers compares to that of employees in other lines of work, by analyzing national data from the Baccalaureate and Beyond survey on cross-occupational attrition rates of college graduates through their first 10 years after graduation from college. We found that teaching does have less attrition—those leaving the occupation entirely—than some other occupations, such as the child-care, secretarial, and paralegal fields (see Figure 14). Attrition rates are similar for teachers and police officers. Perhaps surprisingly, teacher attrition is higher than nursing attrition, and teachers have far higher attrition than traditionally highly respected professions, such as law, engineering, and architecture.
But these overall figures mask large differences in departure rates among different types of teachers and different locales, revealing the need to disaggregate our data. The flow of teachers out of schools is not equally distributed across states, regions, and school districts. The largest variations in teacher departures by location, however, are those between different schools, even within the same district. This includes both major components of total turnover—migration (teachers who move between districts and schools) and attrition (those who leave teaching altogether). The data show that almost half of all public-school teacher turnover takes place in just one-quarter of the population of public schools. The data show that high-poverty, high-minority, urban, and rural public schools have among the highest rates of turnover.
Moreover, by analyzing the SASS/TFS data on the demographic characteristics of both the schools migrating teachers move from and also those they move to for the following school year, we have been able to compare the flows of teachers between different kinds of schools. For instance, we found that of teachers who migrated between the 2004 and 2005 school years, over four times as many went from high-poverty schools to low-poverty schools as in reverse. Likewise, of teachers who moved, over three times as many went from urban to suburban schools, as in reverse [13]. The net result is a large annual asymmetric reshuffling within the school system of a significant portion of the teaching force, with a net loss on the part of poor, minority and urban schools and a net gain to non-poor, non-minority, and suburban schools. For instance, Lankford, Loeb, and Wyckoff offer an insightful examination of teacher migration to and from New York City schools and the suburbs [92].
The data also show that rates of both moving between schools and leaving teaching altogether differ by the race/ethnicity of the teacher. As mentioned in Trend 5, over the past couple of decades, minority teachers have had significantly higher rates of turnover than white teachers. Moreover, the gap has widened in recent years. Why is this? Strikingly, while the demographic characteristics of schools appear to be highly important to minority teachers’ initial decisions as to where to teach, this appears to be less the case for their later decisions about whether to stay or depart. What does impact their decisions, our analyses show, are school working conditions, in particular the degree of autonomy and discretion teachers are allowed over issues that arise in their classrooms, and the level of collective faculty influence over school- wide decisions that affect teachers’ jobs. The same difficult-to-staff schools that are more likely to employ minority teachers are also more likely to offer less-than-desirable working conditions, according to our data, and these conditions account for the higher rates of minority teacher turnover. These high levels of turnover, of course, undermine efforts to diversify the teaching force [78,79].
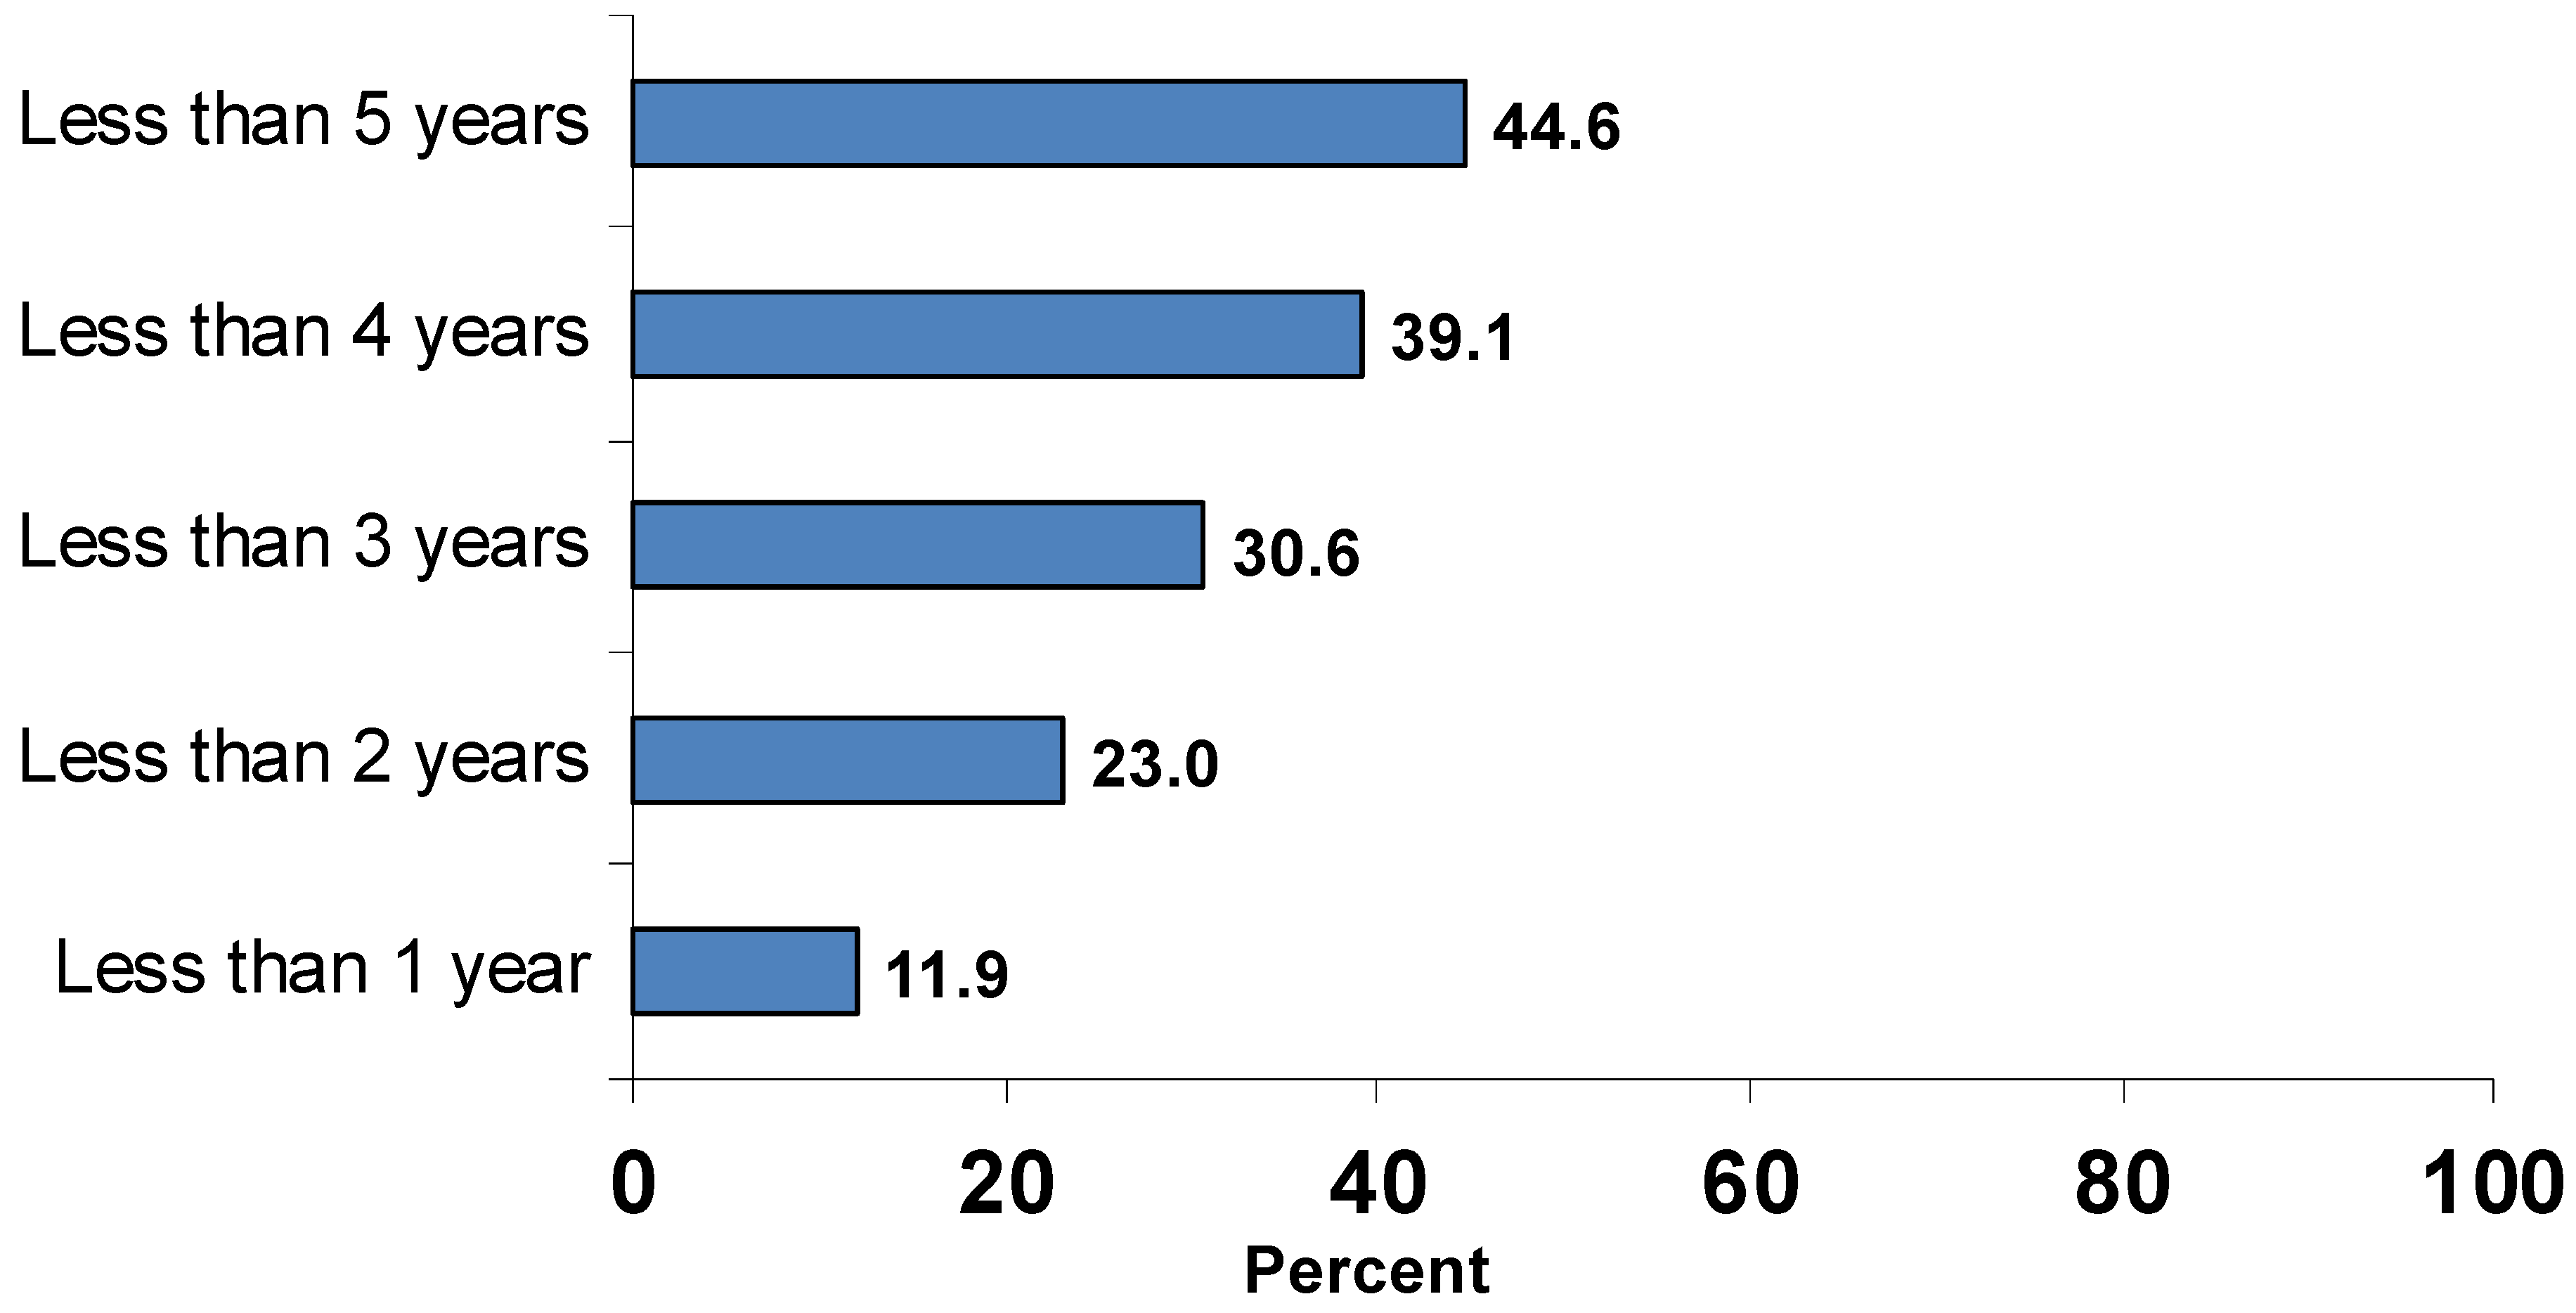
Beginning teachers, regardless of their race, have among the highest rates of turnover of any group of teachers. Almost two decades ago we estimated that between 40 to 50 percent of those who enter teaching leave teaching within 5 years [11]. This figure has been widely reported since, but it was only a rough estimate using cross-sectional national data. More recently, using national longitudinal data from the Baccalaureate and Beyond survey, we were able to more accurately document rates of cumulative beginning attrition (see Figure 15). We found that more than 44 percent of new teachers leave teaching within 5 years of entry.
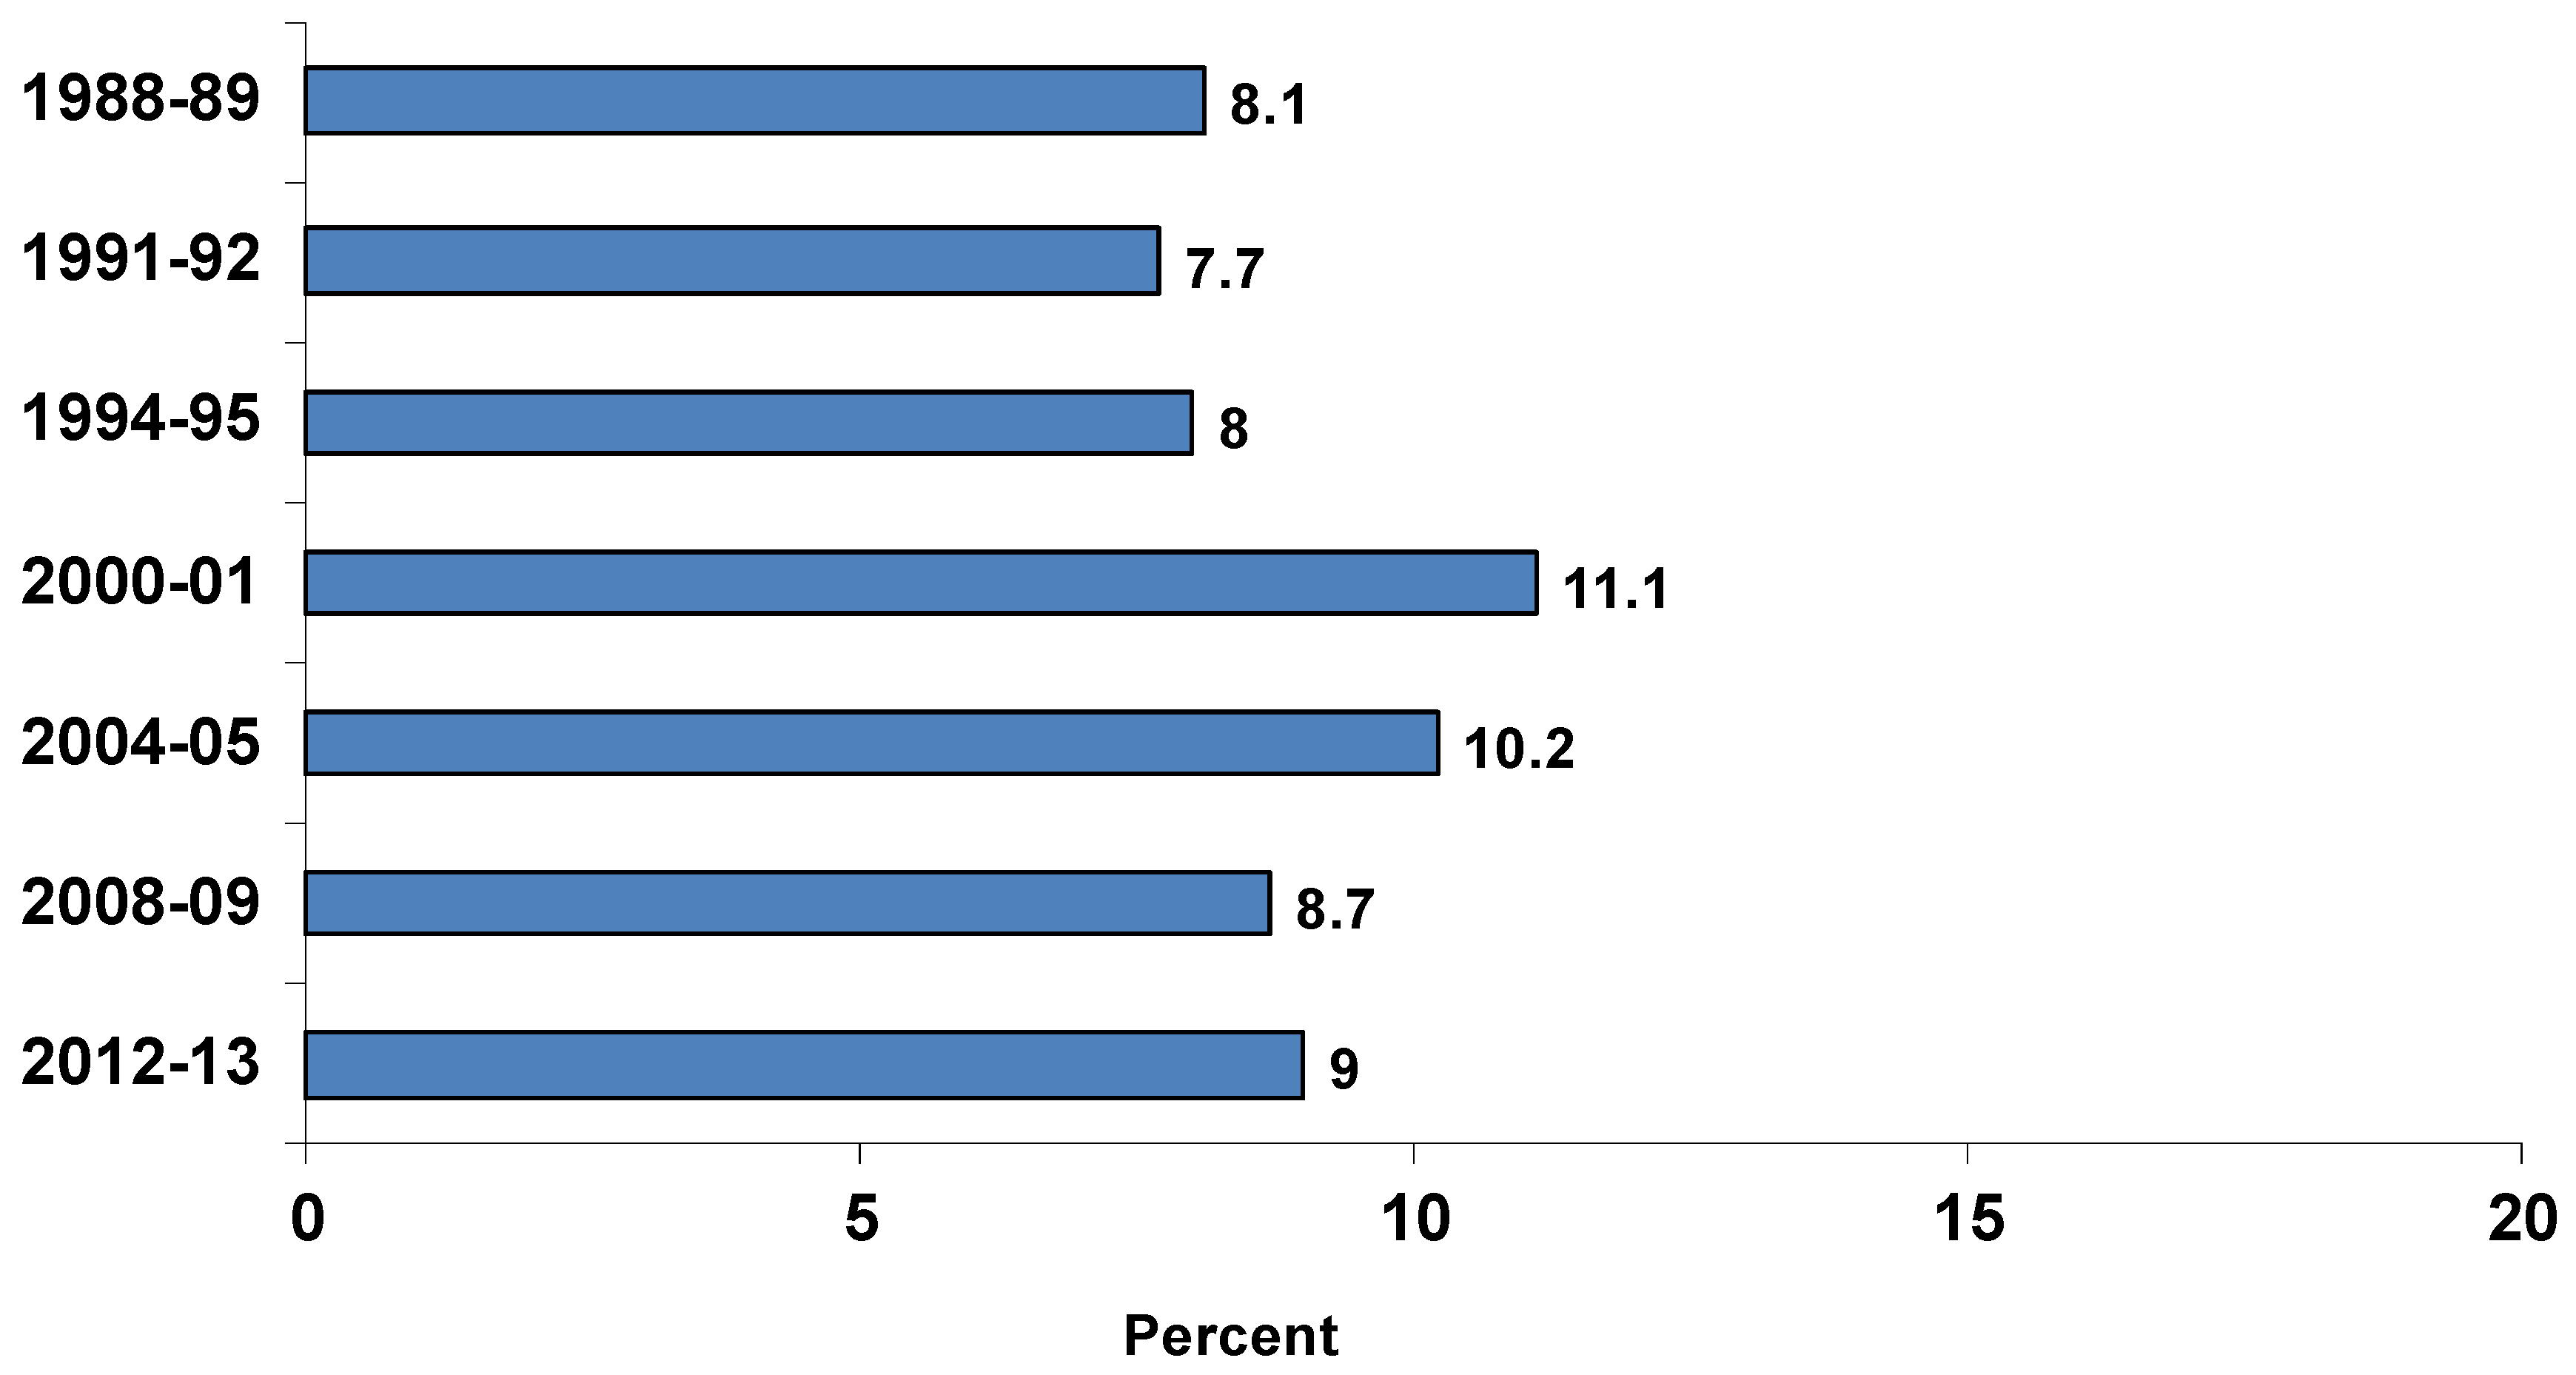
Moreover, we have also found, despite a temporary dip after the 2008 recession, that high levels of attrition among beginning teachers have been holding steady or even slightly increasing since the late 1980s up to 2012–2013 (Figure 16). Note: the last cycle of the TFS to be administered was in the period 2012–2013 and it only included public school teachers. Hence, we present turnover data for public school teachers only in Figure 16, Figure 17 and Figure 18.
Again, however, an increase in the annual percentage does not tell the whole story. Because the teaching force has grown dramatically larger, numerically there are more beginners than before (Trend 3), and hence the actual numbers of teachers who quit the occupation after their first year on the job has also increased. Soon after the 1987–1988 school year, approximately 7500 first-year public school teachers left teaching, while just after the 2012–2013 school year, approximately 11,000 first-year public school teachers left the occupation. There are more beginners in the teaching force, and these beginners are less likely to stay in teaching than others.
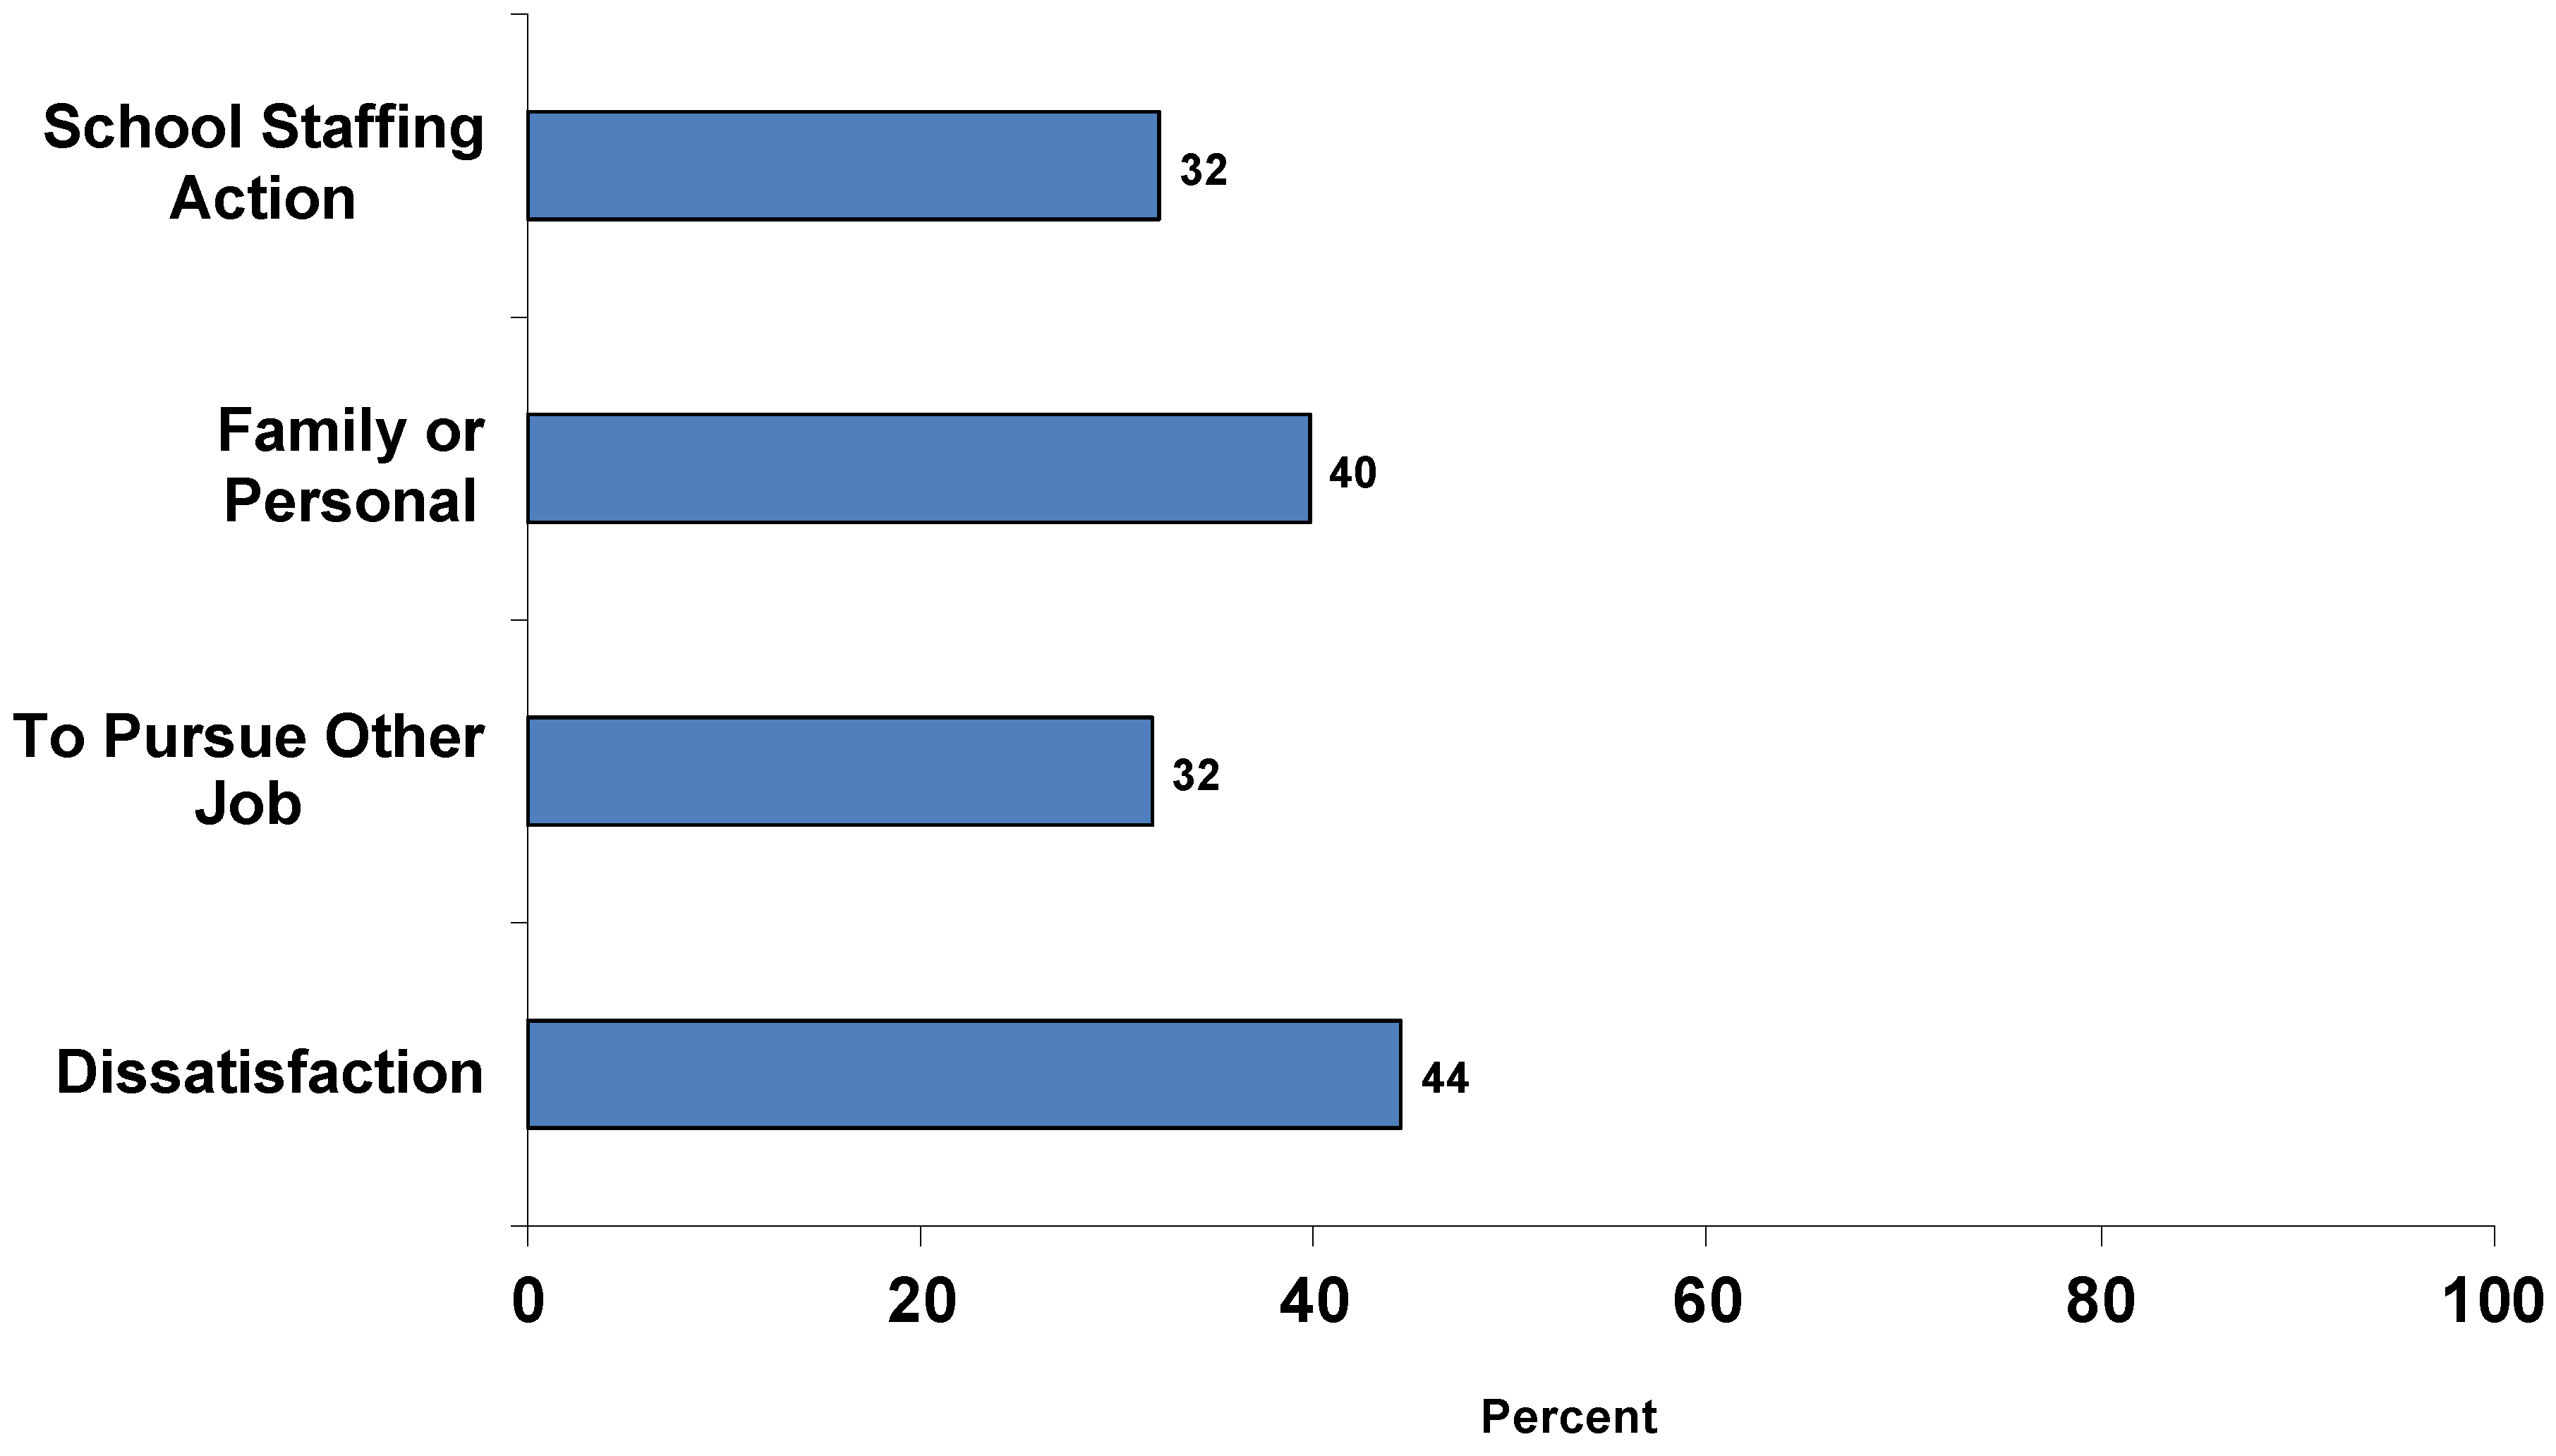
Along with analyzing TFS data on the rates and cross-school variations of turnover, we also analyzed data drawn from an additional set of items in the TFS questionnaire that asked teacher-respondents to indicate the reasons for their departures from a list in the survey questionnaire. Of first-year teachers who departed from their school after the end of the 2011–2012 school year (including both movers and leavers), one-third indicated that they had been involuntarily transferred, laid off, or terminated (see Figure 17). This included for both budgetary and performance reasons. A larger portion indicated that family or personal issues played an important part in their decision to depart. This set included reasons of health, pregnancy, a residence move, and caring for family members. Another one-third indicated that they departed to pursue further education or another career. Finally, the most frequently cited set of reasons concerned dissatisfaction. Of those who indicated that dissatisfaction was a major reason for departure, most cited a variety of school and working conditions, including salaries, classroom resources, student misbehavior, accountability, opportunities for development, input into decision making, and school leadership (Figure 18).
In sum, beginners—the largest group within one of the largest occupations in the nation—have been leaving at relatively high rates, and these rates have held steady or even increased, in recent decades. Together, ballooning (Trend 1) and turnover (Trend 7) indicate a growing flux and instability in the teaching occupation, as both the large numbers of those entering teaching and the large numbers of those leaving teaching have been increasing in recent years.
These changes have large implications. Employee turnover in any occupation has pros and cons, costs and benefits. On the one hand, some degree of employee turnover, with the accompanying job and career changes, is normal, inevitable, and can be efficacious for individuals, for organizations, and for the economic system as a whole. Too little turnover of employees is tied to stagnancy in organizations; effective organizations usually both promote and benefit from a limited degree of turnover by eliminating low-caliber performers and bringing in “new blood” to promote innovation.
On the other hand, high levels of employee departures are consequential not only because they can be a symptom of underlying problems in how well organizations function, but also because departures can entail costs and other negative effects for organizations and for the larger system These include large financial costs [93,94,95], and decreases in student achievement [96,97,98].
As mentioned earlier, we have found that one negative consequence of teacher turnover is its important but often overlooked role in teacher shortages [10,11,12,13,14]. Turnover is a major factor behind the problems that many schools have staffing their classrooms with qualified mathematics, science, and other teachers. Moreover, increases in turnover among minority teachers, especially in disadvantaged schools, undermine efforts to recruit new teachers in hard-to-staff schools and to diversify the teaching force. Additionally, research using longitudinal administrative data shows that teacher turnover disproportionately impacts some schools and districts more than others [99,100].
As mentioned in Trend 3, a possible financial consequence of high levels of teacher attrition among beginning teachers is a reduction in payouts from state pension plans, because increasing numbers of those who paid into systems remain in teaching long enough to reap full pension benefits.
A further negative consequence of high levels of beginning teacher attrition is the loss of newcomers before they are able to fully develop their skills. As mentioned earlier, a number of studies have documented the reasonable proposition that teachers’ academic effectiveness—as measured by gains in their students’ test scores—increases significantly with additional experience for the first several years in teaching [32,33].
4. Discussion
Has the elementary and secondary teaching force in the United States changed in recent decades? The answer is most certainly yes—and in a number of important ways. It has become far larger. It has simultaneously become older, younger, and far less experienced. It has simultaneously become less diverse, by gender, and more diverse, by race/ethnicity. It does not appear to be suffering from a decline in the academic ability of females entering teaching; indeed, the numbers of new teacher hires coming from the top-ranked colleges and universities has greatly increased. Finally, it remains unstable.
For each of these trends, significant questions immediately arise. What are the reasons for, and sources of, the trend? Will the trend continue, and what impact will it have? In this report, we have offered some possible answers to these questions.
It is also striking that while these trends raise important questions, until recently we have seen little awareness or discussion of many of them or their implications—whether by researchers, by policy makers, by educators, or by the public. But there are good reasons to investigate the sources and continuation of these changes—because if these trends do indeed continue, there will be large implications, with serious financial, structural, and educational consequences for America’s educational system.
For instance, will the teaching force continue to outgrow the student population it serves, and, if so, why? If the teaching force does continue to balloon in size, the expense to local school districts could become unsustainable, and without an increase in funds, districts may increasingly turn to cutting teacher salary levels.
Will the hiring, and thus the greening trend, continue? In turn, will an increasing number of new hires decide not to stay in teaching, making teaching increasingly an occupation practiced by the young and inexperienced, and if so, why? If this trend continues, the expense to local school districts could become more sustainable, because of lower overall average salary costs per employee. In other words, will there effectively be a financial tradeoff between the numbers of teachers and their experience? On the other hand, as the older portion of the teaching force finishes retiring, will a large portion of the newcomers decide to stay with teaching to become the next generation of veterans?
Will the teaching force continue to become more female, and if so, why? If the teaching force does continue to become even more female-dominated, with the presence of male role models a rarity for an increasing number of students in their K-12 school years, will there be negative implications for students, both male and female?
Perhaps there is an irony in these changes. Historians tell us that when the public school system was invented a century ago, the teaching force was transformed into a mass occupation that was relatively low-paying, temporary, and designed predominantly for young, inexperienced women, prior to starting their “real” career of child rearing [38,44]. Perhaps the changes that we have traced represent not an entirely new face, but a return to the old face of the American teaching force.
A return to an earlier composition could have serious implications for the future status of elementary and secondary teaching in the United States. Professionalization has long been a source of both hope and frustration for teachers. Since early in the 20th century, educators have repeatedly sought to upend the notion that teaching is akin to lower-skill industrial work where teachers are interchangeable and easily replaced, and they have sought to promote the view that teaching is highly complex work, requiring specialized knowledge and skills, and deserving of the same status as well-established professions, like law, medicine, engineering, and academia. These efforts to enhance the professional status of teaching have also long met with limited success. And if teaching becomes an even larger, lower-paying line of work, predominantly employing young, inexperienced women, who stay for limited periods, it does not suggest optimism for the aspirations to promote the image of teaching as a respected profession.
At the same time, these possible future trajectories, and similarities between the contemporary transformation of the teaching force and its previous incarnation, are strictly speculative on our part. Nothing in our data analyses so far can be considered conclusive evidence that the teaching force is, or will be, “better” or “worse” in one way or another. As we indicated at the beginning of this report, thus far our objective has been exploratory and suggestive. At this point, we have more questions than answers.
What is clear is that large-scale changes are happening to one of the largest occupational groups in the U.S. Immediately after World War II and before the post-war baby boom, there were just over three-quarters of a million elementary and secondary teachers in the United States. By 2017–2018, there were more than five times as many—over 4 million elementary and secondary teachers. In the 2017–2018 school year alone, over 150,000 newcomers entered teaching. These data suggest a very large opportunity—one of the largest occupations in the U.S. is being expanded, replaced, and re-made. Who will our new teachers be and what implications will this have? Further research is warranted to answer this question.
Author Contributions
Conceptualization, R.I.; methodology, R.I., E.M., D.S., G.C.; software, All; validation, All; formal analysis, All; investigation, All; resources, All; data curation, All; writing—original draft preparation, R.I.; writing—All; Visualization, All; supervision, All; project administration, R.I.; funding acquisition, R.I. All authors have read and agreed to the published version of the manuscript.
Funding
This research received no external funding.
Conflicts of Interest
The authors declare no conflict of interest.
References
- Ingersoll, R.; Merrill, E. A Quarter Century of Changes in the Elementary and Secondary Teaching Force: From 1987 to 2012; Statistical Analysis Report (NCES 2015-076); National Center for Education Statistics: Washington, DC, USA, 2017.
- Ingersoll, R.; Merrill, E.; Stuckey, D. The changing face of teaching. Educ. Leadership. 2018, 75, 44–49. [Google Scholar]
- Ingersoll, R.; Merrill, E.; Stuckey, D.; Collins, G. Seven Trends: The Transformation of the Teaching Force; Consortium for Policy Research in Education, University of Pennsylvania: Philadelphia, PA, USA, 2018. [Google Scholar]
- National Center for Education Statistics. Schools and Staffing Survey (SASS) and Teacher Followup Survey (TFS); U.S. Department of Education: Washington, DC, USA, 2013.
- Taie, S.; Goldring, R. Characteristics of Public and Private Elementary and Secondary School Teachers in the United States: Results From the 2017–18 National Teacher and Principal Survey First Look; U.S. Department of Education: Washington, DC, USA, 2020.
- Goldring, R.; Taie, S.; Riddles, M. Teacher Attrition and Mobility: Results From the 2012–2013 Teacher Follow-Up Survey First Look; National Center for Education Statistics: Washington, DC, USA, 2014.
- Bureau of Labor Statistics. Labor Force Statistics from the Current Population Survey. 2020. Available online: https://www.bls.gov/cps/cpsaat11.htm (accessed on 8 May 2021).
- Kirst, M. Who Controls Our Schools; W.H. Freeman and Co.: New York, NY, USA, 1984. [Google Scholar]
- Vollmer, J.R. Schools Cannot Do It Alone: Building Public Support for America’s Public Schools; Enlightenment Press: Fairfield, IA, USA, 2010. [Google Scholar]
- Ingersoll, R. Teacher turnover and teacher shortages: An organizational analysis. Am. Educ. Res. J. 2001, 3, 499–534. [Google Scholar] [CrossRef] [Green Version]
- Ingersoll, R. Is There Really a Teacher Shortage; University of Pennsylvania: Philadelphia, PA, USA, 2003. [Google Scholar]
- Ingersoll, R.; Perda, D. Is the supply of mathematics and science teachers sufficient? Am. Educ. Res. J. 2010, 20, 1–32. [Google Scholar] [CrossRef] [Green Version]
- Ingersoll, R.; May, H. The magnitude, destinations and determinants of mathematics and science teacher turnover. Educ. Eval. Policy Anal. 2012, 34, 435–464. [Google Scholar] [CrossRef] [Green Version]
- Ingersoll, R. Teacher Supply, Demand, Shortages and Turnover in Rural Schools: What the National Data Tell Us, 2021; in press.
- Krugman, P.R. End This Depression Now; W.W. Norton & Co.: New York, NY, USA, 2012. [Google Scholar]
- Moore, S. We’ve become a nation of takers, not makers. Wall Street J. 2011, A15. [Google Scholar]
- Scafidi, B. The School Staffing Surge: Decades of Employment Growth in America’s Schools; Friedman Foundation: Indianapolis, IN, USA, 2013. [Google Scholar]
- National Academy of Sciences. Toward Understanding Teacher Supply and Demand; National Academies Press: Washington, DC, USA, 1987. [Google Scholar]
- National Commission on Excellence in Education. A Nation at Risk: The Imperative for Educational Reform; Government Printing Office: Washington, DC, USA, 1983.
- National Commission on Teaching and America’s Future. What Matters Most: Teaching for America’s Future; National Commission on Teaching and America’s Future: New York, NY, USA, 1996. [Google Scholar]
- National Commission on Teaching and America’s Future. Doing What Matters Most: Investing in Quality Teaching; National Commission on Teaching and America’s Future: New York, NY, USA, 1997. [Google Scholar]
- National Commission on Mathematics and Science Teaching for the 21st Century (the John Glenn Commission). Before It’s Too Late; Government Printing Office: Washington, DC, USA, 2000.
- National Research Council. Learning and Understanding: Improving Advanced Study of Mathematics and Science in U.S. Schools; National Academies Press: Washington, DC, USA, 2002. [Google Scholar]
- U.S. Department of Education. Meeting the Highly Qualified Teachers Challenge: The Secretary’s Annual Report on Teacher Quality; U.S. Department of Education: Washington, DC, USA, 2002.
- U.S. Department of Education. Teacher Shortage Areas Nationwide Listing 1990–1991 to 2009–2010; U.S. Department of Education: Washington, DC, USA, 2009.
- National Academy of Sciences. Rising above the Gathering Storm; National Academies Press: Washington, DC, USA, 2007. [Google Scholar]
- Garcia, E.; Weiss, E. The Teacher Shortage Is Real, Large and Growing, and Worse than We Thought. 2019. Available online: https://www.epi.org/files/pdf/163651.pdf (accessed on 8 May 2021).
- Aldeman, C.; Rotherham, A. Teacher Pension Plans: How They Work, and How They Affect Recruitment, Retention, and Equity; Bellweather Education Partners: Washington, DC, USA, 2019. [Google Scholar]
- Boivie, I. The Three Rs of Teacher Pension Plans: Recruitment, Retention, and Retirement; The National Institute on Retirement Security: Washington, DC, USA, 2011. [Google Scholar]
- Ingersoll, R.; Merrill, L. Review of “Teacher Layoffs: Rethinking “Last Hired, First Fired” Policies”. 2010. Available online: https://repository.upenn.edu/gse_pubs/218 (accessed on 8 May 2021).
- Thomsen, J. Teacher Performance Plays a Growing Role in Employment Decisions. Education Commission of the States. 2014. Available online: http://www.ecs.org/clearinghouse/01/12/42/11242.pdf (accessed on 8 May 2021).
- Henry, G.; Fortner, K.; Bastian, K. The effects of experience and attrition for novice high school science and mathematics teachers. Science 2012, 335, 1118–1121. [Google Scholar] [CrossRef] [PubMed] [Green Version]
- Kane, T.J.; Rockoff, J.E.; Staiger, D.O. What Does Certification Tell Us about Teacher Effectiveness? Evidence from New York City; National Bureau of Economic Research: Cambridge, MA, USA, 2006. [Google Scholar]
- Ingersoll, R.; Strong, M. The impact of induction and mentoring for beginning teachers: A critical review of the research. Rev. Educ. Res. 2011, 81, 201–233. [Google Scholar] [CrossRef] [Green Version]
- Will, M.; Sawchuk, S. Teacher Pay: How Salaries, Pensions, and Benefits Work in Schools. 2018. Available online: https://www.edweek.org/teaching-learning/teacher-pay-how-salaries-pensions-and-benefits-work-in-schools/2018/03 (accessed on 8 May 2021).
- Snell, R.K. Pensions and Retirement Plan Enactments in 2011 State Legislatures. National Conference of State Legislatures. 2012. Available online: https://www.ncsl.org/documents/employ/2011EnactmentsFinalReport.pdf (accessed on 8 May 2021).
- Lohman, J. 50-State Survey of Certain Teacher Retirement Plan Provisions. 2000. Available online: https://www.cga.ct.gov/2000/rpt/2000-R-1110.htm (accessed on 31 March 2021).
- Tyack, D. The One Best System; Harvard University Press: Cambridge, MA, USA, 1974. [Google Scholar]
- Reich, A. Teaching is a Good Profession for A Woman. In And Jill Came Tumbling After; Stacey, J., Bereaud, S., Daniels, J., Eds.; Dell: New York, NY, USA, 1974; pp. 337–343. [Google Scholar]
- Strober, M.; Tyack, D. Why do women teach and men manage? Signs 1980, 5, 499–500. [Google Scholar] [CrossRef]
- Hoffman, N Women’s “True” Profession: Voices from the History of Teaching; Harvard Education Press: Cambridge, MA, USA, 2003.
- Clifford, G. Those Good Gertrudes: A Social History of Women Teachers in America; Johns Hopkins University Press: Baltimore, MD, USA, 2016. [Google Scholar]
- Perlmann, J.; Margo, R.A. Women’s Work?: American Schoolteachers, 1650–1920; The University of Chicago Press: Chicago, IL, USA, 2010. [Google Scholar]
- Lortie, D. School Teacher; University of Chicago Press: Chicago, IL, USA, 1975. [Google Scholar]
- Goldstein, D. The Teacher Wars; Anchor Books: New York, NY, USA, 2014. [Google Scholar]
- Moulthrop, D.; Calegari, N.; Eggers, D. Teachers Have It Easy: The Big Sacrifices and Small Salaries of America’s Teachers; The New Press: New York, NY, USA, 2005. [Google Scholar]
- Grant, G. The Teacher’s Predicament. Teach. Coll. Rec. 1983, 84, 593–609. [Google Scholar]
- Flyer, F.; Rosen, S. The New Economics of Teachers and Education. J. Labor Econ. 1997, 15, S104–S139. [Google Scholar] [CrossRef]
- Shelton, J. Women’s Work, Women’s Walkouts. 2018. Available online: https://genderpolicyreport.umn.edu/womens-work-womens-walkouts/ (accessed on 8 May 2021).
- Reskin, B.; Roos, P. Job Queues, Gender Queues; Temple University Press: Philadelphia, PA, USA, 1990. [Google Scholar]
- Jacobs, J. Men in Female-Dominated Fields. In Doing Women’s Work: Men in Non-Traditional Occupations; Williams, C., Ed.; Sage: Newbury Park, CA, USA, 1993; pp. 49–63. [Google Scholar]
- Waller, W. The Sociology of Teaching; Wiley: New York, NY, USA, 1932. [Google Scholar]
- Mills, C.W. White Collar; Oxford: New York, NY, USA, 1951. [Google Scholar]
- Davis, J.; Smith, T. General Social Surveys, 1972–1996: Cumulative Codebook; National Opinion Research Center: Chicago, IL, USA, 1996. [Google Scholar]
- Smith, T.; Son, J. Measuring Occupational Prestige on the 2012 General Social Survey; University of Chicago: Chicago, IL, USA, 2014. [Google Scholar]
- Dolton, P.; Marcenaro-Gutierrez, O.D.; De Vries, R.; She, P.-W. An International Index of Teacher Status; The Varkey GEMS Foundation: London, UK, 2018. [Google Scholar]
- Lortie, D. The balance of control and autonomy in elementary school teaching. In The Semi-Professions and Their Organization; Etzioni, A., Ed.; Free Press: New York, NY, USA, 1969. [Google Scholar]
- Etzioni, A. Semi-Professions and Their Organizations: Teachers, Nurses and Social Workers; Free Press: New York, NY, USA, 1969. [Google Scholar]
- Ingersoll, R.; Collins, G. The Status of Teaching as a Profession. In Schools and Society: A Sociological Approach to Education, 6th ed.; Ballantine, J., Spade, J., Stuber, J., Eds.; Sage: Berkeley, CA, USA, 2018; pp. 199–213. [Google Scholar]
- Allan, J. Male Elementary Teachers. In Doing Women’s Work: Men in Non-Traditional Occupations; Williams, C., Ed.; Sage: Newbury Park, CA, USA, 1993; pp. 113–127. [Google Scholar]
- Jacinto, A.; Gershenson, S. The intergenerational transmission of teaching. Am. Educ. Res. J. 2020. [Google Scholar] [CrossRef]
- American Association of School Administrators. The American School Superintendent: 2020 Decennial Study; American Association of School Administrators: Alexandria, VA, USA, 2021. [Google Scholar]
- U.S. Department of Education. Digest of Education Statistics; National Center for Education Statistics: Washington, DC, USA, 2019.
- Grissom, J.A.; Reininger, M. Who comes back? A longitudinal analysis of the reentry behavior of exiting teachers. Educ. Financ. Policy 2012, 7, 425–454. [Google Scholar] [CrossRef]
- Pietrykowski, B. The Return to Caring Skills: Gender, Class, and Occupational Wages in the US. Fem. Econ. 2017, 23, 1–30. [Google Scholar] [CrossRef]
- Achinstein, B.; Aguirre, J. Cultural match or cultural suspect: How new teachers of color negotiate socio-cultural challenges in the classroom. Teach. Coll. Rec. 2008, 110, 1505–1540. [Google Scholar]
- Carver-Thomas, D. Diversifying the Teaching Profession: How to Recruit and Retain Teachers of Color; Learning Policy Institute: Palo Alto, CA, USA, 2018. [Google Scholar]
- Campoli, A.K. Supportive principals and black teacher turnover: ESSA as an opportunity to improve retention. J. Sch. Leadersh. 2017, 27, 675–700. [Google Scholar] [CrossRef]
- Irvine, J.J. An analysis of the problem of the disappearing Black educator. Elem. Sch. J. 1988, 88, 503–514. [Google Scholar] [CrossRef]
- Ladson-Billings, G. Toward a theory of culturally relevant pedagogy. Am. Educ. Res. J. 1995, 32, 465–491. [Google Scholar] [CrossRef]
- Lewis, C.W.; Toldson, I. Black Male Teachers: Diversifying the United States’ Teacher Workforce; Emerald Group: Bingley, UK, 2013. [Google Scholar] [CrossRef]
- Rogers-Ard, R.; Knaus, C.B.; Epstein, K.K.; Mayfield, K. Racial diversity sounds nice; systems transformation? Not so much: Developing urban teachers of color. Urban Educ. 2013, 48, 451–479. [Google Scholar] [CrossRef]
- Villegas, A.M.; Strom, K.; Lucas, T. Closing the racial-ethnic gap between students of color and their teachers: An elusive goal. Equity Excell. Educ. 2012, 45, 283–301. [Google Scholar] [CrossRef]
- Albert Shanker Institute. The State of Teacher Diversity in American Education; Albert Shanker Institute: Washington, DC, USA, 2015. [Google Scholar]
- Torres, J.; Santos, J.; Peck, N.L.; Cortes, L. Minority Teacher Recruitment, Development, and Retention; Brown University, Educational Alliance: Providence, RI, USA, 2004. [Google Scholar]
- Villegas, A.M.; Lucas, T. Diversifying the teacher workforce: A retrospective and prospective analysis. In Developing the Teacher Workforce (103rd Yearbook of the National Society for the Study of Education, Part 1); Smylie, M.A., Miretzky, D., Eds.; University of Chicago Press: Chicago, IL, USA, 2004; pp. 70–104. [Google Scholar]
- Zumwalt, K.; Craig, E. Teachers’ characteristics: Research on the demographic profile. In Studying Teacher Education: The Report of the AERA Panel on Research and Teacher Education; Cochran-Smith, M., Zeichner, K.M., Eds.; Lawrence Erlbaum: Mahwah, NJ, USA, 2005; pp. 111–156. [Google Scholar]
- Ingersoll, R.; May, H.; Collins, G. Recruitment, employment, retention and the minority teacher shortage. Educ. Policy Anal. Arch. 2018, 27. [Google Scholar] [CrossRef] [Green Version]
- Ingersoll, R.; May, H.; Collins, G.; Fletcher, T. Trends in the Recruitment, Employment and Retention of Teachers from Under-Represented Racial-Ethnic Groups, 1987 to 2016. In AERA Handbook of Research on Teachers of Color and Indigenous Teachers; Bristol, T., Gist, C., Eds.; American Educational Research Association: Washington, DC, USA, 2021. [Google Scholar]
- Gorard, S.; Maria Ventista, O.; Morris, R. Who Wants To Be a Teacher? Findings from a Survey of Undergraduates in England. 2021. Available online: https://0-www-tandfonline-com.brum.beds.ac.uk/doi/full/10.1080/03055698.2021.1915751 (accessed on 8 May 2021).
- Atkin, M. Who Will Teach in in High School? Daedalus 1981, 110, 91–104. [Google Scholar] [CrossRef]
- Bacolod, M.P. Do alternative opportunities matter? The role of female labor markets in the decline of teacher quality. Rev. Econ. Stat. 2007, 89, 737–751. [Google Scholar] [CrossRef]
- Corcoran, S.; Evans, W.; Schwab, R. Changing labor-market opportunities for women and the quality of teachers, 1957–2000. Pap. Proc. Am. Econ. Rev. 2004, 94, 230–235. [Google Scholar] [CrossRef] [Green Version]
- Gitomer, D.H. Teacher Quality in a Changing Policy Landscape: Improvements in the Teacher Pool; Educational Testing Service: Princeton, NJ, USA, 2007. [Google Scholar]
- Barron. Barron’s Profiles of American Colleges, 28th ed.; Barron: Hauppauge, NY, USA, 2009. [Google Scholar]
- Murnane, R.; Singer, J.; Willett, J.; Kemple, J.; Olsen, R. (Eds.) Who Will Teach? Policies That Matter; Harvard University Press: Cambridge, MA, USA, 1991. [Google Scholar]
- Borman, G.D.; Dowling, N.M. Teacher attrition and retention: A meta-analytic and narrative review of the research. Rev. Educ. Res. 2008, 78, 367–409. [Google Scholar] [CrossRef]
- Carver-Thomas, D.; Darling-Hammond, L. The trouble with teacher turnover: How teacher attrition affects students and schools. Ed. Policy Anal. Arch. 2019, 27. [Google Scholar] [CrossRef] [Green Version]
- Guarino, C.; Santibanez, L.; Daley, G. Teacher recruitment and retention: A review of the recent empirical literature. Rev. Educ. Res. 2006, 76, 173–208. [Google Scholar] [CrossRef] [Green Version]
- Johnson, S.M.; Berg, J.; Donaldson, M. Who Stays in Teaching and Why: A Review of the Literature on Teacher Retention; Harvard Graduate School of Education: Cambridge, MA, USA, 2005. [Google Scholar]
- See, B.H.; Morris, R.; Gorard, S.; Kokotsaki, D.; Abdi, S. Teacher Recruitment and Retention: A Critical Review of International Evidence of Most Promising Interventions. Educ. Sci. 2020, 10, 262. [Google Scholar] [CrossRef]
- Lankford, H.; Loeb, S.; Wyckoff, J. Teacher sorting and the plight of urban schools: A descriptive analysis. Educ. Eval. Policy Anal. 2002, 24, 37–62. [Google Scholar] [CrossRef] [Green Version]
- Barnes, G.; Crowe, E.; Schaefer, B. The Cost of Teacher Turnover in Five School Districts; National Commission on Teaching and America’s Future: Washington, DC, USA, 2007. [Google Scholar]
- Levy, A.J.; Ellis, P.; Joy, L.; Jablonski, E.; Karelitz, T. The Causes and Costs of Turnover for Science and Other Teachers; American Educational Research Association: Denver, CO, USA, 2010. [Google Scholar]
- Milanowski, A.; Odden, A. A New Approach to the Cost of Teacher Turnover; Center on Reinventing Public Education: Seattle, WA, USA, 2007. [Google Scholar]
- Merrill, E. An Analysis Of The Teacher Turnover Policy Problem In New York City’s Middle Schools. Ph.D. Thesis, University of Pennsylvania, Philadelphia, PA, USA, 2014. [Google Scholar]
- Ronfeldt, M.; Loeb, S.; Wykoff, J. How teacher turnover harms student achievement. Am. Educ. Res. J. 2013, 50, 4–36. [Google Scholar] [CrossRef] [Green Version]
- Ingersoll, R.; Perda, D. How High Is Teacher Turnover and Is It a Problem; University of Pennsylvania: Philadelphia, PA, USA, Forthcoming.
- Holme, J.J.; Jabbar, H.; Germain, E.; Dinning, J. Rethinking Teacher Turnover: Longitudinal Measures of Instability in Schools. Educ. Res. 2018, 47, 62–75. [Google Scholar] [CrossRef] [Green Version]
- Papay, J.P.; Bacher-Hicks, A.; Page, L.C.; Marinell, W.H. The Challenge of Teacher Retention in Urban Schools: Evidence of Variation from a Cross-Site Analysis. Educ. Res. 2017, 46, 434–448. [Google Scholar] [CrossRef]
Figure 1.
Trends in the Number of Elementary and Secondary School Teachers and Students, from 1987–1988 to 2017–2018.
Figure 1.
Trends in the Number of Elementary and Secondary School Teachers and Students, from 1987–1988 to 2017–2018.

Figure 2.
Percent Change in Students and Teachers, by School Type, from 1987–1988 to 2017–2018.

Figure 3.
Percent Increase in Students, and Teachers by Field, from 1987–1988 to 2017–2018.

Figure 4.
Age of Teachers, 1987–1988 and 2017–2018.

Figure 5.
Trends in the Percent of Teachers Age 50 and Over, from 1987–1988 to 2017–2018.

Figure 6.
Teaching Experience of Teachers, 1987–1988 and 2017–2018.

Figure 7.
Percent Female Teachers, from 1980–1981 to 2017–2018.

Figure 8.
Percent Change in Teachers and Principals, by Sex, from 1987–1988 to 2017–2018.

Figure 9.
Percent Female Teachers and Principals, by School Level, 2017–2018.

Figure 10.
Percent US Population, Students and Teachers, by Race/Ethnicity, 2017–2018.

Figure 11.
Percent Change in the Number of Students and Teachers, by Race/Ethnicity, from 1987–1988 to 2017–2018.
Figure 11.
Percent Change in the Number of Students and Teachers, by Race/Ethnicity, from 1987–1988 to 2017–2018.

Figure 12.
Percent First-Year Public School Teachers, by Selectivity of their Undergraduate College/University, 1987–1988 to 2017–2018.
Figure 12.
Percent First-Year Public School Teachers, by Selectivity of their Undergraduate College/University, 1987–1988 to 2017–2018.

Figure 13.
Percent First-Year Public School Teachers, with Undergraduate Degrees from the Most and Highly Selective Colleges/Universities, by Gender, 1987–1988 to 2017–2018.
Figure 13.
Percent First-Year Public School Teachers, with Undergraduate Degrees from the Most and Highly Selective Colleges/Universities, by Gender, 1987–1988 to 2017–2018.

Figure 14.
Among 1993 College Grads Who Entered Selected Occupations by 1997, Percent Who Left Occupation by 2003.
Figure 14.
Among 1993 College Grads Who Entered Selected Occupations by 1997, Percent Who Left Occupation by 2003.

Figure 15.
Cumulative Percent Attrition of Beginning Teachers, by Years of Experience, 1993–2003.

Figure 16.
Percent Annual First-Year Public School Teacher Attrition, from 1988–89 to 2012–2013.

Figure 17.
Percent First-Year Public School Teachers Reporting Various Reasons Important for Their Turnover, 2012–2013.
Figure 17.
Percent First-Year Public School Teachers Reporting Various Reasons Important for Their Turnover, 2012–2013.

Figure 18.
Percent First-Year Public School Teachers Reporting Dissatisfaction-Related Reasons Important for Their Turnover, 2012–2013.
Figure 18.
Percent First-Year Public School Teachers Reporting Dissatisfaction-Related Reasons Important for Their Turnover, 2012–2013.

Publisher’s Note: MDPI stays neutral with regard to jurisdictional claims in published maps and institutional affiliations. |
© 2021 by the authors. Licensee MDPI, Basel, Switzerland. This article is an open access article distributed under the terms and conditions of the Creative Commons Attribution (CC BY) license (https://creativecommons.org/licenses/by/4.0/).
Share and Cite
MDPI and ACS Style
Ingersoll, R.; Merrill, E.; Stuckey, D.; Collins, G.; Harrison, B. The Demographic Transformation of the Teaching Force in the United States. Educ. Sci. 2021, 11, 234. https://0-doi-org.brum.beds.ac.uk/10.3390/educsci11050234
AMA Style
Ingersoll R, Merrill E, Stuckey D, Collins G, Harrison B. The Demographic Transformation of the Teaching Force in the United States. Education Sciences. 2021; 11(5):234. https://0-doi-org.brum.beds.ac.uk/10.3390/educsci11050234
Chicago/Turabian StyleIngersoll, Richard, Elizabeth Merrill, Daniel Stuckey, Gregory Collins, and Brandon Harrison. 2021. "The Demographic Transformation of the Teaching Force in the United States" Education Sciences 11, no. 5: 234. https://0-doi-org.brum.beds.ac.uk/10.3390/educsci11050234
Note that from the first issue of 2016, this journal uses article numbers instead of page numbers. See further details here.