
Economic Growth, Governance and Educational Sustainability: A VAR Analysis


Department of Economic Sciences, North-West University, Vanderbijlpark 1900, South Africa
Educ. Sci. 2021, 11(7), 343; https://0-doi-org.brum.beds.ac.uk/10.3390/educsci11070343
Submission received: 22 June 2021
/
Revised: 3 July 2021
/
Accepted: 6 July 2021
/
Published: 13 July 2021
(This article belongs to the Special Issue Including Sustainable Development Goals (SDGs) Transversally in Education)
Abstract
:Quality educational institutions are strategic tools for accelerating the attainment of Sustainable Development Goals (SDGs). All the 17 SDGs are interlinked. For instance, quality education (SDG4) reduces poverty (SDG 1,2) and inequalities (SDG10) and stimulates good health and wellbeing (SDG3). The paper applied unorthodox theoretical postulations such as convergence models, intergovernmentalism, neofunctionalism and neorealism in explaining how functional (educational) institutions are a necessary enabling environment in accelerating the attainment of SDGs. Empirically, the paper identified unclear modus operandi, lack of political will, political instability, small and fragmented markets and economies with heterogeneous characteristics, and lack of standardization of product and procedures, among other factors, as constraints to sustainability in tertiary education. A Vector Autoregressive (VAR) model was employed using data from 51 Sub-Saharan countries. The three variables were gross domestic product per capita (GDPP), governance and tertiary education expenditure. Results indicated significant short-run unidirectional causality from gross domestic product per capita and tertiary education expenditure to governance, but joint short-run causality was not established. However, transmission effects across the three variables became significant as the number of years increased to ten years. The study recommends a holistic approach from policymakers in order to ensure sustainability in tertiary education due to interlinkages, with emphasis placed on direction of causality.
1. Introduction
The Global Goals, also known as the 17 Sustainable Development Goals (SDGs), which were agreed upon in 2015 by the United Nations member states, are fundamentally aimed at improving welfare indicators by 2030. These goals are intertwined in such a way that improvement in one area usually leads to improvement in one or more other indicators due to causality and multiplier effects. For instance, there is vast literature that indicates that quality education (SDG 4) is a strategic tool towards the attainment of poverty reduction as well as for addressing inequalities and stimulating good health and well-being (SDG 1,2,3,4,10) [1,2,3,4,5]. Educated citizens are more productive when they have better chances for decent work, which contributes to economic growth (SDG 8). Moreover, an educated society has a better appreciation of affordable clean energy and water (SDG 6,7), which in turn leads to sustainable cities and communities (SDG 6,7,8,11). On the other hand, to achieve quality education, there is need for quality institutions, which are strategic tools in disseminating knowledge and information on SDGs and other related subjects. These educational institutions should operate in an environment of peace and justice (SDG 16,17) so that they are able to form strong horizontal and vertical partnerships in order to compound the results of their activities. The gains of partnerships or collaborations are anchored on the convergence arguments pioneered by Robert Mundell and will be discussed later [6,7]. Ref. [8] posited that there is an expectation of educational institutions—especially universities—to lead and provide innovative sustainable practices, since they are generators of cutting-edge research.
Sadly, for Africa, the continent is characterised by weak political governance and economic institutions, whose effects trickle down to affect educational institutions. There is a broad sentiment that African institutions have been invariably disappointing, and without strong (educational) institutions, two outcomes are likely to happen: either the attainment (let alone the acceleration) of SDGs will be futile, or in the case where some progress is made, results are likely to be reversed [9,10]. These negative results are compounded by the emergence of the novel coronavirus (COVID-19), which has forced nations and institutions into forced isolation and lockdowns, thereby negating any forms of progress in terms of partnerships and value chains, which were gaining momentum.
A deeper examination of the literature reveals that the renewed vigour on SDGs (formerly MDGs) may not be realised without key institutions. This paper will focus on educational institutions that are both learning and research centres. They are usually the pivot toward long-term success of most economies. Thus, this study employs the Vector Autogressive (VAR) analysis to analyse interlinkages between the key indicators of economic growth, governance and educational sustainability by taking into account selected African economies. The VAR model was preferred because of its ability to establish both the relationship and casual links between variables, unlike some econometric models that only focus on the former. The key variables for this study were gross domestic product per capita (GDPP), governance and expenditure on tertiary education. The paper contributes to the literature by providing a multi-country and multidimensional analysis in addition to unorthodox approaches to some nuances in its application of the econometric model. This is because the model took into account composite variables, which accommodated several other elements.
2. Literature Review
2.1. Economic Perspectives
At a macro level, investment in education in Africa is characterised by several inconsistencies. While some countries make notable efforts to disburse a good proportion of their national revenues towards the education and health ministries, the majority of countries still allocate the lion’s share towards the security and defence ministries, even during times of peace. The situation is exacerbated by the fact that African economies within themselves are characterised by low income per capita, with widespread poverty and high inequality; Nigeria recently overtook India to become the poverty capital of the world [11,12,13]. South Africa is one of the most unequal countries in the world [14,15], and there is sustained poverty in Malawi [16,17] and worsening living standards in Zimbabwe [18]. These complex and gloomy macroeconomic dynamics filter down and affect educational institutions, making the attainment of SDGs a mammoth task. All these factors affect the both the quality of educational institutions and the quality of education itself.
Macroeconomic policy consistency creates the necessary stimuli for educational institutions to both develop internally and also partner with their respective institutions in other countries across the continent. As Mundell [6,7] postulated in his convergence argument, synchronised business cycles are a necessary prelude for sustainable integration and partnerships. Africa acknowledged this argument by establishing the “macroeconomic convergence criteria” through its regional economic communities (RECs). It was realised that there is a need to have fiscal and monetary policy discipline in order to achieve this synchronization, which will ultimately improve economic welfare [19]. When nations are converging, it implies that their economies and/or institutions are moving in a systematic fashion, thereby attaining a similar level of wealth and development. Thus, convergence makes it easier for collaboration of micro-institutions such as universities or research centres in the respective countries. This argument possibly explains why there have been more university collaborations outside Africa compared to those within.
In North America, strong institutional commitment was signalled by Yale University, where there were various university-wide efforts on sustainability, guided by their strategic plan: the Sustainability Strategic Plan 2013–2016 [20] (Yale University, 2015). In Sweden, the University of Uppsala Centre for Sustainable Development coordinated interdisciplinary initiatives on collaborations between the Centre and the Swedish University of Agricultural Sciences. Together, they aim to be research catalysts in education of sustainable development. In the case of developing countries, forty Brazilian universities representing 89% of offered programmes conducted exploratory research to map the emphasis given to the SDGs. The conclusion was that the involvement of SDGs in business administration programmes was slow and irregular, with only 13 (33%) of offered courses having some links to the subject [21]. These irregular results could be attributable to a lack of macro convergence, which is characteristic of many developing economies.
However, ref. [22] provides a contrary school of thought, anchored in ex-ante convergence. According to this idea, convergence is not a prelude to integration. On the contrary, it is the collaboration or partnerships of countries or institutions at different levels of development that will actually lead to convergence. This is because the less developed economy or institution is then able to imitate technology and methods more easily and cheaply without incurring the initial costs of research and development [23,24,25]. Thus, African countries could extrapolate from this argument to establish more collaborations with the developed world, since the continent can benefit from the “catch up” effect by taking advantage of reduced costs for research and development, which are usually incurred before technological developments can be scaled up, as posited in the Solow model [26,27,28].
Apart from South African and Kenyan universities in general, Makerere University in Uganda, Pan African University (PAU) in Nigeria, Nelson Mandela African Institute of Science and Technology (NM AIST) and University of Dar es Salaam (UDSM) in Tanzania, and more recently the Rwandan universities, African universities do not generally engage in collaborations with educational institutions from the developed world. In fact, at the continental level, African educational and research institutions lag behind in terms of both collaborations and quality research outputs. This results in slow progress towards the attainment of SDGs. Refs. [29,30,31] argued that there has been an improvement with regards to sustainability co-creation, that is, increased willingness to join with societal stakeholders. A similar approach would enrich education and research through transdisciplinary knowledge production and pragmatic solutions [32].
There is a need to bring awareness and appreciation to the fact that SDGs require a continental approach to avoid the spill-over effect [19]. There is a usually a tendency for African countries to operate in silos, despite them signalling cooperation through RECs and the African Union (AU). More recent COVID-19 developments are a testament to that; African countries demonstrated little no collaboration, despite the acknowledgement that this is a global pandemic with tangible spill-over effects [33]. In fact, the underlying “zero-sum” notion upon which such policies are anchored was refuted as far back as 1817, when David Ricardo articulated that all stakeholders stand to gain due to variances in elasticities. Research centres have different specialties (elasticities) and can therefore optimise their gains through collaboration, which in turn improves overall welfare and acceleration towards the attainment of SDGs.
2.2. Governance Issues in Institutions
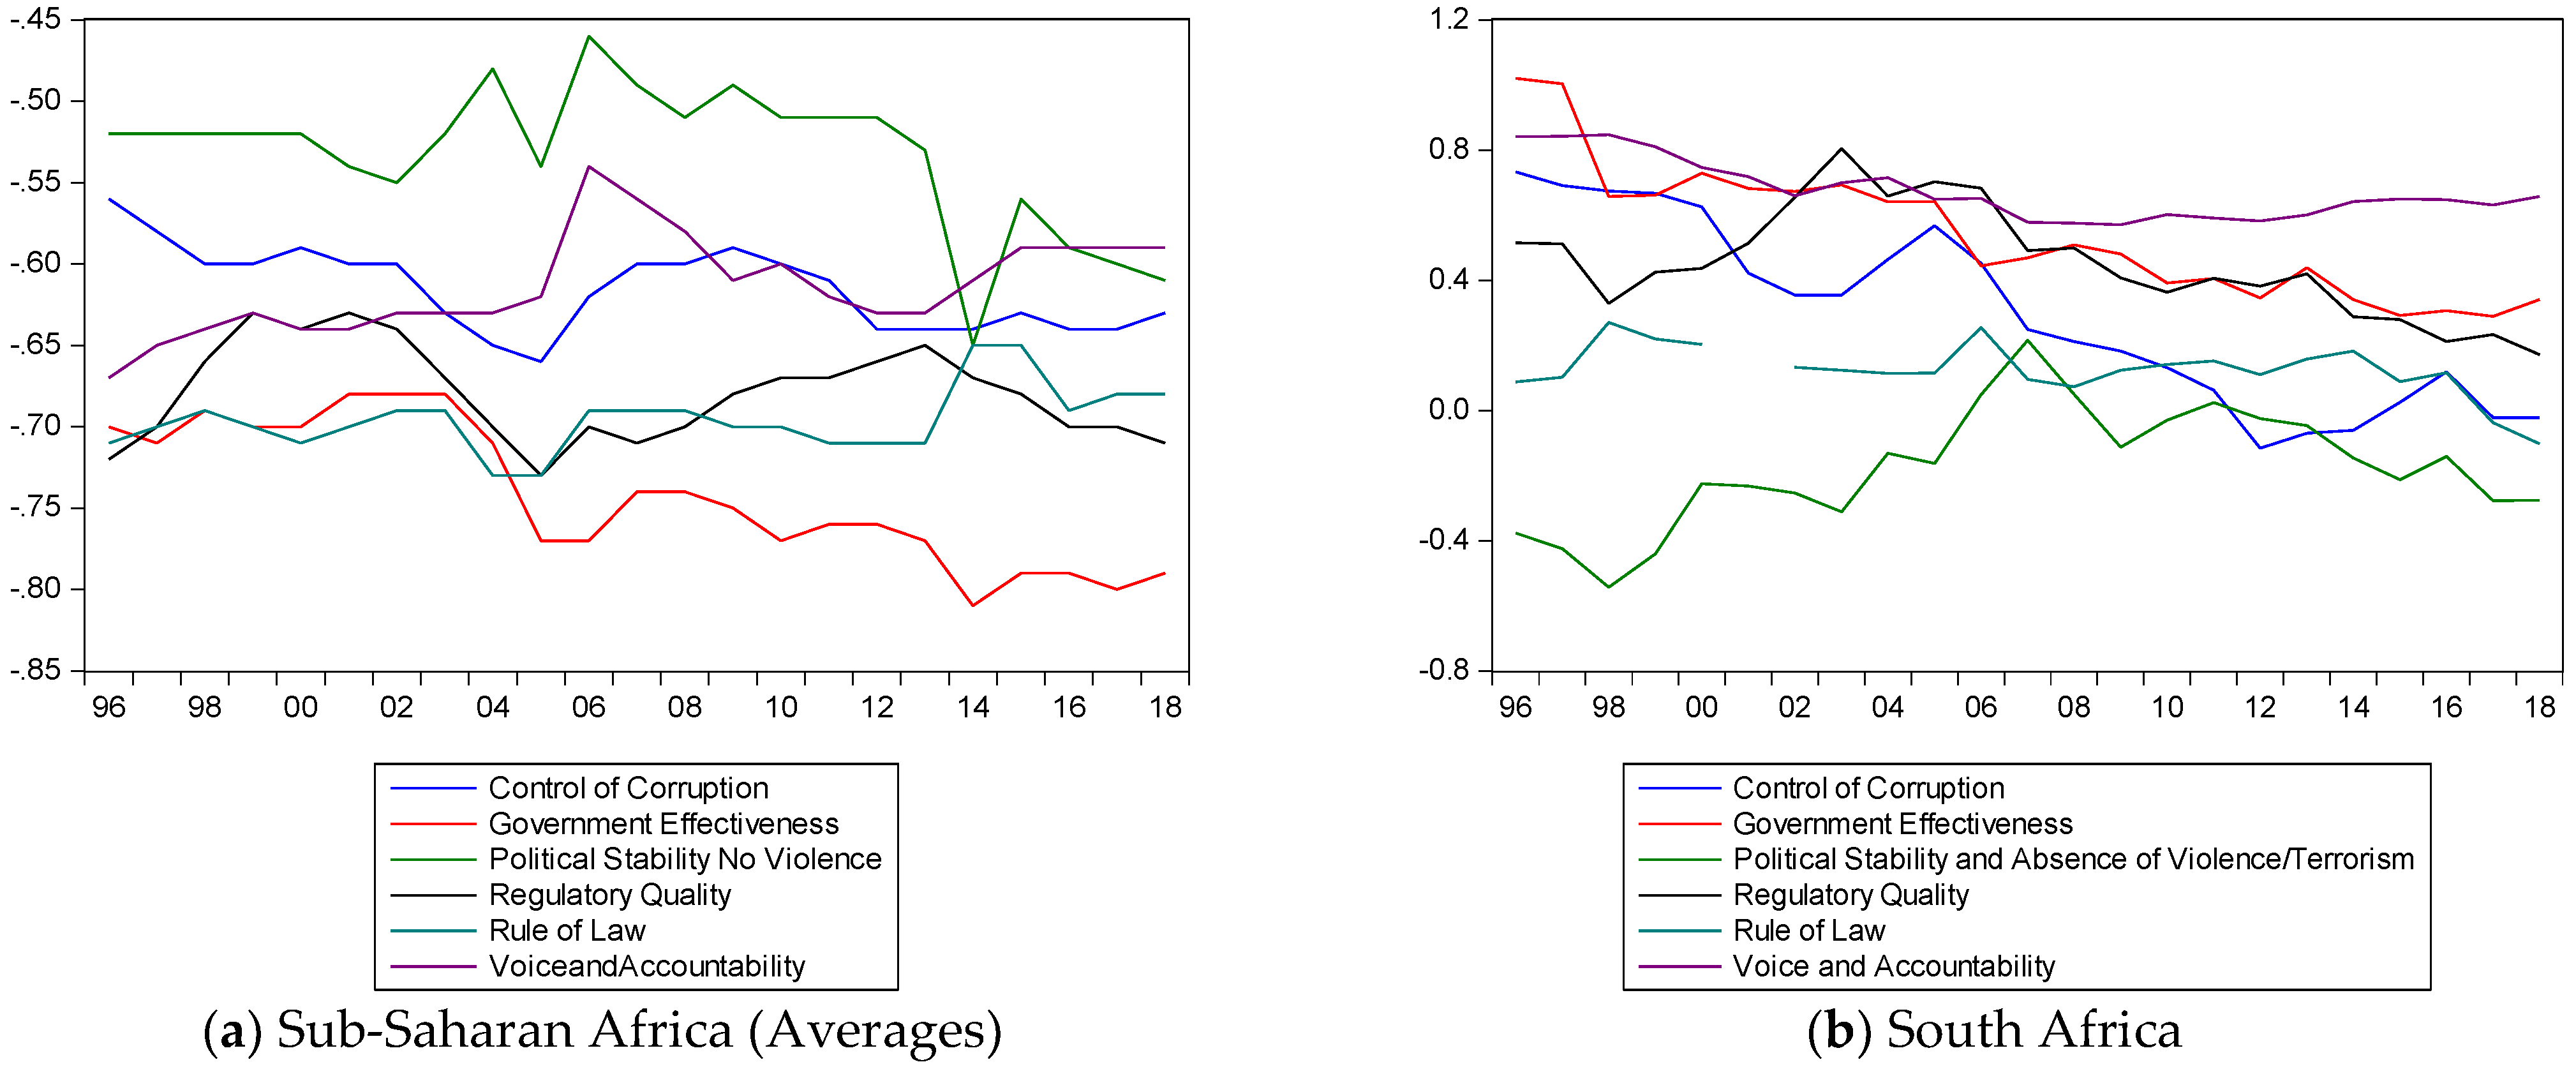
Governance is a composite term and can thus be viewed from variant angles. These include regulatory quality, rule of law, political stability, voice and accountability, government effectiveness, absence of violence or terrorism and control of corruption. Thus, some countries fare well in some indicators while others struggle in different areas. For instance, although South Africa generally fares well above many African countries, it is rather worrying to note that the country is characterised by declining indicators of governance. Similar to other African nations, South Africa has had incidences of political instability, which introduced high levels of uncertainty, especially during election years and periods of the “Fees must fall” movement. Election campaigns included controversial subjects such as land appropriation with or without compensation, which generally increased investment uncertainty, thereby destabilising macroeconomic conditions. The “Fees must fall” movement not only introduced a shock in terms of the learning periods, but also introduced structural changes as students demanded free education. Some analysts argued that although the notion was noble, it was not sustainable, as it put a fiscal strain on the country. The Figure 1 below provides a comparison between the Sub-Saharan African countries and the South African economy.
The figure above clearly shows that regional values are negative, while South Africa has positive values, except for absence of violence and political stability. However, the worrying issue is that the South African values are also declining and converging towards regional averages. This is possibly due to spill-over effects, an argument raised earlier. Similar arguments could be used in economies that are affected by terrorist attacks, such as Nigeria (Boko Haram) and Somalia and Kenya (Al Shabab), and civil war, such as Cameroon, the Democratic Republic of Congo, Mozambique and Sudan.
The significance of political stability in quality of education cannot be overemphasised. Institutional frameworks in Africa generally are predicated on attitudes of politicians such that, like other policies, SDG projects will live or die with them. In most nations, the Vice-Chancellor and university executive lack independence, as they are appointed by the president, who is usually the Chancellor. Such frameworks are unsustainable due to political instability as a result of politicians who are usually forcibly rejected for various reasons beyond the scope of this paper. The incoming leadership will have no interest in following up on such projects (e.g., SDG-related projects), even if they are aimed at improving the welfare of citizens. The consequences are paralysed institutions [33,34,35,36]. While there have been notable efforts in South Africa to integrate SDGs with the National Development Plan (NDP), there is little evidence of this synchronisation in most African countries’ national policies. Lozano (2011) argued that political corruption threatens sustainability in education. In Africa, this is deeply entrenched within the structures of the tertiary institutions. Ref. [37] indicated that although democratisation made governments less secretive, political corruption permeates through endless restructuring exercises that make the domain vulnerable. Consequently, there is routine misconduct in terms of financial misappropriation. This manifests through political solidarity and increased citizen entitlement, sometimes masked as initiatives such as the “Indigenisation policy” in Zimbabwe and the “Broad Based Black Economic Empowerment (BBBEE)” in South Africa, resulting in discriminatory tendering. Unfortunately, educational and research institutions are not spared the chaos.
However, it is not all doom and gloom for the African continent. Botswana has had a fairly impressive performance in its governance indicators since it attained independence in 1966. Recent improvements in some governance indicators such as the control of corruption, government effectiveness and rule of law in countries like Rwanda under Paul Kagame and Tanzania under Dr. John Magufuli has led to some positive outcomes not only in governance but also in quality of tertiary education. Rwandan universities now have several collaborations with regional and international universities. Consequently, the quality of education in these countries has been improving in a sustainable manner. The African Union (AU), which is the higher authority at the continental level, should stimulate regional partnerships in promotion of SDGs. Similar to national educational institutions across the continent, there has been a general sentiment that the AU is failing to provide definitive direction as a higher authority. Historically, the AU failed to address several wars, internal and civil conflicts, and matters relating to memberships in regional economic communities, among others issues [38,39]. This resulted in a lack of trust, a key ingredient needed to drive the SDGs. Despite well-documented SDG plans, there has been little pragmatic action, resulting in an uncoordinated approach towards such a common goal. Espousing the wisdom of intergovernmentalism and neoliberalism (Ujupan, 2005), the AU can stimulate the participation of high- and lower-level office bearers. Thus, visionary leadership and proper governance structures are salient elements in the attainment of long-term objectives such as SDGs.
3. Materials and Methods
3.1. Vector Autoregressive Model
The Vector Autoregressive (VAR) model was employed, since the focus of the investigation is causal effects. Despite the fact that some authors such as [40] criticise the VAR model due to its lack of theoretical outlines, ref. [18] argued that the model can be used when testing interdependence among variables. The VAR model circumvents the necessity of structural modelling, since every variable is treated as exogenous and a function of the lagged values of all endogenous variables. The models are employed in a time series of random disturbances.
Following the assertions of [41], the paper conducted a stationarity test using Augmented Dickey Fuller (ADF) and Granger Causality. Optimal lag length, , was obtained using the Akaike Information Criterion (AIC) so that the probability of multicollinearity, which may emerge due to many degrees of freedom, is minimised while at the same time avoiding too few lags, which may lead to specification errors within the model [41]. There are three variables in the estimated VAR model: economic growth, governance and tertiary education expenditure. Subsequently, the parsimonious trivariate VAR model estimation is
where is economic growth, is governance, is tertiary expenditure as a percentage of gross expenditure on education, , and are coefficients, is white noise disturbances or shocks, is a constant (drift), are lags and is the optimal.
The construction of a Vector Error Correction Mechanism (VECM) is dependent on whether the variables are integrated of the same order or not. In the case that the variables are integrated of different orders, an unrestricted VAR framework is then employed, since dissimilar order of integration nullifies cointegration and consequently the applicability of VECM [1,40]. Cointegration implies that although individual variables are non-stationary, a linear combination of their respective series becomes stationary. This implies that there exists an equilibrium or a long-run relationship between these variables.
Variance Decomposition (VDC) analysis was also provided. It provides information on the relative significance of random shocks by revealing the variance of forecast errors for every endogenous variable. Additionally, the Impulse Response Function (IRF) was also used to trace out responses of current and future values of variables resulting from changes in the current value of one of the VAR errors [42]. The IRF is premised on the assumption that associated errors return to zero in subsequent phases. The IRF shows the dynamic effects of a shock to both other variables and to itself.
3.2. Explanation of Variables
Economic growth per capita () was measured by the rate of growth of GDP divided by the population growth. Per capita values are important because they take into account population changes over the years, giving policy analysts a more accurate picture. This proxy measures the health of an economy and is extensively applied in the literature. However, the proxy also has its shortcomings, and the main ones are omission of inequalities in distribution of income. The Governance (Gov) indicator is the mean of the composite function of five indicators of governance.
where is the control of corruption, is the government effectiveness, is the political stability and absence of violence/terrorism, is the voice and accountability, and is the regulatory quality. The rationale behind using this composite function is to take into account all factors that influence governance at a macroeconomic level. As reflected by the five variables discussed above, governance can be viewed from variant angles, and this paper seeks to employ all variables in its analysis in order to obtain a more comprehensive outlook. The proxy for tertiary educational sustainability () is measured by the percentage of tertiary expenditure as a percentage of total expenditure on education. Tertiary expenditure was considered a reliable proxy because it reflects capital expenditure by tertiary institutions, tertiary enrolment and other expenditures such as staff salaries, research and development. Data were mainly sourced from the World Bank Development Indicators and some authors’ computations.
4. Results
4.1. Descriptive Statistics
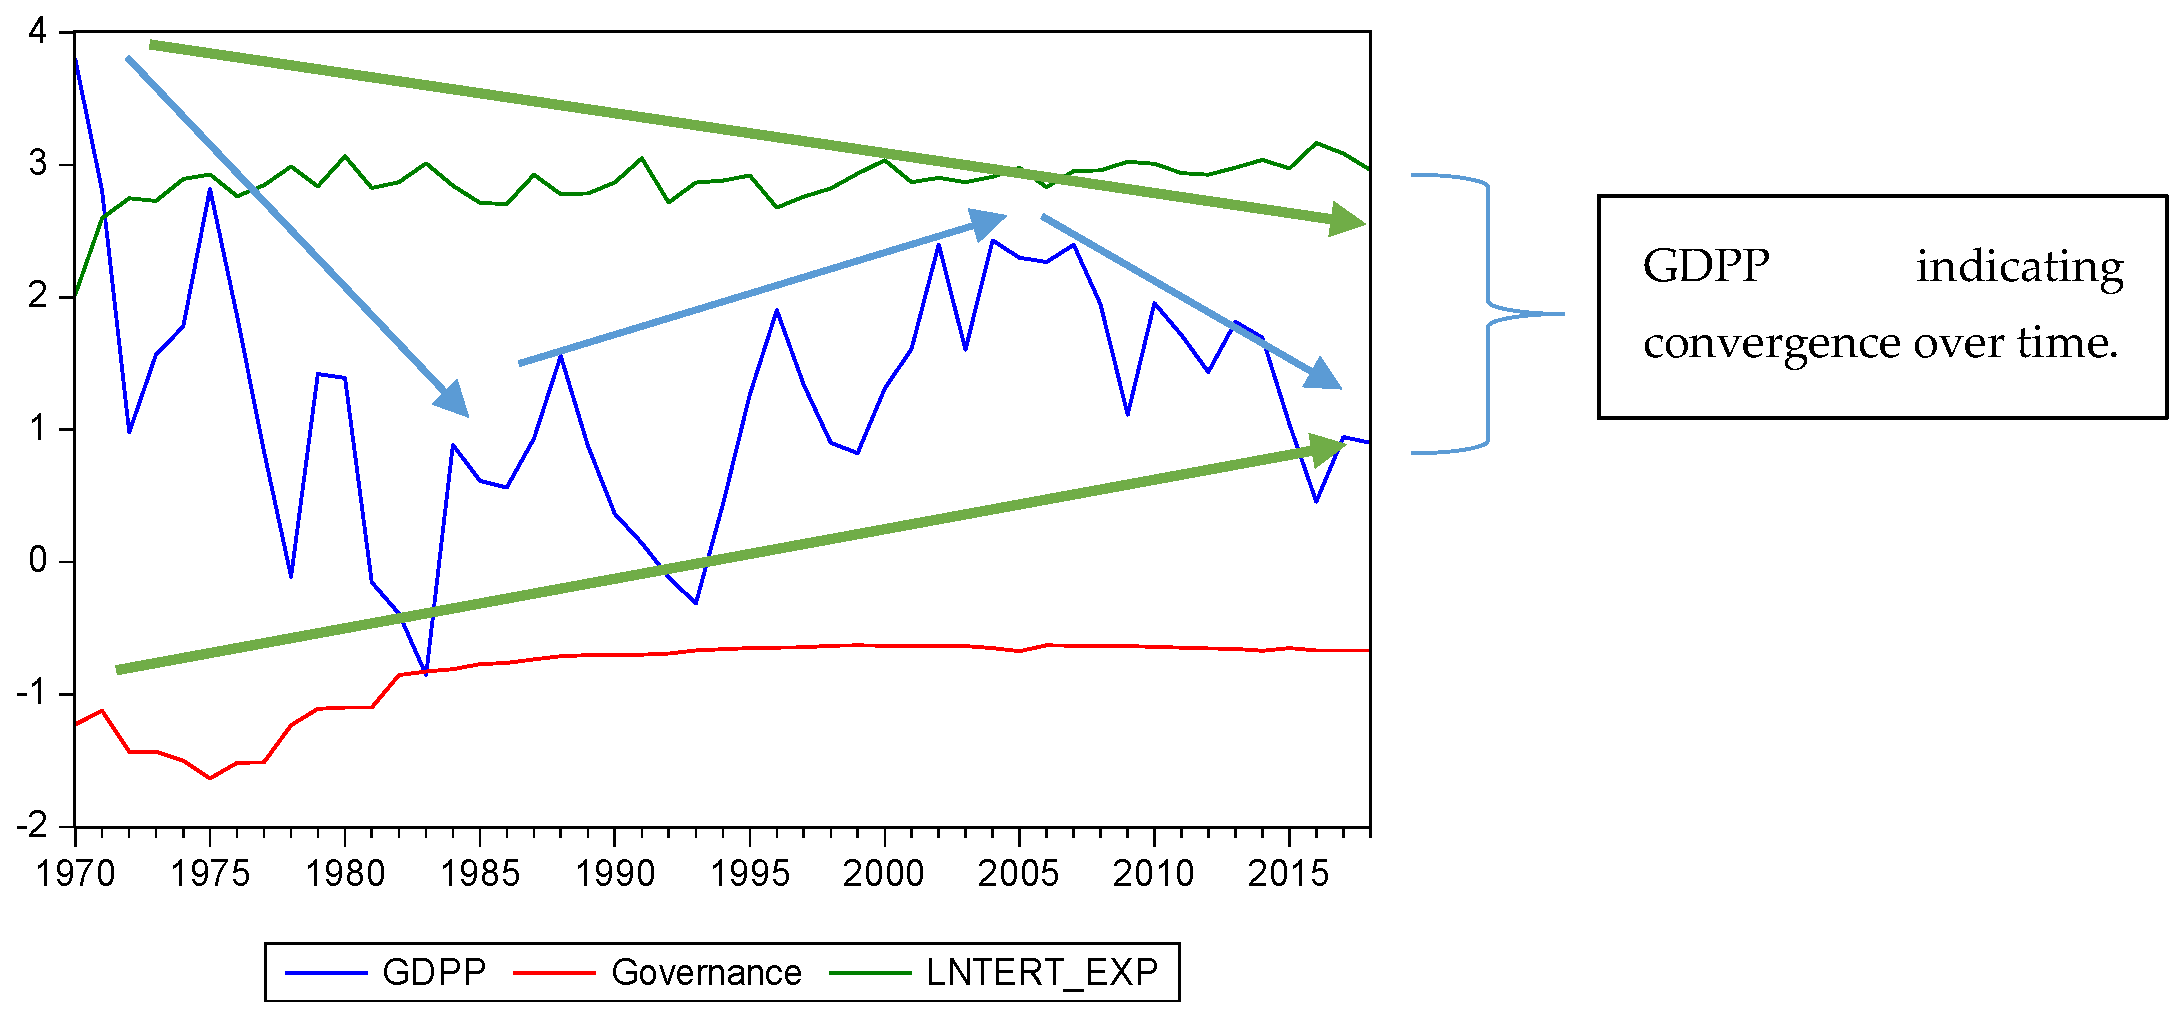
The Figure 2 below shows the trend structures in the SSA region. The three indicators reflect some degree of stability at this point, although there is some level of oscillation of GDPP. The general level of convergence reflected in the GDPP variable could be attributed to the “macroeconomic convergence criteria”, which has been largely adopted by some member countries in their respective regional economic communities [19,43].
More specifically, Figure 2 above indicates that the governance variable declined between 1970 and 1975, followed by an improvement up to the early 1980s. This was probably due to the fact that most African countries had already attained independence by then. However, it is important to note that the overall continental governance index was still in the negative (around −1) and has remained so to date, although stable. This is because Africa is largely characterised by weak and unstable institutions, usually due to political instability, violation of human rights and the rule of law, and inconsistent economic policies, among other factors [37]. Similarly, tertiary education expenditure has remained relatively stable over the period. Notable oscillations have been with regards to GDPP. The period from 1970 to the early 1980s was characterised by a declining trend, while the period from 1983 to the early 2000s is indicative of a positive trend. The GDPP started following a declining trend again around 2005, up until to 2017, due to various macroeconomic factors, which are beyond the scope of this paper.
Table 1 below indicates summary statistics for all three variables for the period 1970 to 2018. These include the mean, median, maximum and minimum, standard deviations, skewness, kurtosis and Jarque-Bera. Overall, there were 49 observations per variable included in the analysis.
4.2. Pre-Estimation Tests
Pre-estimation tests were also conducted to ensure robustness of the results and to avoid spurious regressions. These include multicollinearity, unit root tests and determining the optimal lag length. Table 2 below shows the correlation coefficient matrix, to determine if there is multicollinearity among the variables.
Using the results from Table 2, there is no challenge of multicollinearity, since . The ADF results are presented in Table 3 below for the unit root tests.
The results from the unit root tests indicate that all three variables are stationary in levels. All variables have highly significant probability values of 1% and 5% for GDPP and tertiary expenditure, respectively.
Results from several test criteria are shown in the Table 4 above. Although the methodology section indicated that the Akaike Information Criterion (AIC) would be used in this study, the results above indicate that the AIC is also complemented by three other criteria, which reflect an optimal lag length of two.
Prior to analysis of the results, post-estimation diagnostics were also conducted to ensure that the model is robust. These include the autocorrelation Lagrange-Multiplier (LM) test, the heteroscedasticity test and normality using the Jarque-Bera (JB) joint test. All probability values were insignificant, which means the null hypothesis could not be rejected, implying that the model does not suffer from serial correlation or hetroskedasticity and is normally distributed.
The results for the pairwise Granger causality in Table 5 indicate a unidirectional relationship from GDPP to governance, since was rejected at the 5% significance level. This implies that GDPP or the income of individual citizens is the driving force behind the level of governance. However, the reverse causality was found to be insignificant when taking into account short-run dynamics. The outcome could be different in the long term. Furthermore, results also indicated causal effects of tertiary education expenditure (LNTERT_EXP) on governance. This implies that improvements in tertiary education cause improvements in governance systems and structures. There was no evidence of unidirectional or bidirectional causality between tertiary education expenditure and GDPP. In general, Granger causality did not indicate any support for joint causality between GDPP, governance and tertiary education expenditure, since only two of the six in the non-causation null hypothesis were rejected. Using the causality results from the pairwise Granger, one could reasonably argue that tertiary education expenditure affects GDPP via its effects on governance.
4.3. Vector Autoregressive Results
Table 6 below provides an alternative analysis of the causal effects using the t-statistics of the estimated coefficients. Only two lags are provided, since our AIC indicated two as the optimal lag length. Each variable consists of three rows. The first one indicates the values of the estimated coefficients, the second row shows the probability values (p-values) and the third one indicates the t-values.
The results indicate that the first lag of GDPP has strong short-run causal effects on itself and also on governance, since the value of the t-statistic is highly significant. However, there are no causal effects reflected on tertiary education expenditure by the first lag of GDPP. Taking into account the second lag, the causal effects of GDPP on tertiary education expenditure are weakly significant, since the t-value is close to two. The first level of governance has strong short-run causal effects only, but not on the other two indicators. This is consistent with the Granger causality results discussed earlier. In terms of education, no significant causal effects were observed on the first lag of tertiary education across two variables, although some form of weak significance could be suggested for the variable itself. However, similar to the Granger results, tertiary education has strong causal effects on governance on the second lag.
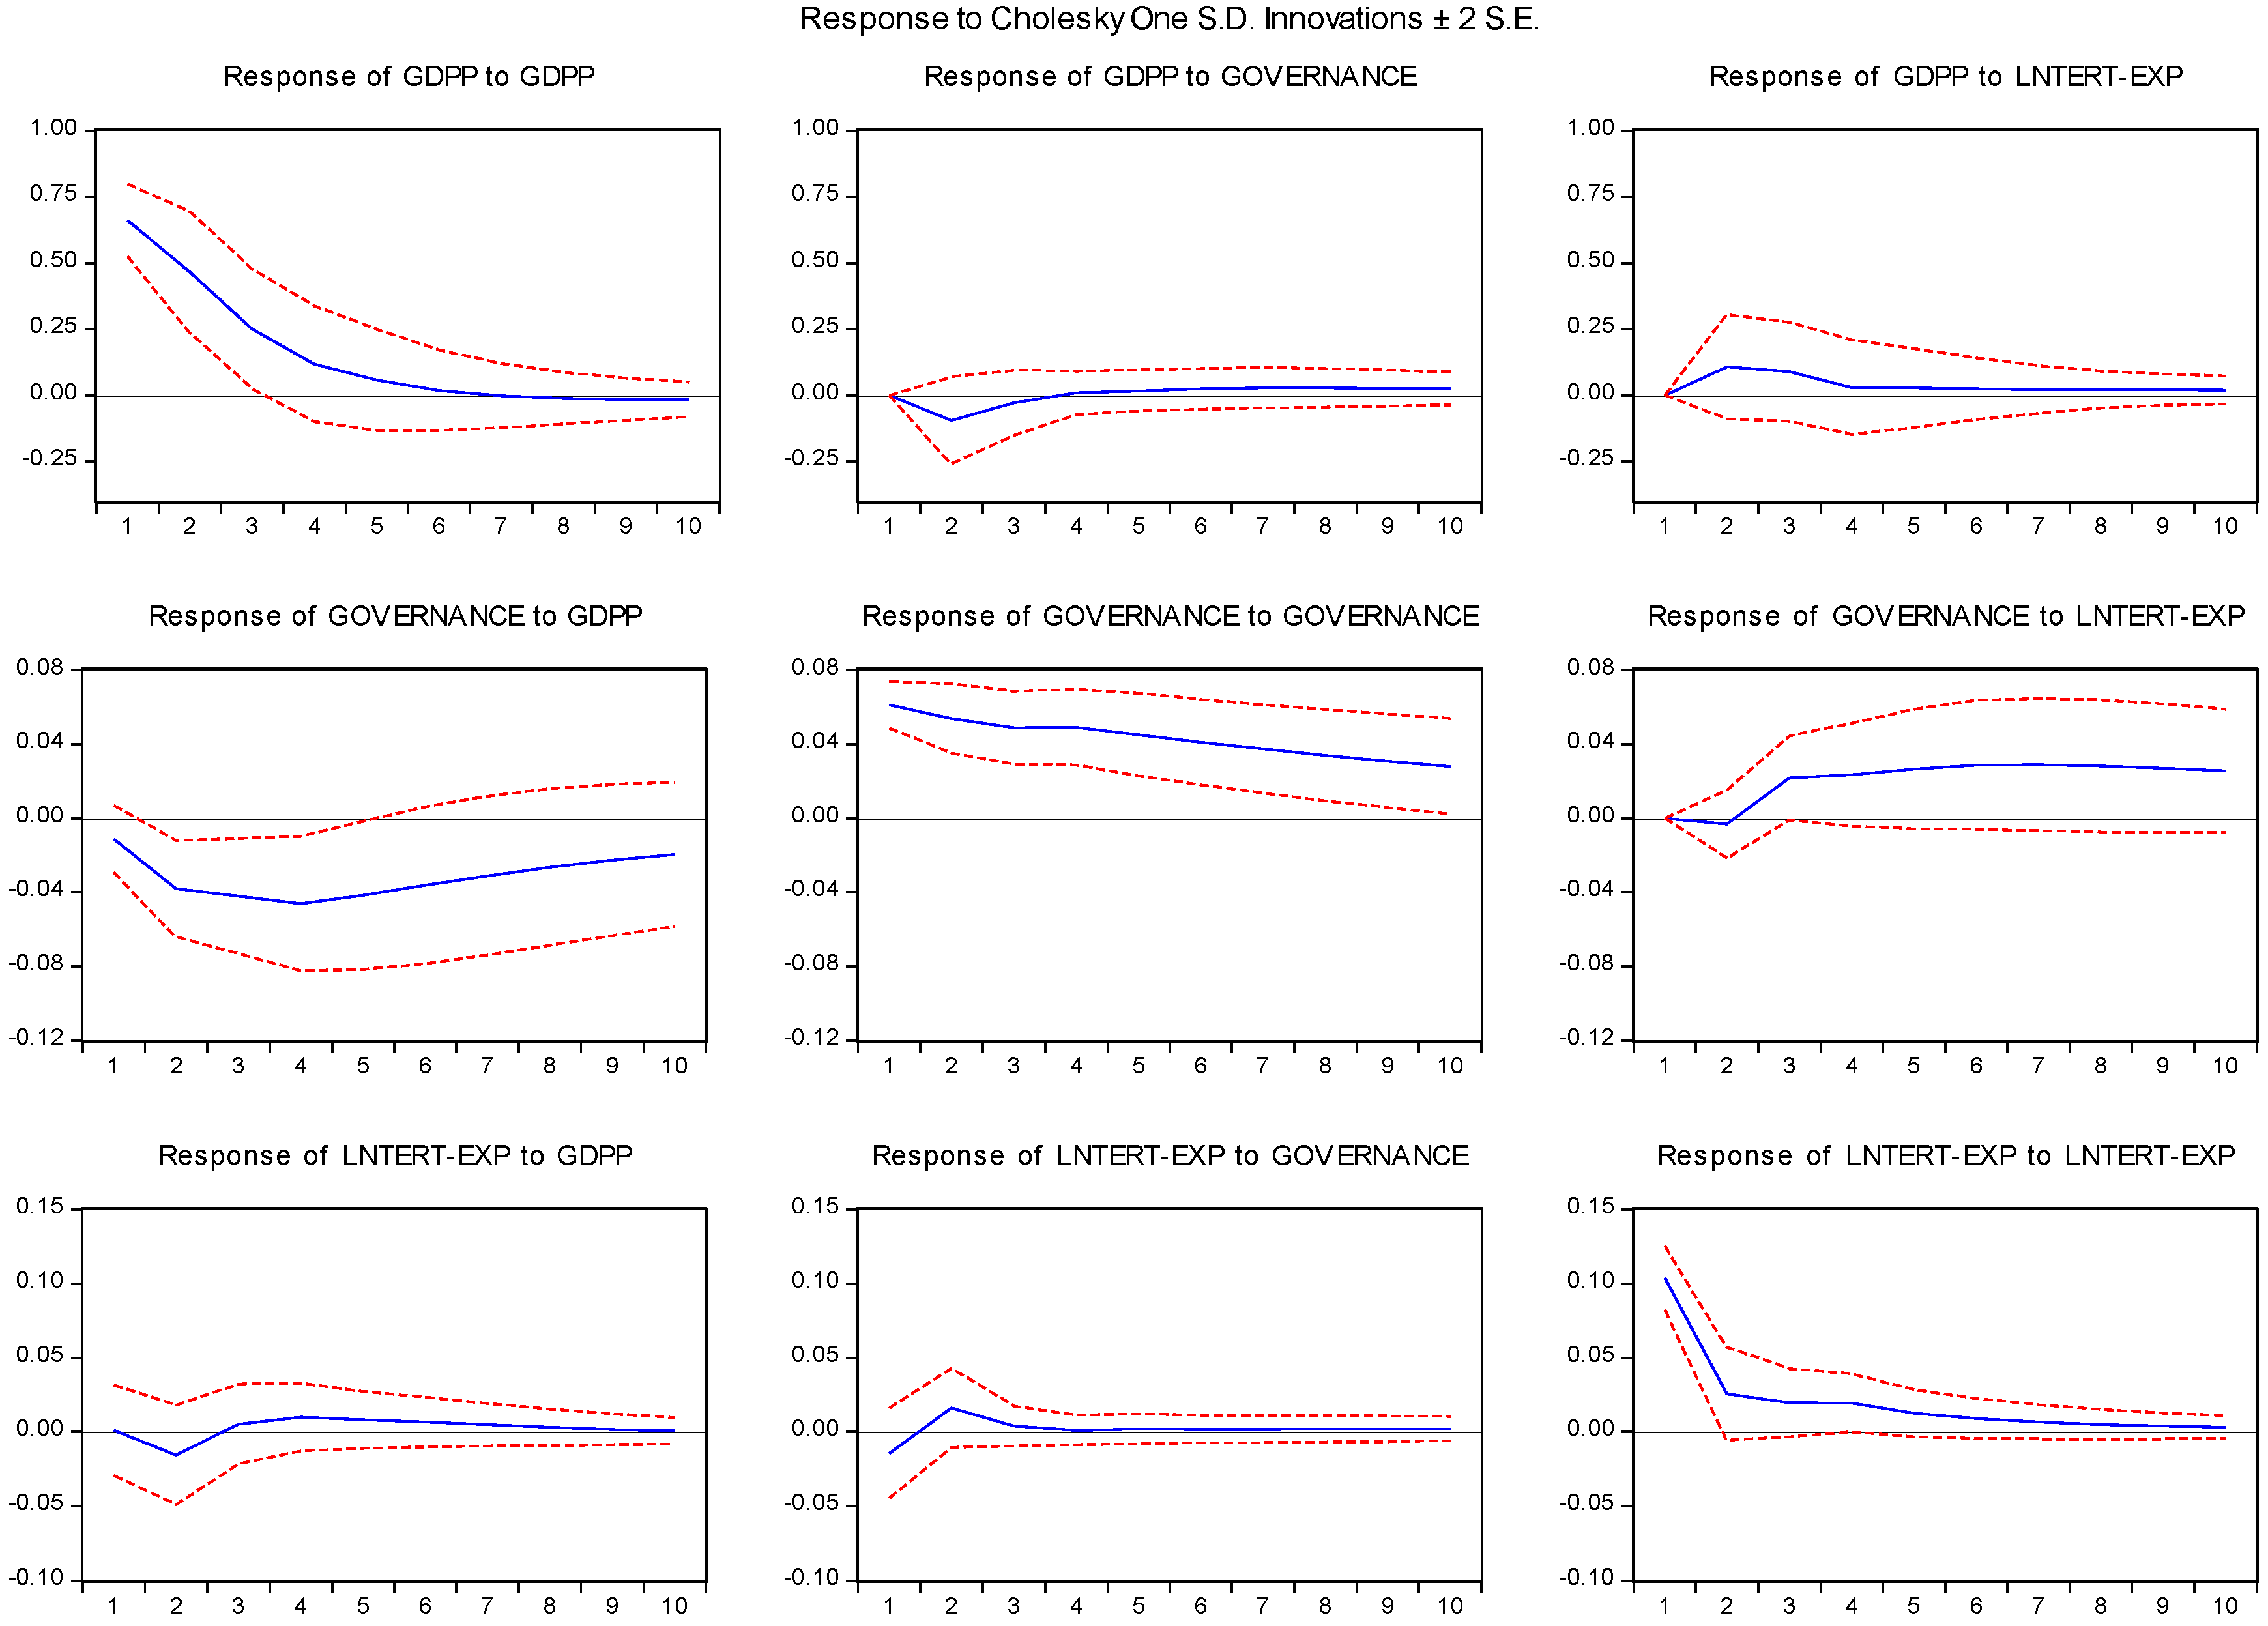
In line with arguments by [41,44], who posited that there is a need to complement VAR results with impulse response functions (IRFs) and/or Variance Decomposition (VDC) to enrich the discussion and understanding of dynamic functions, Figure 3 below presents IRFs, and all shocks are within the 95% confidence interval.
The IRF graphs indicate the dynamic effects due to shocks or innovations in the residual term. The first row shows that GDDP has strong causal effects on itself up to around the fifth or sixth year, before it stabilises around the seventh year. However, slight shocks are transmitted the first year or two from GDPP to governance and expenditure on tertiary education, before they return to their steady state. In the second row, shocks in governance cause shocks to GDPP—first a gradual decrease, followed by a gradual increase. However, important to note is that shocks from governance to GDPP were negative across the ten-year period. Shocks on governance also led to a steady decline of the variable itself, while simultaneously leading to an upward shock on tertiary education expenditure, followed by a steady-state increase. The third row also shows the effect of innovations or shocks on tertiary education expenditure, which are largely felt in the first two years across all variables, with the rest of the period being in a steady state or equilibrium. The IRF results above are also complemented by the variance decomposition in Table 7 below.
The VDC table is complementary to the IRF graphs above. The narrative is basically similar. For instance, the VDC indicates that 100% of shocks or innovations of GDPP are entirely endogenous, with no effects being felt in the other variables. However, a small 5% decline was observed in period 10, implying that shocks of GDPP on other variables slightly increased the effect over time. Transmission from tertiary education expenditure to GDPP was almost zero in the first period and was around 4% in period 10. In terms of governance, transmission effects to GDPP increased from around 3% in period 1 to over 30% in period 10, showing some long-term significance. Similar narratives can be employed for the remaining indicators.
5. Conclusions
The study employed a VAR model to analyse factors accelerating SDGs in Africa. At the core, factors related to achieving SDGs are complex and intricate; they are not only tied to scientific methodologies and outcomes but also to economic, governance and political matters. The analysis included the theoretical and empirical literature and examined how educational institutions are tied into this complex web of attaining SDGs at the continental level. Among other factors, the paper posits that acceleration of achievement of SDGs requires harmonised and well-coordinated efforts from educational institutions such as universities, which are leaders in cutting-edge research, to complementary horizontal and vertical institutions such as government ministries and other related institutions [21,30,31].
A Vector Autogressive (VAR) model was employed in terms of methodology. The results took into account the three variables of gross domestic product per capita, governance and tertiary education expenditure for all 51 Sub-Saharan African countries. While the coverage had the weakness of lacking an in-depth country analysis, the inclusion of SSA countries gives a continent-wide approach. The inclusion of more countries enabled us to have more data points, which improves the reliability in terms of providing continent-wide recommendations. The causality effects from the various tests, that is, pairwise Granger causality, impulse response functions (IRFs) and variance decomposition (VDC), indicated a great degree of complementarity. Generally, the income of individual citizens (GDPP) and expenditure on tertiary education have direct causal effects on governance systems in the short run. On the other hand, tertiary education expenditure affects GDPP via governance, which is an indirect effect. The IRF and VDC indicate significant transmission effects in some variables when taking into account longer periods like ten years, even for those variables that initially showed no short-run transmissions.
Since our governance indicator is a composite variable, the paper recommends that policymakers must ensure political stability, promotion of the rule of law, increased government effectiveness, voice and accountability, regulatory authority and control of corruption. The paper acknowledges the idiosyncrasies that exist within the continent in terms of all six governance indicators. For instance, South Africa may boast of promotion of rule of law and governance, regulatory authority and voice and accountability, but falls short with regard to control of corruption, political stability and non-violence, taking into account several incidences of xenophobia attacks, strikes and high-profile corruption cases. The narrative is similar or worse for several other African countries. Thus, policymakers must endeavour to promote consistency in all governance indicators.
The study clearly indicates that all these issues affect expenditure on tertiary education and ultimately the sustainability of these institutions. Similarly, low income per capita has transmission effects not only on expenditure on tertiary education but also on governance. Both affect quality of education. Thus, these interlinkages remain significant in terms of sustainability. As a result, there is a need for functional institutions (both academic and complementary) when harmonising energy towards achieving SDGs. Accelerating progress will require visionary and dynamic leadership, which ensures that institutions are anchored on (economic) feasibility instead of political affiliations. Refs. [45,46,47] also recommended sufficient mechanisms for protecting universities and administrators when promoting SDGs; by protecting university key personnel such as professors and managers when conducting policy advocacy, alignment is ensured with the broader university guidelines. This can be achieved through a blended top-down and bottom-up approach between the university community and external stakeholders.
Funding
This research received no external funding.
Institutional Review Board Statement
Not applicable.
Informed Consent Statement
Not applicable.
Data Availability Statement
Data was mainly sourced from the World Bank Databank.
Acknowledgments
The author thanks R. Garidzirai for his comments and suggestions on the preliminary version of the manuscript.
Conflicts of Interest
The author declares no conflict of interest.
References
- Pasara, M.T.; Mutambirwa, K.T.; Diko, N. The Trivariate Causality among Education, Health, and Economic Growth in Zimbabwe. Sustainability 2020, 12, 1357. [Google Scholar] [CrossRef] [Green Version]
- Mehrara, M.; Musai, M. The causality between health expenditure and economic growth in Iran. Int. J. Econ. Res 2011, 2, 13–19. [Google Scholar]
- Aka, B.F.; Dummont, J.C. Health, Education and Economic Growth: Testing for Long Run Relationships and Causal Links. Appl. Econ. Int. Dev. 2008, 8, 101–110. [Google Scholar]
- Lucas, R.E. On the mechanics of economic development. J. Monet. Econ. 1988, 22, 3–42. [Google Scholar] [CrossRef]
- Grossman, M. On the Concept of Health Capital and Demand for Health. J. Polit Econ. 1972, 80, 223–255. [Google Scholar] [CrossRef] [Green Version]
- Mundell, R.A. A Theory of Optimum Currency Area. Am. Econ. Rev. 1961, 51, 657–665. [Google Scholar]
- Mundell, R.A. Uncommon Arguments for Common Currencies. In The Economics of Common Currencies; Johnson, H.G., Swoboda, A.K., Eds.; Routledge: New York, NY, USA, 1973; p. 10017. [Google Scholar]
- Too, L.; Bajracharya, B. Sustainable campus: Engaging the community in sustainability. Int. J. Sustain. High. Educ. 2015, 16, 57–71. [Google Scholar] [CrossRef]
- United Nations Publications. Assessing Regional Integration in Africa VIII: Bringing the Continental Free Trade Area about; Publications Section, Economic Commission for Africa: 2017, v 8. Available online: https://books.google.co.zw/books?id=TzWfswEACAAJ (accessed on 15 September 2020).
- Juma, C.; Mangeni, F. African Regional Eocnomic Integration: The Emergence, Evolution, and Impact of Institutional Evolution; Working Paper No. RWP18-003; Belfer Center for Science and International Affairs, Harvard Kennedy School: Cambridge, MA, USA, 2018. [Google Scholar] [CrossRef]
- Pasara, M.T.; Diko, N. The Effects of AfCFTA on Food Security Sustainability: An Analysis of the Cereals Trade in the SADC region. Sustainability 2020, 12, 1419. [Google Scholar] [CrossRef] [Green Version]
- Brookings. Foresight Africa: Top Priorities for the Continent in 2019; Africa Growth Initiative at Brookings; Brookings: Washington, DC, USA, 2019. [Google Scholar]
- Stober, E.O. Breaking the Poverty Trap: Is Education the Solution? J. Human. Soc. Sci. Stud. 2019, 1, 1–14. [Google Scholar]
- Kollamparambil, U. Happiness, Happiness Inequality and Income Dynamics in South Africa. J. Happiness Stud. 2020, 21, 210–222. [Google Scholar] [CrossRef]
- von Fintel, D.; Orthofer, A. Wealth Inequality and Financial Inclusion: Evidence from South African tax and survey records. Econ. Model 2020, 91, 568–578. [Google Scholar] [CrossRef]
- Dunga, H.M.; Mafini, C. Socio-economic factors influencing the education of the girl child in Zomba, Malawi. Int. J. Soc. Sci. Humanit. Sci. 2019, 11, 20–38. [Google Scholar]
- Dunga, H.M.; Dunga, S.H. Household characteristics that determine perceptions on girl education in Malawi. Acta. Univ. Danub. Oecon. 2019, 15, 220–232. [Google Scholar]
- Pasara, M.T.; Garidzirai, R. The Boomerang Effects: An Analysis of Pre and Post Dollarisation Era in Zimbabwe. Economies 2020, 8, 32. [Google Scholar] [CrossRef] [Green Version]
- Pasara, M.T.; Dunga, S.H. An Empirical Investigation of Macroeconomic Convergence in the Tripartite Region. Acta. Univ. Danub. Oecon. 2020, 15, 168–185. [Google Scholar]
- Filho, L.W.; Brandli, L.L.; Becker, D.; Skanavis, C.; Kounani, A.; Sardi, C.; Papaioannidou, D.; Paço, A.; Azeiteiro, U.; de Sousa, L.O.; et al. Sustainable development policies as indicators and pre-conditions for sustainability efforts at universities: Fact or fiction? Int. J. Sustain. High. Educ. 2018, 19, 85–113. [Google Scholar] [CrossRef]
- Palma, L.C.; de Oliveira, A.M.; Viacava, K.R. Sustainability in Brazilian federal universities. Int. J. Sustain. High. Educ. 2011, 12, 250–258. [Google Scholar] [CrossRef]
- Winkler, A.; Mazzaferro, F.; Nerlich, C.; Thimman, C. Official Dollarisation/Euroisation: Motives, Features and Policy Implications of Current Cases; Paper 11; European Central Bank: Frankfurt, Germany, 2004. [Google Scholar]
- Lin, T.-C. Alternative Measure for Education Variable in an Empirical Economic Growth Model: Is Primary Education Less Important? Econ. Bull. 2006, 15, 1–6. [Google Scholar]
- Romer, P. Endogenous Technological Change. J. Polit Econ. 1990, 98, S71–S102. [Google Scholar] [CrossRef] [Green Version]
- Nelson, R.; Phelps, E. Investments in Humans, Technological Diffusion and Development and Growth. Am. Econ. Rev. 1966, 56, 69–75. [Google Scholar]
- Solow, R.M. A Contribution to the Theory of Economic Growth. Q. J. Econ. 1956, 70, 65–94. [Google Scholar] [CrossRef]
- Solow, R.M. The Last 50 years in Growth Theory and the Next 10. Oxford Rev. Econ. Policy 2007, 23, 3–14. [Google Scholar] [CrossRef]
- Romer, P.M. Increasing Returns and Long-Run Growth. J. Polit Econ. 1986, 94, 1002–1037. [Google Scholar] [CrossRef] [Green Version]
- Trencher, G.; Yarime, M.; McComick, K.; Doll, C.; Kraines, S. Beyond the third mission: Exploring the emerging university function of co-creation for sustainability. Sci. Public Policy 2014, 41, 151–179. [Google Scholar] [CrossRef] [Green Version]
- Lozano, R. State of sustainability reporting in Universities. Int. J. Sustain. High. Educ. 2011, 12, 67–78. [Google Scholar] [CrossRef]
- Zilahy, G.; Huisingh, D. The roles of academia in regional sustainability initiatives. J. Clean. Prod. 2009, 17, 1057–1066. [Google Scholar] [CrossRef]
- Trencher, G.; Rosenberg, D.; McCormick, K.; Terada, T.; Petersen, P.; Yarime, M.; Kiss, B. The role of students in the co-creation of knowledge and societal transformations towards sustainability: Experiences from Lund, Tokyo and Ohio. In Engaging Stakeholders in Education for Sustainable Development at the University Level; Leal Filho, W., Brandli, L.L., Eds.; Springer: Berlin, Germany, 2016; pp. 191–215. [Google Scholar]
- Hanieh, A. Khaleeji-Capital: Class-Formation and Regional Integration in the Middle-East Gulf. Hist. Mater. 2010, 18, 35–76. [Google Scholar] [CrossRef]
- Mothae, M. Challenges for Regional Integration in Sub-Saharan Africa: Macroeconomic Convergence and Monetary Coordination. In Africa in the World Economy-The National Regional and International Challenges; Teunissen, J.J., Akkerman, A., Eds.; FONDAD: The Hague, The Netherlands, 2005; pp. 129–155. [Google Scholar]
- Büthe, T.; Milner, H. The Politics of Foreign Direct Investment into Developing Countries: Increasing FDI through International Trade Agreements? Am. J. Pol. Sci. 2008, 52, 741–762. [Google Scholar] [CrossRef]
- Alesina, A.; Enrico, S.; Romain, W. Economic Integration and Political Disintegration. Am. Econ. Rev. 2000, 90, 1276–1296. [Google Scholar] [CrossRef] [Green Version]
- Caporaso, J.A. Europe’s Triple Crisis and the Uneven Role of Institutions: The Euro, Refugees and Brexit. J. Common Mark. Stud. 2018, 56, 1345–1361. [Google Scholar] [CrossRef]
- Pasara, M.T. An overview of the obstacles to the African economic integration process in view of the African continental free trade area. Afr. Rev. 2020, 12. [Google Scholar] [CrossRef]
- Ujupan, A.S. Reconciling Theories of Regional Integration; A Third Way Approach; University of Ulster: Northern Ireland, UK, 2005; pp. 1–10. [Google Scholar]
- Zivengwa, T.; Hazvina, F.; Ndedzu, D.; Mavesere, I.M. Investigating the Causal Relationship between Education and Economic Growth in Zimbabwe. Asian J. Humanit. Soc. Sci. 2013, 1, 399–410. [Google Scholar]
- Gujarati, D.N. Basic Econometrics, 4th ed.; McGraw-Hill Coys: Singapore, 2004. [Google Scholar]
- Stock, J.H.; Watson, M.W. Vector Autoregressions. J. Econ. Perspect. 2001, 15, 101–115. [Google Scholar] [CrossRef] [Green Version]
- Bandara, A.; Dehejia, R.; Lavie_Rouse, S. The Nexus between Human Development and Economic Growth. The Economic and Social Research Foundation (ESRF) Discussion Paper 58. 2014. Available online: http://www.thdr.or.tz/docs/THDR-BP-4.pdf (accessed on 15 September 2020).
- Duede, E.; Zhorin, V. Convergence of economic growth and the Great Recession as seen from a Celestial Observatory. EPJ Data Sci. 2016. [Google Scholar] [CrossRef] [Green Version]
- Blanchard, O.J. A Traditional Interpretation of macroeconomic Fluctuations. Am. Econ. Rev. 1989, 79, 1146–1164. [Google Scholar]
- Zamora-Polo, F.; Sánchez-Martín, J.; Corrales-Serrano, M.; Espejo-Antúnez, L. What Do University Students Know about Sustainable Development Goals? A Realistic Approach to the Reception of this UN Program Amongst the Youth Population. Sustainability 2019, 11, 3533. [Google Scholar] [CrossRef] [Green Version]
- Zamora-Polo, F.; Sánchez-Martín, J. Teaching for a Better World. Sustainability and Sustainable Development Goals in the Construction of a Change-Maker University. Sustainability 2019, 11, 4224. [Google Scholar] [CrossRef] [Green Version]
Figure 1.
Governance indicators for Sub-Saharan Africa (averages) and South Africa.

Figure 2.
Trend structure across the Sub-Saharan African region.

Figure 3.
Impulse response functions (IRFs).


Table 1.
Descriptive statistics.
| GDPP | Governance | LNTERT_EXP | |
|---|---|---|---|
| Mean | 1.249458 | −0.837338 | 2.872217 |
| Median | 1.310432 | −0.671667 | 2.891810 |
| Maximum | 3.798470 | −0.630000 | 3.164772 |
| Minimum | −0.854992 | −1.634287 | 2.021297 |
| Std. Dev. | 0.929583 | 0.301254 | 0.171102 |
| Skewness | 0.090593 | −1.422707 | −2.495734 |
| Kurtosis | 3.131625 | 3.551010 | 13.64103 |
| Jarque-Bera | 0.102397 | 17.14999 | 282.0486 |
| Probability | 0.950090 | 0.000189 | 0.000000 |
| Sum | 61.22345 | −41.02958 | 140.7386 |
| Sum Sq. Dev. | 41.47801 | 4.356201 | 1.405235 |
| Observations | 49 | 49 | 49 |
Table 2.
Correlation matrix.
| GDPP | Governance | Tertiary Expenditure | |
|---|---|---|---|
| GDPP | 1 | −0.1429337 | −0.3432426 |
| Governance | −0.1429337 | 1 | 0.31375250 |
| Tertiary expenditure | −0.3432426 | 0.3137525 | 1 |
Table 3.
ADF stationarity test.
| Variable | ADF Results |
|---|---|
| GDPP | −3.834219 *** |
| (0.0049) | |
| Governance | −3.466395 *** |
| (0.0146) | |
| Tertiary Expenditure | −7.445184 *** |
| (0.0000) |
*** denotes 1% level of significance, respectively.
Table 4.
Optimal lag length.
| Lag | LogL | LR | FPE | AIC | SC | HQ |
|---|---|---|---|---|---|---|
| 0 | −29.33464 | NA | 0.000795 | 1.375942 | 1.494037 | 1.420382 |
| 1 | 54.93912 | 154.2030 | 3.23×10⁻⁵ | −1.827197 | −1.35482 * | −1.649438 |
| 2 | 68.69618 | 23.4163 * | 2.65×10⁻¹ * | −2.02963 * | −1.20296 | −1.71855 * |
* denotes10% level of significance, respectively.
Table 5.
Pairwise Granger causality.
| Null Hypothesis | Obs | F-Statistic | Prob. |
|---|---|---|---|
| Governance does not Granger Cause GDPP | 47 | 0.96706 | 0.3885 |
| GDPP does not Granger Cause Governance | 3.97039 | 0.0263 ** | |
| LNTERT_EXP does not Granger Cause GDPP | 47 | 0.89463 | 0.4164 |
| GDPP does not Granger Cause LNTERT_EXP | 0.96648 | 0.3887 | |
| LNTERT_EXP does not Granger Cause Governance | 47 | 10.0412 | 0.0003 *** |
| Governance does not Granger Cause LNTERT_EXP | 0.81058 | 0.4514 | |
** denotes 5% level of significance, respectively. *** denotes 1% level of significance, respectively.
Table 6.
Vector Autoregressive (VAR) results.
| GDPP | Governance | LNTERT_EXP | |
|---|---|---|---|
| GDPP(-1) | 0.681935 | −0.042829 | −0.018496 |
| (0.15375) | (0.01447) | (0.02440) | |
| [4.43521] | [−2.96002] | [−0.75816] | |
| GDPP(-2) | −0.128969 | 0.016372 | 0.040299 |
| (0.15065) | (0.01418) | (0.02390) | |
| [−0.85609] | [1.15485] | [1.86598] | |
| GOVERNANCE(-1) | −1.314702 | 0.872838 | 0.322023 |
| (1.29209) | (0.12159) | (0.20501) | |
| [−1.01750] | [7.17840] | [1.57079] | |
| GOVERNANCE(-2) | 1.453482 | 0.040807 | −0.276527 |
| (1.26711) | (0.11924) | (0.20104) | |
| [1.14709] | [0.34222] | [−1.37546] | |
| LNTERT_EXP(-1) | 1.029452 | −0.031180 | 0.245691 |
| (0.94083) | (0.08854) | (0.14927) | |
| [1.09420] | [−0.35217] | [1.74589] | |
| LNTERT_EXP(-2) | −0.141056 | 0.287980 | 0.157065 |
| (0.70164) | (0.06603) | (0.11132) | |
| [−0.20104] | [4.36147] | [1.41088] |
Table 7.
Variance decomposition.
| (a) VDC of GDPP | ||||
| Period | S.E 1 | GDPP | GOV | LNTERT_EXP |
| 1 | 0.660119 | 100.0000 | 0.000000 | 0.000000 |
| 2 | 0.820519 | 96.96083 | 1.345277 | 1.693892 |
| 3 | 0.862832 | 96.08877 | 1.323048 | 2.588186 |
| 4 | 0.871419 | 96.03680 | 1.307142 | 2.656060 |
| 5 | 0.873855 | 95.92808 | 1.336297 | 2.735625 |
| 6 | 0.874698 | 95.78717 | 1.409257 | 2.803571 |
| 7 | 0.875376 | 95.63965 | 1.503727 | 2.856620 |
| 8 | 0.876127 | 95.49383 | 1.599060 | 2.907106 |
| 9 | 0.876906 | 95.35639 | 1.687632 | 2.955975 |
| 10 | 0.877645 | 95.23144 | 1.765933 | 3.002625 |
| (b) VDC of Governance | ||||
| Period | S.E | GDPP | GOV | LNTERT_EXP |
| 1 | 0.062121 | 3.266348 | 96.73365 | 0.000000 |
| 2 | 0.090626 | 19.20927 | 80.66335 | 0.127378 |
| 3 | 0.113326 | 26.08947 | 70.16857 | 3.741957 |
| 4 | 0.133850 | 30.53596 | 63.70606 | 5.757988 |
| 5 | 0.149622 | 32.20344 | 60.03659 | 7.759962 |
| 6 | 0.161849 | 32.51615 | 57.71438 | 9.769469 |
| 7 | 0.171411 | 32.26771 | 56.19382 | 11.53847 |
| 8 | 0.178946 | 31.78964 | 55.14563 | 13.06473 |
| 9 | 0.184957 | 31.25188 | 54.39024 | 14.35788 |
| 10 | 0.189803 | 30.73559 | 53.82923 | 15.43518 |
| (c) VDC of Expenditure on Education | ||||
| Period | S.E | GDPP | GOV | LNTERT_EXP |
| 1 | 0.104736 | 0.007776 | 1.895284 | 98.09694 |
| 2 | 0.110104 | 2.013902 | 3.861769 | 94.12433 |
| 3 | 0.112009 | 2.156053 | 3.851605 | 93.99234 |
| 4 | 0.114105 | 2.835754 | 3.719609 | 93.44464 |
| 5 | 0.115068 | 3.267310 | 3.683199 | 93.04949 |
| 6 | 0.115604 | 3.555320 | 3.668362 | 92.77632 |
| 7 | 0.115902 | 3.701028 | 3.669832 | 92.62914 |
| 8 | 0.116060 | 3.756360 | 3.684243 | 92.55940 |
| 9 | 0.116150 | 3.770996 | 3.704888 | 92.52412 |
| 10 | 0.116208 | 3.771017 | 3.728096 | 92.50089 |
Cholesky Ordering: GDPP GOVERNANCE LNTERT_EXP. 1 S.E refers to Standard Error.
Publisher’s Note: MDPI stays neutral with regard to jurisdictional claims in published maps and institutional affiliations. |
© 2021 by the author. Licensee MDPI, Basel, Switzerland. This article is an open access article distributed under the terms and conditions of the Creative Commons Attribution (CC BY) license (https://creativecommons.org/licenses/by/4.0/).
Share and Cite
MDPI and ACS Style
Pasara, M.T. Economic Growth, Governance and Educational Sustainability: A VAR Analysis. Educ. Sci. 2021, 11, 343. https://0-doi-org.brum.beds.ac.uk/10.3390/educsci11070343
AMA Style
Pasara MT. Economic Growth, Governance and Educational Sustainability: A VAR Analysis. Education Sciences. 2021; 11(7):343. https://0-doi-org.brum.beds.ac.uk/10.3390/educsci11070343
Chicago/Turabian StylePasara, Michael Takudzwa. 2021. "Economic Growth, Governance and Educational Sustainability: A VAR Analysis" Education Sciences 11, no. 7: 343. https://0-doi-org.brum.beds.ac.uk/10.3390/educsci11070343
Note that from the first issue of 2016, this journal uses article numbers instead of page numbers. See further details here.