Article

Laying the Groundwork to Investigate Diversity of Life Sciences Reading Lists in Higher Education and Its Link to Awarding Gaps

School of Life Sciences, University of Sussex, Brighton BN1 9RH, UK
*
Author to whom correspondence should be addressed.
Submission received: 6 May 2021 / Revised: 17 June 2021 / Accepted: 13 July 2021 / Published: 17 July 2021
(This article belongs to the Special Issue Advancing Research on Equity and Diversity in Higher Education)

Abstract

:
This study presents a case for decolonising the life sciences curriculum to improve representation of the Black, Asian, and Minority Ethnic (BAME) scholars—a step in eliminating the race “awarding gap”. Here, we investigated diversity among authors in terms of ethnicity and gender of reading lists at the School of Life Sciences, University of Sussex. We show that the reading lists are not diverse and do not represent the demography of the student body. For instance, a disproportionately high number of authors in the reading lists are white 83.40 ± 5.70% (n = 977 authors), male 75.90 ± 5.40% (n = 878 authors), and of European descent. Additionally, our analysis of the geographical locations of publications reveals that a significantly high number of our materials stem from the USA or the UK, whereas the second highest global output of scientific literature (after the USA) comes from China, which is only featured in 1.02% of the reading list. Moreover, we constructively provide potential solutions to decolonise the curriculum of the University of Sussex’s School of Life Sciences by diversifying their reading lists. This study should help to establish a foundation, along with other work that is being conducted, to address the BAME awarding gap and to better showcase the work of women and ethnically underrepresented scientists in history and in modern day.

1. Introduction

In the current climate of rising racism, prejudice, and discrimination both globally and specifically in higher education (HE) [1], it is important to assess and, where needed, challenge all forms of bias. This begins by proactively identifying and taking action to change the culture of unconscious bias and overt inequality in science. However, why does this matter? Surely scientists and teachers should be capable of assessing the quality of research and work without being influenced by the current political climate, or perhaps they may think that mistreatment of minority groups is a thing of the past. It is well known that inequality such as disproportionate gender and ethnic representation still exists in the scientific community [2]. However, what are the steps that academics could take to eradicate this inequality?
A report published in November 2020 by the All-Party Parliamentary Groups (APPG) on Diversity and Inclusion in Science, Technology, Engineering, and Maths (STEM) found that in the UK STEM workforce, only 27% were women as compared with 52% of the wider population [2]. However, this is still not the full picture; women and Black, Asian, and Minority Ethnic (BAME) individuals are grossly underrepresented in leadership positions in HE, with Black academics making up 3.5% of professors as compared with 91.6% of professors who are their white counterparts [3,4,5]. In HE, BAME students make up 22% of undergraduate students, but for physical sciences this drops to 16% [6]. This disparity goes as far as to affect the outcomes of BAME students in HE. For instance, recent data published on the BAME awarding gap reported that university students from BAME backgrounds were less likely to achieve a high degree grade than their white counterparts (an ‘awarding gap’). In the UK, in 2017–2018, 80.9% of white students received a first or upper second-class degree as compared with 67.7% of BAME students, this dramatically reduced to 57.5% for Black students [7]. This awarding gap could be caused by numerous factors such as the white-centric curriculum, barriers to support at institutions, and barriers to accountability [8]. At the University of Sussex, the awarding gap between white students and BAME students is 14.3%, with the Black awarding gap at 26% [9]. However, in the same year, the School of Life Sciences at the University of Sussex had a higher average awarding gap between BAME and white students which remains to be a challenge for the school (Table 1). This gap exists even when previous educational attainment and socioeconomic backgrounds are considered, and the reasons for this gap remain largely unknown [10].
This is not surprising when the trend of not appreciating and valuing work by underrepresented authors is also seen in publishing and is consistent with researchers’ perceptions of high quality work [11,12]. Because of historical biases in scientific fields, it became the norm that white, Western males were recognised for their ground-breaking work, creating the image that white, Western males historically produced the most trustworthy research. This has also been shown to be true in modern day, as Western scientists tend to trust published Western research articles. For instance, in a citation analysis, it was shown that North America and Europe received 42% and 35% of global citations, respectively, which was seven- to eight-fold higher as compared with South America, Africa, and Oceania combined [13]. Most HE academics are also researchers. Therefore, it can be assumed that institutional bias towards Western, white, and male authors is subconsciously continued when designing curriculum, including reading materials, as well as teaching and assessing students’ academic work.
This raises several questions, including does the publishing bias influence academics’ perceptions of minority students’ abilities and is the Life Sciences curriculum diverse and inclusive of race, ethnicity, and gender? If it is not, is a lack of diversity and inclusivity in our curriculum a contributing factor to the disparity?
In order to understand this, we assessed the reading lists of the University of Sussex’s School of Life Sciences undergraduate degree curricula. A curriculum is formed of learning materials and resources, such as textbooks and science paper reading lists, aligned with the degree learning outcomes. As all students are expected to engage with these reading lists, it is very important to offer representative reading materials that set the backdrop for a diverse curriculum taught by staff [14,15]. Additionally, there has been an increase in the awarding gap among BAME students in Life Sciences schools. Therefore, to address the BAME awarding gap at the School of Life Sciences, University of Sussex, we investigated whether the reading lists being provided across all undergraduate modules were diverse and inclusive of BAME authors. Additionally, we assessed whether there was a lack of representation of female authors. We hypothesised that there is a lack of representation in our reading lists. Indeed, our study showed a consistent lack of diversity in author representation in all categories (gender, ethnicity, and geographical location of publication) across all teaching modules tested. Moreover, we provide potential solutions based on our findings in order to produce an inclusive reading list as part of a diverse curriculum and an inclusive School that addresses the BAME awarding gap.

2. Materials and Methods

2.1. Rationale for the Study

We chose to analyse reading lists from the School of Life Sciences at the University of Sussex as efforts are in place to involve faculty in decolonising our curriculum. Moreover, the school delivers teaching on diverse subjects such as biomedical science, ecology and conservation, zoology, chemistry, and genetics. Additionally, our curriculum and research topics consist of components that apply to global matters such as epidemiology and infectious diseases, clinical aspects such as blood transfusion, medical ethics, conservation, and environmental studies such as field trips in Ecuador and Egypt, and more applied elements such as computational biology. Thus, there is empirical interest to assess whether our reading materials and representation of authors match our teaching and research delivery to a certain extent.
The data collection and analyses were carried out in interlinked stages, as described by Bird and Pitman (2020) [14], as described below.

2.1.1. Stage 1: Literature Review

A literature review was undertaken to identify and understand how current studies, with a focus on scientific reading lists, collected and analysed data around inclusivity and decolonisation of curriculum. This was conducted by searching keywords from relevant publications such as ‘decolonising reading lists’, ‘decolonising scientific reading lists’, and ‘analysing reading list representation’ on “Crossref” and “Google Scholar”.

2.1.2. Stage 2: Retrieve Reading Sources from the University of Sussex Library Database

Using a list of modules delivered by the School of Life Sciences at the University of Sussex, in the academic year 2019–2020, and cross checking these against those with available reading lists of the library’s website, all year one and two modules within Biochemistry, Biology, Biomedical Science, Chemistry, Ecology and Conservation, Genetics, Medical Neuroscience, Neuroscience, and Zoology degree programs were selected. For the final undergraduate year’s analysis, only 21 modules were randomly selected due to the large number of modules. These were randomised by using Microsoft Excel Randomise tool.

2.1.3. Stage 3: Data Collection and Categorisation

All the reading materials were collected and stored on a spreadsheet, and then organised into individual ’course’ sheets.
We collected data based on the following categories: the place of publication and the name, perceived gender, and perceived BAME status of each author of papers and books in the reading list. According to previous studies, the gender of the authors was categorised as female or male and deduced from information available such as the first name, pronouns, or photos [16,17,18]. The decision to record BAME status rather than ethnicity, for example, is this author BAME, ’yes’ or ’no’ or ’unknown’ (although the ’unknown’ category was not included in some data representation for clarity), following the definition of ‘non-white’ was carried out conscious of the complexity of an author’s identity, knowing it would be impossible to accurately assume one’s ethnicity, hence the use of perceived gender and BAME status. Additionally, we did not assess the position of authors in multi-authored papers and assumed that each author contributed substantially to the published work [19].
From each module reading list, the name, perceived gender, perceived BAME status, and geographical location of each publication was noted. The place of publication and list of authors information was taken directly from the library’s database. The information about the authors was found by googling the name and using information (name) and/or photos found on Wikipedia, University Faculty profiles, ResearchGate profiles, or social media profiles such as LinkedIn and Twitter to make assumptions about gender and ethnicity. If the search result was not immediately obvious it was useful to add keywords next to the name such as ‘Dr’ beforehand, or ‘biology’ afterwards. When the author was only listed by their first initial and last name, it was searched on Google with the name of the publication.
After using various search terms and various websites, if an author’s identity could not be found, they would be noted as ‘unknown’ for all categories that were unknown. When there was a repeat of studies among reading lists and repeat authors within and among reading lists, these were counted individually for each time they appeared.

2.1.4. Stage 4: Data Analysis

Initially, all collected data were compiled by categorisation. For instance, the gender status and BAME representation of authors were organised by compiling by module, and then collating it by academic year, degree, and total for individual courses. Then, this raw data was normalised to the total number of authors or publications and presented as percentage data.
Next, the geographical origins of publications were examined using the information provided on the library database. We selected 8 countries with the highest publication outputs, i.e., China, USA, India, Germany, Japan, UK, Russia, and Italy, according to the National Science Board data (2020) and compared them with the represented reading list of the Life Sciences School, University of Sussex [20]. ’Other’ was designated to publication outputs by all other countries. The data were converted to percentage data for representation purposes. Then, this was demonstrated using Datawrapper.de, a web tool to create geographical maps, a graph, and a table, as shown in the Results section.
Using this information, data were analysed and graphs were created using GraphPad Prism 8.0.1 (California, USA) and Microsoft Excel 2013. Data are expressed as mean ± standard deviation (SD) and analysed using the Mann–Whitney U test, a non-parametric test, (male vs female; BAME vs. White), where a two-tailed p-value less than 0.05 was considered to be statistically significant.
Next, we analysed the size of the observed effects using the Cohen’s d method [21,22]. Briefly, according to Cohen (1988), the magnitude of size effects can be interpreted by ’no effect’, ’small effect’, ’intermediate effect’, and ’large effect’ (Table 2) [22]. Cohen’s d is determined by calculating the difference between the mean of two groups, and then dividing the result by the pooled standard deviation.

3. Results

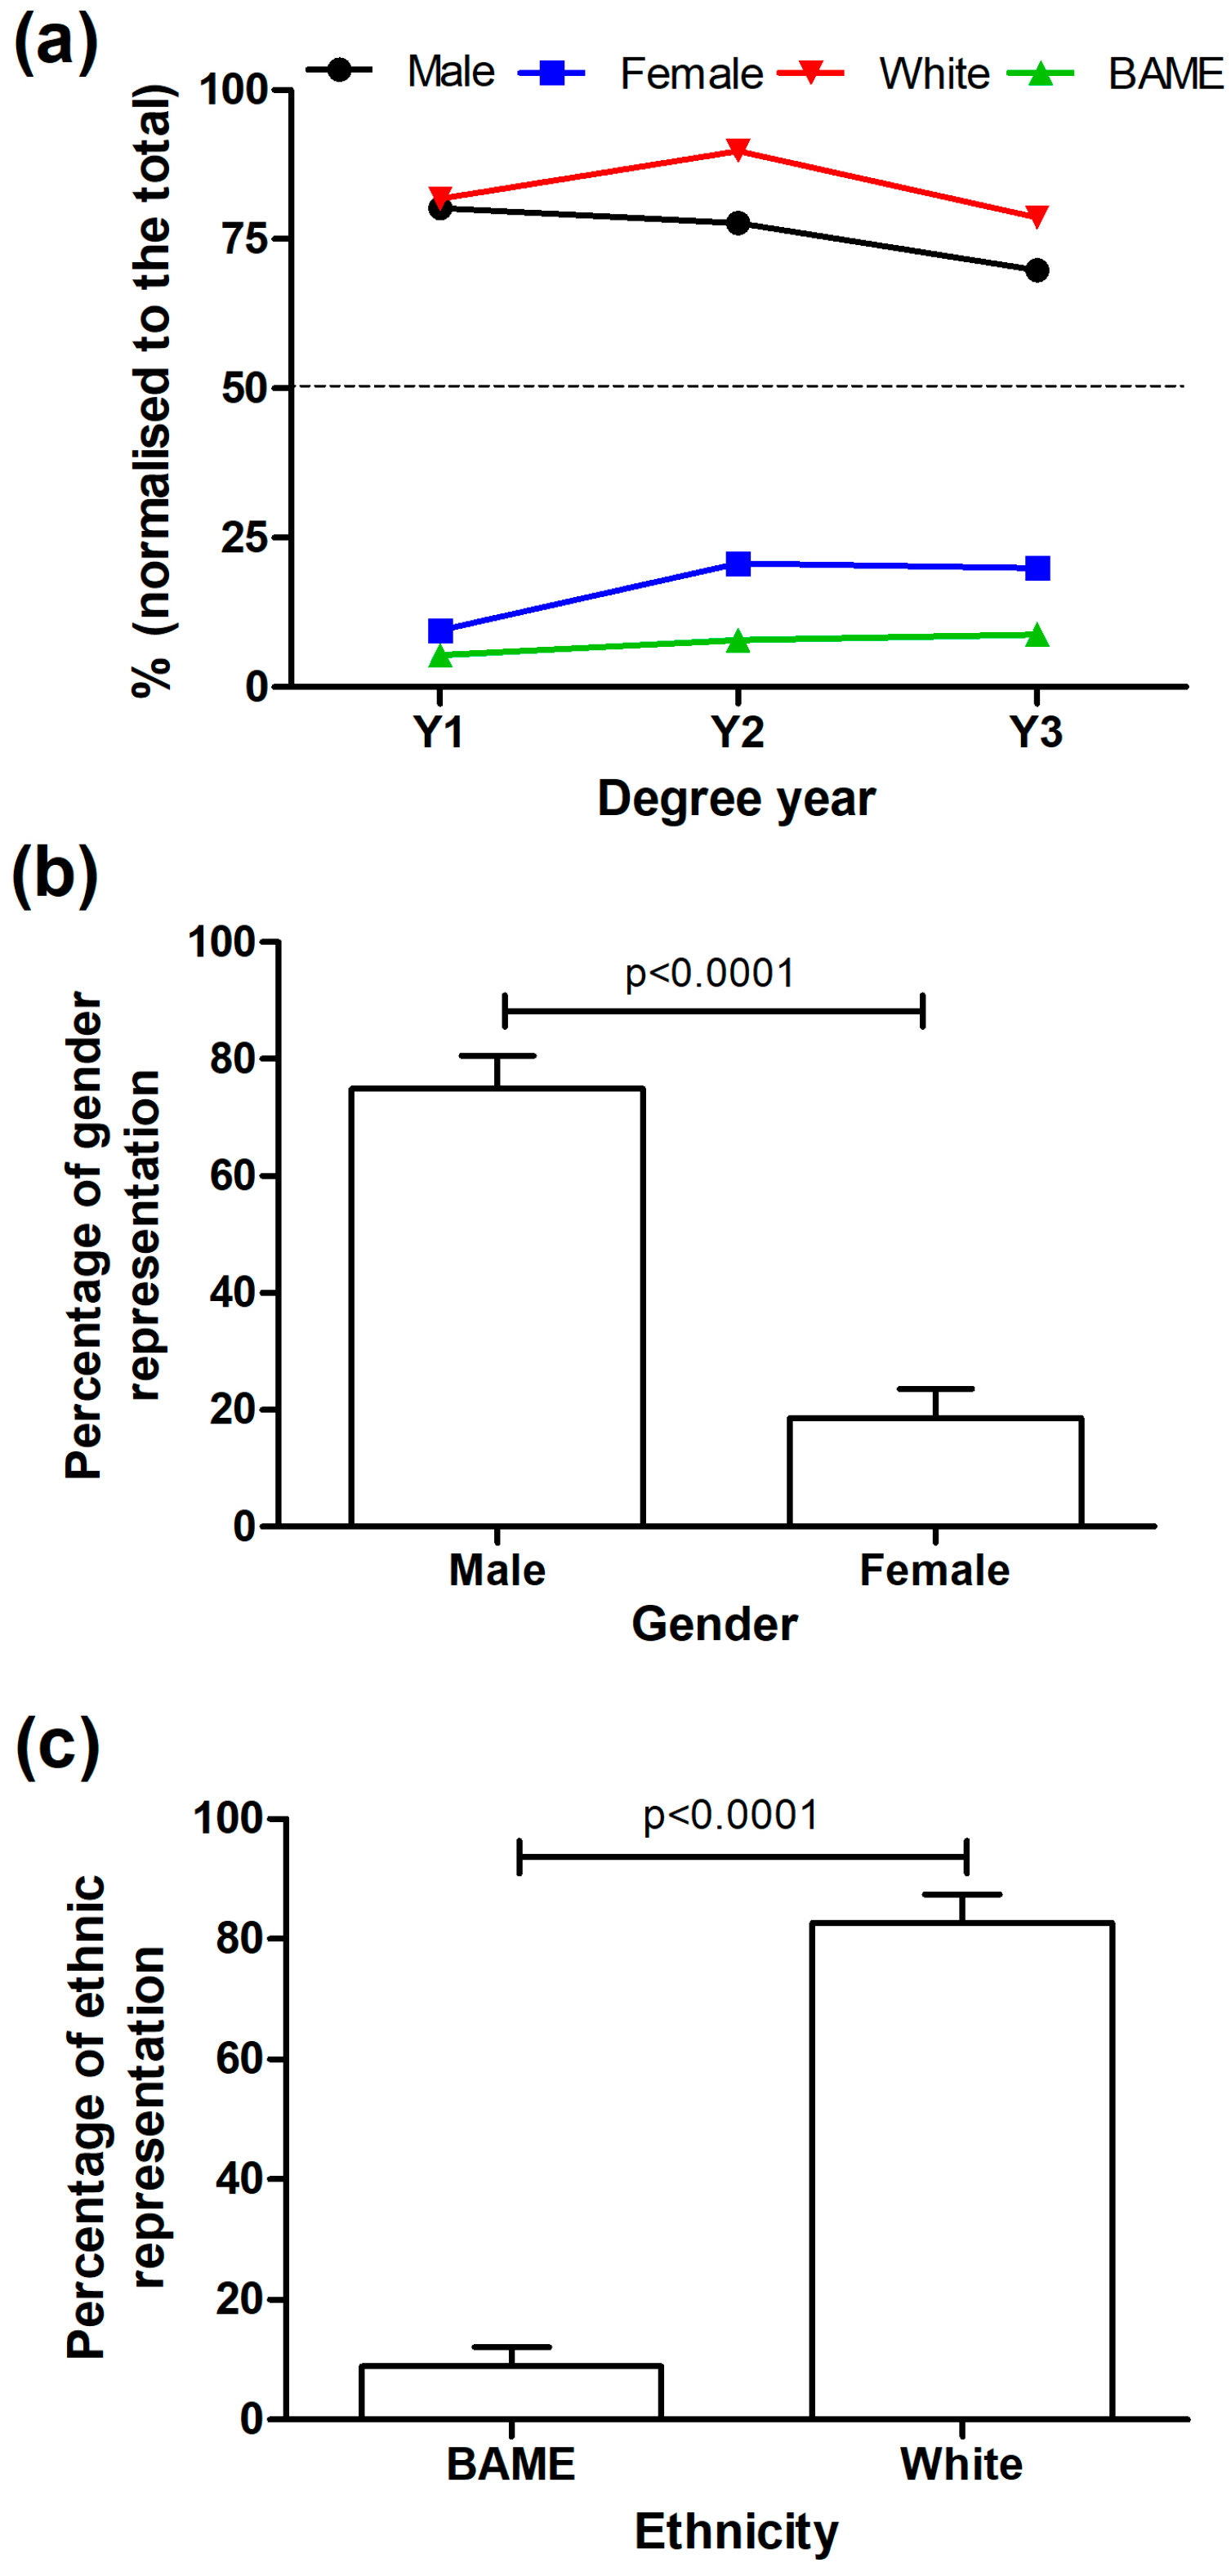
3.1. Representation of Gender and BAME vs. White

First, we analysed and compared the overall representation of authors across the three years in terms of gender and BAME vs. white (Figure 1a) in the reading lists. The data demonstrate that the representation of female and BAME authors remains below 25% across all the degree academic years and the majority of authors are white and male. A breakdown of these results is demonstrated in Figure 1b, c. For instance, out of a group of 1179 authors, we found that 75.9 ± 5.4% (n = 878 authors) and 16.7 ± 6.3% (n = 213 authors) were male and female (significant difference, p 0.0001), respectively (Figure 2b). Analysing BAME author representation, we found that only 7.4 ± 1.8% (n = 92 authors) of authors were BAME, and 83.4 ± 5.7% (n = 977 authors) were white (significant difference, p 0.0001) (Figure 1c). In both cases, there is a significant underrepresentation of female and BAME authors in the reading lists which was also revealed in our size effect analysis (d 1) (Table 3).
Next, we analysed gender and BAME representations in each year group where several shared modules across each degree were taught. The largest gender gap in authors was in Year 1 with women making up only 15.5 ± 28.5% (n = 23 authors, 14 modules) vs. 82.2 ± 30.2% male authors (n = 194 authors, 14 modules), although this remains consistent through Year 2 (13.3 ± 10.9% female, n = 79 authors, 15 modules vs. 85.5 ± 11.0% male, n = 296, 15 modules) and Year 3 (13.3 ± 13.2% female, n = 111 authors, 21 modules) vs. 80.5 ± 17.2% male, n = 388 authors, 21 modules) (Figure 2a). A similar observation was found in the representation of BAME authors in all years (Figure 2b). For instance, Years 1, 2, and 3 reading lists consisted of 2.7 ± 6.2% BAME (n = 13 authors) vs. 94.6% ± 11.2 white (n = 198 authors, 14 modules), 3.5 ± 6.4% BAME (n = 30 authors, 15 modules) vs. 94.6 ± 8.1% white (n = 342 authors, 15 modules), and 4.6 ± 7.0% BAME (n = 49 authors, 21 modules) vs. 83.3 ± 18.0% white (n = 437 authors, 21 modules) authors, respectively. In all cases, the differences are statistically significant (p 0.001) and demonstrates significant underrepresentation of female and BAME authors. According to effect size analysis, the d value is above 0.8 for all the comparisons per year, suggesting a large effect of the observed statistical difference (Table 4).

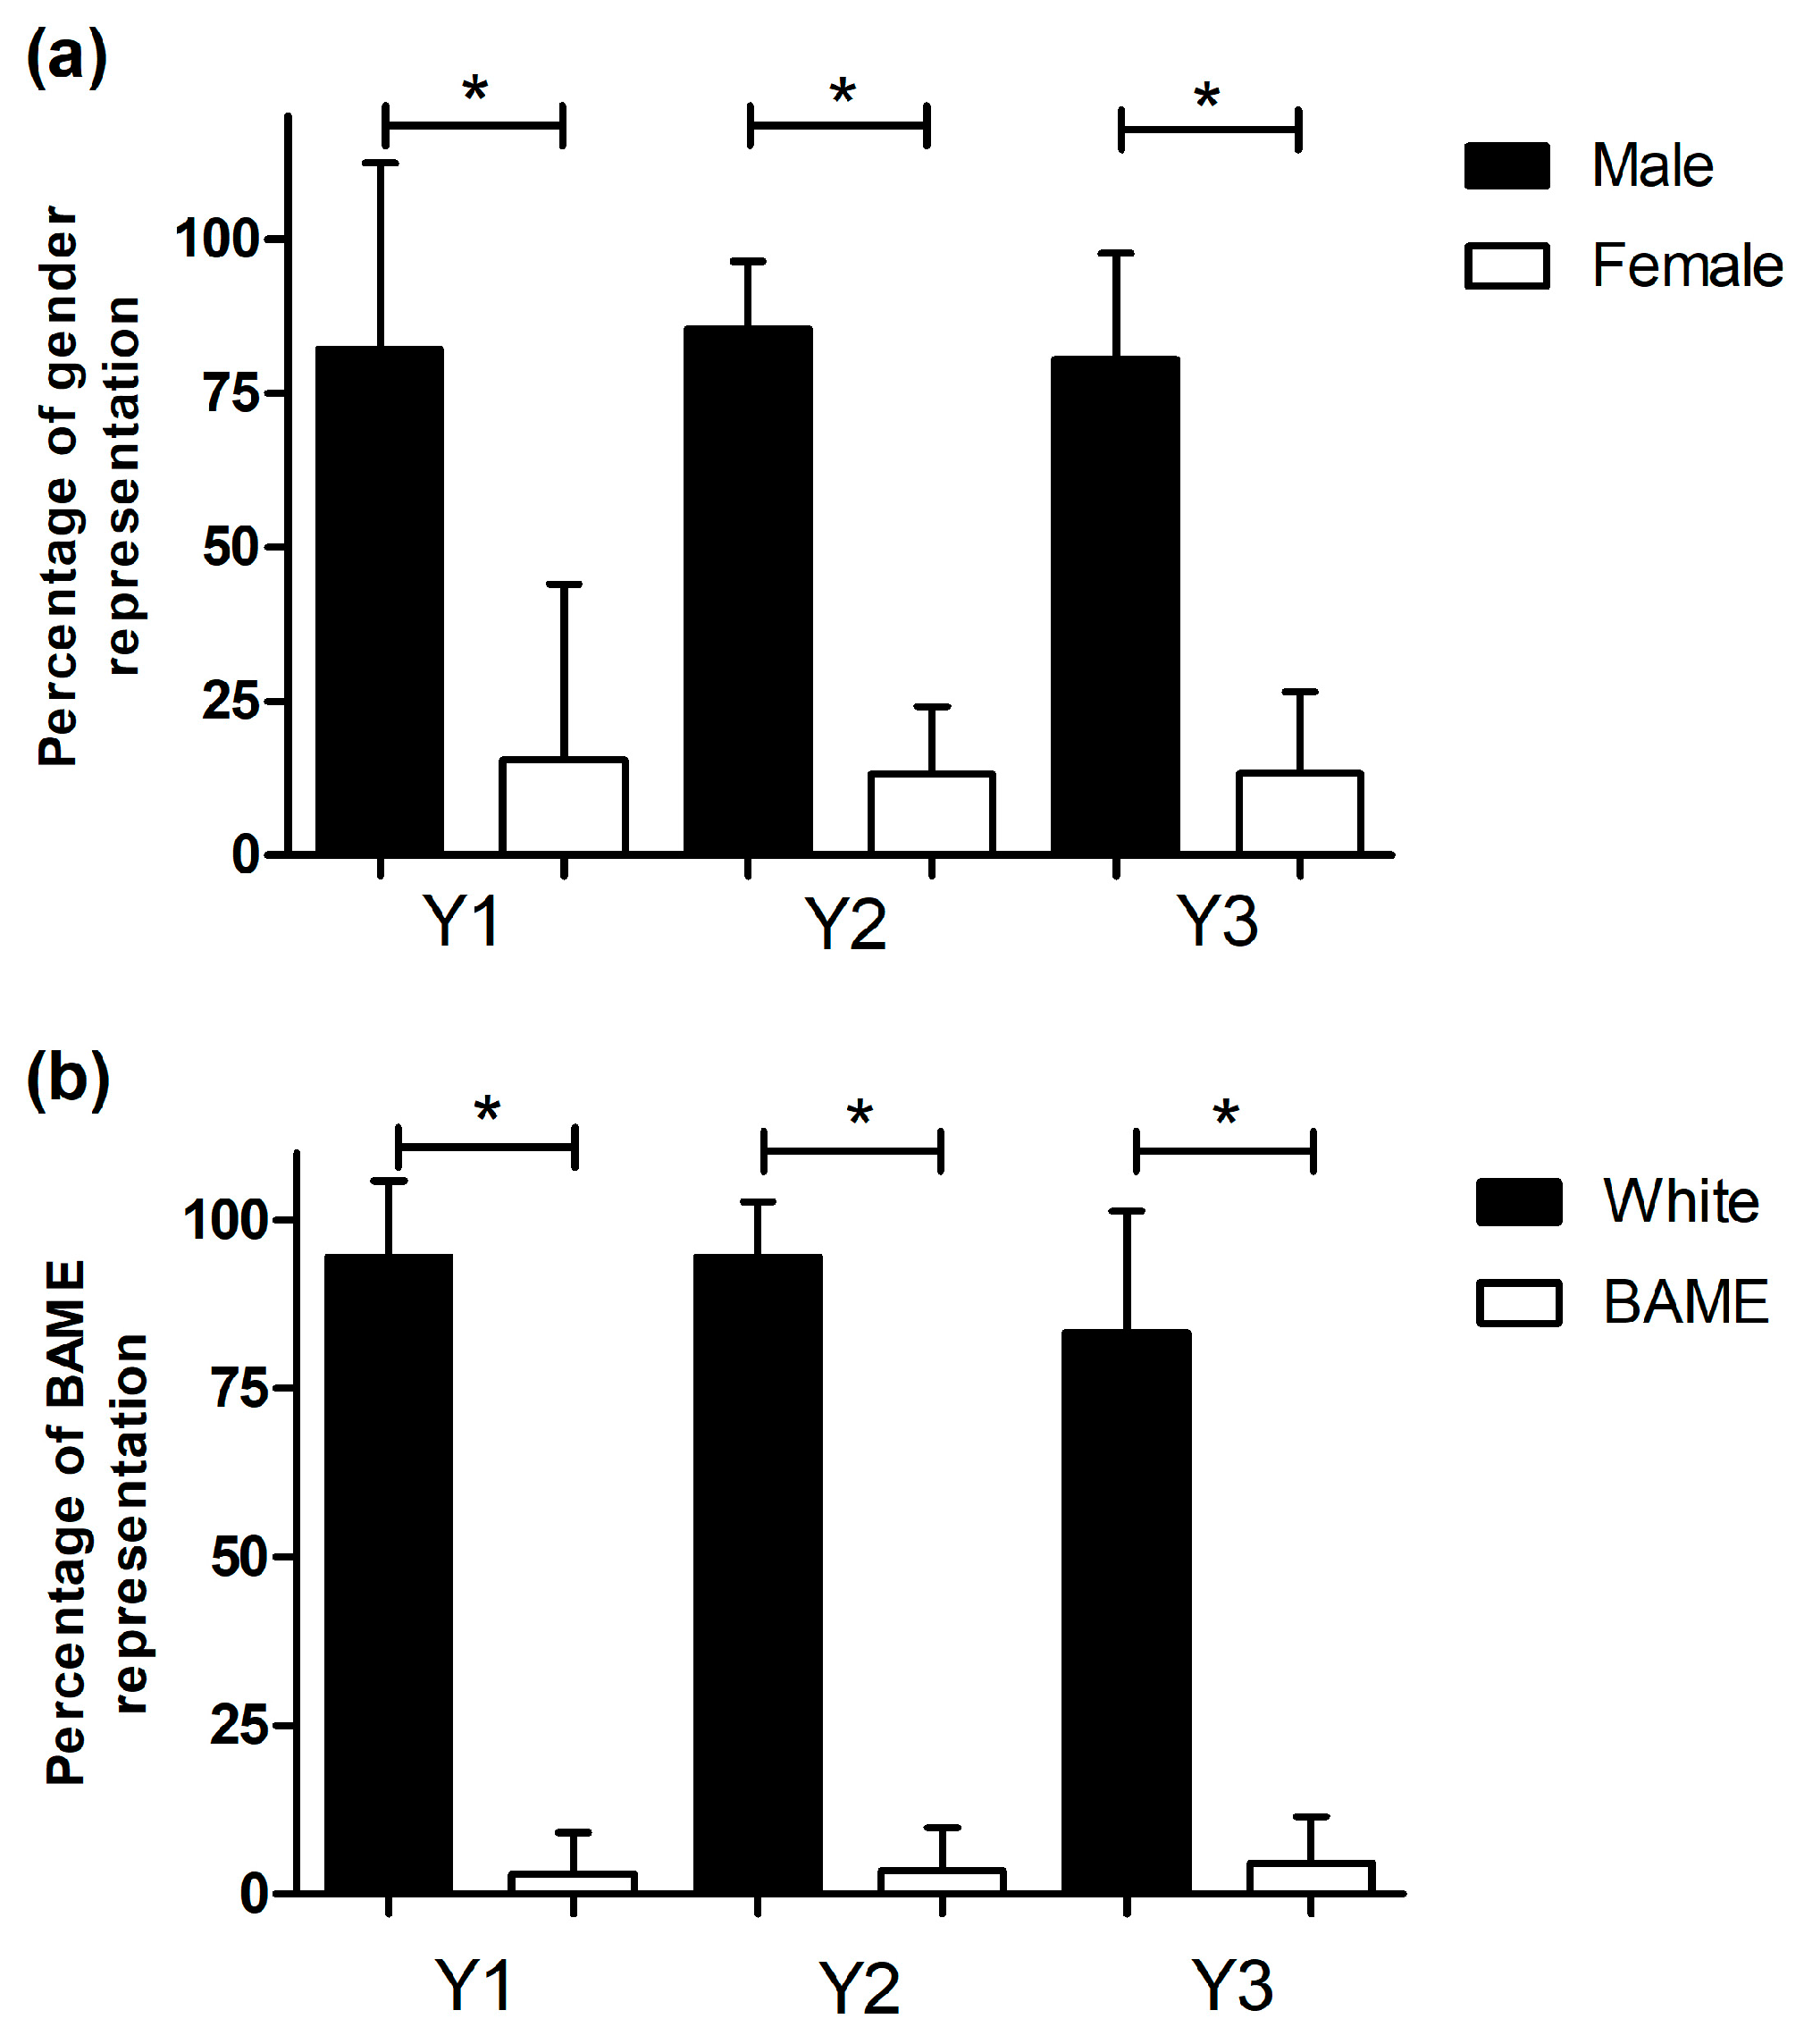
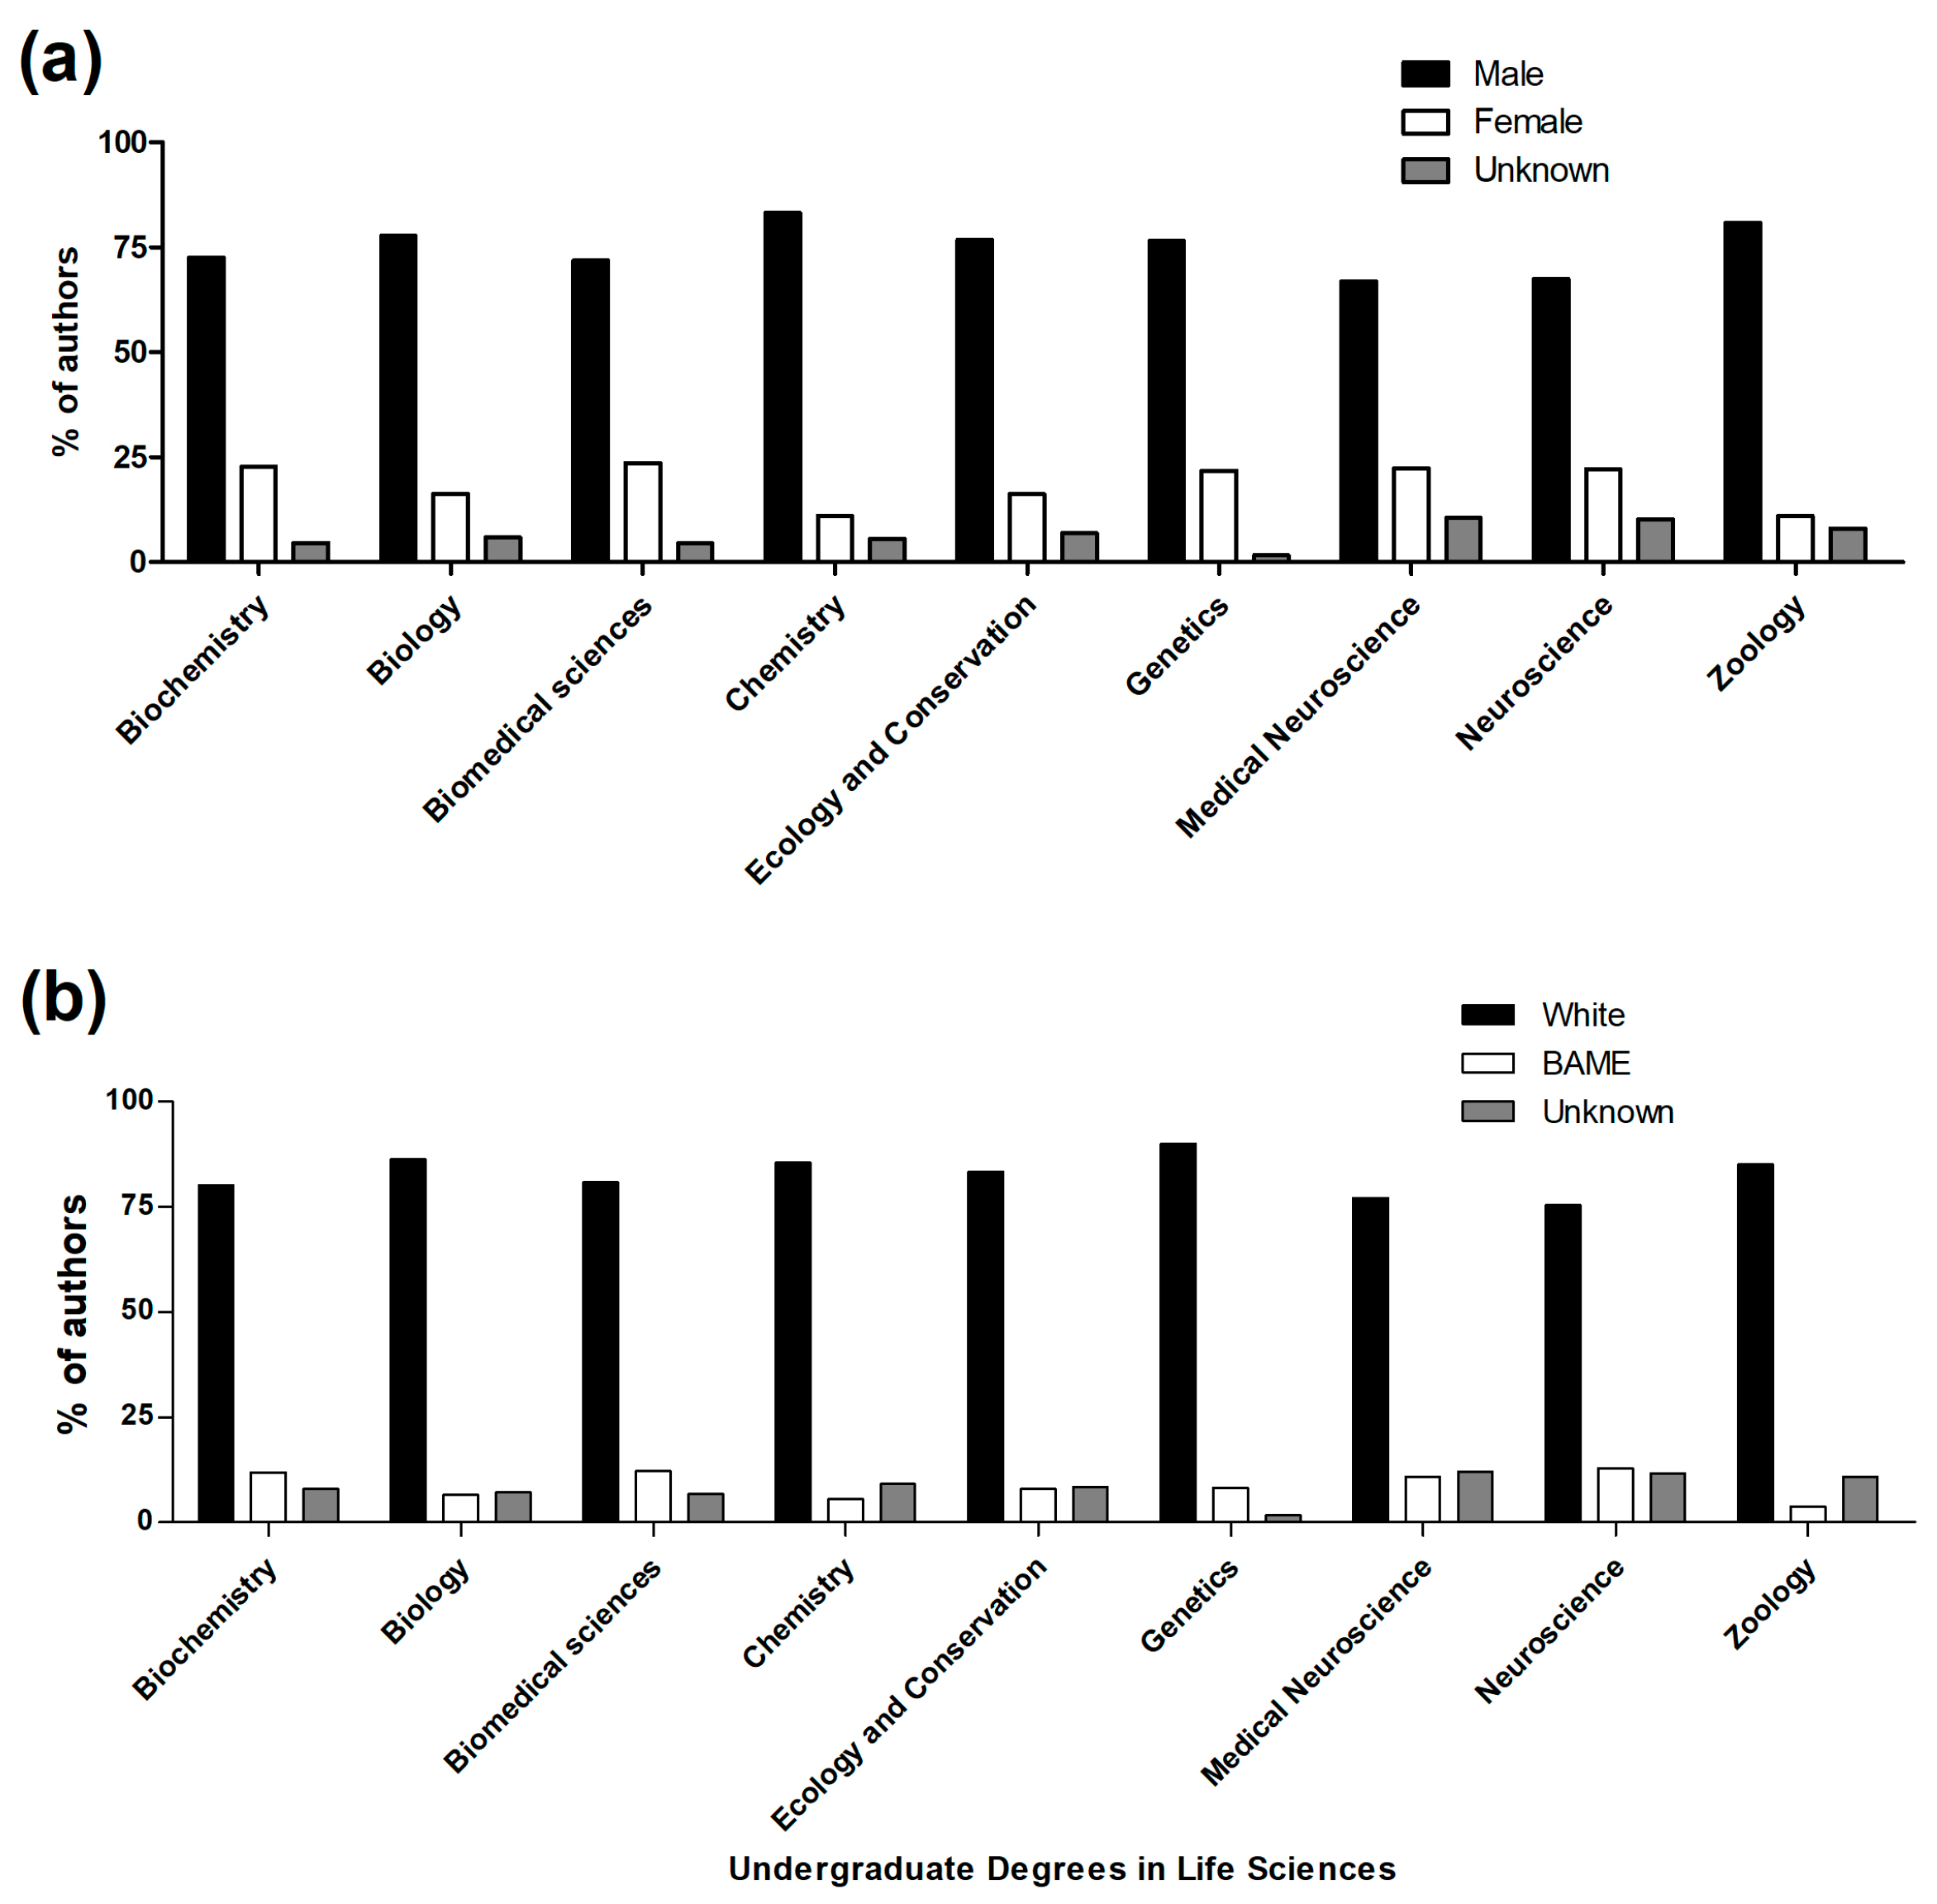
3.2. A Degree-Basis Breakdown of Gender and BAME Author Representation

All degrees reviewed had reading lists with between 66 and 84% of male authors and between 10 and 24% of female authors. The Chemistry and Zoology programs had the largest difference, with 11.15% and 10.97% of female authors, respectively (Figure 3a). A similar observation was found in BAME representation, with white authors making up 75–90% of all authors and BAME authors being represented by 3–13% of authors (Figure 3b). Genetics degree programs had a particularly high percentage of white authors at 90.10% and the Zoology degree program had a very low percentage of BAME authors at 3.87%.

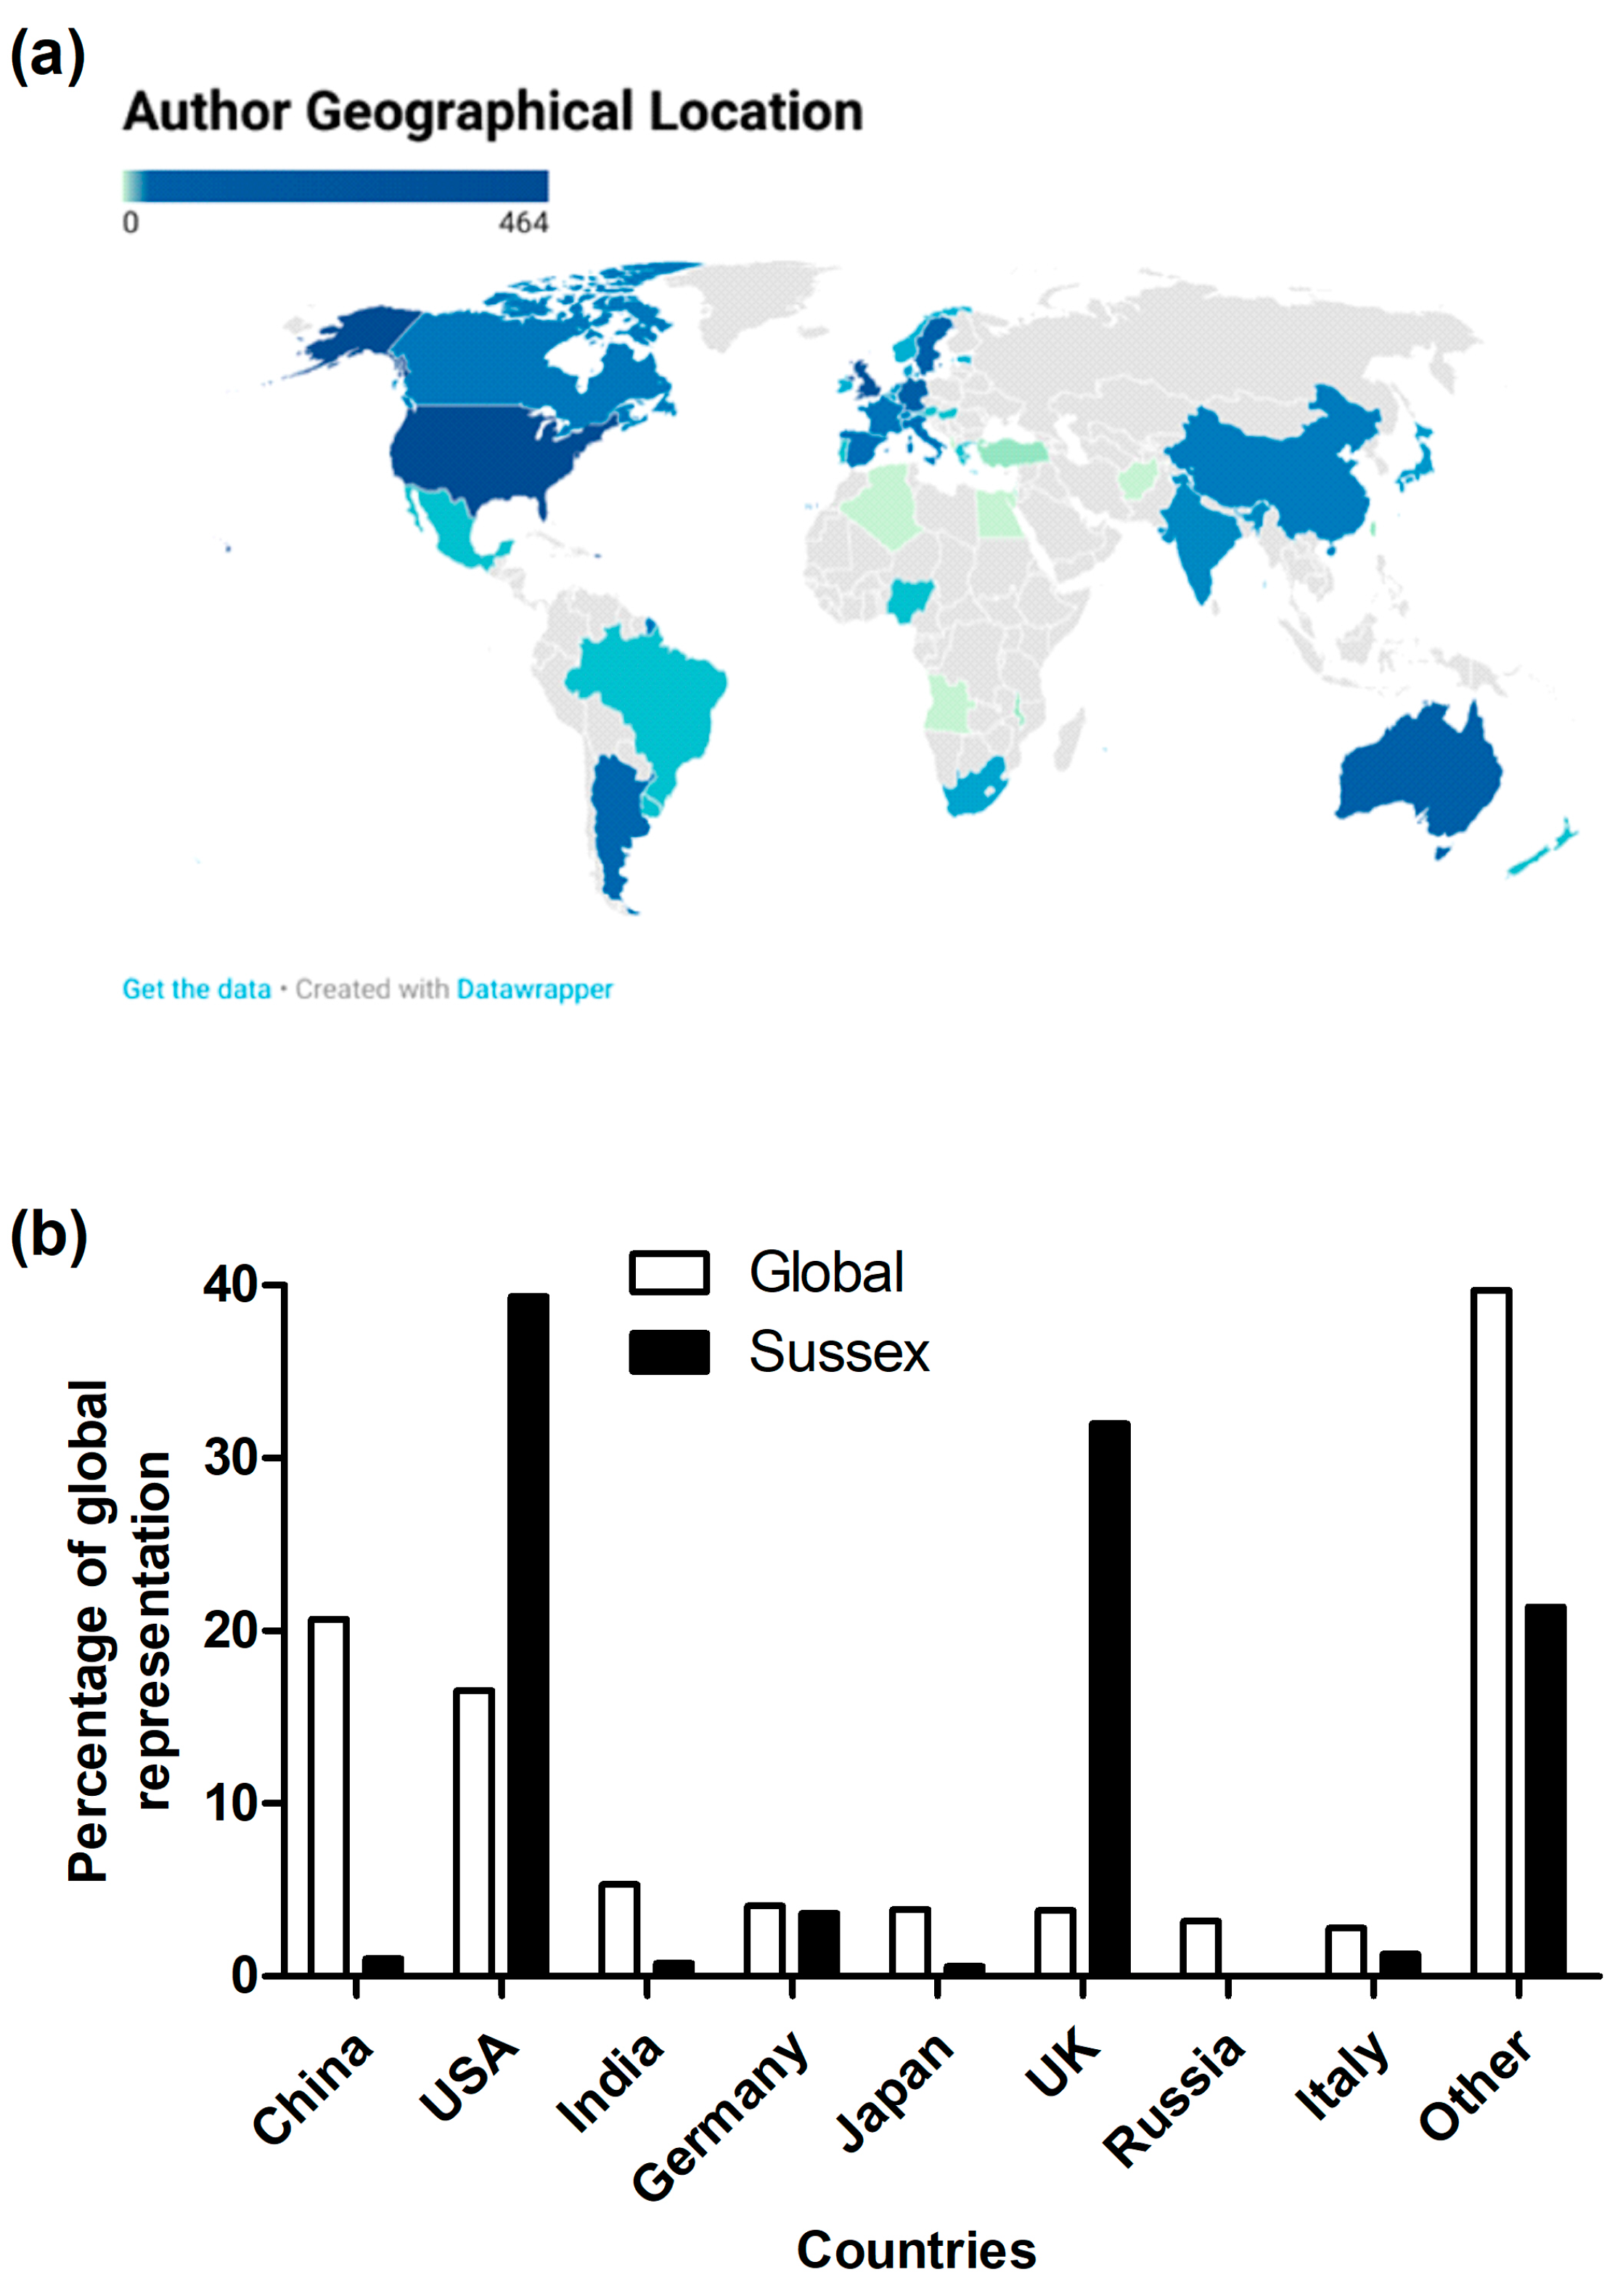
3.3. Geographical Distribution of Publication

Next, we analysed the global output of publications (Figure 4a; Table 5) and compared it with the University of Sussex’s School of Life Sciences reading list (Figure 4b). The USA and the UK made up a large majority of the authors represented on the school’s reading list, at 39.36% and 31.97%, respectively (Figure 4b). The next highest were Germany (3.65%) and Australia (2.63%). The comparison analysis showed a large disproportion to the amount each country publishes and the authors whose work is being taught at the school. For example, authors from China made up 1.02% in the school but globally 20.67%, the second highest after the USA, of all peer-reviewed STEM, particularly natural sciences papers, are published from China [20,23] (Figure 4b).

4. Discussion

The key idea of this study was to investigate diversity of authors in the reading lists of various modules and courses within the School of Life Sciences at the University of Sussex, in order to address one of the key contributing factors to the race awarding gap as highlighted by BAME students [24]. As reading lists are an integral part of our curriculum and most students engage with them for extra reading and learning, they should consist of materials written by authors from underrepresented and minority ethnic backgrounds. Our data demonstrated that the selected reading lists consisted of materials authored mainly by white men. Moreover, we found a significantly large difference between the number of male and female authors on our reading lists.
In line with our hypothesis, the majority of authors were white (83.40% vs. 7.40% BAME) and male (75.90% vs. 16.70% female). Our effect size analysis between these groups (male vs. female and BAME vs. white) revealed d 1, indicating a large disparity between the number of authors of these groups. Our geographical analysis demonstrated that a vast majority of authors were from the global North and Western countries. For instance, 31.98% of authors were from the UK and 39.36% from the USA. At a degree level, most courses had similar results, with Chemistry performing the worst for gender balance (83.28% male vs. 11.15% female). This may be surprising given efforts to increase representation and recognise scientists such as Rosalind Franklin. However, these data demonstrate that there is a need for wider work to be conducted such as training our academics in inclusive teaching methods and providing pastoral support for BAME students. It is, therefore, very important that academics acknowledge historical events and demonstrate appreciation by implementing diversity and inclusivity in their curriculum.
Genetics is one of the degrees that has the lowest BAME representation in the reading lists in the University of Sussex’s School of Life Sciences. The association of genetic studies with eugenics will undoubtably impact the proportion of historical publications from BAME academics, and therefore has potentially affected BAME academics choosing to enter and remain in the subject. The prominent views that have dominated the history of genetics and its use as a tool for discrimination, which pervades into today’s society [25], demonstrate how important it is to present publications from more ethnically diverse academics. It is also important to recognise the involvement of genetic studies in some of the most horrific times in our history and the modern times, and therefore this should be proactively acknowledged through teaching materials and appropriate representative in the curriculum.
In this study, we also reviewed the geographical distribution of the total output of peer-reviewed publications with our reading lists [20]. Interestingly, the results show that our reading lists are not representative of total publications by countries such as China. Accordingly, we show that reading materials from the USA and UK are overrepresented in our reading lists. This disparity may be due to the perception that Western scientific publications are more reliable, valuable, and useful to students learning [26]. However, this perception leads to a lack of representation and conveys the perception that publications from non-Western countries should not be valued. This disproportionate representation should be reviewed to include more research papers from non-USA and non-UK countries. Our curriculum should be diverse in its representation to reflect both the diversity of location for scientific outputs and the diverse student cohorts in undergraduate courses. Additionally, our active scientific researchers who lead on these modules and courses should be aware and appreciative of the equal contribution to knowledge globally. However, why is it important to deliver a balanced, diverse, and inclusive curriculum to our undergraduate students?
Because of the aforementioned historical reasons, the majority of theoretical groundwork has been established by white males, such as the discovery of the double helix DNA, and therefore, conventionally, key scientific resources have been heavily white male-dominated, which was also reflected in our data [27]. For this reason, it is perhaps perceived that ’good quality’ papers come from white male-led scientific groups which represents a biased, colonial view, one that the HE sector should distant itself from. This biased representation of authors increases the disparity when there is an ongoing attempt to decolonise the curriculum [28]. This disparity in BAME and gender representation in science goes beyond the biased perceptions, it starts early on in a young person’s education and continues throughout their career. For instance, male students outnumber female students by 9:1 in STEM apprenticeships, and there are only 0.7% Black professors in biology, although 2.3% Black graduates study a PhD in biology in the UK [29,30]. The knock-on effect of this ‘leaky pipeline’ will be fewer published studies and citations from UK-based BAME academics. Diversifying the reading lists to cite more work by BAME international authors is one method to mitigate the disproportionately low representation and highlight diversity of scientists to undergraduates. Research by the Royal Academy of Engineers also found that 51% of BAME engineering graduates were likely to enter full-time STEM employment after graduation as compared with 71% of their white counterparts [31]. It is also increasingly clear that there is not yet enough research exploring inequality faced by BAME scientists in the workplace. Recent data published on BAME awarding gap reported that university students from BAME background are on average achieving lower degree grades than their white counterparts. In 2017–2018, 80.9% of white students received a first or upper second-class degree as compared with 67.7% of BAME students, and this was dramatically reduced to 57.5% for Black students in the UK [7]. Inequalities are also seen in the healthcare system. Especially during the midst of a global pandemic, it is important to note that women make up the majority and BAME staff are overrepresented of those in the health workforce who are overexposed to COVID-19 [29,32]. In healthcare, we also know that Black patients are less likely to have their pain properly managed [33], black women are five times more likely to die in labour [34], and in medical research, white men are treated as the ‘standard’ [35]. This only scratches the surface of inequality experienced by minority groups in the UK. Thus, Life Sciences subjects should acknowledge, recognise, and represent a balanced and diverse curriculum, particularly through their reading lists, to showcase the historical basis of inequalities in the scientific literature that are upheld in academia.
It is well-known that women were restricted from gaining scientific degrees in many institutions until the early 20th century, and some would also have heard about atrocities such as the Tuskegee Experiment [36], and the abuse of enslaved women by Dr J. Marion Sims, who is widely regarded as the father of modern surgical gynaecology [37]. However, in our view, most would agree that academics are reluctant to adequately discuss the current inequalities and how historical injustices still impact science today.
It is also important to recognise and address the discriminatory ideologies that were the founding understandings of our current knowledge that has shaped our curriculum today. For instance, pioneers such as Darwin encouraged and endorsed Francis Galton [38], largely considered the founder of the sociopolitical movement, Eugenics [38]. During the 1900s, Eugenics became a popular study, legitimised by several high profile scientists across the world such as Charles Davenport, Ronald Fisher, Karl Pearson, and Hermann Joseph Muller [39]. These ideas led to actions by scientists in Nazi Germany who were not only participants, but architects, of the holocaust, by advocating for ‘racial purity’ [40]. Most alarmingly, views similar to those seen in the 1920s and 1930s are becoming more common; white supremacy is rising [41] and it is being legitimized by publications such as the Mankind Quarterly [42], which continues to exist as a “valid” form of publication even after years of promoting racist, ableist, and overall pseudoscientific work. Additionally, politicians, along with the media, incite racial division in our communities. Thus, it is important that in the HE sector, particularly in Life Sciences, we deliver a diverse curriculum and equip students with the tools to oppose these views and flawed methodologies to tackle inequalities in science and in everyday life in the future.
Finally, the most recently highlighted example of disparity is the over representation of positive COVID-19 cases in BAME groups in the UK and the increased death rate. For instance, Black people in the UK are four times more likely to die from COVID-19 than white people [43]. It is believed, rather than being a genetic difference, that this is most likely caused by structural inequalities in healthcare such as higher risk of comorbidities, for example, cardiovascular diseases [44], as well as socioeconomic inequalities such as being more likely to live in urban areas, working customer facing roles, and more likely to be living in overcrowded housing. For example, the NHS has twice the percentage of BAME staff than the rest of the economy [43]. This highlights the need for students to be aware of social inequalities and to incorporate these ideas into their science.
Although far from success, in the last few years there has been progress in recognising historical wrongs and those exploited by science. For instance, awareness of the exploitation of Henrietta Lacks, a Black woman whose tissue biopsy from her cervix was taken without her knowledge or consent and became the source of the immortal HeLa cell line [45], and more recently, the Abdullahi vs. Pfizer in Nigeria where Pfizer conducted a clinical trial during the 1996 meningitis epidemic in which they tested a below recommended dose of an experimental drug illegally without seeking informed consent from the families of ill children who were not aware they were part of a trial [46]. Five children who received the experimental drug died despite Medicine Sans Frontiers delivering the standard treatment in the same building. In 2009, a settlement was reached with the surviving children’s families [46].
While teaching the history of science is important, we should aim to address ethical issues in our teaching. Currently, Sussex Life Sciences curriculum already includes an optional module on bioethics which is key to any student considering a career in science. It is vital that students learn to recognise when studies are not ethical and feel confident in their knowledge of the past so that they do not repeat or enable this exploitation. This could be an opportunity to encourage co-production into a core scientific curriculum (discussed later) open to all life sciences students.
Given the current climate of social inequality and the need for the fight against racism and discrimination, it is vital that academic staff reflect on course materials to ensure equal representation of authors and scientists from various backgrounds. It is also vital that staff include the experiences and studies conducted in a wide range of participants so that students fully understand these issues when they enter into careers themselves. A curriculum reformation in collaboration with students and staff from all backgrounds and services (race, gender, administrative, and academia) should be implemented and the co-creation of a diverse and inclusive reading list within a curriculum should be included in this change.

4.1. Potential Solutions

The first and most direct solution to diversifying reading lists would be to ask the module convenors to reassess their lists for inclusivity. This can be aided by using tools such as’medium.com decolonising science reading lists’ by Prescod-Weinstein and other similar lists that have been created to highlight the work of BAME scientists. Mandating a 50% gender split or a minimum representation of BAME authors on the lists could be considered. However, this may have its own limitations such as taking the focus away from ’why the lists are not representative’ and instead of challenging them, this would lead to tokenistic action.
The second, longer term solution would be to widely educate staff and students about the roles of racism and colonialism in science. A reflective exercise for all academic staff on the lack of diversity on reading lists, the importance of an inclusive reading list, and ways to improve it, would also begin to encourage staff to reflect on their own unconscious biases. If academic staff can take this first step and begin to correct their own resources, it may lead to recognition of bias in their own teaching which may open the door to more dialogue and collaboration. This would also aid in the approach to closing the BAME awarding gap. Crucial to this will be providing a safe space for staff to share their own experiences and concerns and to confront their own prejudices without shame and alienation and without placing the burden of this work unevenly on BAME and women staff members [47].
The next step would be to incorporate the above into an educational setting. This can start by acknowledging female and BAME scientists by name and photograph in lectures when talking about their discoveries and contributions. When addressing inequalities in science and incorporating them into an education setting, it will also be key to address how science has, and is, continuing to be used as a tool that causes suffering to minority groups and is being used for running fascist and imperial regimes [48]. By being honest about atrocities in the past and being open about how some of these tactics are still present, we can bring up future generations of scientists capable of recognising and challenging these failures. Science is an extension of society and not independent of it; the idea that it is a faultless and neutral practice must be addressed and ’academic freedom’ should be at the forefront of it. Now more than ever, it is also important to challenge the rise in fascism and white supremacy, learning from the past and equipping students and staff to recognise and confront it when it arises [49,50].
This education can occur through teaching the origins of ideas, setting up journal clubs for staff and students where research by BAME authors is highlighted, and by incorporating and normalising teaching about these topics in core modules dedicated to ethics and science communication that are featured in all elements of an undergraduate degree. This would encourage students to deeply engage with science on all facets of technical, historical, and social aspects, as well as to improve science communication skills, which the COVID-19 pandemic has shown to be all important in building public trust.
We acknowledge that systemic inequities must be addressed beyond reading lists, for example, by publishing houses taking responsibility to commission work from underrepresented authors [51]. Decolonising and diversifying reading lists will not be a ’quick fix’ for representation in science and suggesting this would be over simplistic and risks potentially overlooking the issues still happening today. Nevertheless, it provides a steppingstone for increasing the understanding of these issues, improving retention of underrepresented scientists, and increasing accessibility of minorities to academia, by providing role models and more visibility to the current and future generations of students.

4.2. Limitations

This study had several limitations. The first limitation was relying on information from the library database instead of searching for publishing locations, and a list of authors for each individual book and paper. The latter would have provided us with a large amount of information. However, due to time restrictions, this was not feasible.
The second but a major limitation was that we were making assumptions about the authors based on their names, online images, current/most recent place of work, and country of study. Because it would have been unrealistic to contact every author, this was the only feasible way of conducting this. Our conclusion that authors were BAME was based solely on their photographs if available from their research and social media profiles, and therefore may not have been entirely accurate as this is a judgement based on the researchers’ presumptions. Similarly, when authors were only listed by their initials there was the chance that we identified the wrong author. Additionally, there was a limitation around identifying gender. We presumed gender from authors’ names and photos, which may have excluded non-binary people. Identifying gender by name in the UK may have also resulted in bias [52,53].
Another limitation is our definition of BAME, which we have used to define ’non-white’. The term BAME, which was adapted from the term BME (black and minority ethnic), is used to define groups of people of ethnic minority backgrounds. The terminology stems from the importance of combating racism in modern society, such as helping data collection for identifying areas in which there is a lack of BAME representation. BAME is a useful umbrella term, however, it can often omit other minorities including Traveller groups such as the Romany and Irish heritage groups [54]. This is likely to have happened in this study, as the perceived ethnicity was assessed by photographs. Other terminologies exist such as ‘People of Colour’ (POC), ‘Black, Indigenous and People of Colour’ (BIPOC) and ‘Women of Colour’ (WOC), which all lack representation of different groups. Therefore, when collating data, we are conscious of the limitations that the term BAME presents.
It is important to note that, while we recommend a diverse author representation in the reading lists, we do not advocate compromising the quality of the reading materials. Although historically, the majority of ground-breaking work was established by white males, we believe that in the last few decades with increased access to opportunities, BAME and female authors, whether naturalised citizens of a Western country or from their country of origin, have been significantly contributing to scientific research. Thus, we strongly propose that faculties should maintain the quality of reading materials, while being mindful of the gender and ethnic status of the authors.
It is also worth noting that this study was only carried out from the reading lists of one sole institution. No comparisons were made with other life sciences institutions nationally or internationally, and hence there is not enough data for us to conclusively compare results more generally and define what may be ‘good’ or ‘bad’. To be clear, it is not our belief or intention to accuse or to imply that staff are maliciously or deliberately prescribing non-representative reading lists. We believe that our data show a lack of thought and conscious action to challenge the status quo of scientific voices.

4.3. Future Direction

We believe that more studies need to be conducted to address issues around non-diverse curriculum in higher education. For example, it would be important to study links between perceived allyship from staff and institution using representative reading lists as a factor associated with students’ achievement. Additionally, it will be important to study the effect of diverse curricula on career choices among students. Long-term studies on the progress made by BAME students and whether they are more likely to stay in academia if presented with role models and a more representative curriculum will be key to developing strategies to closing the BAME awarding gap.
The other line of research would be on reading lists, exploring diversity and representation in other institutions from around the world and the factors that potentially influence these. Does the identity of staff who curate a reading list affect how representative the reading list is? Does the location and geography of the institution affect the reading lists or are the UK and USA overrepresented in most cases? These questions should be investigated further.

5. Conclusions

In conclusion, our study demonstrates that the sampled reading lists consist of overwhelmingly white, male authors, predominantly from the UK and USA. We conclude that based on the history of science and the current inequalities in representation and achievement of underrepresented minority groups such as BAME, it is important to understand the factors behind these unrepresentative trends. We believe that this study is a step forward in understanding the BAME awarding gap and can be applied to the whole curriculum and should help to encourage schools to prescribe more inclusive reading lists. In theory, our proposed solutions for reducing the large disparity would increase diversity in reading lists and directly address a general lack of awareness amongst staff and students as well as increase inclusivity in the curriculum. However, further and more rigorous quantitative studies should be undertaken more widely in the STEM higher education sector to conclusively identify how to close the BAME awarding gap.

Author Contributions

Conceptualization, M.T. and M.Z.I.P.; Data curation, M.T. and M.Z.I.P.; Formal analysis, M.T., J.H. and M.Z.I.P.; Investigation, M.T., J.H., T.E.C. and M.Z.I.P.; Methodology, M.T., J.H., T.E.C., and M.Z.I.P.; Project administration, M.Z.I.P.; Resources, M.Z.I.P.; Supervision, M.Z.I.P.; Validation, M.T., D.A., K.J.P. and M.Z.I.P.; Visualization, M.Z.I.P.; Writing—original draft, M.T. and M.Z.I.P.; Writing—review and editing, D.A., K.J.P., and M.Z.I.P. All authors have read and agreed to the published version of the manuscript.

Funding

This research received no external funding.

Institutional Review Board Statement

Not applicable.

Informed Consent Statement

Not applicable.

Data Availability Statement

The corresponding author can be contacted for datasets although no public data is available.

Acknowledgments

We would like to thank the University of Sussex Library staff for providing information on reading lists. Additionally, we would like to thank Amy Horwood from the School of Life Sciences, University of Sussex and Caitlin Ung from Decolonise Sussex group for proofreading our work.

Conflicts of Interest

The authors declare no conflict of interest.

References

  1. Wong, B.; Elmorally, R.; Copsey-Blake, M.; Highwood, E.; Singarayer, J. Is race still relevant? Student perceptions and experiences of racism in higher education. Camb. J. Educ. 2020, 51, 1–17. [Google Scholar] [CrossRef]
  2. APPG. The All-Party Parliamentary Group. Inquiry on Equity in STEM Education. 2020. Available online: https://diversityuk.org/wp-content/uploads/2020/06/Final_report_Inquiry_on_Equity_in_STEM_education.pdf (accessed on 6 June 2020).
  3. WISE. 2Workforce Statistics—One million women in STEM in the UK. 2019. Available online: https://www.wisecampaign.org.uk/statistics/2019-workforce-statistics-one-million-women-in-stem-in-the-uk/ (accessed on 6 June 2020).
  4. Joice, W.; Tetlow, A. Baselines for Improving STEM Participation: Ethnicity STEM Data for Students and Academic Staff in Higher Education 2007/08 to 2018/19. Available online: https://royalsociety.org/-/media/policy/Publications/2021/trends-ethnic-minorities-stem/Ethnicity-STEM-data-for-students-and-academic-staff-in-higher-education.pdf?la=en-GBhash=22B252EFA4A87B0D869BE288F7EF724F (accessed on 6 April 2021).
  5. AdvanceHE. Equality + Higher Education. Staff Statistical Report. 2018. Available online: https://www.advance-he.ac.uk/sites/default/files/2019-05/2018-06-ECU_HE-stats-report_staff_v5-compressed.pdf (accessed on 16 May 2021).
  6. Pridmore, N.; Lalemi, L. BME in STEM Report. 2019. Available online: http://0-www-bris-ac-uk.brum.beds.ac.uk/media-library/sites/chemistry/documents/Final%20Report%20on%20BME%20in%20STEM.pdf (accessed on 6 June 2021).
  7. UUK. Black, Asian and Minority Ethnic Student Attainment at UK Universities: #closingthegap. 2019. Available online: https://www.universitiesuk.ac.uk/policy-and-analysis/reports/Documents/2019/bame-student-attainment-uk-universities-closing-the-gap.pdf (accessed on 6 June 2020).
  8. SOAS, S.U. Degrees of Racism: A Qualitative Investigation into Ethnicity Attainment Gaps at SOAS; SOAS Student Union: London, UK, 2016. [Google Scholar]
  9. Sussex. Sussex Responds to Report on Reducing Racial Inequality in Higher Education. Available online: http://www.sussex.ac.uk/broadcast/read/49610 (accessed on 20 April 2021).
  10. Akinbosede, D. The BAME Attainment gap is not the fault of BAME students. Times Higher Education, 17 December 2019. [Google Scholar]
  11. Cash-Gibson, L.; Rojas-Gualdron, D.F.; Pericas, J.M.; Benach, J. Inequalities in global health inequalities research: A 50-year bibliometric analysis (1966–2015). PLoS ONE 2018, 13, e0191901. [Google Scholar] [CrossRef] [Green Version]
  12. Chakrabarty, D. Provincializing Europe: Postcolonial Thought and Historical Difference; Princeton University Press: Princeton, NJ, USA, 2000. [Google Scholar]
  13. Pan, R.K.; Kaski, K.; Fortunato, S. World citation and collaboration networks: Uncovering the role of geography in science. Sci. Rep. 2012, 2, 902. [Google Scholar] [CrossRef] [PubMed] [Green Version]
  14. Bird, K.S.; Pitman, L. How diverse is your reading list? Exploring issues of representation and decolonisation in the UK. High. Educ. 2019, 79, 903–920. [Google Scholar] [CrossRef] [Green Version]
  15. Rosenbloom, J.L.; Harris, J.K.; Croston, M.A.; Hutti, E.T.; Eyler, A.A. Diversify the syllabi: Underrepresentation of female authors in college course readings. PLoS ONE 2020, 15, e0239012. [Google Scholar] [CrossRef]
  16. Bird, K.S. Do women publish fewer journal articles than men? Sex differences in publication productivity in the social sciences. Br. J. Sociol. Educ. 2011, 32, 921–937. [Google Scholar] [CrossRef]
  17. Dickersin, K.; Fredman, L.; Flegal, K.M.; Scott, J.D.; Crawley, B. Is There a Sex Bias in Choosing Editors? JAMA 1998, 280, 26–264. [Google Scholar] [CrossRef] [PubMed] [Green Version]
  18. Eigenberg, H.M.; Whalley, E. Gender and Publication Patterns: Female Authorship Is Increasing, But Is There Gender Parity? Women Crim. Justice 2015, 25, 130–144. [Google Scholar] [CrossRef]
  19. McNutt, M.K.; Bradford, M.; Drazen, J.M.; Hanson, B.; Howard, B.; Jamieson, K.H.; Kiermer, V.; Marcus, E.; Pope, B.K.; Schekman, R.; et al. Transparency in authors’ contributions and responsibilities to promote integrity in scientific publication. Proc. Natl. Acad. Sci. USA 2018, 115, 2557–2560. [Google Scholar] [CrossRef] [Green Version]
  20. White, K. National Science Board, National Science Foundation. Publication Output: U.S. Trends and International Comparisons. Science and Engineering Indicators 2020. NSB-2020-6. Alexandria, VA. Available online: https://ncses.nsf.gov/pubs/nsb20206/ (accessed on 6 June 2020).
  21. Lenhard, W.; Lenhard, A. Calculation of Effect Sizes. 2016. Available online: https://www.psychometrica.de/effect_size.html (accessed on 6 June 2020).
  22. Cohen, J. Statistical Power Analysis for the Behavioral Sciences, 2nd ed.; Routledge: New York, NY, USA, 1988. [Google Scholar] [CrossRef]
  23. The ten leading countries in natural-sciences research. Nature 2020. Epub ahead of print. [CrossRef]
  24. Jefferies, S.; Phillips, E.; Plackett, C.; Universities Acting to Close BAME Student Attainment Gap. Universities UK. Available online: https://www.universitiesuk.ac.uk/news/Pages/Universities-acting-to-close-BAME-student-attainment-gap.aspx (accessed on 6 June 2020).
  25. Joly, Y.; Feze, I.N.; Song, L.; Knoppers, B.M. Comparative Approaches to Genetic Discrimination: Chasing Shadows? Trends Genet. 2017, 33, 299–302. [Google Scholar] [CrossRef] [PubMed]
  26. Grant, E. The Foundations of Modern Science in the Middle Ages: Their Religious, Institutional and Intellectual Contexts; Cambridge University Press: Cambridge, UK, 1997; p. 264. [Google Scholar]
  27. Lozano, S.; Bendels, M.H.K.; Müller, R.; Brueggmann, D.; Groneberg, D.A. Gender disparities in high-quality research revealed by Nature Index journals. PLoS ONE 2018, 13, e0189136. [Google Scholar] [CrossRef] [Green Version]
  28. Charles, E. Decolonizing the curriculum. Insights UKSG J. 2019, 32. [Google Scholar] [CrossRef] [Green Version]
  29. HESA. Higher Education Student and Staff Records for the Academic Year 2017/18. 2018. Available online: https://www.hesa.ac.uk/data-and-analysis (accessed on 28 May 2021).
  30. APPG. The State of the Sector: Diversity and Representation in STEM Industriesin the UK; British Science Association: London, UK, 2020; Available online: https://www.britishscienceassociation.org/Handlers/Download.ashx?IDMF=d7899dce-22d5-4880-bbcf-669c0c35bda6 (accessed on 6 June 2021).
  31. Sillem, H.; Driving Diversity in Engineering. The Engineer. 2017. Available online: https://www.theengineer.co.uk/comment-driving-diversity-in-engineering/ (accessed on 5 May 2021).
  32. Nguyen, L.H.; Drew, D.A.; Joshi, A.D.; Guo, C.G.; Ma, W.; Mehta, R.S.; Sikavi, D.R.; Lo, C.H.; Kwon, S.; Song, M.; et al. Risk of COVID-19 among frontline healthcare workers and the general community: A prospective cohort study. medRxiv 2020. preprint. [Google Scholar]
  33. Hoffman, K.M.; Trawalter, S.; Axt, J.R.; Oliver, M.N. Racial bias in pain assessment and treatment recommendations, and false beliefs about biological differences between blacks and whites. Proc. Natl. Acad. Sci. USA 2016, 113, 4296–4301. [Google Scholar] [CrossRef] [Green Version]
  34. Howell, E.A.; Egorova, N.; Balbierz, A.; Zeitlin, J.; Hebert, P.L. Black-white differences in severe maternal morbidity and site of care. Am. J. Obstet. Gynecol. 2016, 214, 122.e1–122.e7. [Google Scholar] [CrossRef] [Green Version]
  35. Holdcroft, A. Gender bias in research: How does it affect evidence based medicine? J. R. Soc. Med. 2007, 100, 2–3. [Google Scholar] [CrossRef]
  36. Brandt, A.M. Racism and research: The case of the Tuskegee Syphilis Study. Hastings Cent. Rep. 1978, 8, 21–29. [Google Scholar] [CrossRef] [PubMed] [Green Version]
  37. Spettel, S.; White, M.D. The portrayal of J. Marion Sims’ controversial surgical legacy. J. Urol. 2011, 185, 2424–2427. [Google Scholar] [CrossRef]
  38. Endersby, J. A Guinea Pig’s History of Biology: The Plants and Animals Who Taught Us the Facts of Life; William Heinemann: London, UK, 2007. [Google Scholar]
  39. Post, S.G. The echo of Nuremberg: Nazi data and ethics. J. Med Ethics 1991, 17, 42–44. [Google Scholar] [CrossRef] [PubMed] [Green Version]
  40. Wilson, P.K. Eugenics. In Encyclopedia Britannica. 2019. Available online: https://www.britannica.com/science/eugenics-genetics (accessed on 20 May 2021).
  41. Clark, S. How White Supremacy Returned to Mainstream Politics. Centre for American Progress. 2020. Available online: https://www.americanprogress.org/issues/security/reports/2020/07/01/482414/white-supremacy-returned-mainstream-politics/ (accessed on 2 June 2021).
  42. Saini, A. Superior, The Return of Race Science; Beacon Press, Fourth Estate Books: Boston, MA, USA, 2019; p. 256. [Google Scholar]
  43. Bentley, G.R. Don’t blame the BAME: Ethnic and structural inequalities in susceptibilities to COVID-19. Am. J. Hum. Biol. Off. J. Hum. Biol. Counc. 2020, 32, e23478. [Google Scholar] [CrossRef]
  44. Bambra, C.; Riordan, R.; Ford, J.; Matthews, F. The COVID-19 pandemic and health inequalities. J. Epidemiol. Community Health 2020, 74, 964–968. [Google Scholar] [CrossRef] [PubMed]
  45. Kemet, S. Insight Medicine Lacks— The Continuing Relevance of Henrietta Lacks. N. Engl. J. Med. 2019, 381, 800–801. [Google Scholar] [CrossRef] [PubMed]
  46. Okonta, P.I. Ethics of clinical trials in Nigeria. Niger. Med J. 2014, 55, 188–194. [Google Scholar] [CrossRef] [Green Version]
  47. Doku, A. White Elephant #3: Putting the Burden of Closing Attainment Gaps off BME Staff and Students; Higher Education Policy Institute: Oxford, UK, 2019; Available online: https://www.hepi.ac.uk/2019/09/22/white-elephant-3-putting-the-burden-of-closing-attainment-gaps-off-bme-staff-and-students/ (accessed on 7 June 2021).
  48. Hodge, J.M. Science and Empire: An Overview of the Historical Scholarship. Sci. Emp. 2011, 3–29. [Google Scholar] [CrossRef]
  49. Grierson, J. Anti-Asian Hate Crimes up 21% in UK During Coronavirus Crisis. Available online: https://www.theguardian.com/world/2020/may/13/anti-asian-hate-crimes-up-21-in-uk-during-coronavirus-crisis (accessed on 6 June 2020).
  50. Bieber, F. Global Nationalism in Times of the COVID-19 Pandemic. Natl. Papers 2020, 1. [Google Scholar] [CrossRef]
  51. Wu, K. Scientific Journals Commit to Diversity but Lack the Data; The New York Times: New York, NY, USA, 2020; p. 3. [Google Scholar]
  52. Johns, B.T.; Dye, M. Gender bias at scale: Evidence from the usage of personal names. Behav. Res. Methods 2019, 51, 1601–1618. [Google Scholar] [CrossRef] [PubMed] [Green Version]
  53. Pilcher, J. Names and “Doing Gender”: How Forenames and Surnames Contribute to Gender Identities, Difference, and Inequalities. Sex Roles 2017, 77, 812–822. [Google Scholar] [CrossRef] [PubMed] [Green Version]
  54. Bunglawala, Z. Please, Don’t Call me BAME or BME! Civil Service, GOV.UK. 2019. Available online: https://civilservice.blog.gov.uk/2019/07/08/please-dont-call-me-bame-or-bme/ (accessed on 6 June 2021).
Figure 1. Percentage of gender and ethnic representation in the reading lists of the School of Life Sciences, University of Sussex: (a) Representation of gender and ethnicity per year in the reading lists (normalised to the total number of authors); a percentage representation of (b) gender and (c) ethnicity of authors on the total reading lists in the school. Results are mean ± standard deviation (SD); p-value is less than 0.0001, demonstrating a significant difference on the Mann–Whitney U test.
Education 11 00359 g001
Figure 2. A comparative breakdown of percentage representation between (a) male and female and (b) White and BAME authors, per module per year in the reading lists. * p 0.001, Mann–Whitney U test. The results are mean ± SD, normalised to the total number of authors and expressed in percentage.
Education 11 00359 g002
Figure 3. A representation of author on reading lists according to (a) gender (male and female) and (b) ethnicity (White and BAME) per degree in the school.
Education 11 00359 g003
Figure 4. Geographical location of publications on the total reading lists of the schools. (a) A visual representation of geographical location of publications used in the reading lists of total global publications; (b) percentage representation of publications in the reading lists of the University of Sussex’s School of Life Sciences vs. global output [20].
Education 11 00359 g004
Table 1. ‘Good honours’ degree (i.e., a first, an upper second class, or any honours level classification gained for an integrated master’s qualification), broken down by ethnicity/demography for the School of Life Sciences at the University of Sussex. Received from University of Sussex through the Freedom of Information Act 2000.
EthnicityGood Honours Degree by Ethnicity (%)
2014/152015/162016/172017/18
White88.390.688.281.6
BAME90.775.973.553.3
Awarding gap
(BAME-White)
+2.4−14.7−14.7−28.3
Table 2. Interpretation of different effect sizes [21,22].
Cohen’s dInterpretation
0Adverse Effect
0No Effect
0.1
0.2Small Effect
0.3
0.4
0.5Intermediate Effect
0.6
0.7
0.8Large Effect
0.9
≥1.0
Table 3. A summary of the effect size of the Mann–Whitney U test results, comparing male and female, and BAME and white authors on the University of Sussex’s School of Life Sciences reading lists.
Cohen’s dU Valuep-ValueInterpretation
Male vs. Female1.88700.0001Large effect
BAME vs. White1.11100.0001Large effect
Table 4. A summary of the effect size of the Mann–Whitney U test results, comparing male and female, and BAME and white authors, across all Years 1, 2, and 3, on the University of Sussex’s School of Life Sciences reading lists.
YearGroups ComparedCohen’s dU Valuep-ValueInterpretation
1Male vs. female1.241200.001Large effect
BAME vs. White0.89600.001Large effect
2Male vs. female1.9900.001Large effect
BAME vs. White1.06800.001Large effect
3Male vs. female2.07300.001Large effect
BAME vs. White1.22100.001Large effect
Table 5. A comparison of geographical distribution between the reading lists at the School of Life Sciences, University of Sussex and global output.
CountriesOutput %
GlobalSussex
China20.671.02
USA16.5439.36
India5.310.76
Germany4.083.65
Japan3.870.59
UK3.8231.98
Russia3.190
Italy2.791.27
Other39.7321.37
Publisher’s Note: MDPI stays neutral with regard to jurisdictional claims in published maps and institutional affiliations.

