
Understanding the Conceptions of Engineering in Early Elementary Students

 , , , and
Abstract
:1. Introduction
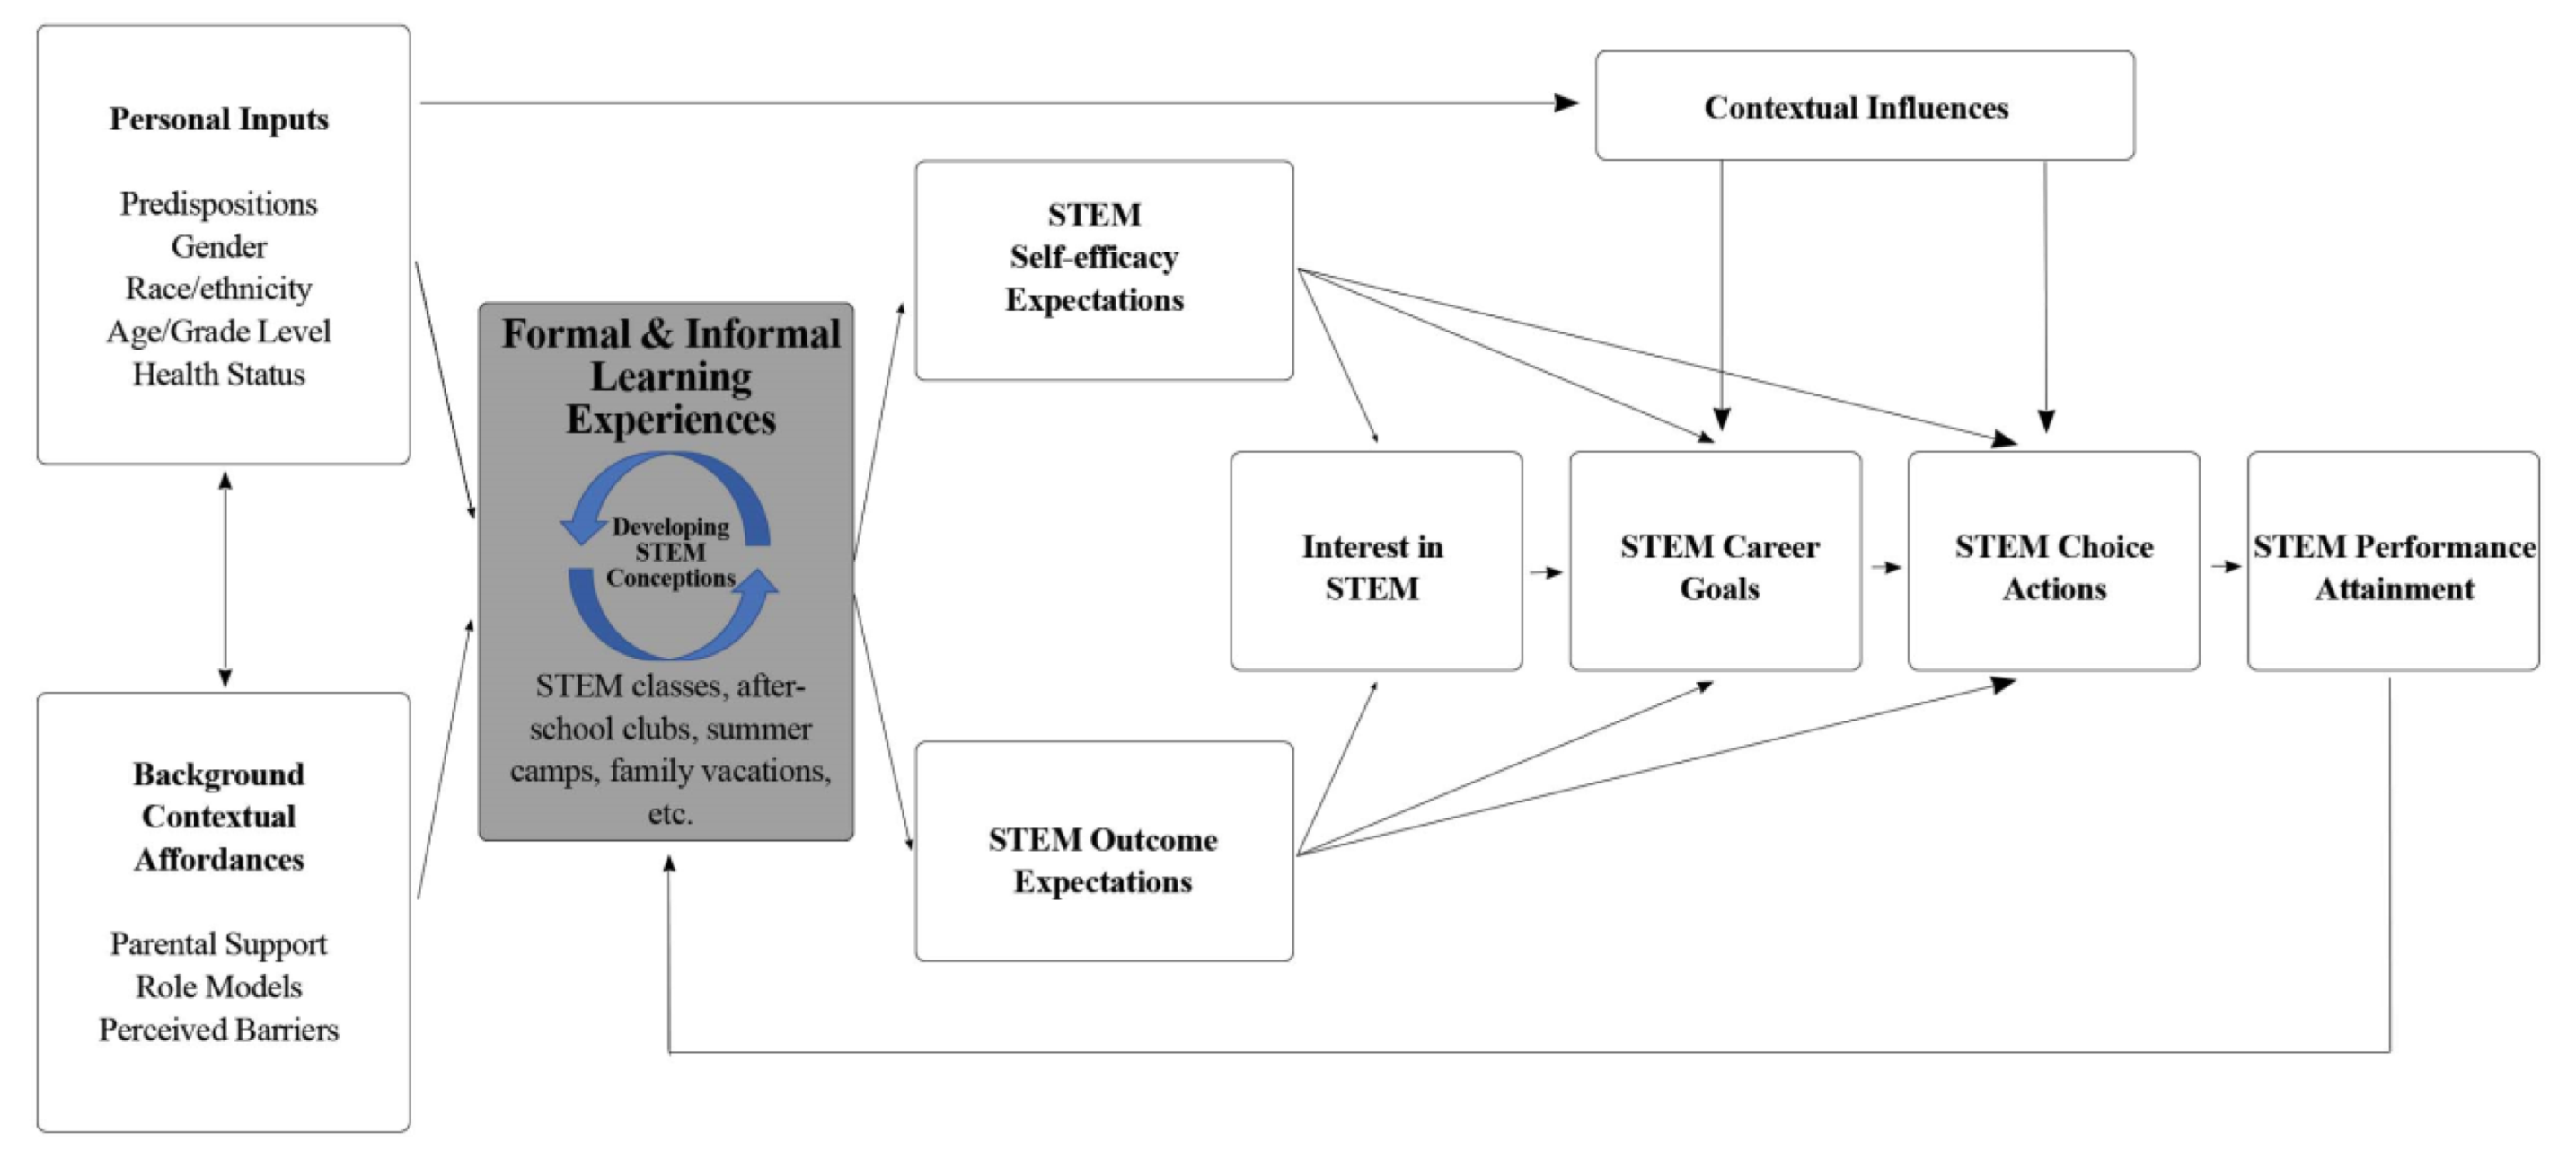
1.1. Theoretical Framework
1.2. Learning Experiences Inform Early STEM Conceptions
1.3. Students’ Conceptions of Engineering
1.4. Research Questions
2. Materials and Methods
2.1. Context of the Study
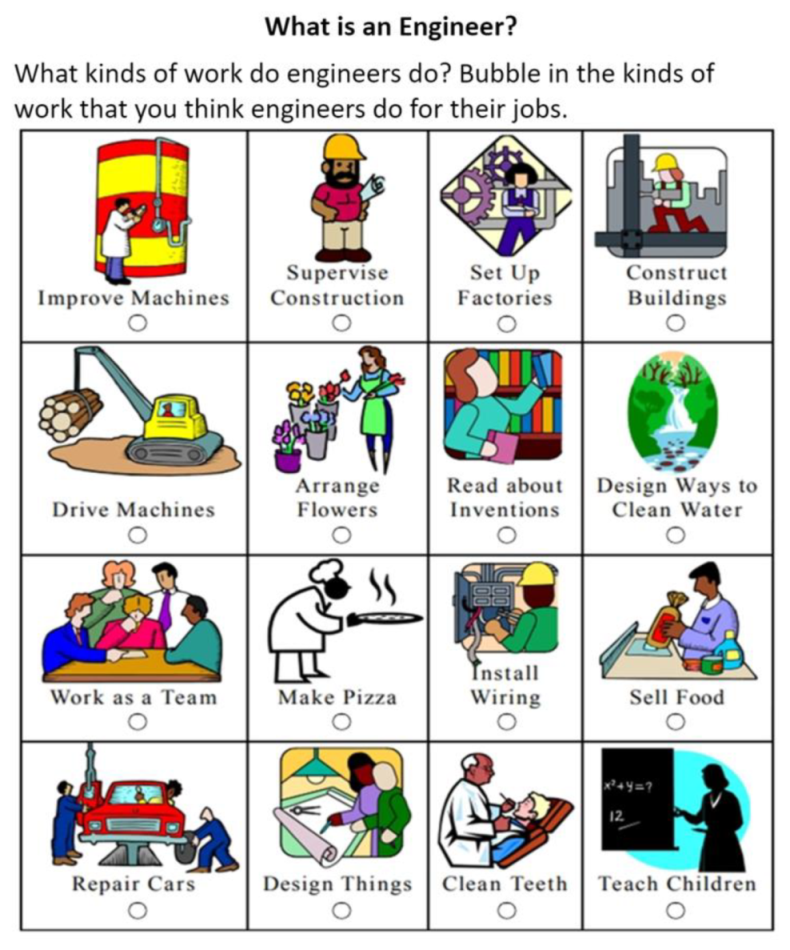
2.2. Data Collection
2.3. Sample
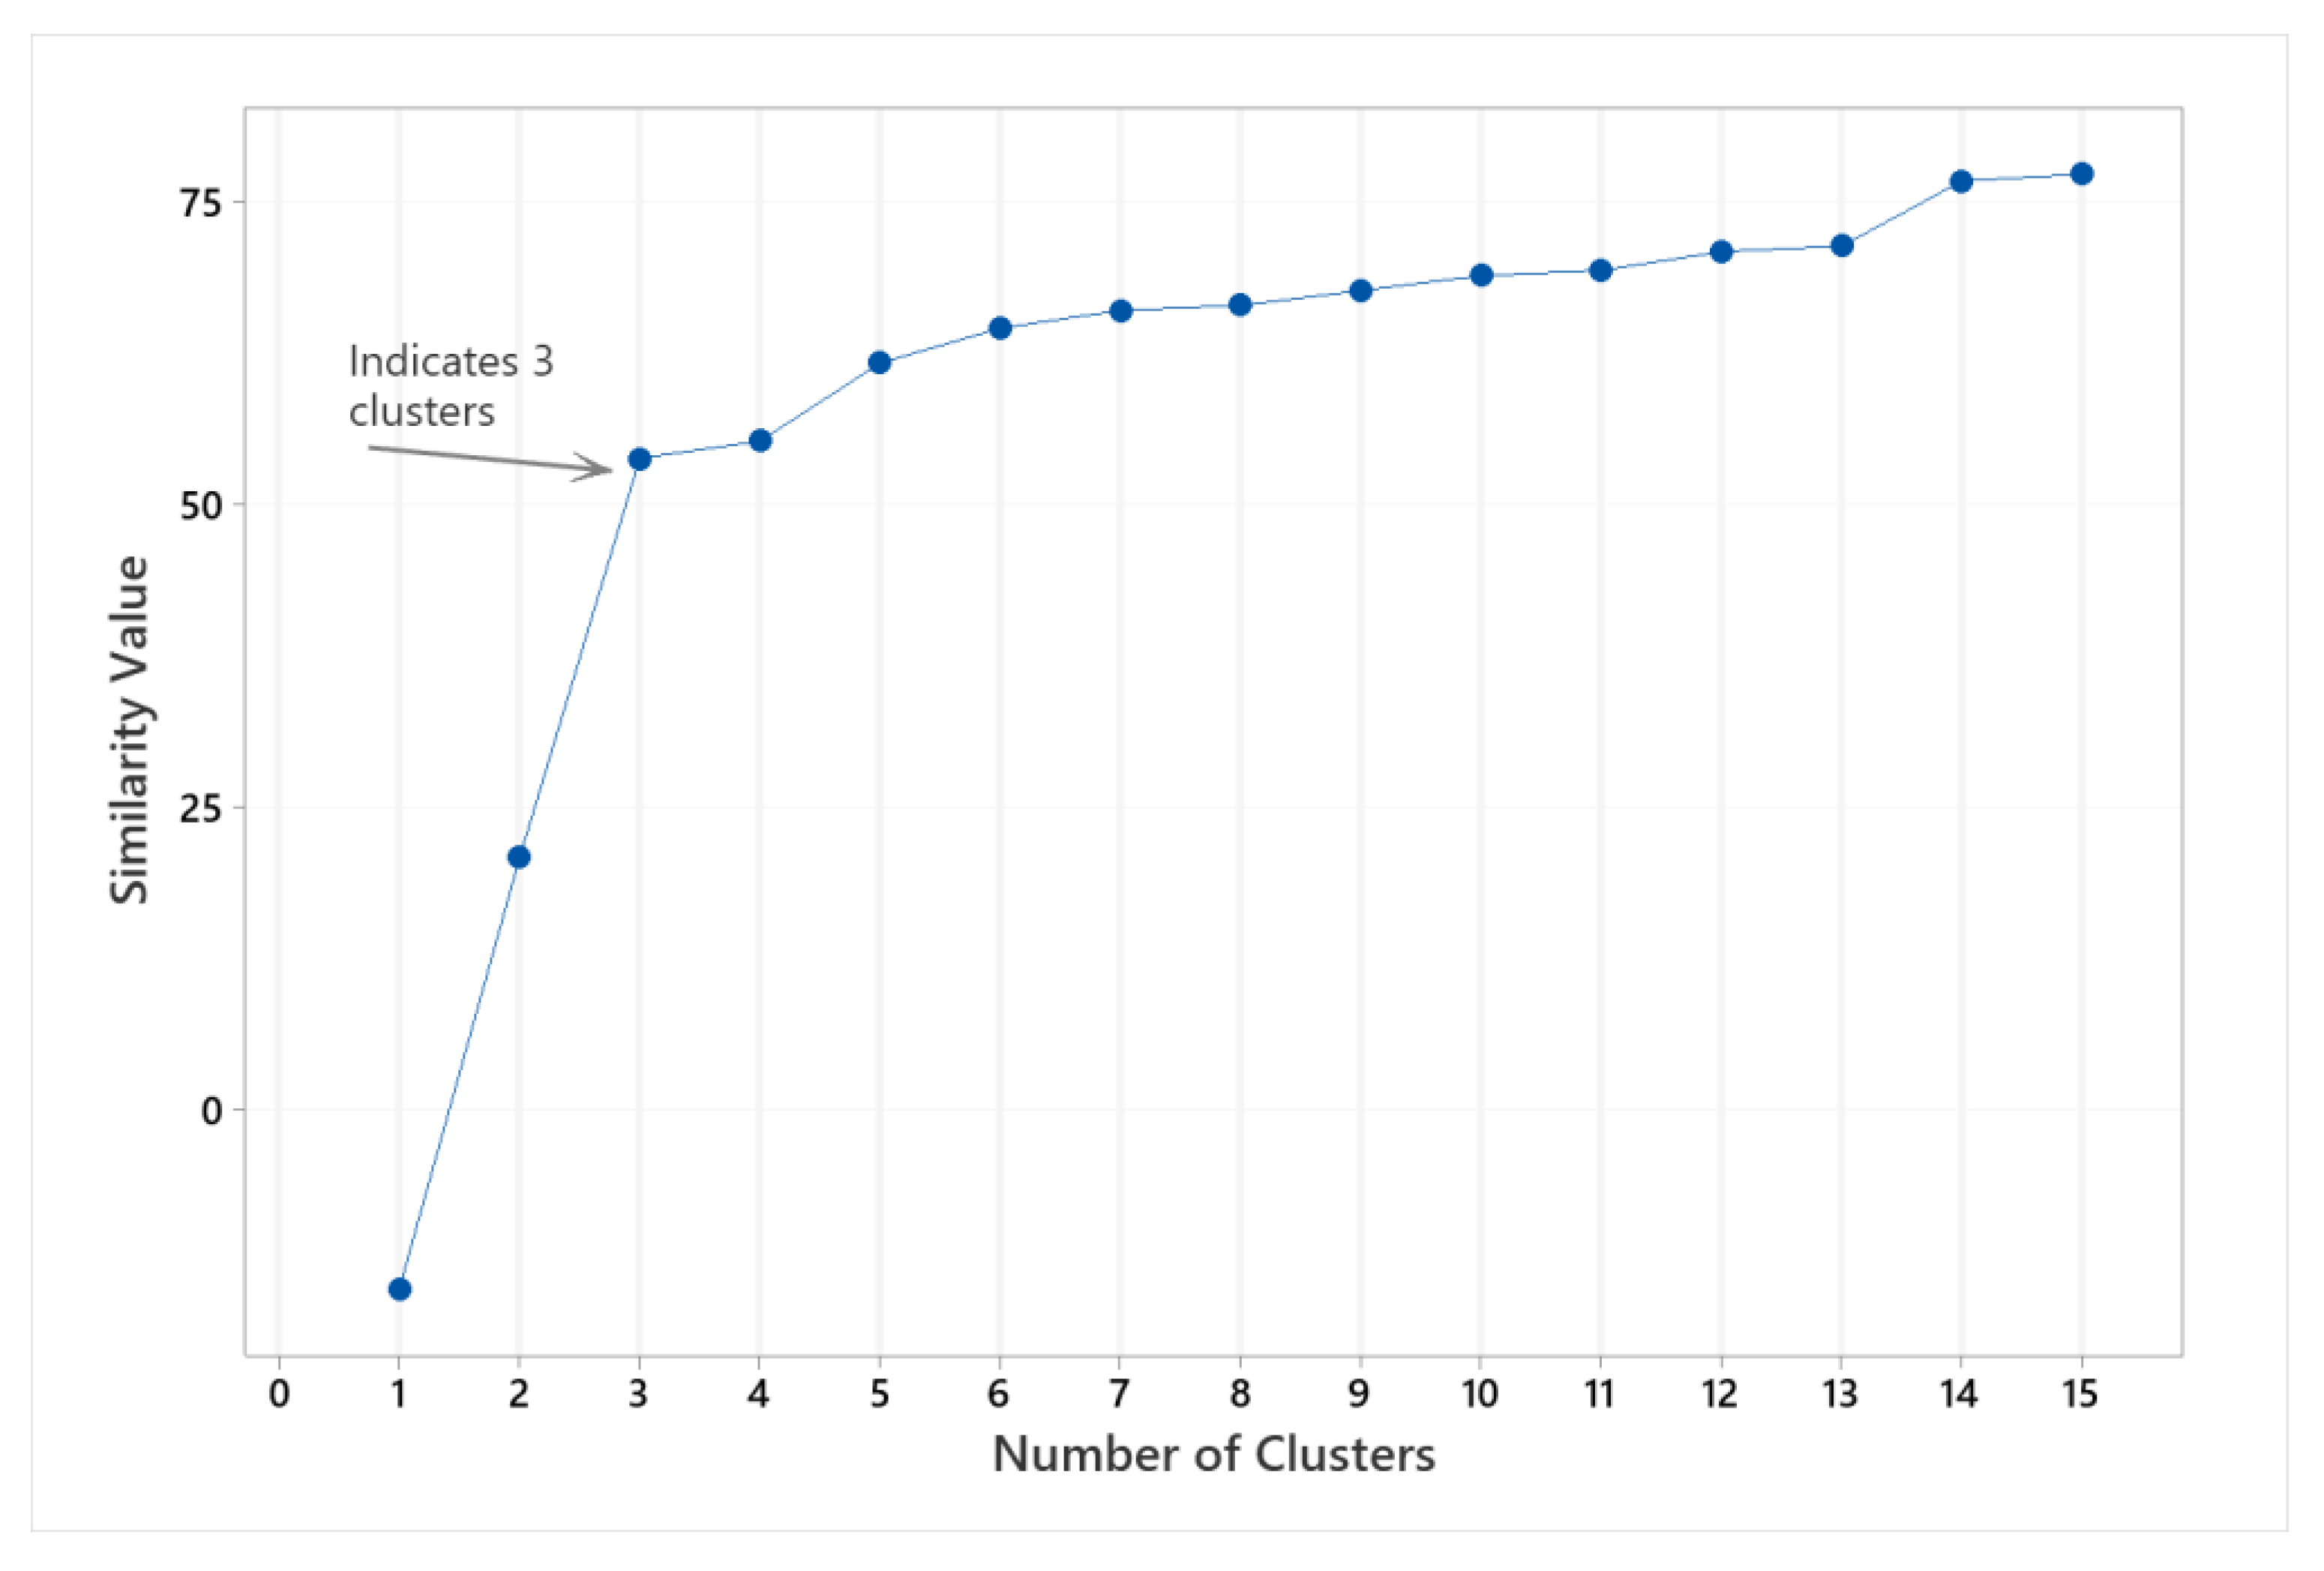
2.4. Data Analysis
3. Results
3.1. Early Elementary Students’ Associations with Engineering
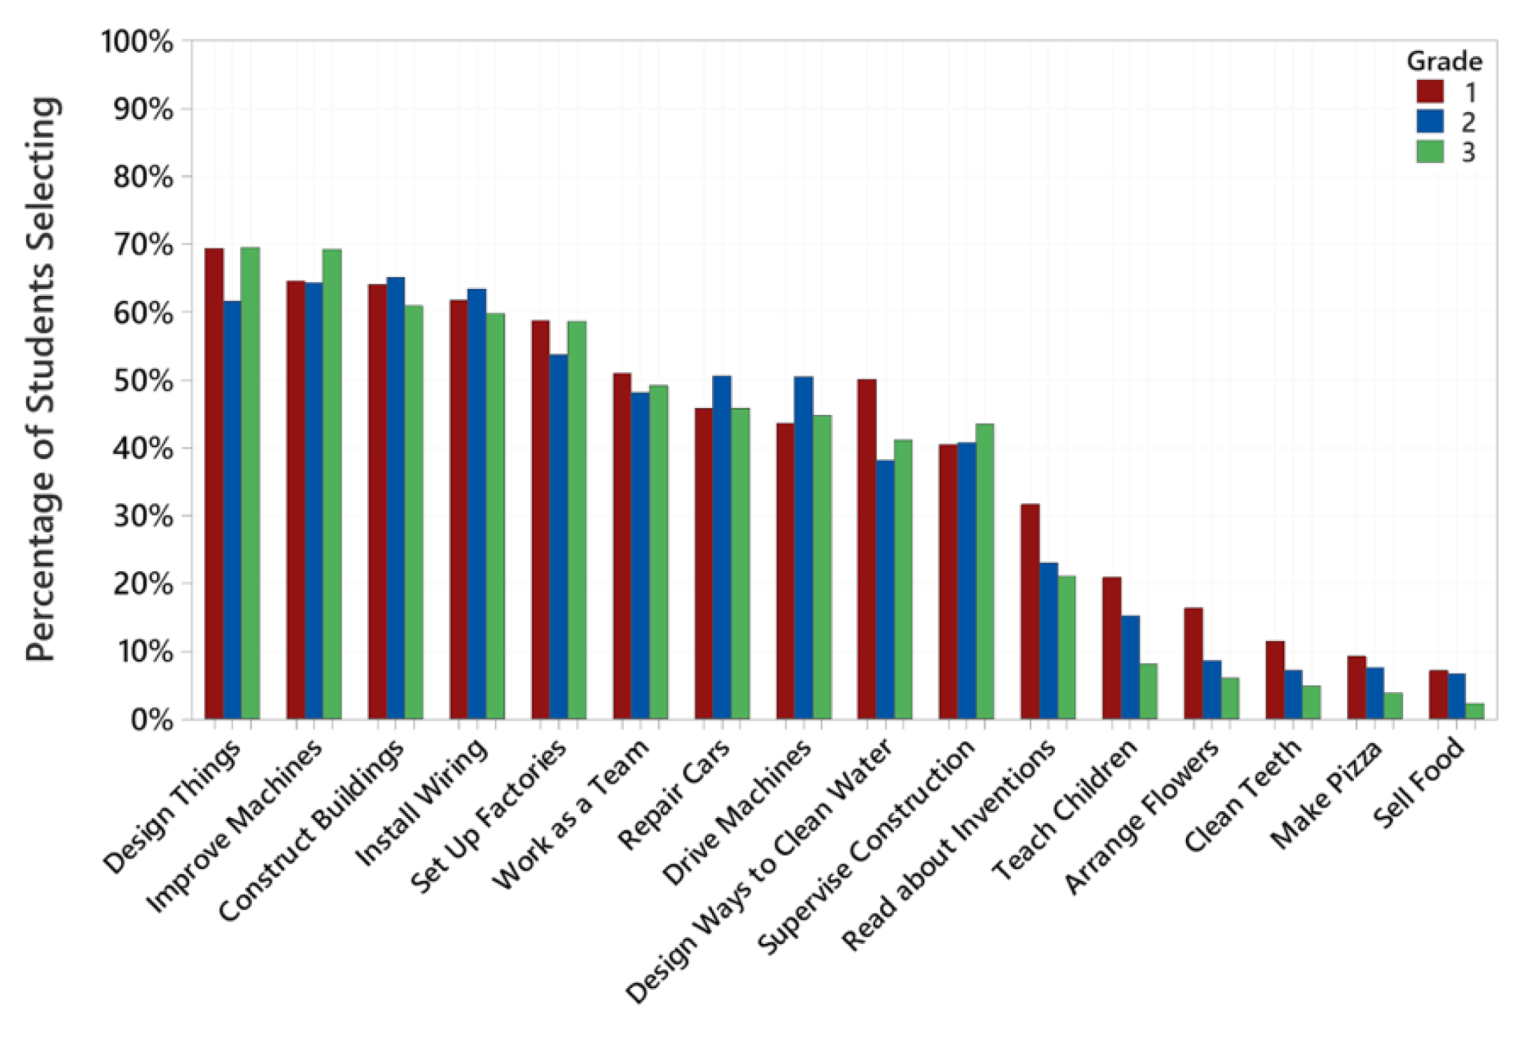
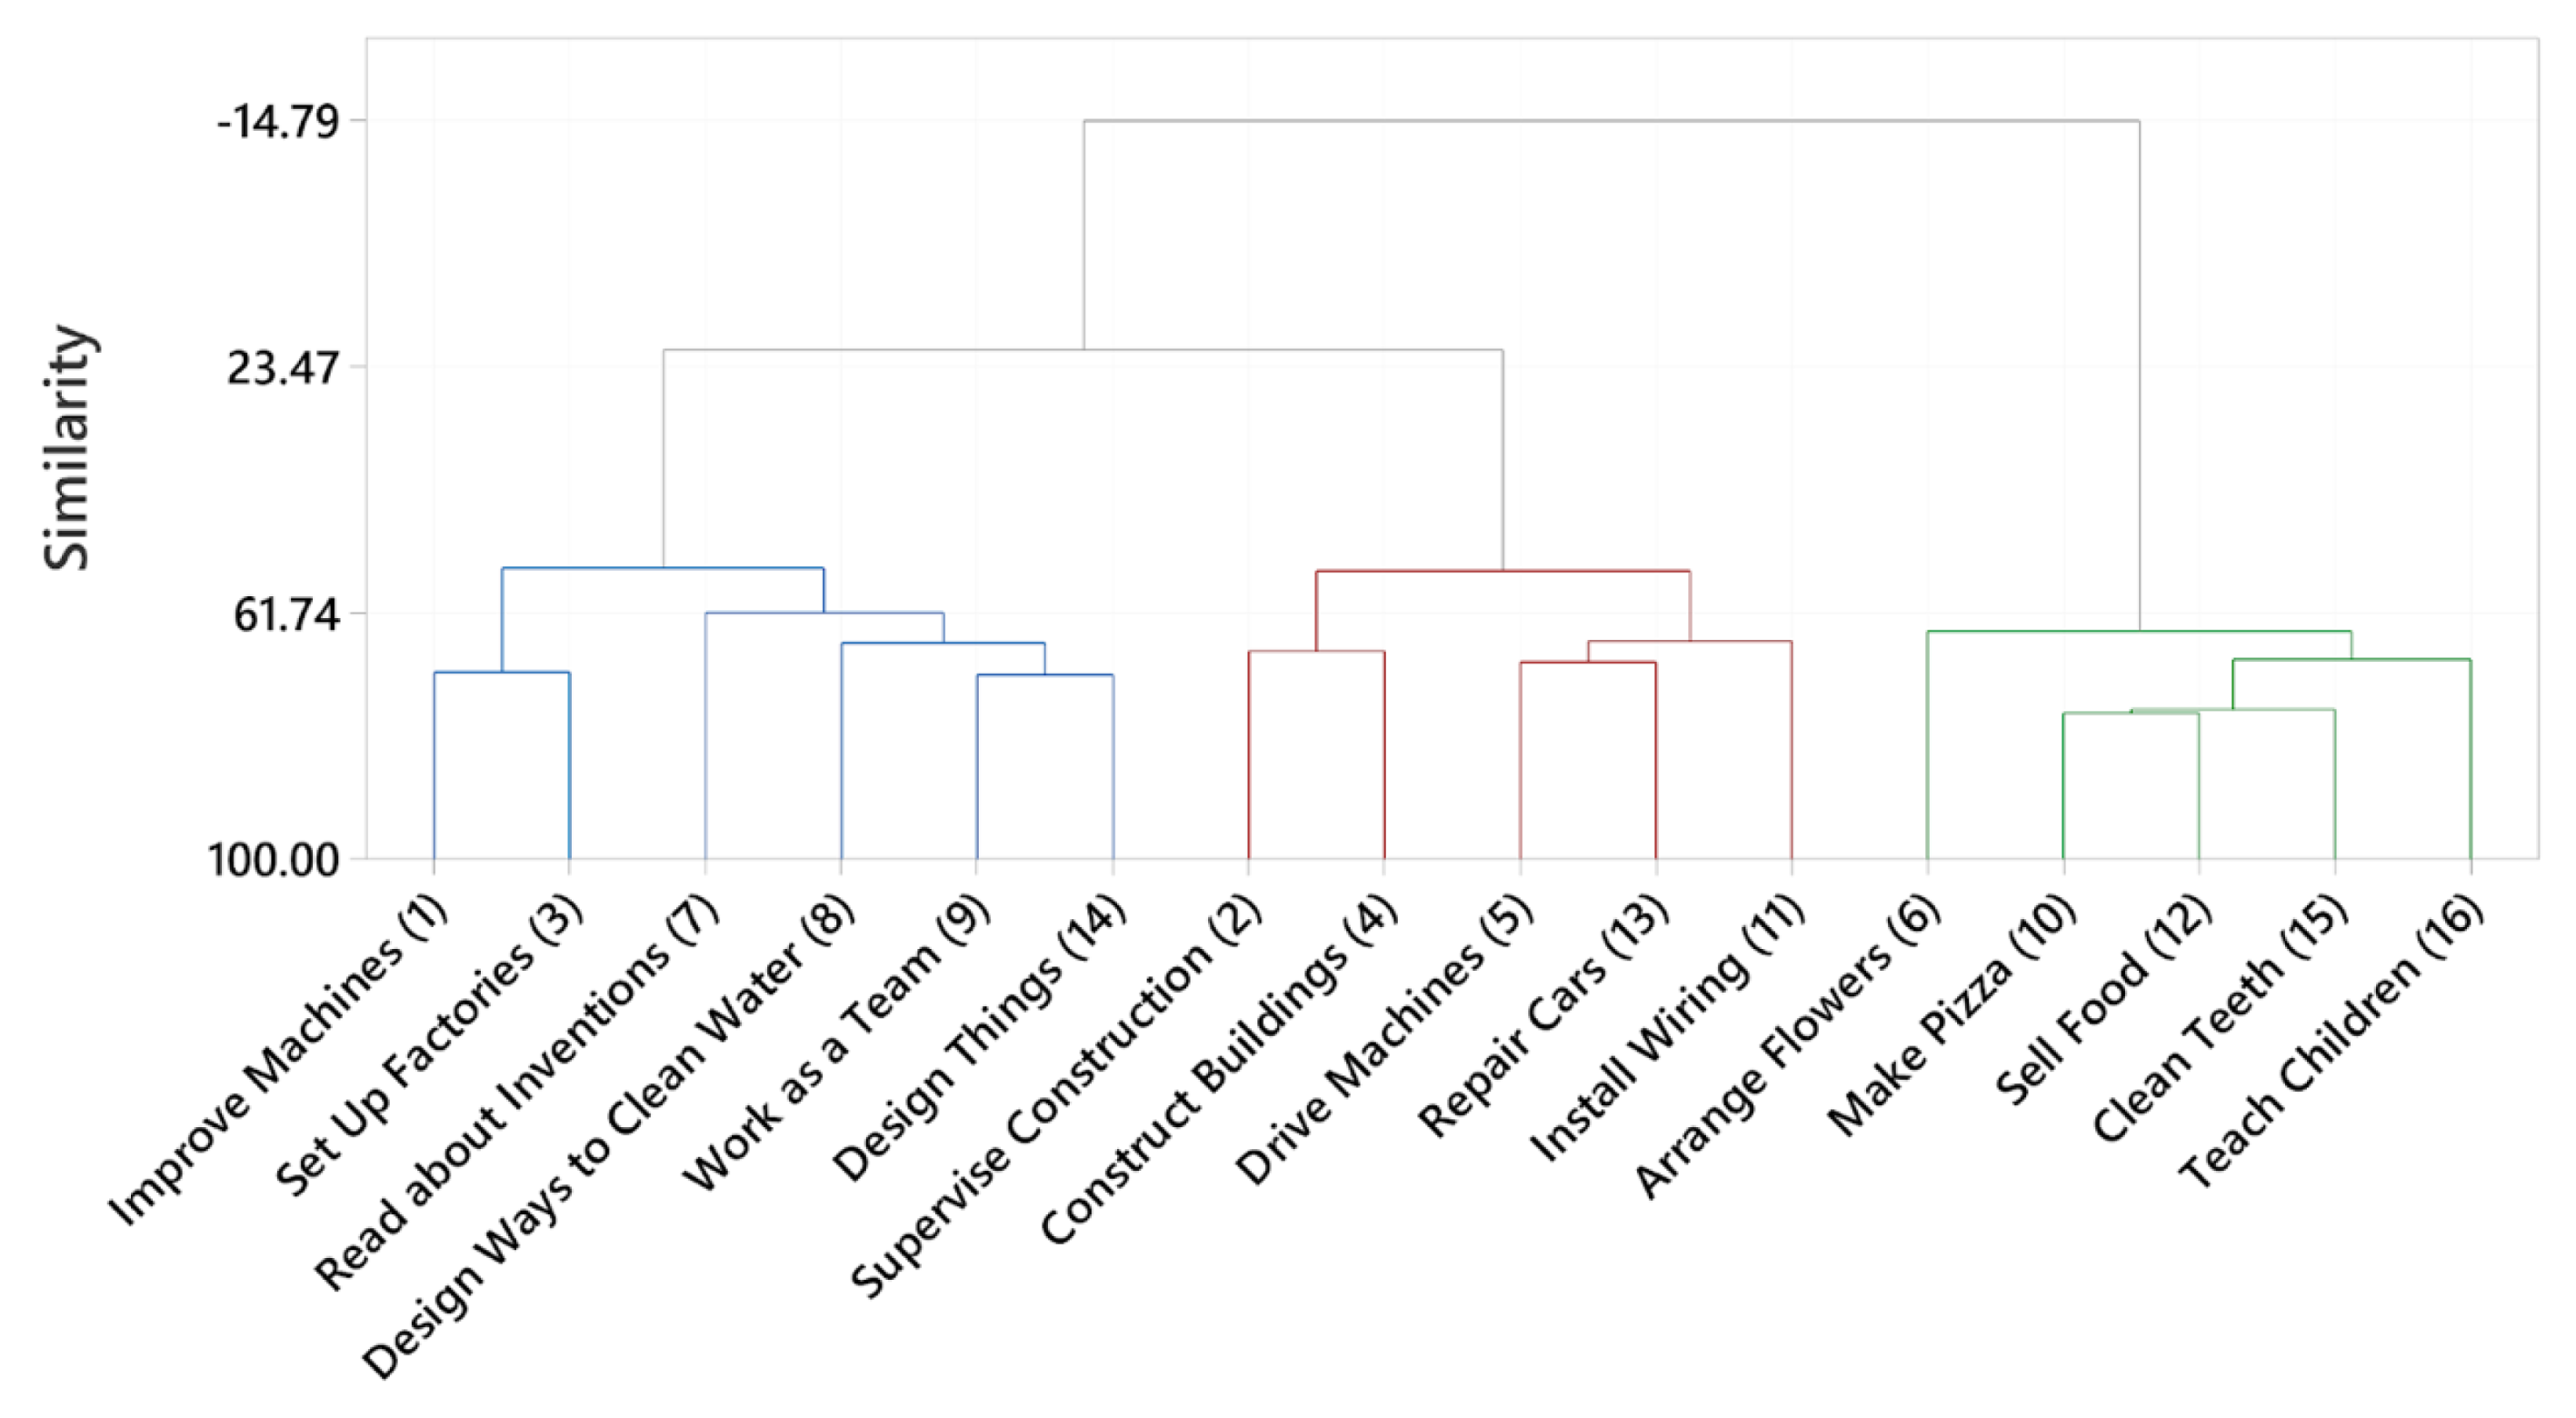
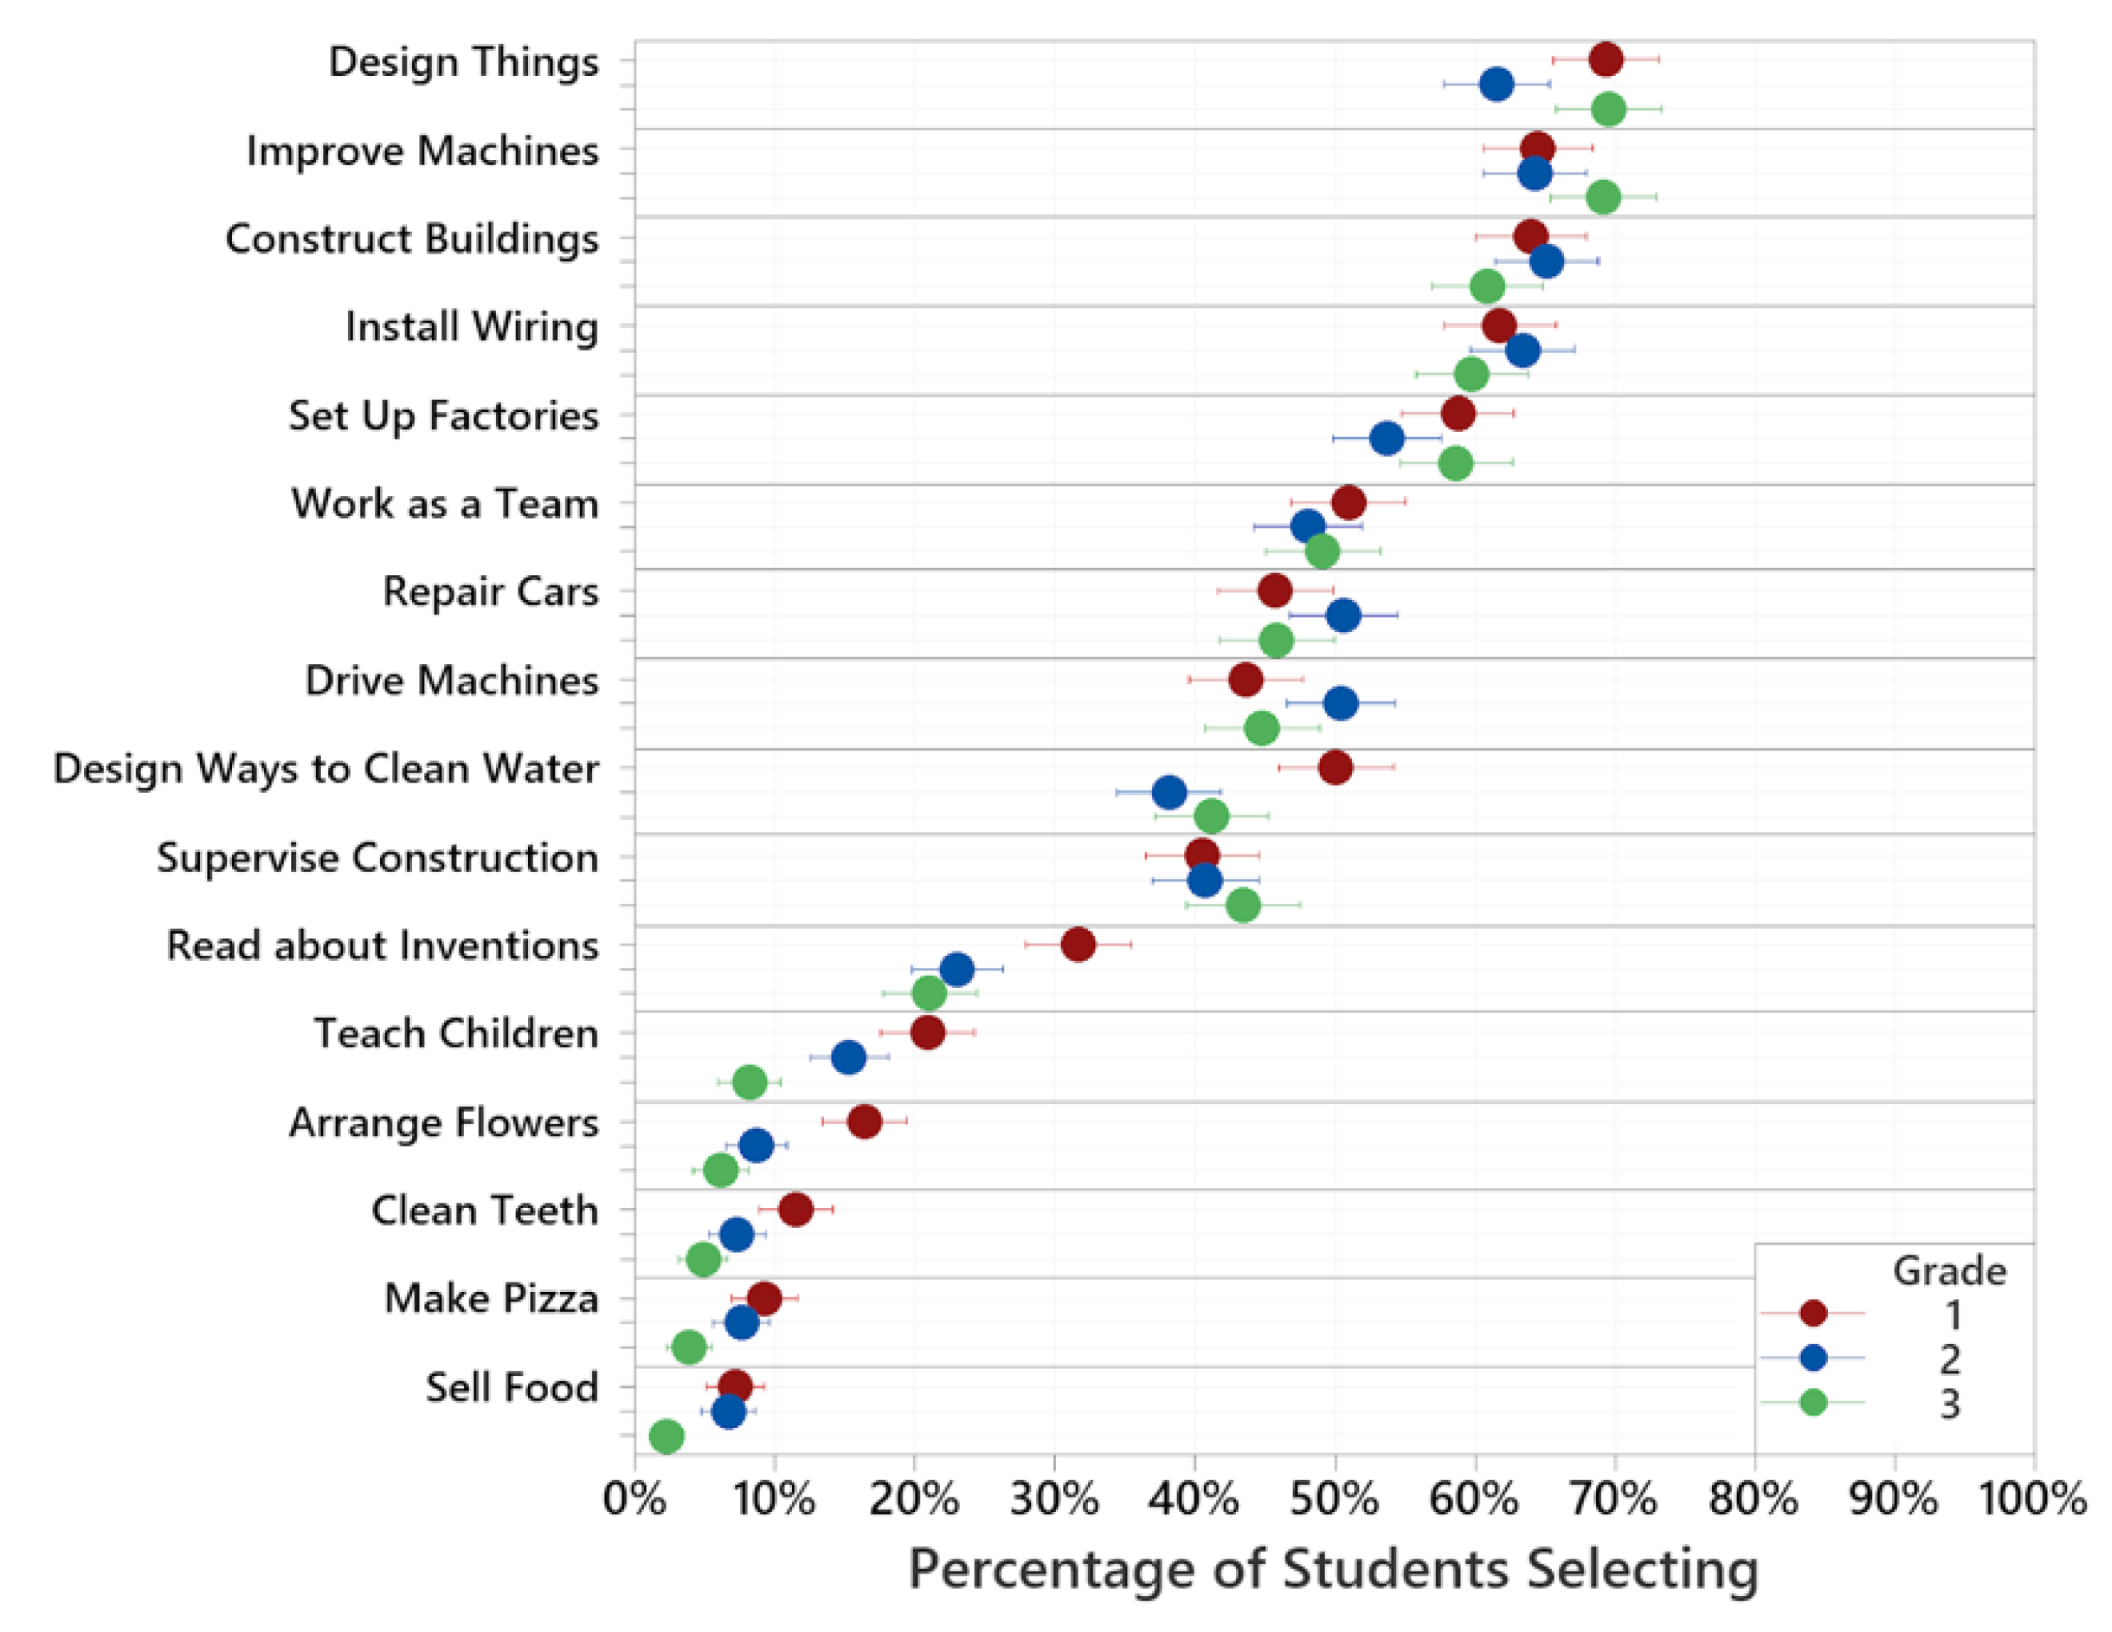
3.2. Grade Comparisons of Images Associated with Engineering
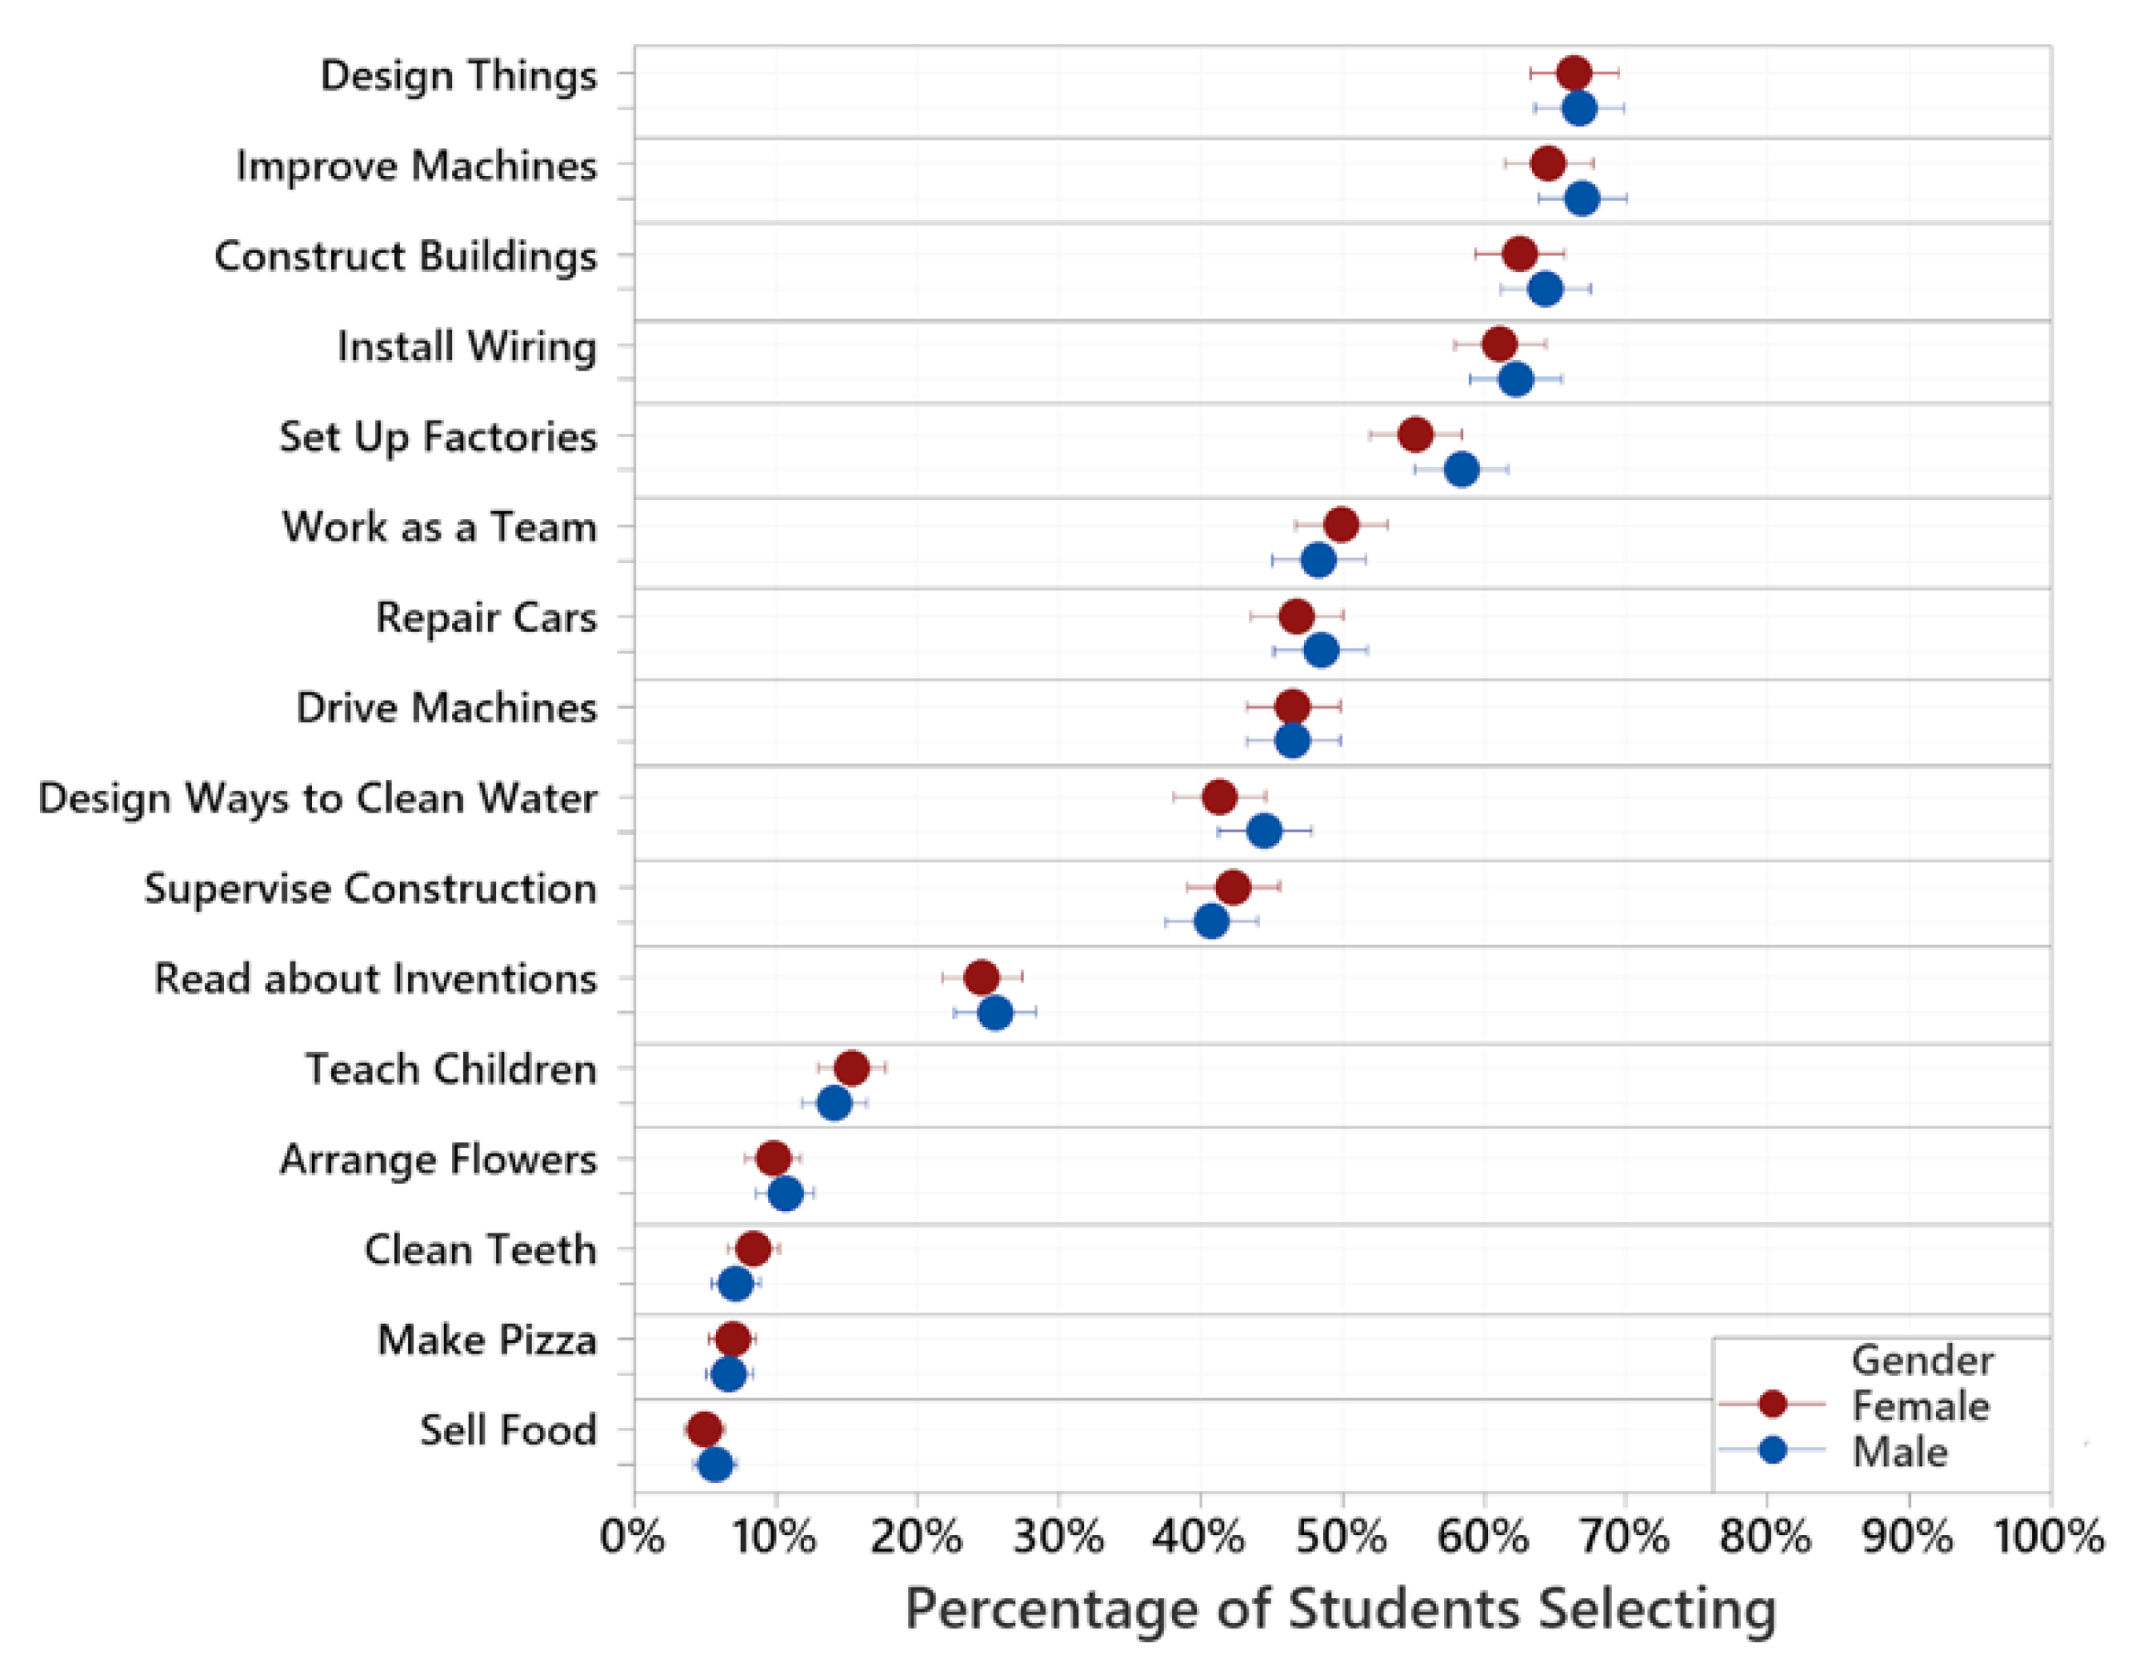
3.3. Gender Comparison of Images Associated with Engineering
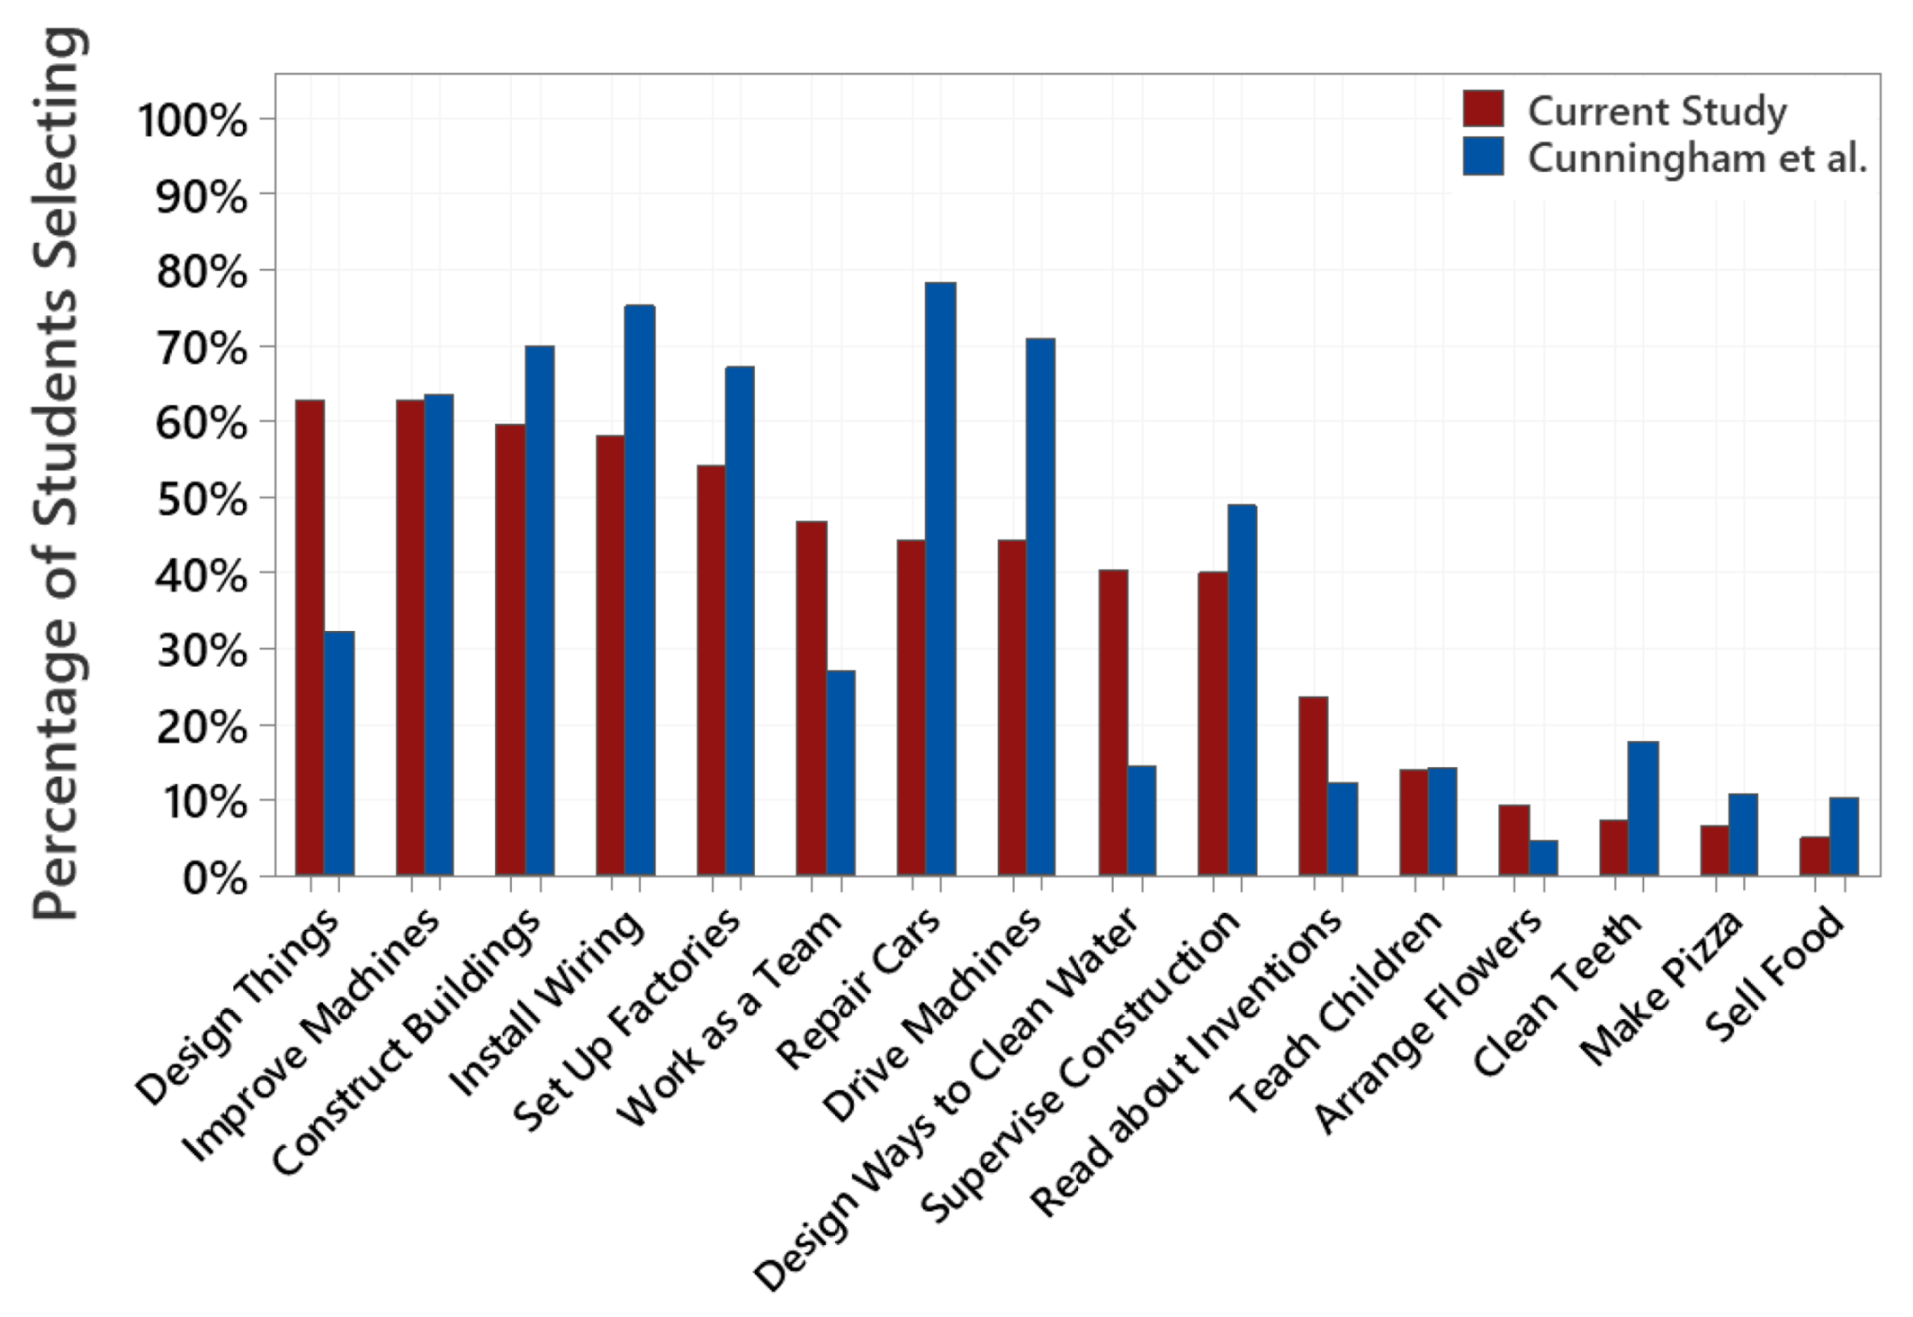
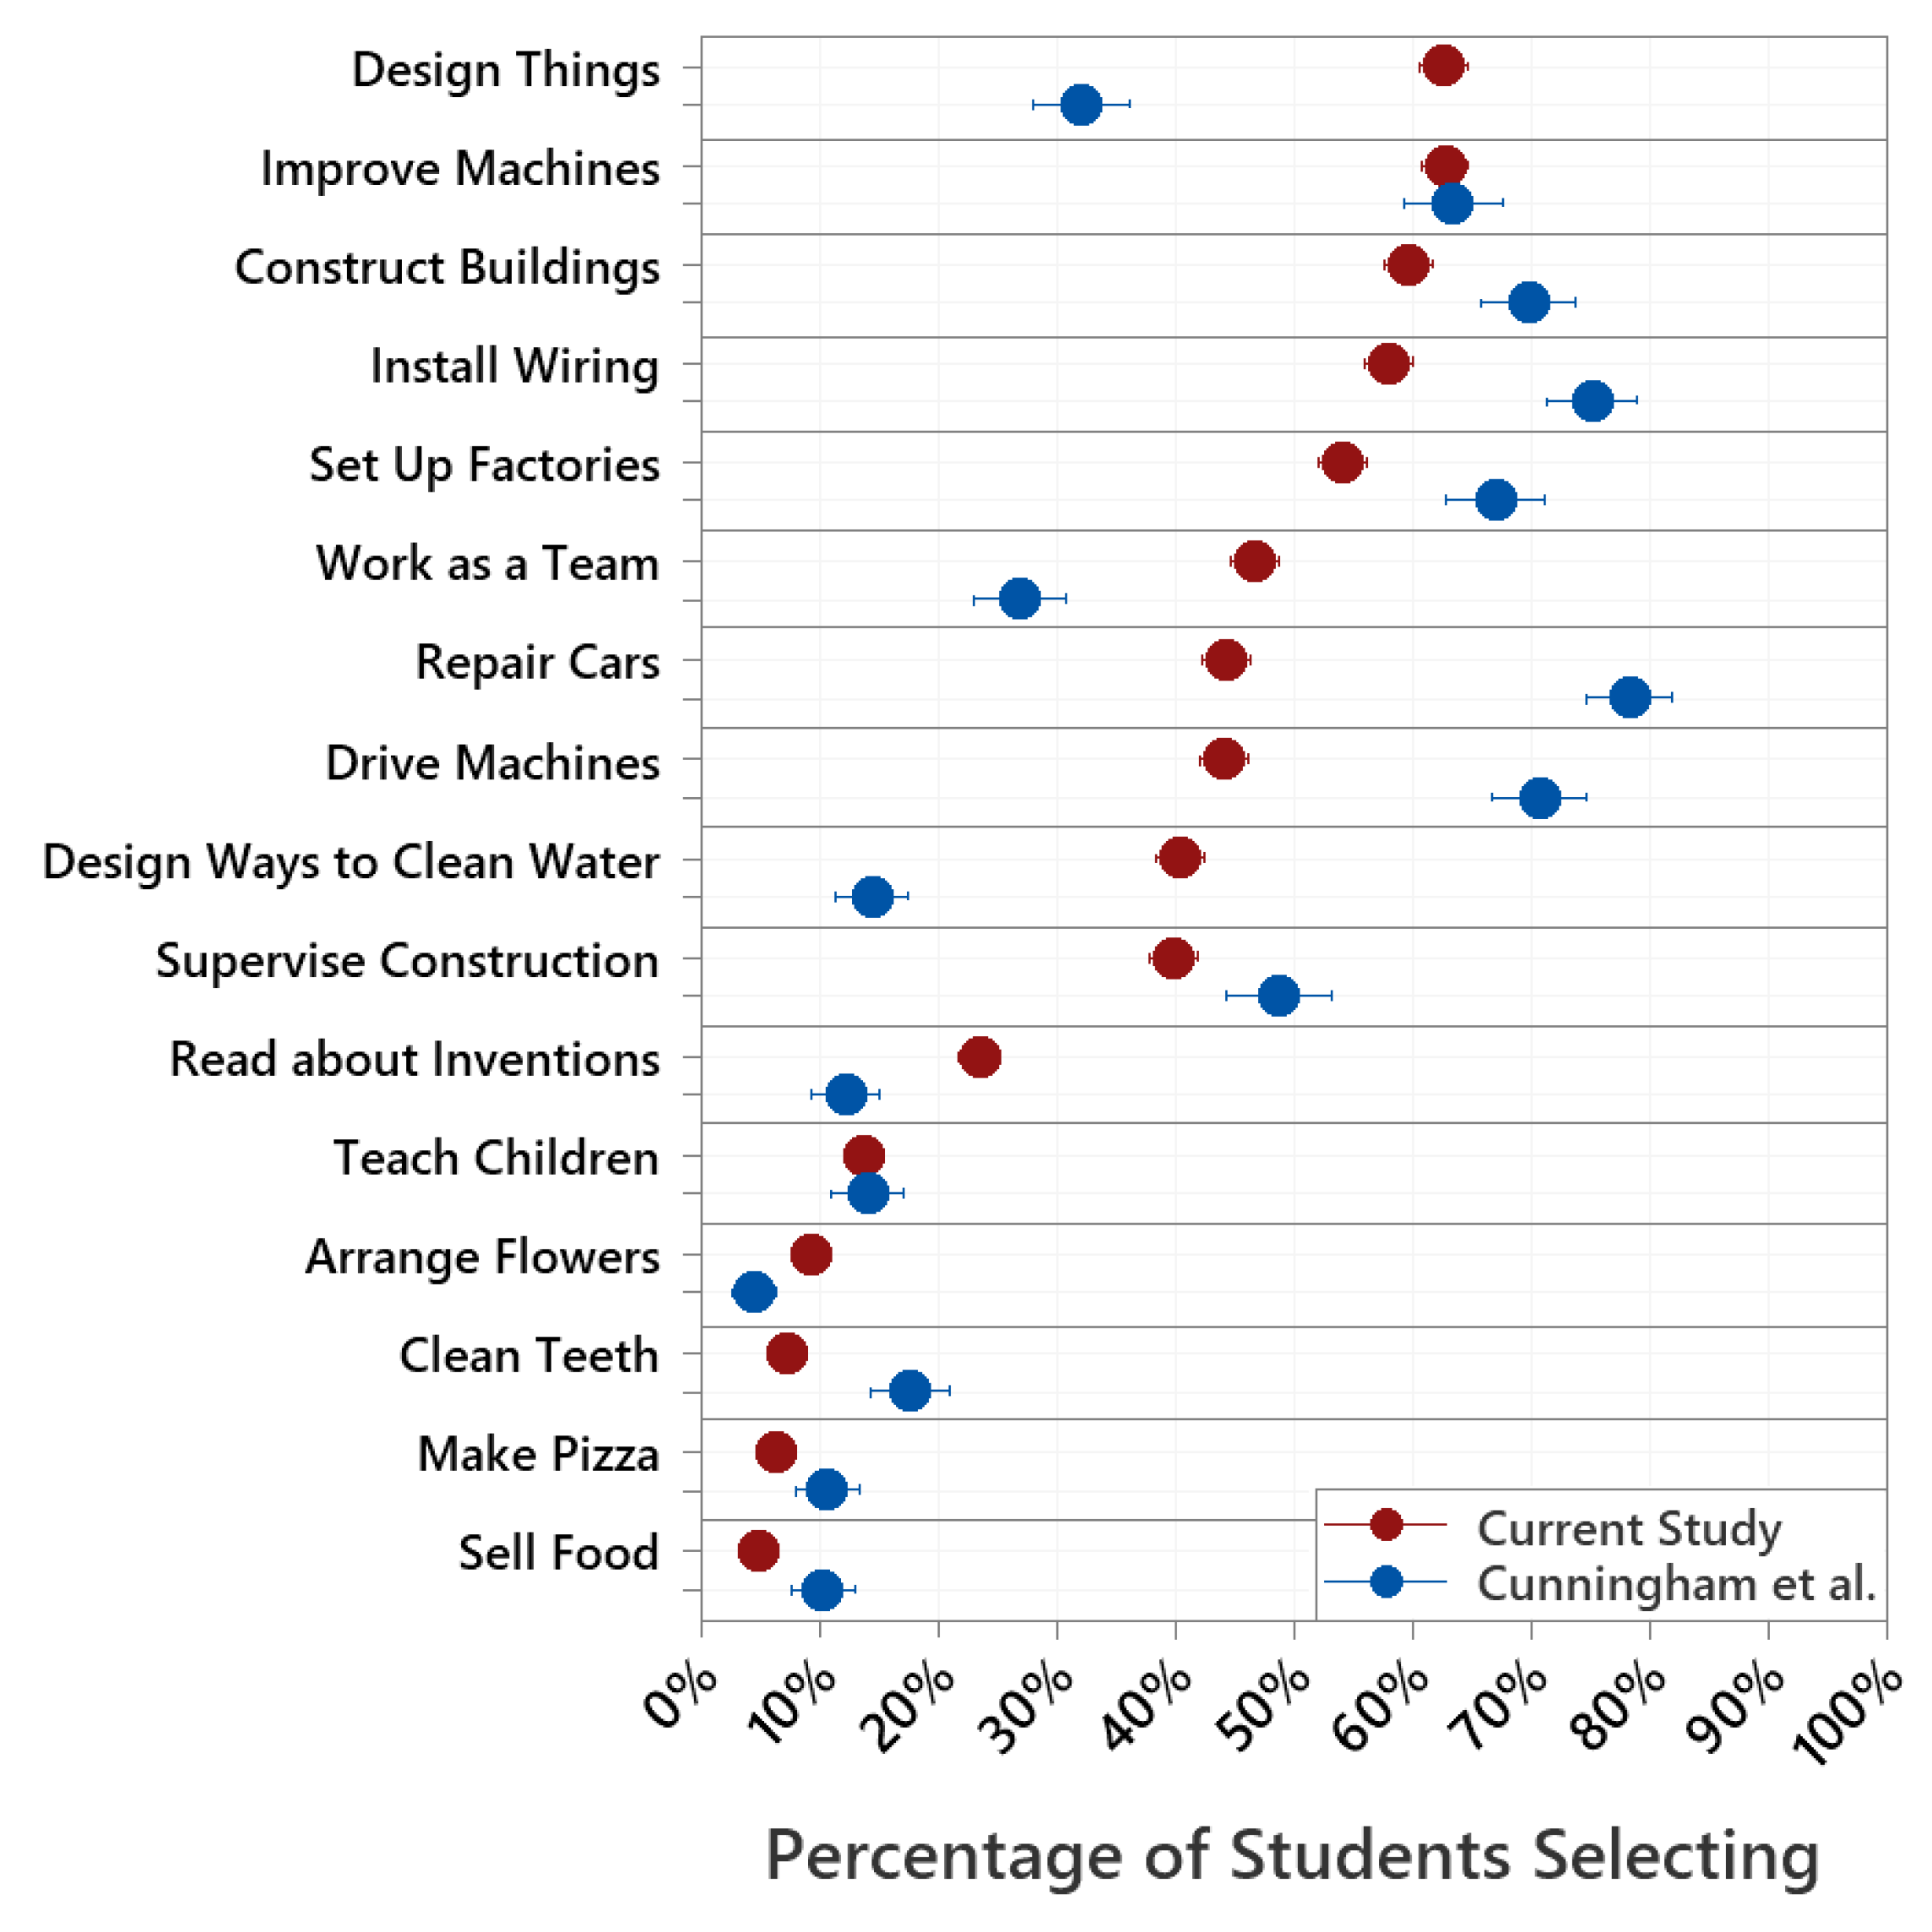
3.4. Cunningham et al. (2005) Comparison
4. Discussion
Limitations
5. Conclusions
Author Contributions
Funding
Institutional Review Board Statement
Informed Consent Statement
Data Availability Statement
Conflicts of Interest
References
- National Research Council. Successful K-12 STEM Education: Identifying Effective Approaches in Science, Technology, Engineering, and Mathematics; The National Academies Press: Washington, DC, USA, 2011. [Google Scholar] [CrossRef]
- U.S. Department of Commerce. STEM Jobs: 2017 Update; Issue Brief No. 02-17; Noonan: Washington, DC, USA, 2017. [Google Scholar]
- Chen, X. STEM Attrition: College Students’ Paths into and out of STEM Fields (NCES 2014-001); National Center for Education Statistics, Institute of Education Sciences, U.S. Department of Education: Washington, DC, USA, 2013. [Google Scholar]
- Kelly, G.; Cunningham, C.M.; Ricketts, A. Engaging in identity work through engineering practices in elementary classrooms. Linguist. Educ. 2017, 39, 48–59. [Google Scholar] [CrossRef]
- Capobianco, B.M.; Diefes-Dux, H.; Mena, I.; Weller, J.K. What is an Engineer? Implications of elementary conceptions for engineering education. J. Eng. Educ. 2011, 100, 304–328. [Google Scholar] [CrossRef]
- Knight, M.; Cunningham, C. Draw an Engineer Test (DAET): Development of a tool to investigate students’ ideas about engineers and engineering. In Proceedings of the 2004 American Society for Engineering Education Annual Conference and Exposition, Salt Lake City, UT, USA, 20–23 June 2004; Matson, E., Deloach, S., Eds.; American Society for Engineering Education: Washington, DC, USA, 2004; pp. 2500–2540. [Google Scholar]
- National Academy of Engineering. Changing the conversation: Messages for Improving Public Understanding of Engineering; National Academies Press: Washington, DC, USA, 2008. [Google Scholar]
- Miaoulis, I. K-12 engineering—The Missing Core Discipline. In Holistic Engineering Education; Grasso, D., Burkins, M.B., Eds.; Springer: New York, NY, USA, 2010; pp. 37–51. [Google Scholar]
- Osborne, R.J.; Wittrock, M.C. Learning science: A generative process. Sci. Educ. 1983, 67, 489–508. [Google Scholar] [CrossRef]
- Driver, R. Students’ conceptions and the learning of science. Int. J. Sci. Educ. 1989, 11, 481–490. [Google Scholar] [CrossRef]
- Bruner, J. The Process of Education; Harvard University Press: Cambridge, MA, USA, 1960. [Google Scholar]
- Dochy, F.J.R.C.; Alexander, P.A. Mapping prior knowledge: A framework for discussion among researchers. Eur. J. Psychol. Educ. 1995, 10, 225–242. [Google Scholar] [CrossRef]
- Wyss, V.L.; Heulskamp, D.; Siebert, C.J. Increasing middle school student interest in STEM careers with videos of scientists. Int. J. Environ. Sci. Educ. 2012, 7, 501–522. [Google Scholar]
- Lent, R.W.; Brown, S.D.; Gackett, G. Toward a unifying social cognitive theory of career and academic interest, choice, and performance. J. Vocat. Behav. 1994, 45, 79–122. [Google Scholar] [CrossRef]
- Lent, R.W.; Brown, S.D. Integrating person and situation perspectives on work satisfaction: A social-cognitive view. J. Vocat. Behav. 2006, 69, 236–247. [Google Scholar] [CrossRef]
- Maiorca, C.; Roberts, T.; Jackson, C.; Bush, S.B.; Delaney, A.; Mohr-Schroeder, M.J.; Yao, S. Informal learning environments and impact on interest in STEM careers. Int. J. Sci. Math. Educ. 2020, 19, 45–64. [Google Scholar] [CrossRef]
- Park, M.-H.; Dimitrov, D.M.; Patterson, L.G.; Park, D.-Y. Early childhood teachers’ beliefs about readiness for teaching science, technology, engineering, and mathematics. J. Early Child. Res. 2017, 15, 275–291. [Google Scholar] [CrossRef]
- DeJarnette, N.K. America’s children: Providing early exposure to STEM (Science, Technology, Engineering and Math) initiatives. Education 2012, 133, 77–84. [Google Scholar]
- Swift, T.M.; Watkins, S.E. An engineering primer for outreach to K-4 education. J. STEM Educ. 2004, 5, 67–76. [Google Scholar]
- After-School Alliance. Full STEM Ahead: Afterschool Programs Step up as Key Partners in STEM Education. 2015. Available online: http://www.afterschoolalliance.org/aa3pm/STEM.pdf (accessed on 1 July 2021).
- Blank, R.K. Science Instructional Time Is Declining in Elementary Schools: What Are the Implications for Student Achievement and Closing the Gap? Sci. Educ. 2013, 97, 830–847. [Google Scholar] [CrossRef]
- Pell, T.; Jarvis, T. Developing attitude to science scales for use with children of ages from five to eleven years. Int. J. Sci. Educ. 2001, 23, 847–862. [Google Scholar] [CrossRef]
- Learning in Informal and Formal Environments (LIFE) Center. 2005. Available online: http://www.life-slc.org/about/citationdetails.html (accessed on 1 July 2021).
- Dorie, B.L.; Jones, T.R.; Pollock, M.C.; Cardella, M.E. Parents as Critical Influence: Insights from Five Different Studies. School of Engineering Education Graduate Student Series. Available online: http://docs.lib.purdue.edu/enegs/55 (accessed on 1 July 2021).
- Hammack, R.; Ivey, T.A.; Utley, J.; High, K.A. Effect of an Engineering Camp on Students’ Perceptions of Engineering and Technology. J. Pre-Coll. Eng. Educ. Res. 2015, 5, 10–21. [Google Scholar] [CrossRef] [Green Version]
- Fralick, B.; Kearn, J.; Thompson, S.; Lyons, J. How Middle Schoolers Draw Engineers and Scientists. J. Sci. Educ. Technol. 2008, 18, 60–73. [Google Scholar] [CrossRef]
- Gibbons, S.J.; Hirsch, L.S.; Limmel, H.; Rockland, R.; Bloom, J. Middle school Students’ Attitudes to and Knowledge about Engineering. In Proceedings of the 2004 ICEE Conference, Gainesville, FL, USA, 16–21 October 2004. [Google Scholar]
- Carr, R.L.; Diefes-Dux, H.A. Change in Elementary Student Conceptions of Engineering Following an Intervention as Seen from the Draw-an-Engineer Test. In Proceedings of the 2012 ASEE Annual Conference & Exposition Proceedings, San Antonio, TX, USA, 10–13 June 2012. [Google Scholar]
- Cunningham, C.; Lachapelle, C.; Lindgren-Streicher, A. Assessing Elementary School Students’ Conceptions of Engineering and Technology. In Proceedings of the 2005 Annual Conference Proceedings, Portland, Oregon, 12–15 June 2005. [Google Scholar]
- Lachapelle, C.P.; Phadnis, P.; Hertel, J.; Cunningham, C.M. What Is Engineering? A Survey of Elementary Students. In Proceedings of the 2nd P-12 Engineering and Design Education Research Summit, Washington, DC, USA, 26–28 April 2012. [Google Scholar]
- Oware, E.; Capobianco, B.; Diefes-Dux, H.A. Young Childrens Perceptions of Engineers before and after a Summer Engineering Outreach Course. In Proceedings of the 2007 37th Annual Frontiers in Education Conference—Global Engineering: Knowledge without Borders, Opportunities without Passports, Milwaukee, WI, USA, 10–13 October 2007. [Google Scholar]
- Chambers, D.W. Stereotypic images of the scientist: The draw-a-scientist test. Sci. Educ. 1983, 67, 255–265. [Google Scholar] [CrossRef]
- NGSS Lead States. Next Generation Science Standards: For States, by States; The National Academies Press: Washington, DC, USA, 2013. [Google Scholar]
- Irani, J.; Pise, N.; Phatak, M. Clustering Techniques and the Similarity Measures used in Clustering: A Survey. Int. J. Comput. Appl. 2016, 134, 9–14. [Google Scholar] [CrossRef]
- Ward, J.H., Jr. Hierarchical grouping to optimize an objective function. J. Am. Stat. Assoc. 1963, 58, 236–244. [Google Scholar] [CrossRef]
- Tukey, J.W. Comparing Individual Means in the Analysis of Variance. Biometrics 1949, 5, 99–114. [Google Scholar] [CrossRef]
- Bratchell, N. Cluster analysis. Chemom. Intell. Lab. Syst. 1989, 6, 106–125. [Google Scholar] [CrossRef]
- Piaget, J.; Inhelder, B. The Psychology of the Child; Basic Books: New York, NY, USA, 1972. [Google Scholar]


| School System | First Grade | Second Grade | Third Grade | Total | Male | Female |
|---|---|---|---|---|---|---|
| City 1 | 9 | 7 | 41 | 57 | 32 | 25 |
| City 2 | 38 | 29 | 27 | 94 | 53 | 41 |
| City 3 | 44 | 32 | 14 | 90 | 40 | 50 |
| City 4 | 22 | 44 | 60 | 126 | 47 | 79 |
| City 5 | 27 | 19 | 0 | 46 | 18 | 28 |
| County 1 | 56 | 51 | 25 | 132 | 64 | 68 |
| County 2 | 13 | 60 | 42 | 115 | 56 | 59 |
| County 3 | 74 | 47 | 53 | 174 | 94 | 80 |
| County 4 | 132 | 146 | 131 | 409 | 218 | 191 |
| County 5 | 42 | 20 | 45 | 107 | 58 | 49 |
| County 6 | 50 | 71 | 73 | 194 | 88 | 106 |
| County 7 | 6 | 18 | 25 | 49 | 25 | 24 |
| County 8 | 23 | 40 | 15 | 78 | 38 | 40 |
| County 9 | 6 | 31 | 23 | 60 | 29 | 31 |
| County 10 | 30 | 36 | 14 | 80 | 40 | 40 |
| Total | 572 | 651 | 588 | 1811 | 900 | 911 |
| School System | Percentage of Free/Reduced Lunch a | Asian b | Black/African American b | Hawaiian/Pacific Islander b | Hispanic b | Native American b | Other b | White/Caucasian b |
|---|---|---|---|---|---|---|---|---|
| City 1 | 58% | 2% | 46% | 0% | 11% | 0% | 5% | 37% |
| City 2 | 32% | 1% | 9% | 0% | 3% | 1% | 2% | 84% |
| City 3 | 33% | 0% | 8% | 0% | 47% | 0% | 2% | 43% |
| City 4 | 76% | 0% | 92% | 0% | 0% | 0% | 2% | 6% |
| City 5 | 53% | 0% | 17% | 0% | 0% | 0% | 2% | 80% |
| County 1 | 53% | 1% | 0% | 0% | 8% | 0% | 1% | 90% |
| County 2 | 71% | 0% | 72% | 0% | 1% | 0% | 3% | 24% |
| County 3 | 68% | 1% | 62% | 0% | 1% | 0% | 0% | 36% |
| County 4 | 51% | 0% | 22% | 0% | 3% | 0% | 4% | 70% |
| County 5 | 78% | 0% | 2% | 0% | 5% | 4% | 0% | 90% |
| County 6 | 46% | 1% | 8% | 0% | 7% | 1% | 1% | 82% |
| County 7 | 52% | 0% | 61% | 0% | 0% | 2% | 0% | 37% |
| County 8 | 76% | 0% | 53% | 0% | 4% | 1% | 3% | 40% |
| County 9 | 65% | 0% | 98% | 0% | 0% | 2% | 0% | 0% |
| County 10 | 78% | 0% | 99% | 0% | 1% | 0% | 0% | 0% |
| Stage | Number of Clusters | Similarity Value | Distance Level | Clusters Joined | New Cluster | Number of Observations in New Cluster | |
|---|---|---|---|---|---|---|---|
| 1 | 15 | 77.262 | 0.45476 | 10 | 12 | 10 | 2 |
| 2 | 14 | 76.701 | 0.46598 | 10 | 15 | 10 | 3 |
| 3 | 13 | 71.3386 | 0.57323 | 9 | 14 | 9 | 2 |
| 4 | 12 | 70.8622 | 0.58276 | 1 | 3 | 1 | 2 |
| 5 | 11 | 69.3227 | 0.61355 | 5 | 13 | 5 | 2 |
| 6 | 10 | 68.8805 | 0.62239 | 10 | 16 | 10 | 4 |
| 7 | 9 | 67.6629 | 0.64674 | 2 | 4 | 2 | 2 |
| 8 | 8 | 66.4291 | 0.67142 | 8 | 9 | 8 | 3 |
| 9 | 7 | 66.0223 | 0.67955 | 5 | 11 | 5 | 3 |
| 10 | 6 | 64.5481 | 0.70904 | 6 | 10 | 6 | 5 |
| 11 | 5 | 61.6694 | 0.76661 | 7 | 8 | 7 | 4 |
| 12 | 4 | 55.2173 | 0.89565 | 2 | 5 | 2 | 5 |
| 13 | 3 | 54.7913 | 0.90417 | 1 | 7 | 1 | 6 |
| 14 | 2 | 20.8068 | 1.58386 | 1 | 2 | 1 | 11 |
| 15 | 1 | −14.7894 | 2.29579 | 1 | 6 | 1 | 16 |
| Case | First Grade | Second Grade | Third Grade |
|---|---|---|---|
| Install wiring | Engineering B | Engineering B | Engineering B |
| Design things | Engineering A | Engineering A | Engineering A |
| Construct buildings | Engineering B | Engineering B | Engineering B |
| Improve machines | Engineering A | Engineering A | Engineering A |
| Set up factories | Engineering A | Engineering A | Engineering A |
| Repair cars | Engineering B | Engineering B | Engineering B |
| Drive machines | Engineering B | Engineering B | Engineering B |
| Work as a team | Engineering A | Engineering A | Engineering A |
| Supervise construction | Engineering B | Engineering B | Engineering B |
| Design ways to clean water | Engineering A | Engineering A | Not engineering |
| Read about inventions | Engineering A | Engineering A | Not engineering |
| Teach children | Not engineering | Not engineering | Not engineering |
| Arrange flowers | Not engineering | Not engineering | Not engineering |
| Clean teeth | Not engineering | Not engineering | Not engineering |
| Make pizza | Not engineering | Not engineering | Not engineering |
| Sell food | Not engineering | Not engineering | Not engineering |
Publisher’s Note: MDPI stays neutral with regard to jurisdictional claims in published maps and institutional affiliations. |
© 2022 by the authors. Licensee MDPI, Basel, Switzerland. This article is an open access article distributed under the terms and conditions of the Creative Commons Attribution (CC BY) license (https://creativecommons.org/licenses/by/4.0/).
Share and Cite
Lampley, S.A.; Dyess, S.R.; Benfield, M.P.J.; Davis, A.M.; Gholston, S.E.; Dillihunt, M.L.; Turner, M.W. Understanding the Conceptions of Engineering in Early Elementary Students. Educ. Sci. 2022, 12, 43. https://0-doi-org.brum.beds.ac.uk/10.3390/educsci12010043
Lampley SA, Dyess SR, Benfield MPJ, Davis AM, Gholston SE, Dillihunt ML, Turner MW. Understanding the Conceptions of Engineering in Early Elementary Students. Education Sciences. 2022; 12(1):43. https://0-doi-org.brum.beds.ac.uk/10.3390/educsci12010043
Chicago/Turabian StyleLampley, Sandra A., Sarah Roller Dyess, Michael P. J. Benfield, Andrew M. Davis, Sampson E. Gholston, Monica L. Dillihunt, and Matthew W. Turner. 2022. "Understanding the Conceptions of Engineering in Early Elementary Students" Education Sciences 12, no. 1: 43. https://0-doi-org.brum.beds.ac.uk/10.3390/educsci12010043