Article

Assessment of Actual Workload and Student Performance in the Agricultural Engineering Final Degree Project in a Spanish Higher Education Context

by
Gregorio Egea
1,*,
Antonio Rodríguez-Lizana
1,
Luis Pérez-Urrestarazu
1,
Manuel Pérez-Ruiz
1,
Pilar Rallo
2 and
María Paz Suárez
2
1
Area of Agroforestry Engineering, School of Agricultural Engineering, University of Seville, Ctra. Utrera, km. 1, 41013 Seville, Spain
2
Department of Agronomy, School of Agricultural Engineering, University of Seville, Ctra. Utrera, km. 1, 41013 Seville, Spain
*
Author to whom correspondence should be addressed.
Submission received: 2 May 2022 / Revised: 9 June 2022 / Accepted: 17 June 2022 / Published: 19 June 2022
(This article belongs to the Special Issue Higher Education: Improvements for a Better System)

Abstract

:
Twenty years after the Bologna Declaration and a decade after Spanish university engineering degrees were updated to comply with the European Credit Transfer System (ECTS), there is still uncertainty on the degree of adaptation to the ECTS system of the final degree project (FDP) course in engineering programs, especially in terms of the workloads allocated to students. The inherent characteristics of the FDP course, with all the learning activities of an unstructured nature, make the real student workload as well as that of the FDP teachers very uncertain. This study addresses this issue by (1) identifying the nature of the unstructured student learning activities related to the FDP course, (2) measuring the time spent by students in the different FDP learning activities throughout the course, and (3) measuring the workload of FDP teachers. A user-friendly smartphone application was configured so that students and teachers in the agricultural engineering degree program at the University of Seville registered the time spent daily on each of the identified FDP learning (students) and supervising (instructors) activities. The results showed that the reported FDP workloads by students who passed the FDP course in either of the two exam periods of the academic year were not significantly higher than the nominal ECTS credit hours stipulated for the FDP course. The FDP teachers reported notably higher workloads than those stipulated by the university regulations. No significant correlation was found between student workload and FDP scores.

1. Introduction

The Bologna Declaration (19 June 1999) motivated the implementation of the European Higher Education Area (EHEA), which led to the transformation of the curricula of the university degrees. In Spain, the transformation of the curricula was materialized through the Royal Decree (RD) 1393/2007 of 29 October 2007 and its successive updates. One of the major regulatory innovations derived from the implementation of RD 1393/2007 in official university education is the obligation for all students to conduct a final degree project (FDP) to obtain a bachelor’s degree. The FDP is a course that is normally scheduled to be taken in the last semester of the program and that allows students to use and apply the knowledge acquired during the previous years of intensive study in multiple ways [1], e.g., developing particular skills and the ability to engage in various types of thinking [2]. The FDPs have meant an important adaptation effort for the degrees where students were not previously required to perform work of similar nature [3], as opposed to former Spanish engineering degrees, where students had to complete an FDP, normally during the last year of studies and, often, once they had passed the rest of the degree courses [4].
The university degree system established with RD 1393/2007 also incorporated other new features with respect to the previous regulatory framework, such as an improved control of the workload and time students need to complete the different courses and continuous assessment to evaluate the acquisition of competencies by students [5]. In the particular case of the FDP course, it must be taken into account that there are some differences with respect to the rest of the degree courses, such as the absence of scheduled lectures, the existence of one or two academic supervisors who guide the student during the completion of the FDP, and the final assessment, which is done by an evaluation commission formed by university teachers, who are often unaware of the learning process undertaken by the student during the completion of the FDP [4]. These characteristics of the FDP course have promoted the development of technological and methodological tools to facilitate both the management of all the information required by the course [6] and the monitoring [4] and evaluation of the FDP [7,8].
In Spanish engineering schools, which already had a final degree project implemented in the engineering degrees prior to EHEA, the objectives, structure, and contents of the current FDP course have probably been assimilated from the former FDP of the extinct engineering degrees. This fact may have implications in the real workload of the FDP course, among others, which might not meet the requirements established in RD 1393/2007 and have associated consequences, such as student overload and negative impact on learning quality and student performance [9].
Within the EHEA framework, the student workload is set through the European Credit Transfer and Accumulation System (ECTS), which is a numerical descriptive value of the total in-class and independent unstructured work required to pass a particular course. However, recent evidence has shown that the ECTS metric for characterizing student workload is questionable [10]. Souto-Iglesias and Baeza-Romero [10] observed that the variability in student workload in two faculties of two Spanish public universities could be too large for the ECTS metric to accurately characterize the workload of a particular course. Additionally, the ECTS system has been reported either to overestimate [10,11,12] or to underestimate [13,14] the actual workload of university students.
Although there are some studies in the scientific literature on the improvement of the teaching–learning process in the FDP course, mainly for non-engineering degrees [15,16,17], no works have been found on the assessment of the actual workload and time invested by engineering students to complete their FDP. Esteban-Sánchez et al. [4] designed a methodological tool based on the use of a virtual teaching platform to monitor the development of the FDP in engineering degrees, but they did not quantify the actual workload required for students to complete their FDP. Peña et al. [18] analyzed whether the academic activities comprising the FDP of building and construction engineering degrees were balanced and adapted for the acquisition of the competencies, but again, their assessment was based on the methodologies used but did not take into account the time and effort required.
In the case study of the degree in agricultural engineering at the University of Seville (Spain), the number of students who pass the course with respect to the number of students enrolled is very low in the first exam period (June). In the academic years 2016–2017 to 2018–2019, the average number of students who completed their FDP in June was, on average, 25% of the students enrolled in the FDP course. This figure is notably lower than that of the rest of the courses in the same semester, with a plausible hypothesis of such poor student performance being a lack of adequacy in the workloads required to complete the FDP with respect to those theoretically established by the ECTS system. This could also be one of the reasons for the moderate level of student satisfaction with the FDP course. In fact, the item regarding FDPs in the annual questionnaire answered by students of the degree in agricultural engineering for quality purposes showed values of 3.03 ± 1.44 (out of 5) in the 2019–2020 academic year.
Determining student workload in courses where all learning activities are of an unstructured nature (i.e., independent student work), such as the FDP course, is a challenge [10]. Despite the existing difficulties, more initiatives oriented towards the determination of the actual workload of courses belonging to EHEA institutions and degrees different from those already examined are demanded [10]. For this reason, an experimental approach aimed to determine the actual workload for students enrolled in the agricultural engineering degree at the University of Seville to complete their FDP was set up. For this purpose, a time management mobile phone application was configured so that FDP students and instructors could register daily the time spent on each of the activities leading to the completion of the FDP, from the start of the course to the FDP dissertation.

2. Materials and Methods

2.1. Context and Theoretical Underpinning

The study was carried out during the 2019–2020 academic year at the School of Agricultural Engineering (ETSIA) at the University of Seville, which implemented the degree in agricultural engineering adapted to the EHEA criteria (RD 1393/2007) in 2010. Until that date, the ETSIA had taught the extinct degree of technical agricultural engineering. The degree in agricultural engineering has two specialties with different professional attributions: (1) Farming systems, where the students acquire the ability to plan, design, and manage farms that are economically sustainable and environmentally friendly, and (2) horticulture and gardening, where the students learn to plan, design, and manage horticultural crops, parks, gardens, and sports facilities, maintaining a balance between economic profitability and environmental sustainability. The curriculum of the degree is structured in eight semesters divided into four academic years. Each semester has a teaching load of 30 ECTS, for a total of 240 ECTS. In order to complete the degree, the student must pass 198 ECTS of courses belonging to the selected specialty, 30 ECTS of optional courses, and 12 ECTS corresponding to the FDP course, which is carried out during the last semester. According to the ETSIA regulations, the students may opt for one of the following FDP modalities: (1) classic agricultural engineering projects where students must design and calculate rural/farm facilities (FDP Type A) and (2) experimental projects, where students must conduct field or laboratory experiments (FDP Type B).
For University degrees, the ECTS system has established 60 ECTS per academic year, which represents a workload to students between 1500 and 1800 h [19], that is 25–30 h per ECTS. Within this range, the University of Seville has established a nominal equivalence of 25 h of student workload per ECTS so that the FDP course of the degree in Agricultural Engineering has 300 h of nominal ECTS credit hours for students. For regular degree courses, the University of Seville established a fixed ratio of classroom activities versus independent student work of 40% vs. 60%, respectively. However, this ratio does not apply to the FDP course due to its particular nature and, therefore, the University of Seville recognizes ten hours of staff workload (equivalent to 1 ECTS) for FDP supervisors, this being reduced to half in the case of FDP co-supervision.
Due to the existing uncertainty about the actual FDP workload for both students and teachers, it is pertinent to conduct experimental initiatives that contribute to clarifying the actual workload of the FDP course for both groups in ECTS-based engineering degrees. However, obtaining reliable and high-frequency measurements of independent student work is not a simple task [20]. There are several methods reported in the literature for determining independent student workloads, as reviewed by Souto-Iglesias and Baeza Romero [10]. The surveying methods based on student interviews [21], questionnaires [22], and/or forms [23] provided to the students to be completed either at the end of a certain course or on a periodic basis during the course are considered too subjective as they rely very much on the students’ memories. The completion of detailed diaries [24] or the periodic collection of data are, in principle, more accurate surveying methods, as long as there are measures to guarantee that the entries of the diaries are updated on a regular (daily/weekly) basis. However, the number of works aimed at determining quantitative values for student workload, accounting for both in-class and independent activities, are scarce.
A frequent limitation of the studies that collect data on a periodic basis is the small fraction of the entire student population involved in the study [10]. There is also little information in the literature on how the workload is distributed among the different activities and tasks required to pass a particular course. For this reason, this initiative was set up to monitor the daily time spent by a representative sample of students enrolled in the FDP course to every in-person (e.g., tutoring sessions) and independent activity performed during the completion of the final degree project.

2.2. Participants

A total of 21 students enrolled in the agricultural engineering degree of the ETSIA (University of Seville) and in the FDP course during the 2019–2020 academic year voluntarily participated in this study. All participants were informed about the purpose of the study and the anonymous treatment of their data. Of the 21 participants, 17 (81%) were male and four (19%) were female, whereas 16 (76%) chose a Type A FDP and five (24%) chose to conduct a Type B FDP. The total number of students enrolled in the FDP course during this academic year was 95 so that the sample represented 22.1% of the total population. The students were informed by their FDP supervisors of the possibility to participate in this research study. They were also informed that they had to use a time management smartphone application (described in Section 2.3) to keep a daily record of the time devoted to any FDP activity, both scheduled activities with their supervisors (e.g., tutoring sessions) and independent work. The participants were also informed that weekly reports generated by the application should be sent to the study coordinator for their records and to ensure the students’ engagement. The participants were offered the possibility of taking a training course on efficient communication and effective presentations funded by the University of Seville through a Teaching Innovation grant (stated in the Funding section), which was transversal to the FDP course and an incentive to encourage them to participate in the study. The time invested by the participants to complete the training course was not considered as FDP workload since it is not an activity included in the FDP course program and was not carried out by all the students enrolled in the course.
A total of 16 teachers (nine females and seven males) participated in the study and were also asked to record the time spent in supervising their FDP students in both tutoring sessions and independent activities (e.g., corrections and FDP review). The teachers were also asked to use the same time management tool to register the time invested in supervising the students’ FDPs. The workload of supervising a total of 23 FDPs was registered by the participating teachers, of which 19 FDPs were performed under co-supervision and 4 under individual supervision. The mismatch between the number of students who registered their workload (21) and the number of FDPs with teachers who registered their workload (23) is due to the fact that there were two students who did not participate in the study but their FDP teachers registered their workload.

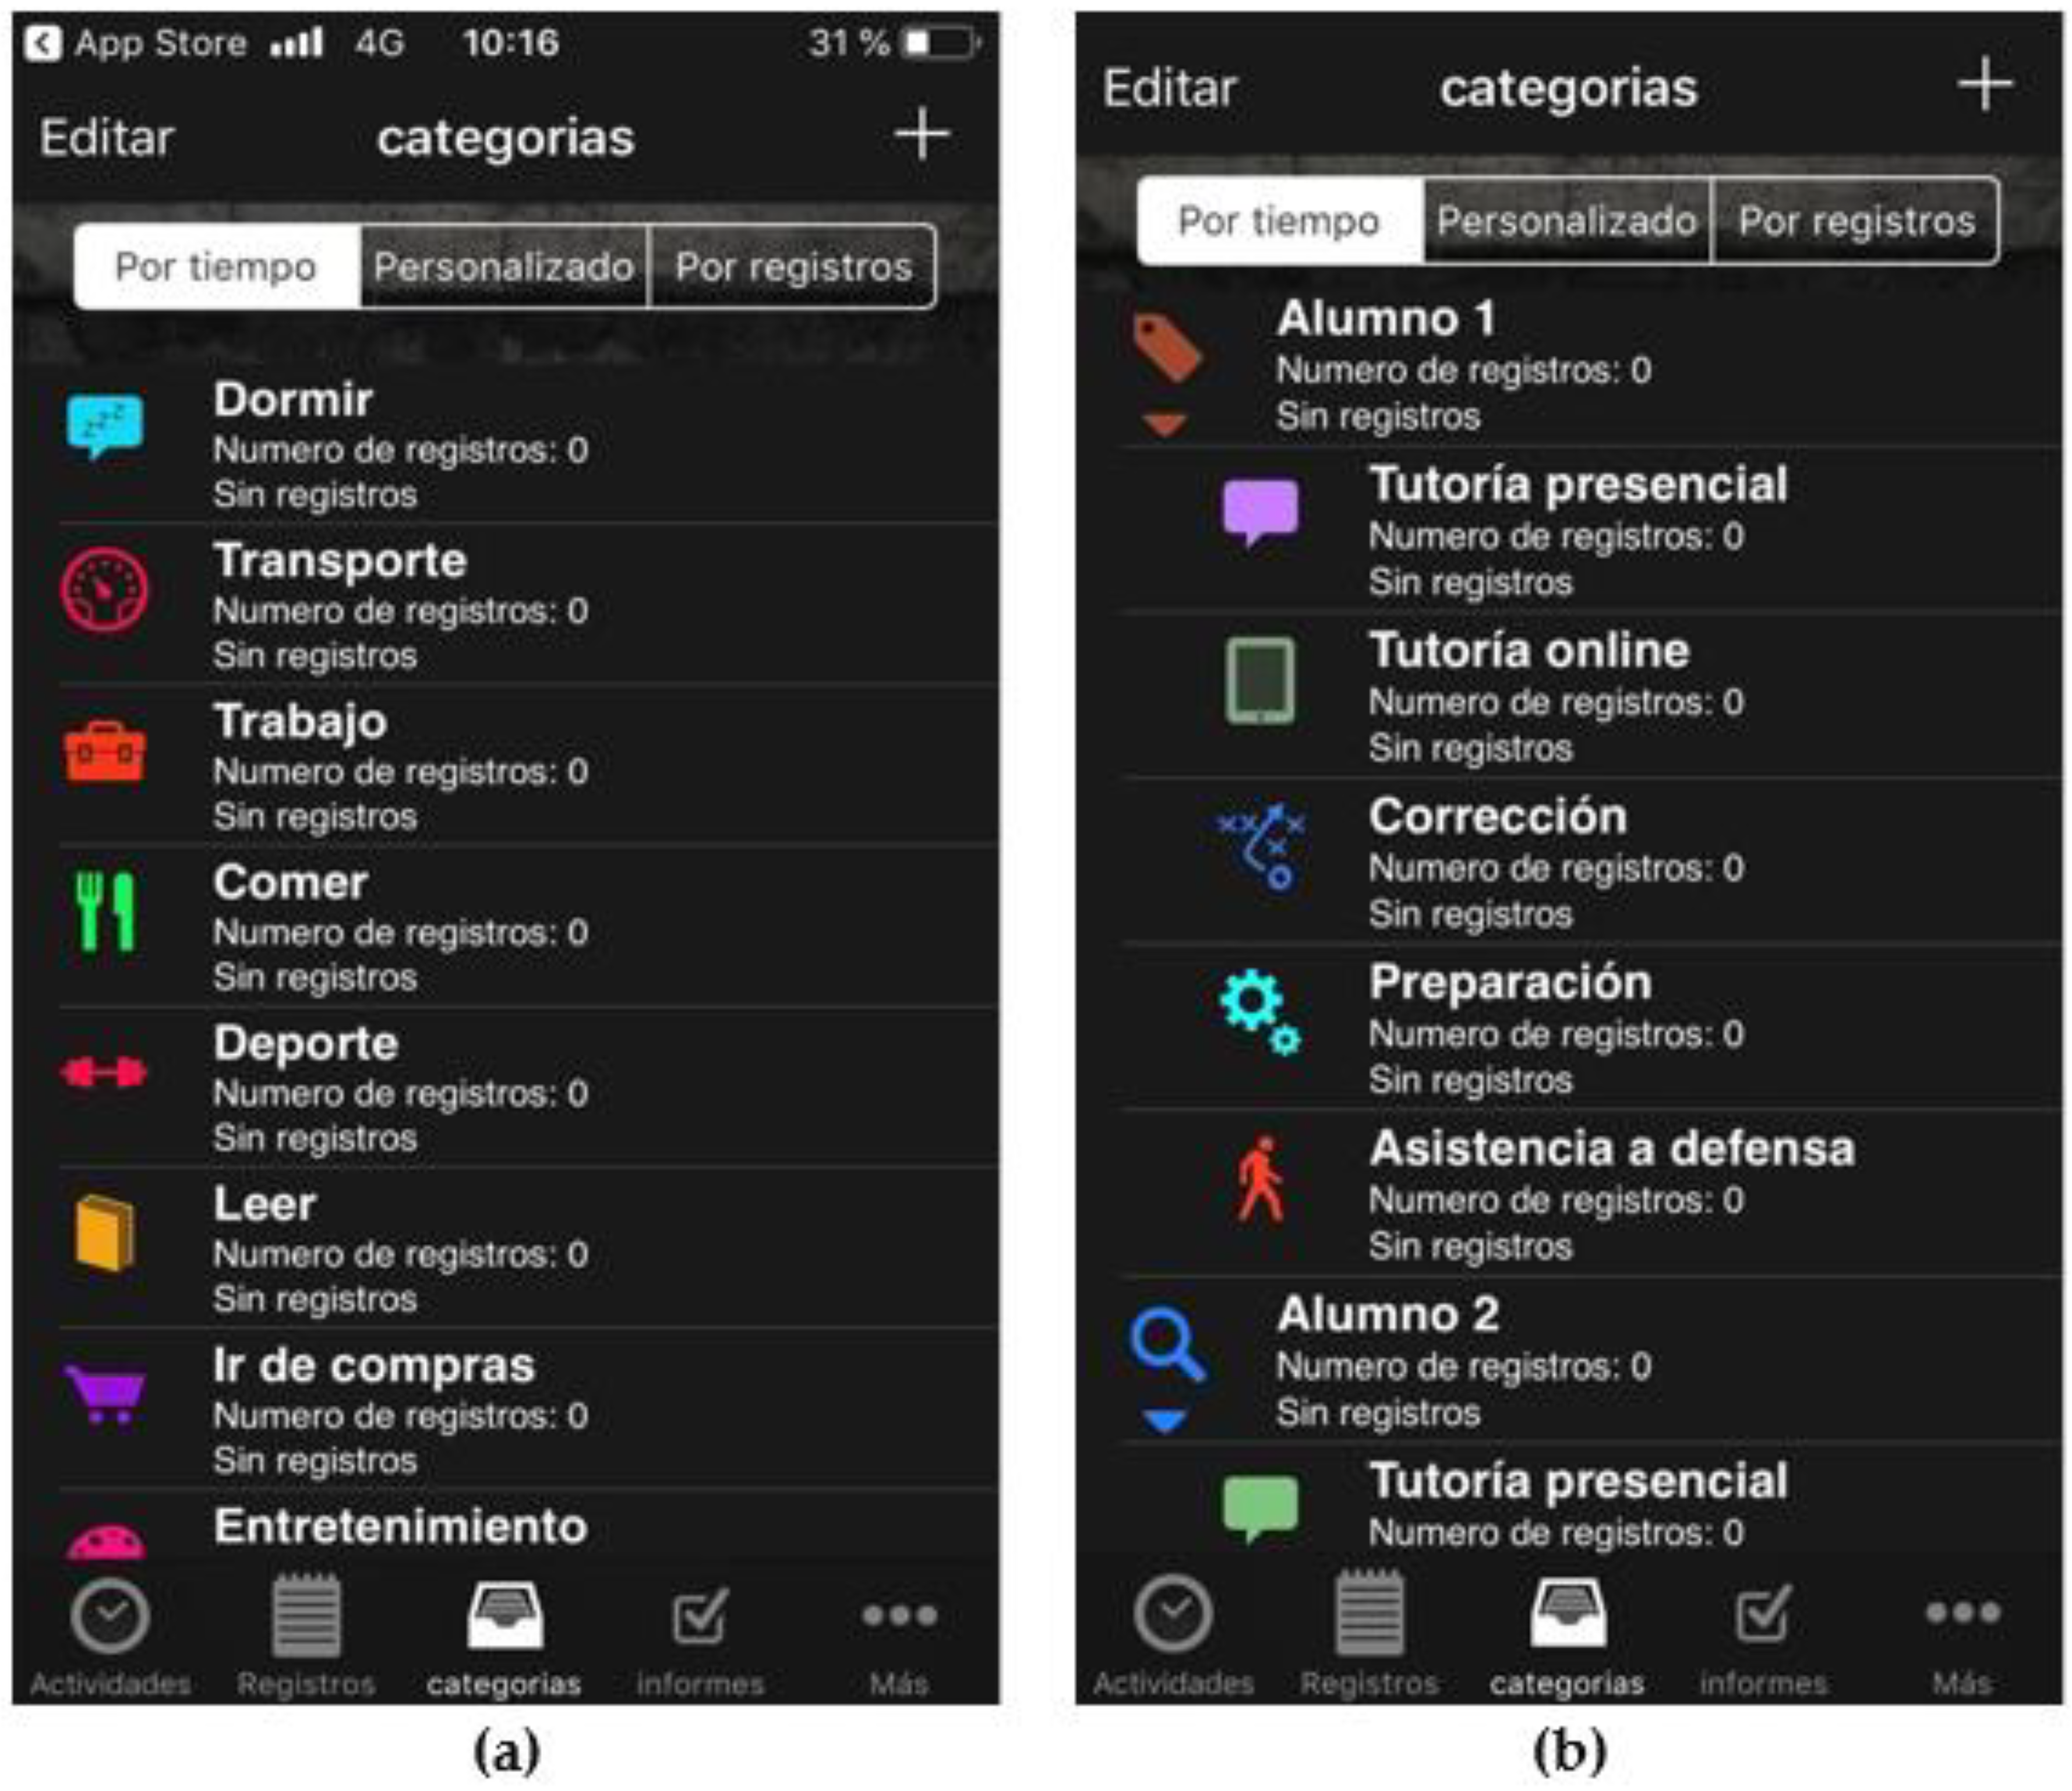
2.3. Instruments and Procedures

During the completion of the FDP course, the time dedicated by both students and teachers to any FDP activity was recorded using the smartphone application aTimeLoggerTM, available for both Android and iOS-based devices. This application is a time management tool that allows editing the type of activities to be monitored and records the time a user spends on a series of activities with just one screen tap. In this case study, the application was configured by each participant attending to his or her role in the research project. In this regard, four user profiles were defined: (1) student performing an engineering project (Type A); (2) student performing an experimental project (Type B); (3) teacher of students performing an engineering (Type A) project; and (4) teacher of students performing an experimental (Type B) project. Each user profile had a series of activities assigned and related to the type of project to be performed (students) or supervised (teachers) (Table 1).
In order to simplify the configuration of the smartphone application by the participants, the authors prepared a tutorial on the use and configuration of the application that was provided to the students and the rest of the teachers involved in this study at the beginning of the semester. On a weekly basis, the project coordinator asked all participants to send the time reports generated by the application for retaining and subsequent data processing. Figure 1 shows some screenshots of the application used in this study.

2.4. Statistical Analysis

A repeated measures analysis of variance was performed to evaluate the differences in the workload of the students and academic supervisors among the different activities defined in this research. Prior to analysis, percentage data were subjected to arcsin [(Y/100)0.5] transformation. The sphericity hypothesis was evaluated with the Mauchly W statistic [25]. Equality of means was tested with the multivariate statistics Pilai’s trace and Hotelling’s trace. To determine the degree of association between the work time spent on the different activities carried out by the students, the Spearman non-parametric correlation coefficient ( ρ ) was used. This measures the correspondence of the ranks assigned to the observations for each activity. The relationship between the grade obtained by the students in their final degree project and the work time spent was determined by means of a least-squares regression. As for the rest of the statistical analysis, robust estimators have been used in this paper because the data have heavy tails and outliers. Thus, the median is used as measure of location, and the normalized median absolute deviation as measure of dispersion [26,27].
The robust generalization of the Wilcoxon–Mann–Whitney test proposed by Mee [28] was used to compare the differences in the population medians of both the scores obtained by the students and the FDP workload as a function of the exam period, i.e., June or September exam (α = 0.05). Normality was tested using the Shapiro–Wilk test. Since the FDP subject of the agricultural engineering degree has a nominal workload of about 300 h for students, a hypothesis test was conducted to determine whether the actual student workload was higher. The null hypothesis was that the time spent is equal to or less than 300 h. Since the distribution of the data was highly skewed, the confidence interval for the population median was determined [29,30].
Finally, a robust Kruskal–Wallis test [31] was used to make a comparison between the individual work time spent by FDP teachers in engineering (Type A) (one teacher vs. two teachers) and experimental (Type B) (two teachers) modalities. Since the derivation of Rust and Fligner (1984) is based on the assumption that ties among the observations occur with probability zero, the Brunner–Dette–Munk test [32] was used to compare scores in engineering (Type A) (one teacher vs. two teachers) and experimental (Type B) (two teachers) FDPs. Analyses were performed with IBM SPSS Statistics 25 and R software [33].

3. Results

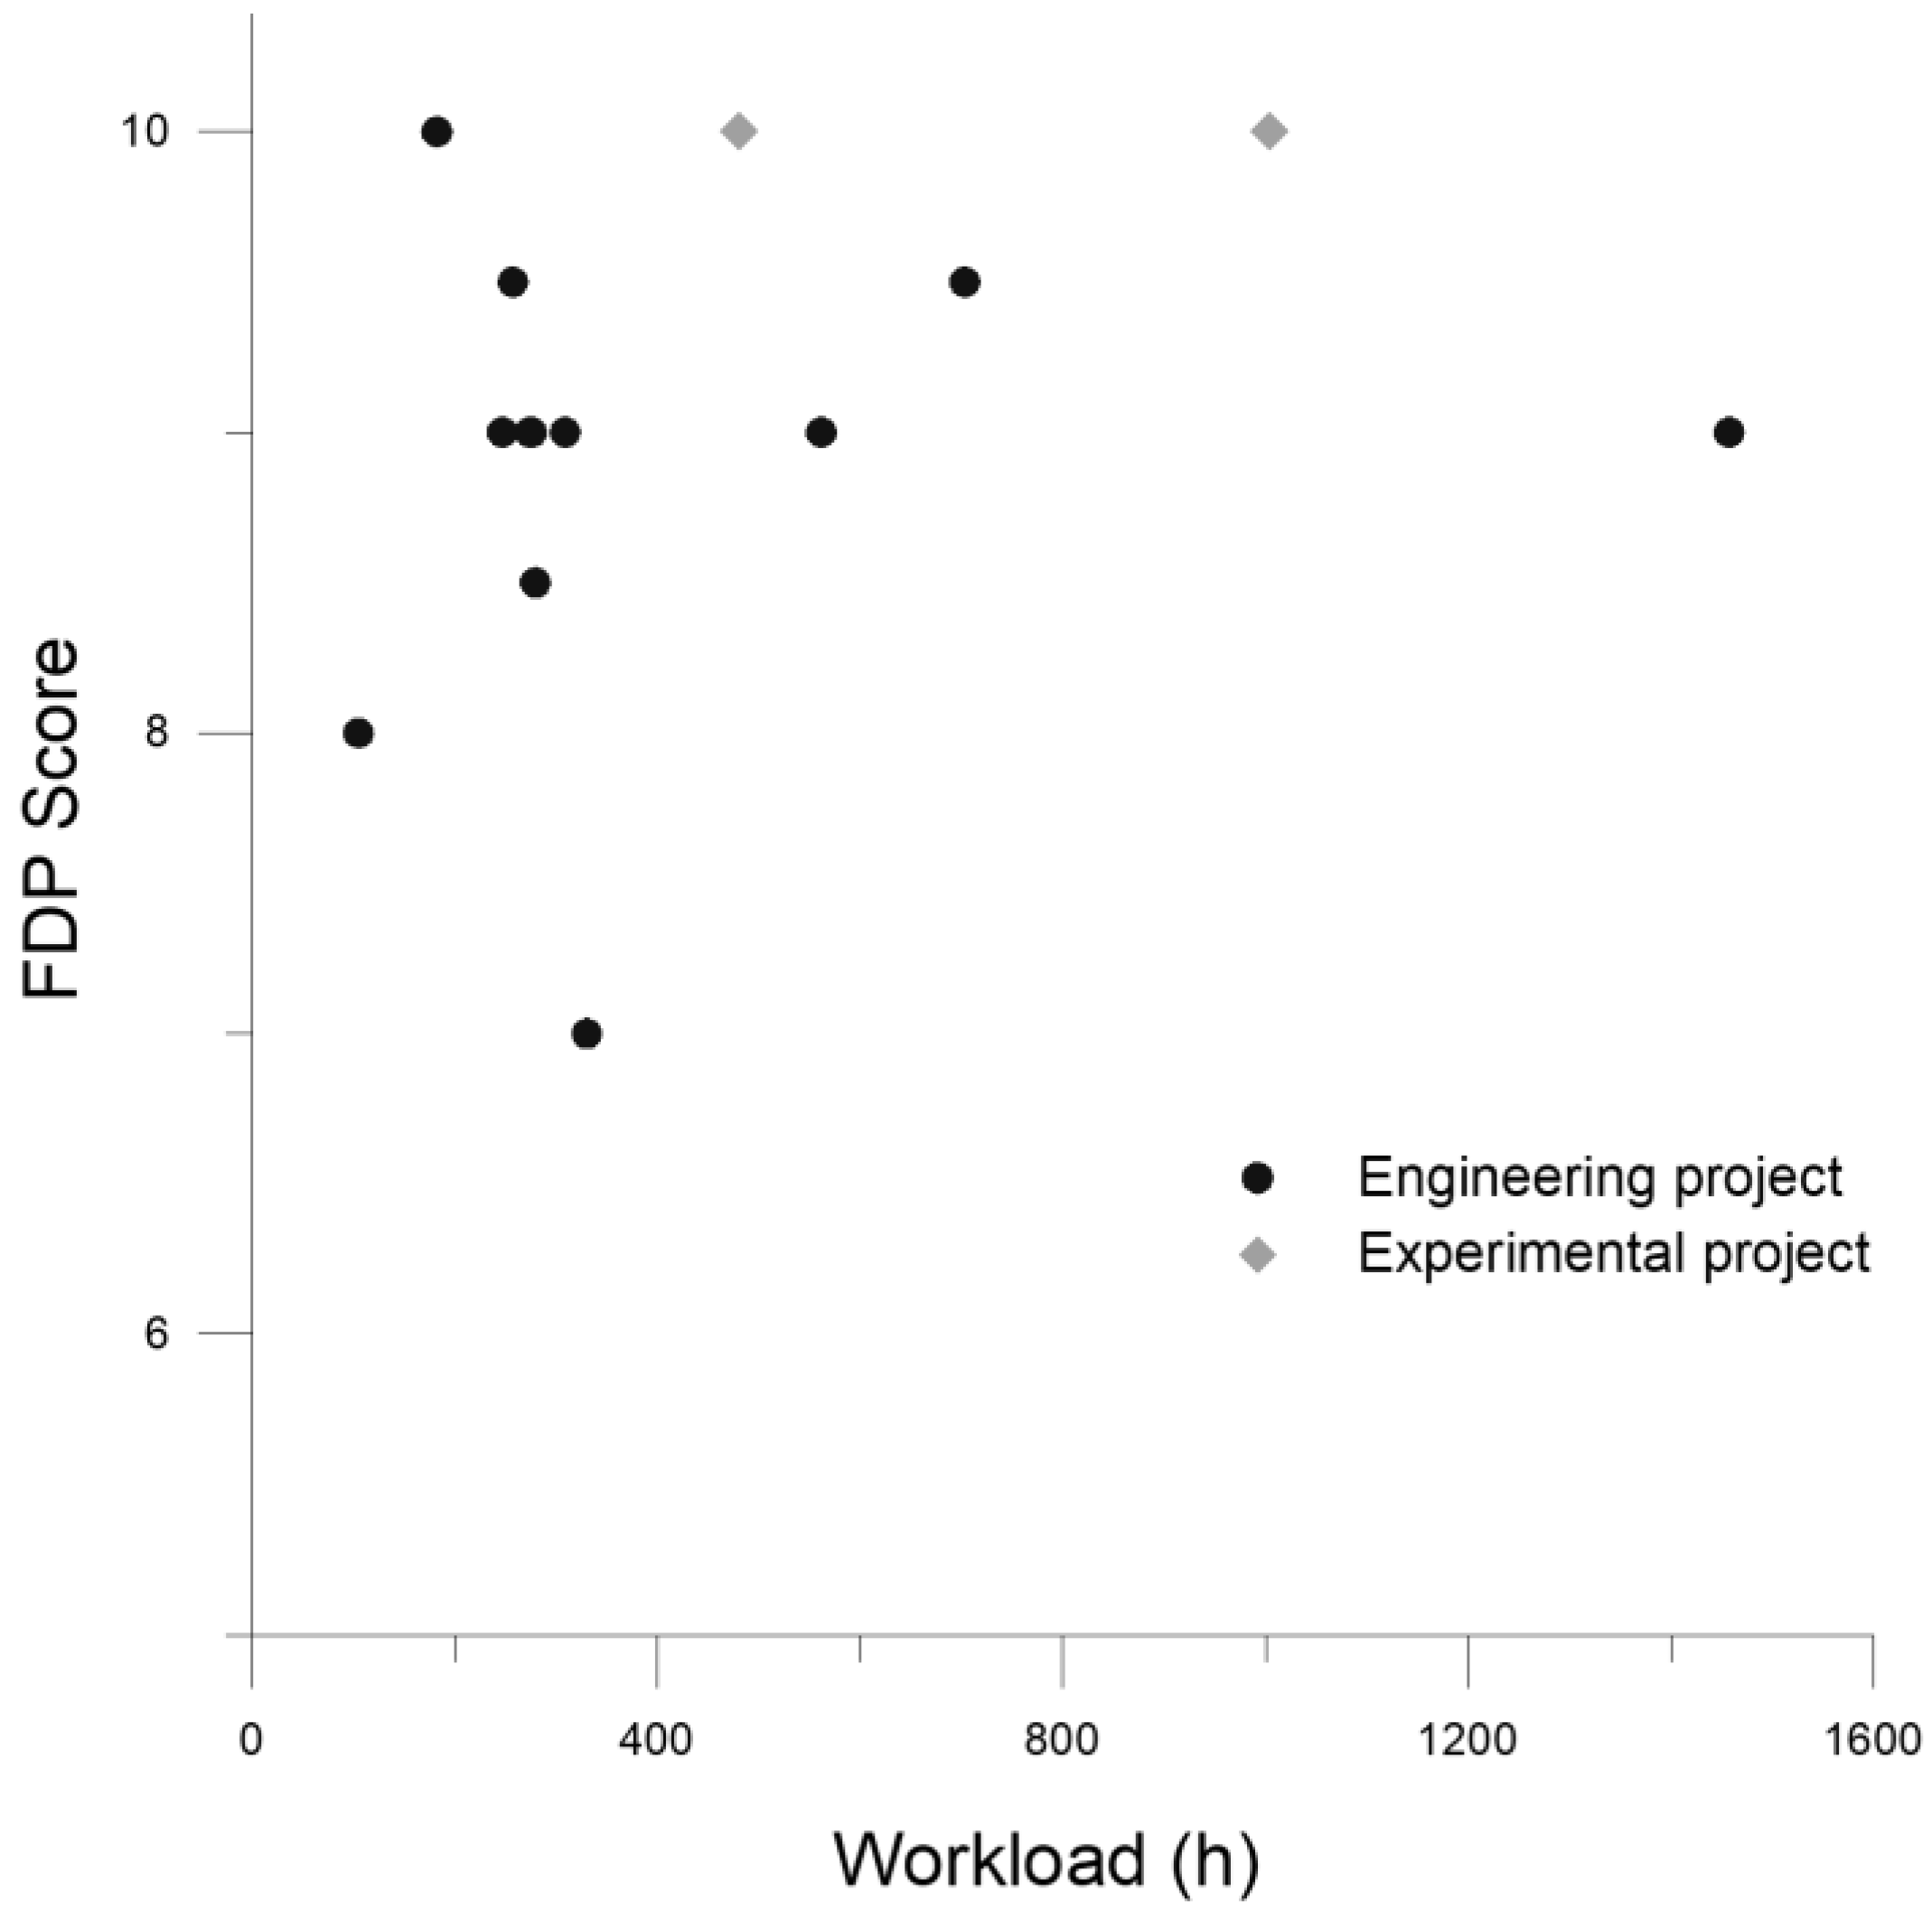
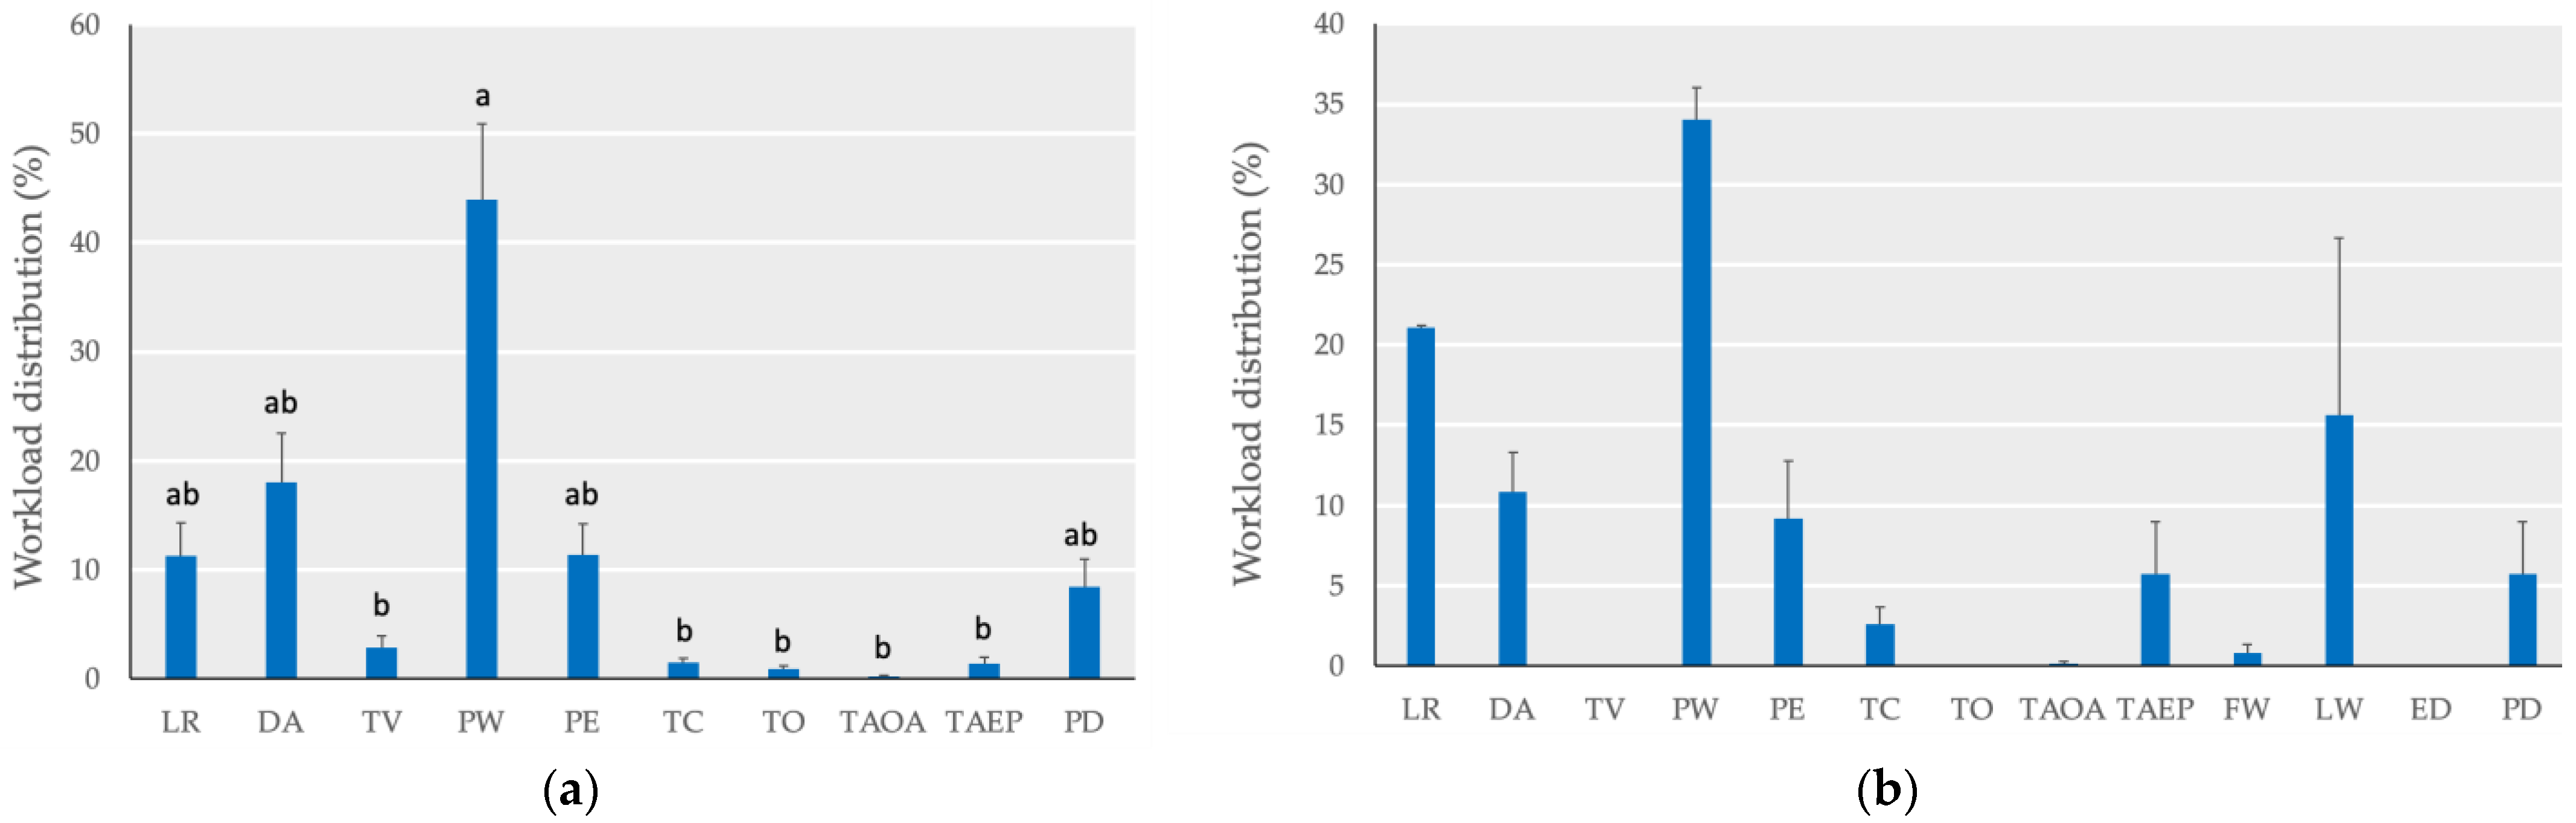
3.1. Students’ FDP Workload

Of the total number of students participating in the study (21), 76% (16) chose to perform a Type A FDP (engineering project) and 24% (5) a Type B FDP (experimental project) (Table 2). Of the students who opted for the Type A modality, 25% (4) were able to defend their FDP in the first exam period (June 2020), 50% (8) in the second exam period (September), and the remaining 25% (4) failed to pass the FDP course within the 2019–2020 academic year. In the case of students who opted for the Type B FDP modality, none of the students were able to pass the course in the first exam period, 40% (2) in the September exam period, and 60% (3) failed to pass the FDP course within the 2019–2020 academic year. Globally, 19% of the students passed the FDP in the first exam period, 48% in the second exam period, and 33% did not pass the FDP course in the 2019–2020 academic year. The latter did not fail the FDP dissertation, but they did not submit the FDP for its evaluation by the committee and subsequent defense. The reason why none of the students performing the Type B FDP passed the course in the first exam period (June) and 60% were not able to pass the FDP course during the 2019–2020 academic year was most likely caused by the home lockdown imposed by the COVID-19 pandemic during the second semester of the academic year, which could affect the correct development of the experiments.
The observed differences in the total workload to complete the FDP course, expressed in hours, between the students who completed the FDP in the first exam period and those who completed it in the second exam period are remarkable (Table 3). The four students who finished the FDP in June (engineering projects) reported a median workload of 214.5 h, while those who finished the FDP in September reported a median workload of 319 h (engineering projects) and 742 h (experimental projects). To determine whether or not the exam period (June vs. September) had a statistical effect on the students’ scores and workloads (only for Type A FDPs), the robust generalization of the Wilcoxon–Mann–Whitney test proposed by Mee [28] was used. This test calculates the probability that a randomly sampled observation from the first group is less than a randomly sampled observation from the second. With respect to the workload, it can be stated that the medians differ (p < 0.05) between the first and second exam periods in Type A FDPs. Comparing these results with the nominal FDP workload for students enrolled in the FDP course (12 ECTS = 300 h), it is observed that the students who passed the FDP course in June reported a median workload of 71% of the nominal FDP workload, while those who passed it in September reported 106% (Type A) and 247% (Type B) of the nominal ECTS credit hours established for this course. Regarding the students who did not pass the FDP course during the academic year, it can be observed that the reported workloads were less than 300 h irrespective of the FDP modality (99.0 h and 81.2 h in Type A and Type B FDPs, respectively).
The workload reported by the two students who performed a Type B FDP and passed the course in the second exam period (September) was notably higher than the nominal ECTS workload. However, these results are not meaningful due to the small size of this subgroup and should be treated with caution and as merely a suspicion of student overload when performing experimental FDPs.
In order to answer the question of whether or not the students’ workloads exceed those theoretically established by the ECTS system, the 95% confidence interval (CI) of the median workload (h) of Type A FDP students was calculated. Since the CI was [266–376], the null hypothesis that the median student workload is less than or equal to 300 h cannot be rejected. The same conclusions can be drawn when both subgroups (Type A and Type B FDPs) are analyzed jointly, obtaining a CI of [256–569] that means the null hypothesis (workloads ≤ 300 h) cannot be rejected.
Remarkably, the scores obtained by the students who performed a Type A FDP project were not significantly affected by the period in which they were examined according to the Wilcoxon–Mann–Whitney test (p > 0.05), despite the large differences observed in the workloads reported by the students to complete the FDP in both exam periods. The two students who performed a Type B FDP project and passed it in September obtained the maximum grade (10). Although the size of the Type B FDP subgroup is too small to draw meaningful conclusions, the results obtained in September seem to point out a tendency to obtain higher scores in Type B projects. Overall, it is noteworthy that there is no correlation between the score obtained and the workloads reported by the students in their FDPs (p = 0.71) (Figure 2).
Regarding the workload distribution of Type A FDPs, significant differences are observed (p = 0.002) among the different activities leading to the FDP completion (Figure 3a). The students who performed Type A FDPs spent most of the time on project writing (44%), followed by data analysis (18%), literature review (11%), project editing (11%), and project defense (8%) (Figure 3a). Students who performed a Type B FDP spent slightly less time in project writing (34%) than the students who performed a Type A FDP but devoted more time to literature review (21%) and laboratory work (16%) (Figure 3b). In both cases, the time invested in preparing the FDP defense was similar (6–8%).
It is noteworthy that, although the results are not significantly different, project writing takes, on average, between two and three times longer than data analysis in both types of FDP, which might be explained by the engineering background of the work, in which students mistakenly consider calculations and infrastructure design as project writing instead of data analysis. Regarding the relation between the time spent and the different FDP activities, no significant correlations were found between them, except for LR and DA activities (rho = 0.79, p = 0.004) in Type A FDPs.

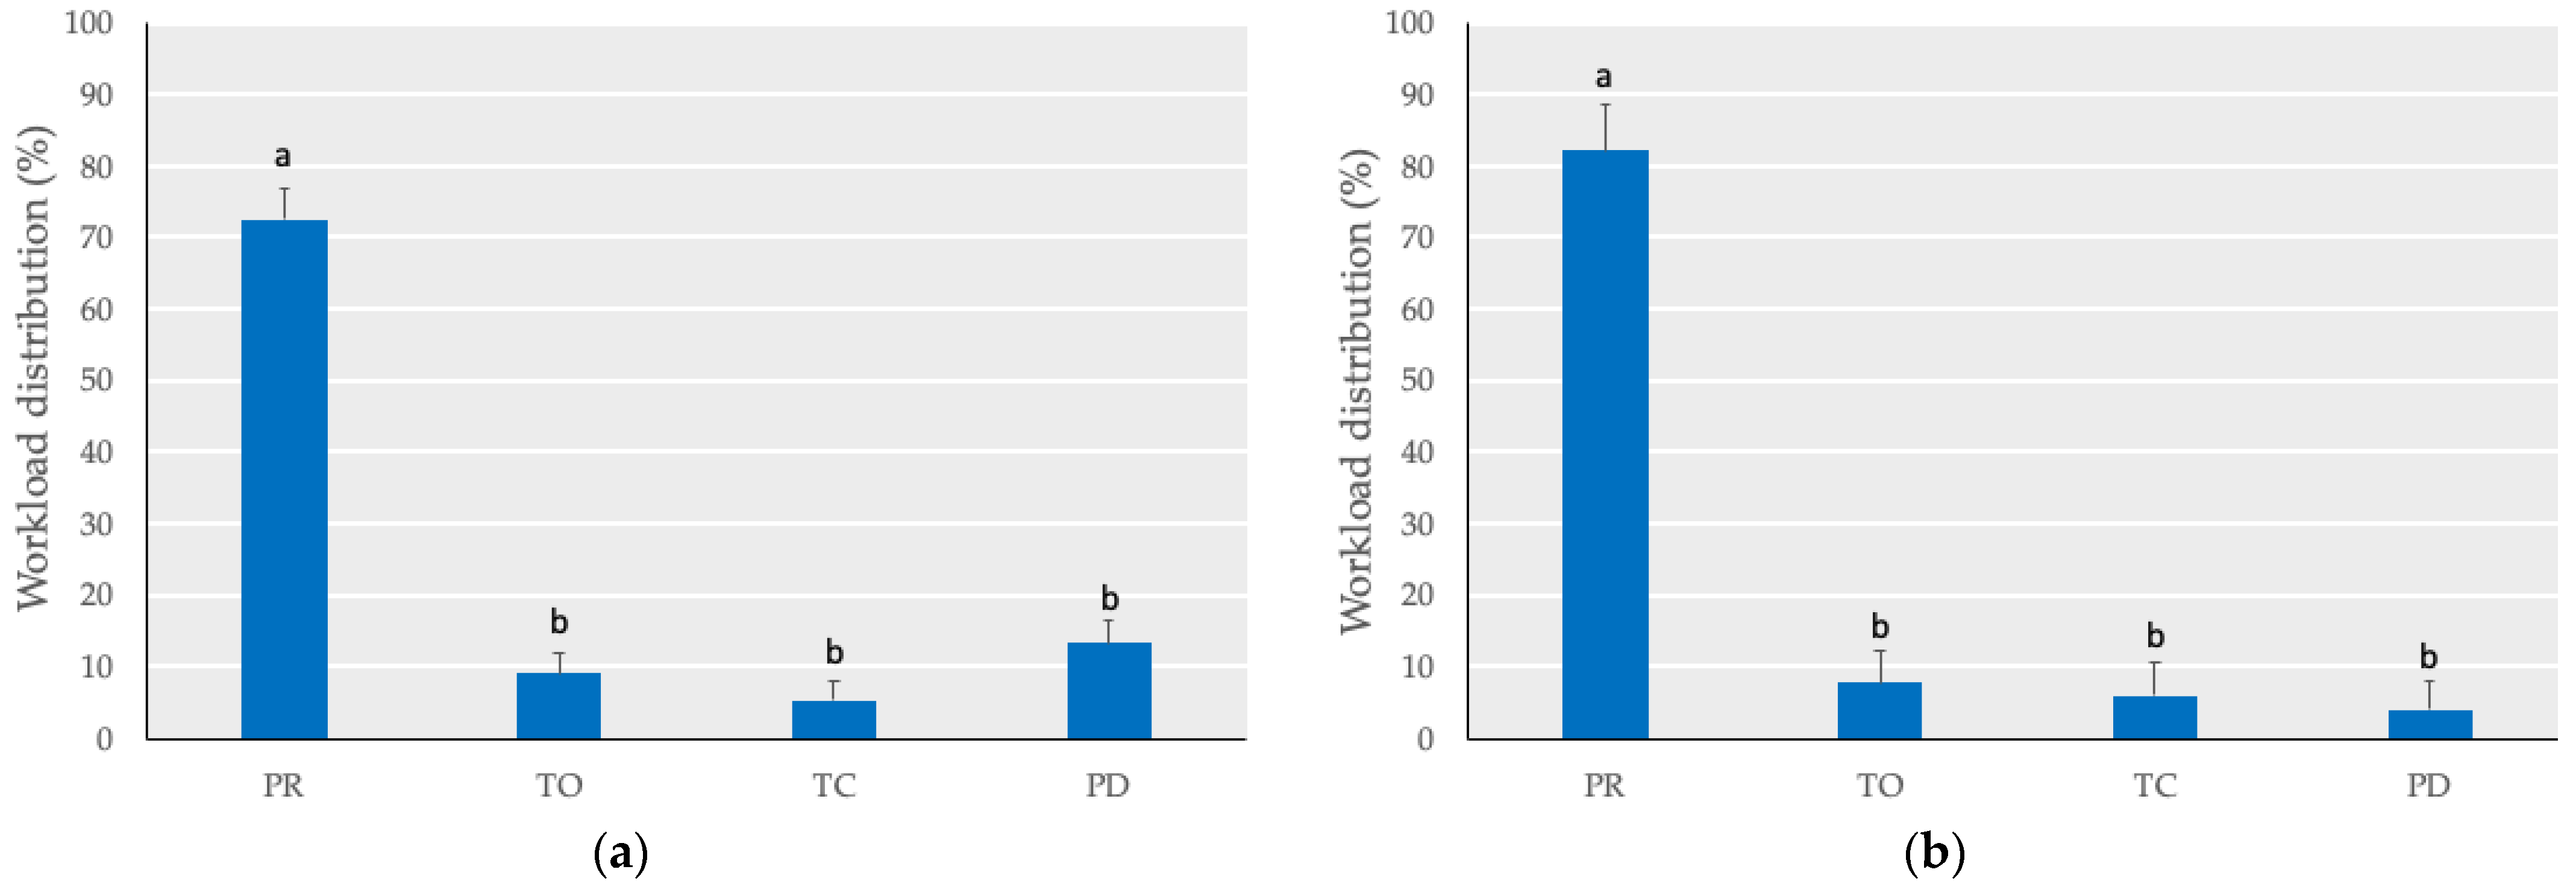
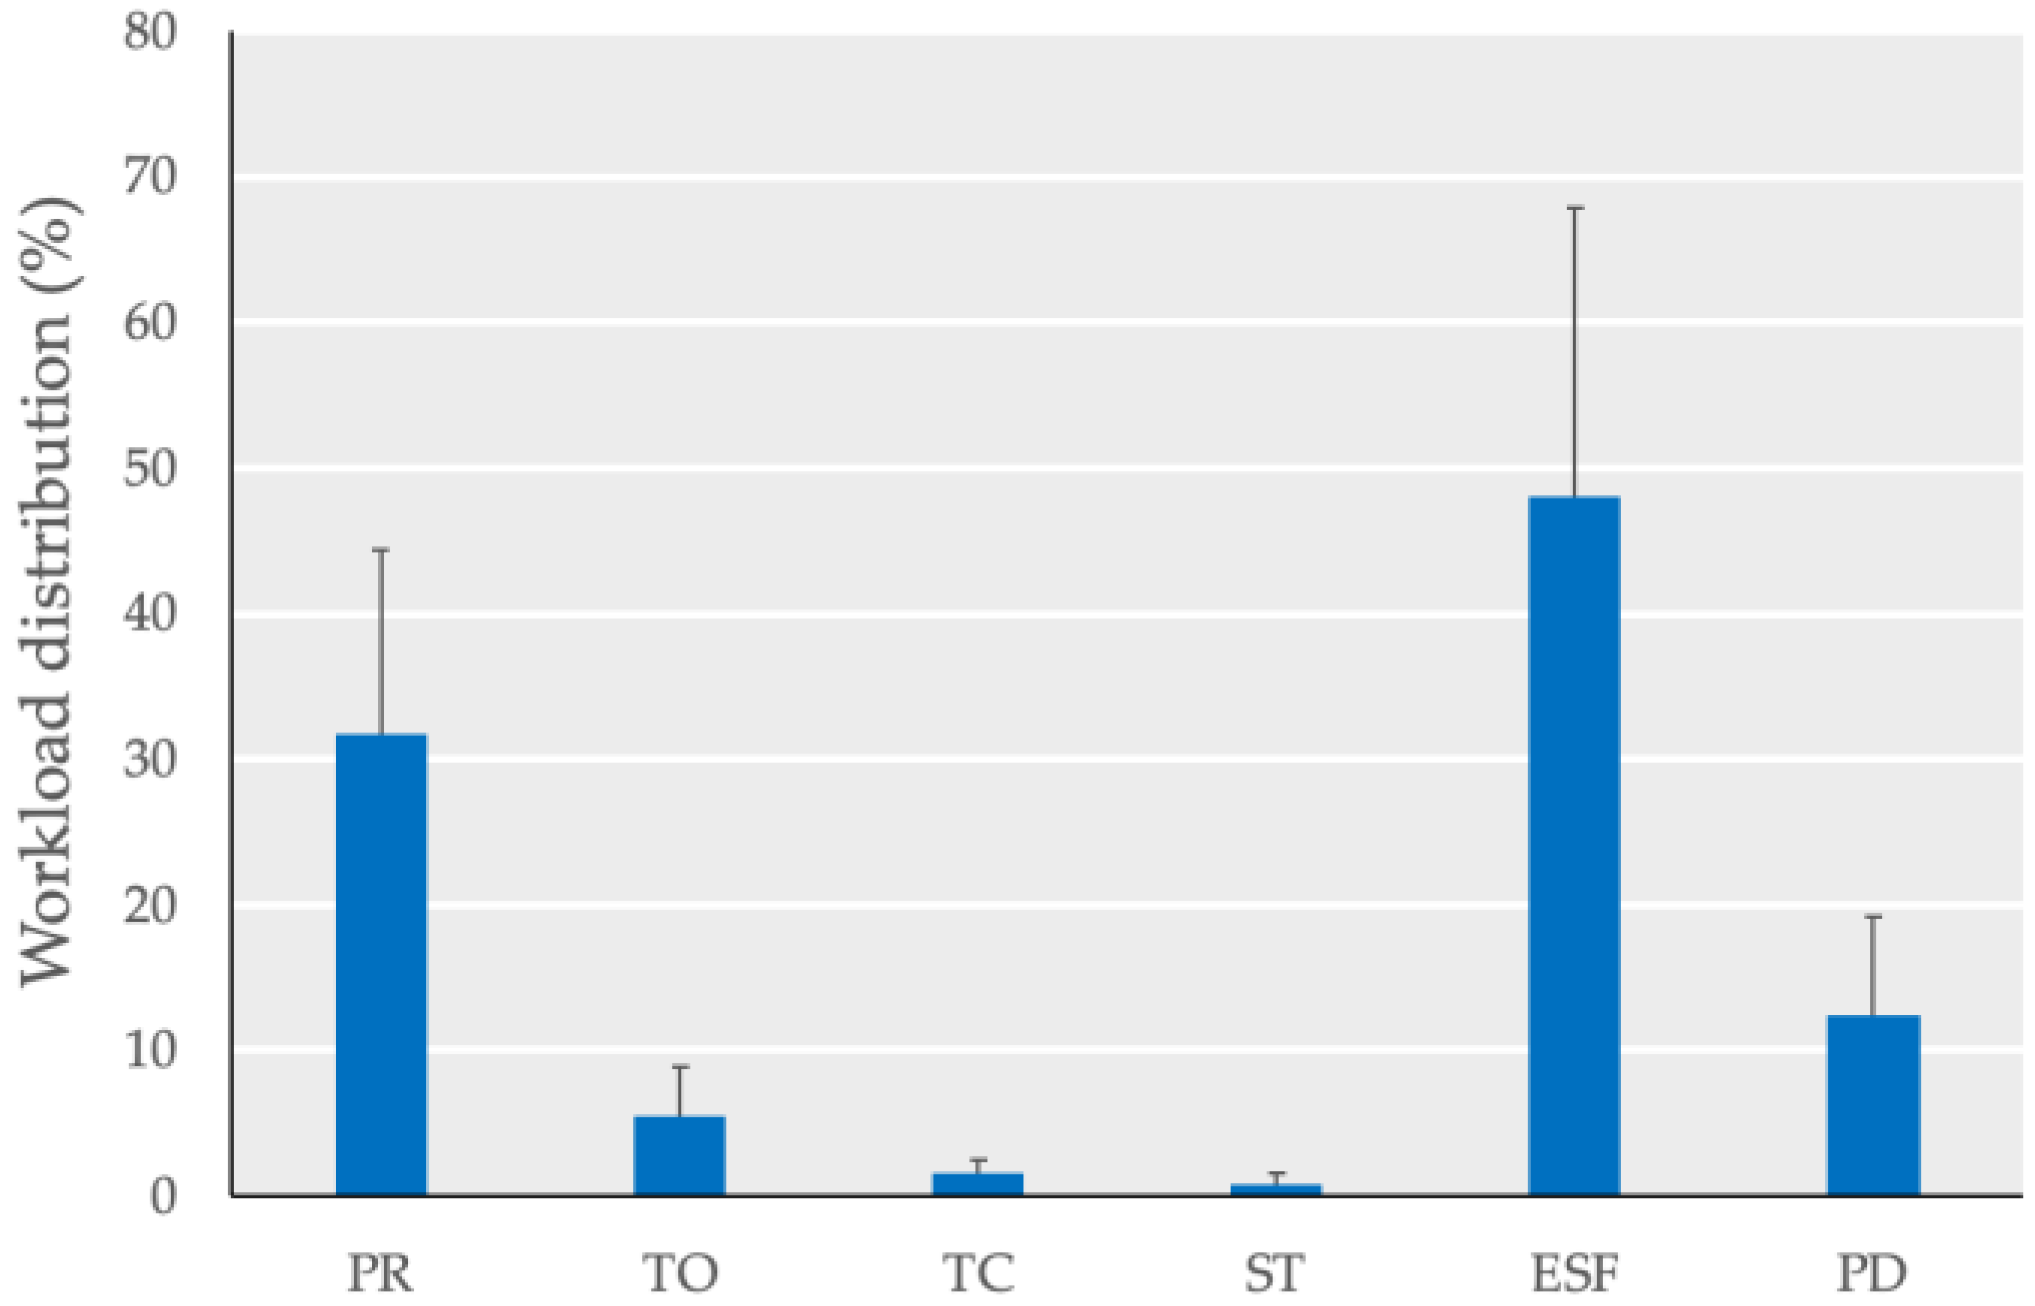
3.2. Teachers’ FDP Workloads

Of the total number of FDP supervision workloads, expressed in hours, monitored in this study (23), 18 corresponded to Type A FDPs and 5 to Type B FDPs. Regarding the Type A FDP supervisions, 14 were carried out under co-supervision and 4 were supervised by only one teacher (Table 4). In the case of the Type B FDP supervisions, all of them were carried out under co-supervision. The median workloads per teacher was 9.6 h (Type A FDP, two teachers), 15.4 h (Type A FDP, one teacher), and 25.2 h (Type B FDP, two teachers). The 95% confidence intervals for the medians (h) were [6.9–17.7] (Type A FDP, two teachers), [6.5–17.6] (Type A FDP, one teacher), and [15.2–91.0] (Type B FDP, two teachers). Considering that the classroom-equivalent hours recognized by the University of Seville for FDP teachers are 5 h (in the case of two teachers per FDP) and 10 h (in the case of one teacher per FDP), our findings show that the reported workloads exceed these values in both Type A and Type B FDP co-supervisions.
Experimental FDPs supervised by two teachers accumulate significantly (p = 9 × 10⁻⁵) more supervising hours (50.4 h) than engineering FDPs with either one (15.4 h) or two teachers (9.55 h × 2 = 19.1 h). The reason why Type B FDP supervisions require greater workloads than Type A FDP supervisions may be due to the fact that Type B FDPs are often offered within the framework of research projects funded through competitive public calls in which the implication of the supervisor is high in the design, performance, and data analysis of the experiments. Furthermore, students receive less training on research activities during the degree as compared to the competencies acquired on how to approach an agricultural engineering project. This fact forces the teachers to spend more time to train the students in certain matters such as experimental procedures in the laboratory or the field, data analysis or, even writing a scientific document. From the point of view of the scores obtained by the supervised students, no significant differences were observed (p = 0.14) according to the Brunner–Dette–Munk test (Table 4).
The time distribution between activities by teachers shows highly significant differences in Type A FDPs with two teachers (p < 10−12) and one teacher (p = 10−5). In both cases, the time spent on project review was much higher than the time spent on the other activities (Figure 4). In this regard, Type A FDP teachers reported that most of their time (73% in the case of FDPs co-supervised and 82% in FDPs supervised by only one academic teacher) was spent on project review. Face-to-face tutoring sessions (TC) represented around 6% of the workload for Type A FDP teachers, whereas on-line tutoring sessions (TO) represented around 8–9% of the workload. Project defense (PD) of Type A FDPs amounted to 13% and 4% of the teachers’ workload, for FDPs supervised by two and one teachers, respectively. In any case, there were no significant differences between TO, TC, and PD activities in type A FDPs, regardless of the number of teachers. In the case of Type B FDPs, the experiment set-up and follow-up along with the project review were the most time-demanding tasks, although there were no significant differences between activities (Figure 5).

4. Discussion

The actual workload for students and teachers of the final degree project (FDP) in the agricultural engineering degree program at the University of Seville was evaluated. The FDP is an active learning course where students must complete their learning process through the development of an experimental- or engineering-type project during the last semester of the bachelor’s degree. It has been reported that university courses that use active learning methodologies tend to improve students’ scores [34]. This was also the case for the FDP course, where the students who passed the FDP obtained high scores regardless of the exam period in which they completed the FDP course or their reported workloads (Table 3 and Figure 2).
A negative outcome from an academic point of view is the low pass rate observed in the FDP course (67%, Table 2). In the Section 1, it was hypothesized that this low student performance could be due to the inadequacy of the workloads required to complete the FDP with respect to those theoretically established by the ECTS system. However, the results obtained in this study indicate that the students who completed the FDP in either of the two exam periods did not require devoting more work hours than the nominal workload established for this course (Table 3), so an excessive workload does not seem to be the reason for the low pass rate observed in the FDP course. In the scientific literature, it has been reported the resistance that students tend to offer to active learning methodologies ([35,36]), which can occur when student expectations about the teaching practices used by instructors are not met. The FDP course is based on active learning methodologies, in particular project-based learning, in which students can apply the basic theoretical concepts learned in other courses to real problems. These methodologies have many benefits for students as well as limitations and difficulties. Project-based learning requires motivated students to participate and engage in their own learning process [37]. However, students may offer resistance to active learning methodologies performing the tasks poorly and with minimal effort, which results in a lower than required workload and an increasing probability of failing the course [38,39]. The low workloads reported by the students who did not pass the FDP course, i.e., less than one-third of the nominal ECTS credit hours (Table 3), suggest that these students may have experienced negative reactions towards active learning tasks.
Scientific evidence indicates that student resistance to active learning methodologies can be reduced by faculty teachers through a variety of strategies [38]. University faculty training workshops can improve teacher performance in engineering faculties [40], including the implementation of active learning methodologies with a positive impact on student engagement [41]. In view of these results, to increase the student pass rate in the FDP course, it may be interesting to foster faculty teachers to attend specific training workshops for the design and implementation of active learning methodologies with positive impact on student motivation and their perception towards the FDP course.
Regarding the reported workloads, the students who passed a Type A FDP course in one of the two exam periods dedicated 30% less (June) or similar (September) workloads to the nominal ECTS credit hours established for this course. These results agree with the findings of Krzin-Stepisnik et al. [11], Arana et al. [12], and Otero-Saborido et al. [42], who have already reported student workload overestimations of the ECTS system. Another aspect observed in this case study that supports previous findings [10] is the large variability in student workloads, which makes it difficult to use ECTS to characterize university course workloads.
Those students who reported workloads higher than the nominal ECTS hours established for the FDP course did not obtain higher scores (Figure 2), which may be due to the fact that students whose workloads exceed the optimal level of motivation and stimulation tend to experience unhealthy and depressive behaviors that reduce their academic performance [9]. Our results also differ from previous experiences that observed that engineering students conducting FDPs rely very much on their teachers’ initiative and need constant help [43]. However, in our case study, the contact hours with the teachers were negligible (below 3% of total workload) and even lower than the time spent seeking technical advice by external professionals (TAEP), especially in Type B FDPs. Project writing was by far the most time-consuming FDP activity in both FDP modalities, accounting for almost 40% of the total workload. The time allocation among the different FDP activities varies with the type of bachelor’s degree, as shown by Notorio et al. [44], who reported that students in more experimental degree programs, such as physics, devote around 23% of the time to project writing (spending 53.8% of hours in laboratory work, 15.4% in data analysis, and 7.7% in project defense).
The fact that most FDP teachers invest significantly more time than that legally recognized by the university is a factor that should be taken into consideration for future regulations. In higher education, teachers are permanently engaged in multiple teaching, research, and management activities that often lead to time conflicting situations [45], so the correct recognition of the FDP teachers’ workloads can contribute to reducing episodes of stress and work inefficiencies in university teachers.

Limitations of the Study

The main limitation of the present study is that the results presented refer to students enrolled in a Spanish engineering school and the findings are thus limited to this student sample. Although we are aware that broad generalizations cannot be made, we believe that the database obtained adds important considerations to the already existing knowledge about the actual practice and workload of university students and how this workload is distributed in a particular course such as the final degree project. It is also important to draw attention to the results obtained at the level of the actual workload for teachers, as they raise important considerations that could be useful for university policy makers.

5. Conclusions

This study has quantitatively determined the real workload of the final degree project (FDP) for students and teachers of an agricultural engineering degree within the EHEA framework (University of Seville, Spain). The results obtained showed that 33% of the students did not pass the FDP course in one academic year, these reporting about one-third of the nominal ECTS credit hours for the FDP course. Student resistance to active learning methodologies is hypothesized as a plausible explanation for the low pass rate of the FDP course. The students who passed the FDP course in the first exam period (19%) reported significantly lower workloads (71% of the nominal ECTS credit hours for the FDP course) than the students who passed it in the second exam period (48%), who reported median workloads of 106% (engineering type FDPs) and 247% (experimental type FDPs) of the nominal ECTS credit hours for the FDP course. The FDP scores obtained by the students were not affected by the exam period in which they passed the course, regardless of the large differences observed in the workloads reported by the two subgroups. Overall, the reported FDP workloads by students who passed the FDP course in either of the two exam periods of the academic year were not significantly higher than the nominal ECTS credit hours. Additionally, no correlation was found between student workloads and FDP scores. Regarding the teachers’ workloads as FDP supervisors, it was found that they devoted to the co-supervised FDPs about two (engineering type) and five times (experimental type) the stipulated time by the university regulations. The time invested by the teachers who supervised the FDPs alone was 60% higher than the time invested by the teachers who co-supervised FDPs, the latter investing about 9.5 h per supervised student.

Author Contributions

Conceptualization, G.E., A.R.-L. and L.P.-U.; methodology, G.E., A.R.-L., M.P.S. and L.P.-U.; software, G.E. and A.R.-L.; validation, G.E., M.P.-R., P.R. and M.P.S.; formal analysis, G.E. and A.R.-L.; investigation, G.E., L.P.-U., M.P.-R., A.R.-L., P.R. and M.P.S.; resources, G.E.; data curation, G.E. and A.R.-L.; writing—original draft preparation, G.E. and A.R.-L.; writing—review and editing, G.E., L.P.-U., P.R., M.P.S. and M.P.-R.; visualization, M.P.S., P.R., M.P.-R., L.P.-U. and G.E.; supervision, G.E.; project administration, G.E.; funding acquisition, G.E. All authors have read and agreed to the published version of the manuscript.

Funding

This research was funded by the University of Seville through the program “Support for Coordination and Teaching Innovation, Call 2019–2020”, ref. 1.2.3 of the III Own Teaching Plan of the University of Seville.

Institutional Review Board Statement

Not applicable.

Informed Consent Statement

Informed consent was obtained from all subjects involved in the study.

Data Availability Statement

The data presented in this study are available on request from the corresponding author.

Conflicts of Interest

The authors declare no conflict of interest.

References

  1. Vitner, G.; Rozenes, S. Final-Year Projects as a Major Element in the IE Curriculum. Eur. J. Eng. Educ. 2009, 34, 587–592. [Google Scholar] [CrossRef]
  2. Dee Fink, L. Creating Significant Learning Experiences: An Integrated Approach to Designing College Courses, Revised and Updated; Jossey-Bass; A Wiley Brand: San Francisco, CA, USA, 2013. [Google Scholar]
  3. Valdés Díaz, M.; López-Cepero Borrego, J. Precursores de La Satisfacción Con El Trabajo de Fin de Grado (TFG) En Estudiantes de Psicología de La Universidad de Sevilla. REDU. Rev. Docencia Univ. 2019, 17, 143. [Google Scholar] [CrossRef] [Green Version]
  4. Esteban-Sánchez, A.L.; Esteban-Escaño, J.; Sein-Echaluce, M.L. Adaptive Monitoring in the Engineering Degree Final Project with Moodle Support. VAEP-RITA 2016, 4, 65–72. [Google Scholar]
  5. Martínez, E.O.; Jaén, J.M.S.; Hernández, S.M. Continuous Assessment at University Teaching of Accounting [Evaluación Continua En La Ensenañza Universitaria de La Contabilidad]. Rev. Investig. Educ. 2020, 38, 109–129. [Google Scholar]
  6. López Nozal, C.; Diez Pastor, J.F.; Maudes Raedo, J.; Marticorena Sánchez, R. Módulo Moodle Para Gestionar Trabajos Final de Grado o Máster. IEEE-RITA 2012, 7, 155–162. [Google Scholar]
  7. Moreno, V.; Hernández-Leo, D.; Camps, I.; Melero, J. Uso de Rúbricas Para El Seguimiento y Evaluación de Los Trabajos Fin de Grado. In Proceedings of the II Congreso Internacional Sobre Evaluación por Competencias Mediante eRúbricas, Málaga, Spain, 24–26 October 2012. [Google Scholar]
  8. Hashim, N.; Hashim, H. Outcome Based Education Performance Evaluation on Final Year Degree Project. In Proceedings of the 7th WSEAS international Conference on Engineering Education (EDUCATION’10), Corfu Island, Greece, 22–24 July 2010; World Scientific and Engineering Academy and Society (WSEAS): Stevens Point, WI, USA, 2010; pp. 215–222. [Google Scholar]
  9. Bachman, L.; Bachman, C. Student perceptions of academic workload in architectural education. J. Archit. Plann. Res. 2006, 23, 271–304. [Google Scholar]
  10. Souto-Iglesias, A.; Baeza Romero, M.T. A Probabilistic Approach to Student Workload: Empirical Distributions and ECTS. High. Educ. 2018, 76, 1007–1025. [Google Scholar] [CrossRef]
  11. Krzin-Stepisnik, J.; Kolar, O.; Trunk-Sirca, N.; Lesjak, D. Student Workload-Student or Teacher Responsibility: Case Study in Higher Education, Slovenia. In Proceedings of the 20th International Congress for School Effectiveness and Improvement (ICSEI), Portoroz, Slovenia, 3–6 January 2007; pp. 169–176. [Google Scholar]
  12. Arana, J.M.; Mayor, M.Á.; Zubiauz, B.; Palenzuela, D.L. The Adaptation of Three Subjects from the First Year of Psychology Studies of the University of Salamanca (Spain) for Teaching within the Framework of the European Credit Transfer System (ECTS). Eur. Psychol. 2005, 10, 160–164. [Google Scholar] [CrossRef]
  13. Kyndt, E.; Berghmans, I.; Dochy, F.; Bulckens, L. ‘Time Is Not Enough.’ Workload in Higher Education: A Student Perspective. High. Educ. Res. Dev. 2014, 33, 684–698. [Google Scholar] [CrossRef]
  14. Ruiz-Gallardo, J.R.; González-Geraldo, J.L.; Castaño, S. What Are Our Students Doing? Workload, Time Allocation and Time Management in PBL Instruction. A Case Study in Science Education. Teach. Teach. Educ. 2016, 53, 51–62. [Google Scholar] [CrossRef]
  15. Crespo Miguel, M.; Sánchez-Saus Laserna, M. Píldoras Formativas Para La Mejora Educativa Universitaria: El Caso Del Trabajo de Fin de Grado En El Grado de Lingüística y Lenguas Aplicadas de La Universidad de Cádiz. Educ. Knowl. Soc. 2020, 21, 10. [Google Scholar] [CrossRef] [Green Version]
  16. Molina Jaén, M.D.; Rodríguez Moreno, J.; Colmenero Ruiz, M.J. Importancia de La Tutorización Para El Éxito Del Trabajo de Fin de Grado/[En] Importance of Tutoring for the Success of the Final Degree Project. Rev. Complut. Educ. 2020, 31, 241–250. [Google Scholar] [CrossRef]
  17. Vicario-Molina, I.; Martín-Pastor, E.; Gómez-Gonçalves, A.; González Rodero, L.M. Nuevos Desafíos En La Educación Superior: Análisis de Resultados Obtenidos y Dificultades Experimentadas En La Realización Del Trabajo Fin de Grado de Estudiantes de Los Grados de Maestro de La Universidad de Salamanca. Rev. Complut. Educ. 2020, 31, 185–194. [Google Scholar] [CrossRef]
  18. Peña, E.; Fonseca, D.; Marti, N.; Ferrandiz, J. Relationship between Specific Professional Competences and Learning Activities of the Building and Construction Engineering Degree Final Project. Int. J. Eng. Educ. 2018, 34, 924–939. [Google Scholar]
  19. European Commission. European Credit-Transfer System ECTS. In Users’ Guide; European Commission: Brussels, Belgium, 1998. [Google Scholar]
  20. Chambers, E. Work-Load and the Quality of Student Learning. Stud. High. Educ. 1992, 17, 141–153. [Google Scholar] [CrossRef]
  21. Nosair, E.; Hamdy, H. Total Student Workload: Implications of the European Credit Transfer and Accumulation System for an Integrated, Problem-Based Medical Curriculum. Health Prof. Educ. 2017, 3, 99–107. [Google Scholar] [CrossRef]
  22. Spronken-Smith, R. Implementing a Problem-Based Learning Approach for Teaching Research Methods in Geography. J. Geogr. High. Educ. 2005, 29, 203–221. [Google Scholar] [CrossRef]
  23. Barjola-Valero, P.; Gómez-Esquer, F.; González-Gutiérrez, J.L.; López-López, A.; Mercado-Romero, F.; Rivas-Martínez, I. Crédito ects: ¿Realidad o ficción? Bordón Rev. Pedagog. 2011, 63, 75–90. [Google Scholar]
  24. Bartual Figueras, T.; Poblet, M. Determinantes Del Rendimiento Académico En Estudiantes Universitarios de Primer Año de Economía. Rev. Form. e Innovación Educ. Univ. (REFIEDU) 2009, 2, 305–314. (In Spanish) [Google Scholar]
  25. Smith, L.F.; Gratz, Z.S.; Bousquet, S.G. The Art and Practice of Statistics; Wadsworth, Cengage Learning: Belmont, CA, USA, 2009. [Google Scholar]
  26. Wilcox, R.R. Fundamentals of Modern Statistical Methods. Substantially Improving Power and Accuracy, 2nd ed.; Springer Science+Bussiness Media: New York, NY, USA, 2010. [Google Scholar]
  27. Wilcox, R.R. Introduction to Robust Estimation and Hypothesis Testing, 2nd ed.; Elsevier Academic Press: Amsterdam, The Netherlands, 2005. [Google Scholar]
  28. Mee, R.W. Confidence Intervals for Probabilities and Tolerance Regions Based on a Generalization of the Mann-Whitney Statistic. J. Am. Stat. Assoc. 1990, 85, 793–800. [Google Scholar] [CrossRef]
  29. Sheather, S.J.; McKean, J.W. A Comparison of Testing and Confidence Interval Methods for the Median. Stat. Probab. Lett. 1987, 6, 31–36. [Google Scholar] [CrossRef]
  30. Hall, P.; Sheather, S.J. On the Distribution of a Studentized Quantile. J. R. Stat. Soc. Ser. B 1988, 50, 380–391. [Google Scholar] [CrossRef]
  31. Rust, S.W.; Fligner, M.A. A Modification of the Kruskal-Wallis Statistic for the Generalized Behrens-Fisher Problem. Commun. Stat. Theory Methods 1984, 13, 2013–2027. [Google Scholar] [CrossRef]
  32. Brunner, E.; Dette, H.; Munk, A. Box-Type Approximations in Nonparametric Factorial Designs. J. Am. Stat. Assoc. 1997, 92, 1494–1502. [Google Scholar] [CrossRef]
  33. Team, R.C. R: A Language and Environment for Statistical Computing. R Foundation for Statistical Computing: Vienna, Austria, 2019. [Google Scholar]
  34. Arbelaitz, O.; Martin, J.I.; Muguerza, J. Analysis of Introducing Active Learning Methodologies in a Basic Computer Architecture Course. IEEE Trans. Educ. 2015, 58, 110–116. [Google Scholar] [CrossRef]
  35. Cooper, K.M.; Ashley, M.; Brownell, S.E. Using Expectancy Value Theory as a Framework to Reduce Student Resistance to Active Learning: A Proof of Concept. J. Microbiol. Biol. Educ. 2017, 18. [Google Scholar] [CrossRef] [Green Version]
  36. Shekhar, P.; Prince, M.; Finelli, C.; Demonbrun, M.; Waters, C. Integrating Quantitative and Qualitative Research Methods to Examine Student Resistance to Active Learning. Eur. J. Eng. Educ. 2019, 44, 6–18. [Google Scholar] [CrossRef]
  37. Díaz Lantada, A.; Lafont Morgado, P.; Muñoz-Guijosa, J.M.; Muñoz Sanz, J.L.; Echavarri Otero, J.; Muñoz García, J.; Chacón Tanarro, E.; Guerra Ochoa, E. de la. Towards Successful Project-Based Teaching-Learning Experiences in Engineering Education. Int. J. Eng. Educ. 2013, 29, 476–490. [Google Scholar]
  38. Finelli, C.J.; Borrego, M. Evidence-Based Strategies to Reduce Student Resistance to Active Learning. In Active Learning in College Science; Springer International Publishing: Cham, Switzerland, 2020; pp. 943–952. [Google Scholar] [CrossRef]
  39. Tharayil, S.; Borrego, M.; Prince, M.; Nguyen, K.A.; Shekhar, P.; Finelli, C.J.; Waters, C. Strategies to Mitigate Student Resistance to Active Learning. Int. J. STEM Educ. 2018, 5, 7. [Google Scholar] [CrossRef] [Green Version]
  40. Finelli, C.J.; Ott, M.; Gottfried, A.C.; Hershock, C.; O’Neal, C.; Kaplan, M. Utilizing Instructional Consultations to Enhance the Teaching Performance of Engineering Faculty. J. Eng. Educ. 2008, 97, 397–411. [Google Scholar] [CrossRef] [Green Version]
  41. Shekhar, P.; Borrego, M. After the Workshop: A Case Study of Post-Workshop Implementation of Active Learning in an Electrical Engineering Course. IEEE Trans. Educ. 2017, 60, 1–7. [Google Scholar] [CrossRef]
  42. Otero-Saborido, F.M.; Palomino-Devia, C.; Bernal-García, A.; Gálvez-González, J. Flipped Learning y Evaluación Formativa: Carga de Trabajo Del Estudiante En La Enseñanza Universitaria. Aloma Rev. Psicol. Ciències l’Educació i l’Esport 2021, 38, 33–40. [Google Scholar] [CrossRef]
  43. Popov, A. Final Undergraduate Project in Engineering: Towards More Efficient and Effective Tutorials. Eur. J. Eng. Educ. 2003, 28, 17–26. [Google Scholar] [CrossRef]
  44. Notario, B.; Laguna-Gutierrez, E.; Pinto, J.; Rodriguez-Perez, M. Final Year Project in Physics’ Degree: A New Challenge for the Scientific and Technical Training of Students in Their Last Year of the Physics’ Degree. In Proceedings of the 7th Annual International Conference on Education and New Learning Technologies, Barcelona, Spain, 6–8 July 2015. [Google Scholar]
  45. Alves, A.C.; Moreira, F.; Sousa, R.M.; Lima, R.M. Teachers’ Workload in a Project-Led Engineering Education Approach. In Proceedings of the International Symposium on Innovation and Assessment of Engineering Curricula, Valladolid, Spain, 15–17 May 2009; Domínguez, U., Ed.; pp. 41–52. [Google Scholar]
Figure 1. Screenshots of the interface of the aTimeLoggerTM application showing the activities (in Spanish) predefined by the app developers (a), and the activities defined in the project for the following user role: teacher of student performing an experimental project (b). In (b): Tutoría presencial (TC), Tutoría online (TO), Corrección (PR), Preparación (ESF), Asistencia a defensa (PD).
Education 12 00418 g001
Figure 2. Relationship between students’ FDP scores and total FDP workload. Each point represents a single student.
Education 12 00418 g002
Figure 3. Workload distribution (%) among the different activities by students who performed Type A (a) and Type B (b) FDPs. The error bars represent the standard error of the mean (n = 12 for Type A FDP; n = 2 for Type B FDP). LR: literature review, DA: data analysis, TV: technical visits, PW: project writing, PE: project editing, TC: tutoring sessions (in-person), TO: tutoring sessions (on-line), TAOA: technical advice by other academics; TAEP: technical advice by external professionals; PD: project defense, FW: fieldwork, LW: laboratory work, ED: experimental design. In (a), bars with different letters denote significant differences at p < 0.05. In (b), statistical analysis was not performed due to the small number of individuals in this subgroup.
Education 12 00418 g003
Figure 4. Workload distribution (%) among the different supervision tasks for Type A FDPs supervised by a single teacher (a) and two teachers (b). The error bars represent the standard error of the mean (n = 14 for FDP with two teachers; n = 4 for FDP with one teacher). PR: project review; TC: tutoring sessions (in-person); TO: tutoring sessions (on-line); PD: project defense. Bars with different letters denote significant differences at p < 0.05.
Education 12 00418 g004
Figure 5. Workload distribution (%) among the different supervision tasks for Type B FDPs supervised by two teachers. The error bars represent the standard error of the mean (n = 5). PR: project review; TC: tutoring sessions (in-person); TO: tutoring sessions (on-line); PD: project defense; ST: student training in analysis and measurement techniques; ESF: experiment set-up and follow-up. No significant differences are observed between activities.
Education 12 00418 g005
Table 1. List of activities defined by the participants in the time logging application according to his/her role in the study for both engineering and experimental FDP types.
ActivityStudent
Engineering
Student
Experimental
Teacher
Engineering
Teacher
Experimental
Literature review (LR)XX
Data analysis (DA)XX
Technical visits (TV)X
Project writing (PW)XX
Project editing (PE)XX
Tutoring sessions (in-person) (TC)XXXX
Tutoring sessions (on-line) (TO)XXXX
Technical advice by other teachers (not his/her supervisor) (TAOA) XX
Technical advice by external professionals (TAEP)XX
Project defense (preparation and exam) (PD)XXXX
Experimental design (ED) X
Laboratory work (LW) X
Field work (FW) X
Project review (PR) XX
Experiments set-up and follow-up (ESF) X
Students’ training in analysis and measurement techniques (ST) X
Table 2. Number of students by type of FDP (Type A: engineering; Type B: experimental) and period for defense (First: June; Second: September; None: FDP not defended during the 2019–2020 academic year).
FDP ModalityStudentsExam period
FirstSecondNone
Type A16 (76%)4 (25%)8 (50%)4 (25%)
Type B5 (24%)0 (0%)2 (40%)3 (60%)
Combined214 (19%)10 (48%)7 (33%)
Table 3. Workloads and scores obtained in the FDP course by students who finished the course in the first and second exam periods and those who did not pass the course (failed) during the 2019–2020 academic year.
FDP ModalityWorkload (h) 1Score 1,2
First Period
(June)
Second Period (September)FailedFirst Period
(June)
Second Period (September)Failed
Type A214.5 ± 55.6319.5 ± 66.799.0 ± 87.49.25 ± 0.749.0 ± 0.0-
Type B-742.0 ± 388.081.2 ± 77.1-10 ± 0.0-
Combined214.5 ± 55.6405.0 ± 193.081.2 ± 77.99.25 ± 0.749.0 ± 0.37-
1 Data are shown as median ± normalized median absolute deviation; 2 Maximum achievable score is 10. An exam candidate needs to achieve a score of 5 or higher to pass the course.
Table 4. Number of supervised students, supervisor workloads, and FDP scores per FDP modality and supervision type (CS: co-supervision, IS: individual supervision).
FDP ModalitySupervisionStudentsWorkload (h) 1FDP Score 1
Type A
CS149.55 ± 6.59.0 ± 0.74
IS415.4 ± 7.68.3 ± 0.74
Type BCS525.2 ± 19.510.0 ± 0.0
IS0--
1 Data are shown as median ± normalized median absolute deviation.
Publisher’s Note: MDPI stays neutral with regard to jurisdictional claims in published maps and institutional affiliations.

