Discovery of Candidate Stool Biomarker Proteins for Biliary Atresia Using Proteome Analysis by Data-Independent Acquisition Mass Spectrometry

 , , and
Abstract
:1. Introduction
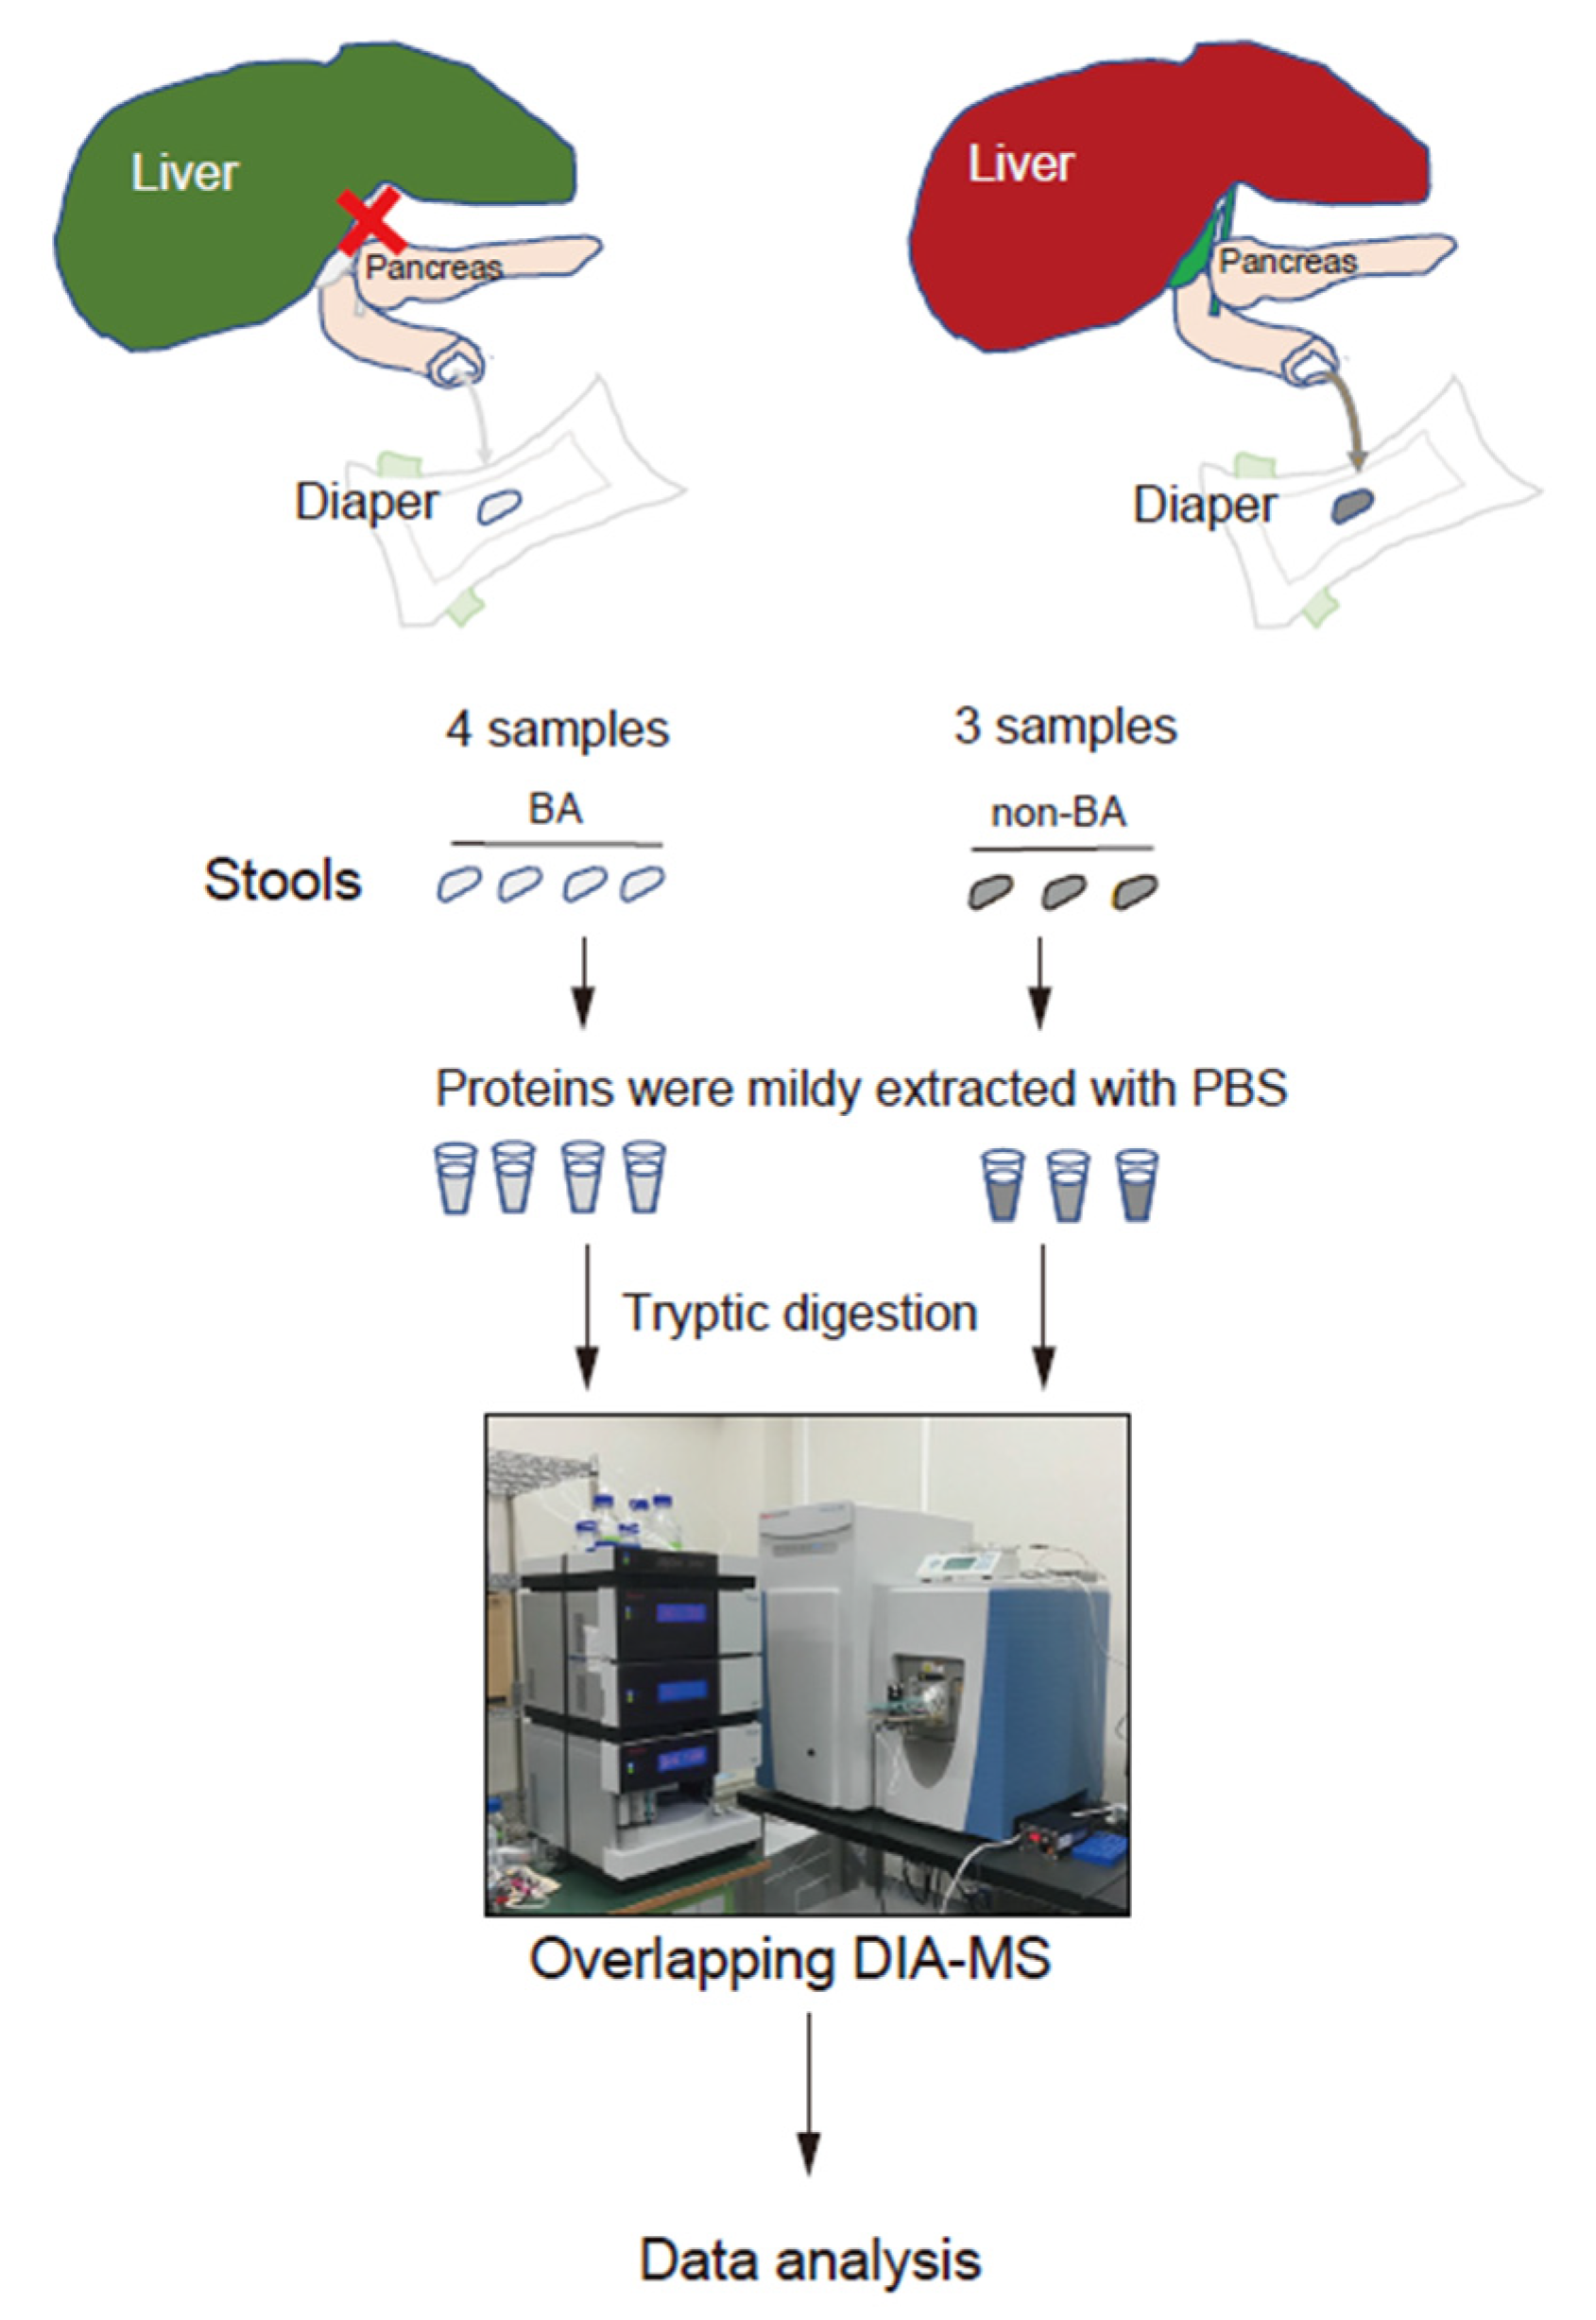
2. Methods
2.1. Patients
2.2. Proteome Analysis
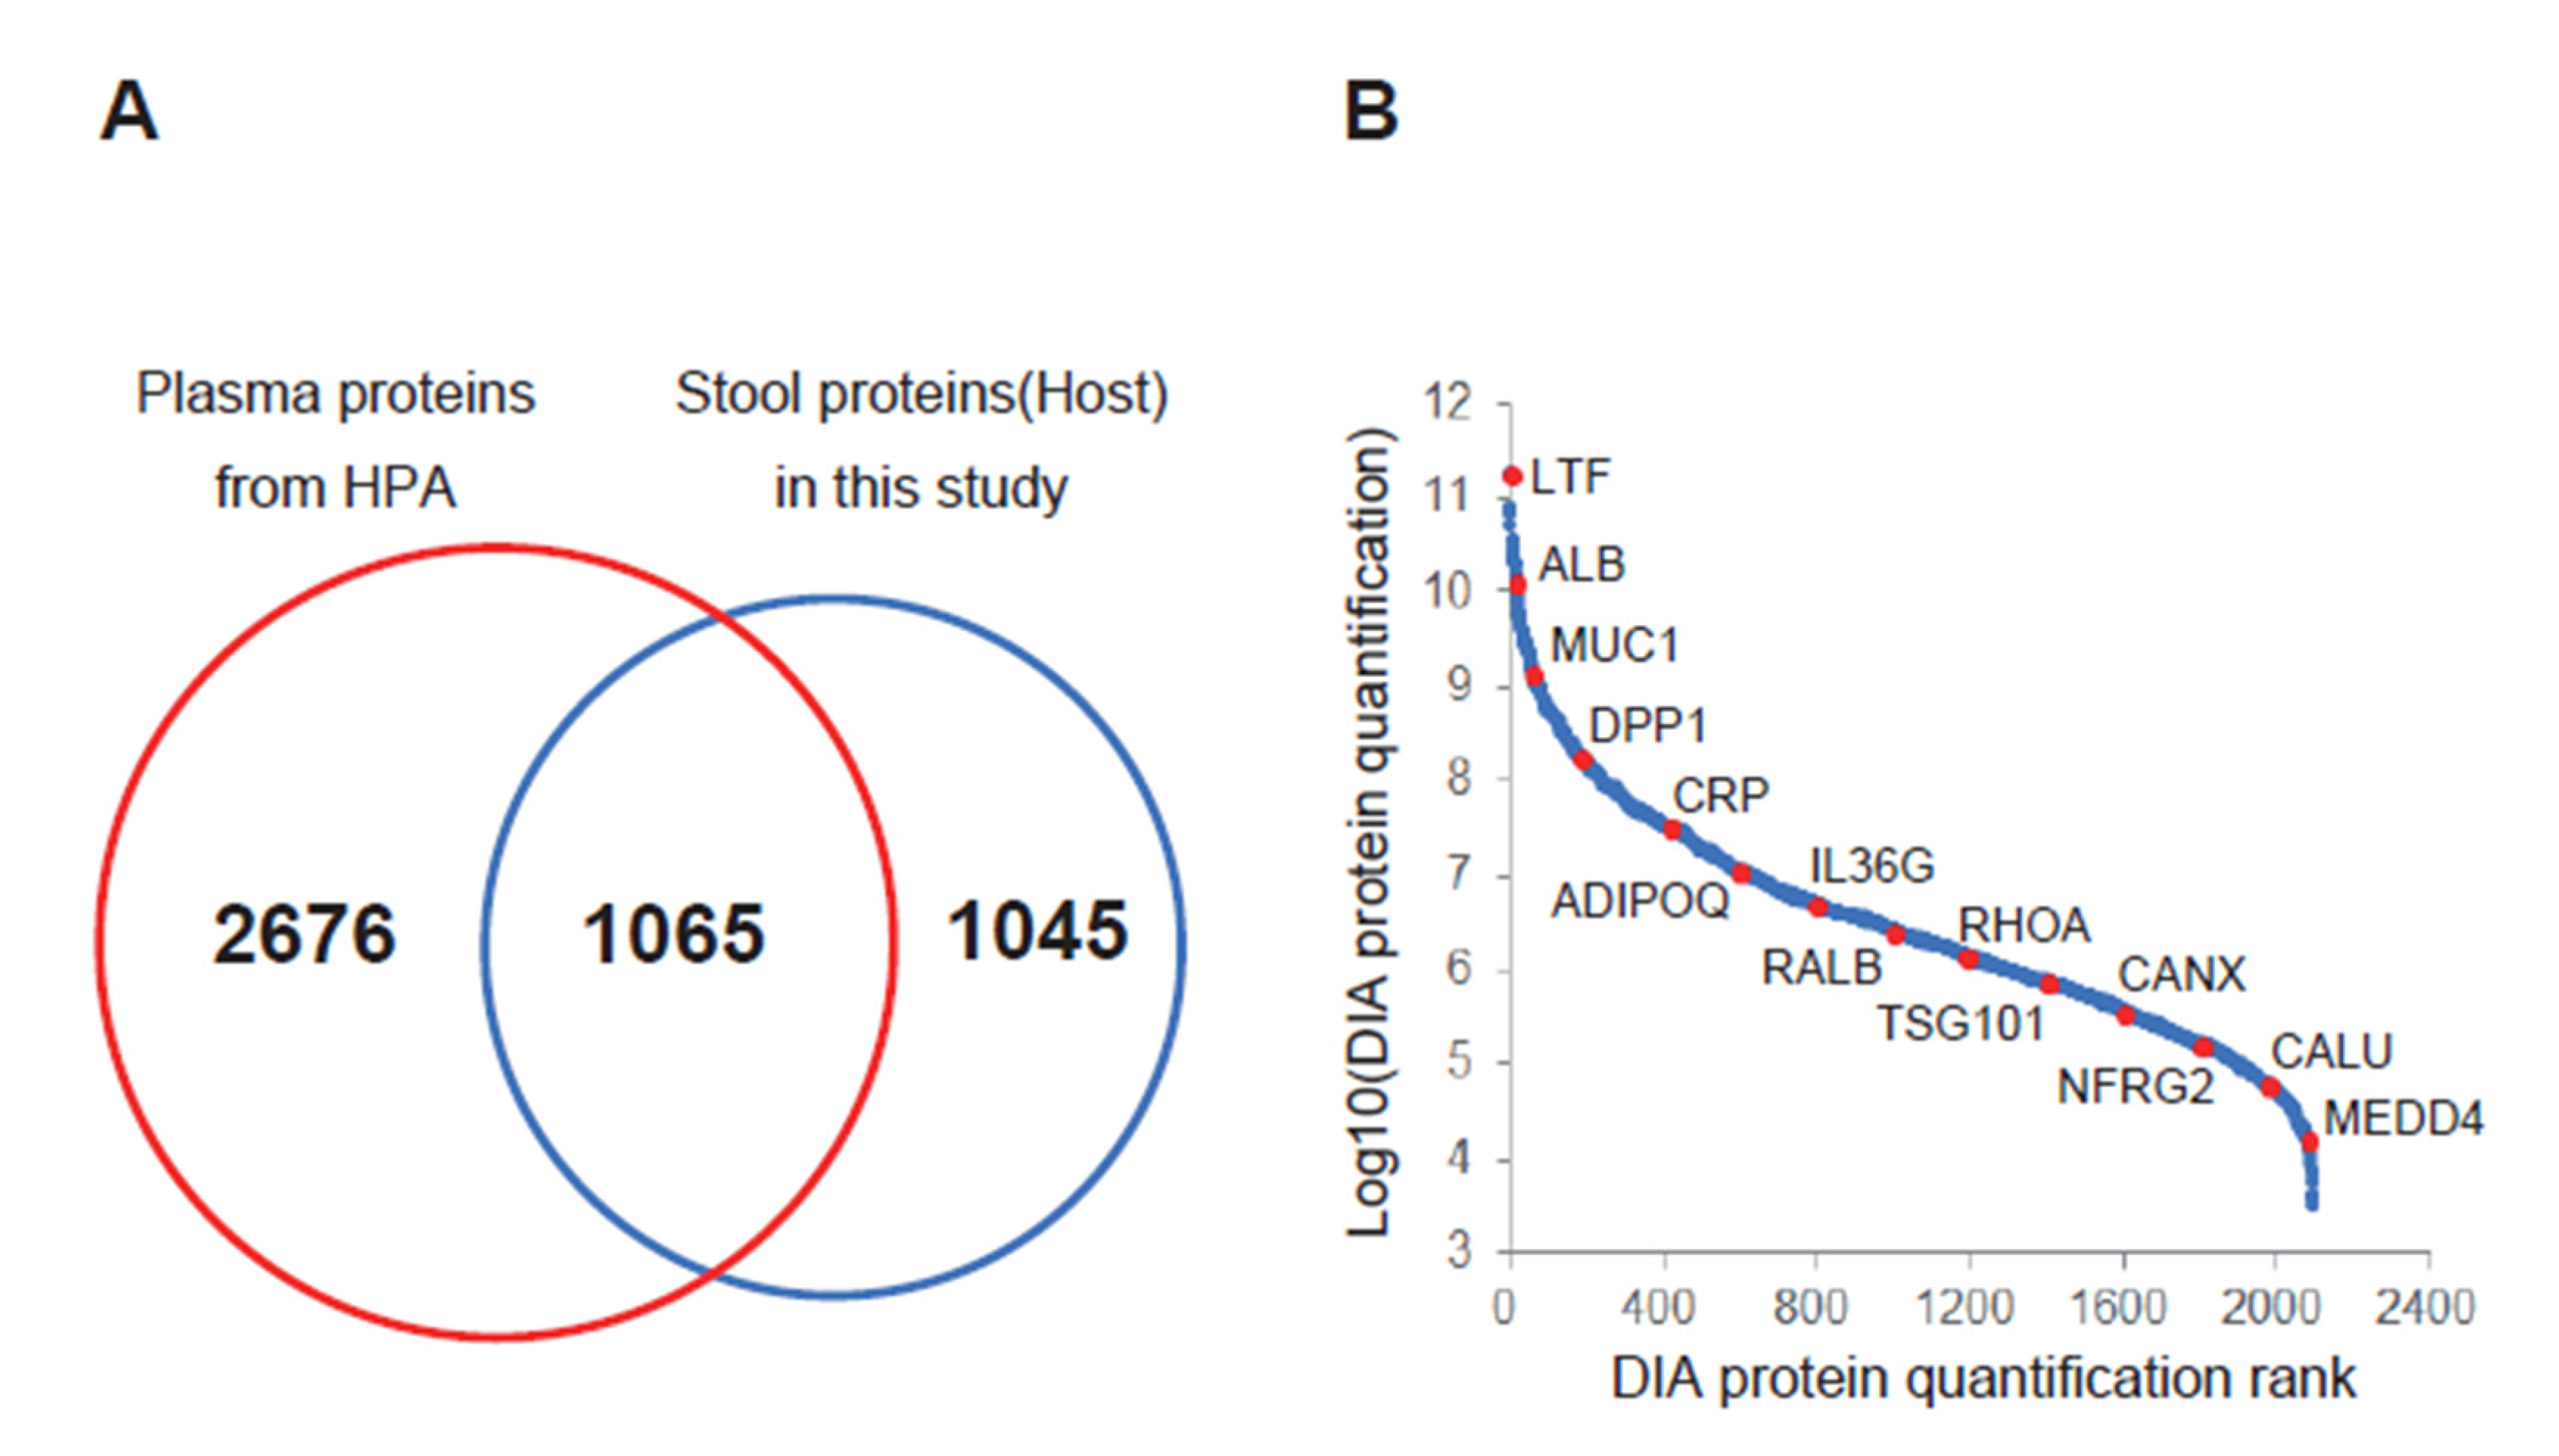
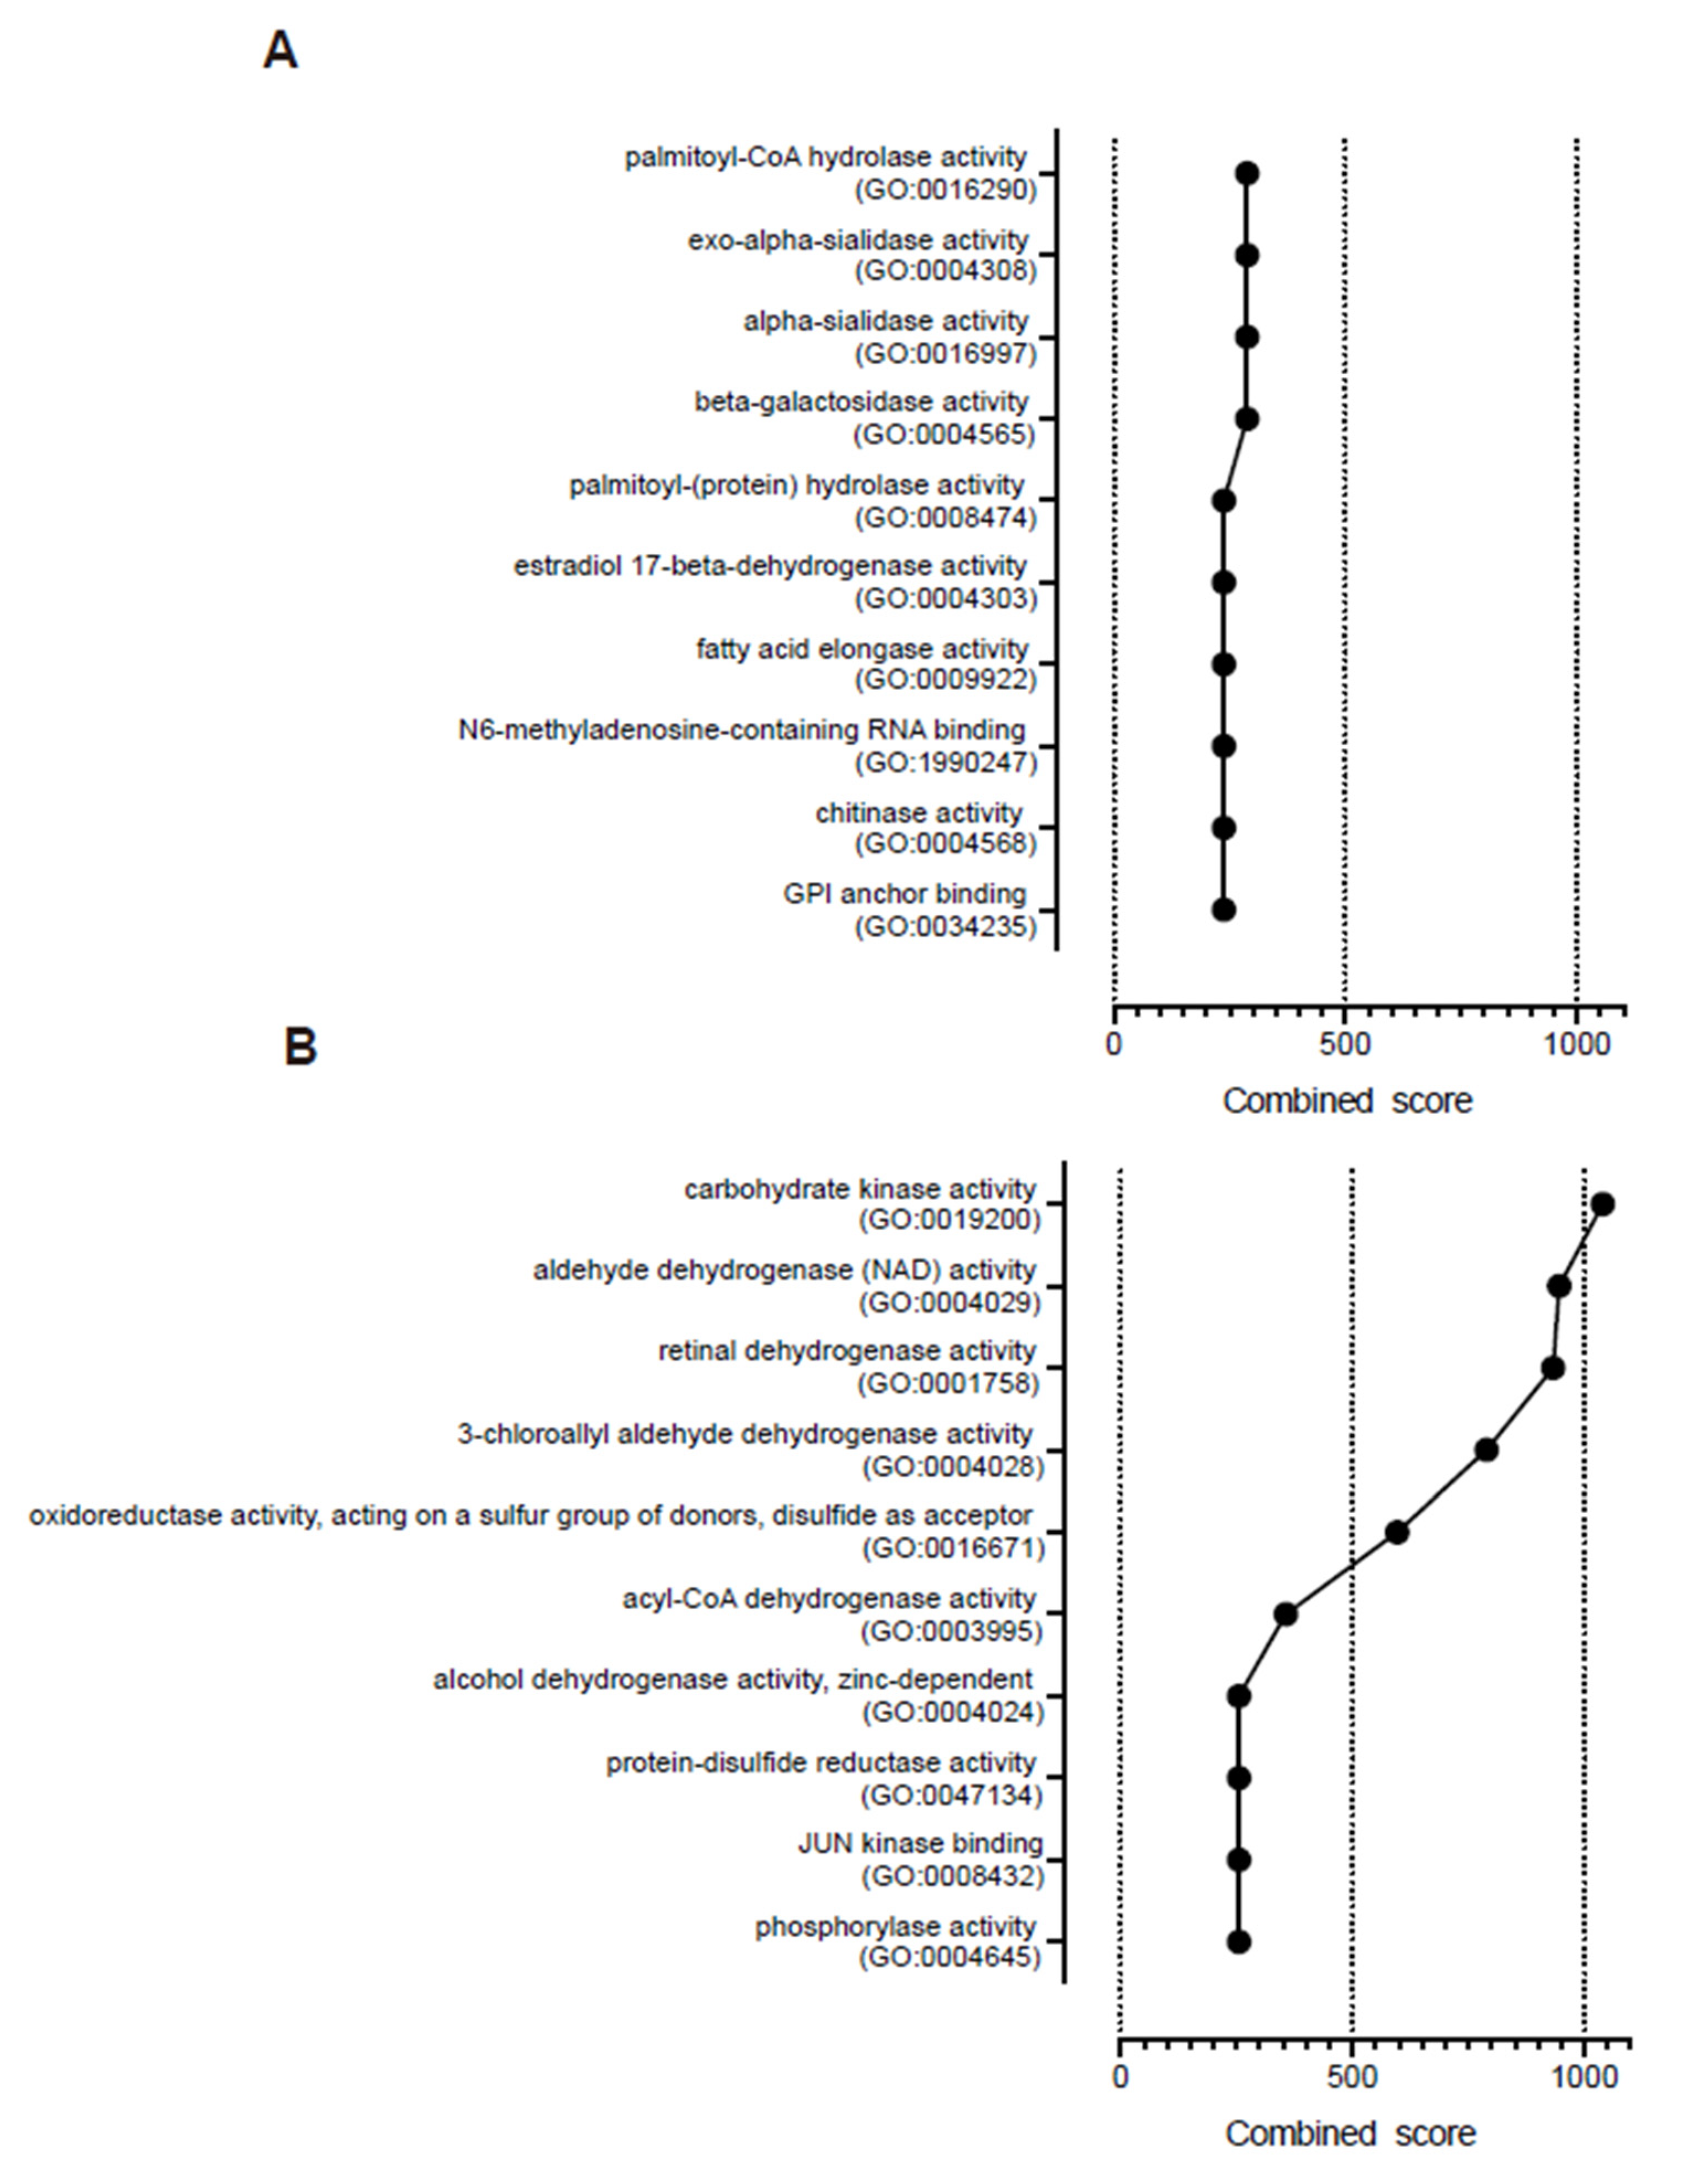
2.3. Data Analysis
2.4. Ethical Approval and Consent to Participate
3. Results and Discussion
4. Conclusions
Author Contributions
Funding
Conflicts of Interest
Abbreviation
| ACAA2 | 3-ketoacyl-CoA thiolase, mitochondrial |
| ACADS | short-chain specific acyl-CoA dehydrogenase, mitochondrial |
| ADH6 | alcohol dehydrogenase 6 |
| ADK | adenosine kinase |
| ALDH1A1 | retinal dehydrogenase 1 |
| ALPL | alkaline phosphatase, tissue-nonspecific isozyme |
| AMACR | alpha-methylacyl-CoA racemase |
| BA | biliary atresia |
| BGP-I | biliary glycoprotein |
| CEACAM | carcinoembryonic antigen-related cell adhesion molecule |
| CHI3L1 | chitinase-3-like protein 1 |
| C4BPA | C4b-binding protein alpha chain |
| DDA | data-dependent acquisition |
| DIA | data-independent acquisition |
| ELISA | enzyme-linked immunosorbent assay |
| GO | gene ontology |
| HMGCS1 | hydroxymethylglutaryl-CoA synthase, cytoplasmic |
| HSD17B2 | estradiol 17-beta-dehydrogenase 2 |
| IRB | institutional review board |
| KHK | ketohexokinase |
| MAMDC4 | apical endosomal glycoprotein |
| MMP-7 | matrix metalloprotease-7 |
| MTTP | microsomal triglyceride transfer protein large subunit |
| NICCD | neonatal intrahepatic cholestasis caused by citrin deficiency |
| PSAT1 | phosphoserine aminotransferase |
| PTGR1 | prostaglandin reductase 1 |
| RBP4 | retinol-binding protein 4 |
| SHMT2 | serine hydroxymethyltransferase, mitochondrial |
| SIGMAR1 | sigma non-opioid intracellular receptor |
| SRM | selected reaction monitoring |
| VOD | veno-occlusive disease |
| XDH | xanthine dehydrogenase/oxidase |
References
- Hartley, J.L.; Davenport, M.; Kelly, D.A. Biliary atresia. Lancet 2009, 374, 1704–1713. [Google Scholar] [CrossRef]
- Okajima, K.; Nagaya, K.; Azuma, H.; Suzuki, T. Biliary atresia and stool: Its consistency and fat content, another potentially useful clinical information. Eur. J. Gastroenterol. Hepatol. 2016, 28, 118. [Google Scholar] [CrossRef] [PubMed]
- Wang, J.; Qian, T.; Jiang, J.; Yang, Y.; Shen, Z.; Huang, Y.; Chen, G.; Zheng, S.; Dong, R. Gut microbial profile in biliary atresia: A case-control study. J. Gastroenterol. Hepatol. 2019, 35, 334–342. [Google Scholar] [CrossRef] [PubMed]
- Tessier, M.E.M.; Cavallo, L.; Yeh, J.; Harpavat, S.; Hoffman, K.L.; Petrosino, J.F.; Shneider, B.L. The Fecal Microbiome in Infants With Biliary Atresia Associates With Bile Flow After Kasai Portoenterostomy. J. Pediatr. Gastroenterol. Nutr. 2020, 70, 789–795. [Google Scholar] [CrossRef]
- Healey, G.; Murphy, R.; Brough, L.; Butts, C.A.; Coad, J. Interindividual variability in gut microbiota and host response to dietary interventions. Nutr. Rev. 2017, 75, 1059–1080. [Google Scholar] [CrossRef] [Green Version]
- Lichtman, J.; Alsentzer, E.; Jaffe, M.; Sprockett, D.; Masutani, E.; Ikwa, E.; Fragiadakis, G.K.; Clifford, D.; Huang, B.E.; Sonnenburg, J.L.; et al. The effect of microbial colonization on the host proteome varies by gastrointestinal location. ISME J. 2015, 10, 1170–1181. [Google Scholar] [CrossRef] [Green Version]
- Hsiao, C.-H.; Chang, M.-H.; Chen, H.-L.; Lee, H.-C.; Wu, T.-C.; Lin, C.-C.; Yang, Y.-J.; Chen, A.-C.; Tiao, M.-M.; Lau, B.-H.; et al. Universal screening for biliary atresia using an infant stool color card in Taiwan. Hepatology 2007, 47, 1233–1240. [Google Scholar] [CrossRef]
- Ang, C.-S.; Baker, M.S.; Nice, E. Mass spectrometry-based analysis for the discovery and validation of potential colorectal cancer stool biomarkers. Methods Enzymol. 2017, 586, 247–274. [Google Scholar] [CrossRef]
- Jin, P.; Wang, K.; Huang, C.; Nice, E. Mining the fecal proteome: From biomarkers to personalised medicine. Expert Rev. Proteom. 2017, 14, 445–459. [Google Scholar] [CrossRef]
- Lin, H.; He, Q.-Y.; Shi, L.; Sleeman, M.; Baker, M.S.; Nice, E. Proteomics and the microbiome: Pitfalls and potential. Expert Rev. Proteom. 2018, 16, 501–511. [Google Scholar] [CrossRef]
- Shao, S.; Guo, T.; Aebersold, R. Mass spectrometry-based proteomic quest for diabetes biomarkers. Biochim. Biophys. Acta Proteins Proteom. 2015, 1854, 519–527. [Google Scholar] [CrossRef] [PubMed]
- Ting, Y.S.; Egertson, J.D.; Bollinger, J.G.; Searle, B.C.; Payne, S.H.; Noble, W.S.; MacCoss, M.J. PECAN: Library-free peptide detection for data-independent acquisition tandem mass spectrometry data. Nat. Methods 2017, 14, 903–908. [Google Scholar] [CrossRef] [PubMed] [Green Version]
- Nakajima, D.; Kawashima, Y.; Shibata, H.; Yasumi, T.; Isa, M.; Izawa, K.; Nishikomori, R.; Heike, T.; Ohara, O. Simple and sensitive analysis for dried blood spot proteins by sodium carbonate precipitation for clinical proteomics. J. Proteome Res. 2020, 19, 2821–2827. [Google Scholar] [CrossRef] [PubMed]
- Amodei, D.; Egertson, J.; MacLean, B.X.; Johnson, R.; Merrihew, G.E.; Keller, A.; Marsh, D.; Vitek, O.; Mallick, P.; MacCoss, M.J. Improving precursor selectivity in data-independent acquisition using overlapping windows. J. Am. Soc. Mass Spectrom. 2019, 30, 669–684. [Google Scholar] [CrossRef]
- Kawashima, Y.; Watanabe, E.; Umeyama, T.; Nakajima, D.; Hattori, M.; Honda, K.; Ohara, O. Optimization of data-independent acquisition mass spectrometry for deep and highly sensitive proteomic analysis. Int. J. Mol. Sci. 2019, 20, 5932. [Google Scholar] [CrossRef] [Green Version]
- Gessulat, S.; Schmidt, T.; Zolg, D.P.; Samaras, P.; Schnatbaum, K.; Zerweck, J.; Knaute, T.; Rechenberger, J.; Delanghe, B.; Huhmer, A.; et al. Prosit: Proteome-wide prediction of peptide tandem mass spectra by deep learning. Nat. Methods 2019, 16, 509–518. [Google Scholar] [CrossRef]
- Searle, B.C.; Pino, L.K.; Egertson, J.D.; Ting, Y.S.; Lawrence, R.T.; MacLean, B.X.; Villén, J.; MacCoss, M.J. Chromatogram libraries improve peptide detection and quantification by data independent acquisition mass spectrometry. Nat. Commun. 2018, 9, 1–12. [Google Scholar] [CrossRef] [Green Version]
- Kuleshov, M.V.; Jones, M.R.; Rouillard, A.D.; Fernandez, N.F.; Duan, Q.; Wang, Z.; Koplev, S.; Jenkins, S.L.; Jagodnik, K.M.; Lachmann, A.; et al. Enrichr: A comprehensive gene set enrichment analysis web server 2016 update. Nucleic Acids Res. 2016, 44, W90–W97. [Google Scholar] [CrossRef] [Green Version]
- Thul, P.J.; Lindskog, C. The human protein atlas: A spatial map of the human proteome. Protein Sci. 2018, 27, 233–244. [Google Scholar] [CrossRef] [Green Version]
- Schreiber, R.A.; Barker, C.C.; Roberts, E.A.; Martin, S.R.; Alvarez, F.; Smith, L.; Butzner, J.D.; Wrobel, I.; Mack, D.; Moroz, S.; et al. Biliary atresia: The canadian experience. J. Pediatr. 2007, 151, 659–665. [Google Scholar] [CrossRef]
- Larrosa–Haro, A.; Caro–López, A.M.; Coello–Ramírez, P.; Zavala–Ocampo, J.; Vázquez–Camacho, G. Duodenal tube test in the diagnosis of biliary atresia. J. Pediatr. Gastroenterol. Nutr. 2001, 32, 311–315. [Google Scholar] [CrossRef] [PubMed]
- Yoshii, D.; Inomata, Y.; Yamamoto, H.; Irie, T.; Kadohisa, M.; Okumura, K.; Isono, K.; Honda, M.; Hayashida, S.; Oya, Y.; et al. The duodenal tube test is more specific than hepatobiliary scintigraphy for identifying bile excretion in the differential diagnosis of biliary atresia. Surg. Today 2020, 50, 1–8. [Google Scholar] [CrossRef] [PubMed]
- Huang, C.-C.; Chou, M.-H.; Wu, C.-L.; Chen, C.-M.; Wang, C.-C.; Chen, Y.-S.; Chen, C.-L.; Tai, M.-H. Matrilysin (MMP-7) is a major matrix metalloproteinase upregulated in biliary atresia-associated liver fibrosis. Mod. Pathol. 2005, 18, 941–950. [Google Scholar] [CrossRef]
- Lertudomphonwanit, C.; Mourya, R.; Fei, L.; Zhang, Y.; Gutta, S.; Yang, L.; Bove, K.E.; Shivakumar, P.; Bezerra, J.A. Large-scale proteomics identifies MMP-7 as a sentinel of epithelial injury and of biliary atresia. Sci. Transl. Med. 2017, 9, eaan8462. [Google Scholar] [CrossRef] [PubMed] [Green Version]
- Yang, L.; Zhou, Y.; Xu, P.-P.; Mourya, R.; Lei, H.-Y.; Cao, G.-Q.; Xiong, X.-L.; Xu, H.; Duan, X.-F.; Wang, N.; et al. Diagnostic accuracy of serum matrix metalloproteinase-7 for biliary atresia. Hepatology 2018, 68, 2069–2077. [Google Scholar] [CrossRef]
- Harpavat, S. MMP-7: The next best serum biomarker for biliary atresia? J. Pediatr. 2019, 208, 8–9. [Google Scholar] [CrossRef] [Green Version]
- Hammarström, S. The carcinoembryonic antigen (CEA) family: Structures, suggested functions and expression in normal and malignant tissues. Semin. Cancer Biol. 1999, 9, 67–81. [Google Scholar] [CrossRef]
- Horst, A.K.; Najjar, S.M.; Wagener, C.; Tiegs, G. CEACAM1 in liver injury, metabolic and immune regulation. Int. J. Mol. Sci. 2018, 19, 3110. [Google Scholar] [CrossRef] [Green Version]
- Svenberg, T. Carcinoembryonic antigen-like substances of human bile. Isolation and partial characterization. Int. J. Cancer 1976, 17, 588–596. [Google Scholar] [CrossRef]
- Luo, Y.; Brigham, D.; Bednarek, J.; Torres, R.; Wang, D.; Ahmad, S.; Mack, C.L. Unique cholangiocyte-targeted IgM autoantibodies correlate with poor outcome in biliary atresia. Hepatology 2020. [Google Scholar] [CrossRef]
- Fehér, J.; Lengyel, G.; Blázovics, A. Oxidative stress in the liver and biliary tract diseases. Scand. J. Gastroenterol. 1998, 228, 38–46. [Google Scholar] [CrossRef] [PubMed]


| Disease | Sample | Type of BA | Sex | Age | AST | ALT | T-Bil | D-Bil | GGTP | |
|---|---|---|---|---|---|---|---|---|---|---|
| BA | RR | 13–30 | 1.0–42 | 0.4–1.5 | 0–0.3 | 13–64 | ||||
| BA.1 | III-c1-ν | M | 65 | 261 | 238 | 13 | 8.9 | 813 | ||
| BA.2 | III-a1-ν | M | 69 | 102 | 80 | 7.7 | 5.4 | 536 | ||
| BA.3 | III-b1-ν | M | 63 | 186 | 120 | 9.1 | 6.0 | 276 | ||
| BA.4 | III-b1-ν | F | 25 | 99 | 50 | 4.1 | 2.8 | 195 | ||
| Ave | 56 | 162 | 122 | 8.5 | 5.8 | 455 | ||||
| Disease | Sample | Type of non-BA | Sex | Age | AST | ALT | T-Bil | D-Bil | GGTP | |
| non-BA | RR | 13–30 | 1.0–42 | 0.4–1.5 | 0–0.3 | 13–64 | ||||
| non-BA.1 | NICCD | M | 90 | 241 | 48 | 9.4 | 5.7 | 172 | ||
| non-BA.2 | GS | F | 38 | 143 | 110 | 5.4 | 3.2 | 194 | ||
| non-BA.3 | VOD | F | 112 | 116 | 150 | 25.7 | 17.0 | 37 | ||
| Ave | 80 | 167 | 103 | 14 | 8.6 | 134 |
| Uniprot ID | Protein Name | Gene Symbol | BA/Non-BA |
|---|---|---|---|
| P13497 | Bone morphogenetic protein 1 | BMP1 | ∞ |
| P36222 | Chitinase-3-like protein 1 | CHI3L1 | 347.3 |
| Q9BW60 | Elongation of very long chain fatty acids protein 1 | ELOVL1 | 142.3 |
| P80511 | Protein S100-A12 | S100A12 | 72.5 |
| Q14956 | Transmembrane glycoprotein NMB | GPNMB | 64.4 |
| P50897 | Palmitoyl-protein thioesterase 1 | PPT1 | 37.9 |
| P02747 | Complement C1q subcomponent subunit C | C1QC | 32.4 |
| Q9Y3E0 | Vesicle transport protein GOT1B | GOLT1B | 25.3 |
| P20160 | Azurocidin | AZU1 | 19.6 |
| P47989 | Xanthine dehydrogenase/oxidase | XDH | 18.3 |
| O60911 | Cathepsin L2 | CTSV | 17.8 |
| P00709 | Alpha-lactalbumin | LALBA | 17.0 |
| P20036 | HLA class II histocompatibility antigen, DP alpha 1 chain | HLA-DPA1 | 14.5 |
| P05164 | Myeloperoxidase | MPO | 11.4 |
| P12724 | Eosinophil cationic protein | RNASE3 | 10.5 |
| P04003 | C4b-binding protein alpha chain | C4BPA | 9.2 |
| Q9UBX7 | Kallikrein-11 | KLK11 | 8.6 |
| P55157 | Microsomal triglyceride transfer protein large subunit | MTTP | 7.9 |
| P37059 | Estradiol 17-beta-dehydrogenase 2 | HSD17B2 | 7.9 |
| P08311 | Cathepsin G | CTSG | 7.7 |
| Q9UJA9 | Ectonucleotide pyrophosphatase/phosphodiesterase family member 5 | ENPP5 | 7.5 |
| P48594 | Serpin B4 | SERPINB4 | 6.8 |
| P04440 | HLA class II histocompatibility antigen, DP beta 1 chain | HLA-DPB1 | 6.3 |
| Q6UXC1 | Apical endosomal glycoprotein | MAMDC4 | 5.6 |
| P31997 | Carcinoembryonic antigen-related cell adhesion molecule 8 | CEACAM8 | 5.6 |
| O14795 | Protein unc-13 homolog B | UNC13B | 5.4 |
| A0A0C4DH67 | Immunoglobulin kappa variable 1–8 | IGKV1–8 | 5.4 |
| Q6NSJ0 | Myogenesis-regulating glycosidase | MYORG | 4.9 |
| P16278 | Beta-galactosidase | GLB1 | 4.9 |
| P06731 | Carcinoembryonic antigen-related cell adhesion molecule 5 | CEACAM5 | 4.7 |
| Q86WC4 | Osteopetrosis-associated transmembrane protein 1 | OSTM1 | 4.7 |
| P13688 | Carcinoembryonic antigen-related cell adhesion molecule 1 | CEACAM1 | 4.6 |
| P05186 | Alkaline phosphatase, tissue-nonspecific isozyme | ALPL | 4.3 |
| O95498 | Vascular non-inflammatory molecule 2 | VNN2 | 4.0 |
| P62244 | 40S ribosomal protein S15a | RPS15A | 4.0 |
| Q9Y6 × 5 | Bis(5′-adenosyl)-triphosphatase ENPP4 | ENPP4 | 3.8 |
| P09651 | Heterogeneous nuclear ribonucleoprotein A1 | HNRNPA1 | 3.4 |
| P52272 | Heterogeneous nuclear ribonucleoprotein M | HNRNPM | 3.2 |
| Q14315 | Filamin-C | FLNC | 3.0 |
| Q9BXJ0 | Complement C1q tumor necrosis factor-related protein 5 | C1QTNF5 | 2.9 |
| Q92542 | Nicastrin | NCSTN | 2.8 |
| P06756 | Integrin alpha-V | ITGAV | 2.6 |
| Q10588 | ADP-ribosyl cyclase/cyclic ADP-ribose hydrolase 2 | BST1 | 2.2 |
| Q99720 | Sigma non-opioid intracellular receptor 1 | SIGMAR1 | 2.1 |
| P07910 | Heterogeneous nuclear ribonucleoproteins C1/C2 | HNRNPC | 2.1 |
| P46783 | 40S ribosomal protein S10 | RPS10 | 1.9 |
| P60842 | Eukaryotic initiation factor 4A-I | EIF4A1 | 1.8 |
| P07437 | Tubulin beta chain | TUBB | 1.8 |
| P68363 | Tubulin alpha-1B chain | TUBA1B | 1.7 |
| Uniprot ID | Protein Name | Gene Symbol | Non-BA/BA |
|---|---|---|---|
| P11217 | Glycogen phosphorylase, muscle form | PYGM | ∞ |
| Q15555 | Microtubule-associated protein RP/EB family member 2 | MAPRE2 | ∞ |
| Q9Y547 | Intraflagellar transport protein 25 homolog | HSPB11 | 48.6 |
| P02792 | Ferritin light chain | FTL | 26.7 |
| P02753 | Retinol-binding protein 4 | RBP4 | 11.8 |
| O43396 | Thioredoxin-like protein 1 | TXNL1 | 11.1 |
| O95336 | 6-phosphogluconolactonase | PGLS | 10.6 |
| P34897 | Serine hydroxymethyltransferase, mitochondrial | SHMT2 | 10.3 |
| Q9UNZ2 | NSFL1 cofactor p47 | NSFL1C | 10.1 |
| Q01581 | Hydroxymethylglutaryl-CoA synthase, cytoplasmic | HMGCS1 | 9.7 |
| Q9NWU1 | 3-oxoacyl-(acyl-carrier-protein) synthase, mitochondrial | OXSM | 9.5 |
| P28332 | Alcohol dehydrogenase 6 | ADH6 | 9.5 |
| Q9UJ68 | Mitochondrial peptide methionine sulfoxide reductase | MSRA | 9.1 |
| P62306 | Small nuclear ribonucleoprotein F | SNRPF | 8.9 |
| P00352 | Retinal dehydrogenase 1 | ALDH1A1 | 7.5 |
| Q15084 | Protein disulfide-isomerase A6 | PDIA6 | 6.8 |
| Q9UJ70 | N-acetyl-D-glucosamine kinase | NAGK | 6.3 |
| O94788 | Retinal dehydrogenase 2 | ALDH1A2 | 6.2 |
| P16219 | Short-chain specific acyl-CoA dehydrogenase, mitochondrial | ACADS | 6.1 |
| O15143 | Actin-related protein 2/3 complex subunit 1B | ARPC1B | 6.1 |
| O95571 | Persulfide dioxygenase ETHE1, mitochondrial | ETHE1 | 5.9 |
| P15531 | Nucleoside diphosphate kinase A | NME1 | 5.8 |
| P27797 | Calreticulin | CALR | 5.7 |
| Q06830 | Peroxiredoxin-1 | PRDX1 | 5.5 |
| P49748 | Very long-chain specific acyl-CoA dehydrogenase, mitochondrial | ACADVL | 5.5 |
| Q99598 | Translin-associated protein X | TSNAX | 5.3 |
| P55263 | Adenosine kinase | ADK | 5.3 |
| Q01518 | Adenylyl cyclase-associated protein 1 | CAP1 | 5.2 |
| Q9Y5K6 | CD2-associated protein | CD2AP | 5.1 |
| P50053 | Ketohexokinase | KHK | 5.0 |
| Q6P9B6 | MTOR-associated protein MEAK7 | MEAK7 | 5.0 |
| P11766 | Alcohol dehydrogenase class-3 | ADH5 | 4.8 |
| P42765 | 3-ketoacyl-CoA thiolase, mitochondrial | ACAA2 | 4.4 |
| A8MWD9 | Putative small nuclear ribonucleoprotein G-like protein 15 | SNRPGP15 | 4.3 |
| P62714 | Serine/threonine-protein phosphatase 2A catalytic subunit beta isoform | PPP2CB | 4.3 |
| P35221 | Catenin alpha-1 | CTNNA1 | 4.2 |
| P26639 | Threonine--tRNA ligase 1, cytoplasmic | TARS1 | 3.8 |
| O95834 | Echinoderm microtubule-associated protein-like 2 | EML2 | 3.6 |
| A6NDG6 | Glycerol-3-phosphate phosphatase | PGP | 3.4 |
| P55735 | Protein SEC13 homolog | SEC13 | 3.3 |
| Q14410 | Glycerol kinase 2 | GK2 | 3.3 |
| P09211 | Glutathione S-transferase P | GSTP1 | 3.3 |
| Q9UBQ0 | Vacuolar protein sorting-associated protein 29 | VPS29 | 3.2 |
| P35080 | Profilin-2 | PFN2 | 3.1 |
| P53396 | ATP-citrate synthase | ACLY | 2.9 |
| P16870 | Carboxypeptidase E | CPE | 2.7 |
| Q9Y617 | Phosphoserine aminotransferase | PSAT1 | 2.5 |
| Q9UHN6 | Cell surface hyaluronidase | CEMIP2 | 2.5 |
| Q9BRT3 | Migration and invasion enhancer 1 | MIEN1 | 2.4 |
| Q9UHK6 | Alpha-methylacyl-CoA racemase | AMACR | 2.3 |
| P22061 | Protein-L-isoaspartate(D-aspartate) O-methyltransferase | PCMT1 | 2.3 |
| P04275 | von Willebrand factor | VWF | 2.2 |
| Q9UHY7 | Enolase-phosphatase E1 | ENOPH1 | 2.0 |
| Q14914 | Prostaglandin reductase 1 | PTGR1 | 1.7 |
Publisher’s Note: MDPI stays neutral with regard to jurisdictional claims in published maps and institutional affiliations. |
© 2020 by the authors. Licensee MDPI, Basel, Switzerland. This article is an open access article distributed under the terms and conditions of the Creative Commons Attribution (CC BY) license (http://creativecommons.org/licenses/by/4.0/).
Share and Cite
Watanabe, E.; Kawashima, Y.; Suda, W.; Kakihara, T.; Takazawa, S.; Nakajima, D.; Nakamura, R.; Nishi, A.; Suzuki, K.; Ohara, O.; et al. Discovery of Candidate Stool Biomarker Proteins for Biliary Atresia Using Proteome Analysis by Data-Independent Acquisition Mass Spectrometry. Proteomes 2020, 8, 36. https://0-doi-org.brum.beds.ac.uk/10.3390/proteomes8040036
Watanabe E, Kawashima Y, Suda W, Kakihara T, Takazawa S, Nakajima D, Nakamura R, Nishi A, Suzuki K, Ohara O, et al. Discovery of Candidate Stool Biomarker Proteins for Biliary Atresia Using Proteome Analysis by Data-Independent Acquisition Mass Spectrometry. Proteomes. 2020; 8(4):36. https://0-doi-org.brum.beds.ac.uk/10.3390/proteomes8040036
Chicago/Turabian StyleWatanabe, Eiichiro, Yusuke Kawashima, Wataru Suda, Tomo Kakihara, Shinya Takazawa, Daisuke Nakajima, Ren Nakamura, Akira Nishi, Kan Suzuki, Osamu Ohara, and et al. 2020. "Discovery of Candidate Stool Biomarker Proteins for Biliary Atresia Using Proteome Analysis by Data-Independent Acquisition Mass Spectrometry" Proteomes 8, no. 4: 36. https://0-doi-org.brum.beds.ac.uk/10.3390/proteomes8040036