
Adaptively Promoting Diversity in a Novel Ensemble Method for Imbalanced Credit-Risk Evaluation


School of Business Administration, Northeastern University, Shenyang 110819, China
*
Author to whom correspondence should be addressed.
Mathematics 2022, 10(11), 1790; https://0-doi-org.brum.beds.ac.uk/10.3390/math10111790
Submission received: 26 March 2022
/
Revised: 16 May 2022
/
Accepted: 17 May 2022
/
Published: 24 May 2022
(This article belongs to the Topic Topology vs. Geometry in Data Analysis/Machine Learning)
Abstract
:Ensemble learning techniques are widely applied to classification tasks such as credit-risk evaluation. As for most credit-risk evaluation scenarios in the real world, only imbalanced data are available for model construction, and the performance of ensemble models still needs to be improved. An ideal ensemble algorithm is supposed to improve diversity in an effective manner. Therefore, we provide an insight in considering an ensemble diversity-promotion method for imbalanced learning tasks. A novel ensemble structure is proposed, which combines self-adaptive optimization techniques and a diversity-promotion method (SA-DP Forest). Additional artificially constructed samples, generated by a fuzzy sampling method at each iteration, directly create diverse hypotheses and address the imbalanced classification problem while training the proposed model. Meanwhile, the self-adaptive optimization mechanism within the ensemble simultaneously balances the individual accuracy as the diversity increases. The results using the decision tree as a base classifier indicate that SA-DP Forest outperforms the comparative algorithms, as reflected by most evaluation metrics on three credit data sets and seven other imbalanced data sets. Our method is also more suitable for experimental data that are properly constructed with a series of artificial imbalance ratios on the original credit data set.
Keywords:
credit-risk evaluation; ensemble learning; imbalanced classification; diversity promotion; self-adaptive optimization; fuzzy sampling methodMSC:
91G40; 68U35; 68T101. Introduction
Class imbalance is the problem that occurs when a smaller number of samples are included in one class than in the others. Especially for binary-classification tests, there exists a typical division into a minority class and a majority class. These imbalanced classification tasks have challenged existing machine learning algorithms greatly, since most of them were initially designed for balanced learning tasks. Credit-risk evaluation has been recognized as a binary-classification task which divides the customers into the categories of good credit and bad credit in order to determine the applicability of loans for applicants. Meanwhile, class-imbalance and data-insufficiency problems recur under various kinds of credit-risk evaluation circumstances with monotonous regularity. However, this stage has substantial economic importance for the finance industry in the context of credit activities to reduce the losses caused by wrong decisions. It also benefits enterprises in terms of inner-management financial risk control. In recent decades, evaluation models based on machine learning have been studied widely [1,2]. The experimental results demonstrate that the machine learning models outperform traditional statistical models under most circumstances [3].
However, the balance of the data disturbance is an essential assumption for most machine learning algorithms, and it can hardly be achieved under real circumstances. In particular, models such as Artificial Neural Networks (ANNs) need abundant training data to achieve excellent performance. In credit-risk evaluation tasks, the number of customers with high credit risk is far lower than that of normal customers, which results in data imbalance and insufficiency. This significantly challenges the accuracy and robustness of these data-mining models. Imbalanced machine learning is of great importance in such applications.
A great number of studies have been dedicated to handling these imbalanced classification tasks. Therefore, imbalanced learning strategies have been employed in various kinds of applications; they mainly include resampling techniques, cost-sensitive learning and ensemble methods. Resampling techniques belong to data-pre-processing methods, which generate artificial data before model construction. However, the effects are limited when encountering data that are either extremely imbalanced or insufficient, for the valid information on which artificial-sample generation based on is, therefore, insufficient. Cost-sensitive approaches assign a higher misclassification cost to the minority class than the majority class. However, the disadvantage is the lack of recourse to set the appropriate values in the cost matrix. Ensemble methods combine several base classifiers to obtain a prediction with an accuracy that is mostly superior to other single classifiers. Meanwhile, they can also handle class-imbalance problems. Instead of pre-processing the experimental data, some researchers deal with data imbalance by improving the algorithm itself, such as the BalancedRandomForest algorithm proposed by Chao Chen and Andy Liaw [4].
As for ensemble learning, diversity and accuracy are two main factors for the improvement of the performance of the classifier. However, the individual accuracy and the diversity in the ensemble system are two naturally opposite objects, and it is intractable to maximize them simultaneously. It has been experimentally verified that the robustness of the ensemble classifier can be promoted by increasing ensemble diversity. It is now widely considered that the promotion of diversity can lead to superior performance compared with other methods when simultaneously balancing ensemble accuracy. Inspired by this, this study proposes an ensemble algorithm that manages to balance the accuracy as well as increasing the diversity when taking the data-imbalance problem into consideration.
The main innovative feature of the novel ensemble model is that it provides an insight in an ensemble-diversity-promotion method for imbalanced learning tasks. We generate borderline-fuzzy samples for diversity promotion that directly create diverse hypotheses and address the imbalanced classification problem while training the proposed model. A self-adaptive optimization mechanism within the ensemble simultaneously balances the individual accuracy as the diversity increases. The paper is organized as follows: Section 2 summarizes the literature related to ensemble approaches and imbalanced learning. Section 3 presents the detailed methodology of the proposed algorithm. The experimental design is represented in Section 4. The data sets we used and the comparative algorithms are shown, and the experimental process is also presented. In Section 5, the experimental results are presented, and an analysis is conducted to illustrate the performance of the model. We outline our conclusions and future expectations in Section 6.
2. Literature Review
A great number of research studies have been made on ensemble learning and imbalanced learning approaches. In this section, the evolution of ensemble learning and its important issues are introduced. As the topic of this paper is credit-risk assessment, the following discussion only includes classification cases. Additionally, some common methods to reduce the negative effect of imbalanced samples are also elaborated in the following.
2.1. Ensemble Approaches
Ensemble learning has been proved to be an effective machine learning model applied to data-mining tasks. As the features and sizes of the data used in these tasks have become harder to classify in the past few decades, further developments have been made to the classification algorithms. However, the various kinds of single classifiers cannot effectively solve all the problems and meet developing needs. Therefore, ensemble methods have been studied and widely applied to various kinds of tasks. A great number of studies have proved that the performance of ensemble classifiers is often superior to that of individual classifiers. Dietterich [5] reviewed some original methods, such as Bayesian averaging, and some modern methods, such as boosting and bagging. Kuncheva [6] revealed the superiority of ensemble models under the diversity aspect.
2.1.1. Ensemble Classifier and Hybrid Ensemble
Ensemble learning is prevalent in various domains, and the studies on this topic can be mainly categorized into those analyzing the ensemble classifier and those dedicated to the hybrid ensemble. Ensemble-classifier studies mainly focus on the algorithms and their decision making. Classical ensemble algorithms such as bagging, boosting and stacking have all been applied to classification tasks such as credit scoring. A comparative study [7] indicated that ensemble classifiers can substantially improve performance in comparison with individual classifiers. It also verified that bagging performs better than boosting in all credit data sets, while stacking and bagging ensemble algorithms obtain the best performance. Tomczak [8] used the boosting method to construct an extreme gradient lifting tree ensemble model, which is applied for predicting credit bankruptcy risk. Their model also takes advantage of synthetic features. He and Zhang [9] used RandomForest and the extreme gradient lifting tree as the basic classifier for ensemble learning. In addition, their model also combines stacking with the extended balance cascade approach in order to obtain a three-stage ensemble to adapt to different ratios of imbalanced data sets.
On the other hand, hybrid ensemble studies mainly focus on the combination of feature selection or parameter optimization before classification. Eletter [10] proposed a network to support the decision making of Jordanian commercial banks. The best parameters of the neural network were found by applying the genetic algorithm. Several feature selection methods were compared in Fatemeh’s study [11], and the Principal Component Analysis (PCA) was considered the best feature-selection method to build a hybrid model. Other scholars focused on the breakthrough of the dimension-reduction algorithm before classifier modelling. Jadhav [12] and Nali [13] also conducted research in the field of hybrid ensemble.
2.1.2. Ensemble Diversity
The diversity of the ensemble classifier is regarded as the most important question in ensemble learning. It represents the difference between the base classifiers of an ensemble model. Only by gathering single classifiers with diversity can we combine them to reduce the variance error without increasing the bias error [14]. However, some scholars showed that the correlation between ensemble diversity and performance is not so obvious, and individual accuracy is considered the most crucial factor, rather than ensemble diversity [15]. It is now widely considered that the promotion of diversity can lead to superior performance when we simultaneously balance ensemble accuracy.
However, there is still not a complete understanding of diversity, neither do we have a precise measure that can be widely accepted. At present, the measure of ensemble diversity is mainly based on the prediction of the validation set. Even though many different measures have been proposed in the literature, studies such as Tang [16] imply that the exact form of diversity measurement which can effectively guide the construction of ensembles has not been discovered. In this study, we propose a kappa coefficient for diversity measurement, which was first used by Dietterich [17], in order to intuitively display ensemble diversity in a two-dimension graph. The graph is well known as a ‘kappa error’.
Many ensemble algorithms enhance their diversity in their own ways. Some commonly used ensemble methods, mainly divided into boosting or bagging, generate diversity based on certain algorithms. A famous boosting algorithm, Adaboost [18], promotes its diversity by re-weighting the existing training data after each iteration. Bagging predictors [19] use the bootstrap sub-sampling method to improve diversity, while RandomForest [20] further improves ensemble diversity by randomly choosing a feature subset during modelling. Geurts [21] introduced the extremely randomized trees technique, which consists of randomizing both feature selection and cut-point choice while splitting a tree node; this can further increase the diversity and reach a better result than RandomForest. Another idea, named rotation forest [22], simultaneously encourages individual accuracy and diversity within the ensemble by applying PCA on the training feature subset, offering a rotated feature space for a base classifier. Maudes [23] proposed random feature weights for constructing ensembles of decision trees in order to increase diversity by introducing randomness. Hu [24] proposed a novel ensemble learning algorithm that aims at improving the margin distribution of the combined system over the training set; therefore, diversity is exploited by optimizing the margin distribution. Adding artificial data into the training set is another way to improve ensemble diversity. Melville and Mooney [25] generated artificial data based on the Gaussian distribution defined by the mean and standard deviation from the original training set. The algorithm they proposed reduces the correlation between individual classifiers by labeling these artificial data oppositely before offering them to the ensemble. Zhang and Zhou [26] exploited unlabeled data to facilitate ensemble learning by helping the augmentation of diversity among the base classifiers.
However, ensemble diversity and ensemble accuracy are usually two opposite objects that can hardly be maximized simultaneously. It is unavoidable that the individual accuracy dramatically decreases when the diversity increases [27]. Mao [28] exploited the correlation among individual classifiers and their corresponding weights by constructing a joint optimization ensemble model to balance the diversity and accuracy. In a study by Ren [29], an ensemble learning approach that uses a two-phase accuracy bee-colony algorithm was proposed to balance the accuracy and diversity. In this paper, a novel method is also proposed to balance accuracy and diversity in a certain way.
2.2. Imbalanced Learning
In some cases, rare events happen much less frequently and are hard to detect. This results in a class imbalance and an insufficiency of data provided for data-mining model construction. However, the misclassification of these rare events would cause enormous losses, especially in fields such as credit-risk evaluation. Therefore, many imbalanced learning strategies have been proposed to cope with imbalanced and insufficient classification tasks; they are mainly categorized as resampling [30], ensemble methods [31] and cost-sensitive learning [32].
2.2.1. Resampling
Resampling methods manage to cope with imbalanced classification tasks at the data level, which is independent of the learning algorithm. However, consensus has not been reached among researchers regarding which resampling method is the best, for there is not a method that maintains the best performance under various circumstances [33]. The types of resampling methods are mainly divided into three groups, as many scholars have acknowledged [34]: over-sampling, under-sampling and hybrid sampling. A famous over-sampling method called the synthetic minority over-sampling technique (SMOTE) [35] has been applied to many kinds of imbalanced classification tasks, such as clinical data analysis [36], credit-risk evaluation [37], information technology, etc. However, it may generate redundant information or even indicate the wrong direction for classifier construction. Therefore, various improvements have been made based on the synthetic minority over-sampling technique (SMOTE) [38,39] with respect to its weakness. Scholars such as Niu [40] also proposed a new sampling method, while facing the credit-scoring task of P2P lending, in order to solve the misclassification of the majority class as well as maintaining the prediction accuracy of the minority class. Under-sampling is also commonly used; it consists of randomly selecting samples from the majority class to be dropped to decrease its size to that of the minority class. However, it often causes a great loss of information in the majority class when the data are extremely imbalanced and insufficient. Hybrid methods are the combination of over-sampling and under-sampling. In many applications, hybrid ensemble methods are designed to make a breakthrough on the current resampling techniques [41,42]. Besides, novel resampling techniques based on the cluster method also draw great attention. Nekooeimehr [43] proposed a semi-unsupervised hierarchical clustering approach to cluster the minority instances and then oversample them in terms of their distance to the majority class. However, this data-pre-processing method is not so effective and can hardly maintain its competitive edge when facing extremely imbalanced problems.
2.2.2. Ensemble Methods
Ensemble-based methods have been found to be more and more effective for class imbalance problems in recent years. As boosting and bagging are the two main ensemble paradigms in ensemble learning, they are also popular solutions when combining them with resampling methods or cost-sensitive learning. EasyEnsemble and balance cascade are two classical ensemble methods that can overcome the deficiency of under-sampling [44]. They draw balance subsets from original data randomly or with guide removal at each iteration and are used to train an Adaboost ensemble. RUSBoost and SMOTEBoost were proposed in another study [45], which also combined Adaboost with sampling techniques. Apart from these iteration-based ensembles, parallel-based ensembles can also provide good results. The BalancedRandomForest classical algorithm was proposed based on the RandomForest algorithm. At each iteration, the bootstrap samples are drawn from the minority class, and the same number of samples are drawn from the majority class. It obviously shows a better performance than other algorithms. Sun [46] stated that the current ensemble model may suffer from unexpected mistakes and rise in generalization errors when altering the data distribution. Therefore, he proposed a novel ensemble model based on the parallel ensemble and reached a better result when solving highly imbalanced problems.
In recent years, researchers have begun to introduce ensemble classifiers to the field of credit-risk evaluation. A DBN-based resampling SVM ensemble learning paradigm was introduced by Yu [47] in credit-risk assessment. The bagging resampling method is used to generate the training subset. It applies SVM as a base classifier and is then integrated by a DBN model, which is quite different from classical ensemble paradigms. Jie Sun [48] combined sampling techniques with a parallel ensemble to form a new decision tree ensemble framework based on SMOTE, bagging and DSR. This introduces different over-sampling rates to SMOTE, and therefore diversity, into the ensemble, outperforming other models for imbalanced enterprise-credit evaluation. Leopoldo [49] introduced dynamic selection techniques to solve imbalanced credit-scoring problems, as they show advantages over static learning models. Some other scholars also made improvements in this field [50].
2.2.3. Cost-Sensitive Learning
Different from resampling methods and ensemble methods, cost-sensitive learning can handle imbalanced data without altering the data distribution. In this case, we assume the cost of misclassification, with respect to the cost under real circumstances. Cost-sensitive learning is often used together with certain classification algorithms such as weighted RandomForest. However, cost-sensitive methods are used much less frequently than resampling techniques and ensemble methods, as the misclassification cost cannot be estimated accurately.
3. Methodology
The imbalance and insufficiency of samples are questions that trouble the field of credit-risk evaluation. As ensemble methods are among the most useful methods in imbalanced classification tasks, this paper provides an insight in effectively integrating the methods that can enhance ensemble classification performance in imbalanced classification tasks. As promoting diversity to a proper degree while simultaneously balancing accuracy is essential for ensemble learning, SA-DP Forest integrates these two aspects into imbalanced learning.
This novel ensemble learning algorithm combines two essential structures, self-adaptive optimization techniques and a diversity-promotion method, which focus on ensemble diversity and individual accuracy, respectively. The diversity-promotion method works based on artificially constructed samples which are generated by a fuzzy sampling method at each iteration of training a base classifier. It directly creates diverse hypotheses and addresses the imbalanced classification problem while training the proposed model. Meanwhile, the self-adaptive optimization mechanism within the ensemble simultaneously balances individual accuracy as the diversity increases. These two aspects are the fundamental elements of SA-DP Forest.
3.1. Fuzzy Sampling Method
At each iteration of training the base classifier, we selected the imbalanced data subset from the original training data. Then, we balanced the training subset of a base classifier by constructing artificial samples.
To overcome the weakness of random over-sampling, Chawla et al. put forward the SMOTE (synthetic minority oversampling technique) algorithm for class-imbalanced classification. Its basic assumption is the random constructing of an artificial sample between two real minority-class samples. For a minority-class sample vector x, its K nearest neighbor is selected by the Euclidean distance. According to the proportion of minority samples and other samples, the nearest minority samples are selected. For all randomly selected nearest-neighbor samples , a new sample is constructed as follows:
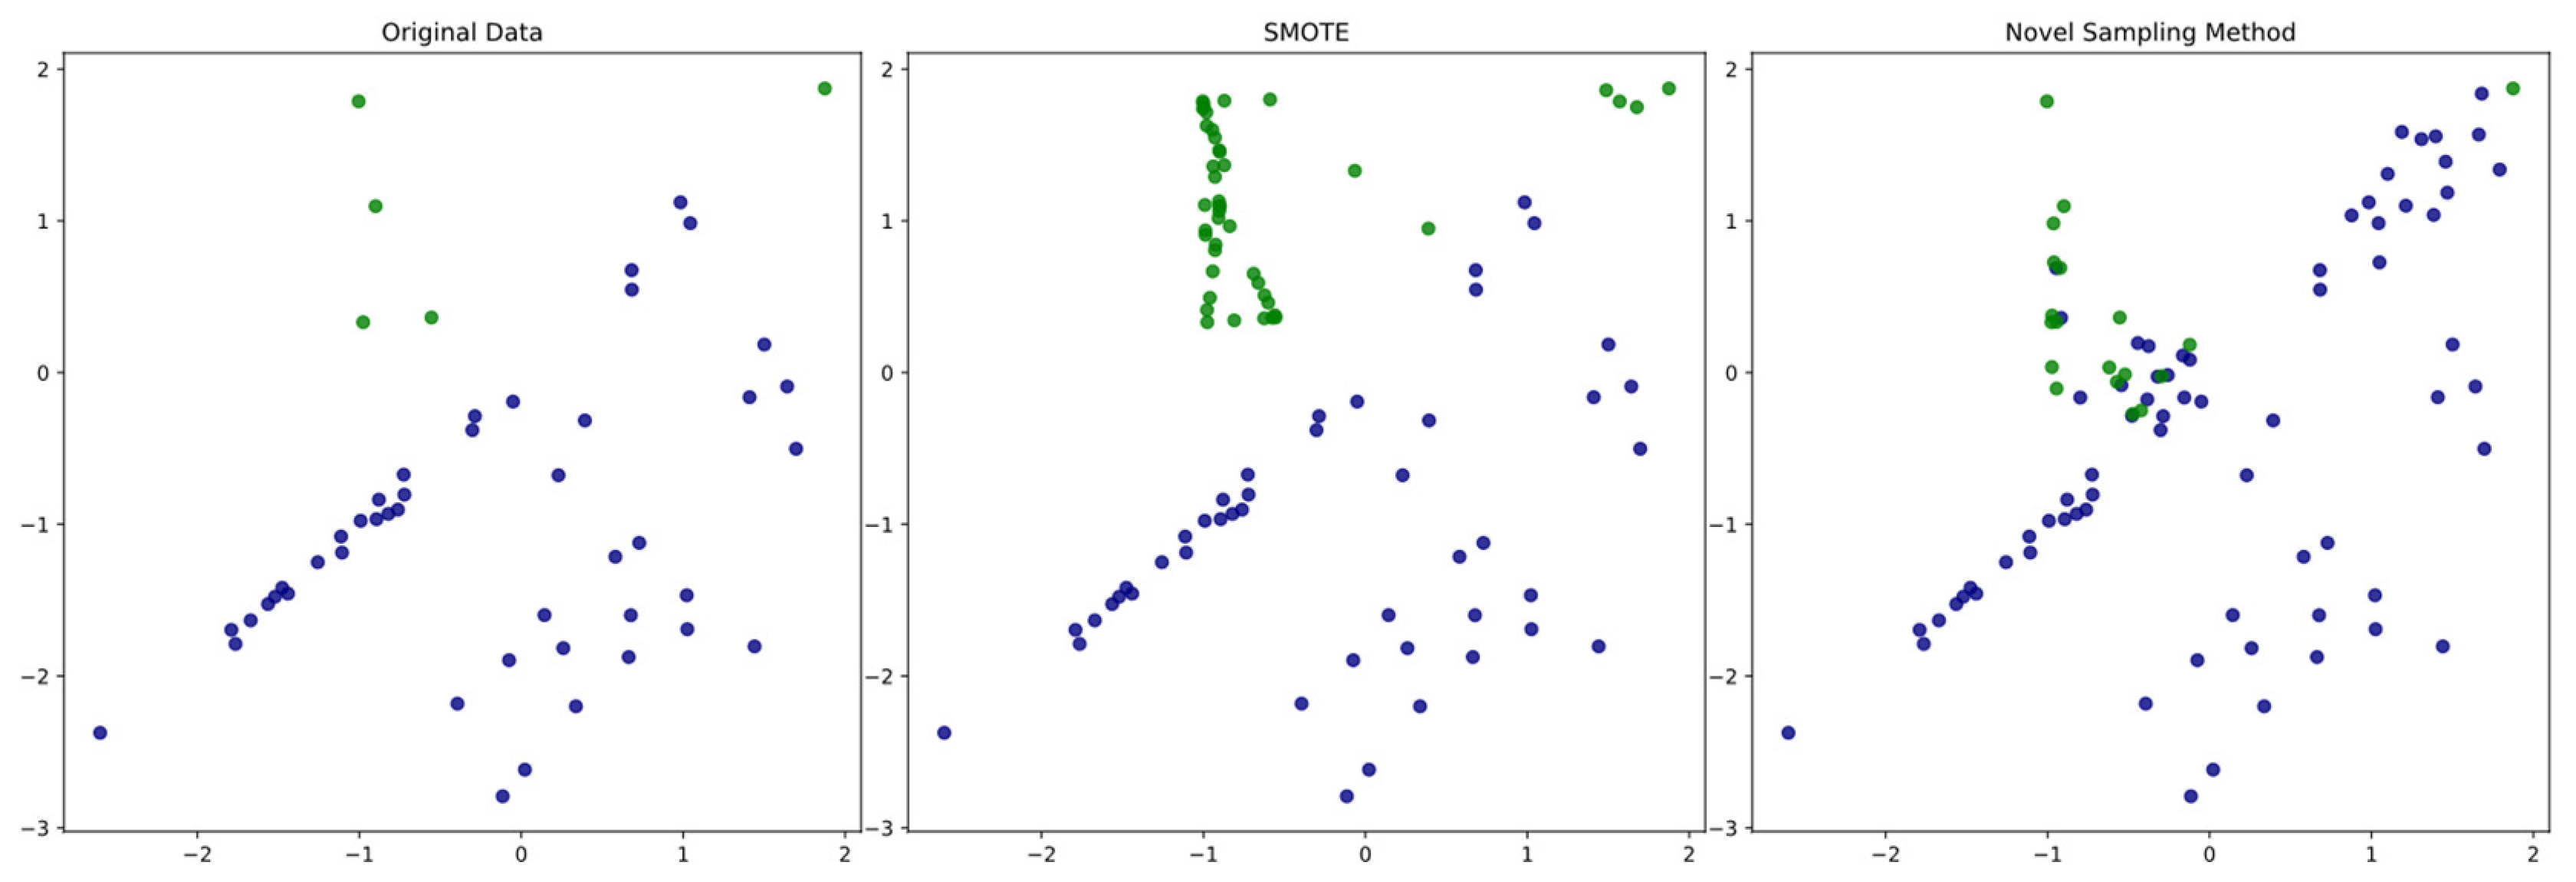
We proposed a fuzzy sampling method based on Equation (1) to promote diversity in the ensemble by constructing unexpected artificial samples. The boundary of different classes is obfuscated by artificial samples generated from this fuzzy sampling method. The class of artificial samples is randomly decided.
This fuzzy sampling method is effective mainly due to its borderline-fuzzy operation. As artificial samples contribute to the increase in ensemble diversity, training samples generated with a proper fuzzy operation can theoretically further contribute to this increase. This fuzzy operation focuses on the samples on the borderline of each class. The borderline sample is distinguished by the value of . For a sample in the original data set, represents the proportion of samples belonging to the minority class in its K nearest neighbors. If the K nearest neighbors of a sample all have the same kind of label, then equals to 1 or 0. It is regarded as an internal sample, for its nearest neighbors all belong to the same class. Intuitively, the borderline samples are located when is not equal to 1 or 0. For a borderline sample , a random vector with the same length of vector is constructed, and it contains different random numbers between 0 and 1. An artificial sample is generated as follows:
where is the difference vector of sample and one of its nearest neighbors . SMOTE generates artificial samples in the linear space between and , as it utilizes just one random number to determine the random distance between and . This fuzzy sampling method proposes a random vector substitute for the random number, which results in the position of the artificial sample being located randomly in all directions.
For each artificial sample we generated as a borderline sample, its label is randomly defined according to . The probability that it belongs to the majority class and minority class are and , respectively. This fuzzy operation makes the borderline between the minority class and the majority class not so explicit. Figure 1 shows the comparative application of SMOTE and this fuzzy sampling method on simulated original data. The green points represent the minority class samples and blue points represent the majority class samples. The artificial samples generated by the fuzzy sampling method are mainly located on the borderline. With the uncertainty of label definition, the borderline is not so intuitively explicit in comparison with the SMOTE over-sampling method.
As there are no accurate metrics to measure ensemble diversity, the validity remains uncertain with the increase in diversity by focusing on a specific manmade metric. However, diversity has been proved to be able to be increased by artificial sample disturbance, although we cannot measure it accurately. This fuzzy sampling method can generate diversity in the ensemble by introducing fuzzy artificial samples into model construction. The numbers of artificial samples are controlled by a fuzzy rate (). As the number of original samples is , the upper number limitation of artificial samples is . The specific process is shown in Algorithm 1.
| Algorithm 1 Artificial Sample Construction |
| Input: |
| : A fuzzy rate which controls the numbers of artificial samples () |
belongs to minority class:
|
3.2. Self-Adaptive Optimization
The optimization mechanism within the ensemble is a self-adaptive controlling method based on a simulation test. It focuses on balancing the individual accuracy while the diversity increases. Several data subsets are randomly selected from the original training set as a function of the validation of the ensemble generalization ability in order to stimulate the application environment under various circumstances. At each iteration, a simulation environment is randomly selected to test whether a base classifier is able to join the ensemble or train another one. The data subset in the simulation test is also obfuscated by the fuzzy sampling method with a parameter (Algorithm 1). These operations simulate the randomness of events in reality. The value of is used to simulate the complexity of a real data set, for the more diversity the environment contains, the more artificial samples need to be generated.
These scores are computed through a simulation test of the ensemble before and after adding a new base classifier. C represents the ensemble model before adding a new base classifier, and C + 1 represents the ensemble model after adding a new classifier. The formula indicates that the base classifier is accepted if the inequality holds.
3.3. The Algorithm of the SA-DP Model
The original data are input into the model as samples. The input parameter N represents the limitation on the numbers of base classifiers. Parameters and depend on the specific data set.
At each iteration, in order to construct a subset to train the base classifier for the ensemble, minority-class samples and majority-class samples are randomly extracted from the original data set. Then, a decision tree is trained by the training subset, and the simulation test is used to decide to add the decision tree to the ensemble model.
The composition of the training set plays a significant role when training a base classifier. A larger proportion of samples provides more valuable information about the class to which these samples belong. Based on this assumption, we designed the self-adaptive mechanism of SA-DP Forest. At iteration C, the size of the samples in the two classes of the training subset is controlled by the sampling ratio . equals to the division of and , which is computed at the previous iteration. At iteration C, the size of the real minority class in the training subset, which is extracted from the original minority class, is , where is the sample size of the minority class in the original data set. This illustrates that the higher is, the bigger is. Therefore, the minority samples extracted at iteration C become larger and make up a greater part of the training subset. Similarly, the size of the real majority class in the training subset extracted from the original majority class is . In order to integrate uncertainty into the training subset and improve the diversity within each individual classifier, the numbers of artificial samples controlled by are generated and added to the training subset before they are offered to train the individual classifier.
If the base classifier trained at iteration C is accepted, then is generated for iteration C + 1. Sampling rate is the key element of the self-adaptive adjustment. The specific process at each iteration is shown in Table 1. As a result, the balance of the classification accuracy in the two classes is adjusted self-adaptively, meanwhile adding diversity to the ensemble.
The algorithm of the SA-DP model is here stated in Algorithm 2.
| Algorithm 2 SA-DP Forest |
| Input: ●The training set X = ●N—The limitation of the base learning algorithm number ●Parameters and |
| BaseLearner(T)—Single decision tree trained by subset T C—The number of base classifiers in the ensemble model. (C = 1, 2, …, N) EC—The ensemble learning model in iteration C RC—The sampling ratio in iteration C T+—The samples in majority classes T−—The samples in minority classes |
| Randomly extract several subsets from T+ and T− respectively, then change the sample distribution by the fuzzy operation (Algorithm 1). These subsets are constructed as verification set (TV) for the simulation test. C = 0 = 1 Accuracy = 0 E0 = ϕ While C < N:
|
| Let = |
| C = C + 1 |
|
| = -BaseLearner(T). |
| Output: SA-DP Forest ensemble model |
To classify an unlabeled sample, the hard-voting technique is applied. Each base learner within the ensemble provides a result (i = 1, 2, …, C), = 1 or 0. The number of two classes, y+ = countif(), y− = countif(), is compared. The label of an unknown sample predicted by the ensemble learning model belongs to the majority one.
3.4. Operation Mechanism of SA-DP Forest
The diversity and accuracy of the ensemble system are usually opposite objects. An ensemble with high diversity may result in sacrificing the accuracy of the model. However, some preliminary ensemble algorithms consider maximizing the diversity and individual accuracy simultaneously by measuring proposed specific metrics which indicate diversity and accuracy. The effectiveness of these methods remains to be discussed. SA-DP Forest manages to increase diversity in imbalanced classification tasks in another way, and its effectiveness is illustrated below.
The self-adaptive optimization method is designed to control ensemble accuracy. The optimization mechanism considers the self-adaptive controlling method based on a simulation test. At each iteration of the simulation test, the size of the artificial samples in the two classes is indirectly controlled by sampling ratio R. During the process of the optimization method, the adjustment of the training set at later iterations makes up for the classification deficiency of the ensemble model at the previous iteration. As the samples in the simulation test contain fuzzy artificial samples, this self-adaptive optimization method could adaptively improve ensemble accuracy when proposing the diversity-promotion method.
The fuzzy sampling technique that generates the synthetic samples is the most important diversity-promotion method within the novel ensemble. This fuzzy sampling method generates artificial samples which contain a certain randomness. Additionally, the design of SA-DP Forest focuses on improving the diversity of the base classifier. The design of diversity promotion in this research study is as follows:
- (a)
- Decision tree is a classifier which is sensitive to the differences in input training samples;
- (b)
- The model randomly extracts sample subsets at each iteration and randomly extracts a feature subset in order to form the training data subset;
- (c)
- Artificial samples are generated based on the fuzzy sampling method. The artificial samples obtain more diversity and uncertainty according to the fuzzy operation. The artificial samples can directly create diverse hypotheses while training the proposed model;
- (d)
- The training subsets are extracted from the original data before building the model to simulate the diversity under real circumstances. The fuzzy artificial data are also introduced in the simulation test. Each of the verification sets has a different composition and distribution, so that they can diversify the applicable data distribution of each decision tree and diversify the base classifier.
4. Experimental Design
4.1. Data Set Description
In order to test the performance of our proposed algorithm on imbalanced data, and to ensure the reliability and availability of our proposed algorithm, we applied SA-DP Forest to the credit-risk data of Germany, Taiwan and China. The Chinese SME data set was obtained from Choice Financial Terminal, and the other data sets were obtained from UCI data sets. In the Chinese SME data set, the Chinese authorities marked some companies with ‘ST’ and ‘*ST’, which alert market investors of their financial distress. We defined all these companies as being at a high-risk level, while the others remained at a low level of credit risk. The overall information of all these data sets is given in Table 2 with the numbers of samples, features, classes and original imbalanced ratio (IR). As credit-risk evaluation is a binary classification task, the labels of the samples were all divided into two classes. Three of them were originally imbalanced. As world economic activities greatly deviated from normal due to the COVID-19 pandemic, the credit data of Chinese SMEs in 2020 and 2021 were not considered in the study.
The features for Chinese SMEs had to be selected in our experiment. According to previous studies and the international standard, this study selected several original features regarding four aspects: profitability, solvency, operating ability and growth ability (Table 3). Profitability means the ability of an enterprise to use current resources in order to create profits. Solvency represents the debt-paying situation of the enterprise in the previous periods, so that it can reflect its credit status. Operating ability indicates the operating efficiency of an enterprise, mainly referring to the efficiency and benefit of its operating assets. Growth ability reflects the speed of enterprise development and the expectations for the future.
We also selected seven imbalanced binary data sets from the KEEL repository to illustrate that SA-DP Forest is not limited to credit-risk evaluation, but that it also performs well in other imbalanced classification situations. The overall information of all these data sets is given in Table 4.
Additionally, credit-risk data sets with different imbalanced ratios were also adopted in the experiment. We resampled the data sets of German credit in order to construct a series of experimental training sets with different imbalance ratios. As it is shown in Table 5, by randomly dropping samples from the minority class, we constructed 28 imbalanced training sets with different imbalance ratios. Therefore, the simulated circumstances ranged from being slightly imbalanced to extremely imbalanced.
4.2. Data Pre-Processing
Before the experiments, we pre-processed the original data sets. Firstly, regarding the Chinese SME data set obtained from the real market, there were missing values in some features. Except for the missing values of the interest protection multiple, which were large, the missing values of the other features were all below 20. Therefore, the mean-value filling method was used to fill in the eigenvalues that were very small. Since the interest guarantee multiple is an important feature to measure the long-term solvency of an enterprise and is important for credit-risk evaluation, the missing value of this feature was filled with the missing forest method. Additionally, there were no missing values in other imbalanced data sets obtained from the UCI and KEEL repositories.
As the original data of the features were different from each other by having different sizes of numeric ranges, those with larger numeric ranges may have had a larger impact on the target value. Data standardization was applied to alter the data in different features into same scale. The original data were transformed by the following formula (: mean, : std) into the new :
4.3. Performance Evaluation
The assessment of the model proposed in this experiment was evaluated by certain measures of performance. The description of these measures is explained by the confusion matrix presented in Table 6.
The different parts of the confusion matrix can be described as follows in terms of class prediction:
- TP: Actual instances with bad credit that are predicted as bad;
- FN: Actual instances with bad credit that are predicted as good;
- FP: Actual instances with good credit that are predicted as bad;
- TN: Actual instances with good credit that are predicted as good.
According to the above explanation, four types of measures were chosen, that is, accuracy, recall, G-mean and AUC. Some of them are calculated below:
Accuracy was considered as the ratio of a model’s correct prediction among the total number of instances. Recall was considered as the ratio of a model’s correct prediction among the total number of instances with bad credit. G-mean was considered as the average value of the correct prediction rate among enterprises with bad credit and the counterparts of enterprises with good credit. AUC, which measures the area under the ROC curve, was introduced to provide a quantitative measure of a classifier’s performance for the evaluation of which model was better.
We also used the kappa coefficient to evaluate the diversity between the two individual classifiers and , while the average error was also computed to form a kappa-error graph. refers to the accuracy rate of the individual classifier on the test data. Meanwhile, the following metrics are the average kappa coefficient and average error of the total ensemble, respectively, where N is the number of individual classifiers:
4.4. Experiment Design
An empirical study was conducted to validate the performance of AB-DP Forest. The experiments were conducted using Python software, version 3.8. To illustrate the performance of the proposed method, six ensemble methods for imbalanced classification tasks were compared in our experiments, and their differences are listed in Table 7.
We set the initial ensemble size as 50 individual decision trees within these proposed models, which then remained unchanged in Observations 1–3. A five-fold CV was adopted to divide the data sets into training parts and testing parts. The training parts were used to learn the classifiers. The testing parts were used to calculate the evaluation metrics mentioned above. Then, the experiment on these data sets was carried out. There were three main observations. The details are presented as follows:
Observation 1: This research study first ran the models on the three credit data sets. This was performed to verify the robustness of the model on different credit-risk applications. Seven other imbalanced data sets were provided for expanding the applications to various imbalanced classification tasks. Then, the evaluation metrics were proposed to show the performance of these models.
Observation 2: An observation was made on the internal structure of the ensemble. As diversity promotion is the key of our proposed model, a kappa-error diagram was applied to demonstrate the diversity versus error between base classifiers. The average kappa coefficient and average error were computed for the seven algorithms on the three credit data sets.
Observation 3: The research study resampled the German credit training set in order to construct a series of experimental training sets with different imbalance ratios. The performance of each algorithm was analyzed under different circumstances of credit-risk evaluation. The curve, according to the evaluation metrics, was then drawn.
5. Experimental Analysis
5.1. Observation 1: Performance on Different Data Sets
The ensemble model we propose was designed for imbalanced classification tasks, especially credit-risk evaluation. In this section, we first discuss the results on credit-risk data sets.
As SA-DP achieves a better diversity, it seems to have an edge over the other multi-stage integrated methods and ensemble classifiers mentioned above. In the case of credit-risk evaluation, the experiment was conducted on the German credit data set, the Taiwanese bankruptcy data set and the Chinese SME data set. For each data set, five-fold stratified cross validation was used to divide the data sets into training parts and testing parts for evaluating the performance of each method. The accuracy, recall, G-mean and AUC on total validation set were applied for these measurements. The experiment results are summarized in Table 8, where we present the prediction among the credit data sets, which provides us with a clear illustration of the models’ classifying ability for each class. Furthermore, the results of the classifier on other imbalanced learning data sets are presented in Table 9.
The experiment on all data sets showed that the improvement exerted on the ensemble model’s performance is not absolute, but depends on the variety of different data sets. For each measure, the best algorithm among the seven methods is shown in bold-face type. Table 8 illustrates the outstanding performance of our proposed model on the credit-risk data sets.
As Table 8 shows, SA-DP achieved the highest result according to the AUC on the three credit data sets. Accuracy and G-mean reflect the performance of the whole model on both the minority class and the majority class. According to both metrics, SA-DP achieved the highest result on the German credit data set and the Taiwanese bankruptcy data set, while the Chinese SME data set came in second place. Recall represents the prediction accuracy of customers with bad credit. The ensemble models generally achieved a better recall than the models without sample-balance methods (RF) or models that balance the data set in a pre-processing stage (SRF). SA-DP achieved the highest recall on the Chinese SME data set and the German credit data set. EasyEnsemble achieved the best result in the Taiwanese bankruptcy data set, while SA-DP Forest came in second place. Additionally, it is also worth pointing out that the SA-DP Forest we propose in this paper provided significant better performance than SMOTEBoost (SB). Both SMOTEBoost and SA-DP Forest adopt synthetic neighborhoods in their ensemble procedure, but the artificial samples in SMOTEBoost are composed by synthetic samples generated by SMOTE. This result illustrates that our proposed fuzzy sampling method within the ensemble can lead to a great promotion of model performance.
As Table 9 shows, we only propose an imbalanced ensemble method for these seven data sets. The table illustrates that SA-DP Forest maintained a good performance on different applications. As it achieved the best AUC in four of the seven data sets, it verified its relative superiority in generalization ability compared with the other four imbalanced ensemble methods. Moreover, as for the accuracy and G-mean, we can observe that the proposed SA-DP showed better performance. In addition, ensemble models such as RUSBoost and SMOTEBoost performed well on originally highly-imbalanced data sets, while ensemble models such as BalancedRandomForest and EasyEnsemble preferred data sets that were more balanced. Although SA-DP Forest did not always maintain the best performance when applied to various imbalanced data sets, it is still competitive with other algorithms. The results show that the use of SA-DP Forest may be worth expanding to a wider range of application scenarios.
These results suggest that SA-DP Forest is more competitive in predicting customers with credit risk when imbalanced information is provided. The superiority of our method over the other comparative algorithms confirms that utilizing a diversity-promotion method and balancing the accuracy can bring more benefits than other ensemble techniques in imbalanced credit-risk evaluation.
5.2. Observation 2: Diversity and Accuracy
The SA-DP Forest we designed is based on the claim that diversity is critical for an ensemble model. This can lead to better results in imbalanced classification tasks such as credit-risk evaluation.
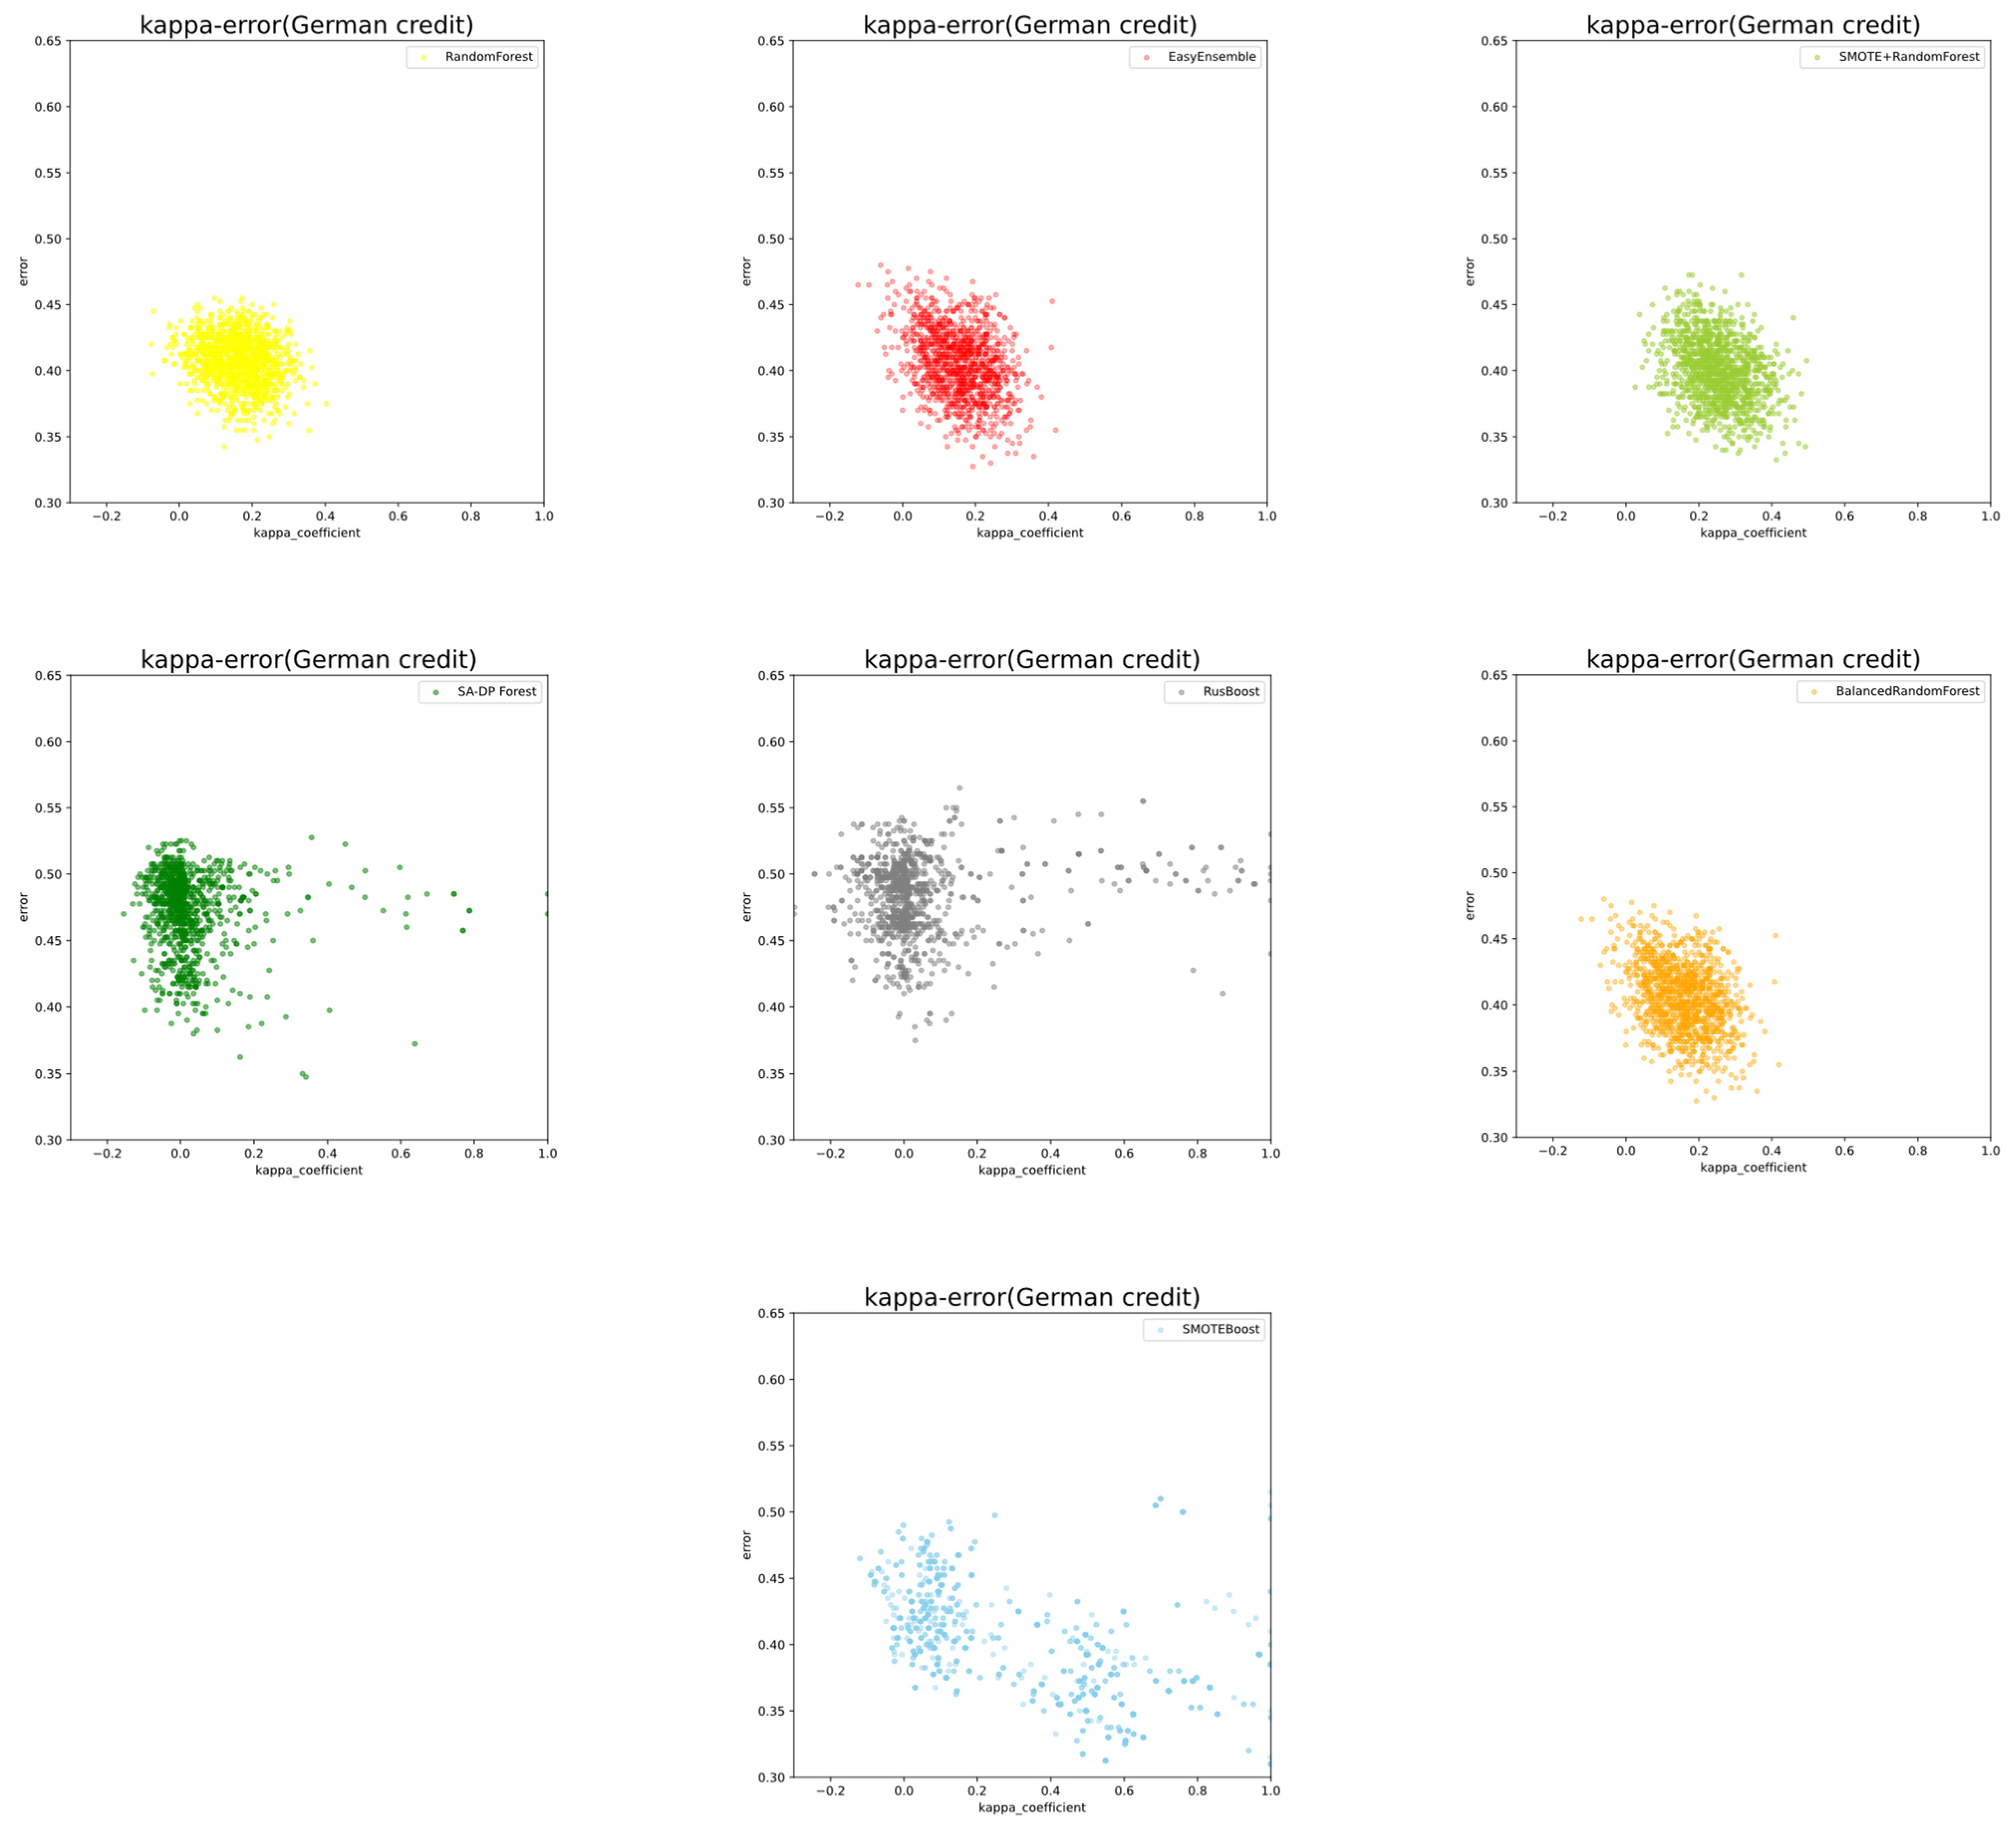
We attempted to validate this by measuring the similarity between two base classifiers and their average generalization error. The kappa-error graph was applied to reinforce our claim. The y-axis represents the average generalization error between two base classifiers, and the x-axis represents the kappa coefficient between them. The kappa coefficient is a traditional statistic first used by Margineantu and Dietterich to measure the diversity between two classifiers. The kappa coefficient generally lies in [−1,1], and the bigger the kappa coefficient is, the greater the diversity between the two classifiers. For instance, the kappa coefficient is 1 if the predictions of the two classifiers are exactly the same. Moreover, if it is 0, the predictions of the two classifiers are completely independent. Additionally, if the kappa coefficient is less than 0, it represents the circumstances whereby the number of consensuses reached between the two classifiers is less than the expected number when the classification is totally random.
The experimental results are given by the scatter plot in Figure 2. We compared the kappa-error diagrams with the seven models. As it is shown, SA-DP Forest and RUSBoost obtained the value of the scatter on the x-axis direction on the diagrams much closer to 0 than the other five ensemble models. This illustrates that the individual classifiers inside the ensemble structure were more independent than the other five ensemble models on the proposed data sets. Meanwhile, the average error of SA-DP Forest was lower than that of RUSBoost, and this may lead to the superiority of our proposed model compared with RUSBoost.
To further analyze the details of the ensemble structure, we quantitively studied the average kappa coefficient and average error of the seven algorithms. The computation of these two metrics is shown in Section 4.3. After summarizing, we gained the main information of the kappa-error diagrams as shown in Table 10.
As it is shown, SA-DP achieved the highest average kappa coefficient on the German credit data set and the Taiwanese bankruptcy data sets. There was a slight difference between SA-DP and RUSBoost, but this was a significant gap compared with other algorithms. As shown above, SA-DP effectively improved ensemble diversity, while diversity within the other five ensemble models was lower. Furthermore, we compared the average accuracy of SA-DP and the comparative ensemble models in the three data sets. However, as the table indicates, the value of the average error of SA-DP was higher than some of the other ensemble models. This means that the classification accuracy of each base classifier in SA-DP may be worse than some comparative methods. This result occurred with all the data sets. The average error of SA-DP Forest was lower than that of RUSBoost, meaning that its performance was better than that of RUSBoost. In addition, the average error of EasyEnsemble was the lowest. However, its average kappa coefficient was high, which means a high correlation within the individual classifiers. Its outstanding performance on individual accuracy helped the entire ensemble model achieve a better performance. Although SA-DP Forest is not optimal in either of the two indicators, the total classification ability of SA-DP was better than that of the other methods we have verified. This illustrates that individual accuracy and ensemble diversity are opposite and crucial for the ensemble to reach equilibrium. The results illustrate that our design of an ensemble structure which manages to improve ensemble diversity as well as balancing individual accuracy is effective.
5.3. Observation 3: Data Sets with Different Imbalance Ratios
The influence of the imbalance ratio plays a significant role in building a classifier. To determine how the ensemble model’s performance changed according to the different imbalance ratios of the training data, we ran the following experiment by increasing the imbalance ratio. The imbalance ratio is defined as the ratio of the number of samples in the majority class to that of samples in the minority class. The bigger the imbalance ratio is, the more serious the imbalance of the data in the training set. German credit was chosen as the experimental data set, for the number of samples in both the majority and minority classes was sufficient for artificially constructing a training set with different imbalance ratios. We intentionally increased the imbalance ratio of the training set by randomly dropping samples from the minority class until a certain imbalance ratio was reached. As a result, 28 training sets with imbalance ratios from 3:1 to 30:1 were constructed and applied in this experiment. For instance, when the imbalance ratio was 30:1, the number of samples in the minority class contained in the training set was 20.
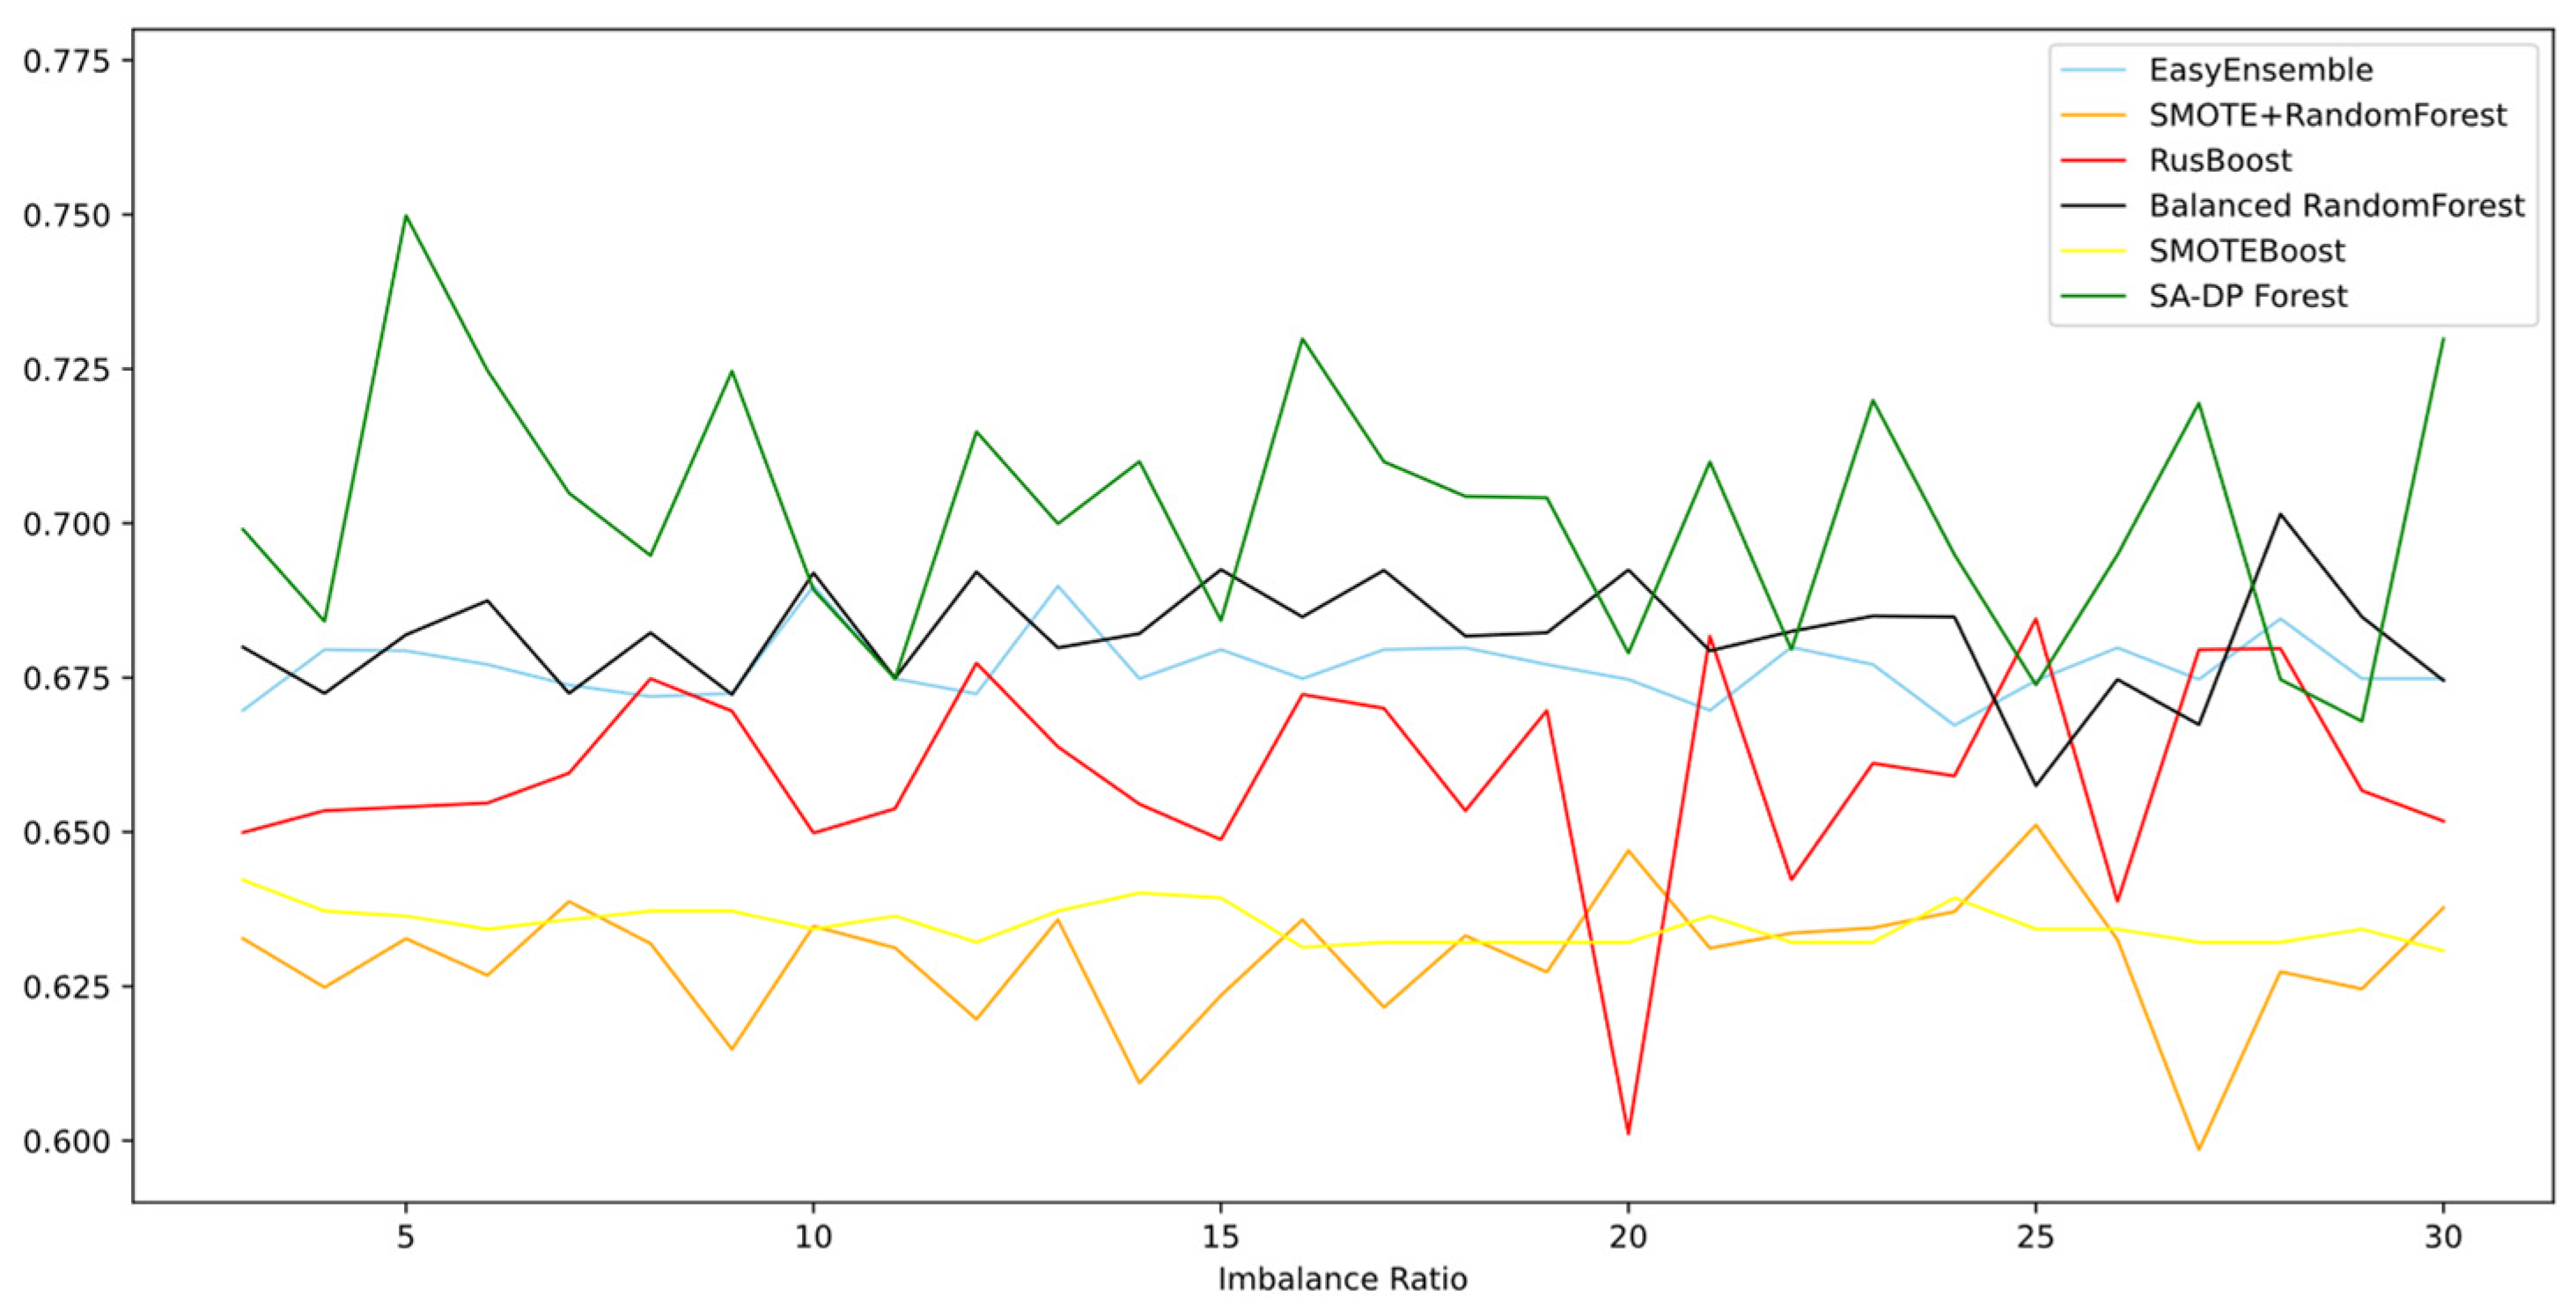
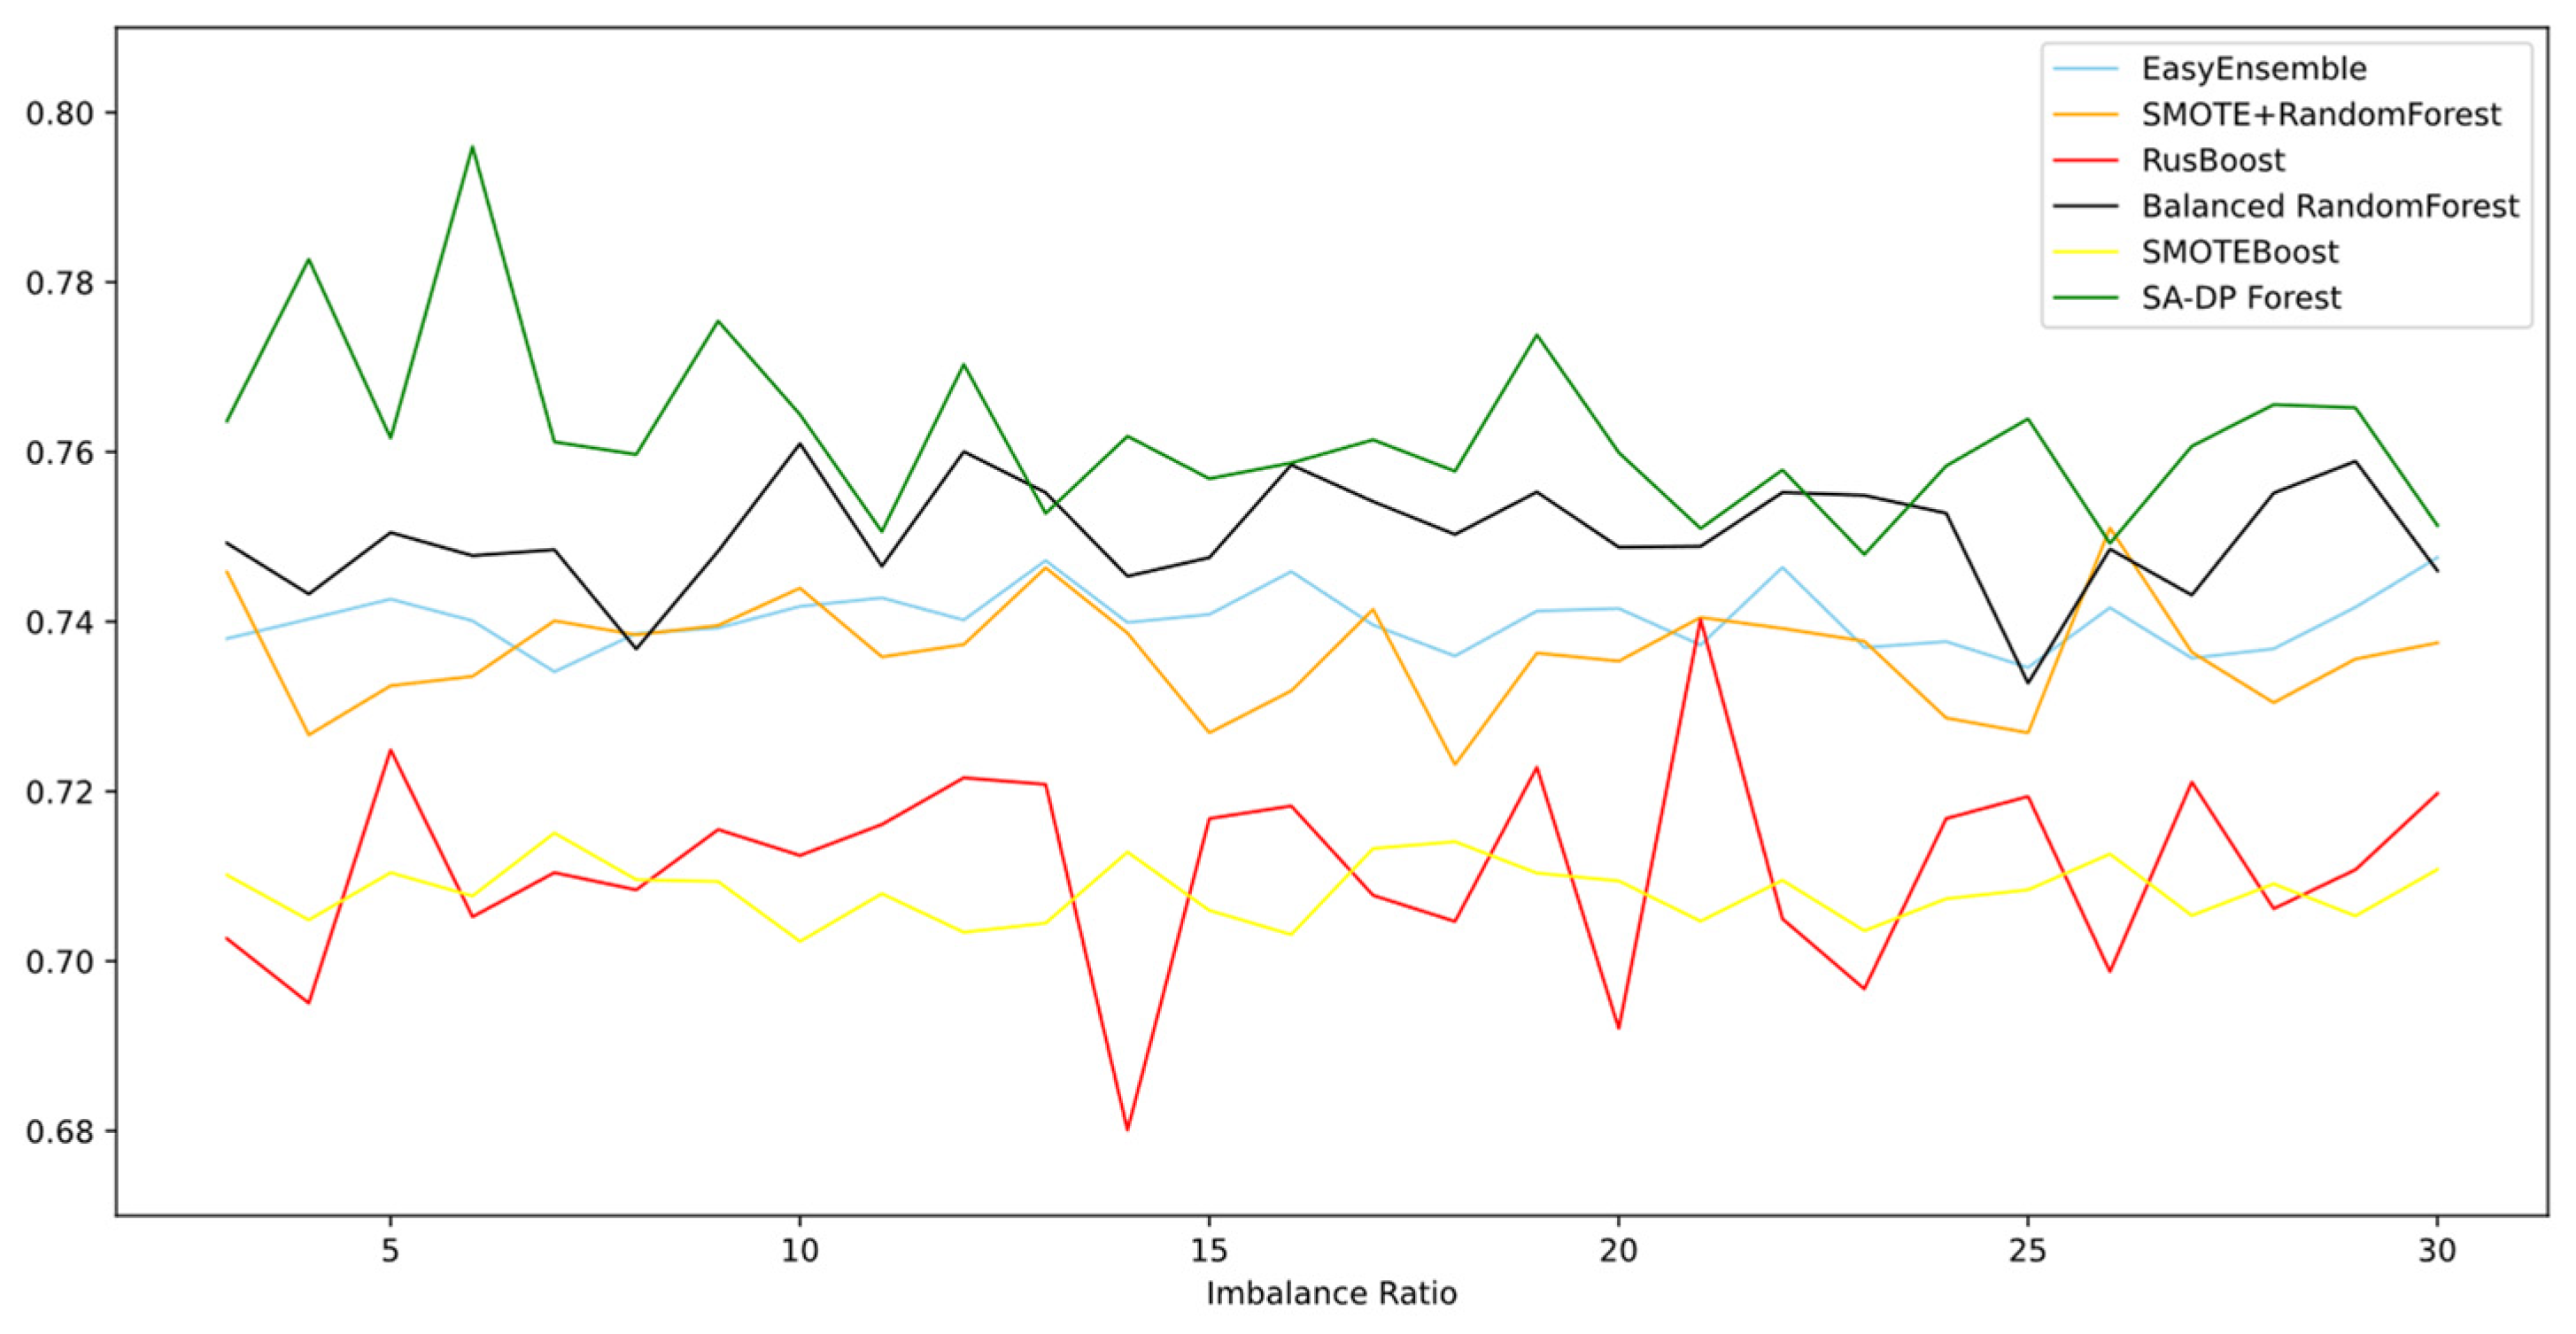
Figure 3 and Figure 4 show the G-mean and AUC of the models according to different imbalance ratios, respectively. There were five comparative methods included in this experiment, for they are all imbalanced learning techniques. Five of them were affected by the increase in the imbalanced ratio to a greater or lesser degree, but the curve did not show a notable decline in either measure—G-mean or AUC. SA-DP Forest achieved the highest performance and remained in first place as the imbalanced ratio increased. The figures of both G-mean and AUC indicate that SA-DP Forest maintained its accuracy and robustness simultaneously, even with less training information of the minority class being provided. We suppose that this depends on the self-optimization technique we used and the artificial samples we generated. The BalancedRandomForest and EasyEnsemble methods were obviously higher than the RUSBoost and SMOTEBoost algorithms, according to both metrics. These four algorithms, the strategies of which are based on ensemble modeling, achieved a higher G-mean than SMOTE+RandomForest. In Figure 4 (AUC), it can be seen that SMOTE + RandomForest achieved a higher result than RUSBoost and SMOTEBoost. Compared with basic ensemble learning algorithms, these sampling techniques applied in the stage of data pre-processing before ensemble modeling did improve the classification ability on the minority class, according to the figure.
However, the curves of SA-DP Forest and RUSBoost fluctuated more than those of the other four algorithms and were unstable. The same occurred with the AUC metric. We analyzed the uncertainty included in the model construction. As borderline-fuzzy sample generation and simulation tests all largely depend on randomness, the method to balance diversity and accuracy in SA-DP Forest might not be as stable as that of the other comparative algorithms.
Though it may lead to a slight decrease in the model’s robustness, the total generalization ability under various credit-risk evaluation circumstances was better on average. Therefore, the experiment illustrated that SA-DP Forest was more suitable for the task using extremely imbalanced data while evaluating credit risk as the cost of misclassification.
6. Conclusions
This paper presents an ensemble method for imbalanced learning tasks where only an extremely imbalanced data set is available. We introduce the diversity-promotion method for imbalanced learning while using an ensemble model and simultaneously balancing the individual accuracy. The proposed method performed better under circumstances of data set imbalanced distribution than comparative ensemble models and imbalanced learning methods.
SA-DP Forest was designed based on the diversity-promotion method and the self-optimization technique. Firstly, artificially constructed borderline-fuzzy data enlarged the minority class based on a fuzzy sampling technique, which promoted ensemble diversity as well as addressing imbalanced classification problems. Meanwhile, a simulation test and an adaptive ratio were applied to the self-optimization mechanism, which can control the number of artificial data generated in the current iteration based on the parameters from the last iteration. Several fuzzy subsets were randomly drawn from the training data and used to optimize the individual accuracy while increasing the diversity.
An empirical study was conducted to validate the performance of SA-DP Forest. This research study ran SA-DP Forest with six other comparative models on three credit evaluation data sets, including German credit, Chinese SMEs and Taiwanese credit. The comparative analysis was also applied on seven other imbalanced data sets. Moreover, the research study resampled the German credit data set in order to construct experimental data with different imbalance ratios. The curve was then drawn to measure the performance of the models.
Although the new method provides an illuminating insight in ensemble learning, the precise interpretation of ensemble diversity remains an unsolved mystery. Whether it can be defined by an explicit definition or can only be comprehended intuitively still needs to be discussed. In future research, ensemble diversity needs to be further analyzed. Moreover, the theoretic interpretation of randomness in SA-DP Forest and diversity also needs to be improved in the future. Additionally, as a limitation, this paper focuses solely on binary classification tasks, which are the main character of credit-risk evaluation. This new method needs to be applied to multi-class classification tasks and relevant experiments need to be designed in an appropriate way in future research.
In conclusion, the proposed SA-DP Forest effectively improves diversity by applying the fuzzy sampling method while balancing individual accuracy as well. It obtained a better performance than the comparative ensemble learning algorithms in our experiment. This not only illustrates the outstanding performance of our model in handling imbalanced classification tasks but also provides an insight in considering a diversity-promotion method while applying ensemble models to cases that have data with extreme imbalanced ratios, such as credit-risk evaluation.
Author Contributions
Conceptualization, Y.G.; Data curation, Z.P.; Methodology, Y.G.; Resources, Z.P.; Software, Y.G. and H.L.; Supervision, W.L.; Visualization, Z.P.; Writing—original draft, J.M., Z.P. and H.L.; Writing—review & editing, W.L. All authors have read and agreed to the published version of the manuscript.
Funding
Project 202110145072 Supported by National Training Program of Innovation and Entrepreneurship for Undergraduates; Project 72171041 Supported by National Natural Science Foundation of China; Project 72171040 Supported by National Natural Science Foundation of China.
Institutional Review Board Statement
Not applicable.
Informed Consent Statement
Not applicable.
Data Availability Statement
Publicly available datasets were analyzed in this study. This data can be found here: KEEL: A software tool to assess evolutionary algorithms for Data Mining problems (regression, classification, clustering, pattern mining and so on) (ugr.es), UCI Machine Learning Repository: Taiwanese Bankruptcy Prediction Data Set, UCI Machine Learning Repository: Statlog (German Credit Data) Data Set, CSMAR (gtarsc.com).
Conflicts of Interest
The authors declare no conflict of interest.
References
- Hung, C.; Chen, J.-H. A selective ensemble based on expected probabilities for bankruptcy prediction. Expert Syst. Appl. 2009, 36, 5297–5303. [Google Scholar] [CrossRef]
- Lessmann, S.; Baesens, B.; Seow, H.-V.; Thomas, L.C. Benchmarking state-of-the-art classification algorithms for credit scoring: An update of research. Eur. J. Oper. Res. 2015, 247, 124–136. [Google Scholar] [CrossRef] [Green Version]
- Dastile, X.; Celik, T.; Potsane, M. Statistical and machine learning models in credit scoring: A systematic literature survey. Appl. Soft Comput. 2020, 91, 106263. [Google Scholar] [CrossRef]
- Chen, C.; Liaw, A.; Brieman, L. Using Random Forest to Learn Imbalanced Data; Technical Report No. 666; University of California: Berkley, CA, USA, 2004; Volume 110. [Google Scholar]
- Dietterich, T.G. Ensemble methods in machine learning. In Multiple Classifier Systems; Lecture Notes in Computer Science (Including Subseries Lecture Notes in Artificial Intelligence and Lecture Notes in Bioinformatics); Springer Science + Business Media: Berlin, Germany, 2000; Volume 1857, pp. 1–15. [Google Scholar] [CrossRef] [Green Version]
- Kuncheva, L.; Whitaker, C.J. Measures of Diversity in Classifier Ensembles and Their Relationship with the Ensemble Accuracy. Mach. Learn. 2003, 51, 181–207. [Google Scholar] [CrossRef]
- Wang, G.; Hao, J.; Ma, J.; Jiang, H. A comparative assessment of ensemble learning for credit scoring. Expert Syst. Appl. 2011, 38, 223–230. [Google Scholar] [CrossRef]
- Zięba, M.; Tomczak, S.K.; Tomczak, J.M. Ensemble boosted trees with synthetic features generation in application to bankruptcy prediction. Expert Syst. Appl. 2016, 58, 93–101. [Google Scholar] [CrossRef]
- He, H.; Zhang, W.; Zhang, S. A novel ensemble method for credit scoring: Adaption of different imbalance ratios. Expert Syst. Appl. 2018, 98, 105–117. [Google Scholar] [CrossRef]
- Eletter, S.F.; Yaseen, S.G.; Elrefae, G.A. Neuro-Based Artificial Intelligence Model for Loan Decisions. Am. J. Econ. Bus. Adm. 2010, 2, 27–34. [Google Scholar] [CrossRef]
- Koutanaei, F.N.; Sajedi, H.; Khanbabaei, M. A hybrid data mining model of feature selection algorithms and ensemble learning classifiers for credit scoring. J. Retail. Consum. Serv. 2015, 27, 11–23. [Google Scholar] [CrossRef]
- Jadhav, S.; He, H.; Jenkins, K. Information gain directed genetic algorithm wrapper feature selection for credit rating. Appl. Soft Comput. 2018, 69, 541–553. [Google Scholar] [CrossRef] [Green Version]
- Nalić, J.; Martinović, G.; Žagar, D. New hybrid data mining model for credit scoring based on feature selection algorithm and ensemble classifiers. Adv. Eng. Inform. 2020, 45, 101130. [Google Scholar] [CrossRef]
- Merentitis, A.; Debes, C.; Heremans, R. Ensemble Learning in Hyperspectral Image Classification: Toward Selecting a Favorable Bias-Variance Tradeoff. IEEE J. Sel. Top. Appl. Earth Obs. Remote Sens. 2014, 7, 1089–1102. [Google Scholar] [CrossRef]
- Kuncheva, L. A Bound on Kappa-Error Diagrams for Analysis of Classifier Ensembles. IEEE Trans. Knowl. Data Eng. 2011, 25, 494–501. [Google Scholar] [CrossRef]
- Tang, E.K.; Suganthan, P.N.; Yao, X. An analysis of diversity measures. Mach. Learn. 2006, 65, 247–271. [Google Scholar] [CrossRef] [Green Version]
- Dietterich, T.G. An Experimental Comparison of Three Methods for Constructing Ensembles of Decision Trees: Bagging, Boosting, and Randomization. Mach. Learn. 2000, 40, 139–157. [Google Scholar] [CrossRef]
- Freund, Y.; Schapire, R.E. A Decision-Theoretic Generalization of On-Line Learning and an Application to Boosting. J. Comput. Syst. Sci. 1997, 55, 119–139. [Google Scholar] [CrossRef] [Green Version]
- Breiman, L. Bagging predictors. Mach. Learn. 1996, 24, 123–140. [Google Scholar] [CrossRef] [Green Version]
- Breiman, L. Random forests. Mach. Learn. 2001, 45, 5–32. [Google Scholar] [CrossRef] [Green Version]
- Geurts, P.; Ernst, D.; Wehenkel, L. Extremely randomized trees. Mach. Learn. 2006, 63, 3–42. [Google Scholar] [CrossRef] [Green Version]
- JRodríguez, J.J.; Kuncheva, L.; Alonso, C.J. Rotation Forest: A New Classifier Ensemble Method. IEEE Trans. Pattern Anal. Mach. Intell. 2006, 28, 1619–1630. [Google Scholar] [CrossRef]
- JMaudes, J.; Rodríguez, J.J.; García-Osorio, C.; García-Pedrajas, N. Random feature weights for decision tree ensemble construction. Inf. Fusion 2012, 13, 20–30. [Google Scholar] [CrossRef]
- Hu, Q.; Li, L.; Wu, X.; Schaefer, G.; Yu, D. Exploiting diversity for optimizing margin distribution in ensemble learning. Knowl. Based Syst. 2014, 67, 90–104. [Google Scholar] [CrossRef] [Green Version]
- Melville, P.; Mooney, R.J. Creating diversity in ensembles using artificial data. Inf. Fusion 2005, 6, 99–111. [Google Scholar] [CrossRef]
- Zhang, M.-L.; Zhou, Z.-H. Exploiting unlabeled data to enhance ensemble diversity. Data Min. Knowl. Discov. 2013, 26, 98–129. [Google Scholar] [CrossRef] [Green Version]
- Mao, S.; Chen, J.-W.; Jiao, L.; Gou, S.; Wang, R. Maximizing diversity by transformed ensemble learning. Appl. Soft Comput. 2019, 82, 105580. [Google Scholar] [CrossRef]
- Mao, S.; Lin, W.; Jiao, L.; Gou, S.; Chen, J.-W. End-to-End Ensemble Learning by Exploiting the Correlation Between Individuals and Weights. IEEE Trans. Cybern. 2021, 51, 2835–2846. [Google Scholar] [CrossRef] [PubMed]
- Shiue, Y.-R.; You, G.-R.; Su, C.-T.; Chen, H. Balancing accuracy and diversity in ensemble learning using a two-phase artificial bee colony approach. Appl. Soft Comput. 2021, 105, 107212. [Google Scholar] [CrossRef]
- Loyola-González, O.; Martinez-Trinidad, J.F.; Carrasco-Ochoa, J.A.; García-Borroto, M. Study of the impact of resampling methods for contrast pattern based classifiers in imbalanced databases. Neurocomputing 2016, 175, 935–947. [Google Scholar] [CrossRef]
- Galar, M.; Fernandez, A.; Barrenechea, E.; Bustince, H.; Herrera, F. A Review on Ensembles for the Class Imbalance Problem: Bagging-, Boosting-, and Hybrid-Based Approaches. IEEE Trans. Syst. Man Cybern. Part C Appl. Rev. 2012, 42, 463–484. [Google Scholar] [CrossRef]
- Krawczyk, B.; Wozniak, M.; Schaefer, G. Cost-sensitive decision tree ensembles for effective imbalanced classification. Appl. Soft Comput. 2014, 14, 554–562. [Google Scholar] [CrossRef] [Green Version]
- Napierala, K.; Stefanowski, J. Types of minority class examples and their influence on learning classifiers from imbalanced data. J. Intell. Inf. Syst. 2016, 46, 563–597. [Google Scholar] [CrossRef]
- Haixiang, G.; Yijing, L.; Shang, J.; Mingyun, G.; Yuanyue, H.; Bing, G. Learning from class-imbalanced data: Review of methods and applications. Expert Syst. Appl. 2017, 73, 220–239. [Google Scholar] [CrossRef]
- Chawla, N.V.; Bowyer, K.W.; Hall, L.O.; Kegelmeyer, W.P. SMOTE: Synthetic Minority Over-sampling Technique. J. Artif. Intell. Res. 2002, 16, 321–357. [Google Scholar] [CrossRef]
- Li, J.; Liu, L.-S.; Fong, S.; Wong, R.K.; Mohammed, S.; Fiaidhi, J.; Sung, Y.; Wong, K.K.L. Adaptive Swarm Balancing Algorithms for rare-event prediction in imbalanced healthcare data. PLoS ONE 2017, 12, e0180830. [Google Scholar] [CrossRef] [PubMed] [Green Version]
- Shen, F.; Zhao, X.; Li, Z.; Li, K.; Meng, Z. A novel ensemble classification model based on neural networks and a classifier optimisation technique for imbalanced credit risk evaluation. Phys. A Stat. Mech. Its Appl. 2019, 526, 121073. [Google Scholar] [CrossRef]
- Yun, J.; Ha, J.; Lee, J.-S. Automatic Determination of Neighborhood Size in SMOTE. In Proceedings of the 10th International Conference on Ubiquitous Information Management and Communication, Da Nang, Vietnam, 4–6 January 2016; pp. 1–10. [Google Scholar] [CrossRef]
- Han, H.; Wang, W.Y.; Mao, B.H. Borderline-SMOTE: A new over-sampling method in imbalanced data sets learning. In Advances in Intelligent Computing, Proceedings of the International Conference on Intelligent Computing, Hefei, China, 23–26 August 2005; Springer: Berlin/Heidelberg, Germany, 2005; pp. 878–887. [Google Scholar] [CrossRef]
- Niu, K.; Zhang, Z.; Liu, Y.; Li, R. Resampling ensemble model based on data distribution for imbalanced credit risk evaluation in P2P lending. Inf. Sci. 2020, 536, 120–134. [Google Scholar] [CrossRef]
- Li, D.-C.; Liu, C.-W.; Hu, S.C. A learning method for the class imbalance problem with medical data sets. Comput. Biol. Med. 2010, 40, 509–518. [Google Scholar] [CrossRef] [PubMed]
- Ramentol, E.; Caballero, Y.; Bello, R.; Herrera, F. SMOTE-RSB: A hybrid preprocessing approach based on oversampling and undersampling for high imbalanced data-sets using SMOTE and rough sets theory. Knowl. Inf. Syst. 2012, 33, 245–265. [Google Scholar] [CrossRef]
- Nekooeimehr, I.; Lai-Yuen, S.K. Adaptive semi-unsupervised weighted oversampling (A-SUWO) for imbalanced datasets. Expert Syst. Appl. 2016, 46, 405–416. [Google Scholar] [CrossRef]
- Liu, X.-Y.; Wu, J.; Zhou, Z.-H. Exploratory Undersampling for Class-Imbalance Learning. IEEE Trans. Syst. Man Cybern. Part B 2009, 39, 539–550. [Google Scholar] [CrossRef]
- Seiffert, C.; Khoshgoftaar, T.M.; Van Hulse, J.; Napolitano, A. RUSBoost: A Hybrid Approach to Alleviating Class Imbalance. IEEE Trans. Syst. Man Cybern. Part A Syst. Hum. 2010, 40, 185–197. [Google Scholar] [CrossRef]
- Sun, Z.; Song, Q.; Zhu, X.; Sun, H.; Xu, B.; Zhou, Y. A novel ensemble method for classifying imbalanced data. Pattern Recognit. 2015, 48, 1623–1637. [Google Scholar] [CrossRef]
- Yu, L.; Zhou, R.; Tang, L.; Chen, R. A DBN-based resampling SVM ensemble learning paradigm for credit classification with imbalanced data. Appl. Soft Comput. 2018, 69, 192–202. [Google Scholar] [CrossRef]
- Sun, J.; Lang, J.; Fujita, H.; Li, H. Imbalanced enterprise credit evaluation with DTE-SBD: Decision tree ensemble based on SMOTE and bagging with differentiated sampling rates. Inf. Sci. 2018, 425, 76–91. [Google Scholar] [CrossRef]
- Junior, L.M.; Nardini, F.M.; Renso, C.; Trani, R.; Macedo, J.A. A novel approach to define the local region of dynamic selection techniques in imbalanced credit scoring problems. Expert Syst. Appl. 2020, 152, 113351. [Google Scholar] [CrossRef]
- Xie, Y.; Li, X.; Ngai, E.W.; Ying, W. Customer churn prediction using improved balanced random forests. Expert Syst. Appl. 2009, 36, 5445–5449. [Google Scholar] [CrossRef]
Figure 1.
Visualization of resampling based on SMOTE and the fuzzy sampling method.

Figure 2.
Kappa error of the German credit data set.

Figure 3.
G-mean according to different imbalance ratios (German credit).

Figure 4.
AUC according to different imbalance ratios (German credit).


Table 1.
The real sample number at each iteration.
| Iteration Number | Real Minority Sample Size | Real Majority Sample Size | R () |
|---|---|---|---|
| 1 | |||
| 2 | |||
| … | … | … | … |
| C |
Table 2.
Information of credit data sets.
| Experiment Data (Credit Risk Evaluation) | Numbers | IR | ||
|---|---|---|---|---|
| Features | Classes | Samples | ||
| German | 20 | 2 | 1000 | 2.33 |
| Chinese SMEs | 20 | 2 | 1000 | 13.08 |
| Taiwanese Bankruptcy | 95 | 2 | 6819 | 29.99 |
Table 3.
Features.
| Num. | First Level | Second Level |
|---|---|---|
| 1 | Solvency | Current ratio |
| 2 | Quick action ratio | |
| 3 | Cash ratio | |
| 4 | Net assets debts ratio | |
| 5 | Equity ratio | |
| 6 | Interest coverage ratio | |
| 7 | Profitability | Return on equity |
| 8 | Net profit margin on sales | |
| 9 | Return on total assets ratio | |
| 10 | Ratio of profits to cost and expense | |
| 11 | Net interest rate on total assets | |
| 12 | Net operating interest rate | |
| 13 | Operating ability | Inventory turnover ratio |
| 14 | Total assets turnover | |
| 15 | Receivables turnover ratio | |
| 16 | Growth ability | Net assets growth rate |
| 17 | Increase rate of main business revenue | |
| 18 | Total assets growth rate | |
| 19 | Growth rate of operating profit | |
| 20 | Net profit growth rate |
Table 4.
Information of other imbalanced data sets.
| Experiment Data (Other Applications) | Numbers | IR | ||
|---|---|---|---|---|
| Features | Classes | Samples | ||
| yeast3 | 8 | 2 | 1484 | 8.1 |
| ecoli-0-1-4-7_vs_5-6 | 6 | 2 | 332 | 12.28 |
| yeast4 | 8 | 2 | 1484 | 28.1 |
| winequality-red-4 | 11 | 2 | 1599 | 29.17 |
| winequality-red-8_vs_6 | 11 | 2 | 656 | 35.44 |
| yeast6 | 8 | 2 | 1484 | 41.4 |
| winequality-red-3_vs_5 | 11 | 2 | 691 | 68.1 |
Table 5.
Information of credit simulation data sets.
| Experiment Data (Simulation) | Numbers | IR | ||
|---|---|---|---|---|
| Features | Classes | Samples | ||
| Datasets constructed with different imbalanced ratio based on German credit dataset | 20 | 2 | 933 | 3 |
| 20 | 2 | 875 | 4 | |
| … | … | … | … | |
| 20 | 2 | 723 | 30 | |
Table 6.
Confusion matrix.
| Prediction | Bad Customers | Good Customers | |
|---|---|---|---|
| Actual Classification | |||
| Bad customers | True Positive TP | False Negative FN | |
| Good customers | False Positive FP | True Negative TN | |
Table 7.
Description of methods.
| Abbreviation | Method | Category | Description |
|---|---|---|---|
| BRF | BalancedRandomForest | Imbalance ensemble method | The base learner of RandomForest is trained by the balanced subset in each iteration. |
| RB | RUSBoost | The base learner of Adaboost is trained by the dataset balanced by random undersampling in each iteration. | |
| EEC | EasyEnsemble | Bagging with undersampling of the majority class and Adaboost. | |
| SB | SMOTEBoost | The base learner of Adaboost is trained by the dataset balanced by SMOTE in each iteration. | |
| RF | RandomForest | Ensemble method | The simple RandomForest algorithm, which is mostly used for the balance classification task. |
| SRF | SMOTE+RandomForest | Sampling method | RandomForest trained by the dataset balanced by SMOTE, which represents the sampling method. |
Table 8.
Evaluation of model performance on credit risk datasets (%), the bold represent the optimal result.
Table 8.
Evaluation of model performance on credit risk datasets (%), the bold represent the optimal result.
| Balance Ensemble Models | Boosting Imbalance Ensemble | Bagging Imbalance Ensemble | Proposed Method | ||||
|---|---|---|---|---|---|---|---|
| AUC | RF | SRF | SB | RB | BRF | EEC | SA-DP |
| Chinese SMEs | 92.67 | 91.21 | 88.34 | 78.40 | 92.25 | 93.59 | 93.79 |
| German credit | 74.91 | 74.17 | 70.10 | 71.74 | 73.45 | 71.77 | 76.37 |
| Taiwanese bankruptcy | 89.92 | 91.48 | 91.34 | 85.06 | 92.73 | 93.38 | 93.50 |
| Recall | RF | SRF | SB | RB | BRF | EEC | SA-DP |
| Chinese SMEs | 47.50 | 64.37 | 55.62 | 58.72 | 81.25 | 90.62 | 91.25 |
| German credit | 30.25 | 47.75 | 72.50 | 67.25 | 63.50 | 71.25 | 77.75 |
| Taiwanese bankruptcy | 12.00 | 47.33 | 33.66 | 62.33 | 87.66 | 90.67 | 90.33 |
| Accuracy | RF | SRF | SB | RB | BRF | EEC | SA-DP |
| Chinese SMEs | 73.12 | 80.93 | 75.37 | 71.25 | 85.31 | 86.87 | 86.25 |
| German credit | 62.12 | 64.87 | 66.37 | 67.25 | 67.37 | 67.75 | 73.75 |
| Taiwanese bankruptcy | 56.00 | 71.63 | 66.16 | 73.99 | 85.16 | 86.83 | 87.33 |
| G-mean | RF | SRF | SB | RB | BRF | EEC | SA-DP |
| Chinese SMEs | 67.92 | 79.04 | 72.56 | 70.02 | 84.99 | 86.76 | 85.57 |
| German credit | 53.31 | 62.53 | 66.07 | 67.02 | 66.37 | 67.63 | 73.33 |
| Taiwanese bankruptcy | 34.52 | 67.14 | 57.35 | 72.65 | 85.09 | 86.69 | 87.22 |
Table 9.
Evaluation of model performance on other data sets (%), the bold represent the optimal result.
Table 9.
Evaluation of model performance on other data sets (%), the bold represent the optimal result.
| Datasets | RB | SB | BRF | EEC | SA-DP | |
|---|---|---|---|---|---|---|
| yeast3 | Accuracy | 90.84 | 91.58 | 92.45 | 90.29 | 91.42 |
| G-mean | 90.84 | 91.56 | 92.45 | 90.29 | 91.42 | |
| AUC | 94.98 | 95.02 | 97.54 | 96.93 | 95.32 | |
| ecoli-0-1-4-7_vs_5-6 | Accuracy | 89.87 | 89.74 | 88.24 | 87.63 | 90.02 |
| G-mean | 89.85 | 89.33 | 88.24 | 87.63 | 90.00 | |
| AUC | 94.95 | 95.81 | 95.69 | 96.23 | 96.53 | |
| yeast4 | Accuracy | 82.87 | 82.34 | 83.75 | 82.41 | 82.27 |
| G-mean | 82.87 | 82.23 | 83.25 | 82.41 | 82.18 | |
| AUC | 78.12 | 81.76 | 85.70 | 90.91 | 89.12 | |
| winequality-red-4 | Accuracy | 70.67 | 70.93 | 70.54 | 63.41 | 75.04 |
| G-mean | 70.66 | 70.90 | 69.57 | 63.41 | 72.77 | |
| AUC | 60.12 | 68.97 | 71.37 | 69.73 | 72.07 | |
| winequality-red-8_vs_6 | Accuracy | 85.22 | 86.66 | 72.40 | 77.89 | 83.70 |
| G-mean | 85.21 | 86.64 | 72.39 | 77.89 | 83.06 | |
| AUC | 77.01 | 76.51 | 84.39 | 86.18 | 84.65 | |
| yeast6 | Accuracy | 91.84 | 89.93 | 88.81 | 87.93 | 90.36 |
| G-mean | 91.84 | 89.37 | 88.81 | 87.93 | 89.76 | |
| AUC | 90.27 | 90.31 | 93.69 | 93.91 | 94.98 | |
| winequality-red-3_vs_5 | Accuracy | 91.30 | 89.74 | 75.97 | 76.69 | 91.61 |
| G-mean | 91.30 | 89.63 | 75.97 | 76.69 | 75.68 | |
| AUC | 66.51 | 71.51 | 75.97 | 84.31 | 84.50 |
Table 10.
Main information of each kappa-error diagram.
| SA-DP | BR | RB | EEC | RF | SB | SR | |
|---|---|---|---|---|---|---|---|
| German credit | 0.0202 | 0.1553 | 0.0417 | 0.6743 | 0.1610 | 0.3293 | 0.2527 |
| Taiwanese bankruptcy | 0.0148 | 0.5623 | 0.0152 | 0.7358 | 0.2540 | 0.5137 | 0.3833 |
| Chinese SMEs | 0.1430 | 0.5090 | 0.0025 | 0.6278 | 0.4996 | 0.5379 | 0.5232 |
| SA-DP | BR | RB | EEC | RF | SB | SR | |
| German credit | 0.4746 | 0.4055 | 0.4843 | 0.3369 | 0.4069 | 0.4014 | 0.4013 |
| Taiwanese bankruptcy | 0.4473 | 0.2090 | 0.4651 | 0.1738 | 0.3800 | 0.4573 | 0.3076 |
| Chinese SMEs | 0.3535 | 0.2237 | 0.4710 | 0.1920 | 0.3100 | 0.3652 | 0.2812 |
Publisher’s Note: MDPI stays neutral with regard to jurisdictional claims in published maps and institutional affiliations. |
© 2022 by the authors. Licensee MDPI, Basel, Switzerland. This article is an open access article distributed under the terms and conditions of the Creative Commons Attribution (CC BY) license (https://creativecommons.org/licenses/by/4.0/).
Share and Cite
MDPI and ACS Style
Guo, Y.; Mei, J.; Pan, Z.; Liu, H.; Li, W. Adaptively Promoting Diversity in a Novel Ensemble Method for Imbalanced Credit-Risk Evaluation. Mathematics 2022, 10, 1790. https://0-doi-org.brum.beds.ac.uk/10.3390/math10111790
AMA Style
Guo Y, Mei J, Pan Z, Liu H, Li W. Adaptively Promoting Diversity in a Novel Ensemble Method for Imbalanced Credit-Risk Evaluation. Mathematics. 2022; 10(11):1790. https://0-doi-org.brum.beds.ac.uk/10.3390/math10111790
Chicago/Turabian StyleGuo, Yitong, Jie Mei, Zhiting Pan, Haonan Liu, and Weiwei Li. 2022. "Adaptively Promoting Diversity in a Novel Ensemble Method for Imbalanced Credit-Risk Evaluation" Mathematics 10, no. 11: 1790. https://0-doi-org.brum.beds.ac.uk/10.3390/math10111790
Note that from the first issue of 2016, this journal uses article numbers instead of page numbers. See further details here.