1. Introduction
There are currently numerous studies on global warming and the consequences of greenhouse gas emissions and climate change, and there are many attempts being made to mitigate these global problems that face humanity.
In urban areas, the urban heat island effect (UHI) is remarkable [
1,
2,
3,
4]; it is caused by the low reflectance of the materials used in cities and the scarcity of vegetation and evapotranspiration with consequences such as an increase in ambient temperature between 4–5 °C in urban centers compared to the periphery, which implies an increase of 5–10% in the demand for cooling, the impoverishment of air and water quality and the deterioration of people’s health. [
5,
6].
The study presented in this article is part of the Life Heatland project and solves the important problem of protecting measurement sensors, which are expensive and must be located on the city street. The idea of protection against theft or other vandalism arises from the beginning, and due to the need to provide it to the measurement sensors, a study of the materials and the most appropriate design to achieve the objective has been carried out.
The fact that the sensors are located in the streets of the city will be explained in the first sections of this study.
This project, in which the work presented in this article is developed, is part of the European Life Program [
6], founded in 1992 as a financing instrument for actions in the field of environmental conservation, aimed at combating climate change. Life Heatland, a project in which several entities participate, coordinated by the Construction Technology Center of the Region of Murcia (CTCON) [
7], is an experimental study, pioneering in Spain, carried out in the city of Murcia, located at 37°59′20.51″ N 1°7′47.49″ W, in the southeast of mainland Spain, where the amount of solar radiation is intense throughout the year, especially during the summer, and even several months before and after. This means that the temperatures reached in the central part of the year can reach up to 45 degrees Celsius, or even exceed this temperature [
8,
9].
The project aims to improve the quality of life of the citizens and local climatic conditions by using new asphalt pavements that are much more reflective than conventional ones and therefore store less radiation during daylight hours and emit less heat at night, improving the quality of life and human well-being. This objective follows the guidelines of the “EU Adaptation Strategy”, which promotes the use of more environmentally friendly building materials.
This study will, at the same time, contribute to climate change mitigation, as the innovative solution reduces energy consumption and greenhouse gas emissions associated with typical technologies in the urban environment: on the one hand, it will improve the coefficient of performance (COP) of air conditioning and refrigeration devices, reducing their energy consumption. On the other hand, the new cool pavement will have a higher reflectance compared to conventional asphalt pavements and will also produce an improvement in nighttime visibility, potentially reducing lighting requirements and thus producing energy savings [
10].
The study of climate characterization and its improvement, smoothing as much as possible the extreme temperatures reached, is currently being pursued both to improve the quality of life of the inhabitants of urban areas, and to contribute to the improvement of the global greenhouse effect conditions in the face of climate change [
11]. This is the objective of the Life Heatland project, which will characterize the decrease in temperature, among other variables, after the implementation of the new asphalt in an area of Murcia with respect to a conventional asphalt over a period of two years, through the constant collection of data of temperature, solar radiation, reflectance, wind speed, environmental noise, and various greenhouse gases [
12].
For this purpose, a comparison of temperatures at different heights will be made between the conventional asphalt of the streets of the city of Murcia and the new cool pavement. The problem of installing measurement sensors on the street arises from possible robberies or acts of vandalism. Therefore, as shown in this article, a system has been designed and implemented to protect the measurement sensors by covering them with aluminum cylinders to prevent any theft or vandalism. At the same time, the problem of overheating produced inside has been solved by studying the heat transfer processes present, as shown in
Section 2.4.
Finally, the main objective of this article is the design of a sensor protection system, without affecting the quality and accuracy of the measurements. For this purpose, a study has been carried out by means of a discriminated dimensional analysis to avoid the excess of temperature that the sensors could measure due to overheating of the protection system [
13,
14,
15].
The study, using advanced techniques of discriminated dimensional analysis, was carried out on the air flow, forcing its entrance through the lower part of the protection tubes, and generating a convection process. As will be explained later, the sensors were in the inner part of the tubes where the flow is fully developed, thus avoiding the measurements being affected by turbulence processes at the inlet. In this way, the objective of protection was achieved without altering the data obtained by the sensors.
The technique used for the design and optimization of the sensor protection system is discriminated dimensional analysis [
14,
16]. This technique, together with nondimensionalization and normalization [
15,
17], has shown its usefulness in establishing control parameters in various physical, chemical, and engineering processes such as industrial explosions [
16], consolidation processes [
18], heat transfer [
14], etc., facilitating the obtaining of universal curves that allow the resolution of these problems quickly and accurately.
2. Design and Location of Monitoring Stations
As part of the Life Heatland Project, a study of various areas of the city to be monitored was carried out, previously analyzing the strategic points for the placement of the measurement towers.
The location of the towers was chosen for its proximity to the pavement, avoiding any type of obstacle between the towers and the pavement. As indicated above, the problem arises from the need to protect the sensors from possible acts of vandalism without affecting the quality of the sensor measurement.
Below are the locations where the sensors are installed, necessary for the treatment of the problem later, because for the design of the prototype it was necessary to know, among other variables, the amount of solar radiation received by the sensors, how long they are in shadow, etc.
2.1. Location of Monitoring Station
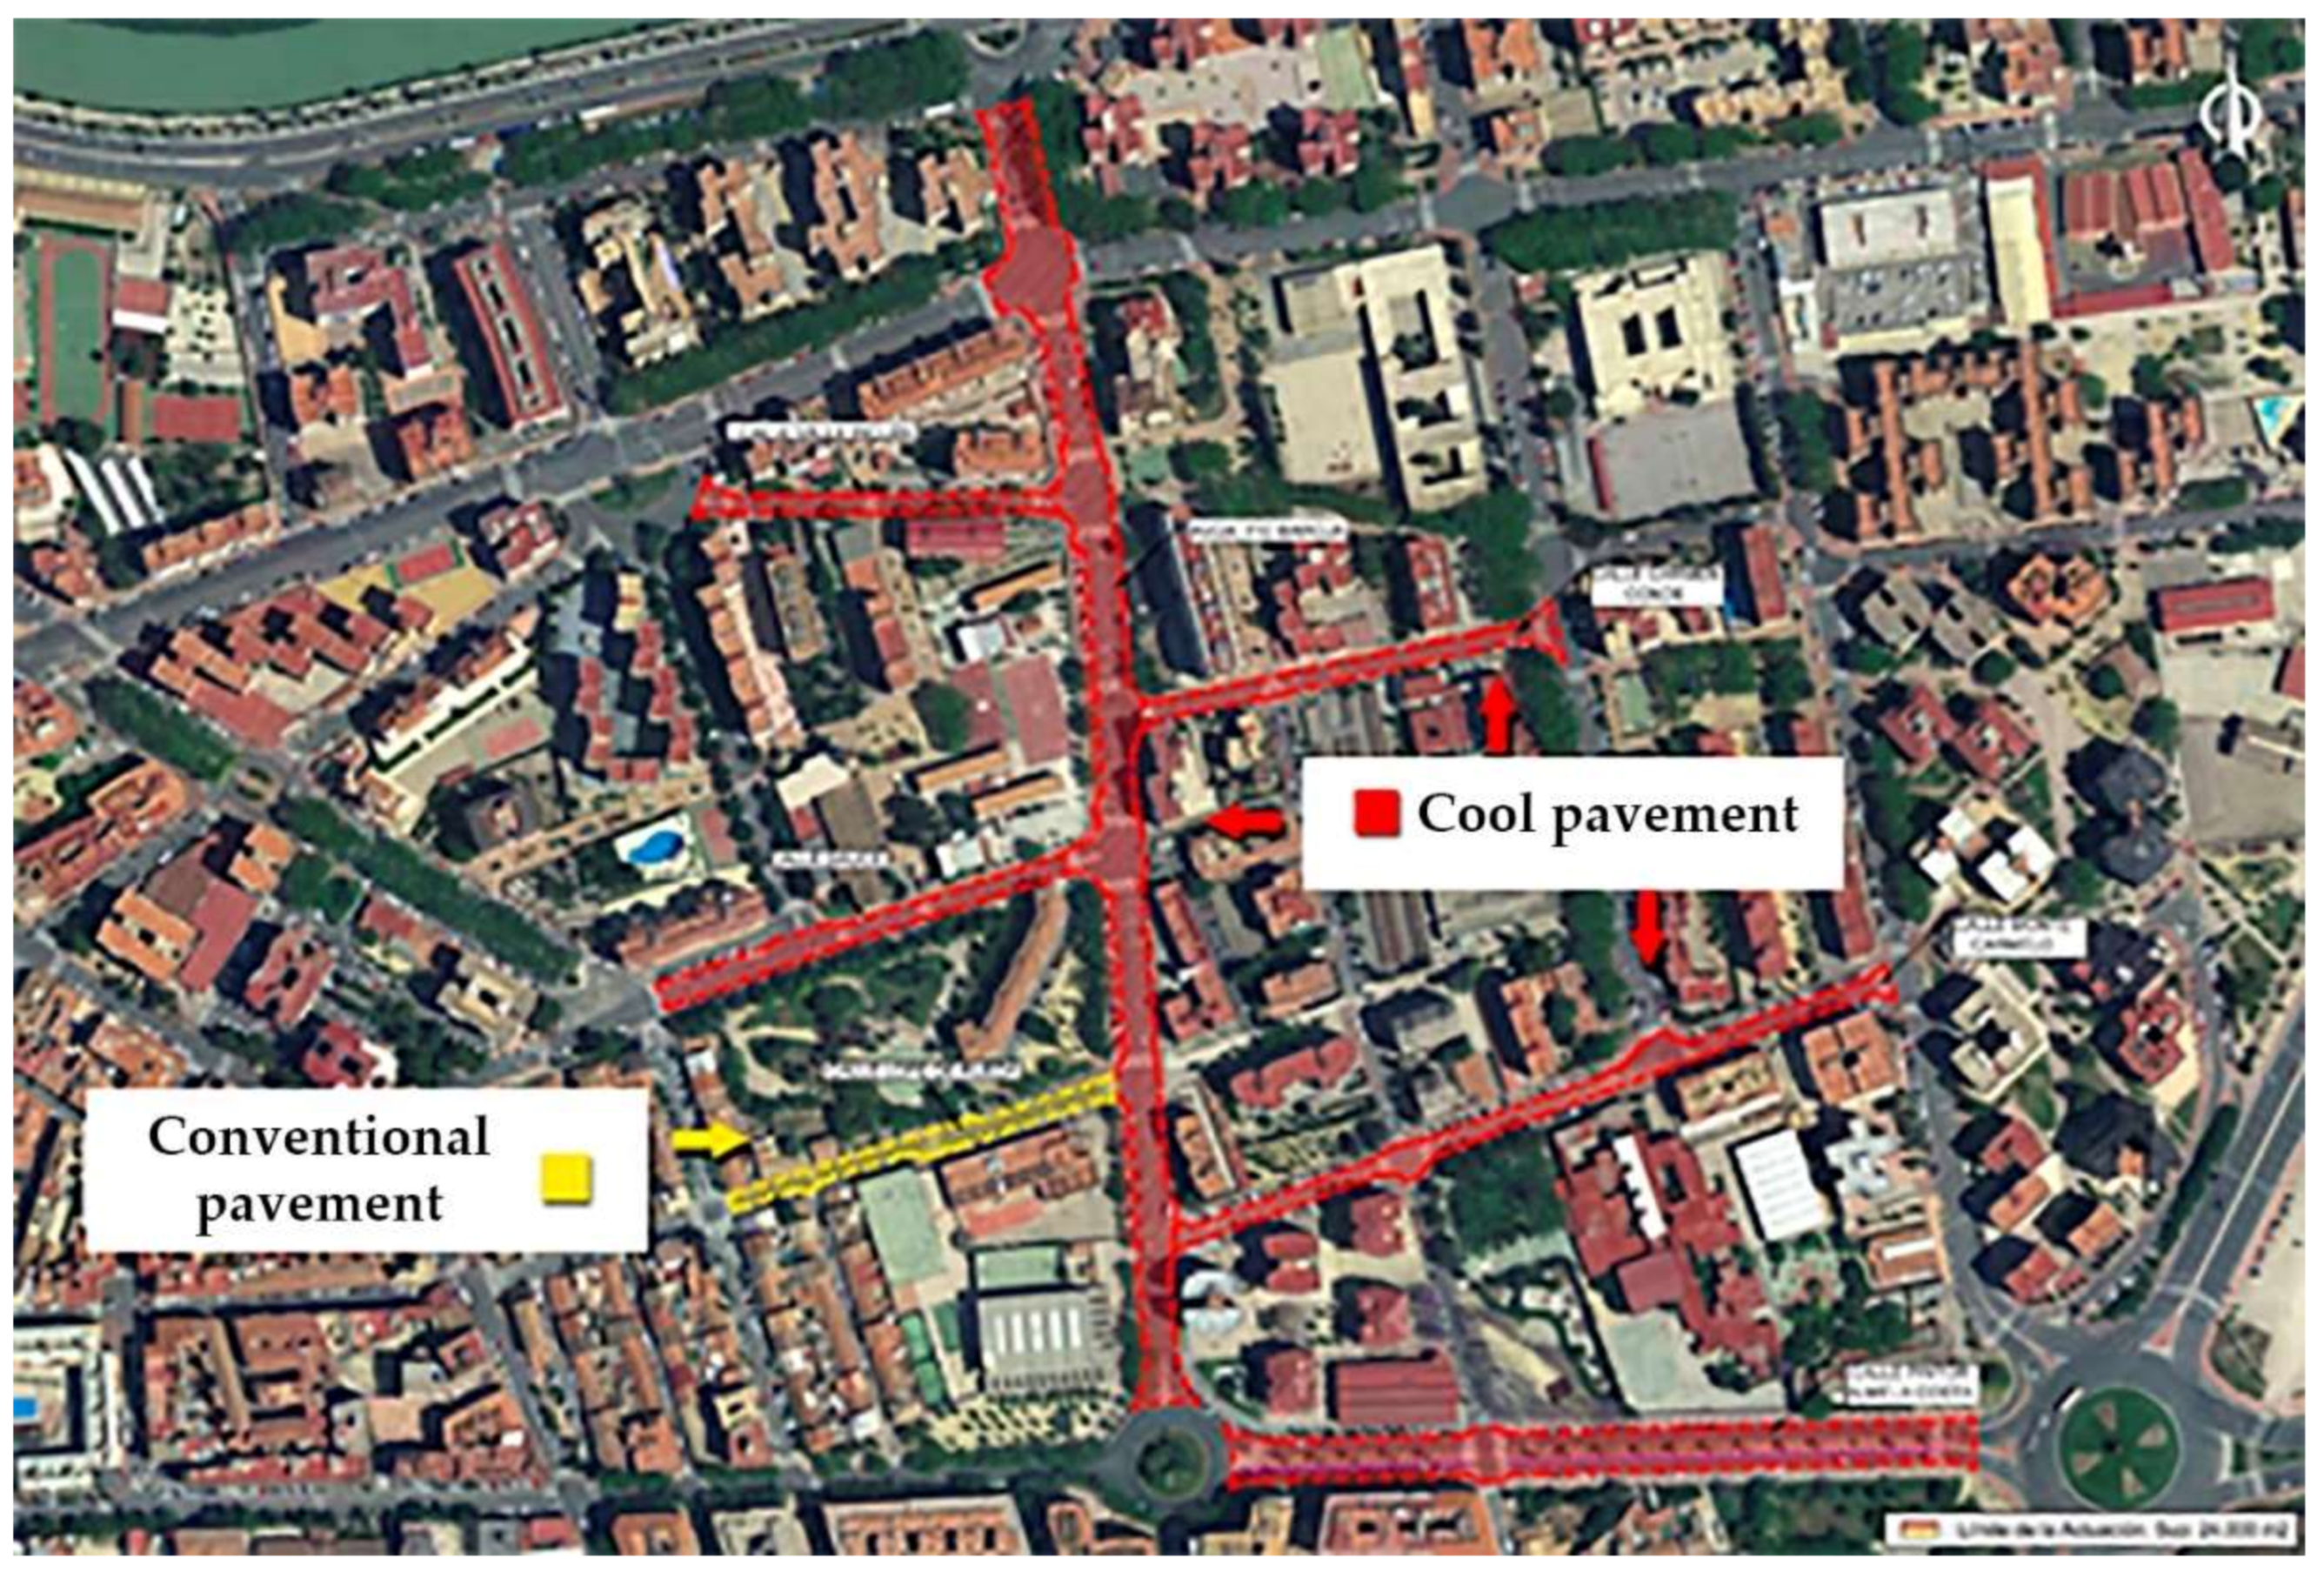
The monitored area is Avenida Pío Baroja in Murcia (Spain). This location was chosen for its size and the characteristics of the road and the environment. To achieve the objectives of the project, upon which this work was developed, an area where the width of the street was large and where it was easy to lay the new cool pavement was needed, in addition, due to its location, where the sun shines for several hours a day.
It had also been decided to re-asphalt Lope de Rueda Street with a conventional asphalt, so that the results between the new cool pavement and the conventional asphalt can be compared, since normally in a conventional asphalt the bitumen tends to age over time and this causes the intense black color to be lost.
Four measuring towers with sensors were placed on lampposts. Initially, these towers were to be placed on the traffic lights of the road, but for simplicity in the process, the lampposts closest to the asphalt were finally selected.
The final locations are shown in
Figure 1.
2.2. Design of Measuring System
The necessity of comparing different characteristics with similar scenarios is the reason for choosing different measurement and test points placed in different locations. Each of these points will consist of a station of equal characteristics containing the following primary measurements:
- -
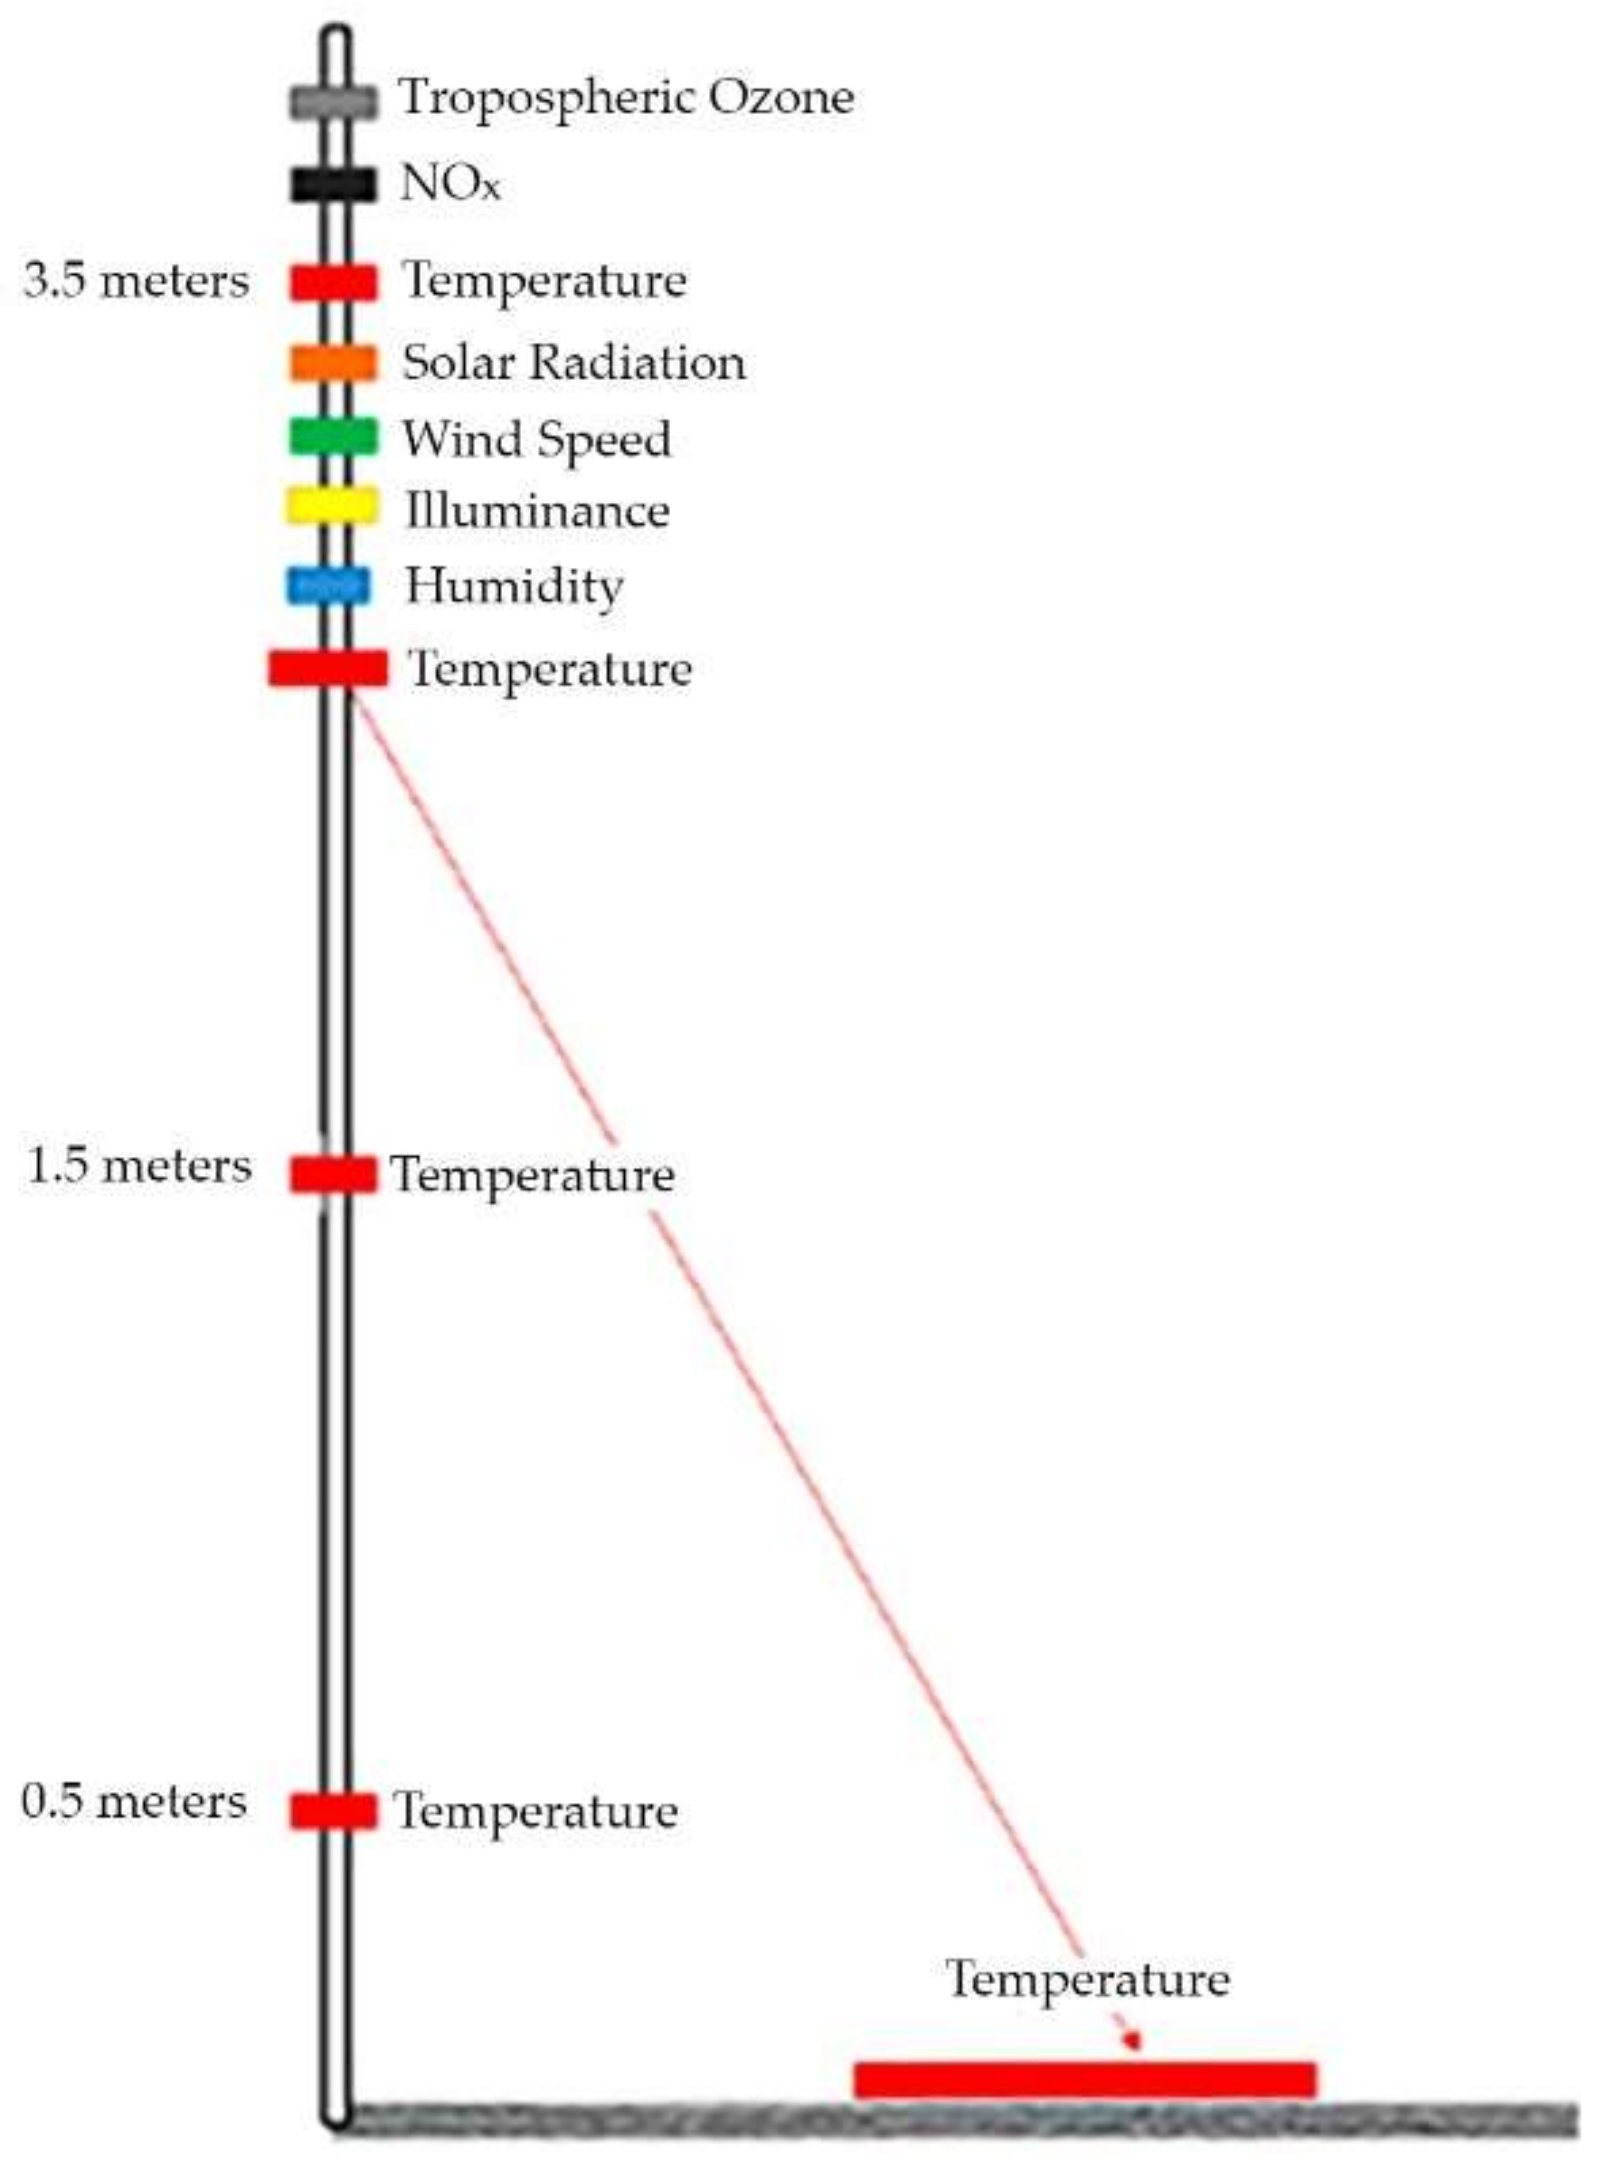
Temperature profile, measuring asphalt temperature, ambient temperature at 50 cm height, ambient temperature at 1.5 m height and ambient temperature at approximately 3.5 m height.
- -
Ambient noise sensor located at 3 m height.
- -
Gas sensor located at 3 m height.
As the project, upon which this work was developed, intended to compare the primary measurements during different periods of time, it should be considered that there are other meteorological parameters that may affect the measurements and, as such, they should be measured to correct the data generated in both stages and obtain conclusions without affecting those parameters. For this reason, the secondary sensors would be used to measure the following at each point:
- -
Wind speed and direction.
- -
Solar radiation.
- -
Pluviometry.
These sensors would be placed on a 3 m high mast that would allow us to fix the different sensors at the corresponding height and at the same time serve as a support for a fiber electrical panel inside which would be installed an electronic recording and sending data to a server that would archive all the data, with the possibility of reviewing and studying the data at different times. This would help us to study the data both in real time and historically.
The system consists of four stations equipped with an aluminum mast to be fixed to a concrete die, as shown in
Figure 2.
As a summary, the measures taken with the designed system are shown below:
- -
Temperature and humidity sensor at 0.5 m height.
- -
Temperature and humidity sensor at 1.5 m height.
- -
Temperature and humidity sensor at 3.5 m height.
- -
Sensor for measuring solar radiation, pyranometer.
- -
Sensor for measuring surface temperature at a distance.
- -
Wind speed. Anemometer
- -
Illuminance
- -
Sound level meter
- -
Sensor for gas measurement: CO, NO, NO2, SO2, O3, H2S, VOC (volatile organic compounds).
- -
Suspended particles or particle matter, PM10 and PM2.5 size.
2.3. Sensor Models Used
In this case, it was proposed to use the same sensor, the Delta Ohm 9008, which integrates temperature and humidity measurement in the same device, with RS485 Modbus output. This sensor provides a measurement range from −40 °C to 80 °C and from 0 to 100% in humidity. Since a comparison of before and after would be made, equipment that provides good accuracy had been sought, in order to measure the changes well. This equipment provides an accuracy in temperature of ±0.15 °C and 1.5% in humidity. It also has a radiation and wind protector that minimizes these effects on the measurement.
In this case, an infrared sensor capable of measuring the temperature of the asphalt was proposed, which can evaluate the effect of the asphalt. The Omega 0S211-C4 sensor with RS485 Modbus output, suitable for outdoor use and with an accuracy of 1 °C, was proposed.
Two types of sensors were proposed, one that integrated air quality and one that did not.
The first sensor would be the Frontech FWS700 Sensor, which integrates in a single device the measurement of rainfall, wind direction and speed by ultrasound and global radiation, among other parameters. In addition, as integrated sensor 2, the Frontech AQM910 was installed, which would measure CO, NO, NO2, SO2, O3, H2S, VOC, PM2.5, PM10 and ambient noise.
Once the towers were in place, data could be stored every 15 min.
2.4. Design of Antivandalism System
In order to protect the sensors located in the measuring towers, a system was developed to prevent vandalism and any type of theft or damage. This was the main objective of this work and its design was optimized using discriminated dimensional analysis techniques, as will be shown in the following sections.
Initially, the prototype consisted of an aluminum tube, the same as that of the towers, which covered the sensors. However, once the data collection began, it was observed that the ambient temperature data, which is measured at 1.5 m inside the tube, was higher than the surface temperature of the pavement, concluding that the results of this first prototype did not obtain optimal results, due to the excessive overheating of the sensor inside the aluminum tube.
Therefore, a polyvinyl chloride (PVC) tube was placed inside the tube and the gap between the two tubes was filled with polyurethane foam, as shown in
Figure 3.
As is known, due to the thermal properties of aluminum, which is used in our sensor protection model, it causes the sensors to overheat, however, the overheating effects were compensated with polyvinyl chloride (PVC) tubing and polyurethane foam [
19], both thermally insulating materials. The thicknesses decided for each of these materials were 21 mm for the polyurethane foam, 4 mm for the thickness of the PVC pipe covering the sensors and 1 mm for the external aluminum layer. The internal diameter of the PVC tube was 33 mm. Finally, the thermophysical properties of the materials used in this prototype are shown in the following table [
20,
21].
In order to keep the interior ventilated, several attempts were made by drilling, firstly 7 mm, and finally 10 mm diameter holes in the tube at the height of the probe, as shown in
Figure 4.
Data were taken inside the tube at 1.5 m and at 0.5 m, placing the tube directly under direct solar radiation and comparing the data obtained with another probe in the shade. In this case, as shown in the results section below, the expected results were obtained, appreciating that there was hardly any difference between the temperature data from the tube exposed to solar radiation and those from the tube in the shade, confirming that the aluminum tube that protected the sensors from vandalism or burglaries did not alter the results obtained by the sensors inside.
2.4.1. Theoretical Foundations Applied to System Design
Inside the aluminum tube that covers the sensors, heat transfer processes take place both by conduction and convection, although the aluminum itself of the external layer of this protection device also emits energy by radiation that could influence the data stored by the sensors. That is why it is necessary to give a brief explanation of these processes and how they can influence the reading of the sensor data, since it is important to discriminate between them and try to minimize them to avoid the influence they may have on the readings, since it is not desirable that they influence them, because the only purpose of these aluminum coatings, filled with polyurethane foam, is to protect the sensors against damage and vandalism. Thus, by minimizing the different processes of heat transfer that are involved, the sensor will only measure the temperature of the air that enters through the ventilation system.
Conduction heat transfer is a process governed by governing equations well known in scientific literature [
22,
23]. These equations have been obtained from experimental observation and are expressed by Fourier’s Law:
where
α is the thermal diffusivity (
α = k/(
ρc
p)), k, the thermal conductivity,
ρ, the density, and, finally, c
p, the material specific heat. Heat conduction occurs whenever there is a temperature difference between two points. Finally,
n is the direction in which the heat transfer process occurs.
In the sensor protection device, made of layers of aluminum and polyurethane foam, the above mentioned process occurs in an appreciable way, only in the small thickness of the aluminum, because as shown in the data in
Table 1, the thermal conductivity of both the polyurethane foam and PVC has very small values, making this process of heat transfer, and therefore, the influence it may have on the readings of the sensors inside, negligible, as shown in the results in
Section 4, thus solving the problem of sensor isolation.
As with conduction, the possible influence that the aluminum emissivity may have on the data acquisition is negligible, given the practically null thermal conductivity of polyurethane foam and PVC, and also due to the great thickness of the polyurethane foam layer, which was up to 21 mm, as well as the low value it presents,
Table 1.
Regarding the convection process taking place inside the sensor protection tube, two types of events can be differentiated. On the one hand, the variation in the air velocity profile due to the formation of a boundary layer near the inner walls of the tube due to friction. In this boundary layer, therefore, a variation in the velocity of the fluid particles is observed until it stabilizes as it approaches the axis of the tube. On the other hand, there is the heat transfer process by laminar forced convection that also occurs inside the tube. The study of both assumptions using the technique of discriminated dimensionless analysis is fully clarified in the scientific literature in various scientific texts.
In particular, the heat transfer process is of utmost importance in this study, since it has been taken into account when developing the sensor protection tube model, together with the insulators, so that the interior sensors would not be affected by the overheating of the rising air.
In the following sections, the effect that it has on the tube design, and therefore on the measurement of temperature, fluid velocity, the convective effect on heat transfer and the calculation of the insulation optimal thickness by means of discriminated dimensional analysis is explained in depth. Finally, the selection of materials and dimensions used in the design of the antivandal tube is explained.
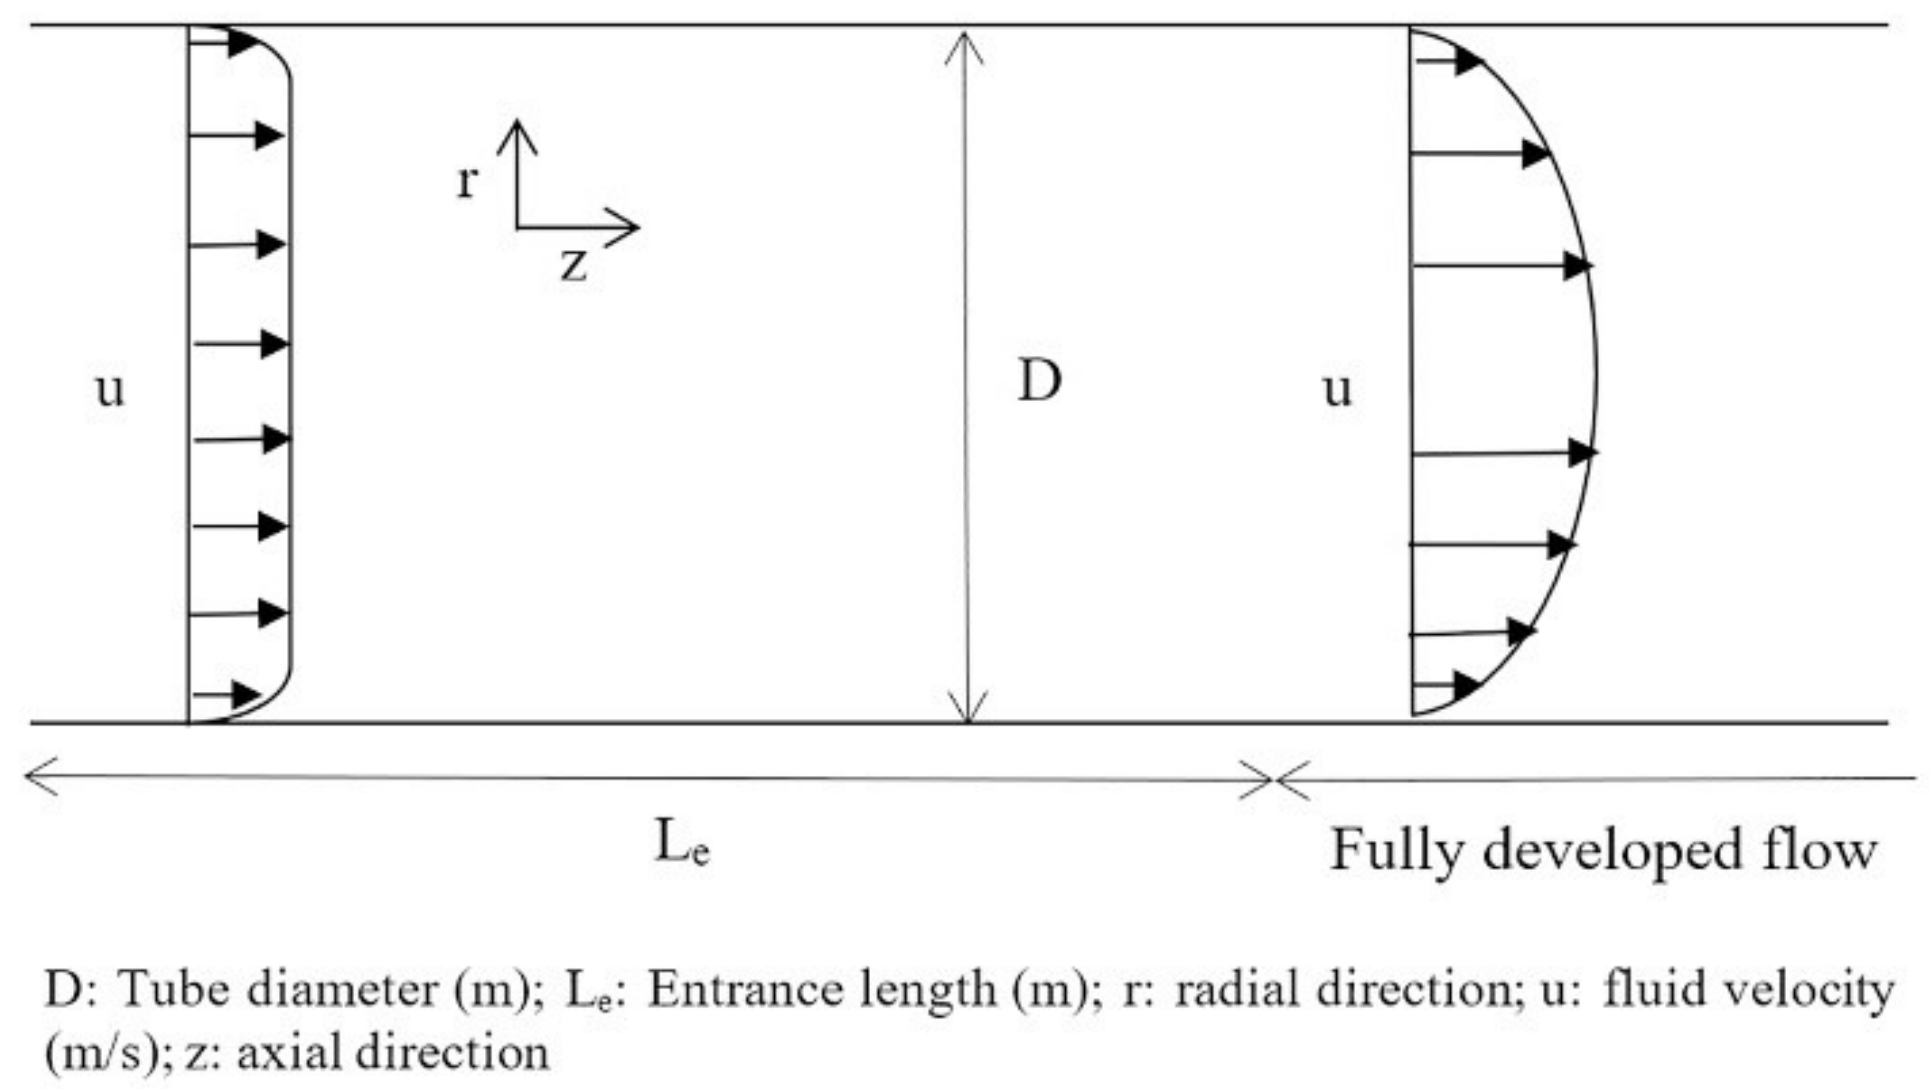
2.4.2. Internal Flow in Tubes
When a fluid enters a circular tube with a uniform velocity, a decrease in velocity occurs due to the adjacent layer of the fluid with the surface, developing a velocity boundary layer, whose thickness increases along the tube until it reaches the center of the circular section. The region between the entrance and this point is known as the entrance longitude, L
e. The fluid flow is then fully developed,
Figure 5 [
14].
If these two zones are studied by means of discriminated dimensional analysis, the following relations between the different variables are obtained. In the entrance zone, the discriminated dimensional analysis leads to the entrance length being a function of the Reynolds number [
14].
where L
e is the mentioned entrance length, D is the tube diameter, u is the fluid velocity, μ is the dynamic viscosity and ψ is a function. This expression has an analytical solution for both laminar and turbulent flow [
24,
25].
From these expressions it can be deduced that the entrance length corresponding to turbulent flow is much shorter than that of laminar flow. In practice, in a turbulent regime, the entrance length becomes insignificant at a position beyond 10 to 40 times the diameter, that is, L
e,turbulent ≈ 10D or L
e,turbulent ≈ 40D [
26,
27].
Therefore, the sensors must be located in the zone where the fluid is fully developed, since the velocity profile remains constant and the inertial forces cancelled. If we analyze this zone by discriminated dimensional analysis, we obtain the following relations for the velocity profiles [
14]:
where R is the radius of the tube, dP/dz is the pressure gradient and ψ is a function. The analytical solution of this expression is of the parabolic type, with a maximum in the center of the tube and a minimum on its surface.
The pressure drop or pressure gradient can be determined again by discriminated dimensional analysis [
14].
where u
a is the mean velocity and has the same order of magnitude as the velocity at the center of the tube. It should be noted that the previous expression can be expressed as a function of two classic dimensionless numbers, Reynolds and Euler [
14].
Due to the design of the protection tube, given that the air inlet will be produced through the holes, it is not expected that high air flow velocities will be reached, since they will be between 1 and 5 cm/s, so the rate will be clearly laminar, taking a value for the Reynolds number between 23 and 114. Thus, with this design, it is favored that the entrance of the fluid is uniform since the velocities are very low and the fluid homogenization has been improved thanks to the holes. Finally, for these values, the entrance length will vary between 4.3 and 22 cm.
2.4.3. Heat Transfer by Convection
When a fluid enters a circular tube with a certain velocity and temperature, a forced convection heat transfer occurs with the internal wall. In order to minimize this transfer, the tube was insulated and a reflective material used on the external face to minimize the heat transfer due to solar radiation that the outside of the tube would receive. However, the behavior of heat transfer inside the tube has also been studied by means of discriminated dimensional analysis in order to minimize it. As in the previous case, we find two regions, a thermal entrance area and a zone where it is already fully developed,
Figure 6 [
14].
If these two zones are studied by means of discriminated dimensional analysis, the following relations between the different variables are obtained. In the entrance zone, the discriminated dimensional analysis leads to the thermal entrance length being a function of the Peclet number [
14].
where L
et is the thermal entrance length. Since the Peclet number can be expressed as a relation of the Reynolds and the Prandtl number, Pe = RePr, a relationship can be established between the two entrance lengths, the thermal one and the one referring to the fluid velocity [
14].
Since the Prandtl number takes a value of about 0.71 for air, it can be concluded that the thermal profile will develop more rapidly than the velocity profile, thus the velocity entrance length is more important for the tube design.
The sensors will be located in the area where the thermal gradient is fully developed, since they will allow us to minimize the effect of the thermal gradient. If we analyze this zone through discriminated dimensional analysis, we obtain the following relationships [
14]:
where T
is and T
m are the temperatures on the inner surface of the tube and the mean temperature, respectively. If the previous expression is analyzed, it can be deduced that, obviously, the temperatures T
s and T
m must be as similar as possible in order to minimize the effects of heat transfer from the tube to the fluid. In the design of the tube, the proximity between the values of both temperatures has been achieved by using insulating materials that minimize the transfer of heat from the outside to the inside by conduction and by using a material with an external face with high reflectivity.
2.4.4. Critical Radio Determination
It is commonly thought that adding an insulator, that is, increasing the thickness, will reduce heat transfer. This is true for walls where the area remains constant. However, in a tube, as the thickness increases, the resistance to heat transmission by conduction increases, but the radius also increases, and therefore the outer area, which implies that the resistance to convection and radiation decreases [
28,
29]. Thus, increasing the thickness increases the heat transfer until a maximum value is reached. After this point, the behavior is as expected, that is, the resistance increases with increasing thickness. The thickness value that provides the maximum heat transfer is known as the critical radius of insulation. Sahin and Kalyon studied the critical radius by implementing a dimensionless equation involving the phenomena of conduction, radiation, and convection, obtaining the following expression [
29]:
where σ is the Stefan–Boltzmann constant, ε is the emissivity, in our case it would be that of aluminum, k is thermal conductivity, which in the study carried out in this work would be the equivalent conductivity that includes all the materials used, T
os is the outer surface temperature, and finally, h is the convection heat transfer coefficient.
If the previous expression is analyzed, it is concluded that the critical radius will increase with increasing thermal conductivity and with decreasing convection heat transfer coefficient, emissivity and external surface temperature. As it is of interest to know the maximum value of the critical radius, it must be assumed that there is natural convection since, for a forced convection, the convection heat transfer coefficient would take a higher value. In the bibliography, it is recommended to take a value of 5 W/m
2K for natural convection [
28].
If the critical radius is calculated for the design of the tube, knowing that with all the materials used we have a thickness of 26 mm, that is, a tube radius of 59 mm, an approximate equivalent thermal conductivity of 0.048 W/mK, the outer surface temperature will be between −10 °C (minimum value for winter) and 60 °C (maximum value for summer) and the values of
Table 1, we obtain a range of values between 9.36 and 9.18 mm, for each of the temperatures, respectively, so the radius taken in the design is much greater and we are far from the point of maximum heat transmission, our insulation being effective. Although it is true that in our design some holes have been made in the tube to favor the entrance of air to the sensor, these will have a minimal influence, given its diameter, in the calculation of the critical radius.
2.4.5. Selection of Materials and Adequate Dimensions in the Design of the Tube
Finally, if we consider all of the above, the selection of materials used can be justified. The choice of aluminum for the external face was mainly due to two factors, (i) it serves as a protective housing for the sensor and (ii) it has a high reflectivity value, so it would reflect most of the incident solar radiation. The selection of polyurethane foams was due to their low thermal conductivity, and finally, PVC was used as the inner protective housing. In addition, the values obtained for the entrance length and the critical radius were also taken into account in the design and placement of the sensors, as mentioned above.
3. Design of the Experimental Procedure
Initially, a test was carried out by taking readings on the temperature measuring towers, both at pavement level and at 50 and 150 cm height. This showed us that these data were considerably higher in the sensors that were inside the aluminum tubes, without having filled the inside with any thermal insulation, placed as protection against possible acts of vandalism, since inside the tube there was overheating.
Table 2 shows examples of temperature data recorded during 2019, where the observed differences can be appreciated.
The explanation for these results is that the material of the tube where the probes were located was only aluminum, so the temperature of the probes placed inside the tube was higher than the surface temperature of the asphalt. This fact caused the temperature inside the tube, when exposed to the sun without any kind of insulation, to increase considerably.
To solve this problem, a prototype was made with the same conditions but insulated. The prototype, as mentioned above, consisted of an aluminum tube such as the one used in the towers; in addition, a polyvinyl chloride (PVC) tube was placed inside and the gap between the two tubes was filled with polyurethane foam. To produce a ventilation effect, 7 mm holes were drilled at the height of the probe. Data were taken inside the tube at 1.5 m and at 0.5 m by placing the tube in the sun. To check the reliability of the test, a probe with the same characteristics was also placed in the shade.
The results of this first prototype do not obtain optimal results, since the tube continued to heat up and, consequently, altered the results of the temperature measurement of the sensors that were inside the aluminum tubes. The differences in this test were more than 2° Celsius if we compared the probes that were in the sun, at 0.5 m, 1.5 m and 2.5 m, with respect to the probes that were in the shade, so this solution was not valid either.
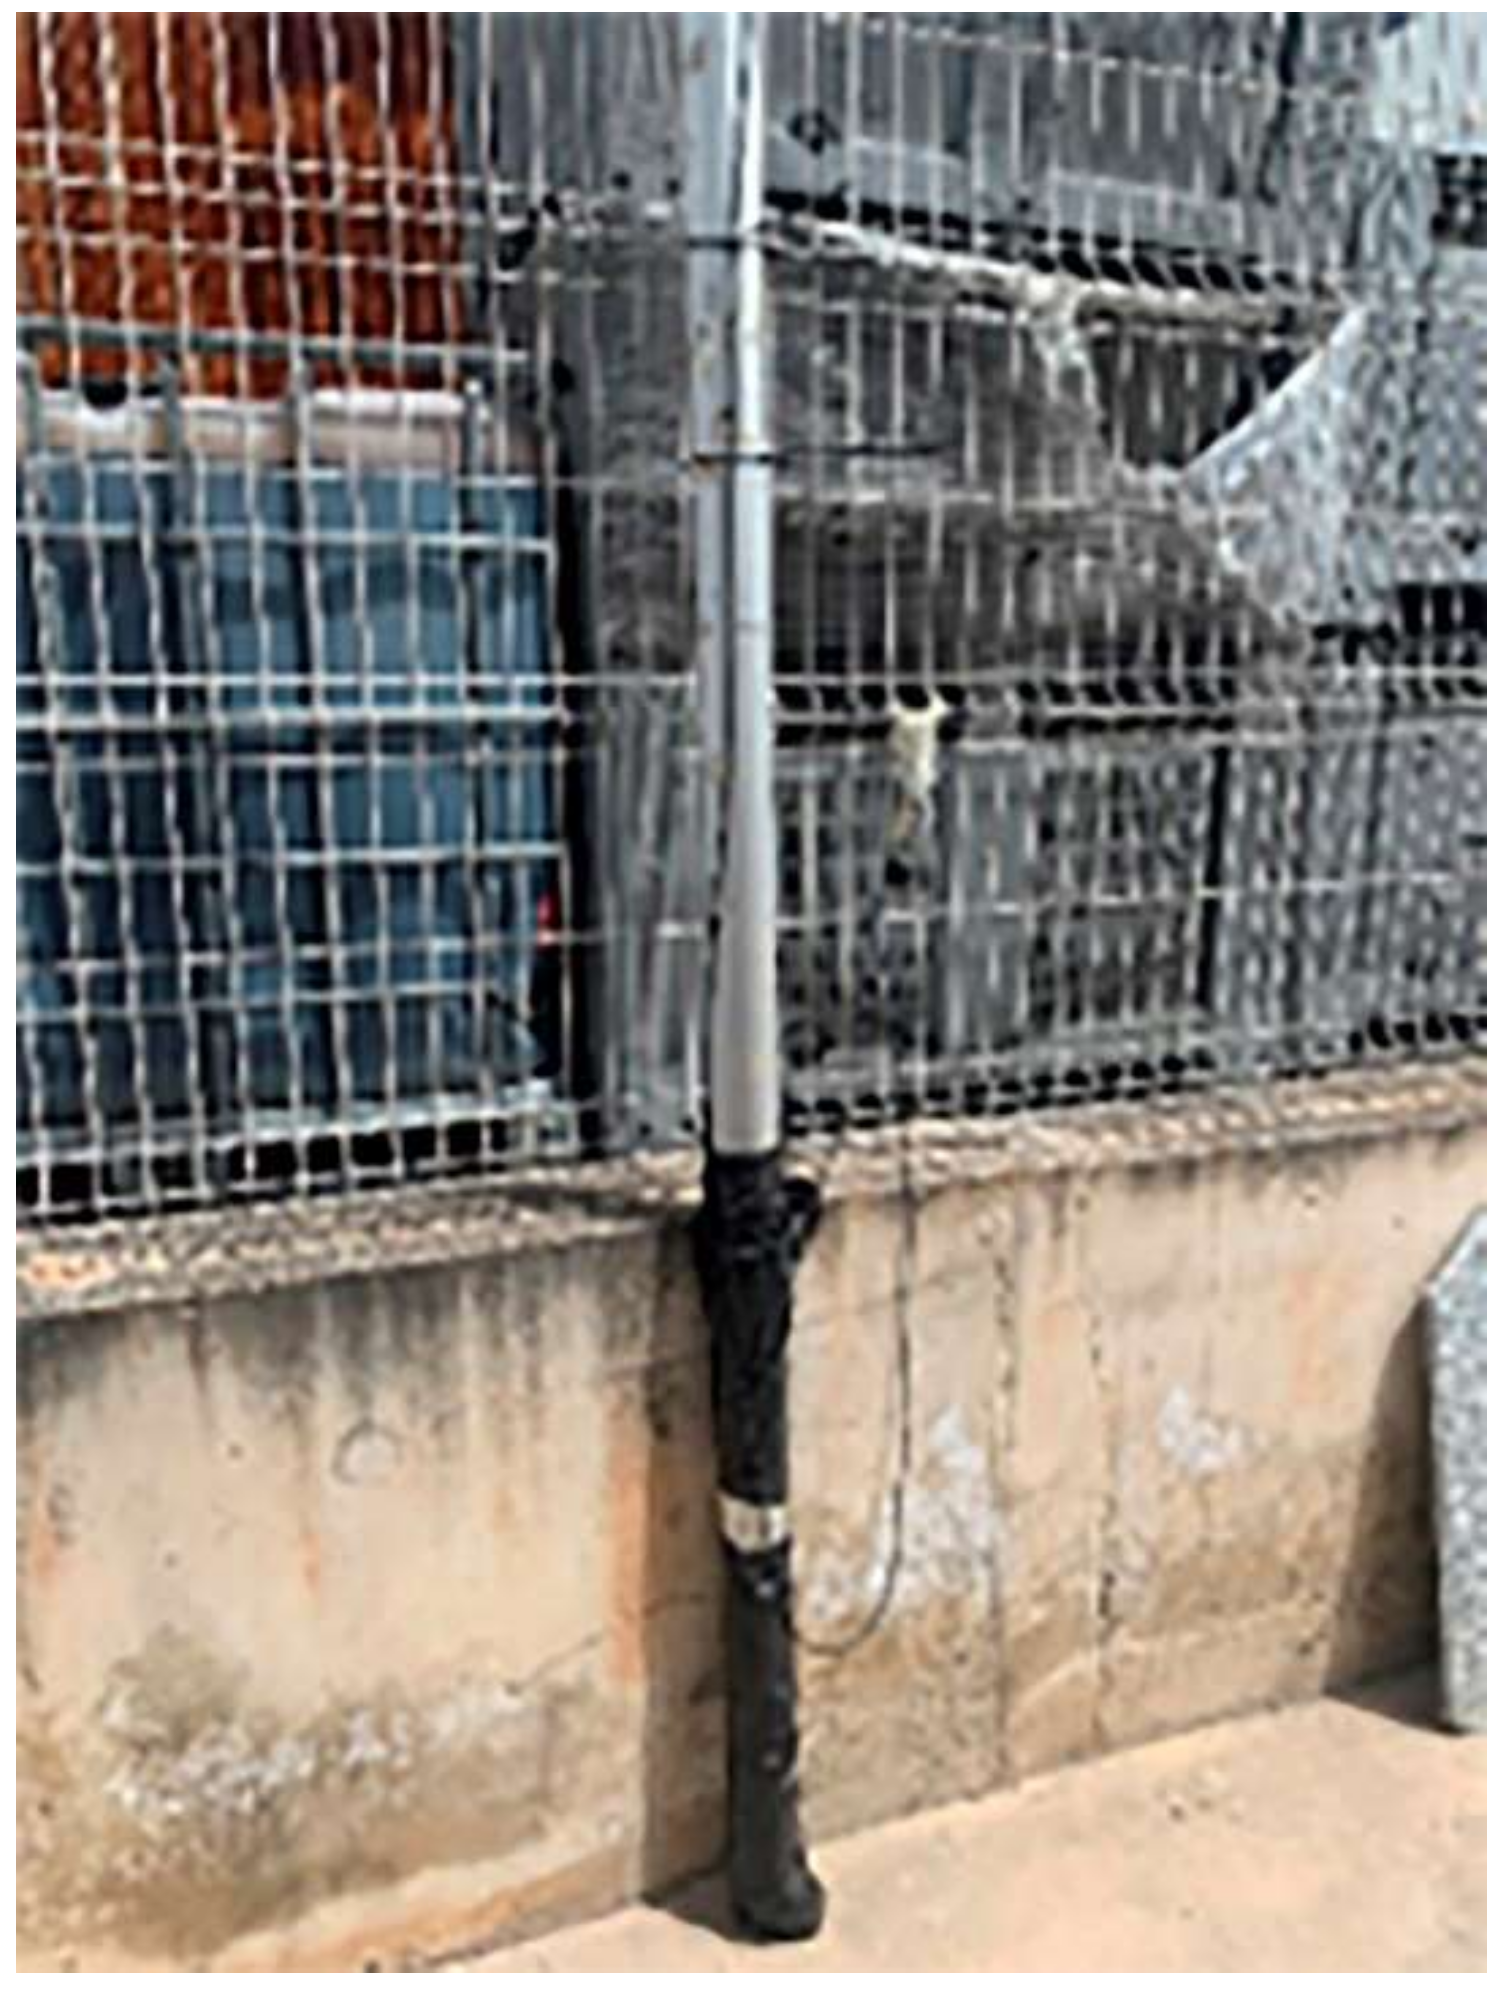
In addition, a dark material was placed at the lower end of the protection tube of the sensors, as shown in
Figure 7, so that the heat absorbed by this material caused a temperature gradient between the lower part and the upper part of the tube, thus forcing a convection process to ventilate the interior, as explained in
Section 2.4.1, which talked about heat transfer by forced convection. Since the upper part is open, the heat stored inside the tube will be expelled and the sensors will not overheat. Other authors placed the dark material at the top [
30].
When the difference in the temperature data obtained by the probe at 0.5 m and the sensor at 1.5 m was compared with respect to those in the shade, the difference was still between 2.5 and 4 degrees Celsius, so this solution was also not valid.
Subsequently, the size of the ventilation holes was increased to 10 mm in diameter.
This time, there was hardly any difference between the temperature of the probe placed in the shade and that at 1.5 m. The difference between the 1.5 to 0.8 values was reduced. However, between the probe placed at 0.5 m and the temperature in the shade, the difference we found was 3 degrees. The explanation is mainly due to two factors:
- i.
This last sensor was placed in the area covered with dark material, used to favor the movement of ascending air, so the heat transfer would be greater in this area.
- ii.
The increase in fluid velocity increased the inlet length, and possibly this would be the area where the velocity and temperature profiles had not been developed. Therefore, given, on the one hand, that the tests were carried out with high radiation and temperature values, and on the other hand, that there were no large differences between the values of the prototype and control probes located at 1.5 m, and furthermore, these differences will decrease with decreasing radiation and air temperature, it was advisable to take the values of the probe located at the latter position and reduce the area covered with the dark material to improve the results obtained for the probe located at 0.5 m.
4. Validation Test Results
During the study, countless data were obtained because the measuring stations took data every 15 min without interruption. Below, two periods of 24 h are shown in
Table 3 and
Table 4, in which the data contained in each hour are tabulated, in order to compare the results on different days. In addition, the data from two measuring stations are compared, one that was under direct sunlight during daylight hours, and another that was placed in the shade, in order to compare the results of the antivandalism system, since, due to this, considerable differences were initially obtained between these stations, one in the sun and the other in the shade (
Table 3).
After implementing the corrective measures explained in
Section 3, it can be clearly seen how the problem of installing the antivandalism devices in the measuring towers had been solved, since differences were observed, both in the station under direct sunlight and the one in the shade, of just 1 degree or less in most of the day, especially in the central hours, where large differences would be apparent if the device was distorting the measurements (
Table 4). In summary, the objective was achieved thanks to the polyurethane foam thermal insulation and, more importantly, by drilling 10 mm diameter holes in the aluminum housing in order to improve the convective flow (ventilation).
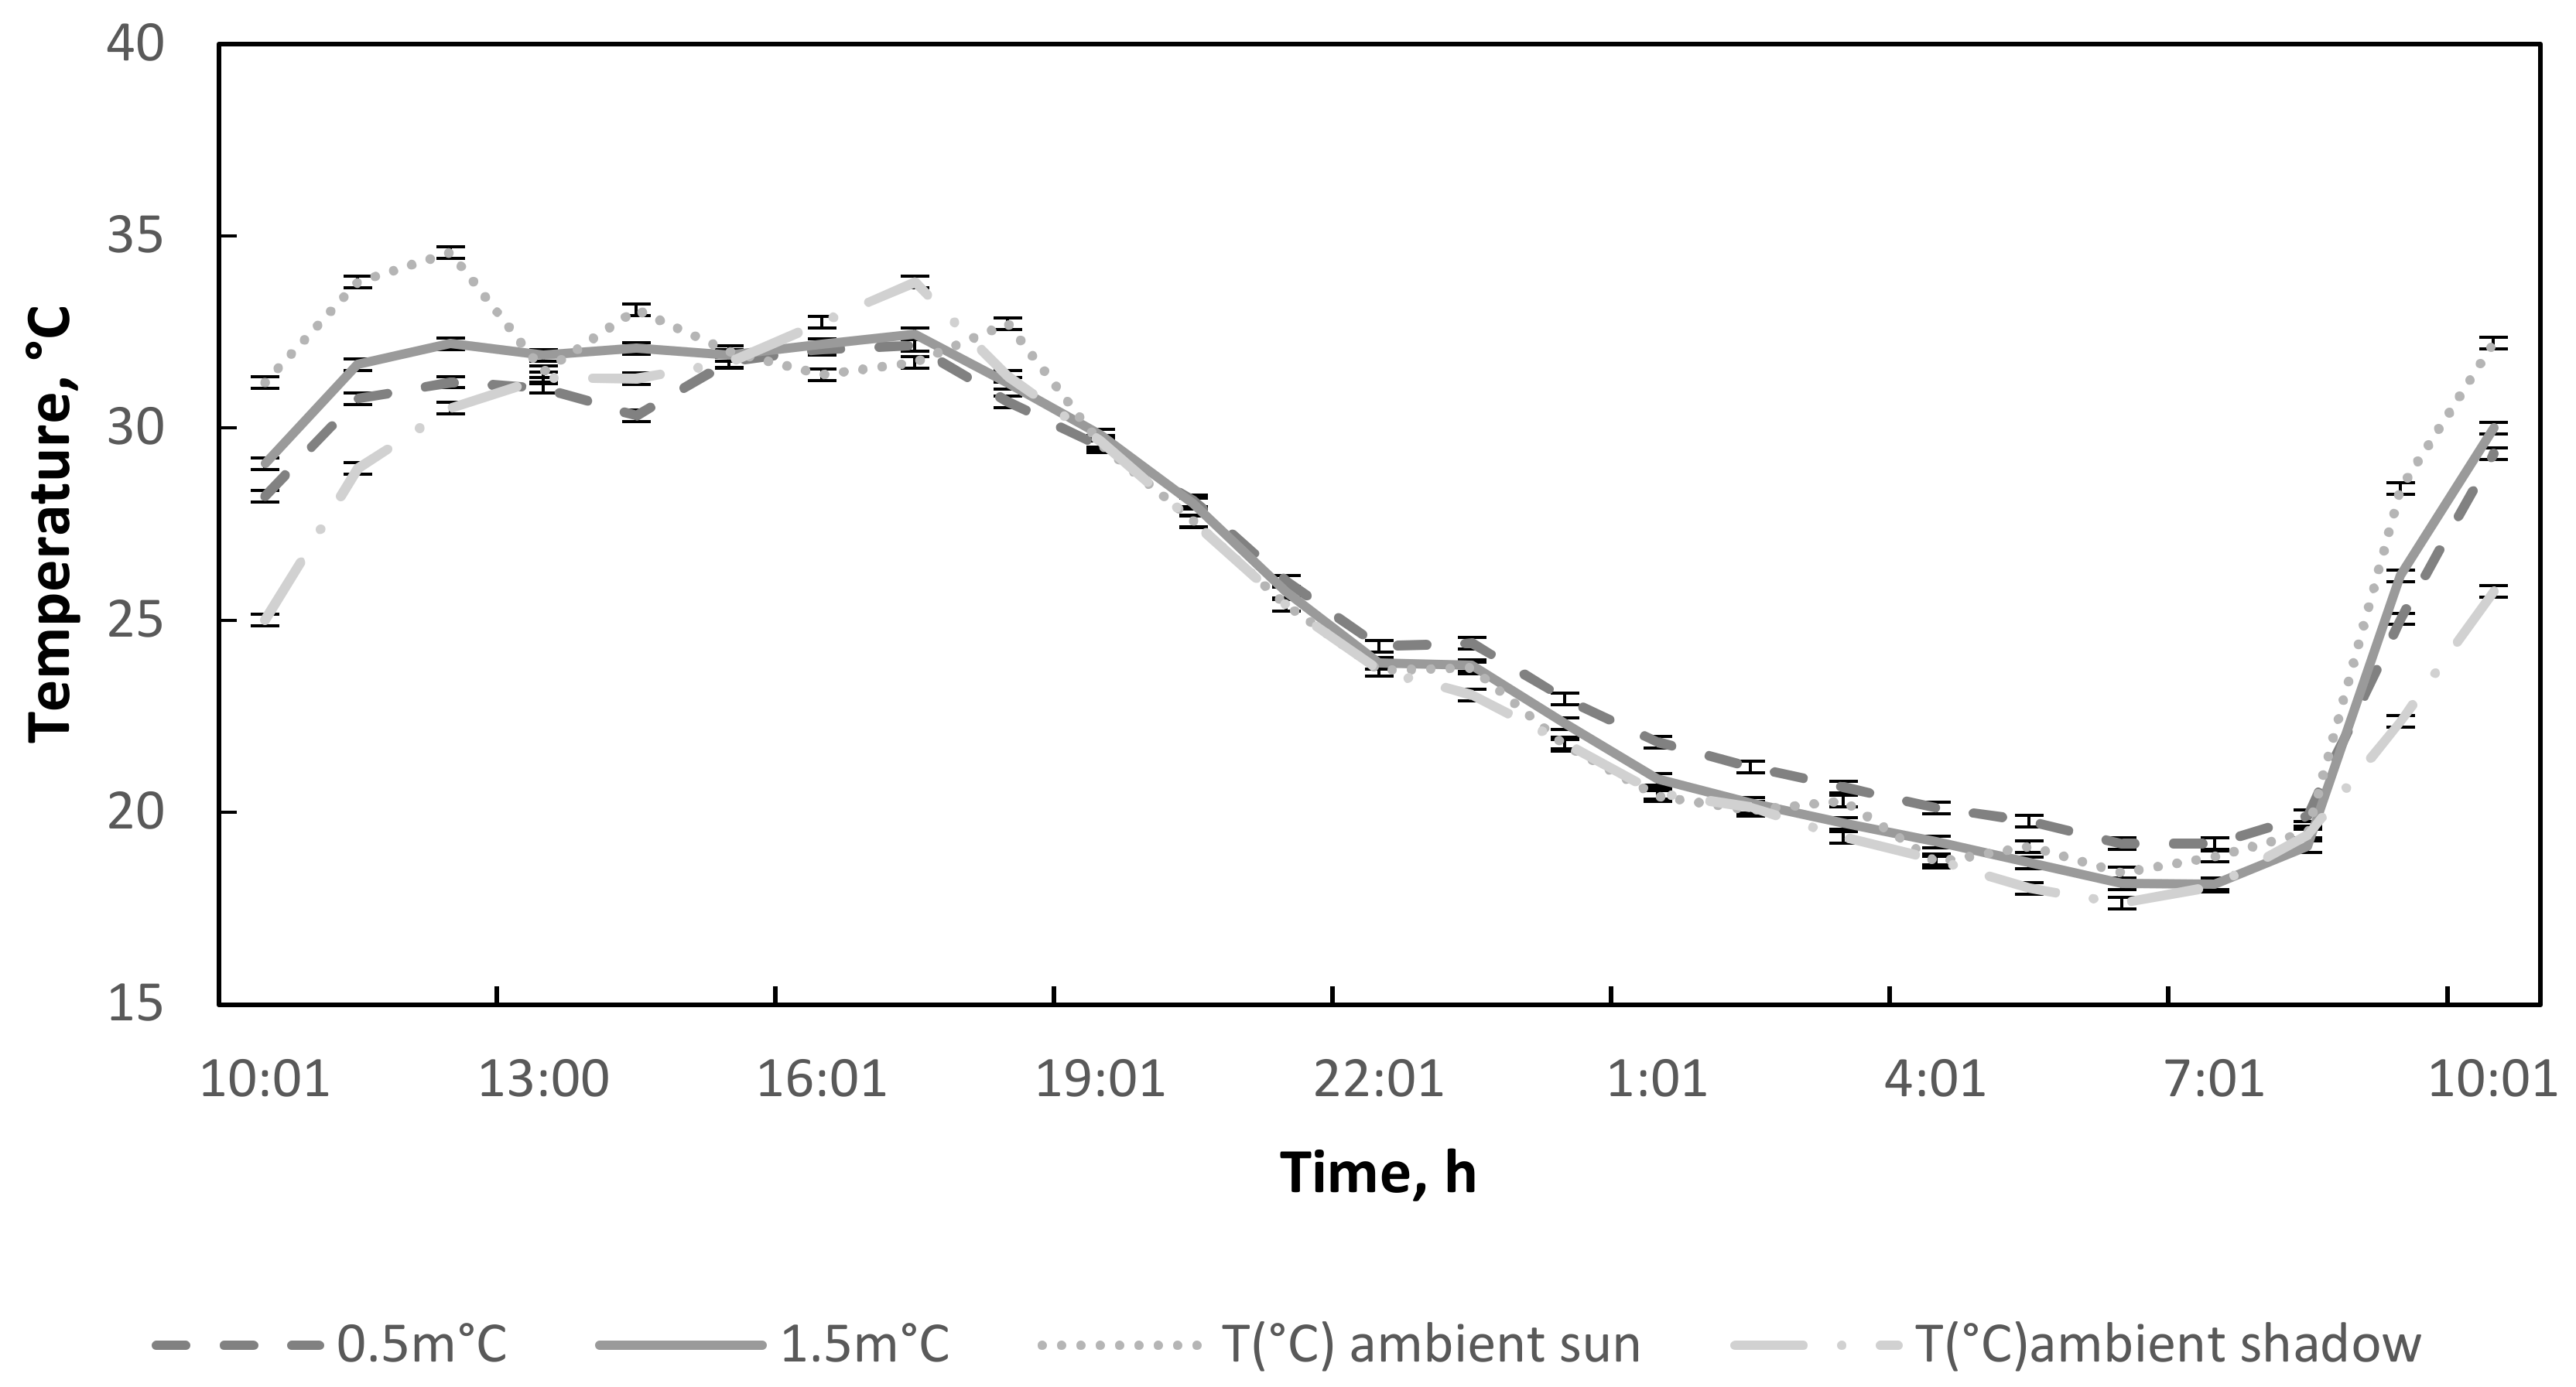
Figure 8 shows the data where the coincidence between the values of ambient temperatures and those of the sensors located inside the insulated aluminum tubes and with the holes drilled can be seen.
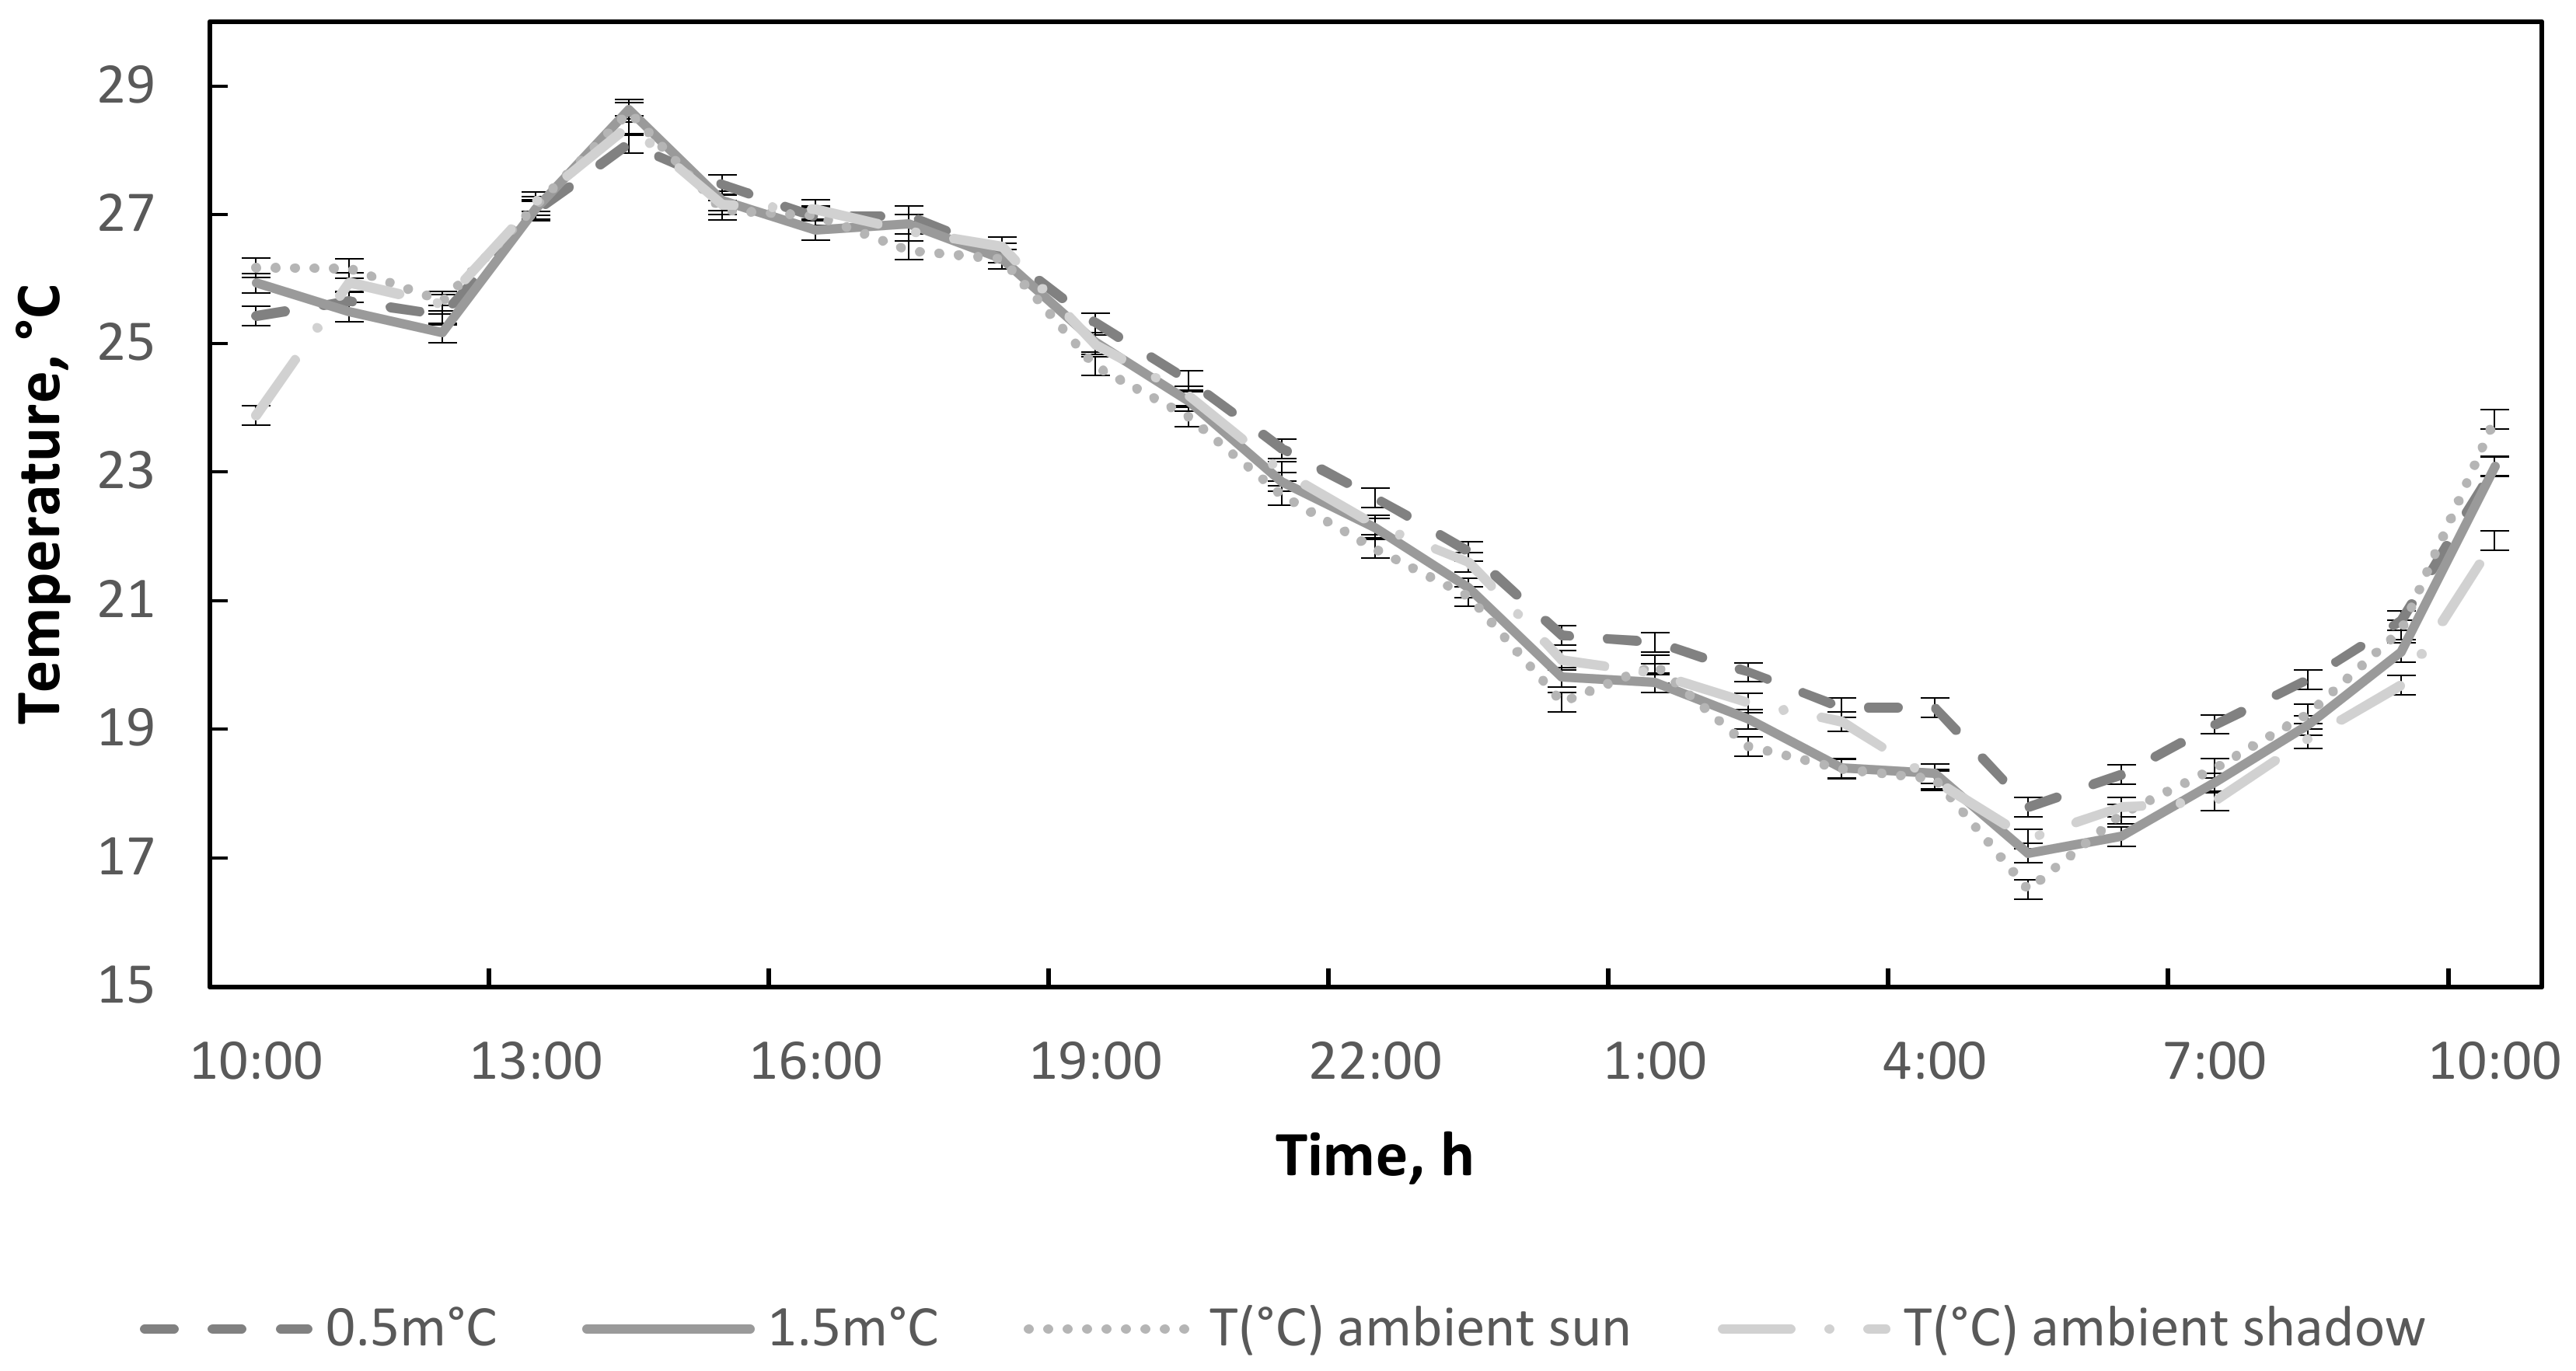
Figure 9 shows the data for the day between 10:00 a.m. on 25 May and 10:00 a.m. the following day, showing the same trend seen above, which confirms that the antivandalism device does not influence the measurements taken by the sensors.
Figure 8 and
Figure 9 show the results obtained, indicating their certainty with the error bar for each measurement. Since the temperature measurements were taken once every hour, the error in the measurements is that provided by the accuracy of the equipment itself, which, according to the indications, had a value of ±0.15 °C. It should be noted that the influence of this error is minimal since, as indicated above, the differences between the sensor located in the sun and one in the shade was one degree or less.
5. Final Comments and Conclusions
The results make it clear that the objective of this study has been achieved. Initially, it was considered implementing protection on the measurement sensors of the control stations due to possible damage or theft that could be caused to them, since the study for which they were designed required them to be located in the streets of the city. For this purpose, an aluminum tube was used as an antivandalism device, since it has a high percentage of reflection of incident solar radiation, with the intention of not affecting the measurements carried out by the sensors that were inside; however, it was quickly observed that they did interfere, producing distortions in the measurements with respect to a control station, placed for this purpose. A study was then carried out by means of discriminated dimensional characterization and the length of the air fluid inlet and the critical radius of the aluminum tube were calculated, with the premise that this should be as small as possible. Thus, the problem was solved by filling the aluminum cylinders with a suitable thickness of polyurethane foam limited inside by another tube, smaller in diameter than the aluminum one, made of polyvinyl chloride (PVC). In addition, the aluminum cylinder was initially provided with 7 mm holes, which did not solve the problem, and finally with 10 mm diameter holes to maintain adequate ventilation and also optimize the convective flow along with a small part in the lower area of the tube that was covered with a dark material, to force the air convection. With these modifications to the prototype, the desired objective was achieved, i.e., to cover and protect the sensors of the measuring stations with a system that prevented damage and theft, without modifying and interfering with the temperature measurements of the sensors inside, the objective for which they were designed. It should be noted that, in the results obtained, in the measurement station under direct sunlight and the one in the shade, both showed differences of just 1 degree or less for most of the day, especially in the central hours, where large differences would be apparent if the device was distorting the measurements, thus achieving the objective set out in this article.
As a final conclusion of this article, it is recommended that in those places where it is necessary to protect temperature sensors from possible acts of vandalism, the device described in this article be used, since it has been designed with discriminated dimensional analysis techniques and the results obtained were adequate. The protection system included an aluminum tube on the outside that had high reflectivity, a polyurethane foam that had low thermal conductivity, and a PVC tube that favored the foam integrity. In addition, to promote air circulation, some holes were made in the tube and the lower part covered with a dark material. If the use of other materials is required to protect the sensors, it is advisable to follow the procedure described in this article, as it will allow optimization and obtaining suitable results.


 ,
, 


