Article

Multicompartmental Mathematical Model of SARS-CoV-2 Distribution in Human Organs and Their Treatment

by
Vasiliy N. Afonyushkin
1,2,3,*,
Ilya R. Akberdin
3,4,5,
Yulia N. Kozlova
2,
Ivan A. Schukin
3,
Tatyana E. Mironova
1,6,
Anna S. Bobikova
1,6,
Viktoriya S. Cherepushkina
1,
Nikolaj A. Donchenko
1,6,
Yulia E. Poletaeva
2 and
Fedor A. Kolpakov
4,5,7
1
Siberian Federal Scientific Center of Agro-BioTechnologies of the Russian Academy of Sciences, 630501 Krasnoobsk, Russia
2
Institute of Chemical Biology and Fundamental Medicine of the Siberian Branch of the Russian Academy of Sciences, 630090 Novosibirsk, Russia
3
Department of Natural Sciences, Novosibirsk State University, 630090 Novosibirsk, Russia
4
Biosoft.Ru, Ltd., 630058 Novosibirsk, Russia
5
Department of Computational Biology, Sirius University of Science and Technology, 354340 Sochi, Russia
6
Federal State Educational Institution of Higher Professional Education, Novosibirsk State Agrarian University, 630039 Novosibirsk, Russia
7
Bioinformatics Laboratory, Federal Research Center for Information and Computational Technologies, 630090 Novosibirsk, Russia
*
Author to whom correspondence should be addressed.
Submission received: 13 April 2022 / Revised: 26 May 2022 / Accepted: 28 May 2022 / Published: 4 June 2022
(This article belongs to the Special Issue Mathematical and Computational Methods in Systems Biology)

Abstract

:
Patients with COVID-19 can develop pneumonia, severe symptoms of acute respiratory distress syndrome, and multiple organ failure. Nevertheless, the variety of forms of this disease requires further research on the pathogenesis of this disease. Based on the analysis of published data and original experiments on the concentrations of SARS-CoV-2 in biological fluids of the nasopharynx, lungs, and intestines and using a developed modular model of the virus distribution in human tissue and organs, an assessment of the SARS-CoV-2 reproduction in various compartments of the body is presented. Most of the viral particles can transport to the esophagus from the nasopharynx. The viral particles entering the gastrointestinal tract will obviously be accompanied by the infection of the intestinal epithelium and accumulation of the virus in the intestinal lumen in an amount proportional to their secretory and protein-synthetic activities. The relatively low concentration of SARS-CoV-2 in tissues implies an essential role of transport processes and redistribution of the virus from the nasopharynx and intestines to the lungs. The model simulations also suppose that sanitation of the nasopharynx mucosa at the initial stage of the infectious process has prospects for the use in medical practice.

1. Introduction

The current state of and predictions for the SARS-CoV-2 pandemic constitute unprecedented threats to humanity both in public health and economic terms. The number of people infected with severe acute respiratory syndrome caused by coronavirus two (SARS-CoV-2), the causative agent of COVID-19, is growing rapidly worldwide. Patients with COVID-19 can develop pneumonia [1,2], severe symptoms of acute respiratory distress syndrome (ARDS), and multiple organ failure [1,3]. Extraordinary research efforts have taken place to investigate molecular mechanisms of COVID-19 pathogenesis and virus–host interactions and develop effective treatment drugs, as well as vaccines, in order to curb the spread of the pandemic since early 2020.
Primary contact with the virus occurs mainly through airborne droplets. When inhaled, the main part of the microbial–viral aerosol is deposited on the surface of the nasal mucosa. However, some aerosol particles can enter the trachea and bronchi and multiply in ciliary and secretory cells [4]. Since the upper respiratory tract is quite efficiently capable of eliminating viral particles due to the activity of the mucociliary apparatus, the bulk of the viral particles should enter the nasopharynx. Due to the fact that the virus is firstly able to be released into the external environment by means of the mechanisms of secretion, the role of secreting cells—in particular, cells secreting mucin—seems to be decisive in the accumulation of viral particles in the phase of the immune response [4]. The presence of both the ACEII receptor and the serine protease TMPRSS2 in goblet cells also suggests a crucial role in the accumulation of SARS-CoV-2 in the body of mucin-secreting mucous membrane cells [4,5,6]. The most intensive synthesis of secreted mucins occurs in the epithelium of the nasopharyngeal region [7], intestines, and salivary glands. It can be assumed that the synthesis and secretion of viral proteins and viral particles should correlate with the activity of the protein-synthetic and secretory apparatus of the cell. The published data on the distribution of SARS-CoV-2 in the body at the initial stage of the infectious process seem to be less objective and are disputed (controversial). The possibilities of in vivo detection of the virus in the human lungs and small intestine are very limited. The analysis of the viral reproduction activity should also take into account the differences in the kinetics of protein synthesis and secretion of cells affected by the virus in different organs and tissues of the organism.
Herein, we describe a new multicompartmental model representing the SARS-CoV-2 de novo infection, virus production, and distribution among three human organs where the virus is mostly abundant according to the experimental data. The model takes into account the action of three different therapies, providing more insights into the SARS-CoV-2 pathogenesis and maybe the in silico test site for the development of the most effective and precise antiviral therapy. Furthermore, by using the sensitivity analysis, we have established that the fraction of uninfected target cells is sensitive to a different set of parameters depending on the compartment. The results of the analysis suggest a treatment strategy for inactivating the SARS-CoV-2 virus at the initial stage of the infection via the nasopharyngeal gate.

2. Materials and Methods

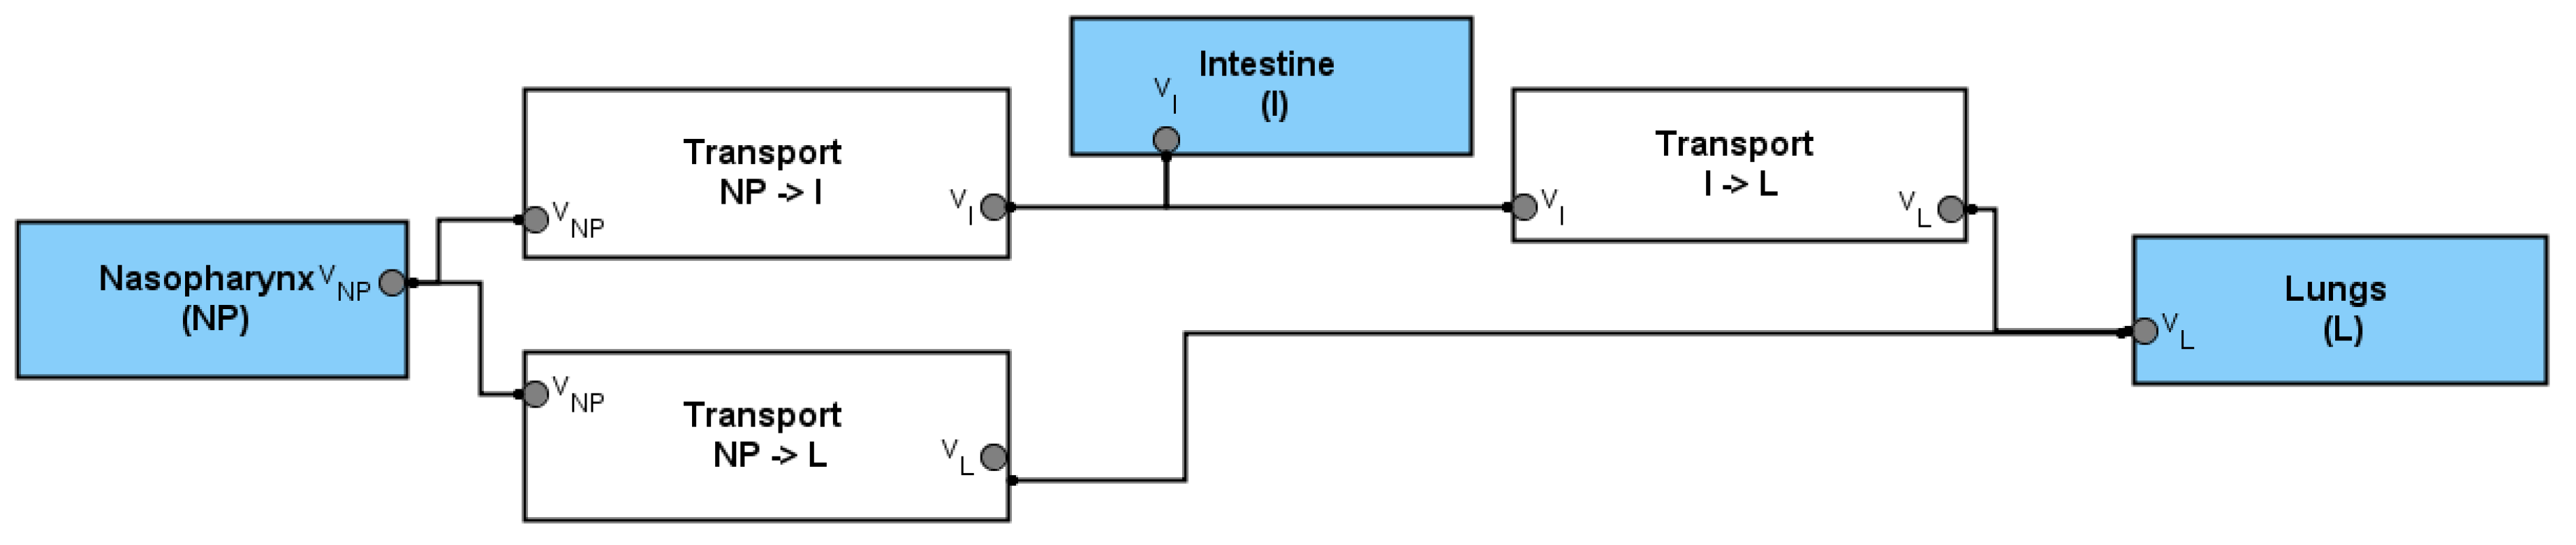
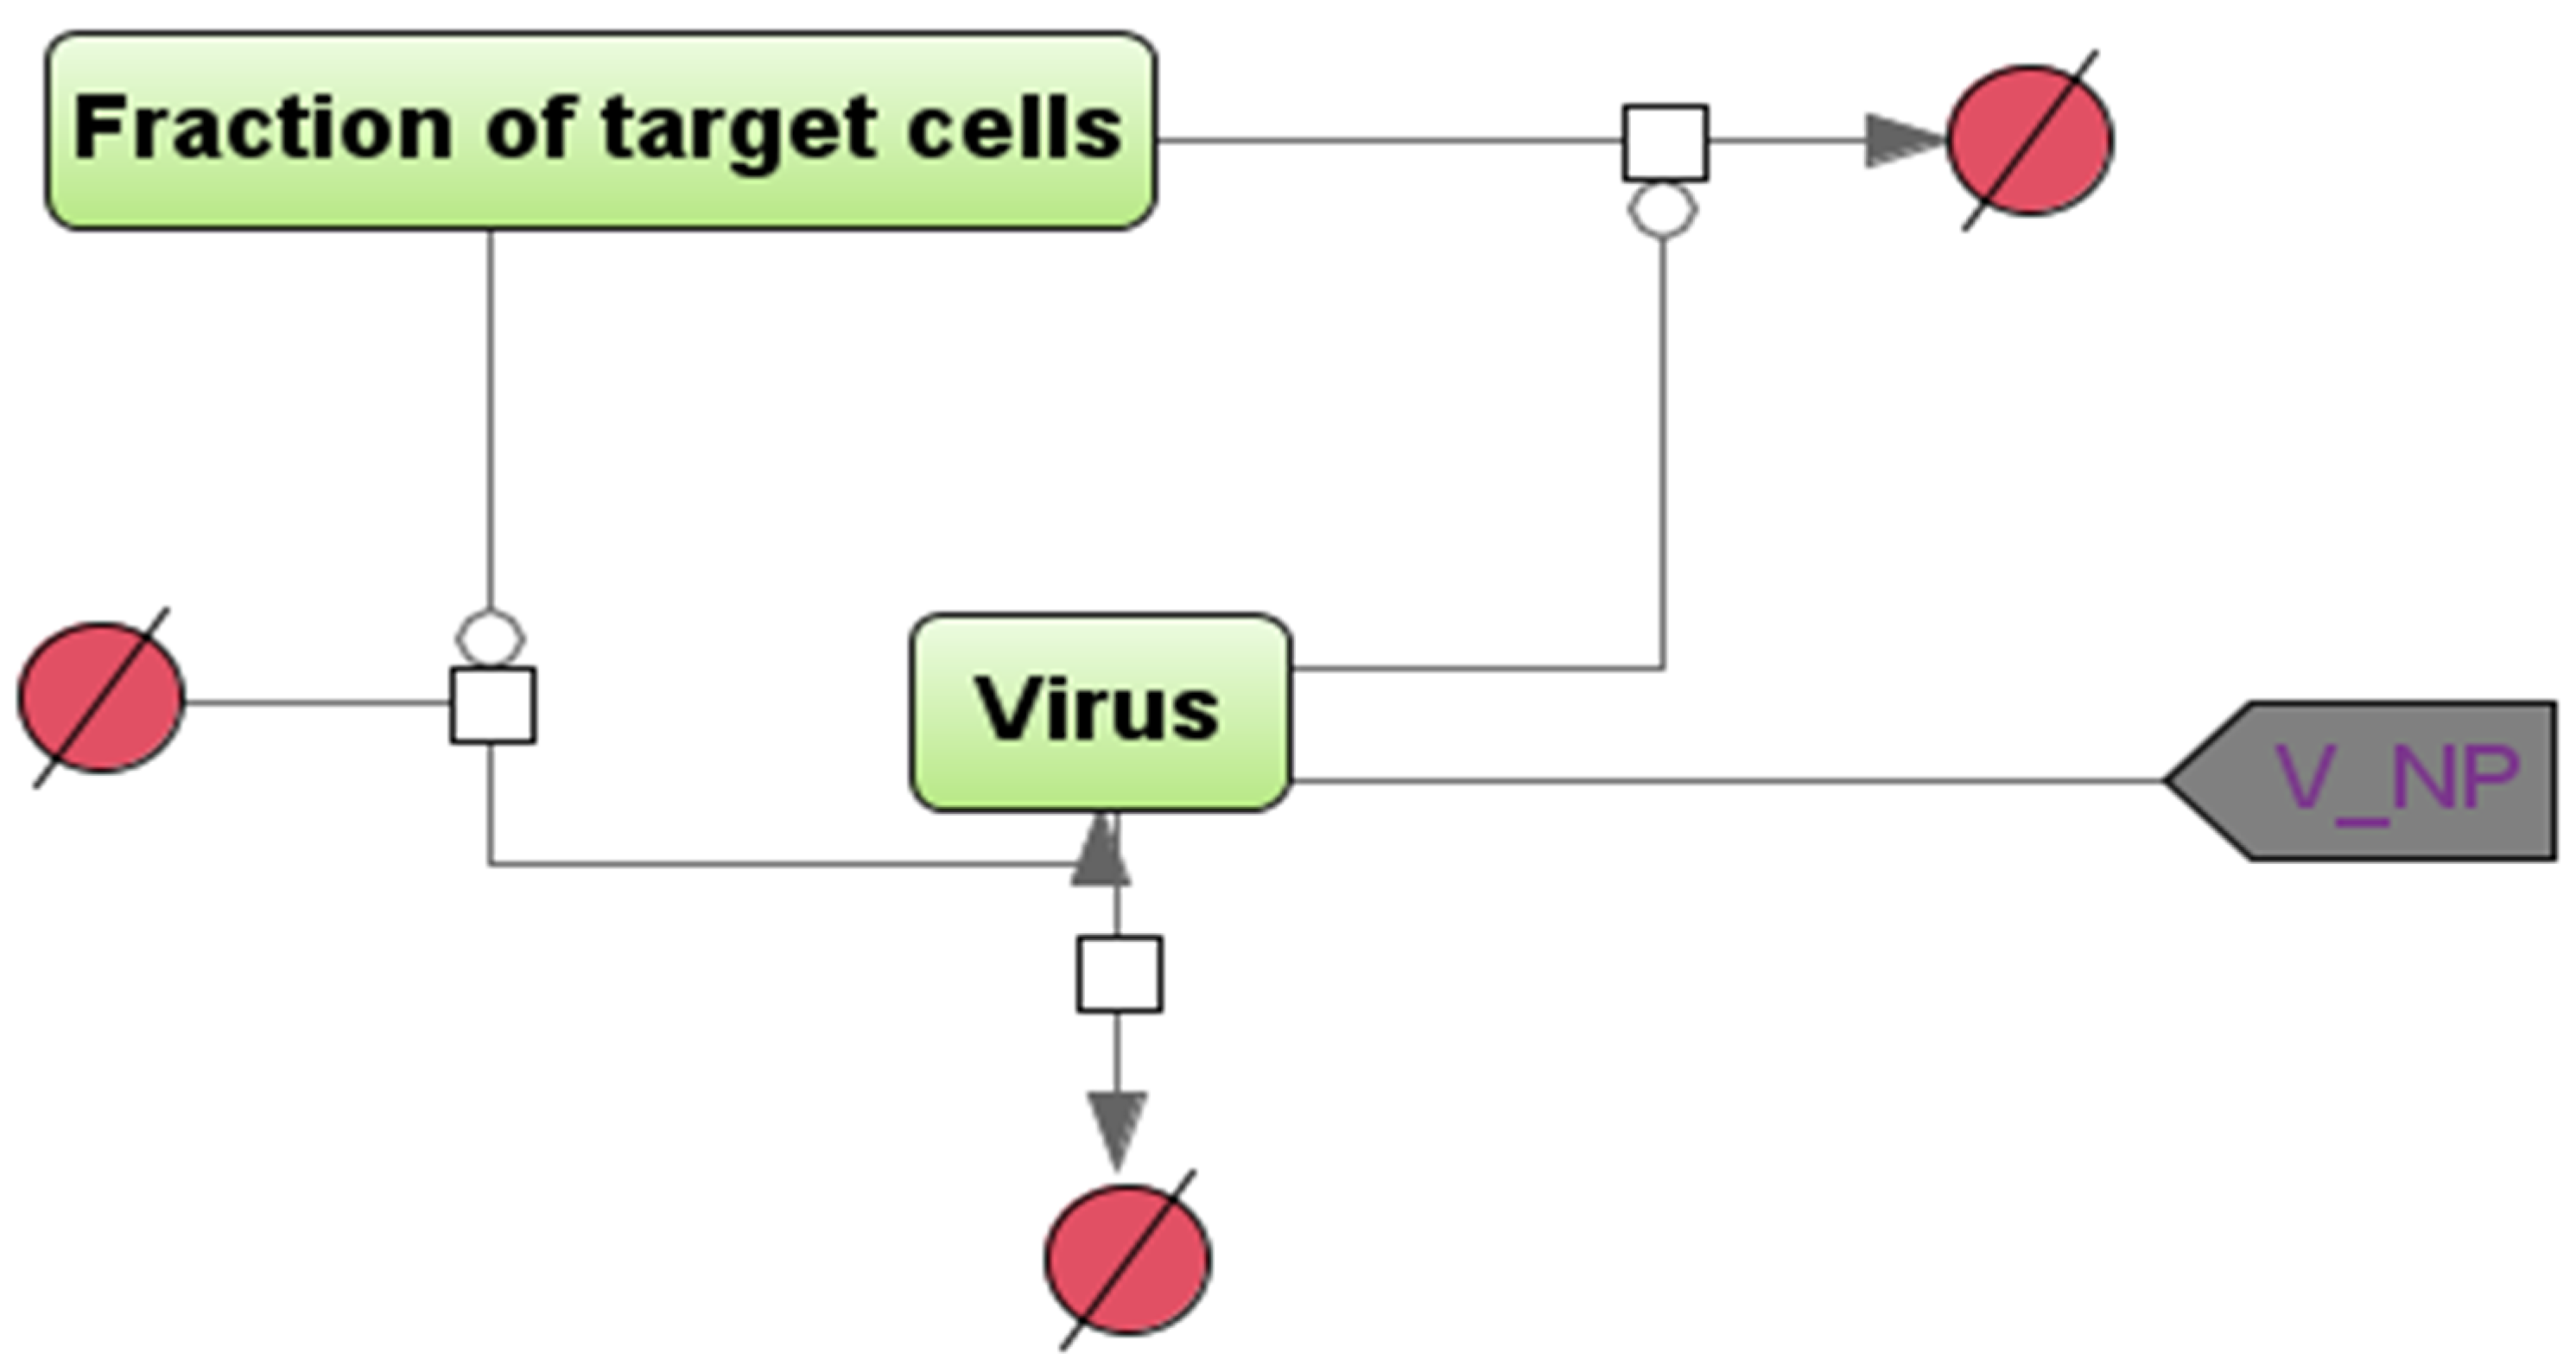
2.1. Mathematical Modeling

The multi-compartmental model of the infectious process has been built by using a modular approach implemented in the BioUML platform which supports the main standards of the systems’ biology, modular, and visual modeling [8]. In the frame of the approach, the biological system is considered as a set of interconnected subsystems or modules. Each module is a mathematical model which can be investigated and simulated independently. The integration of these modules results in a more complex model of the whole system. Modules may leverage different mathematical formalisms and scales and may be viewed as replaceable parts. Modules provide explicit interfaces (variables and constant parameters) represented by ports and through which they can be connected without exposing their inner structure. According to the methodology of the model development process, the presented integrated model and all submodels were constructed as visual diagrams, where each component of the diagram represents a corresponding mathematical object, such as a variable, a reaction, or an equation. The visual representation and the defined properties of diagram elements are the basis for the automatic generation of the corresponding Java code that is used to simulate the model in BioUML. All methodological details on visual modular modeling implemented in the platform are presented in the recent publication [9].
The modular model describes the accumulation and degradation of viral particles in the nasopharynx, intestines, and lungs, including the transport processes of viral particles along the gastrointestinal tract and circulatory system, which also affect the dynamics of changes in the viral load in these organs (or compartments in the model) of the body.
The developed model consists of five modules: three modules represent the infection of sensitive cells with the SARS-CoV-2 virus and its reproduction in the corresponding compartment (nasopharynx, NP; intestine; and lungs), and two virus transport modules from NP to intestine and lung (transport from NP to intestine and lung) and through the bloodstream from intestine to lung (transport from intestine to lung) (Figure 1).
In each compartment, the model describes the primary entry of the virus into the compartment; the change in the proportion of susceptible cells (which decreases over time, as the cells become infected with the virus); and the number of viral particles due to the processes of replication, degradation, and transport of the virus from/to other compartments (Figure 2). The kinetic laws of the simulated processes and the majority of the parameter values originated from the recently published quantitative model used to compare within-host SARS-CoV-2, MERS-CoV, and SARS-CoV dynamics [10]. It is worth noting that the original one-compartment model was fitted to the viral load trajectory obtained on the basis of the nasopharyngeal and oropharyngeal swabs from 30 individual SARS-CoV-2 patients not under antiviral treatment from Singapore, China, Germany, and Korea.
The developed modular model of the virus infection and distribution between three compartments is described as a system consisting of six differential equations with delay arguments and 22 kinetic parameters (Table 1):
d f n p d t = ( 1 ϵ H 1 ) β n p f n p V n p
d V n p d t = ( 1 ϵ H 1 ) ( 1 ή H 2 )   γ n p f n p V n p ( t τ r n p ) 1 1 θ H 3 δ n p V n p ( t τ d n p ) K t r n p I V n p ( t τ t n p I ) K t r n p L V n p ( t τ t n p L )
d f I d t = β I f I V I
d V I d t = K t r n p I V n p ( t τ t n p I ) + ( 1 ϵ H 1 ) ( 1 ή H 2 )   γ I f I V I ( t τ r I ) 1 1 θ H 3 δ I V I ( t τ d I ) K t r I L V I ( t τ t I L )
d f L d t = β L f L V L
d V L d t = K t r n p L V n p ( t τ t n p L ) + K t r I L V I ( t τ t I L ) + ( 1 ϵ H 1 ) ( 1 ή H 2 )   γ L f L V L ( t τ r L ) 1 1 θ H 3 δ L V L ( t τ d L )
where np, L, and I are the nasopharynx, lungs, and intestines, respectively; βi is the rate constant of the virus infection in the corresponding compartment; γi is the maximum rate constant of the virus replication depending on the compartment; δi is the death rate of infected cells (and viral particles in these cells, respectively); fi is the proportion of cells sensitive to infection; and Vi is the number of viral particles in the corresponding compartment. Moreover, τri, τdi, and τti are time-delay parameters associated with the processes of replication and assembly of the viral particles; degradation of infected cells and viral particles, including the impact of cellular and humoral immune-mediated responses; and transport of viral particles from one compartment to another ( t r n p I —transport from the NP to the intestine; t r n p L —transport from the NP to the lung; t r I L —transport from the Intestine to the lung), respectively.
Furthermore, ϵ, ή, and θ are the constants of the effectiveness of external and/or additional factors limiting the infectious process (0 < ϵ, ή, θ < 1): ϵ = 1 corresponds to the complete suppression of the mechanisms of cell infection; ή = 1 reflects 100% efficiency of the inhibition of viral replication and assembly of viral particles in infected cells; and θ = 1 denotes the cytotoxic activity of effector T cells/drugs.
Finally, H1, H2, and H3 are Heaviside step functions, i.e., H(t) = 0 if t < t′. Otherwise, H(t) = 1, where t′ corresponds to the inhibition of infection, replication, and assembly of viral particles; activation of the cytotoxicity of an infected cell; or a combination of these factors.
Figure 2. A schematic diagram describing the multiplication and inactivation of the virus in a certain compartment (the NP module is shown as an example), in the SBGN format [8]. “Fraction of target cells” is the proportion of cells sensitive to the infection, and “Virus” is the number of viral particles in a given compartment of the model. The vertices in the bipartite graph in the form of white squares correspond to the reactions in the model, the rate equations of which are given below in the system of ordinary differential equations. To account for the transport of viral particles from the NP module to the intestine and lung, a “contact”-type port (gray color) is used within the modular approach in BioUML.
Mathematics 10 01925 g002
Table 1. Kinetic parameters of the modular model of SARS-CoV-2 infection and distribution between the three compartments.
ParameterThe ValueUnits of MeasureReferences
β n f 5.2 × 10⁻⁶(copies/mL)−1 × days−1[10]
β I 5.2 × 10⁻⁶(copies/mL)−1 × days−1Assumption 1 [10,11,12]
β L 5.2 × 10⁻⁶(copies/mL)−1 × days−1Assumption 1 [10,11,12]
γ n f 4.0day−1[10]
γ I 5.0day−1Assumption 2
γ L 1.0–2.0day−1Assumption 2
δ n f 0.23–0.93day−1[10]
δ I 0.46day−1[11]
δ L 0.046day−1[12]
V n f 100–100,000copies/mLAssumption
τ r n f 0.05day[13]
τ r I 0.05day[13]
τ r L 0.05day[13]
τ d n f 0.1dayAssumption
τ d I 0.1dayAssumption
τ d L 0.1dayAssumption
τ t n p I 0.05dayAssumption
τ t n p L 0.05dayAssumption
τ t I L 0.05dayAssumption
K t r n p I 0.6day−1Assumption 3 [14]
K t r n p L 0.03–0.00048day−1Assumption 3 experiment
K t r I L 0.03–0.0001day−1Assumption 3 experiment
θ I0.3–0.8dimensionlessAssumption 4
θ L0.8dimensionlessAssumption 4
θ NP0.53–0.8dimensionlessAssumption
ϵ I 0.5–0.995dimensionlessAssumption 4
ϵ L 0.9–0.995dimensionlessAssumption 4
ϵ N P 0.7–0.995dimensionlessAssumption 4
t i m e θ I 13day[15]
t i m e θ L 8dayAssumption 4
t i m e θ N P 6day[15]
t i m e ϵ I 1–14dayAssumption 4
t i m e ϵ L 9dayAssumption 4
t i m e ϵ N P 1–7day[15]

2.2. Model Assumptions

Assumption 1.
The infection rate is the same in all considered compartments.
Due to the lack of quantitative data on the infection rate in the epithelial cells of the human intestine or lungs, we assumed that the parameter value in both compartments is the same as in the nasopharynx.
Assumption 2.
The synthesis and secretion of viral particles are limited by the activity of the protein-synthetic and secretory apparatus of the host cell.
Besides the use of previously published kinetic parameters’ values (Table 1), we employed expert evaluation for unknown parameters in order to fit the simulated viral load dynamics to experimental data [10]. The value of the maximum rate constant for viral replication in the nasopharynx, γnp, was originated from the study [10] and equals 4.0 day−1, while the parameter value in the intestine was higher (5.0 day−1) due to the greater ability of the intestinal mucosa to protein synthesis and cell division [11]. The maximum constant rate for viral replication in the lung has to be 10 times less than in the intestine. However, the parameter value in the lung was increased (Table 1), as the model does not consider a significantly lower rate of the viral elimination from the lung alveoli.
The mucous membrane in the area of the nose and nasal sinuses occupies an area of 120–200 cm2 [16,17], where up to 15% of cells can be occupied by Goblet cells [7,17]. The number includes those that are capable of producing SARS-CoV-2 [4] and mucin. The total production of mucus by the upper respiratory tract is up to 2 liters, which provide mucociliary clearance in the process of passing through the upper respiratory tract ~12 m3 of air per day [18]. If we subtract the volume of mucus of the trachea and saliva from the total volume of mucus, then we can estimate the production of ~400–500 mL of fluid by the nasopharyngeal region per day. Most of the mucus, apparently, dries up while moistening the incoming air, and part of the mucus from the deep parts of the nasal sinuses also flows down to the pharynx, making contact with the tonsils. At the initial phase of the infectious process (4–5 days from the onset of symptoms), the concentration of the virus in the nasopharyngeal region can reach 108 copies of viral RNA per 1 mL [19], which should correspond to the daily production of the virus in the amount of ~1010–1011 copies of the viral RNA.
The average daily volume of mucus produced by the bronchi and tracheal mucosa ranges from 10 to 100 mL [20], while the concentration of the virus in the bronchoalveolar lavage can fluctuate between 2 × 206 and 2.6 × 608 copies of viral RNA in 1 mL. It means that the daily isolation of the virus can reach values of 109–1010 copies of the viral RNA in the lungs.
Entering the gastrointestinal tract of viral particles in an amount equivalent to ~1010–1011 copies of viral RNA will obviously be accompanied by the infection of the intestinal epithelium and accumulation of the virus in the intestinal lumen in an amount proportional to the number of cells susceptible to the infection multiplied by their secretory and protein-synthetic activity. Similar mechanisms of cross-infection of both the intestine and the lungs have been described, for example, in rhinovirus infection and coronavirus OC43 infection [21].
A very large area of the mucous membrane of the gastrointestinal tract (~100–300 m2), combined with a high activity of protein synthesis, cell division with a very high rate of mucosal renewal (48–72 h) [22], and elimination contents of the gastrointestinal tract, should contribute to the formation of large amounts of the viral particles. In comparison with the gastrointestinal tract, the respiratory epithelium in the lungs is renewed approximately every 22–35 days [11]. It results in a lower rate of protein synthesis in the tissue. At the same time, the histological structure of the alveoli implies that the rate of purification of their contents is comparable to the rate of synthesis of biopolymers and desquamation of cells of the respiratory epithelium into the lumen of the alveoli.
Assumption 3.
The transport rate of the viral particles from the nasopharynx to the intestine is much higher than the parameters from the nasopharyngeal region to the lungs.
Transport rate constant, K t r n p I , for the virus transport from the nasopharynx to the intestine limited only by virus preservation in the acidic gastric medium [14] has the greatest value, while K t r I L , the parameter value of the virus transfer from the intestine to the lung via blood and lymphatic systems, was experimentally measured (see below). The value of K t r n p L , representing transport from the nasopharynx to the lung, is less than it is in the intestine due to more pronounced barrier properties of the nasopharynx mucosa compared to the intestinal.
Assumption 4.
The onset of adaptive immune response in the lungs occurs earlier than the formation of local antiviral reactions of the adaptive immunity in the intestine.
The symbol ϵ indicates reactions of the humoral immune response, and the time of its activation’s initiation, t i m e ϵ , differs between compartments depending on the timeframe of the virus emergence in corresponding compartments. The timing of CD4+ T lymphocyte differentiation is certainly the same in all compartments. Nevertheless, we take into account the non-simultaneous accumulations of the antigen in different compartments as the infection process gradually generalized and the incubation period ended [2]. The nasopharynx is characterized by the presence of a fairly effective immune system, including tonsils, regional lymph nodes, and a diffuse lymphatic system [11,23]. Since this compartment is the very first location where the virus accumulates, the immune response will be the earliest here. According to the literature sources, the average duration of the incubation period is 5.1 (95% CI, 4.5 to 5.8 days) [24], and this is comparable to the appearance of early antibodies of the class M and T lymphocytes 5 days after exposure to the antigen [25]. Furthermore, the average time of dyspnea onset reaches 8 days from the time of symptoms onset [1]. We suggest that the symptom complex corresponds to the lungs damage by the virus and leukocytes in framework of the COVID-19 pathogenesis. The summation of the incubation period [24] with the time of the dyspnea development [1] correlates with the sum of two temporal cycles of T and B lymphocytes’ differentiation and proliferation, including immune memory cells [25,26,27], and is 12–14 days from the time of infection. The onset of adaptive immunity formation in the intestine, as we assume, becomes possible not after a contact with a viral agent, but after the entry of CD4+ T lymphocytes from the regional lymph nodes of the nasopharynx or lungs into the system circulation, causing inflammation in the intestine [28]. Therefore, the formation of local adaptive immunity in the intestine is realized last in our model. We shift the onset of adaptive immunity formation in the lungs relative to the nasopharynx due to the later entry of viral particles and/or viral antigens along the lung/intestine axis [28,29]. The timing of viral RNA detection in the nasopharynx and in sputum from the lungs did not exceed 6 days [27]. Due to the migration of CD4+ T lymphocytes into the lung tissue during the period of the appearance of viral antigens there, we set the time for the formation of an early immune response to be 8 day post-infection. Thus, the next cycle of maturation and reproduction of lymphocytes, including those from the first generation of memory cells, will cause a sharp increase in the number of immune-mediated lungs damage in 8 days after the onset of symptoms according to the publication [1].
The time required for the maturation of B lymphocytes is somewhat longer due to the need for differentiation of B lymphocytes into plasma cells and the accumulation of a sufficient number of antibodies. Therefore, the activation onset of cellular and humoral immunity in our model differs by 1 day for all compartments (Table 1).
In addition to that, values of ϵ and θ parameters in the model depend on the compartmental identity in the manner: iLung > iNP > iI, where i ∈ (ϵ; θ), while values of the δ parameters depend on the identity in the opposite manner: iI > iNP > iLung. The greatest value of the parameter is in the intestine due to the initially fast renewal rate of the intestinal mucosa (no more than three days), while the parameter value in the nasopharynx is lower because of the lesser renewal rate of multilayered epithelium.

2.3. Model Simulation and Sensitivity Analysis in BioUML

We numerically solved the model equations by using an ordinary differential equation JVode solver built into the BioUML, with default settings and time increment equals to 0.1 day. Sensitivity analysis [30] implemented in the platform was utilized to investigate the effect of the parameter change on the model solution considering the target cell ratio (fi) in each model compartment as target variables (Table 1). According to the basic, the method calculates sensitivity measures associated with the steady state of a spatially homogeneous reaction system:
d c d t = f ( c , k , t ) c ( 0 ) = c 0
where c s s ( k i ) and c s s ( k i + k i ) indicate solutions of the algebraic systems f ( c , k i ) and f ( c , k i + k i ) , correspondingly, while the scaled sensitivities are calculated by multiplying each component c α k i of the vector c k i by the normalization factor k i c α s s ( k i ) . As a result of the analysis, we used the scaled sensitivity measures (see below).

2.4. Mathematical Modeling of Sanitation with Virucidal Medications of the Nasopharynx and Intestines

To investigate the effect of sanitation by virucidal medications in different compartments of the body on the viral dynamics, we increased the value of parameter ϵ up to 0.995, indicating 99.5% efficiency of the de novo infection blocking, and set the timeframe of its activation to the first day post-infection (in the nasopharynx only (Case 1) and in both compartments (Case 2). To computationally estimate the effect on the outcome of the dynamics, simulations were performed by using different initial infection doses: from 102 to 106 viral particles.

2.5. Evaluation of the Transfer Efficiency of Model Viral Particles from the Nasopharynx to the Esophagus and Trachea, with Airborne Infection

Spraying of the bacteriophage MS2 virus, which is used as a phage model to mimic the behavior of specific human viruses in aerosols [31], was performed on Balb/c mice (n = 12) in an aerosol chamber with a volume of 1 m3. A nebulizer NEB Pro (MicroLife) was used to generate the aerosol. The average droplet size was 10.15 µm. Then 9 mL of bacteriophage MS2 suspension at a concentration of 2 × 10⁸ PFU/mL was sprayed for 40 min. The final concentration of the bacteriophage was 1.8 × 10⁶ PFU/liter of the air.
The culture of E. coli CEMTK 3877 (collection of extremophilic microorganisms of ICBFM) was used as a test strain.
One group of mice (Balb/c, males, n = 6) was taken out of the experiment post 1 h after bacteriophage spraying, while the second one (n = 6) was taken out of the experiment post 2 h and 30 min after the spraying. The trachea, esophagus, and lung were taken, and blood samples were also taken from the left and right ventricles of the heart; the average time for sampling was 15 min. The organ was homogenized by using ceramic beads, and serial dilutions of the homogenate were made. The bacteriophage concentration was determined by the Gratia method.

2.6. Experimental Evaluation of the Efficiency of Viral Particles Transport from the Intestines to the Lungs through the Circulatory and Lymphatic Systems

Bacteriophage ph 57 (deposited in the collection of Extremophilic Microorganisms and Type Cultures of the Institute of Chemical Biology and Fundamental Medicine of the Siberian Branch of the Russian Academy of Sciences, registration number WFCC #974) [32] was used as an in vivo model to assess the efficiency of transport of viral particles from the intestines [33] to the lungs’ circulatory system, K t r I L , while a P. aeruginosa (WFCC #670) cell culture was employed to determine phage particle activity. The bacteriophage was once administered intragastrically to Balb/c mice (n = 12) by using a special probe at a dose of 200 μL per animal. The initial concentration of the bacteriophage was 1.8 × 10⁸ PFU/mL. A group of mice was taken out of the experiment after 2 h. The organs were homogenized by using ceramic beads, and serial dilutions of the homogenate were made. The residual concentration of bacteriophage inoculations was determined in 10-fold dilutions. The survival rate of phage particles was determined by the method of two-layer agar (Gratia method). The ratio of the number of bacteriophages in the intestine to the number of bacteriophages in the lungs was calculated by dividing the total number of bacteriophages in the mouse intestine by the total number of bacteriophages in the lungs. The studies were carried out at room temperature (30 ± 2 °C). All experiments were performed in triplicate.

2.7. Statistical Data Processing

The data were processed by the methods of variation and nonparametric statistics. The level of statistical significance of differences was assessed by using Mann–Whitney (p-value < 0.05 was considered as statistically significant). We also considered such statistical indicators as the confidence interval and Shapiro–Wilk W.

3. Results

3.1. Viral Particles’ Distribution in Trachea, Lungs, and Esophagus after Airborne Infection

After contact of mice with an aerosol of a model virus (bacteriophage MS2) at the initial concentration of 1.8 × 10⁶ PFU/L, the bacteriophage concentration statistically significantly decreases by 0.61 Log10 (U emp = 3 (p-value < 0.01)) post 1.5 h, as follows from Table 2. The data allow us to propose the effectiveness of the mucociliary clearance that reduces the concentration of viral particles in the trachea by 2.6 times in 1 h.
The number of bacteriophages in the lungs was higher than in the trachea. However, a statistically significant reduction of the bacteriophage was not observed (see Table 2). According to the experimental model, no more than 3837 viral particles per hour can be eliminated from one lung via mucociliary clearance of the bronchial airway. The possible rate of the virus elimination in the lungs was no more than 1.21% of the detected number of viral particles in the lungs per hour.
Furthermore, there is a trend of bacteriophage concentration reduction in the trachea by 0.61 Log10 post 1.5 h (p-value < 0.01), while the trend is not observed in the esophagus. The latter creates prerequisites for the long-term transport of viral particles from the nasopharynx to the esophagus after aerosol and/or airborne droplet infection.

3.2. The Efficiency of the Viral Particles Transport from the Intestines to the Lungs

According to the experimental results, the appearance of ph57 bacteriophage (Figure 3a,b) in the lungs was observed within an hour post-onset intragastric administration of the bacteriophage. On average, 5194 ± 1666 bacteriophage particles were found in the gastrointestinal tract of the experimental mice 1 h later. Up to 3.65% of the bacteriophage (out of 4845 phage particles surviving after passing through the stomach) was detected in the lungs of mice with normal mucosal permeability. Thus, the ratio of bacteriophage numbers in the lungs to the ones in the gastrointestinal tract was 1:256.08 ± 166 (M ± SD) for an hour (see Supplementary Table S1, where the original data on bacteriophage particles in the gastrointestinal tract and in the lungs are presented).

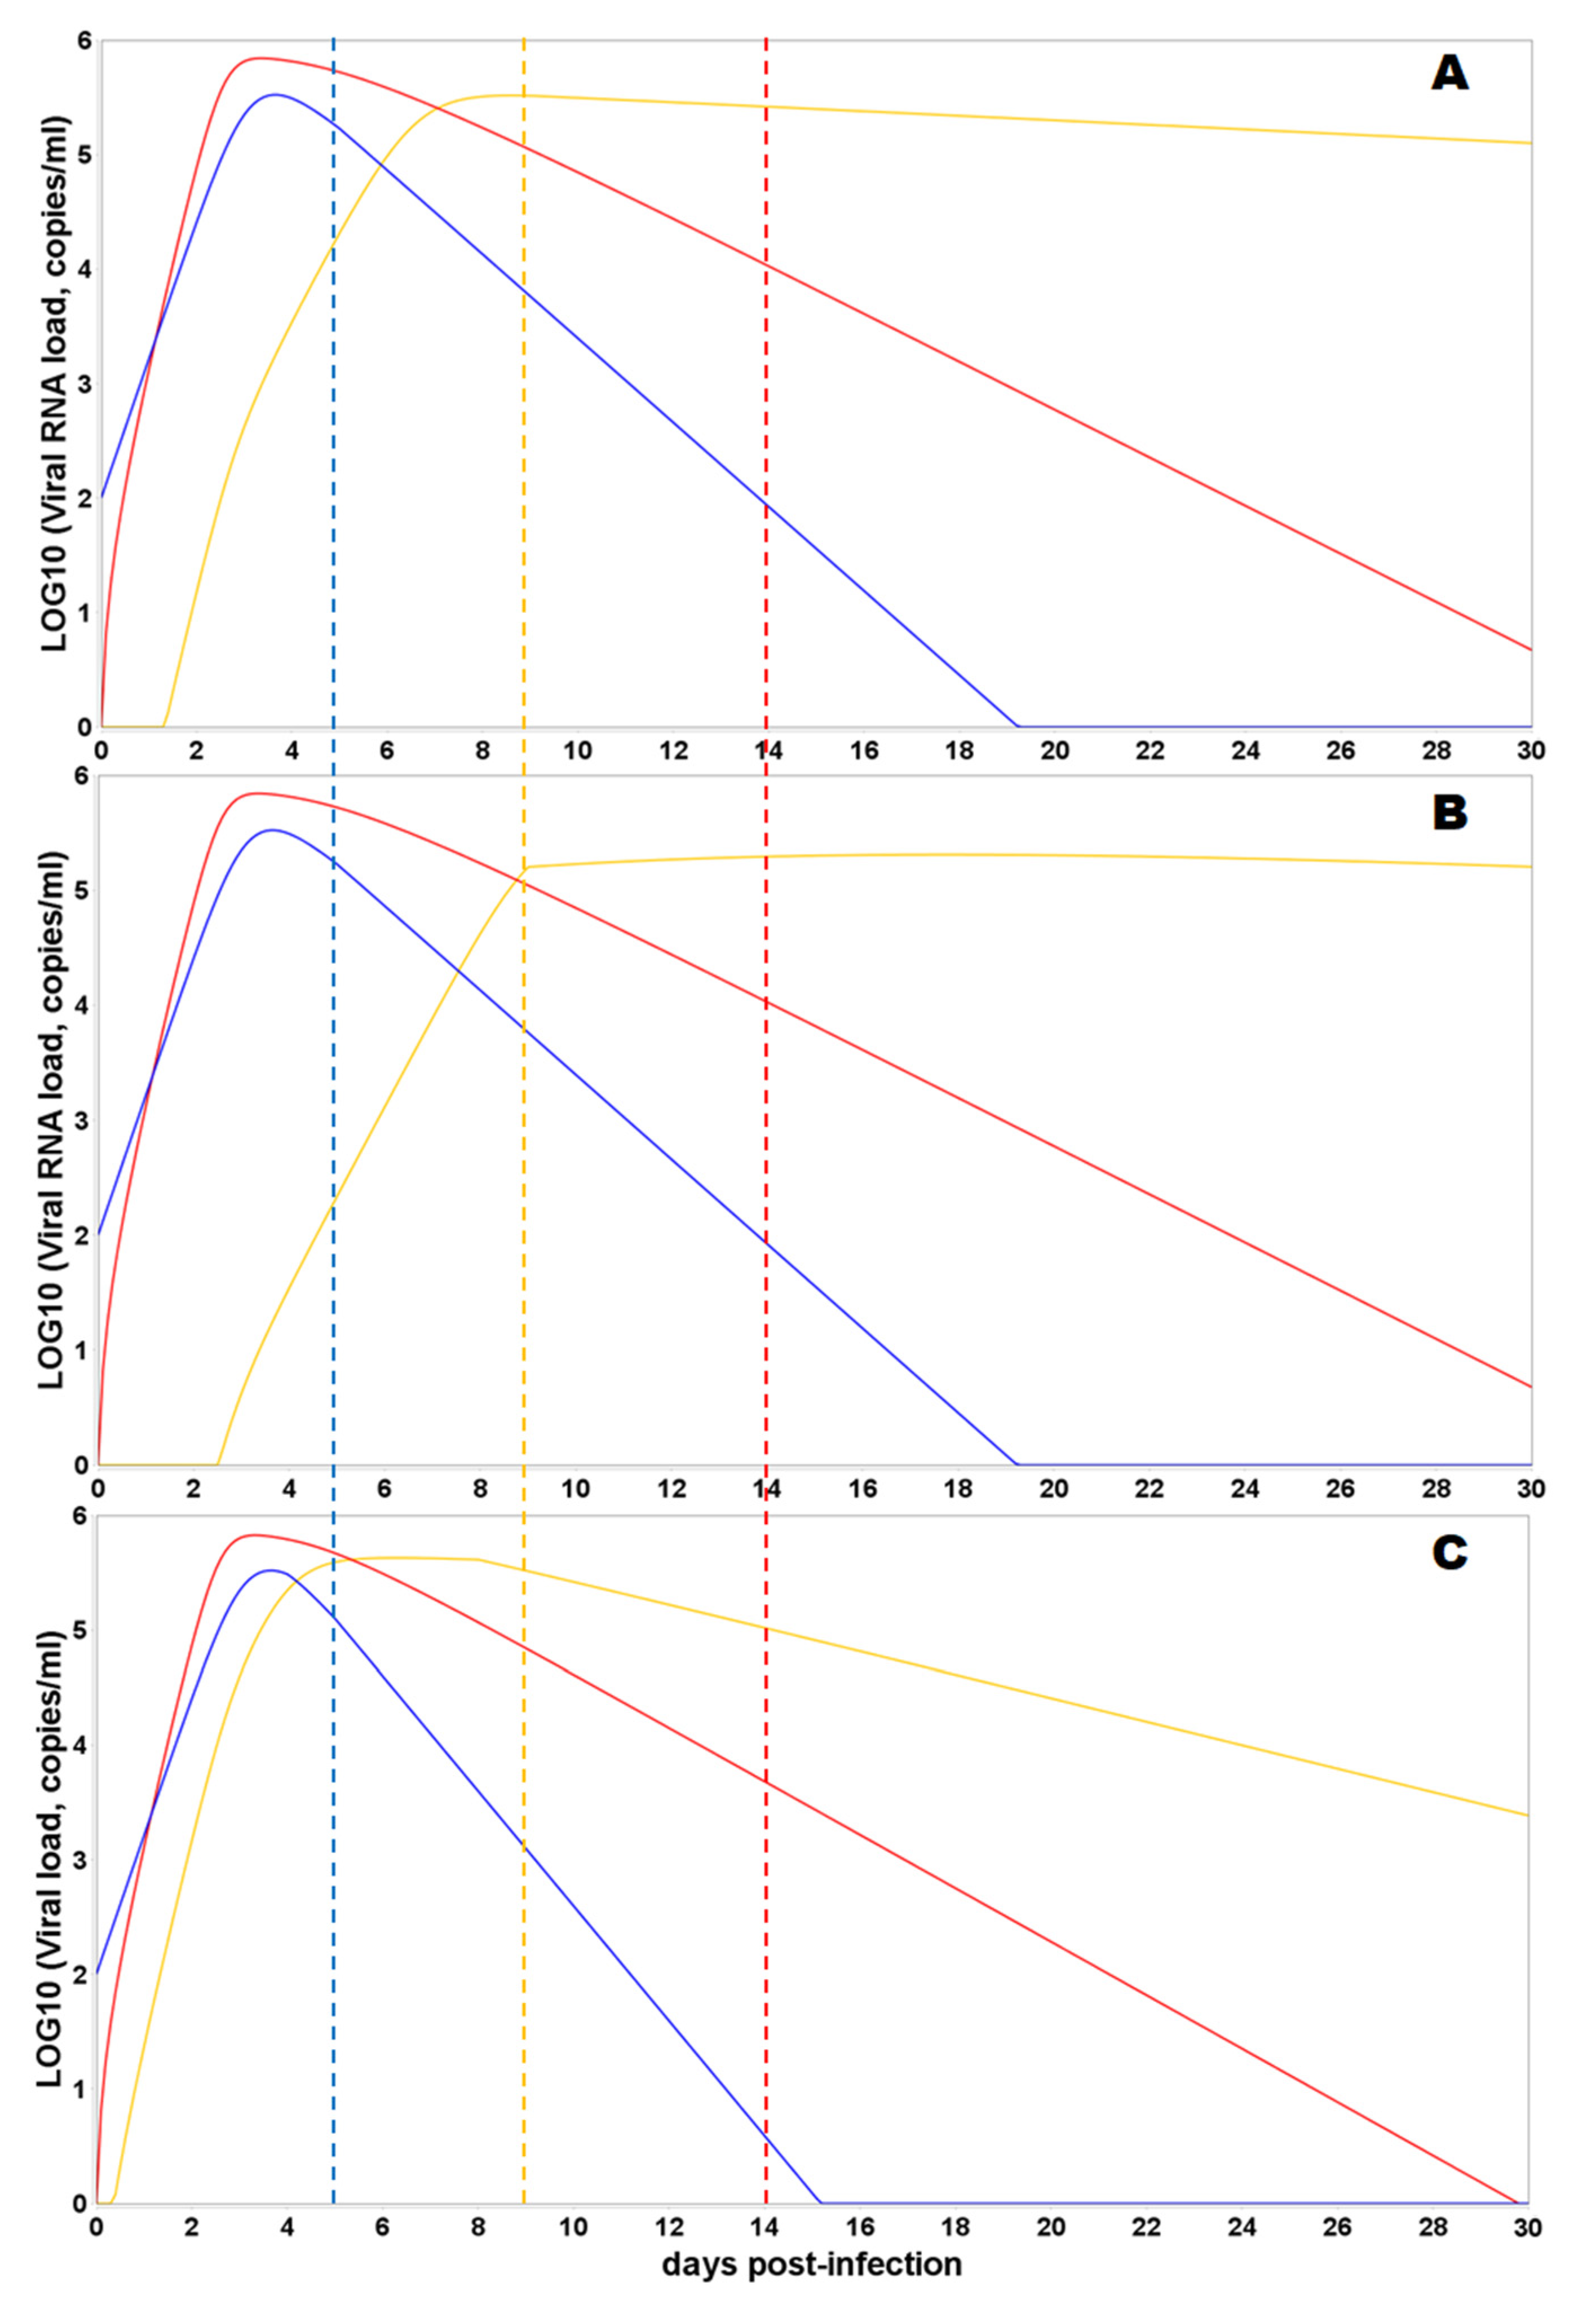
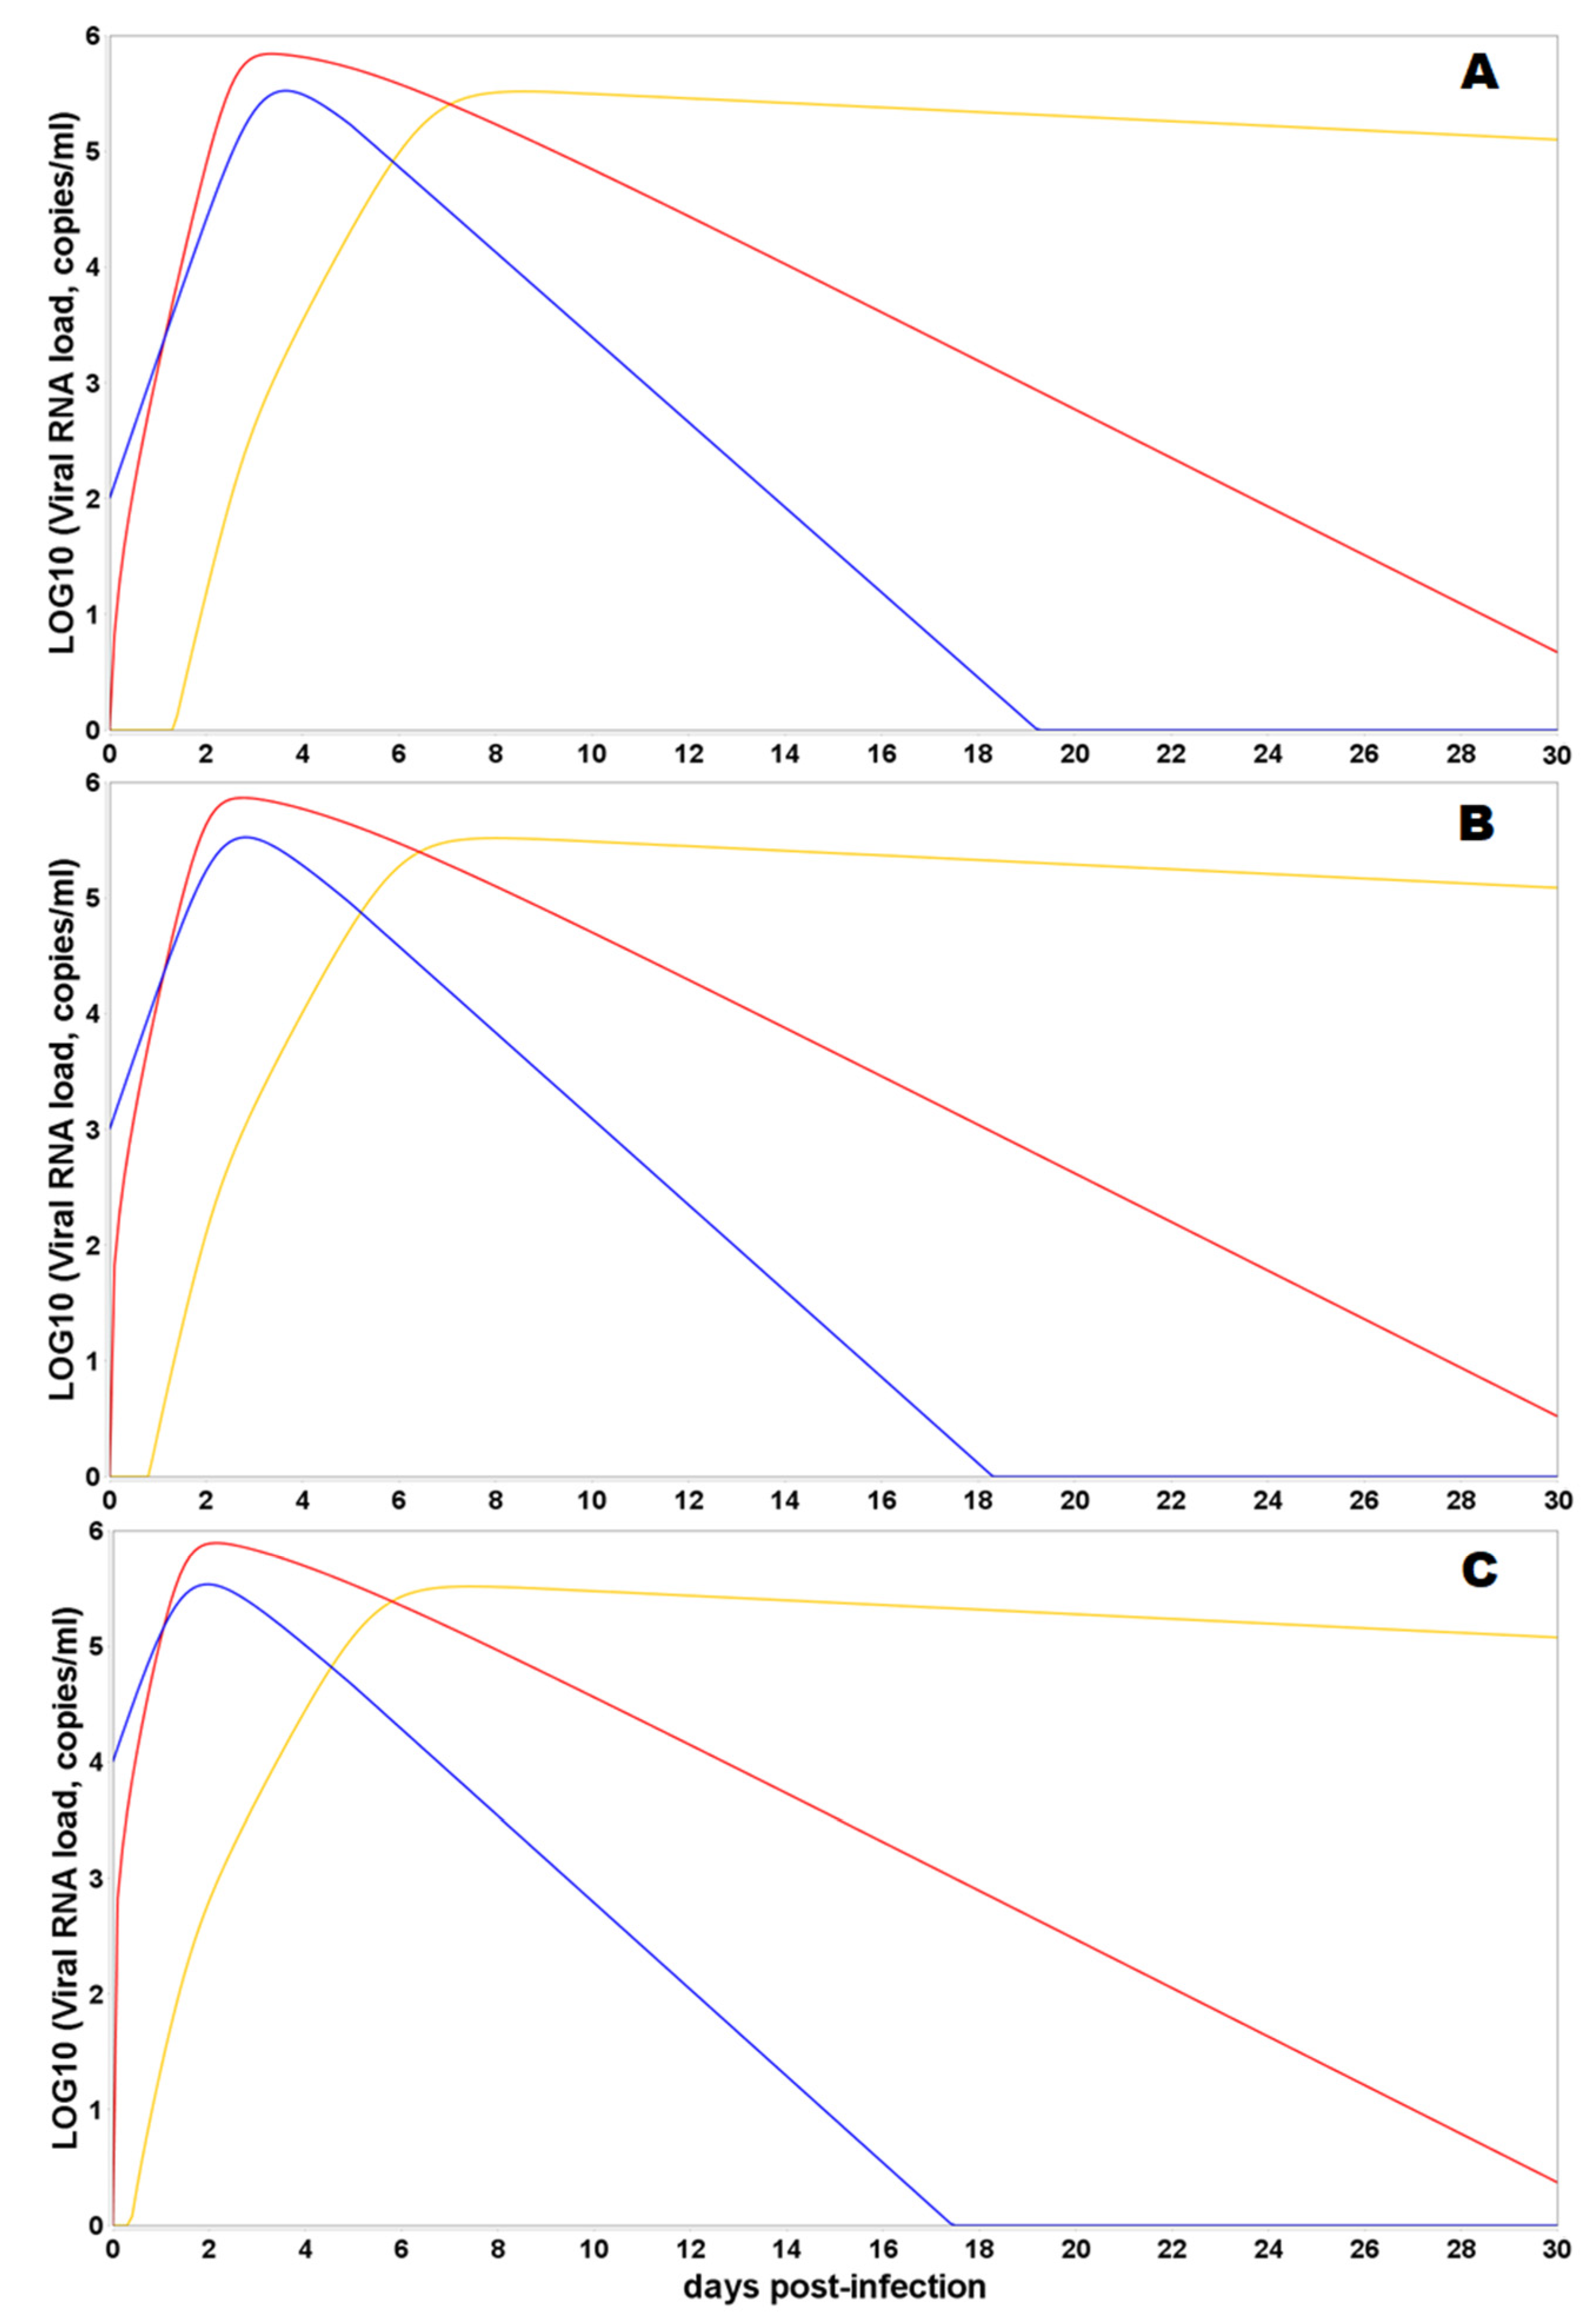
3.3. Model Simulations of SARS-CoV-2 Viral Dynamics and Distribution of the Viral Particles in Different Human Organs and Tissues

The main factor limiting the multiplication of the virus in each of the compartments is a decrease in a certain proportion of susceptible cells during the infection. At the initial stage of the infectious process, the penetration of the virus into a cell with an ACE2 receptor and a TMPRSS2 protease implies the formation of an appropriate number of viral particles per unit of time. As the proportion of infected cells increases, the risk of entering an already infected cell proportionally increases. Of course, in this situation, an additional number of viral particles can no longer be formed. Self-purification of the analyzed compartments due to the processes of renewal and degradation in this model does not change over time, but the effects of this process are summed up with a decrease in the efficiency of cell infection. The original data on the efficiency of the viral particles’ transport, considering experimental bacteriophage models, enables us to assume a more significant effect of the transport processes on the viral titer in the lungs.
Based on the developed model and parameter values (Table 1), we conducted in silico experiments to investigate (1) the effect of the transport processes on the viral load in each of the compartments, (2) the effect of an initial number of viruses infecting the epithelial cells of the nasopharynx, and (3) the possibility of promoting cytotoxicity as an additional antiviral mechanism mediated by cytotoxic T lymphocytes and natural killer cells (T-cellular response). In the first two cases, the basic antiviral mechanism was blocking de novo infection induced by neutralizing antibodies (B-cellular response) on different days post-infection, depending on the compartment (see Table 1).
According to the model simulation results, the change in values of transport parameters from the nasopharyngeal region to the lung and from the intestine to the lung can significantly alter the trajectory of the viral load in all compartments (Figure 4). Higher transport efficacy results in better outcomes of the disease, suggesting complete viral clearance in the nasopharynx and the intestine on 15 and 30 days post-infection, respectively. Moreover, the model also predicts the significant decline of the viral load in the lung under higher transport efficacy at the same timeframe, while lower transport efficacy leads to the time shift of the peak viral load and more prolonged virus reproduction in the lung.
The dose of infection, or the efficiency of accumulation of viral particles at the gate of infection, according to the results of mathematical modeling, should have a nonlinear effect on the further development of the infectious process. A small dose of infection increases the length of the incubation period (Figure 5A) and creates the prospects for the appearance of class A immunoglobulins on the mucous membranes with a minimum amount of virus entering the lungs through the circulatory system. At the same time, the immune response formed in the intestine will outpace the response of the immune system in the lungs by two days, which can potentially lead to suppression of the immune response in the lungs and the development of an asymptomatic form of pneumonia (but with a limited viral load at the initial stage). An increase in the infection dose by a factor of 1000 (Figure 5C) leads to the synchronization of the accumulation of the virus in the nasopharynx and intestines and a higher total dose of virus accumulation in the lungs (which is estimated as the area under the curve (AUC)) at the time of the formation of a specific immune response and, accordingly, a more extensive inflammatory process.
Eventually, we simulated the effect of combining cellular and humoral immune responses blocking de novo infection and promoting cytotoxicity (Figure 6). The combining effect of responses results in more rapid decay in viral load in all compartments. Moreover, the immune response mediated by cytotoxic T lymphocytes and natural killer cells and initiated after the viral load peak in each compartment can still reduce the AUC implying the crucial and most prominent effect of the T-cellular immune response in the viral clearance.

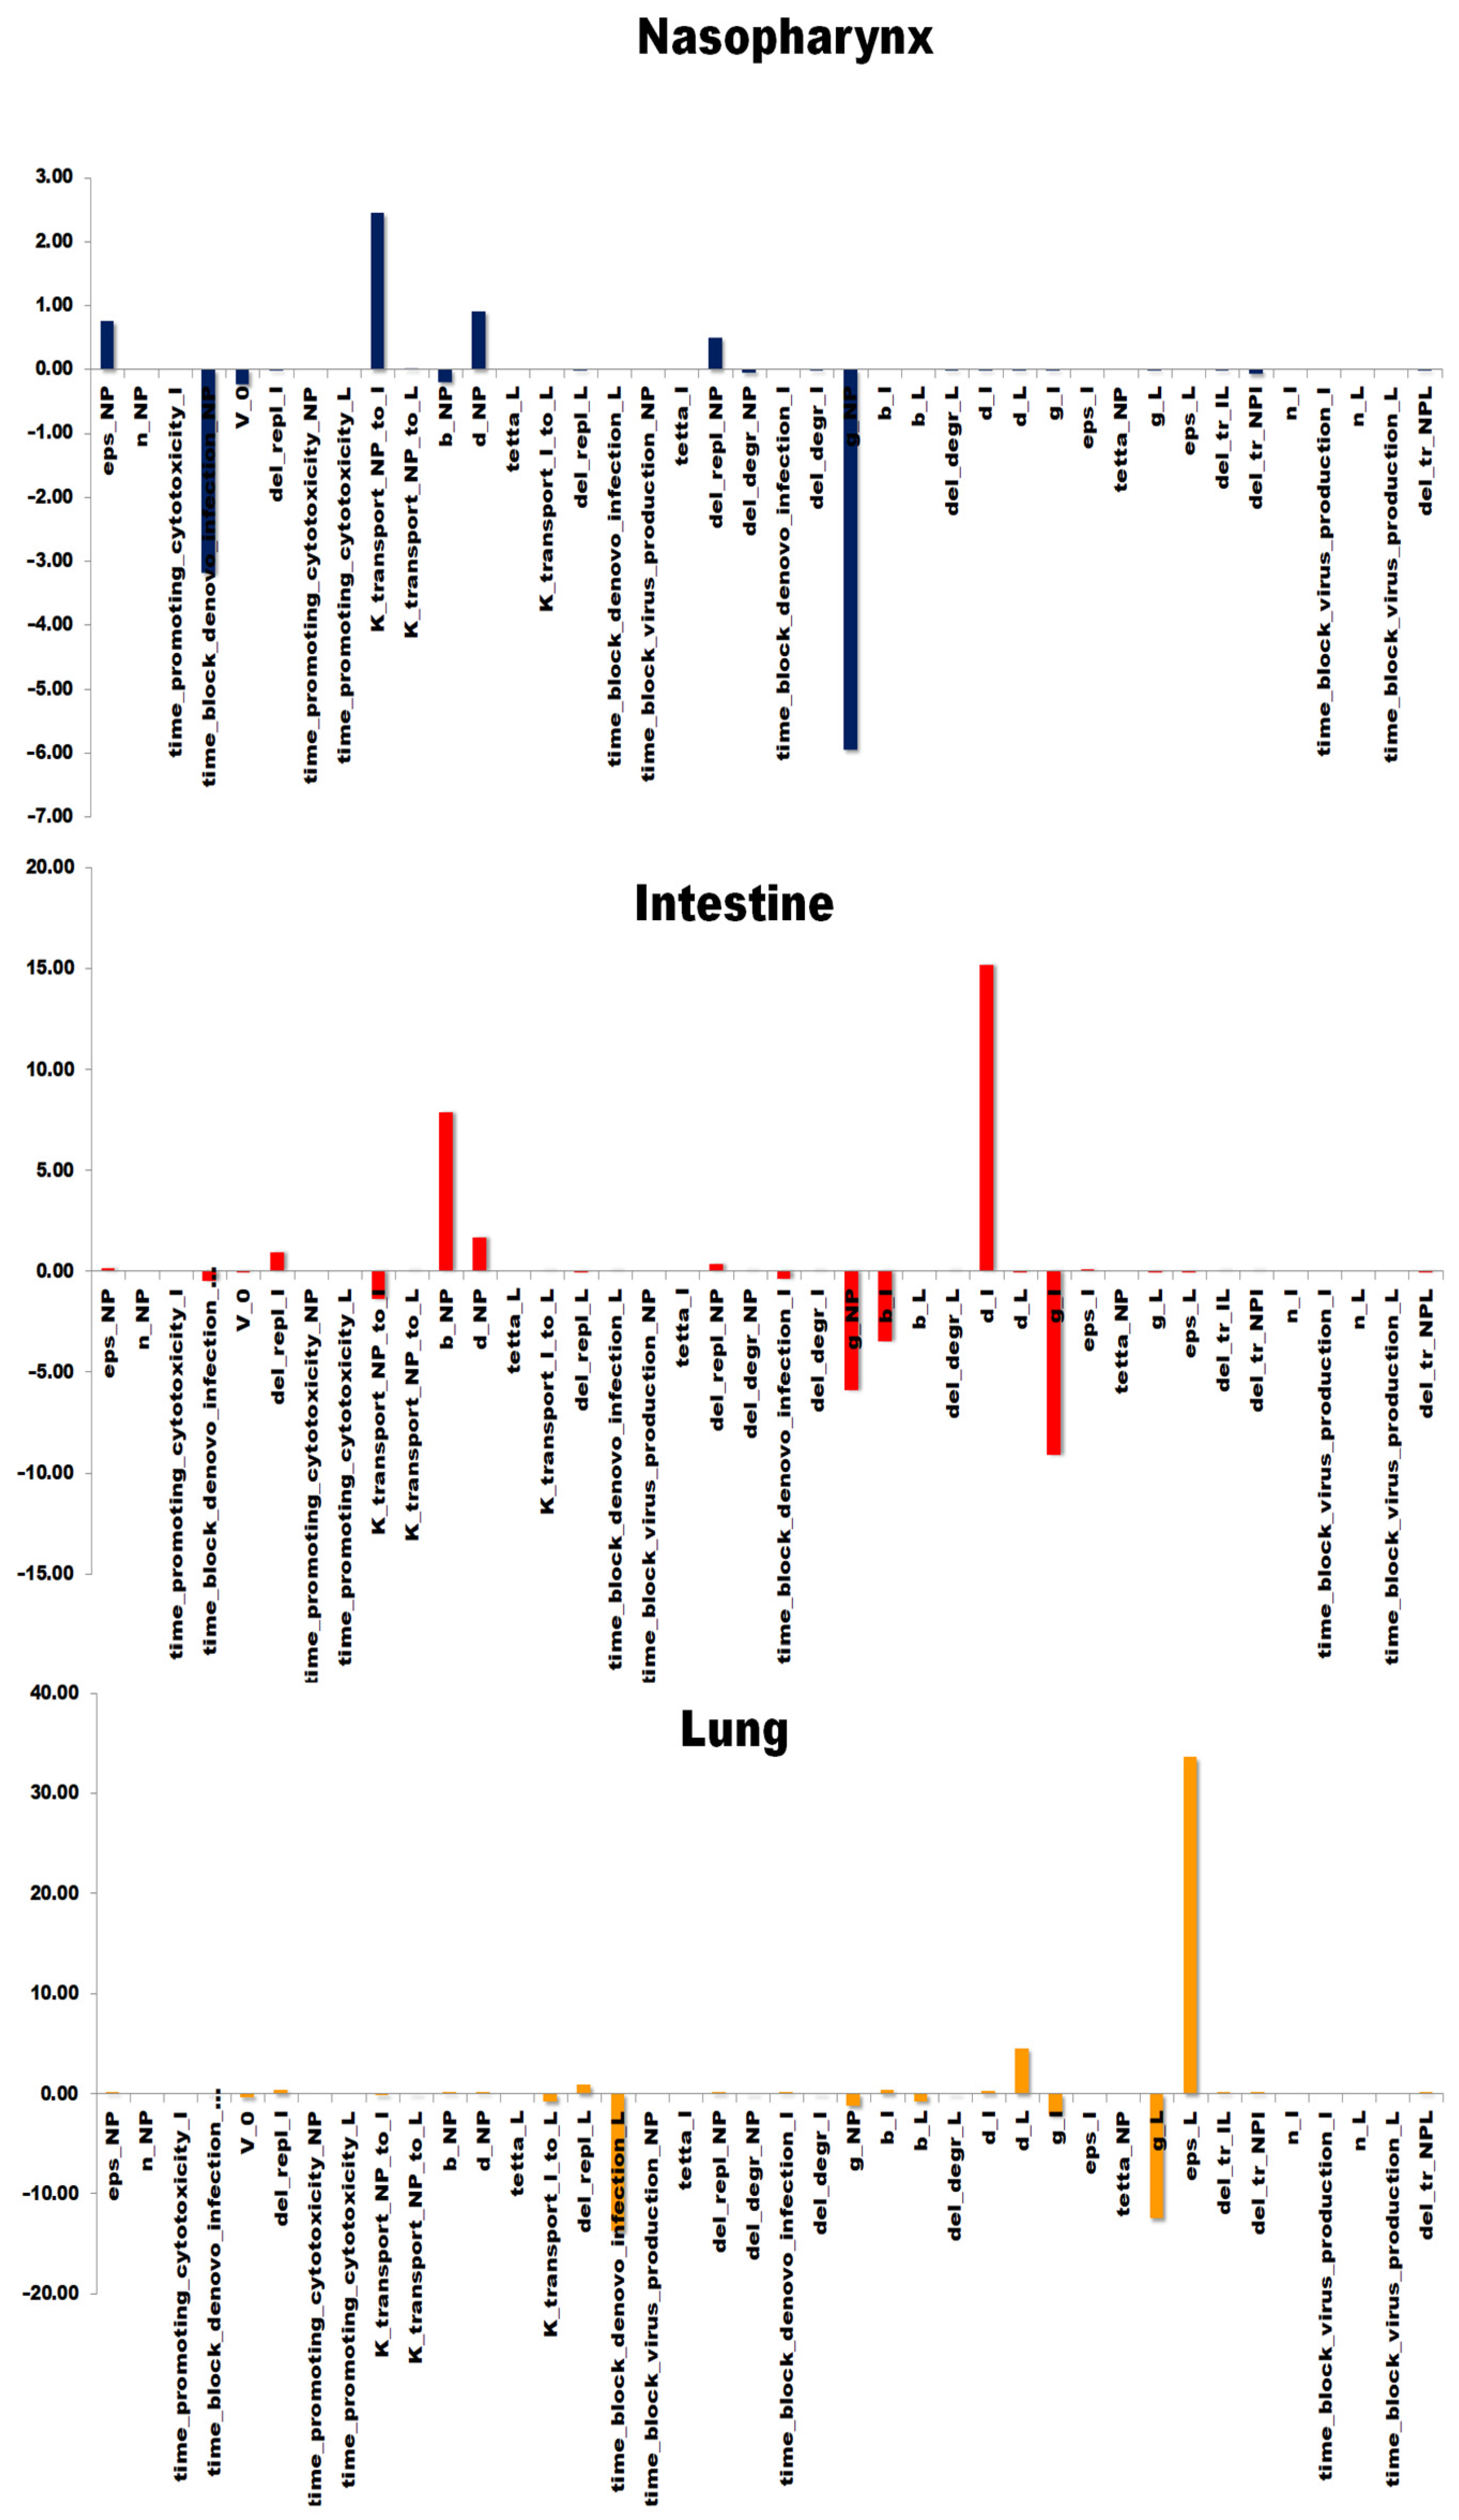
3.4. Sensitivity Analysis of the Model

Using a sensitivity analysis, we determined to which model parameters the uninfected target cell proportion in each compartment is more sensitive. Such an analysis tells us the importance of each parameter on the infectious process in the corresponding compartment. Figure 7 presents the results of the analysis and demonstrates sensitivity indices of the model with respect to f i in a certain module. From the figure, it is clear that the variable is the most sensitive to the maximum rate constant for viral replication, γ n f . It indicates that an increase in the parameter value will be followed by an immediate decrease in the proportion of uninfected target cells. Moreover, the variable is significantly sensitive to the transport rate constant, K t r n p I , meaning that faster transport of the virus from the nasopharynx to the intestine can lead to more target cells in the former remaining uninfected. It is also intriguing that the proportion of uninfected target cells in the compartment is sensitive to the timeframe of the humoral response initiation in the nasopharynx. The obtained result suggests a strategy to control the initial stage of the infection in an organism via a drug that improves the humoral response initiation in the nasopharynx.
The fraction of target cells that remain uninfected in the intestine, in turn, is the most sensitive to the death rate of infected cells (and viral particles in these intestine cells, respectively), δ I . It indicates that renewal processes of the intestinal mucosa may play an essential role in the infection dynamics in the intestine. The interesting aspect of the analysis for the compartment is the sensitivity of the intestinal fraction to the SARS-CoV-2 life cycle in the nasopharynx (infection and replication rate constants, β n f and γ n f , as well as the death rate, δ n f . The result also confirms the potential benefit of an infection control strategy via the gate of infection, the nasopharynx. Eventually, the fraction of uninfected lung cells is also sensitive to the virus replication in the compartment, γ L, but the variable in the lung is mostly sensitive to the effectiveness of the humoral response, ϵL, blocking de novo infection, and the timeframe of the response, t i m e ϵ L . Thus, the infection dynamics in the lung is mainly determined by the humoral immune response and its onset, proposing the treatment way in combating SARS-CoV-2 in human lungs.

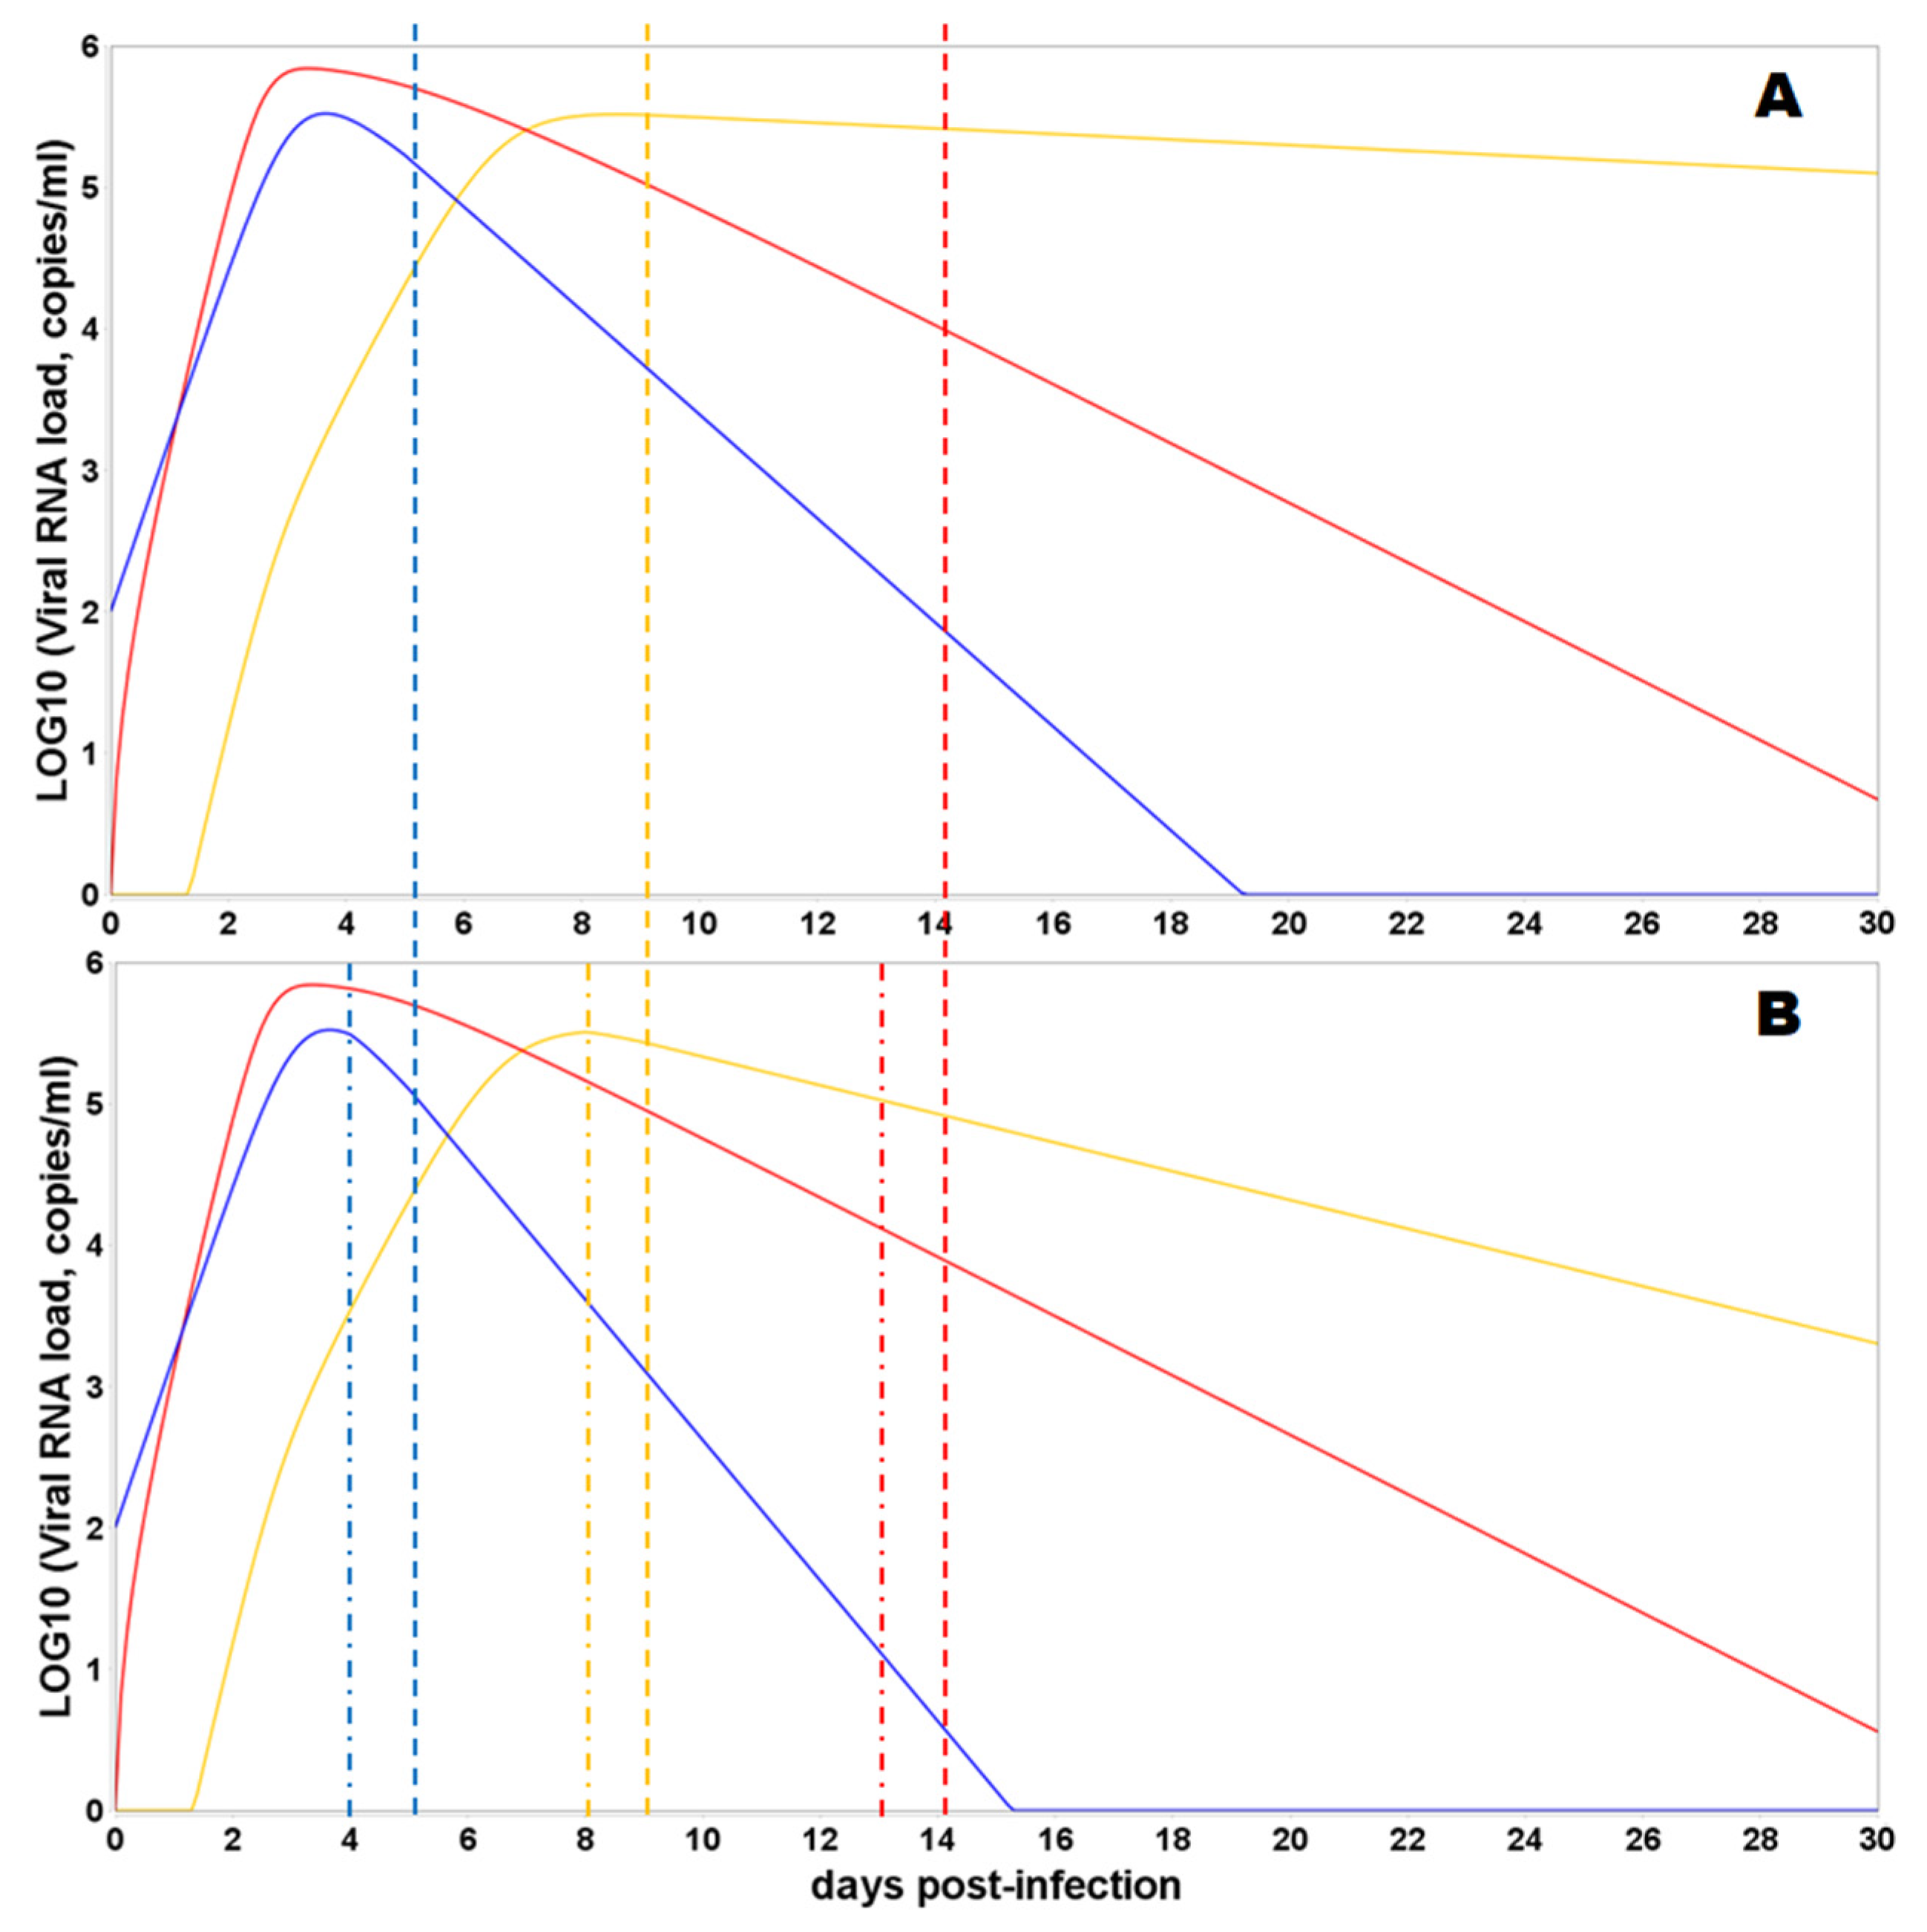
3.5. Sanitation of the Intestines and Nasopharynx with Virucidal Drugs

The results of the model simulation of the sanitation with virucidal medicines of the nasopharynx only (Case 1) and of both the nasopharynx and intestines (Case 2) are summarized in Table 3. It is shown that the sanitations significantly decrease the viral load in the corresponding compartment. However, there is no statistically significant decline of the viral load in the lungs in both cases.

4. Discussion

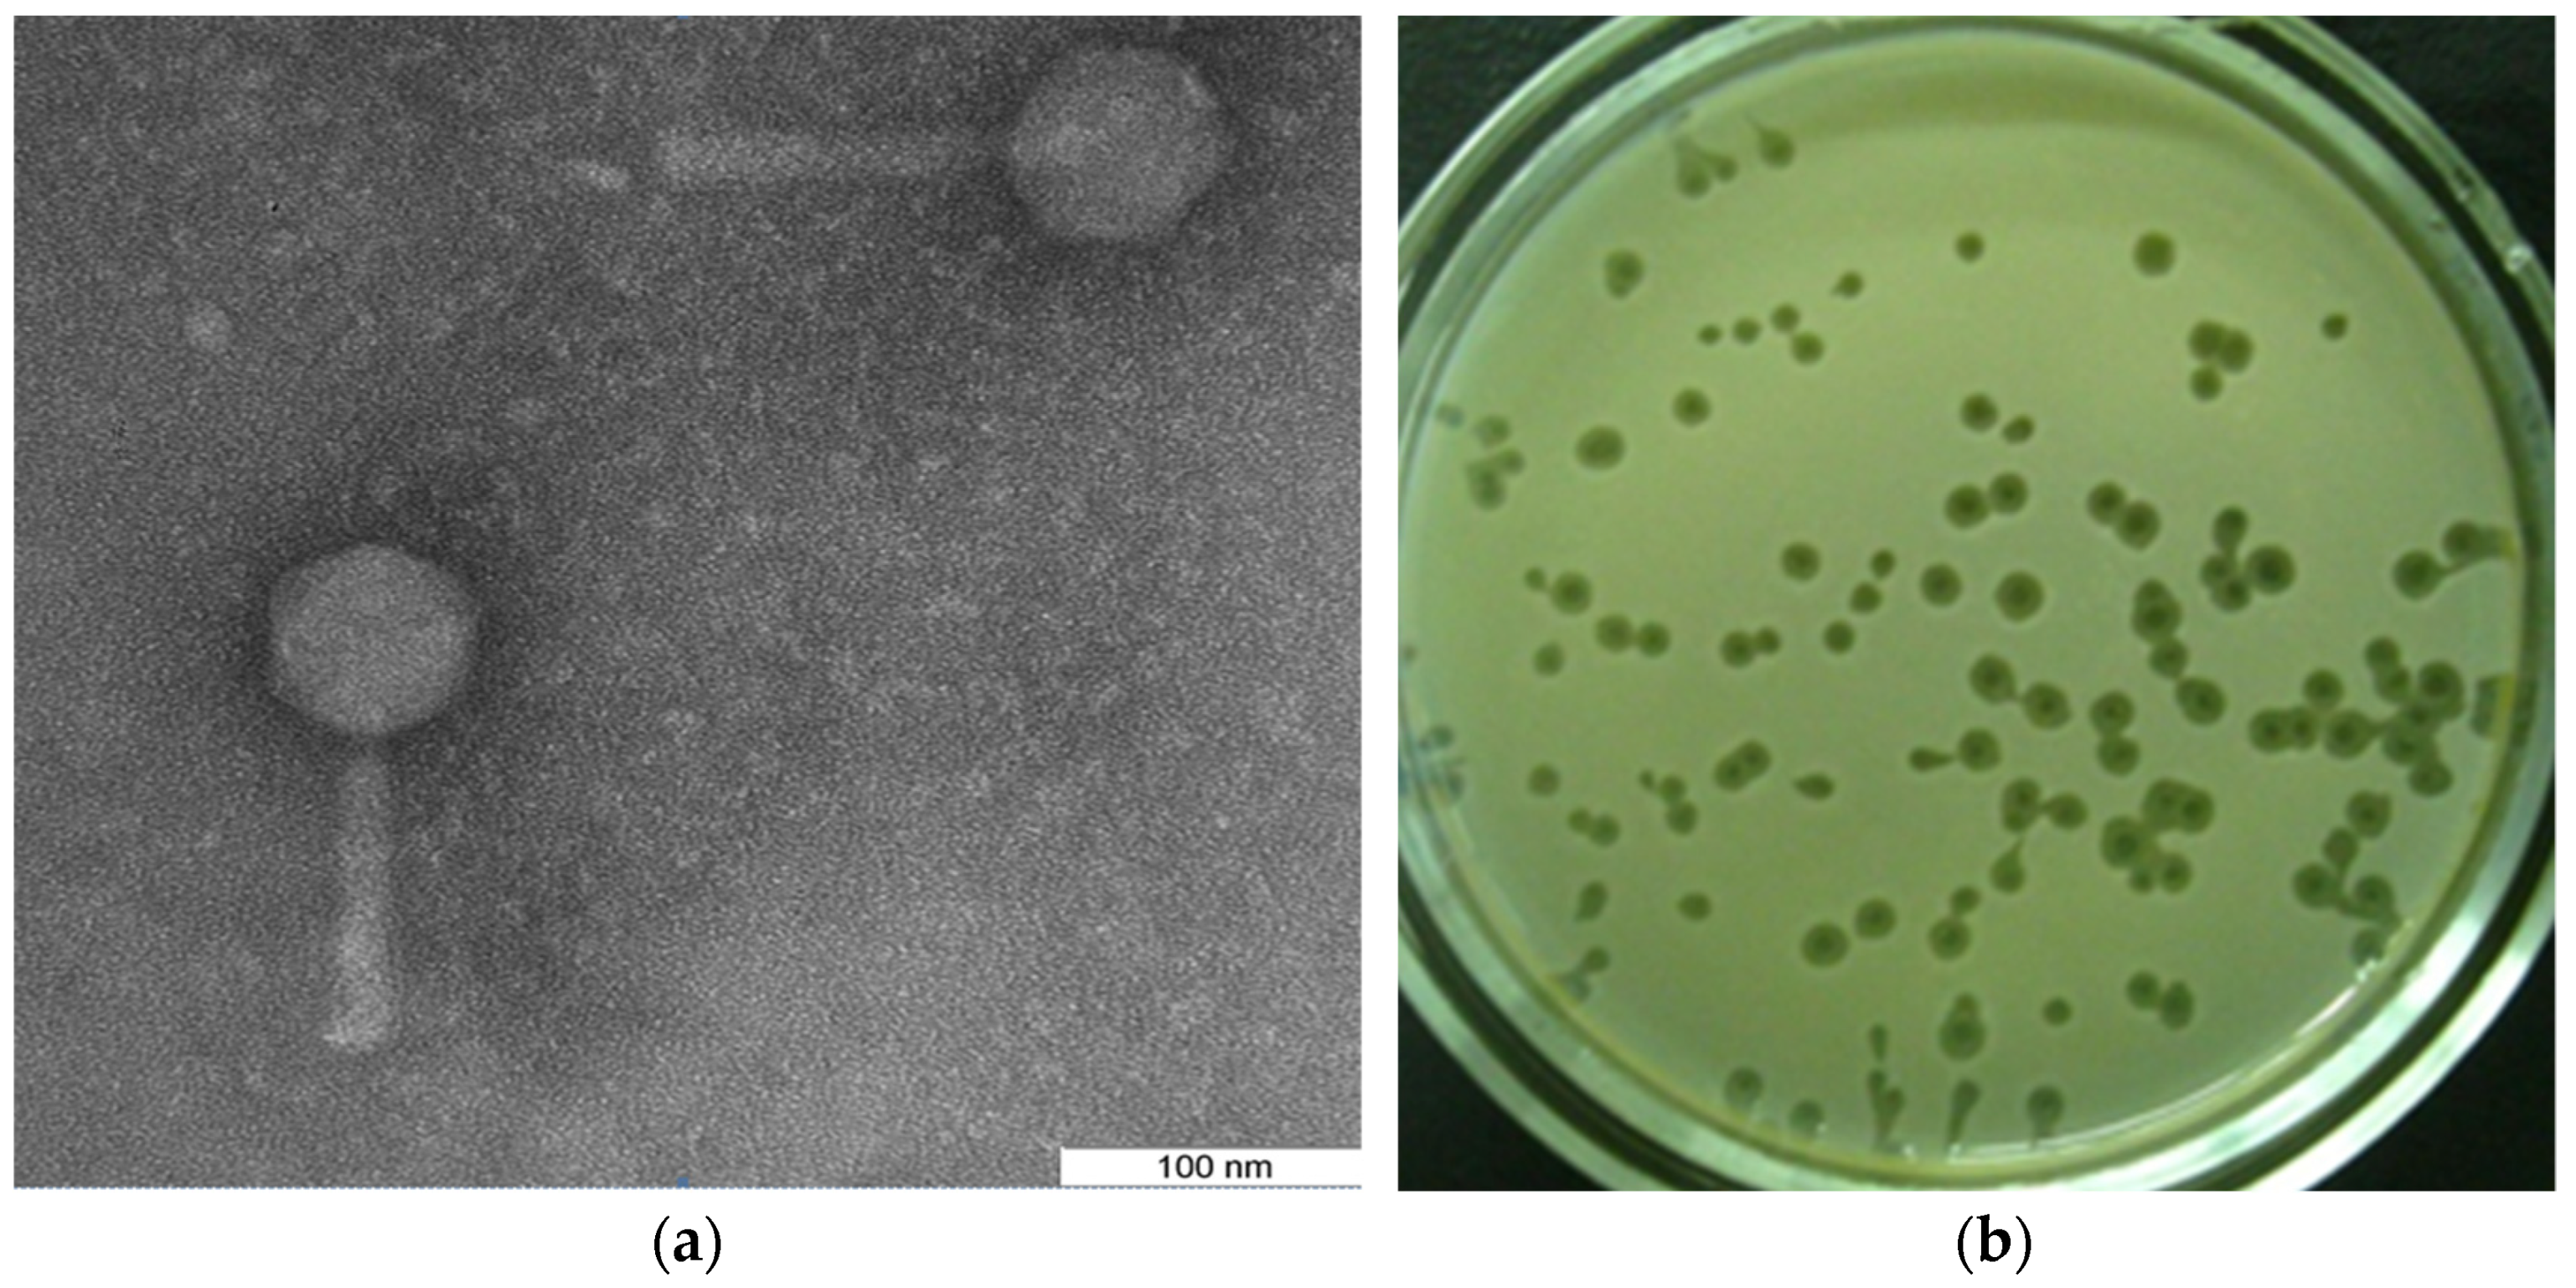
4.1. The Experimental Result by Using Bacteriophages

Experiments with bacteriophage spraying showed its rapid elimination in mice from the trachea (Table 2) but not from the lungs. Considering this experiment as a model of COVID-19 to infect the bronchi by the viral particles, the viruses must increase their numbers three times per hour (Table 2) (on average) to ensure reproduction and further dissemination along the bronchial tree to the lungs [16]. The result does not contradict the published data [5]. The entry of viral particles into the lungs with an aerosol significantly reduces the requirements for the rate of virus reproduction due to a significantly lower rate of renewal of respiratory epithelial cells [11].
We also propose that any infection transmitted by airborne droplets will be accompanied by the entry of a significant part of the viral particles into the gastrointestinal tract. The resistance of viral agents to gastric juice will determine the likelihood of cells’ infection in the gastrointestinal tract [14,34].
The presented results of the conducted experiments with bacteriophages biodistribution and the follow-up model analysis drive us to formulate the next scheme of the COVID-19 pathogenesis in humans. Airborne infection involves the predominant entry of SARS-CoV-2 viral particles into the nasopharyngeal region of the upper respiratory tract, followed by the reproduction and transport of viral particles into the esophagus. The viral particles that have entered into the trachea and bronchi will be eliminated from the trachea to the oral cavity and transferred to the gastrointestinal tract, but not into the lungs, as follows from the experiment with viral particles that are not capable to replicate in cells of the mice (Table 2). Furthermore, experimental results on the bacteriophages’ biodistribution demonstrated a rapid decrease in the concentration of bacteriophages by four times in the tracheal mucosa (Table 2). This outcome can be explained by a combination of two factors: (1)cessation of the entry of new portions of viral particles with aerosol into the trachea and (2)active elimination of viral particles from the trachea into the nasopharynx and esophagus. Another important factor is the low efficiency of the SARS-CoV-2 virus reproduction in the bronchi and trachea (with the exception of Omicron-like strains of SARS-CoV-2) [35]. This fact, in our opinion, determines the large contribution of the transport processes of viral particles from the compartments of the body with high synthetic efficiency and secretion of proteins [22] (including viral ones) to the compartment in which the regeneration efficiency of damaged cells is low, i.e., into the lungs.

4.2. Model-Derived Results on the Viral Load Considering the Anatomical and Functional Relationships of the Organism Compartments

As follows from the simulation results, the concentration of viral particles in 1 mL of the nasopharyngeal fluid reaches 5.5 Log10 viral particles per 1 mL (Figure 4 and Figure 5). In general, this does not contradict the published data. The SARS-CoV-2 virus was detected in saliva at concentrations of 104–108 RNA copies per 1 mL of saliva [36], while the average saliva production in an adult is 1–1.5 liters per day [7,18].
Since the bulk of the broncho-tracheal, nasal mucus, and saliva, together with ~1011 copies of the virus, enter the esophagus for a long time, it can be confidently stated that the subsequent infection should affect the gastrointestinal mucosa, not the lungs. The accumulation dynamics of SARS-CoV-2 in the lungs and nasopharynx, in general, reflects this assumption (Figure 4). As follows from the proposed model, the lower efficiency of the virus transport from the nasopharyngeal region and intestine (through the circulatory system) to the lungs compared to the transmission of the virus from the nasopharynx and oral cavity to the intestine (with saliva and mucus) is evident. In this case, the anticipatory accumulation of SARS-CoV-2 in the intestine relative to the lungs does not contradict the observed clinical picture: the onset of symptoms of intestinal upset before the onset of clinical signs of pneumonia [37,38].
As follows from our model, the concentration of the virus in the lungs increases more slowly than in the intestine and nasopharynx (Figure 4, Figure 5 and Figure 6). It is noteworthy that the maximum amount of virus in the lungs is 5–10 times less (due to the lower anabolic activity of the respiratory epithelium and the endothelium of the blood vessels of the lungs). On the other hand, in our model, the concentration of SARS-CoV-2 in the lungs remains at a consistently high level for longer than in the nasopharynx and intestines. This fact is due to the lower rate of lung self-renewal. The analysis of published data and conducted model simulations has prompted us to pose the following question: is the presence of SARS-CoV-2 in the lungs a consequence of hematogenous transport of the viral particles from the intestine, or is it mainly the result of independent reproduction of the virus in the lung tissue?
The presence of the viral agent in the gastrointestinal tract is an established fact [39,40,41,42]. Long-term persistence of the virus in the intestine [38,40,41,42,43], supporting the hypothesis that the persistent virus could contribute to the long COVID, is feasible only when the virus reproduction rate is comparable to the rate of renewal of the intestinal contents. The earliest signs of COVID-19, accompanied by nausea and sometimes diarrhea [39,40], also suggest that the viral agent enters the intestines earlier than the lungs [39,42].
The copy number of SARS-CoV-2 genomic RNA in stool samples ranges from 1 × 10² to 1 × 10⁸ copies/mL [12,44,45] depending on the presence of the diarrhea, respectively. If we estimate the volume of daily excretion of intestinal contents with a mild form of diarrheal syndrome > 700 mL/d, then the daily production of the virus should exceed 7 × 7011 copies. The accelerated passage of food masses through the intestine should increase the likelihood of detecting viral RNA by PCR in the presence of diarrheal syndrome [45,46]. However, the characteristic ratio between RNA copy measurements and TCID50 measurements is about four orders of magnitude but can vary between three and five orders of magnitude [47]. This fact reduces the correctness of the data, especially for the intestines. Most likely, a PCR of the intestinal content gives underestimated amounts of RNA compared to the results of PCR testing of the upper respiratory tract due to the accelerated degradation of viral RNA by intestinal RNases.

4.3. Model-Derived Results on the Viral Load Considering the Adaptive Immune Response and Virucidal Therapy

A sequential activation of the adaptive immune response in the nasopharynx, lungs, and intestines accelerates the elimination of the virus in the nasopharynx and intestines (Figure 5 and Figure 6). According to the model simulations, the effect of adaptive immunity in the lungs is secondary to the efficiency of elimination of the virus and viral antigens in the nasopharynx and intestines. These results are not very consistent with the literature data. However, the combination of an intense antiviral immune response in the lungs with a constant supply of new viral particles and antigens from the gut may explain the severe and prolonged course of pneumonia [48].
The applied significance of our model is a necessity for local therapy of the viral infection in compartments with a potential maximum rate of the viral particles reproduction, at least at the initial stage of the infectious process (Table 3).
The developed model implies a relatively low intensity of the spread of the virus through the lung tissue, considering the nasopharynx and intestines as the main sources of the viral agent in the body and for the respiratory system as well. Therefore, a decrease in the viral load only in the nasopharynx or only in the intestine is not able to affect the viral load in the lungs but should significantly change the nature of immunological reactions in the lungs at the initial stages of the infectious process. However, the nature of the immune response formation in these compartments can be diametrically opposite (proliferation and transport of T-suppressors and T-helpers, respectively). Therefore, the order of reaching peak concentrations of SARS-CoV-2 (depending on local immunoreactivity, mucosal integrity, efficiency of the SARS-CoV-2 transport, and the dose of infection) in the nasopharynx and intestines theoretically can be the main factor causing the development of immune-mediated damage of the vessels and respiratory epithelium of the lungs, or the asymptomatic course of COVID-19.
An important factor in our model that limits the reproduction of a viral agent in body tissues is the specific proportion of sensitive cells (fi). Obviously, the death of the organism will occur before the amount of fi is reduced to values that limit the reproduction of the virus. In any case, this may concern the vascular endothelium and the respiratory epithelium. Accordingly, the ratio of the virus replication rate, γi, and the rate of degradation of viral particles, δi, is not at the equilibrium point in our model. For this reason, a shift in the dynamics of the virus accumulation in the body under the influence of adaptive immunity reactions becomes possible only at values of θ and ϵ ~ 1.0. This feature of the model brings it closer to modeling the viral infection and the antiviral effect of antibodies in cell culture. A closed cell culture system also makes it possible to suppress a viral infection only with 100% inactivation of viral particles by virus-neutralizing antibodies. It is obvious that the very fact that there is constant elimination of viral particles in the body (washing out of viral particles from the mucous membranes, destruction under the action of enzymes, etc.) should significantly increase the effectiveness of the sanitation of the mucous membranes from the virus both with drugs and antibodies.
As follows from the data, the effect of virucidal substances [49,50,51,52,53] on coronaviruses in the intestinal lumen [49,50] was accompanied by a decrease in the intensity of lung damage [49]. These facts show the importance of the reduction of hematogenous viral particles’ transport from the intestinal lumen to the lungs. The simulation results allow us to propose that the sanitation of the mucous membranes of the nasopharynx and/or of the gastrointestinal tract at the initial stage of the infectious process has prospects for use in medical practice.

5. Conclusions

Our comparison of published data on the concentration of SARS-CoV-2 in the lungs, nasopharynx, and intestines with the mass of these organs and the intensity of synthetic processes in mucosal cells indicates that the relatively high concentration of this virus in the lungs is due not only to the endogenous formation of viral particles. The accumulation of viral particles in the lungs is also affected by the slow process of their destruction/elimination in the lungs compared to the nasopharynx and intestines. Moreover, the significant role of the transport processes and redistribution of the virus in the body from compartments with intensive reproduction of the virus (nasopharynx and intestines) to organs and systems where the penetration of the virus can create life-threatening conditions (lungs) is proposed by the model analysis as an important effect on the concentration of SARS-CoV-2 in the lungs. The results of the model simulations show that the intestine and nasopharynx, as a source of SARS-CoV-2 for the lungs, are equivalent for COVID-19 pathogenesis.
The developed multicompartmental model represents a simplified version of the realistic processes inside the human body elicited by the infection agent and does not take into account detailed mechanisms and functioning of many components of immunity, such as macrophages, cytokines, and T- and B-cellular differentiation. However, the novelty and practical significance of the model is an opportunity to simulate the local therapy of infection in different compartments and predict the impact of these parameters on the viral load in the lungs as an essential indicator of the COVID-19 pathogenesis. Moreover, the conducted sensitivity analysis of the modular model demonstrates potentially different targeted hubs or strategies of local control for the infectious process in each considered tissue. We suggest that the developed model could be a valuable tool to improve the development and efficiency of new drugs and treatment modes, as well as provide a more accurate theory for therapy of viral infections such as COVID-19.

Supplementary Materials

The following supporting information can be downloaded at https://0-www-mdpi-com.brum.beds.ac.uk/article/10.3390/math10111925/s1. Table S1: Experimental data on bacteriophage particles in the gastrointestinal tract and in the lungs.

Author Contributions

Conceptualization, V.N.A. and F.A.K.; methodology, I.R.A. and N.A.D.; software, I.R.A.; validation, V.N.A. and N.A.D.; formal analysis, I.R.A.; investigation, I.A.S., T.E.M., A.S.B., V.S.C. and Y.N.K.; resources, Y.N.K. and Y.E.P.; data curation, I.R.A.; writing—original draft preparation, V.N.A.; writing—review and editing, I.R.A.; visualization, Y.E.P. and I.R.A.; supervision, F.A.K. and N.A.D.; project administration, F.A.K.; funding acquisition, F.A.K. All authors have read and agreed to the published version of the manuscript.

Funding

This research was funded by RFBR, grant number 20-04-60355, “Development of a multi-scale immuno-epidemiological mathematical model COVID-19, taking into account the impact on the economy of the region and the scenarios of authority actions”.

Institutional Review Board Statement

The animal study protocol was approved by the Ethics Committee of Federal State Educational Institution of Higher Professional Education “Novosibirsk State Agrarian University” protocol code 003; 12 January 2022 (date of approval).

Informed Consent Statement

Not applicable.

Data Availability Statement

The modular versions of the model and all modules are available on Gitlab at https://gitlab.sirius-web.org/covid-19/virus-distribution_human-organs, accessed on 25 May 2022.

Acknowledgments

We thank Ruslan N. Sharipov for helpful comments and suggestions.

Conflicts of Interest

The authors declare no conflict of interest.

References

  1. Huang, C.; Wang, Y.; Li, X.; Ren, L.; Zhao, J.; Hu, Y.; Zhang, L.; Fan, G.; Xu, J.; Gu, X.; et al. Clinical features of patients infected with 2019 novel coronavirus in Wuhan, China. Lancet 2020, 395, 497–506. [Google Scholar] [CrossRef] [Green Version]
  2. Guan, W.J.; Ni, Z.Y.; Hu, Y.; Liang, W.H.; Ou, C.Q.; He, J.X.; Liu, L. Clinical characteristics of coronavirus disease 2019 in China. N. Engl. J. Med. 2020, 382, 1708–1720. [Google Scholar] [CrossRef] [PubMed]
  3. Wolfel, R.; Corman, V.; Guggemos, W.; Seilmaier, M.; Zange, S.; Müller, M.; Niemeyer, D.; Jones, T.C.; Vollmar, P.; Rothe, C. Virological assessment of hospitalized cases of coronavirus disease 2019. medRxiv 2020. Available online: https://www.medrxiv.org/content/10.1101/2020.03.05.20030502v1 (accessed on 25 May 2022). [CrossRef] [Green Version]
  4. Sungnak, W.; Huang, N.; Bécavin, C.; Berg, M.; HCA Lung Biological Network. SARS-CoV-2 entry genes are most highly expressed in nasal goblet and ciliated cells within human airways. arXiv 2020. Available online: https://arxiv.org/abs/2003.06122 (accessed on 25 May 2022). [CrossRef] [Green Version]
  5. Schaefer, I.-M.; Padera, R.F.; Solomon, I.H.; Kanjilal, S.; Hammer, M.M.; Hornick, J.L.; Sholl, L.M. In situ detection of SARS-CoV-2 in lungs and airways of patients with COVID-19. Mod. Pathol. 2020, 33, 2104–2114. [Google Scholar] [CrossRef]
  6. Zheng, S.; Fan, J.; Yu, F.; Feng, B.; Lou, B.; Zou, Q.; Xie, G.; Lin, S.; Wang, R.; Yang, X.; et al. Viral load dynamics and disease severity in patients infected with SARS-CoV-2 in Zhejiang province, China, January–March 2020: Retrospective cohort study. BMJ 2020, 369, m1443. [Google Scholar] [CrossRef] [Green Version]
  7. Cole, P. Nasal and oral airflow resistors. Site, function, and assessment. Arch. Otolaryngol. Head Neck Surg. 1992, 118, 790–793. [Google Scholar] [CrossRef]
  8. Kolpakov, F.; Akberdin, I.; Kiselev, I.; Kolmykov, S.; Kondrakhin, Y.; Kulyashov, M.; Kutumova, E.; Pintus, S.; Ryabova, A.; Sharipov, R.; et al. BioUML: An integrated environment for systems biology and collaborative analysis of biomedical data. Nucleic Acids Res. 2022, gkac286. [Google Scholar] [CrossRef]
  9. Akberdin, I.R.; Kiselev, I.N.; Pintus, S.S.; Sharipov, R.N.; Vertyshev, A.Y.; Vinogradova, O.L.; Popov, D.V.; Kolpakov, F.A. A modular mathematical model of exercise-induced changes in metabolism, signaling, and gene expression in human skeletal muscle. Int. J. Mol. Sci. 2021, 22, 10353. [Google Scholar] [CrossRef]
  10. Kim, K.S.; Ejima, K.; Iwanami, S.; Fujita, Y.; Ohashi, H.; Koizumi, Y.; Asai, Y.; Nakaoka, S.; Watashi, K.; Aihara, K.; et al. A quantitative model used to compare within-host SARS-CoV-2; MERS-CoV, and SARS-CoV dynamics provides insights into the pathogenesis and treatment of SARS-CoV-2. PLoS Biol. 2021, 19, e3001128. [Google Scholar] [CrossRef]
  11. Bertalanffy, F.D. Respiratory tissue: Structure, histophysiology, cytodynamics. Part II. New approaches and interpretations. Tnt. Rev. Cytol. 1964, 17, 213–297. [Google Scholar] [CrossRef]
  12. Cheung, K.S.; Hung, I.F.N.; Chan, P.P.Y.; Lung, K.C.; Tso, E.; Liu, R.; Ng, Y.Y.; Chu, M.Y.; Chung, T.W.H.; Tam, A.R.; et al. Gastrointestinal manifestations of SARS-CoV-2 infection and virus load in fecal samples from the Hong Kong cohort and systematic review and meta-analysis. Gastroenterology 2020, 159, 81–95. [Google Scholar] [CrossRef] [PubMed]
  13. Wang, S.; Hao, M.; Pan, Z.; Lei, J.; Zou, X. Data-driven multi-scale mathematical modeling of SARS-CoV-2 infection reveals heterogeneity among COVID-19 patients. PLoS Comput. Biol. 2021, 17, e1009587. [Google Scholar] [CrossRef] [PubMed]
  14. Sun, Z.; Cai, X.; Gu, C.; Zhang, R.; Han, W.; Qian, Y.; Wang, Y.; Xu, W.; Wu, Y.; Cheng, X.; et al. Stability of the COVID-19 virus under wet, dry and acidic conditions. medRxiv 2020. Available online: https://www.medrxiv.org/content/10.1101/2020.04.09.20058875v1 (accessed on 25 May 2022). [CrossRef]
  15. MacLennan, I.C.; Gulbranson-Judge, A.; Toellner, K.M.; Casamayor-Palleja, M.; Sze, D.M.; Chan, E.Y.; Luther, S.A.; Orbea, H.A. The changing preference of T and B cells for partners as T-dependent antibody responses develop. Immunol. Rev. 1997, 156, 53–66. [Google Scholar] [CrossRef] [PubMed]
  16. Mygind, N.; Pedersen, M.; Nielsen, M. Morphology of the upper airway epithelium. In The Nose: Upper Airway Physiology and Atmospheric Environment; Proctor, D.F., Andersen, I., Eds.; Elsevier: New York, NY, USA, 1982; pp. 71–97. [Google Scholar]
  17. Fomin, V.M.; Ganimedov, V.L.; Melnikov, M.N.; Muchnaya, M.I.; Sadovsky, A.S.; Shepelenko, V.I. Numerical simulation of air flow in the human nasal cavity with imitation of the clinical method of the anterior active rhinomanometry. J. Appl. Mech. Tech. Phys. 2012, 53, 8–66. (In Russian) [Google Scholar] [CrossRef]
  18. Humphrey, S.P.; Williamson, R.T. A review of saliva: Normal composition, flow, and function. J. Prosthet. Dent. 2001, 85, 162–169. [Google Scholar] [CrossRef] [PubMed]
  19. Hui, K.; Cheung, M.C.; Perera, R.; Ng, K.C.; Bui, C.; Ho, J.; Ng, M.; Kuok, D.; Shih, K.C.; Tsao, S.W.; et al. Tropism, replication competence, and innate immune responses of the coronavirus SARS-CoV-2 in human respiratory tract and conjunctiva: An analysis in ex-vivo and in-vitro cultures. Lancet Resp. Med. 2020, 8, 687–695. [Google Scholar] [CrossRef]
  20. Toremalm, N.G. The daily amount of tracheobronchial secretions in man. Acta Otolaryng. 1960, 158, 43–53. [Google Scholar] [CrossRef]
  21. Openshaw, P. Crossing barriers: Infections of the lung and the gut. Mucosal Immunol. 2009, 2, 100–102. [Google Scholar] [CrossRef] [Green Version]
  22. Creamer, B.; Shorter, R.G.; Bamforth, J. The turnover and shedding of epithelial cells. Gut 1961, 2, 110–116. [Google Scholar] [CrossRef] [Green Version]
  23. Zuercher, A.W.; Coffin, S.E.; Thurnheer, M.C.; Fundova, P.; Cebra, J.J. Nasal-Associated Lymphoid Tissue Is a Mucosal Inductive Site for Virus-Specific Humoral and Cellular Immune Responses. J. Immunol. 2002, 168, 1796–1803. [Google Scholar] [CrossRef] [PubMed]
  24. Lauer, S.A.; Kyra, H.G.; Bi, Q.; Jones, F.K.; Zheng, Q.; Meredith, H.R.; Azman, A.S.; Reich, N.G.; Lessler, J. The Incubation Period of Coronavirus Disease 2019 (COVID-19) From Publicly Reported Confirmed Cases: Estimation and Application. Ann. Intern. Med. 2020, 172, 577–582. [Google Scholar] [CrossRef] [PubMed] [Green Version]
  25. Miao, H.; Hollenbaugh, J.A.; Zand, M.S.; Holden-Wiltse, J.; Mosmann, T.R.; Perelson, A.S.; Wu, H.; Topham, D.J. Quantifying the early immune response and adaptive immune response kinetics in mice infected with influenza A virus. J. Virol. 2010, 84, 6687–6698. [Google Scholar] [CrossRef] [Green Version]
  26. Mayer, A.; Zhang, Y.; Perelson, A.S.; Wingreen, N.S. Regulation of T cell expansion by antigen presentation dynamics. Proc. Natl. Acad. Sci. USA 2019, 116, 5914–5919. [Google Scholar] [CrossRef] [Green Version]
  27. To, K.K.; Tsang, O.T.; Leung, W.S.; Tam, A.R.; Wu, T.C.; Lung, D.C.; Yip, C.C.; Cai, J.P.; Chan, J.M.; Chik, T.S.; et al. Temporal profiles of viral load in posterior oropharyngeal saliva samples and serum antibody responses during infection by SARS-CoV-2: An observational cohort study. Lancet Infect. Dis. 2020, 20, 565–574. [Google Scholar] [CrossRef] [Green Version]
  28. Aktas, B.; Aslim, B. Gut-lung axis and dysbiosis in COVID-19. Turk. J. Biol. 2020, 44, 265–272. [Google Scholar] [CrossRef]
  29. Maghool, F.; Valiani, A.; Safari, T.; Emami, M.H.; Mohammadzadeh, S. Gastrointestinal and renal complications in SARS-CoV-2-infected patients: Role of immune system. Scand. J. Immunol. 2021, 93, e12999. [Google Scholar] [CrossRef]
  30. Rabitz, H.; Kramer, M.; Dacol, D. Sensitivity analysis in chemical kinetics. Annu. Rev. Phys. Chem. 1983, 34, 419–461. [Google Scholar] [CrossRef]
  31. Turgeon, N.; Toulouse, M.J.; Martel, B.; Moineau, S.; Duchaine, C. Comparison of Five Bacteriophages as Models for Viral Aerosol Studies. Appl. Environ. Microbiol. 2014, 80, 42–50. [Google Scholar] [CrossRef] [Green Version]
  32. Кoзлoва, Ю.Н.; Репин, В.Е.; Майбoрoдин, И.В. Treatment of the Surgical Infection Caused Pseudomonas Aeruginosa in Experiment. J. Exp. Clin. Surg. 2013, 6, 425–431. [Google Scholar] [CrossRef]
  33. Davydova, N.V.; Koptev, V.Y.; Kozlova, Y.N.; Sulimova, L.I.; Afonyushkin, V.N.; Cherepushkina, V.S. Estimation of permeability to bacteriophages of intestinal mucosa of chickens with eimeriosis. Sib. Her. Agric. Sci. 2019, 49, 57–63. [Google Scholar] [CrossRef]
  34. Xiao, F.; Tang, M.; Zheng, X.; Liu, Y.; Li, X.; Shan, H. Evidence for gastrointestinal infection of SARS-CoV-2. Gastroenterology 2020, 158, 1831–1833. [Google Scholar] [CrossRef] [PubMed]
  35. Hui, K.P.Y.; Ho, J.C.W.; Cheung, M.-C.; Ng, K.-C.; Ching, R.H.H.; Lai, K.-L.; Kam, T.T.; Gu, H.; Sit, K.-Y.; Hsin, M.K.Y.; et al. SARS-CoV-2 Omicron variant replication in human bronchus and lung ex vivo. Nature 2022, 603, 715–720. [Google Scholar] [CrossRef] [PubMed]
  36. Zhu, J.; Guo, J.; Xu, Y.; Chen, X. Viral dynamics of SARS-CoV-2 in saliva from infected patients. J. Infect. 2020, 81, e48–e50. [Google Scholar] [CrossRef]
  37. Wang, D.; Hu, B.; Hu, C.; Zhu, F.; Liu, X.; Zhang, J.; Wang, B.; Xiang, H.; Cheng, Z.; Xiong, Y.; et al. Clinical characteristics of 138 hospitalized patients with 2019 Novel Coronavirus-infected Pneumonia in Wuhan, China. JAMA 2020, 323, 1061–1069. [Google Scholar] [CrossRef]
  38. Gu, J.; Han, B.; Wang, J. COVID-19: Gastrointestinal manifestations and potential fecal–oral transmission. Gastroenterology 2020, 158, 1518–1519. [Google Scholar] [CrossRef]
  39. Mönkemüller, K.; Fry, L.; Rickes, S. COVID-19, coronavirus, SARS-CoV-2 and the small bowel. Rev. Esp. Enferm. Dig. 2020, 112, 383–388. [Google Scholar] [CrossRef]
  40. Pan, L.; Mu, M.I.; Yang, P.; Sun, Y.; Wang, R.; Yan, J.; Li, P.; Hu, B.; Wang, J.; Hu, C.; et al. Clinical characteristics of COVID-19 patients with digestive symptoms in Hubei, China: A descriptive, cross-sectional, multicenter study. Am. J. Gastroenterol. 2020, 115, 766–773. [Google Scholar] [CrossRef]
  41. Wu, Y.; Guo, C.; Tang, L.; Hong, Z.; Zhou, J.; Dong, X.; Yin, H.; Xiao, Q.; Tang, Y.; Qu, X.; et al. Prolonged presence of SARS-CoV-2 viral RNA in Faecal samples. Lancet Gastroenterol. Hepatol. 2020, 5, 434–435. [Google Scholar] [CrossRef]
  42. Natarajan, A.; Zlitni, S.; Brooks, E.F.; Vance, S.E.; Dahlen, A.; Hedlin, H.; Park, R.M.; Han, A.; Schmidtke, D.T.; Verma, R.; et al. Gastrointestinal symptoms and fecal shedding of SARS-CoV-2 RNA suggest prolonged gastrointestinal infection. Med 2022, in press. Available online: https://0-www-sciencedirect-com.brum.beds.ac.uk/science/article/pii/S2666634022001672 (accessed on 25 May 2022). [CrossRef]
  43. Zollner, A.; Koch, R.; Jukic, A.; Pfister, A.; Meyer, M.; Rossler, A.; Kimpel, J.; Adolph, T.E.; Tilg, H. Post-acute COVID-19 is characterized by gut viral antigen persistence in inflammatory bowel diseases. Gastroenterology 2022, in press. [CrossRef]
  44. Jones, D.L.; Baluja, M.Q.; Graham, D.W.; Corbishley, A.; McDonald, J.E.; Malham, S.K.; Hillary, L.; Connor, T.R.; Gaze, W.H.; Moura, I.B.; et al. Shedding of SARS-CoV-2 in feces and urine and its potential role in person-to-person transmission and the environment-based spread of COVID-19. Sci. Total Environ. 2020, 749, 141364. [Google Scholar] [CrossRef] [PubMed]
  45. Mesoraca, A.; Margiotti, K.; Viola, A.; Cima, A.; Sparacino, D.; Giorlandino, C. Evaluation of SARS-CoV-2 viral RNA in fecal samples. Virol. J. 2020, 17, 86. [Google Scholar] [CrossRef] [PubMed]
  46. Chan, P.K.; To, K.F.; Lo, A.W.; Cheung, J.L.; Chu, I.; Au, F.W.; Tong, J.H.; Tam, J.S.; Sung, J.J.; Ng, H.K. Persistent infection of SARS coronavirus in colonic cells in vitro. J. Med. Virol. 2004, 74, 1–7. [Google Scholar] [CrossRef]
  47. Sender, R.; Bar-On, Y.M.; Gleizer, S.; Bernshtein, B.; Flamholz, A.; Phillips, R.; Milo, R. The total number and mass of SARS-CoV-2 virions. Proc. Natl. Acad. Sci. USA 2021, 118, e2024815118. [Google Scholar] [CrossRef]
  48. Chua, R.L.; Lukassen, S.; Trump, S.; Hennig, B.P.; Wendisch, D.; Pott, F.; Debnath, O.; Thürmann, L.; Kurth, F.; Völker, M.T.; et al. COVID-19 severity correlates with airway epithelium–immune cell interactions identified by single-cell analysis. Nat. Biotechnol. 2020, 38, 970–979. [Google Scholar] [CrossRef]
  49. Mironova, T.E.; Afonyushkin, V.N.; Kozlova, Y.N.; Bobikova, A.S.; Koptev, V.Y.; Cherepushkina, V.S.; Sigareva, N.A.; Kolpakov, F.A. Study of the protective effects of virucidal drugs on the model of coronavirus pneumonia. Vet. Med. Feed. 2020, 7, 35–38. [Google Scholar] [CrossRef]
  50. Nefedova, E.; Koptev, V.; Bobikova, A.S.; Cherepushkina, V.; Mironova, T.; Afonyushkin, V.; Shkil, N.; Donchenko, N.; Kozlova, Y.; Sigareva, N.; et al. The Infectious Bronchitis Coronavirus Pneumonia Model Presenting a Novel Insight for the SARS-CoV-2 Dissemination Route. Vet. Sci. 2021, 8, 239. [Google Scholar] [CrossRef]
  51. Afonyushkin, V.N.; Cherepushkina, V.S.; Tatarchuk, O.P.; Frolova, O.A. Study of anti-phage activity of disinfectants as a factor of suppressing horizontal gene transfer. Bull. KSAU 2020, 4, 88–96. [Google Scholar] [CrossRef]
  52. Afonyushkin, V.N.; Shirshova, A.N.; Shamovskaya, D.V.; Plomodyalov, D.N. A study of the antiviral effect of drug triviron on IBV. Vet. Sci. 2018, 7, 24–28. [Google Scholar]
  53. Romo-Quiñonez, C.R.; Álvarez-Sánchez, A.R.; Álvarez-Ruiz, P.; Chávez-Sánchez, M.C.; Bogdanchikova, N.; Pestryakov, A.; Mejia-Ruiz, C.H. Evaluation of a new Argovit as an antiviral agent included in feed to protect the shrimp Litopenaeus vannamei against White Spot Syndrome Virus infection. PeerJ 2020, 8, e8446. [Google Scholar] [CrossRef] [Green Version]
Figure 1. The developed multicompartmental model of the SARS-CoV-2 infection processes and distribution among three human organs, taking into account the virus reproduction in each compartment and viral transport between them. Gray circles are contact ports representing the interface of the module through which it can be connected with other modules or with the integrated model itself. VNP, VI, and VL correspond to viral particles in the nasopharynx, intestine, and lungs, respectively.
Mathematics 10 01925 g001
Figure 3. An electron micrograph of bacteriophage ph 57 particles. Uranyl acetate staining method (a) and morphology of negative colonies of bacteriophage ph 57 on a matte background of P. aeruginosa CEMTK 670 culture (b).
Mathematics 10 01925 g003
Figure 4. Predicted viral load trajectories in the nasopharyngeal region (NP, blue curve), gastrointestinal tract (intestine, red curve), and lungs (lung, orange curve) are shown. The dashed vertical lines correspond to the timing of humoral immune response initiation in a certain compartment (the color of the dotted line corresponds to the color of the viral trajectory in the compartment). The initial viral load is 100 viral particles in the NP. Y-axis—log10 of viral load (copies/mL); X-axis—days from the moment of infection. (A) Values of the transport parameters correspond to the default values from Table 1. (B) Values of the transport parameters from the nasopharyngeal region to the lungs and from the intestine to the lung were reduced 100 times. (C) Values of the transport parameters from the nasopharyngeal region to the lungs and from the intestine to the lung were increased 100 times.
Mathematics 10 01925 g004
Figure 5. Predicted viral load trajectories in the nasopharyngeal region (NP, blue curve), gastrointestinal tract (Intestine, red curve), and lungs (Lung, orange curve) are shown. The time of humoral immune response initiation in each compartment is the same as in Figure 4. The initial viral load is varied in the NP. Y-axis—log10 of viral load (copies/mL); X-axis—days from the moment of infection. (A) Initial dose of the viral particles corresponds to 102, (B) initial dose is 103, and (C) initial dose is 104.
Mathematics 10 01925 g005
Figure 6. Predicted viral load trajectories in the nasopharyngeal region (NP, blue curve), gastrointestinal tract (intestine, red curve), and lungs (lung, orange curve), depending on the consideration of the T-cellular response, are shown. The dashed vertical lines correspond to the timing of humoral immune response initiation in a certain compartment, while dash-dotted lines represent the initiation of T-cellular immune response in a certain compartment (the color of the dashed and dash-dotted lines correspond to the color of the viral trajectory in the compartment). The initial viral load is 100 viral particles in the NP. Y-axis—log10 of viral load (copies/mL); X-axis—days from the moment of infection. (A) Only B-cellular response is involved in the virus clearance. (B) B- and T-cellular responses are activated.
Mathematics 10 01925 g006
Figure 7. Sensitivity analysis of the model. The target variables in the analysis correspond to the target cell ratios in each compartment, where the column height indicates the scaled sensitivity’s value of the variable to a certain model parameter.
Mathematics 10 01925 g007
Table 2. Concentrations of bacteriophage MS2 (Log10 PFU/mL) in lungs, esophagus, and trachea of mice post 1 and 2.5 h of the inoculation onset.
The Duration of the Experiment1 h2 h 30 min
OrgansLungTracheaEsophagusLungTracheaEsophagus
М ± SD5.502 ± 0.4034.282 ± 0.193.269 ± 0.5875.116 ± 0.4063.672 ± 0.4073.279 ± 0.348
Shapiro–Wilk W0.85330.8920.81450.74960.91720.76
CI 95%5.03–5.984.05–4.512.58–3.964.64–5.63.19–4.152.85–3.67
p-value (Mann–Whitney)0.2920.0190.629
Table 3. The viral peak load and day post-infection during the suppression of virus accumulation in the nasopharynx only (Case 1) and in both compartments (Case 2).
Dose of the Infection, Log10 PFUControlCase 1Case 2
NasopharynxIntestineLungsNasopharynxIntestineLungsNasopharynxIntestineLungs
1.695.55.754.753.75.74.73.75.54.25
1.85.55.754.753.55.74.753.95.54.3
25.55.84.83.25.84.7545.54.35
2.695.55.84.854.85.854.84.65.74.7
2.85.515.84.854.65.854.84.65.74.75
35.55.84.94.255.854.84.75.754.8
3.695.515.854.85.854.84.74.74.8
M5.505.794.844.125.804.774.315.484.56
SD0.000.020.090.660.070.040.430.360.25
CI (95%)5.498–5.5075.76–5.814.76–4.933.515–4.7285.734–5.8654.735–4.8083.917–4.7125.145–5.8124.33–4.79
Shapiro–Wilk W0.60040.60040.92020.89330.71030.76930.81450.70860.801
p-value (Mann–Whitney: Case 1 vs. Control)0.001690.31150.1122
p-value (Mann–Whitney: Case 2 vs. Control)0.0016490.0230.02018
Note: In the experiment, γL = 1.0; epsilon = 0.995, one day after the onset of infection; SD—standard deviation; M—medium.
Publisher’s Note: MDPI stays neutral with regard to jurisdictional claims in published maps and institutional affiliations.

