Article

Deep Learning Approaches for the Segmentation of Glomeruli in Kidney Histopathological Images

1
Department of Information Engineering and Mathematics (DIISM), University of Siena, 53100 Siena, Italy
2
Department of Social, Political and Cognitive Sciences, University of Siena, 53100 Siena, Italy
3
Azienda Sanitaria Universitaria Integrata di Trieste, ASUITS, 34127 Trieste, Italy
4
Nephrology Dialysis and Transplantation Unit, Siena University, Azienda Ospedaliera Universitaria Senese, Le Scotte, 53100 Siena, Italy
*
Author to whom correspondence should be addressed.
Mathematics 2022, 10(11), 1934; https://doi.org/10.3390/math10111934
Submission received: 7 May 2022 / Revised: 30 May 2022 / Accepted: 2 June 2022 / Published: 5 June 2022
(This article belongs to the Special Issue Neural Networks and Learning Systems II)

Abstract

:
Deep learning is widely applied in bioinformatics and biomedical imaging, due to its ability to perform various clinical tasks automatically and accurately. In particular, the application of deep learning techniques for the automatic identification of glomeruli in histopathological kidney images can play a fundamental role, offering a valid decision support system tool for the automatic evaluation of the Karpinski metric. This will help clinicians in detecting the presence of sclerotic glomeruli in order to decide whether the kidney is transplantable or not. In this work, we implemented a deep learning framework to identify and segment sclerotic and non-sclerotic glomeruli from scanned Whole Slide Images (WSIs) of human kidney biopsies. The experiments were conducted on a new dataset collected by both the Siena and Trieste hospitals. The images were segmented using the DeepLab V2 model, with a pre-trained ResNet101 encoder, applied to 512 × 512 patches extracted from the original WSIs. The results obtained are promising and show a good performance in the segmentation task and a good generalization capacity, despite the different coloring and typology of the histopathological images. Moreover, we present a novel use of the CD10 staining procedure, which gives promising results when applied to the segmentation of sclerotic glomeruli in kidney tissues.

1. Introduction and Background

In the big data era, the transformation of biomedical data into valuable knowledge has become one of the most important challenges in bioinformatics [1,2,3]. Deep learning has in fact advanced rapidly since the beginning of the new millennium and now demonstrates cutting-edge performance in various fields. As a result, the application of deep learning in biomedical sciences has been emphasized in both academia and industry [4,5,6]. In particular, deep learning architectures can automatically extract features from images, which makes them very efficient and attractive for real-world image parsing applications [7,8,9,10,11,12,13,14,15,16].
Kidney transplantation and kidney nephritis detections are among the major clinical priorities and, indeed, kidney transplantation is one of the most common transplant surgeries performed worldwide. Currently, it is estimated that more than 100,000 people in the United States are awaiting a kidney transplant [10], with an average waiting time of 3.6 years, depending on the patient’s health status, compatibility, and organ availability [10,11]. In fact, organ compatibility is hard to assess because it is based on multiple aspects that consider both the clinical and morphological features of the candidate organ analyzed. In this context, the Karpinsky index [12] is typically used to assess transplantability. The Karpinsky index, first introduced in 1999, is based on the assessment of four parameters, namely the rate of glomerular sclerosis, tubular atrophy, interstitial fibrosis, and reduction in the arteriolar caliber, and assigns a score between 0 and 3, where 0 indicates the absence of the pathological condition and 3 stands for the worst state for the evaluated feature.
The renal glomeruli are vascular formations consisting of a group of capillaries with the function of filtering urine from the blood, while the Bowman’s capsule is a part of the nephron (the structural and functional unit of the vertebrate kidneys) that forms a cup-shaped sac surrounding the glomerulus. The Bowman’s capsule encloses a space called the Bowman’s space, which represents the beginning of the urinary space. Bowman’s capsule, Bowman’s space, and the glomerular capillary network and its supporting architecture can be collectively considered as components of the glomerulus. There are approximately 900,000 glomeruli within the cortex of a mature human kidney [13]. From a morphological point of view, lesions present in glomeruli can be quantified by evaluating the Bowman’s space. Examples of healthy and sclerotic glomeruli are shown in Figure 1.
In recent years, few studies witnessed the use of deep learning for applications in the field of nephropathology and histopathology [7]. For example, in [17], a Computer-Aided-Diagnosis (CAD; Table 1 includes a description of abbreviations and acronyms used) system was proposed to classify sclerotic and non-sclerotic glomeruli. A Convolutional Neural Network (CNN) was employed and trained on a small in-house collected dataset, composed of only 26 kidney biopsies. In [18], instead, a two-step deep learning approach was realized, segmenting and then classifying the segmented structures, using an AlexNet-like architecture, tested on 47 Whole Slide Images (WSIs). Similarly, in [19], some different staining modalities were compared in the framework of a classification model to predict diseased and non-diseased kidney tissues. The study was conducted using tissues collected from six patients and demonstrates the superiority of deep learning approaches over human performance in this task. In [20], the AlexNet-based sliding window approach was applied to the WSIs to classify glomerular/non-glomerular regions, achieving good accuracy in glomerulus detection. Moreover, in [21], an ensemble classifier was employed for the semantic segmentation of glomerulus areas. Similar approaches can also be found in the case of the segmentation/detections of mice-glomeruli [22,23], based on a slightly higher number of images. Indeed, one of the major difficulties in the case of human kidneys is precisely the absence of consolidated benchmarks to be used for the segmentation of glomeruli.
Therefore, for the purpose of our study, we collected a novel dataset in cooperation with the Siena Hospital and the Trieste Hospital. The WSIs were acquired with different instruments and underwent different staining procedures. Clinical experts from both hospitals accurately segmented the entire WSI set and tagged all glomeruli by assigning them to the sclerotic or non-sclerotic classes. Specifically, to facilitate this task, we implemented a novel pipeline for clinicians that allowed them to easily tag WSIs through a scripting interface platform we developed. The dataset we collected was subsequently used for the training and validation of the deep learning architecture presented in this manuscript. Moreover, we studied the CD10 staining procedure as a way to improve the detectability of sclerotic glomeruli in kidney tissues. The proposed staining approach shows promising performance, especially for the segmentation of sclerotic glomeruli.
The paper is organized as follows. In Section 2, we present an outline of the collected dataset, as well as the methodology and the performance indicators used for the assessment of the network results. In Section 3, the experimental settings are described and results are shown and discussed for the sclerotic and non-sclerotic glomerulus, both for the CD10 and the Masson-stained images, in Section 3 and Section 4, respectively. Finally, in Section 5, we draw conclusions and future perspectives.

2. Materials and Methods

2.1. Patient Data Collection

The new image dataset was collected in a joint project between the Hospital of Siena (Azienda Ospedaliera Senese, “Le Scotte”) and the Hospital of Trieste (Azienda Ospedaliero-Universitaria “Giuliano Isontina”). Two types of immuno-histological images were gathered: using the Masson and the CD10 staining procedures. Masson trichrome staining is a standard coloring protocol used in histology. It was originally developed by Claude Pierre Masson and is widely employed for its ability to correctly distinguish cells nearby connective tissue. The CD10 staining (CD10 [SP67] Rabbit Monoclonal Primary Antibody), instead, is an immune histological coloring that is commonly used for cancer detection in WSIs.
A total of 52 images from the Trieste Center and 25 images from the AOU Siena Hospital Center were collected in our dataset; the images were stained with the Masson procedure. Moreover, 12 images stained with the CD10 primary antibody coming from the Siena Hospital Center were also gathered. All the WSIs were captured at 400× magnification and saved in tiff format using a high-resolution whole-slide scanner Ventana DP 200 (ROCHE) in the Siena Hospital. The images from Trieste were digitalized through the use of the D-sight scanner (Menarini) at 20× magnification.

2.2. Method: DeepLab V2

To detect the structure of glomeruli, a well-established CNN-based architecture for semantic segmentation, the DeepLab V2 network [24], was used. In fact, DeepLab has reached the state-of-the-art performance in multiple semantic segmentation tasks [24]. The design of the model is based on a typical segmentation architecture that uses an encoding and a decoding part. The DeepLab architecture employs atrous convolutions that allow enlarging the receptive field without using pooling operations, which can produce a loss of spatial information [24]. More formally, an atrous convolution y ( i ) for a one-dimensional signal x ( i ) , with a filter w ( k ) of length K and a stride rate r , can be described as:
y [ i ] = k = 1 K x [ i + r , k ] w [ k ]        
One of the first CNNs used for semantic segmentation is the Fully Convolutional Network (FCN). A fundamental issue with FCN is that the alternance of convolutional and pooling layers produces a down-sampled output so that the predicted segmentation is characterized by fuzzy boundaries. DeepLab V1, instead, uses a standard CNN followed by one or two atrous layers, to give a coarse rank map. This map is then up-sampled using interpolation so that a higher resolution is obtained; subsequently, a fully convolutional Conditional Random Field (CRF) is applied to improve the final segmentation map. Further improvements were introduced with version 2 of the DeepLab, where an Atrous Spatial Pyramid Pooling (ASPP) was added to the model. The ASPP allows handling the presence of objects with different sizes by applying multiple atrous convolutions with different sampling rates [24]. Various kinds of encoders can be used in the DeepLab architecture. In our experiments, we used a ResNet101 encoder pre-trained on the MS_COCO dataset [25].

2.3. Performance Evaluation

Performance was evaluated through a 5-fold cross-validation procedure, employing two commonly used metrics for semantic segmentation, namely the Jaccard and Dice indices. The Jaccard index defines the similarity between two sets of objects. It is, in fact, commonly used in computer vision, and particularly for semantic segmentation applications to evaluate performance, because it can effectively compare predicted and ground truth masks. More formally, given two sets A and B , the Jaccard or Intersection Over Union (IOU) index is defined as:
J a c c a r d   ( I O U ) = | A B | | A B |
This represents the ratio between the intersection and the union of the two sets.
Another commonly used performance indicator in semantic segmentation is the Dice similarity index. In this case, given two sets A and B , the Dice index can be defined as:
D i c e = 2 | ( A B ) | | A | + | B |
where | A | and | B | are the cardinality of the sets A and B , respectively.

3. Results

3.1. Data Preparation

The dataset used in this work was not originally provided with pixel-level supervision suitable for carrying out the image semantic segmentation task. Therefore, as a first step, we set up a pipeline so that clinicians could easily label each pixel of the images belonging to glomeruli or not. To this end, we used an open-source histopathological image processing software, called QuPath [26]. In particular, we designed and developed a set of pre-processing scripts written in the Groovy language that is supported as an extension scripting language for the QuPath platform. The scripts assist and guide clinicians through the various phases of the labeling procedures, and eventually save the results into a standard mask, linked to the corresponding original image.
Using this interface, clinicians were able to provide 52 renal agobiopsy images from the Trieste Hospital (stained with the Masson procedure), 25 procurement renal wedge biopsy images from the AOU Siena Hospital (stained with the Masson trichrome technique), and 12 discarded kidney images also from the Siena Hospital (stained with a double staining CD10/PAS). In Table 2, we present a summary of the total number of sclerotic and non-sclerotic glomeruli for the two types of staining.
The original images were subsequently cropped in patches of dimensions 512 × 512 pixel size, downsampled by a factor of 2, to be used as input to the deep learning architecture. The patches were obtained by dividing the original WSI images into tiles of dimension 512 × 512 pixels, without pre-selection, in order to obtain examples of kidney tissue only, and of sclerotic and non-sclerotic glomeruli.

3.2. Experimental Setting

In this section, we will provide a description of the results obtained by the proposed automatic segmentation method. In our experimental setup, we trained the DeepLab V2 architecture with a Resnet101 encoder, pre-trained on the MS_COCO dataset [25], to perform sclerotic and non-sclerotic glomerulus segmentation. The training was performed for 2000 epochs using a weight decay of 0.0005, a learning rate of 2.5 × 10⁻⁴, and a batch size of 2.
We performed segmentation of sclerotic and non-sclerotic glomeruli dividing the dataset according to the staining procedure type. First, we trained the model with the Masson-stained images, and performed segmentation of sclerotic and healthy glomeruli, considering only Masson-colored images. The results are presented in Section 3.2.1 and Section 3.2.2. Secondly, we considered the CD10 colored images and performed segmentation of sclerotic and healthy glomeruli. For this last case, the results are presented in Section 3.2.3 and Section 3.2.4.

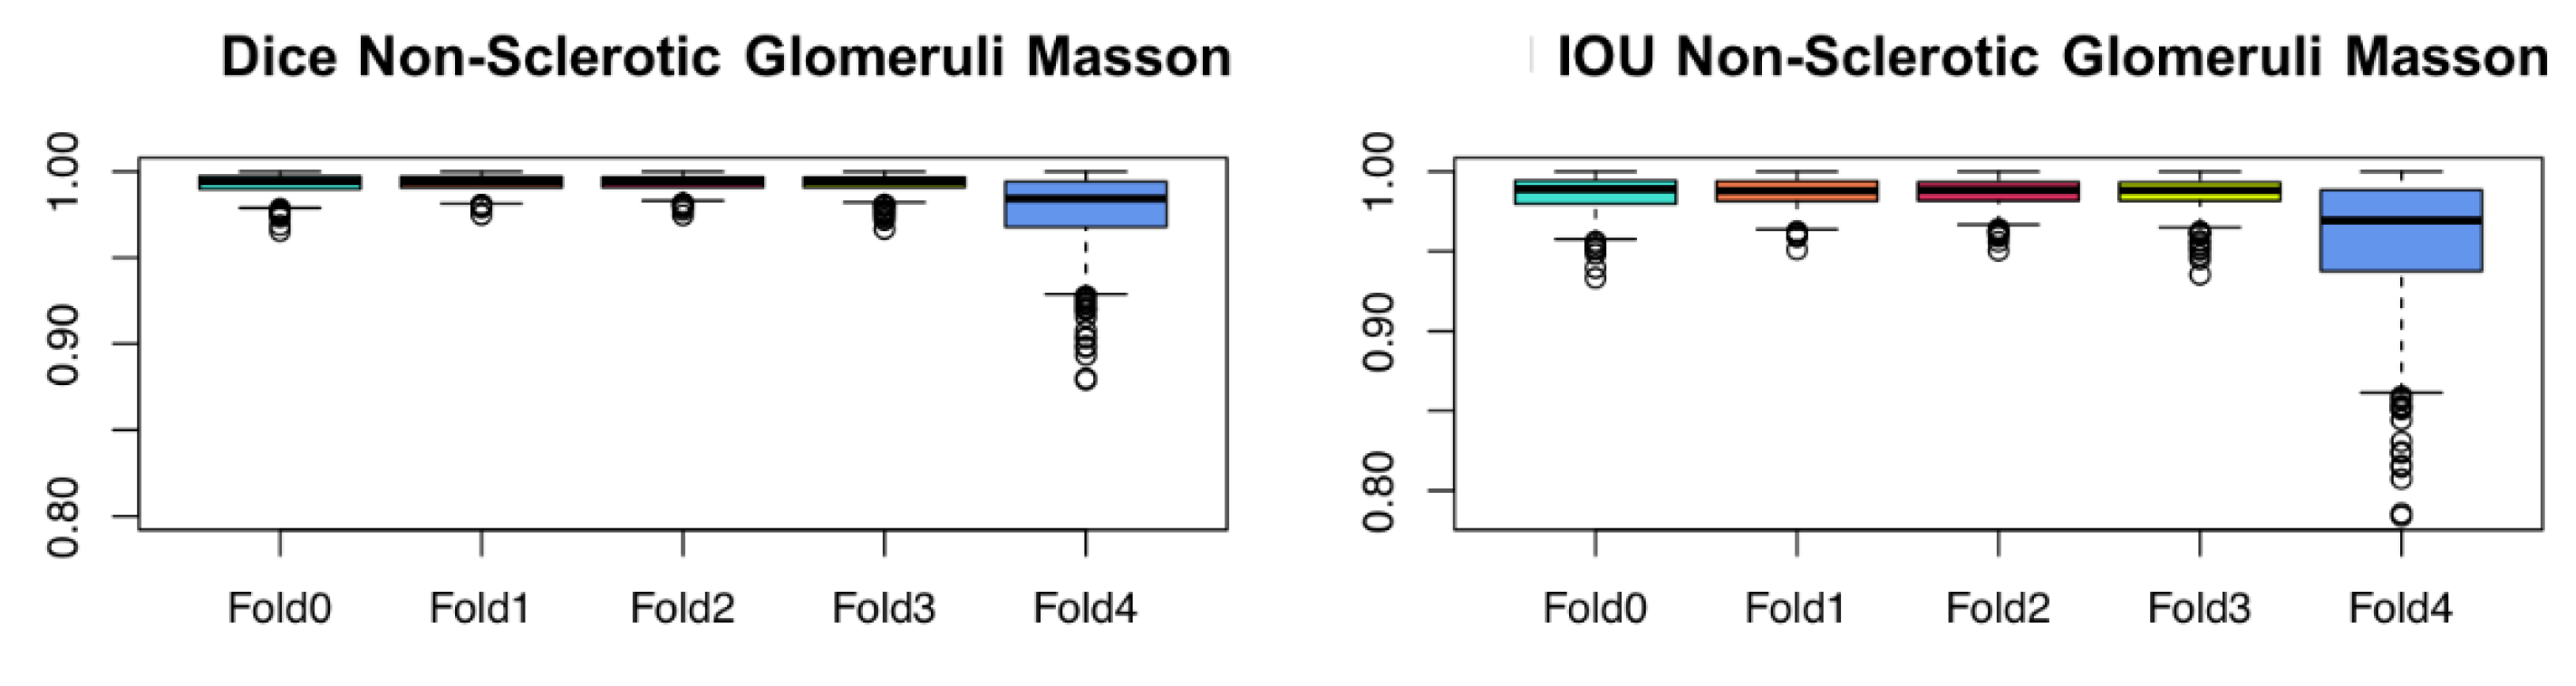
3.2.1. Segmentation of Masson Non-Sclerotic Glomeruli

We conducted experiments on the Masson-stained images considering jointly the data from Trieste and Siena as a single dataset. After the pre-processing, a total amount of 1936 tiles containing ground truth masks of healthy glomeruli were obtained for this dataset. Adopting a 5-fold cross-validation approach, the dataset was divided into 5 folds and, at each iteration, approximately 1393 elements were used for training, 155 for validation, and 388 for the test, with a hold-out approach. The results of the 5-fold cross-validation experiments on test images are reported in Figure 2. As we can see, the segmentation algorithm performed extremely well, across all the 5 folds. The median IOU was 0.99, while the mean standard deviation was 0.98 (±0.024 s.d.). The same held true for the Dice Index, where we obtained a median of 0.99 across the 5 folds, with a mean of 0.98 ± (0.012 s.d.).

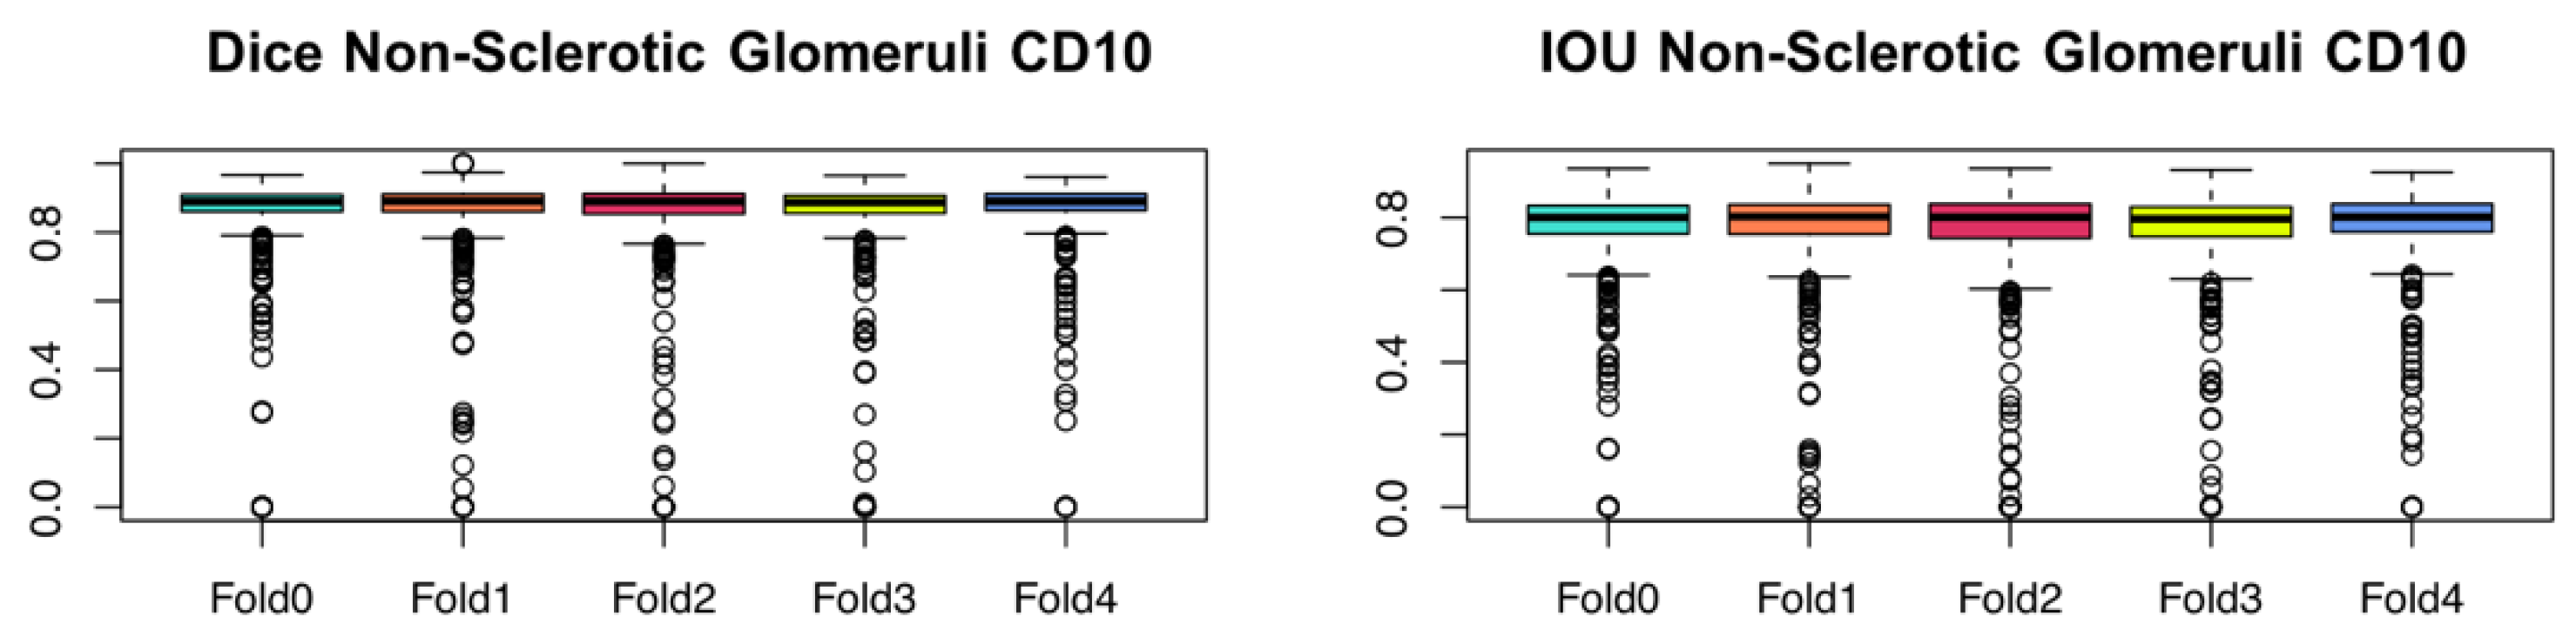
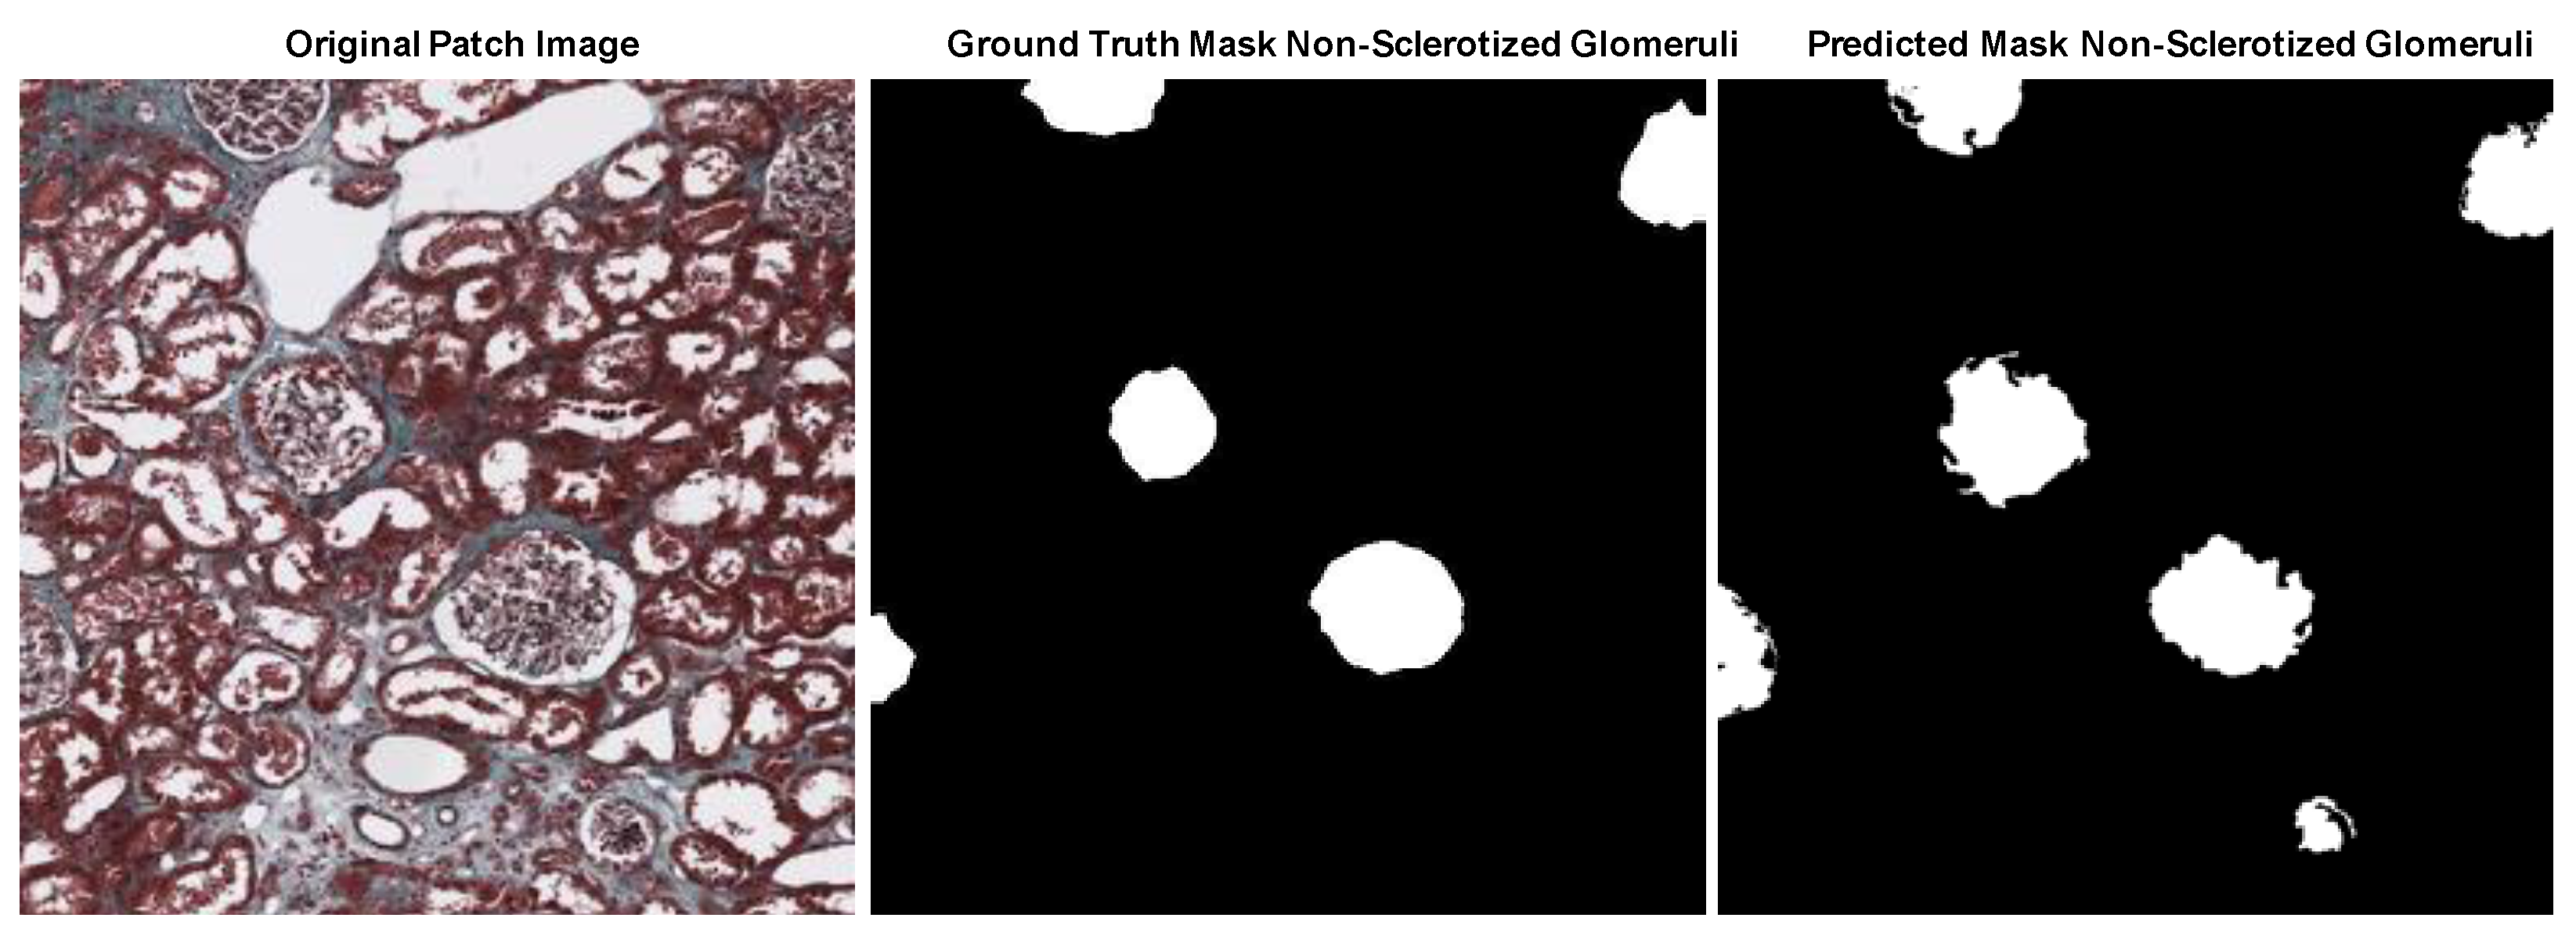
3.2.2. Segmentation of CD10 Non-Sclerotic Glomeruli

We then performed segmentation on the non-sclerotic glomeruli for the CD10-stained images. Results of the 5-fold cross-validation procedure are reported in Figure 3. In this case, a total of 2502 patches were obtained (with roughly 1803 patches for training, 500 for tests, and 199 for validation). As we can appreciate from Figure 3, performance, in this case, was worse than using Masson-stained images (Section 3.2.1). In fact, we obtained a median Dice index of 0.89 across the 5 folds, with a mean of 0.85 (±0.14 s.d.). The same trend can be observed using the IOU metric, where a median IOU of 0.80 and a mean value of 0.77 (±0.15 s.d.) were obtained. We can also see the presence of several outliers across the 5 folds. This behavior could be due to the presence of “difficult” patches, where there are only a few glomeruli, which are more difficult to detect. In particular, IOU and Dice indices close to zero are often obtained for the tiles comprising only spurious glomeruli or when they are absent.

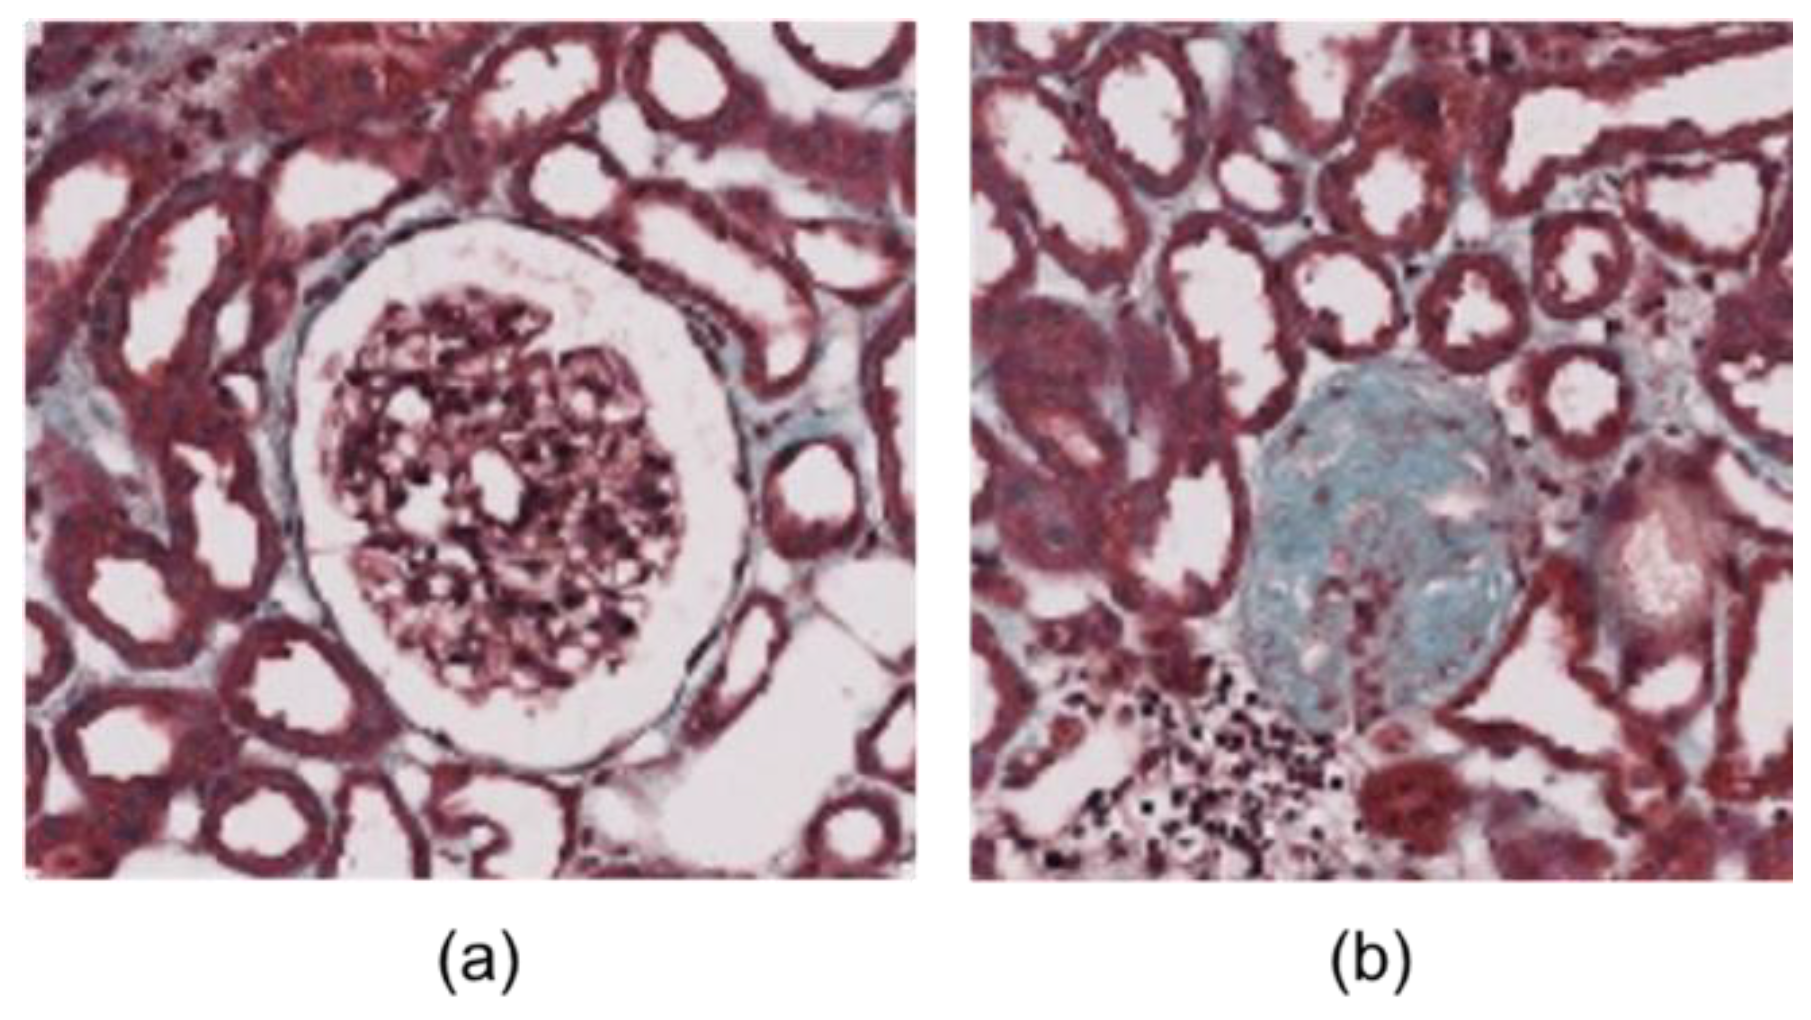
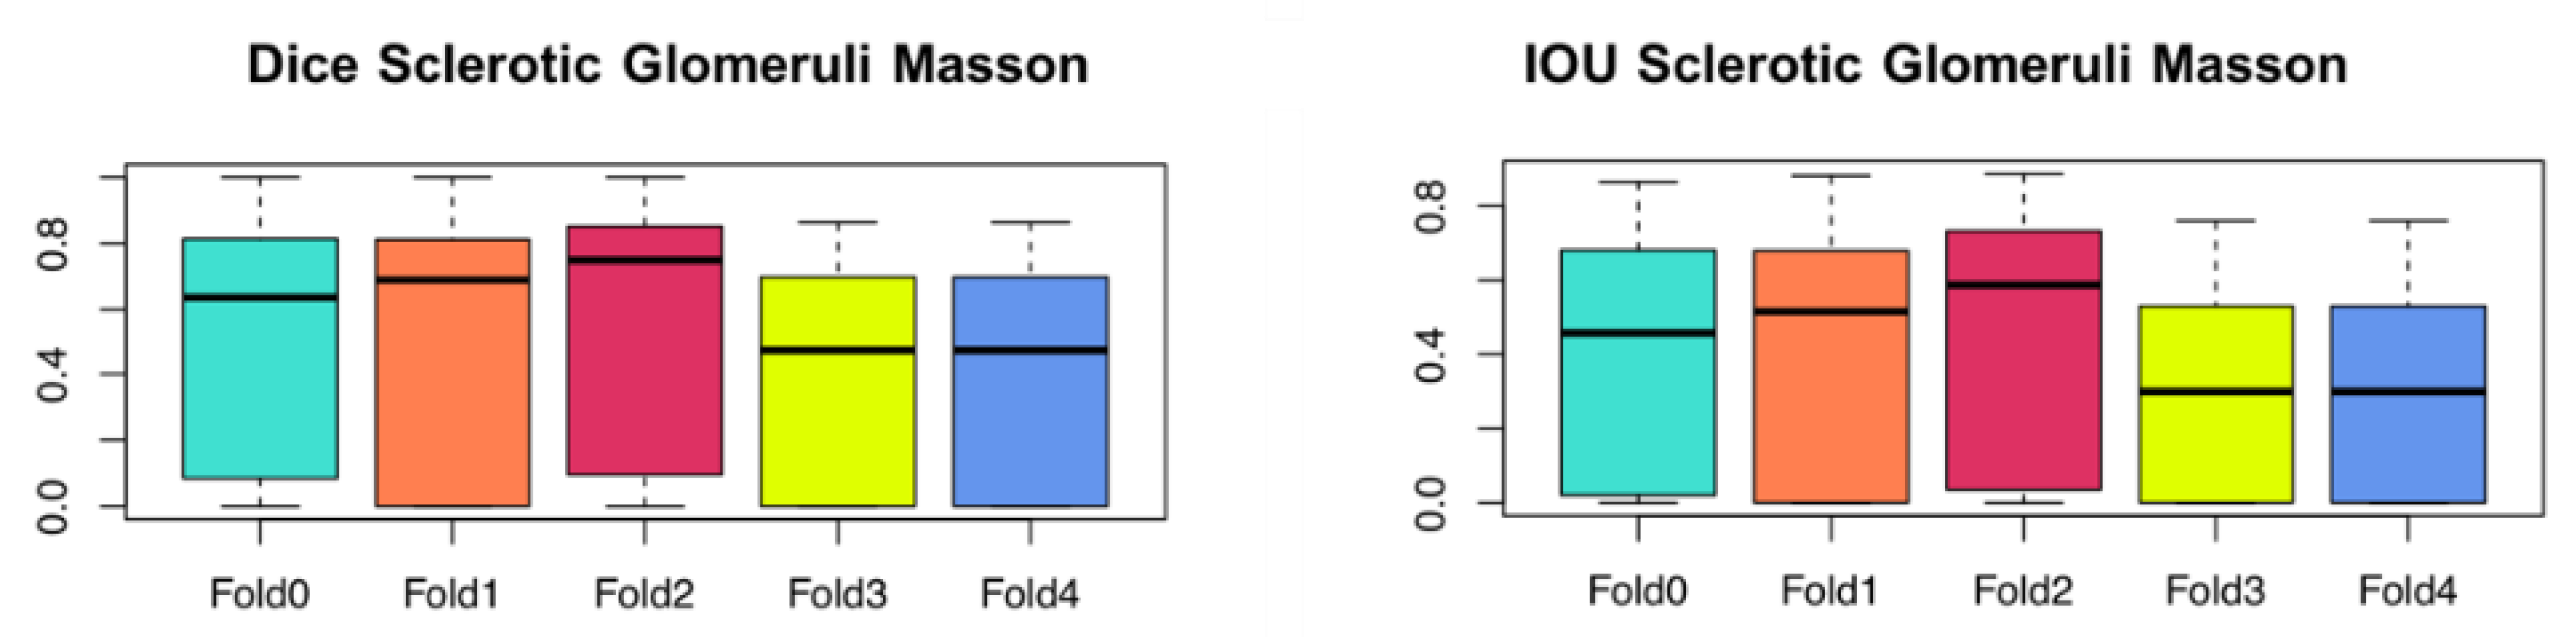
3.2.3. Segmentation of Masson Sclerotic Glomeruli

For this task, a total of 771 patches were obtained (around 155 were used for testing, 554 for training, and 62 for validation at each iteration of the 5-fold cross-validation procedure).
The segmentation performance of sclerotic glomeruli using the Masson-stained images dropped significantly. The mean IOU across the 5 folds was 0.37 (±0.29 s.d.), with a median value of 0.39. Similar values were obtained for the Dice index, where a mean of 0.46 (±0.34 s.d.) and a median of 0.57 were obtained. This performance drop can be caused by several factors, the most important of which are the limited number of sclerotic samples available in Masson-stained images and the increased difficulty of the detection of sclerotic glomeruli compared to the non-sclerotic ones.
As we can observe from the boxplots in Figure 4, the results had a high variability from image to image, which could be caused by a poor model generalization that we hope to increase as soon as more data become available.

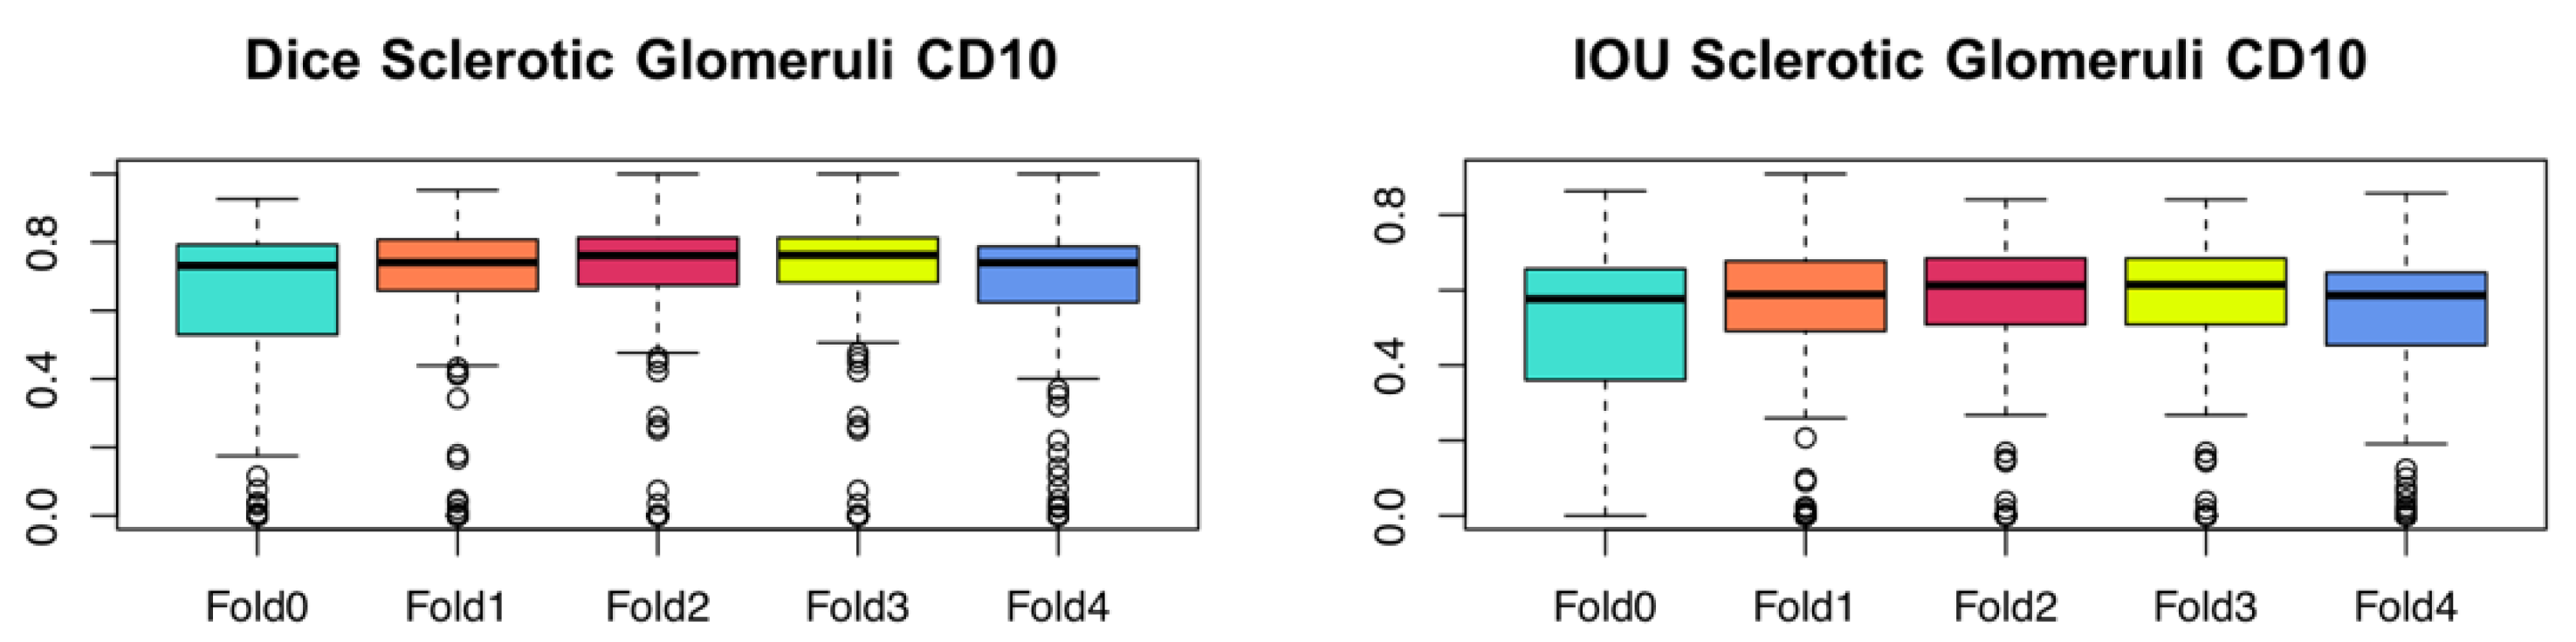
3.2.4. Segmentation of CD10 Sclerotic Glomeruli

When the CD10-stained images were used to segment sclerotic glomeruli, we obtained a mean IOU of 0.66 (±0.24 s.d.) and a median of 0.75. Instead, using the Dice index we obtained a mean of 0.53 (±0.22) and a median of 0.60. In this case, a total of 848 patches were employed (approximately 610 patches were used for training, 171 for the test, and 67 for validation at each iteration of the 5-fold cross-validation process). Compared to the results for the non-sclerotic glomeruli, we could observe a significant drop in performance. However, the results were better than those obtained in the case of sclerotic glomeruli with Masson staining (Section 3.2.3), as we can see from Figure 5.

4. Discussion

The experiments performed show the capability of the proposed deep learning architecture to successfully segment both the sclerotic and non-sclerotic glomeruli. In Table 3, we summarize the results reported in Section 3, with respect to the average Dice and IOU obtained across the 5-fold cross-validation procedure for the four classifiers.
In particular, we obtained the best performance in the segmentation of non-sclerotic glomeruli with the Masson-stained images, where both IOU and Dice averages over all folds were above 0.98. For the CD10 non-sclerotic glomerulus segmentation, performance was also quite good and robust across different folds, even if the results are lower compared to the Masson-stained images. Such behavior is due to the lower number of examples of sclerotic glomeruli present in our dataset, which might impact and worsen performance. Moreover, the task of segmenting sclerotic glomeruli is inherently harder, as such structures are more difficult to detect. An example of the segmentation for non-sclerotic glomeruli, in the case of the Masson-stained images, is presented in Figure 6.
For the segmentation of sclerotic glomeruli, instead, the best performance was reached in the case of CD10-stained images, where an average IOU of 0.65 and a median of 0.74 are obtained. This can be due to several reasons. On the one hand, the number of available examples of sclerotic glomeruli is higher for the CD10 staining—about 2317 images compared to only 523 for the Masson case. On the other hand, the Masson-stained images are also heterogeneous, since they were collected in two different centers (Siena and Trieste), which increases the variability of the samples, making it harder for the network training. This effect is not evident when a higher number of examples is present (such as for non-sclerotic glomeruli). Additionally, it must be considered that non-sclerotic glomeruli are easier to detect than sclerotic glomeruli since they present a non-blurred contour and a definite shape, which allow an easier (visual) identification of the region in which they are located. On the CD10 images, sclerotic glomeruli become much more evident, and, therefore, the deep learning methods are also more effective in their segmentation. An example of the segmentation of sclerotic glomeruli on CD10-stained images is presented in Figure 7.
Glomerular damage is common in renal pathologies leading to chronic and end-stage renal disease. Morphological changes within the glomeruli provide valuable insight into the mechanisms of kidney failure and facilitate an accurate clinical diagnosis. Moreover, a fundamental morphological parameter in nephropathology is the quantification of normal and abnormal glomeruli: the number of glomeruli is required for the assessment of tissue sufficiency in renal transplant pathology, while the histological analysis of glomerular diseases involves a careful examination of the entire slide of a renal biopsy, which includes the identification of all glomeruli, the assessment of their status and the integration of these data with other parameters to assess the kidney health. This work demonstrates the power of deep learning for assessing complex histologic structures from digitized human kidney biopsies. Indeed, the results hereby presented are very promising and can be considered as the first step toward an automatic pipeline to evaluate the Karpinsky index, and to speed up and support the decision on the transplantability of a kidney Unfortunately, we were unable to compare our results against existing methods due to the lack of a standard benchmark, available only in the case of mice https://datadryad.org/stash/dataset/doi:10.5061/dryad.fqz612jpc, accessed on 6 May 2022. Currently, the absence of a huge standardized dataset with labeled images is a great limitation, and more images containing sclerotic glomeruli need to be collected to improve the performance of our approach, and before making our new dataset available.

5. Conclusions

In this paper, we proposed a novel histopathological dataset of renal tissues, coupled with the label maps of sclerotic and non-sclerotic glomeruli, and performed an automatic segmentation of the manually labeled images. The work was carried out in collaboration with the Hospitals of Siena and Trieste. In our experiments, we employed the DeepLab V2 architecture for the segmentation of both sclerotic and non-sclerotic glomeruli, using a 5-fold cross-validation technique for partially contrasting the problem of data scarcity. The best performance was obtained in the case of non-sclerotic glomeruli present in the Masson-stained images and, as regards the segmentation of sclerotic glomeruli, with the CD10-stained images. Future work entails creating an enlarged dataset to increase performance, especially for the segmentation of sclerotic glomeruli. Moreover, we are currently working on improving the segmentation tool to be able to perform a clinical re-assessment and validation of the results obtained. We also believe that the employment of the CD10 staining procedure for the detection of glomerular structures could significantly improve the performance of automatic detection tools and could open new research perspectives in the field of automatic analysis of histopathological images.

Author Contributions

Conceptualization, G.M.D. methodology, G.M.D.; software, G.M.D.; validation, G.M.D., S.A.T., A.M., F.S., M.B., P.A. and S.B.; investigation, G.M.D.; data curation, T.M., S.A.T., G.G., A.Z. and G.M.D.; writing—original draft preparation, G.M.D.; writing—review and editing, S.B., P.A., M.B., F.S., S.A.T., A.M., T.M. and G.M.D.; supervision, M.B., F.S., S.A.T., A.M., G.G., A.Z. All authors have read and agreed to the published version of the manuscript.

Funding

The work has been carried out thanks to the FONDI ORGANIZZAZIONE TOSCANA TRAP-IANTI (OTT), REGIONE TOSCANA, A.Y. 2019–2020.

Institutional Review Board Statement

Not applicable.

Informed Consent Statement

Patient consent was waived due to the fact that patients cannot be identified from the images used in the study.

Data Availability Statement

Not applicable.

Acknowledgments

The work has been carried out thanks to the FONDI ORGANIZZAZIONE TOSCANA TRAPIANTI (OTT), REGIONE TOSCANA, A.Y. 2019–2020.

Conflicts of Interest

The authors declare no conflict of interest.

References

  1. Larrañaga, P.; Calvo, B.; Santana, R.; Bielza, C.; Galdiano, J.; Inza, I.; Lozano, J.A.; Armañanzas, R.; Santafé, G.; Pérez, A.; et al. Machine learning in bioinformatics. Brief. Bioinform. 2006, 7, 86–112. [Google Scholar] [CrossRef] [PubMed] [Green Version]
  2. Su, C.; Tong, J.; Zhu, Y.; Cui, P.; Wang, F. Network embedding in biomedical data science. Brief. Bioinform. 2020, 21, 182–197. [Google Scholar] [CrossRef] [PubMed]
  3. Dimitri, G.M.; Agrawal, S.; Young, A.; Donnelly, J.; Liu, X.; Smielewski, P.; Hutchinson, P.; Czosnyka, M.; Lió, P.; Haubrich, C. A multiplex network approach for the analysis of intracranial pressure and heart rate data in traumatic brain injured patients. Appl. Netw. Sci. 2017, 2, 29. [Google Scholar] [CrossRef] [PubMed]
  4. Dimitri, G.M.; Agrawal, S.; Young, A.; Donnelly, J.; Liu, X.; Smielewski, P.; Hutchinson, P.; Czosnyka, M.; Lio, P.; Haubrich, C. Simultaneous Transients of Intracranial Pressure and Heart Rate in Traumatic Brain Injury: Methods of Analysis. In Intracranial Pressure & Neuromonitoring XVI; Springer: Cham, Switzerland, 2018; pp. 147–151. [Google Scholar]
  5. Peterson, E.D. Machine learning, predictive analytics, and clinical practice: Can the past inform the present? JAMA 2019, 322, 2283–2284. [Google Scholar] [CrossRef] [PubMed]
  6. Scott, I.A.; Cook, D.; Coiera, E.W.; Richards, B. Machine learning in clinical practice: Prospects and pitfalls. Med. J. Aust. 2019, 211, 203–205. [Google Scholar] [CrossRef] [PubMed]
  7. Maenosono, R.; Tullius, S.G. Saving lives by saving kidneys for transplant. JAMA Intern. Med. 2019, 179, 1374–1375. [Google Scholar] [CrossRef] [PubMed]
  8. Becker, J.U.; Mayerich, D.; Padmanabhan, M.; Barratt, J.; Ernst, A.; Boor, P.; Cicalese, P.A.; Mohan, C.; Nguyen, H.V.; Roysam, B. Artificial intelligence and machine learning in nephropathology. Kidney Int. 2020, 98, 65–75. [Google Scholar] [CrossRef] [PubMed]
  9. Cun, Y.L.; Bengio, Y.; Hinton, G. Deep learning. Nature 2015, 521, 436–444. [Google Scholar]
  10. Available online: http://optn.transplant.hrsa.gov/ (accessed on 1 April 2022).
  11. Available online: https://www.kidney.org (accessed on 1 March 2022).
  12. Karpinski, J.; Lajoie, G.; Cattran, D.; Fenton, S.; Zaltzman, J.; Cardella, C.; Cole, E. Outcome of kidney transplantation from high-risk donors is determined by both structure and function. Transplantation 1999, 67, 1162–1167. [Google Scholar] [CrossRef] [PubMed]
  13. Falkson, S.R.; Bordoni, B. Anatomy, Abdomen and Pelvis, Bowman Capsule’s StatPearls Publishing. 2022. Available online: https://0-www-ncbi-nlm-nih-gov.brum.beds.ac.uk/books/NBK554474/ (accessed on 1 May 2022).
  14. Bonechi, S.; Andreini, P.; Mecocci, A.; Giannelli, N.; Scarselli, F.; Neri, E.; Bianchini, M.; Dimitri, G.M. Segmentation of Aorta 3D CT Images Based on 2D Convolutional Neural Networks. Electronics 2021, 10, 2559. [Google Scholar] [CrossRef]
  15. Dimitri, G.M.; Spasov, S.; Duggento, A.; Passamonti, L.; Liò, P.; Toschi, N. Unsupervised stratification in neuroimaging through deep latent embeddings. In Proceedings of the 2020 42nd Annual International Conference of the IEEE Engineering in Medicine & Biology Society (EMBC), Montreal, QC, Canada, 20–24 July 2020. [Google Scholar]
  16. Guo, Y.; Liu, Y.; Oerlemans, A.; Lao, S.; Wu, S.; Lew, M.S. Deep learning for visual understanding: A review. Neurocomputing 2016, 187, 27–48. [Google Scholar] [CrossRef]
  17. Altini, N.; Cascarano, G.D.; Brunetti, A.; Marino, F.; Rocchetti, M.T.; Matino, S.; Venere, U.; Rossini, M.; Pesce, F.; Gesualdo, L.; et al. Semantic segmentation framework for glomeruli detection and classification in kidney histological sections. Electronics 2020, 9, 503. [Google Scholar] [CrossRef] [Green Version]
  18. Bueno, G.; Fernandez-Carrobles, M.M.; Gonzalez-Lopez, L.; Deniz, O. Glomerulosclerosis identification in whole slide images using semantic segmentation. Comput. Methods Programs Biomed. 2020, 184, 105273. [Google Scholar] [CrossRef] [PubMed]
  19. Temerinac-Ott, M.; Forestier, G.; Schmitz, J.; Hermsen, M.; Bräsen, J.H.; Feuerhake, F.; Wemmert, C. Detection of glomeruli in renal pathology by mutual comparison of multiple staining modalities. In Proceedings of the 10th International Symposium on Image and Signal Processing and Analysis, Ljubljana, Slovenia, 18–20 September 2017. [Google Scholar]
  20. Gallego, J.; Pedraza, A.; Lopez, S.; Steiner, G.; Gonzalez, L.; Laurinavicius, A.; Bueno, G. Glomerulus classification and detection based on convolutional neural networks. J. Imaging 2018, 4, 20. [Google Scholar] [CrossRef] [Green Version]
  21. Gu, Y.; Ruan, R.; Yan, Y.; Zhao, J.; Sheng, W.; Liang, L.; Huang, B. Glomerulus Semantic Segmentation Using Ensemble of Deep Learning Models. Arab. J. Sci. Eng. 2022, 1–12. [Google Scholar] [CrossRef]
  22. Bukowy, J.D.; Dayton, A.; Cloutier, D.; Manis, A.D.; Staruschenko, A.; Lombard, J.H.; Solberg Woods, L.C.; Beard, D.A.; Cowley, A.W., Jr. Region-based convolutional neural nets for localization of glomeruli in trichrome-stained whole kidney sections. J. Am. Soc. Nephrol. 2018, 29, 2081–2088. [Google Scholar] [CrossRef] [PubMed] [Green Version]
  23. Stritt, M.; Stalder, A.K.; Vezzali, E. Orbit image analysis: An open-source whole slide image analysis tool. PLoS Comput. Biol. 2020, 16, e1007313. [Google Scholar] [CrossRef] [PubMed]
  24. Chen, L.-C.; Papandreou, G.; Kokkinos, I.; Murphy, K.; Yuille, A. DeepLab: Semantic image segmentation with deep convolutional nets, atrous convolution, and fully connected crfs. IEEE Trans. Pattern Anal. Mach. Intell. 2017, 40, 834–848. [Google Scholar] [CrossRef] [PubMed] [Green Version]
  25. Available online: https://cocodataset.org/#home (accessed on 1 May 2022).
  26. Bankhead, P.; Loughrey, M.B.; Fernández, J.A.; Dombrowski, Y.; McArt, D.G.; Dunne, P.D.; McQuaid, S.; Gray, R.T.; Murray, L.J.; Coleman, H.G.; et al. QuPath: Open source software for digital pathology image analysis. Sci. Rep. 2017, 7, 16878. [Google Scholar] [CrossRef] [PubMed] [Green Version]
Figure 1. (a) Healthy glomerulus; (b) Sclerotic glomerulus. The image shown is one of the Masson-stained images collected in our novel dataset from the Siena Hospital.
Mathematics 10 01934 g001
Figure 2. Segmentation performances obtained with 5-fold cross-validation on the non-sclerotic glomeruli in Masson-stained images.
Mathematics 10 01934 g002
Figure 3. Segmentation performance obtained with 5-fold cross-validation on the non-sclerotic glomeruli in CD10-stained images.
Mathematics 10 01934 g003
Figure 4. Segmentation performance obtained with 5-fold cross-validation on the sclerotic glomeruli in Masson-stained images.
Mathematics 10 01934 g004
Figure 5. Segmentation performance obtained with 5-fold cross-validation on the sclerotic glomeruli in CD10-stained images.
Mathematics 10 01934 g005
Figure 6. A patch of a Masson-stained image, its corresponding ground truth mask relative to non-sclerotic glomeruli and the related segmented output (IOU = 0.97 and DICE = 0.98).
Mathematics 10 01934 g006
Figure 7. A patch of a CD10-stained image, its corresponding ground truth mask relative to sclerotic glomeruli and the related segmented output (IOU = 0.77 and DICE = 0.637).
Mathematics 10 01934 g007
Table 1. List of abbreviations and acronyms used in this paper.
AbbreviationExplanation
CADComputer-Aided-Diagnosis
CNNConvolutional Neural Network
CRFConditional Random Field
FCNFully Convolutional Network
IOUIntersection Over Union
PASPeriodic Acid-Schiff stain
WSIWhole Slide Image
Table 2. Number of sclerotic and healthy glomeruli for each hospital and image staining type.
Center and Image TypeHealthy GlomeruliSclerotic Glomeruli
Trieste, Masson1811168
Siena, Masson2189355
Siena, CD1074362317
Table 3. Average IOU and DICE indices across the 5-fold cross-validation tests. In bold we highlight the best performances obtained for the non-sclerotic and sclerotic cases.
Image TypeIOU (Mean ± s.d.)DICE (Mean ± s.d.)
Masson, Non-Sclerotic0.98 (±0.024)0.98 (±0.012)
CD10, Non-Sclerotic0.77 (±0.15)0.85 (±0.14)
Masson, Sclerotic0.37 (±0.29)0.46 (±0.34)
CD10, Sclerotic0.66 (±0.24)0.53 (±0.22)
Publisher’s Note: MDPI stays neutral with regard to jurisdictional claims in published maps and institutional affiliations.

