
Voting-Based Ensemble Learning Algorithm for Fault Detection in Photovoltaic Systems under Different Weather Conditions


Department of Electrical Engineering, National Taiwan University of Science and Technology, No. 43, Keelung Road, Section 4, Taipei 10607, Taiwan
*
Author to whom correspondence should be addressed.
Mathematics 2022, 10(2), 285; https://0-doi-org.brum.beds.ac.uk/10.3390/math10020285
Submission received: 2 December 2021
/
Revised: 9 January 2022
/
Accepted: 12 January 2022
/
Published: 17 January 2022
Abstract
:A photovoltaic (PV) system is one of the renewable energy resources that can help in meeting the ever-increasing energy demand. However, installation of PV systems is prone to faults that can occur unpredictably and remain challenging to detect. Major PV faults that can occur are line-line and open circuits faults, and if they are not addressed appropriately and timely, they may lead to serious problems in the PV system. To solve this problem, this study proposes a voting-based ensemble learning algorithm with linear regression, decision tree, and support vector machine (EL-VLR-DT-SVM) for PV fault detection and diagnosis. The data acquisition is performed for different weather conditions to trigger the nonlinear nature of the PV system characteristics. The voltage-current characteristics are used as input data. The dataset is studied for a deeper understanding, and pre-processing before feeding it to the EL-VLR-DT-SVM. In the pre-processing step, data are normalized to obtain more feature space, making it easy for the proposed algorithm to discriminate between healthy and faulty conditions. To verify the proposed method, it is compared with other algorithms in terms of accuracy, precision, recall, and F-1 score. The results show that the proposed EL-VLR-DT-SVM algorithm outperforms the other algorithms.
1. Introduction
1.1. Background
Solar energy harvesting is a promising option because of its massive potential for power systems. This is evident from increasing photovoltaic (PV) installation, which is estimated to grow annually by approximately 18% with 123 GW power generated in 2019 [1]. Its contribution to generating energy and supplying power to end-users is believed to meet the ever-increasing demand for energy. However, installation of PV systems is prone to faults that can occur unpredictably and remain challenging to detect. This has motivated engineers and researchers to pay more attention to overcome the interference of the PV system, such as fault detection and diagnosis (FDD) [2].
There are two main causes that can result in the failure of the PV system, and these causes are internal and external. The internal cause can be seen in cable dysfunction and inadequate wiring, whereas the external cause can be seen in shading due to trees or clouds and hotspot due to ambient temperature. The research community is extensively working on overcoming these challenges of PV system failures.
Many studies on PV fault detection have been conducted with different methodologies, advantages, and limitations [1,3,4,5,6,7,8,9,10,11,12]. A single algorithm for detecting PV faults has already been explored extensively. A multi-layer perceptron neural network (MLPNN) has been proposed to recognize the PV faults [13]. The use of discrete wavelet transform (DWT) with Daubechies 5 (db5) property is considered to decompose and reconstruct the signals. The results of this study have concluded that the MLPNN model is able to recognize existing PV faults successfully. However, this work requires much attention because feature extraction on a wavelet and hidden layer building on neural network (NN) architecture is not an easy task. Garoudja et al. [14] has proposed a probabilistic neural network (PNN) algorithm for PV fault detection. The PV parameters were extracted using the best-so-far artificial bee colony (ABC) algorithm. Considering both noisy and noiseless datasets, the PNN was able to produce accuracies of 98.19% and 100%, respectively. Even though an excellent performance was achieved with the algorithm, obtaining a noiseless dataset and constructing hidden layers on the PNN is challenging and requires careful work. Both these works suffer from the same problem of dataset selection. The examples of used datasets should be chosen carefully for NN layer construction to avoid time-intensive work. Otherwise, the model will not function effectively in detecting PV faults. Mandal et al. [15] has developed a PV fault detection system using a support vector machine (SVM). The accuracy values of 88.33%, 85.40%, and 85.00% were obtained for scenarios of one versus all (OVA), adaptive directed acyclic graph (ADAG), and one versus one (OVO), respectively. The SVM was also employed by [16,17]. An accuracy value ranging from 18.31% to 100.00%, depending upon the different mismatch percentages used, has been reported in [16]. Yi et al. [17] have reported an accuracy of 91.40% and 94.74% from the experimental results. Tao et al. [18] have investigated a deep belief network optimized by a genetic algorithm (GA-DBN). This study has successfully classified PV faults with an accuracy rate of 95.73%. A more advanced method has been proposed by [19] via a convolutional neural network (CNN), AlexNet, and SVM. However, the results showcased relatively low values of accuracies in the range of 69.39–73.53%. Therefore, based on the aforementioned studies, it can be inferred that for a more robust performance there is still a need for further research.
The emergence of ensemble learning (EL) methods offers advantages in addressing some of the shortcomings of the existing work as mentioned above. This method is believed to perform better because it is a combination of some algorithms for detecting PV faults. The EL method was proposed by Eskandari et al. [20] for line-line faults using a combination of three algorithms, namely SVM, naïve Bayes (NB), and k-nearest neighbor (KNN). Under different scenarios, these classifiers were able to perform well with 99.00% and 99.50% accuracy. Bagging and stacking-based ELs were explored by Justin et al. [21] for detecting the energy production anomalies of PV faults. The outcomes were 79.50% for bagging-based EL and 94.00% for stack-based EL. The EL of quadratic discriminant analysis, extra trees with entropy, and decision tree (QDA-ETent-DT), which outperformed the other comparable classifiers, was investigated by Kapucu et al. [22]. When applied for recognizing two PV faults namely partial shading, and short circuit, the EL yielded an accuracy rate of 97.46% before optimization and 97.67% after optimization. Better performance is still needed to obtain a more robust result in detecting PV faults. Adhya et al. [23] have reported good performance, yielding an accuracy of approximately 99.00% after employing the EL of the light gradient boosting method (LGBM), categorical boosting (CatBoost), and extreme gradient boosting (XGBoost) in diagnosing the PV faults. However, the feature selection process and EL type have not been fully addressed in this study. The EL method was also proposed by Dhibi et al. [24], using SVM, KNN, and DT. Two principal component analyses (PCAs), including kernel PCA (KPCA) and reduced kernel PCA (RKPCA), were developed. PCA development aimed to obtain better performance and lower computational load. Although this study yielded an excellent performance, executing EL was still time-consuming. The developed PCAs-based EL method needed 110.36 and 221.85 s for RKPCA and KPCA, respectively.
Likewise, random forest (RF), which is the EL of DTs, was used in recognizing PV faults that occur in the PV systems [25,26,27,28,29]. In [25], Euclidean distance-based reduced kernel RF (RK-RFED) and K-means clustering-based reduced kernel RF (RK-RFKmeans) were used to detect the occurrence of PV faults with 10-fold cross-validation. It resulted in a good performance with a computational time of 113.75 and 154.50 s for RK-RFED and RK-RFKmeans, respectively. In [26], RF was employed to recognize line-line faults, degradation, open circuits, and partial shading. Compared to DT, RF showed a better accuracy rate. In [27], a pre-processing stage was developed for an interval reduced kernel principal component analysis. The resulting data were then fed to RF to obtain the classification process. Although employed for detecting islanding, partial shading, open-circuit/short-circuit, and output current sensor faults, the proposed algorithm or model was able to produce high accuracy with low computational time. In [28], RF was proposed as a comparative model for other machine learning (ML) algorithms. RF is still considered a good model because it enables high accuracy in classifying six existing PV faults. In [29], RF and other algorithms were investigated to recognize two PV faults. RF showed good results via F1 score identification. However, the use of the RF algorithm incurs a large memory and heavy computational load because of the number of trees used in building the RF.
1.2. Aim and Contributions
To overcome the aforementioned drawbacks, a voting-based ensemble learning algorithm with linear regression, decision tree, and support vector machine (EL-VLR-DT-SVM) is developed in this work to offer better performance in detecting the occurrence of faults in the PV system. Other EL algorithms were also used as benchmarks for the purpose of comparison. To obtain better justification, the proposed study not only uses accuracy, but also discusses other performance indicators, such as precision, recall, and F-1 score. In addition, computational time and a confusion matrix are performed. For pre-processing of data, additional data normalization is also explored to investigate its effect on the algorithm. In contrast, previous studies have used only one kind of data normalization [20,29]. As the performance of a PV system depends on the external environment, two different weather conditions are considered in this study. Although these weather factors may trigger nonlinearity signals of the PV system, the proposed EL-VLR-DT-SVM algorithm still exhibits excellent performance. Additionally, the proposed algorithm is compared with other related studies to investigate its reliability.
1.3. Paper Organization
The paper is organized as follows. Section 2 presents the PV fault events. Section 3 describes the proposed method. Section 4 provides the results and discussion, including dataset, dataset exploration, dataset preparation, feature selection and data pre-processing, performance assessment, and comparison with the related studies. Finally, Section 5 presents the conclusions of the work.
2. PV Fault Events
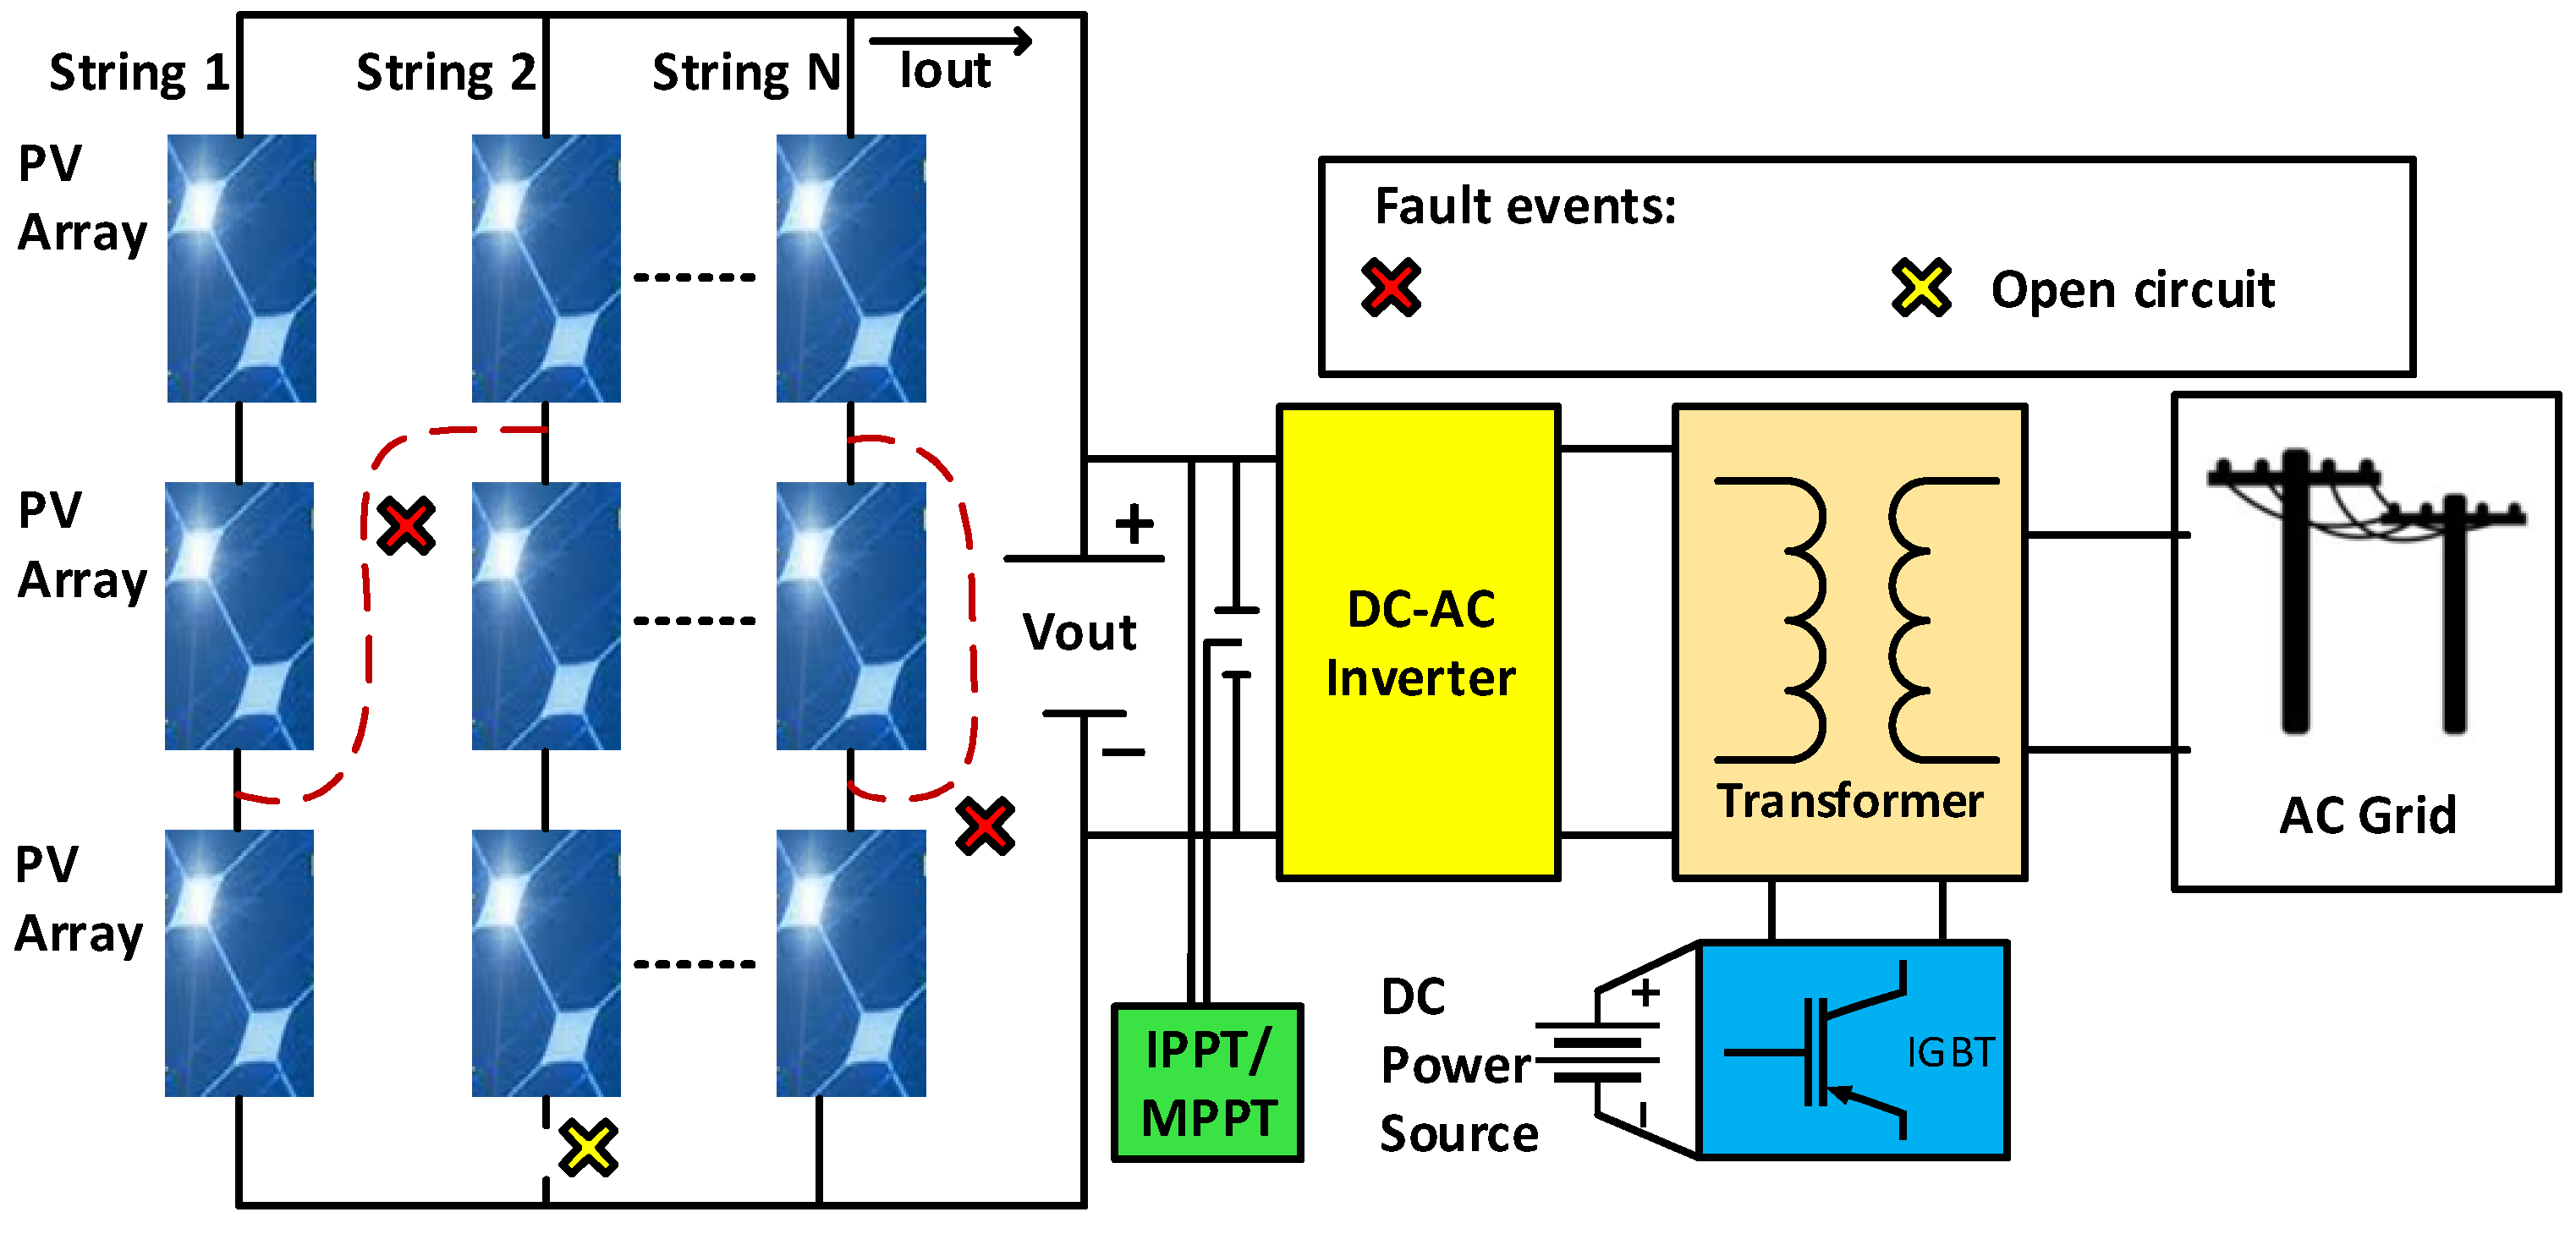
In a PV system, the PV output characteristics are nonlinear [30]. This occurs because of certain conditions, such as different weather conditions. Many faults may remain undetected owing to the nonlinear nature of the PV output characteristics. Many researchers and engineers have been working to find the best solution for detecting various early PV faults with high accuracy and low computational load. In this study, two PV faults are considered, namely line-line (L-L) and open circuit (OC) faults. These faults are of great importance because the frequency of occurrence of both these faults [31,32] in PV systems is relatively high.
Figure 1 illustrates the fault occurrences in a PV system. The L-L fault can exist either in the intra string or extra string, whereas the OC fault can occur in the PV string connection. The existing L-L faults in the PV systems may be caused by undesired or faulty connections [33] and chewed wires by rodents and animals [34]. If these faults are not treated appropriately and quickly, they may cause fire hazards. The OC faults are possibly caused by broken wires of the connection system, leading to power loss in the PV systems [35]. If these two faults are not addressed correctly and appropriately, they may cause damage to the PV system. Hence, PV fault detection is crucial for maintaining the performance and reliability of the PV systems.
3. Proposed Method
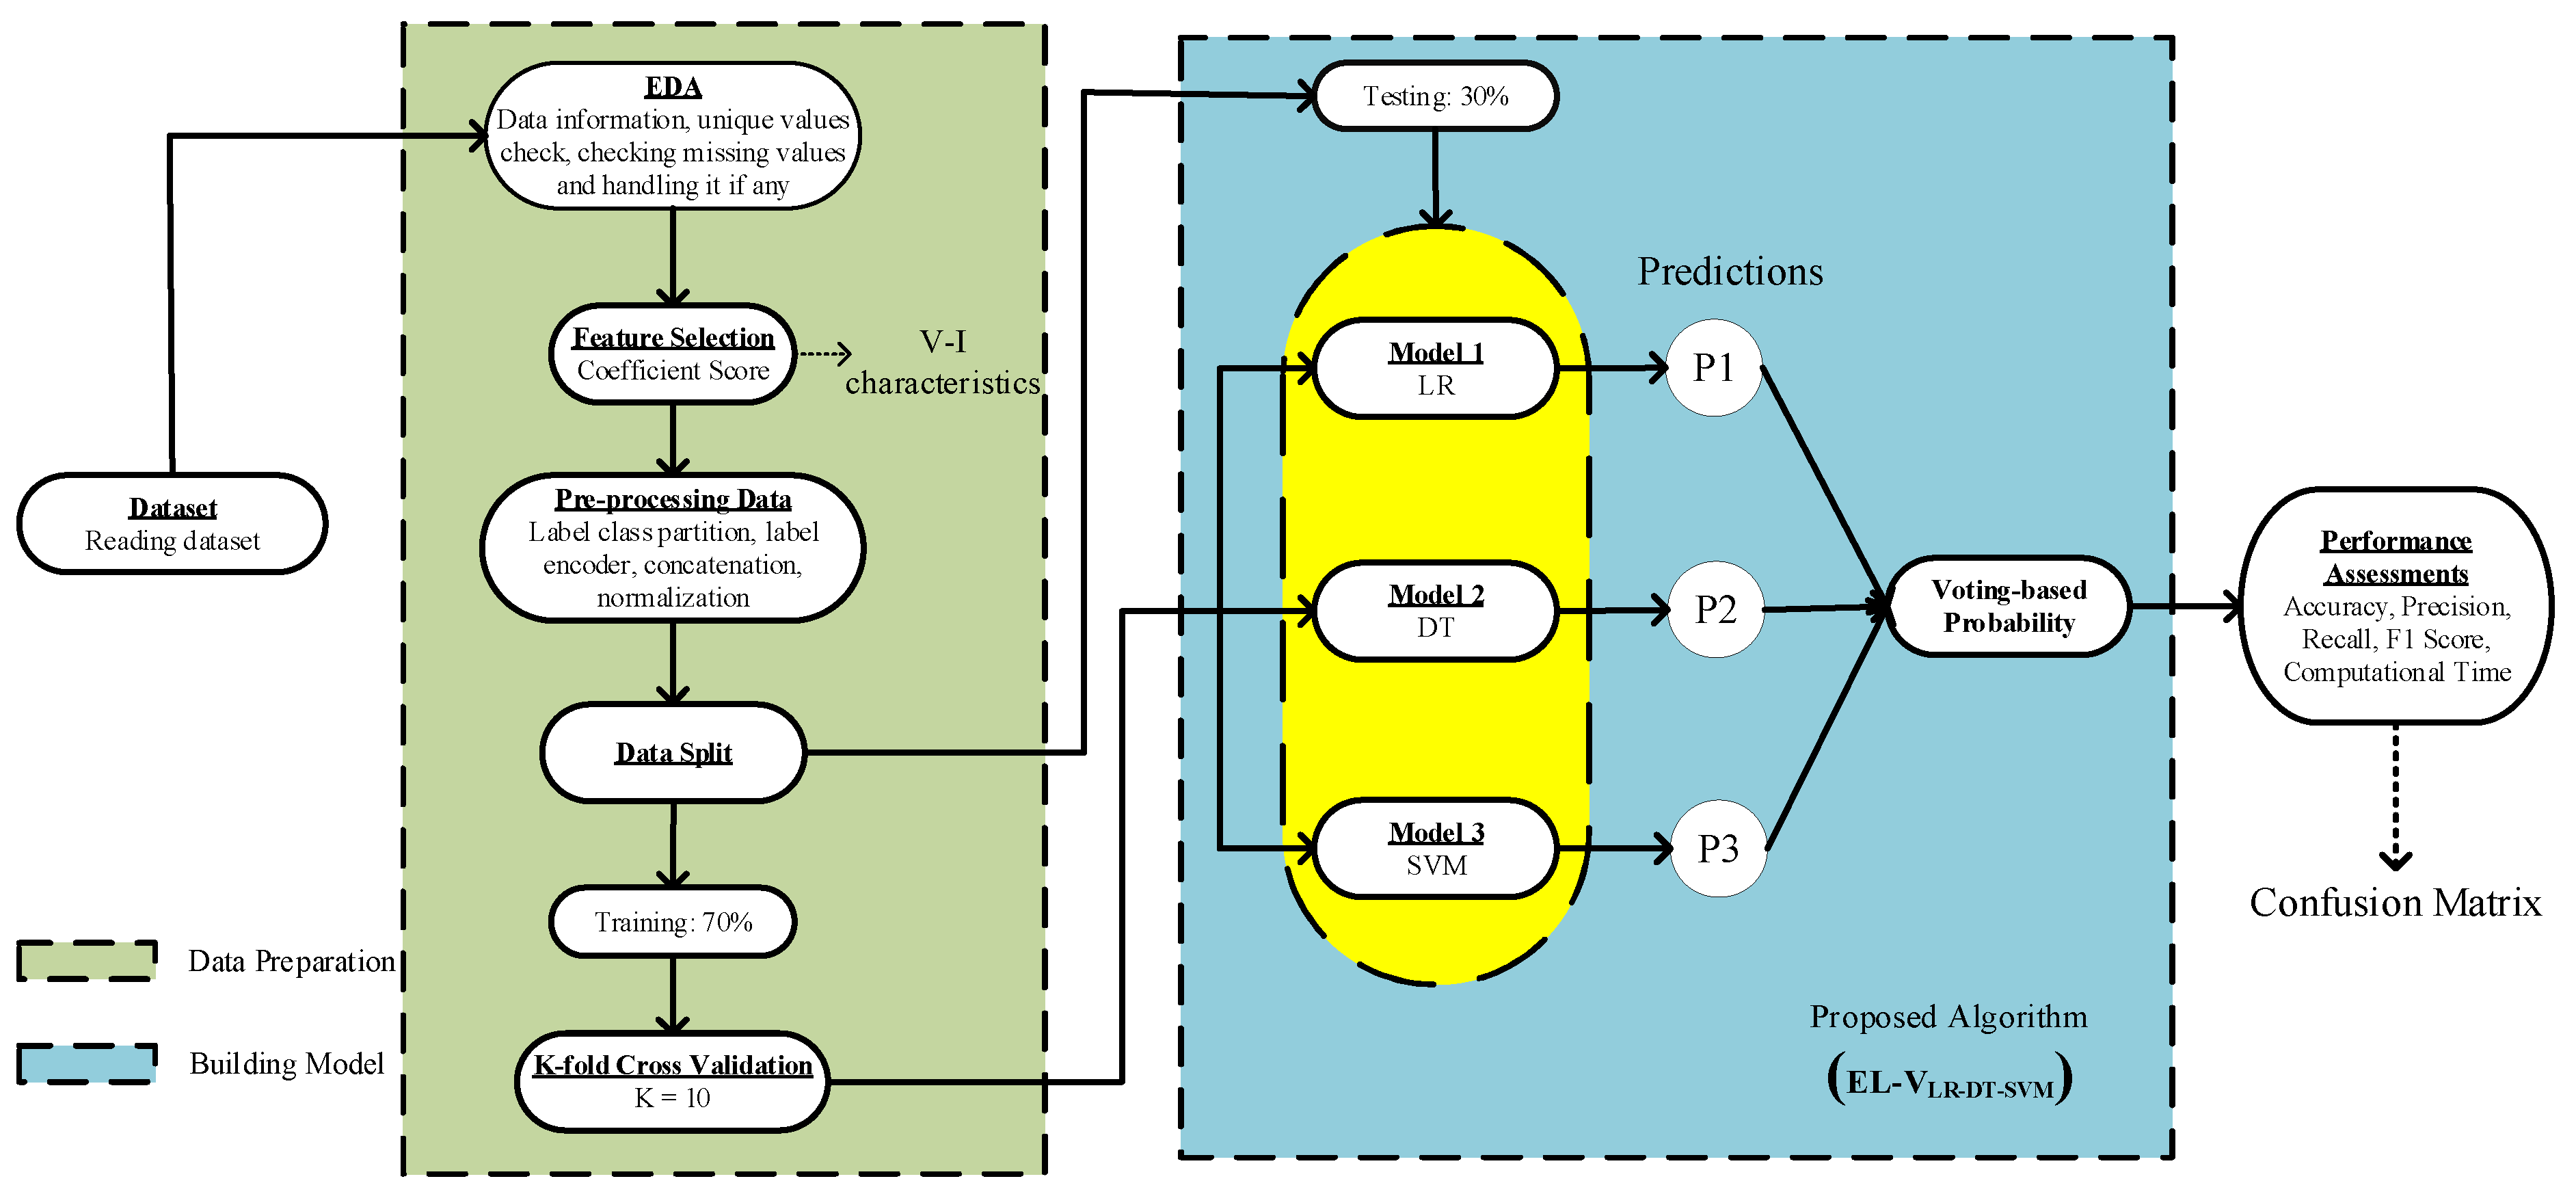
A voting-based ensemble learning with linear regression, decision tree, and support vector machine (EL-VLR-DT-SVM) for PV fault detection is developed in this work. Figure 2 shows the proposed method and the process of the learning algorithm. The advantage of voting-based EL algorithms lies in the freedom to choose more single ML algorithms and thus combine them to prove their effectiveness in detecting the PV faults. Therefore, more algorithms can be useful for the classification task instead of relying on a single algorithm. Using the selected features of voltage-current (V-I) to detect PV faults, the proposed algorithm can detect L-L faults and OC faults effectively.
3.1. Exploratory Data Analysis (EDA)
Exploration of the dataset plays a crucial role in obtaining a deeper understanding of the dataset. Herein, some exploration processes are conducted, such as data information, missing values check, data description, and unique values check. From these processes, the next steps of dataset preparation can be performed accurately. For example, if there is a missing value, a handling process is required.
3.2. Feature Selection
In a dataset, many features can be found. However, not all features contribute to a good performance. In this study, the coefficient score methodology is employed to determine the most influential features. The coefficient score selects all the possible feature combinations. Then, they are calculated to obtain the best features that can be used later in building the model algorithm. Therefore, the computationally intensive problem can be overcome by running the algorithm with fewer features for detecting the PV faults.
3.3. Pre-Processing Data
The dataset is completely prepared up to this stage. Some types of pre-processing involving label class partition, label encoder, concatenation, dropping, and normalization are carried out as a next step. Label class partition aims to separate each condition of the dataset (normal, L-L fault, and OC). Label encoder is conducted to change each categorical data to numerical data. This is necessary because an ML algorithm cannot interpret categorical data. Then, concatenation of data from each condition is obtained before normalization. In normalization, the MinMax scaler and standard scaler are used to normalize the dataset. Mathematically, the MinMax scaler and standard scaler can be expressed as (1) and (2), respectively. This normalization aims to attain more structured data, making the algorithm easy to differentiate between healthy and faulty conditions. Splitting of data is then conducted resulting in 70% training and 30% testing data.
where
- z
- the normalized data
- x
- the data intended to be normalized
- xmin
- the minimum value of x
- xmax
- the maximum value of x
- u
- the mean of training data
- s
- the standard deviation
3.4. Cross Validation
In learning algorithm evaluation, cross-validation (CV) is widely used. It aims to obtain more robust results for PV fault detection. Herein, K-fold CV is employed with K = 10 and shuffle data setting kept as True. Thus, there are ten processes of the testing algorithm, each resulting in a different performance. The data are randomly split into ten folds. The 1st fold is taken to test the algorithm, and the rest of the folds are used for data validation. Then, the 2nd fold is taken, and the rest of the folds are used for data validation. This process continues until ten times as many folds are defined.
3.5. Conventional Algorithm
3.5.1. Linear Regression
LR was first introduced by Galton in 1877 [36]. The LR algorithm represents the linear relationship between the data input and the target class. As this study uses more than one feature as input data, multiple linear regression is used. Mathematically, the LR is defined as shown in (3).
where
- c
- the target class
- B0
- the bias coefficient
- B1
- the coefficient of input data
- X
- the data input
3.5.2. Decision Tree
A DT algorithm splits data through nodes. Each node retains the representative information and eliminates unrelated information. Therefore, the data gradually becomes smaller in volume until the last iteration [37]. Mathematically, a DT model can be expressed as shown in (4)–(7). For a dataset x, the target class is obtained as shown in (4).
where
- c
- the target class of data x
- M
- the node
- the region of m
- the estimated prediction
- the represented target classes
Then, the square error is used according to the mean of the data input in the region of to obtain the optimum constant of . Then, obtaining tree T(x) for the lowest prediction risk can be expressed as shown in (5).
where
- ith estimated prediction
- ith obtained tree
The possible constant region () that aims at obtaining the minimum loss can be seen in (6). Thus, the quality score for node split j can be obtained as expressed in (7).
where
- the quality score on
- the input variable
- the split on .
- the left region
- the right region
- the result on
- the result on
3.5.3. Support Vector Machine
The SVM algorithm works based on its hyperplane, which divides the dataset into target classes. This discrimination is conducted with respect to the support vectors among the dataset. The hyperplane aims to search for the maximum distance between support vectors [16]. The wider the distance, the higher the accuracy. The SVM can be defined mathematically as shown in (8)–(10). Suppose that x is a dataset of two classes , as shown in (8).
The function of the hyperplane is y, as shown in (9) where is the margin between the hyperplane and the support vector of one target class, and is the bias.
Finally, the prediction of two target classes (+1, −1) can be obtained, as expressed in (10).
where is the hyperplane of
3.6. Proposed EL-VLR-DT-SVM Algorithm
The premise of the EL algorithm is the likelihood of overcoming the shortcomings of traditional machine learning algorithms. As EL combines conventional ML algorithms [38], the performance of the EL-based algorithm can be improved [39]. In this study, the EL-VLR-DT-SVM is developed to detect the occurrence of PV faults. This proposed model combines three basic models, i.e., LR, DT, and SVM to obtain the final performance of the PV fault detection. This ensemble method is expected to be a better algorithm for generalizing a given dataset, instead of using a single classifier. Each prediction result is summed, and the final performance is obtained via a majority vote. To tune the hyperparameters of the proposed EL-VLR-DT-SVM algorithm, a GridSearch methodology is used to find the fittest parameters of each conventional algorithm. Table 1 shows the parameters used with the GridSearch methodology.
The proposed algorithm for detecting the occurrence of PV faults is shown in Figure 2. There are two main stages of the algorithm that are discussed as follows:
- Data Preparation
- Step 1: EDA that aims to obtain the first look at how the dataset will be used.
- Step 2: Feature selection that aims to obtain the most important features needed for the classification using the coefficient score.
- Step 3: Pre-processing data to prepare the dataset and normalize it before splitting and classification.
- Step 4: Dataset is split into 70% training and 30% testing data.
- Step 5: Cross-validation that aims to train and test the dataset using the model with a predefined k-number.
- Building Model
- Step 1: Defining three intended basic models, i.e., LR, DT, and SVM.
- Step 2: Tuning the hyperparameters using the GridSearch methodology.
- Step 3: Training and testing the proposed algorithm.
- Step 4: Obtaining the result via voting-based probability.
- Step 5: Obtaining performance assessments via accuracy, F1 score, recall, precision, and computational time. In addition, we have visualized the obtained performance in the confusion matrix.
3.7. Performance Indicators
To obtain a better justification of the proposed algorithm in detecting occurrence of PV faults, some indicators are evaluated, including accuracy, precision, recall, F1 score, and computational time.
3.7.1. Accuracy
One performance indicator that is commonly used in ML applications to detect PV faults is the accuracy score. The accuracy value represents the proportion of correct predictions by the proposed algorithm. It can be mathematically expressed as (11).
where
- TP
- true positive
- TN
- true negative
- FN
- false negative
- FP
- false positive
3.7.2. Precision
The precision indicator refers to the positive predictive value of the proposed algorithm for a given dataset. In the mathematical expression, the precision can be written as (12).
3.7.3. Recall
To evaluate the performance of the proposed algorithm, a recall indicator is utilized to investigate the true positive rate. The recall value shows the ability of the proposed algorithm to identify all positive samples of a given dataset. This can be expressed mathematically as (13).
3.7.4. F1 Score
The F1 score measures the harmonic mean of the precision and recall. The proposed algorithm can be rated as a well-performed model for detecting PV faults when the F1 score is close to 1. Otherwise, it can be rated as a bad algorithm when the F1 score is close to 0. The mathematical expression for the F1 score is given by (14).
3.7.5. Confusion Matrix
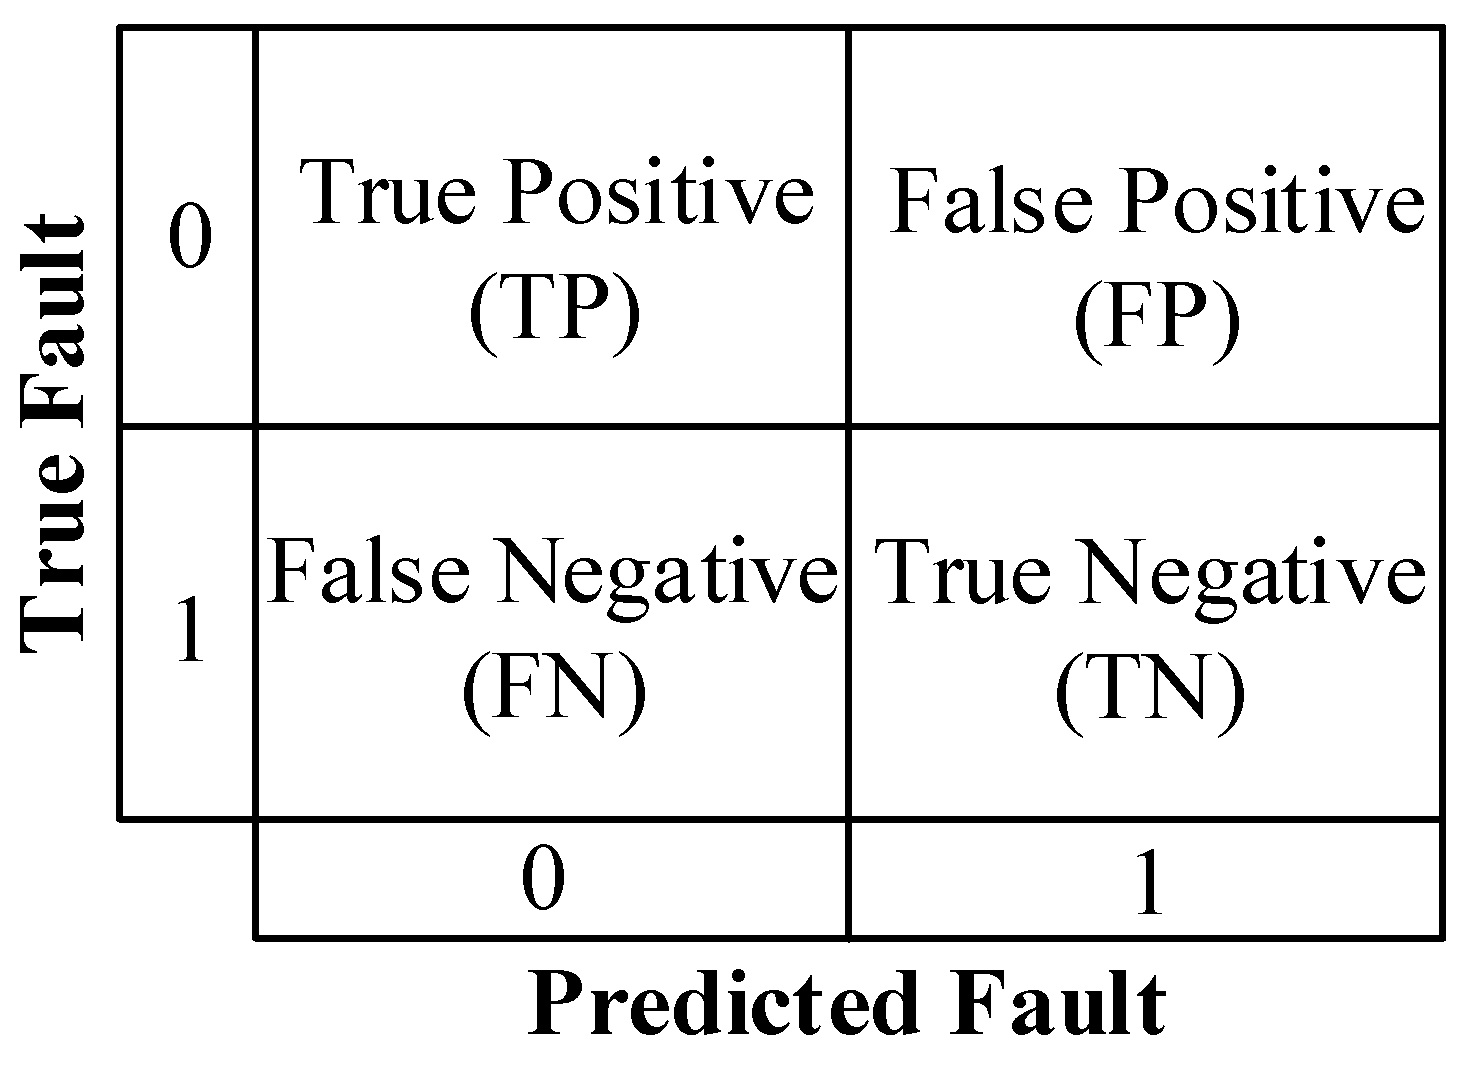
Confusion matrix (CM) in a classification task is commonly used to investigate the performance of the proposed algorithm. In Figure 3, a confusion matrix is shown to detect the occurrence of PV faults. Well-performed algorithms have high true positive and true negative numbers, whereas high false positive and high false negative numbers indicate unreliable algorithms.
3.7.6. Computational Time
Another indicator that should be considered when evaluating the proposed algorithm is the required computational time, which is measured in seconds. A computational load is important to consider because it shows how long a personal computer takes to realize a built model. A low computational time indicates faster fault detection.
4. Results and Discussion
This section presents the results and discussion of the proposed EL-VLR-DT-SVM algorithm to detect the occurrence of PV faults under different weather conditions. Some parts that are covered and explained in this section include dataset, dataset exploration, performance assessment, and comparison with the existing studies. To better justify the performance of the proposed algorithm for PV fault detection, some assessment indicators are considered, such as accuracy, precision, recall, F1 score, and computational load. A visualization of the confusion matrix is also shown to obtain a more intuitive understanding of the performance of the EL-VLR-DT-SVM algorithm. In this study, three scenarios are chosen to detect two common PV faults and these scenarios are: (1) without normalization, (2) MinMax scaler normalization, and (3) standard scaler normalization. All classification tasks in this PV fault detection are accomplished using a personal computer with the specification of 6.0 GB dedicated GPU memory, 8.0 shared GPU memory, and a processor of Intel(R) Core (TM) i7-10700F CPU @ 2.90 GHz (16 CPUs) ~2.9 GHz.
4.1. Dataset
A publicly available dataset is used in this study [40]. The dataset is collected during different weather conditions both in winter and summer. The reason is that the real-world applications of the PV system will be working in a variety of weather conditions. Four category values are measured, including irradiation, temperature, voltage, and current [29]. Irradiation is measured using a commercial lux meter (LX1330B) with an error rate of ±2%. The lux range applied was between 0.01 and 200 Klux, and the temperature was in the range of 1–7 °C. Then, the average values of temperature were stored for data acquisition. The OC voltage of the PV is 39 V, whereas the short-circuit current is 9 A. The specifications of the PV system used in this study are shown in Table 2. This proposed study only uses (V-I) characteristics because they show the highest rank on feature performance using the coefficient score methodology for PV faults detection.
4.2. Dataset Exploration
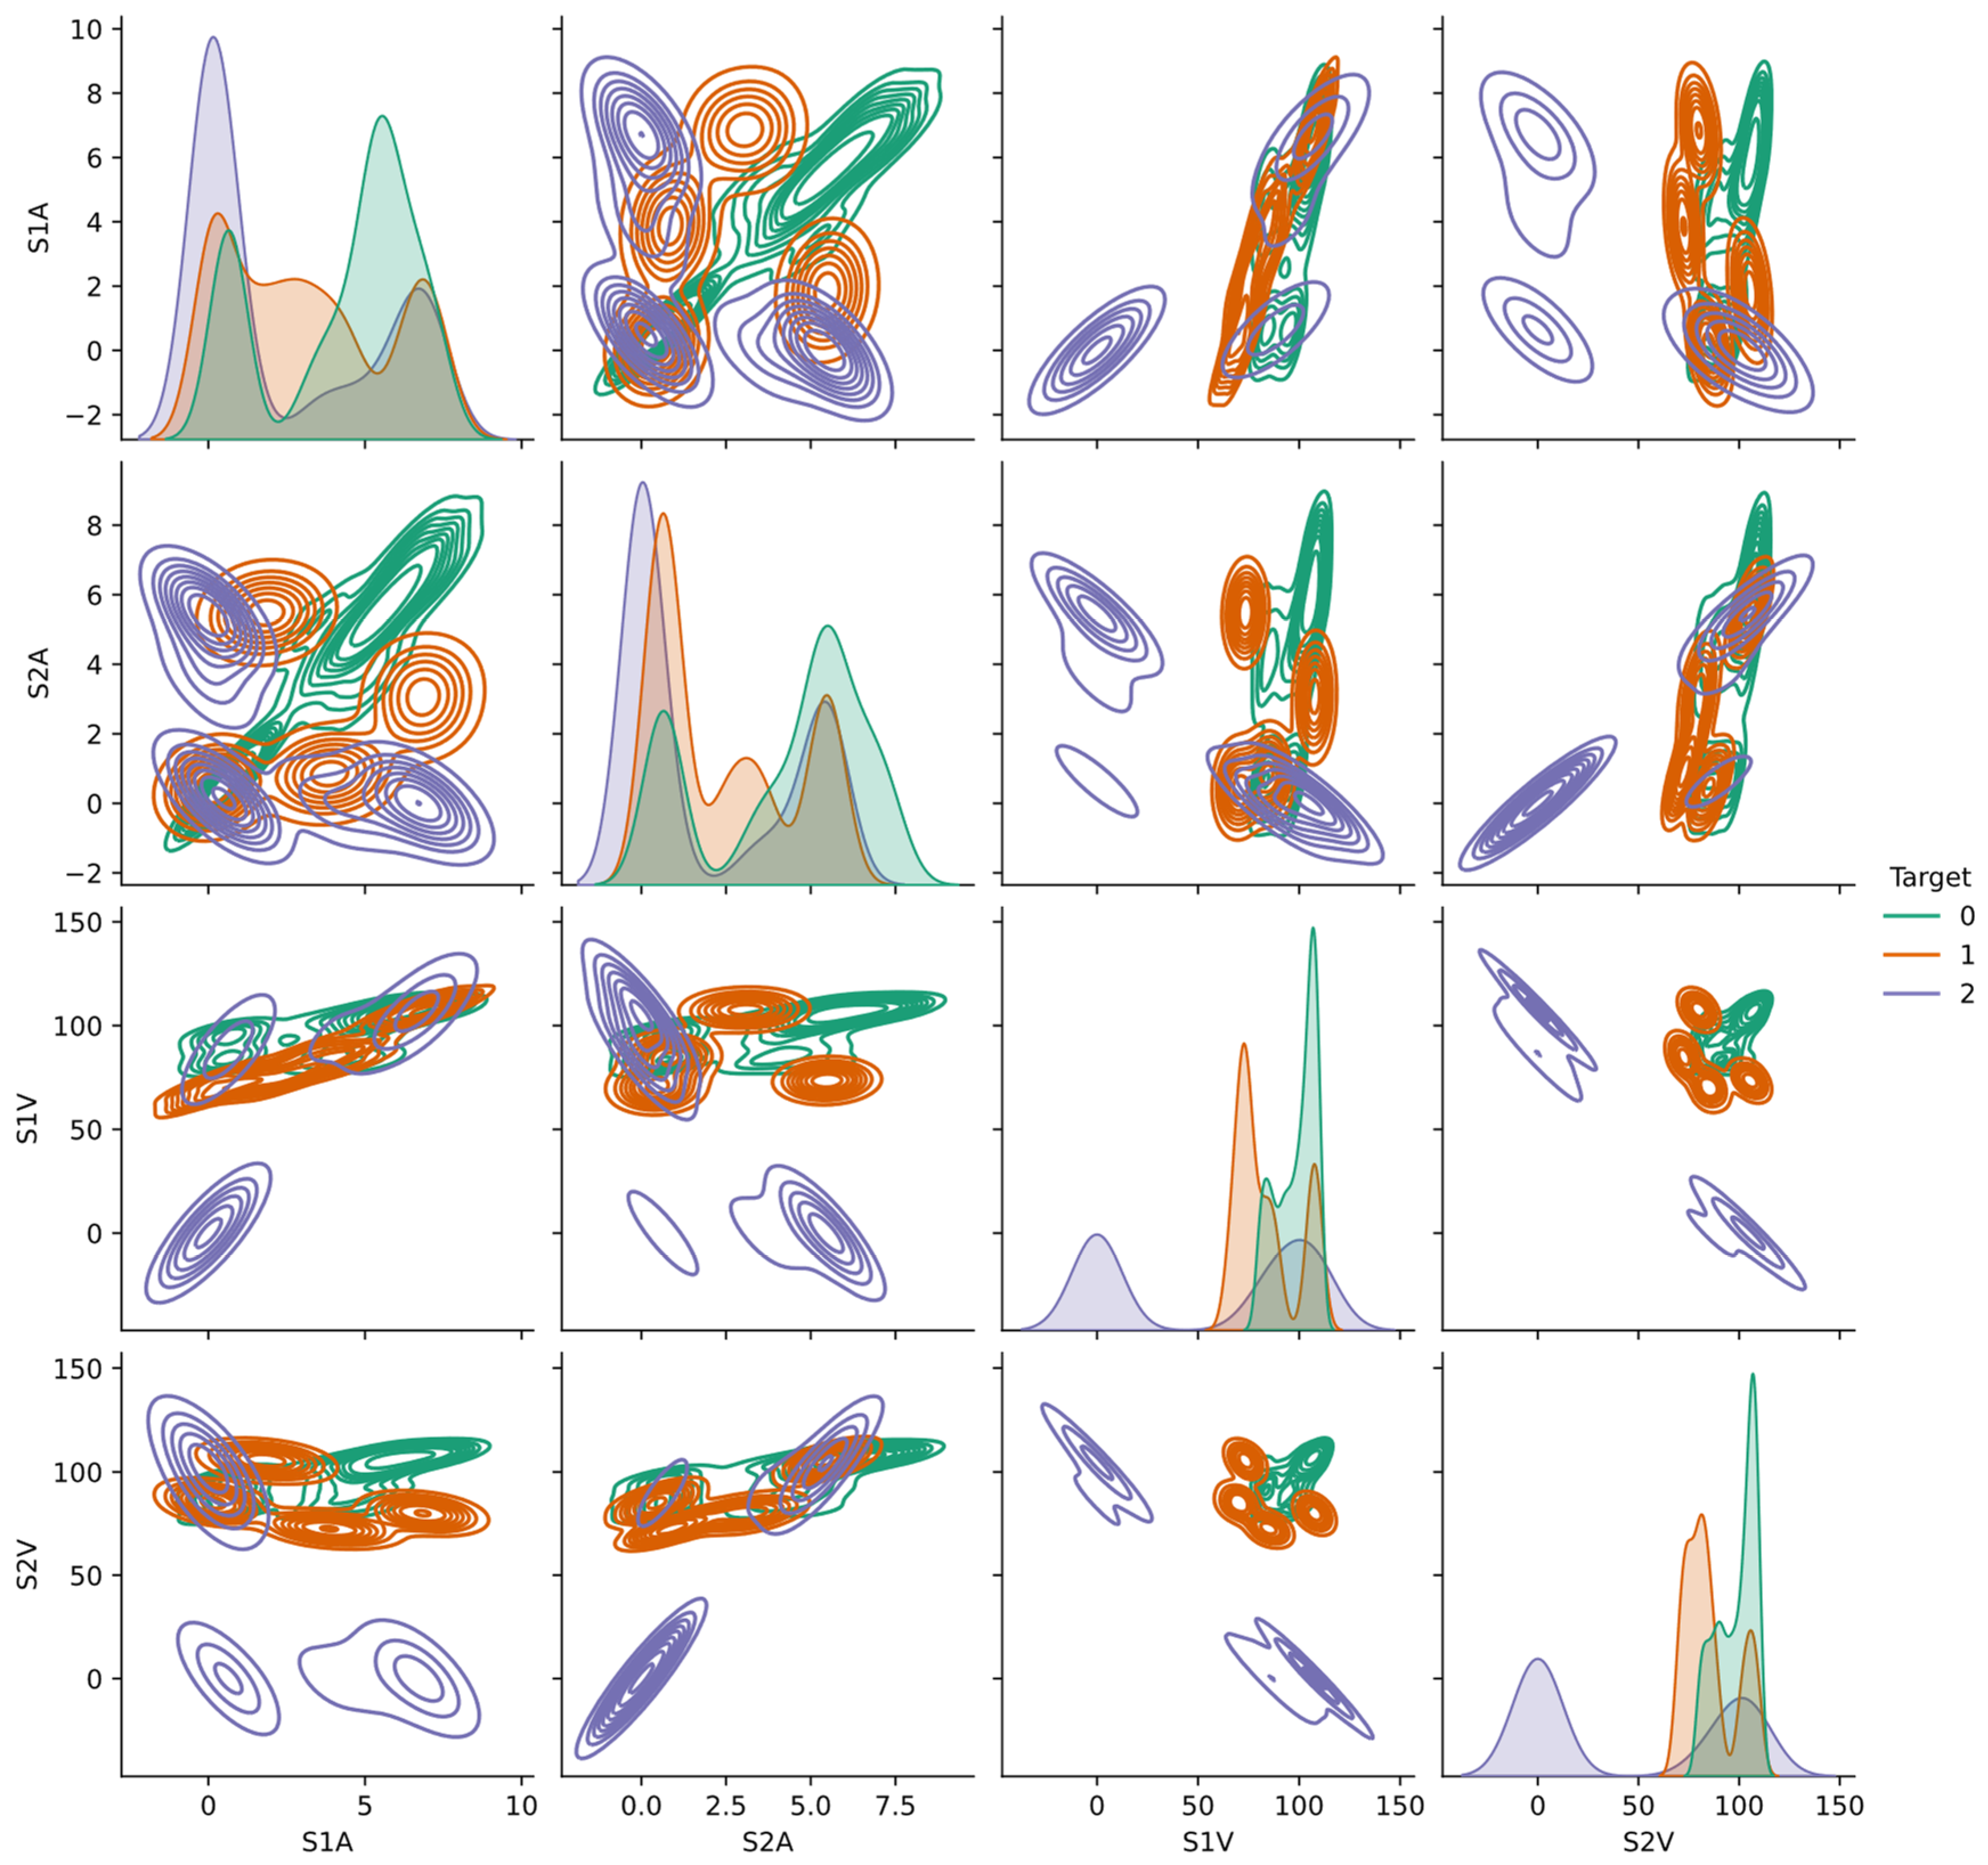
EDA plays a crucial role before going further to the pre-processing, building of the proposed algorithm, and finally, obtaining the results. After the dataset is stored, to obtain a more intuitive understanding, the availability of the figure showing dispersion and correlation of data is strongly suggested. However, pre-processing of data is carried out first to obtain the label encoder by changing the categorical target classes to the numerical ones. The normal (or healthy condition), L-L faults, and OC faults are assigned the numerical values of 0, 1, and 2, respectively. The data dispersion and correlation between the target class and the V-I characteristics are shown in Figure 4. S1V and S2V represent the voltages in PV strings 1 and 2, respectively. The current of PV string 1 is denoted by S1A, whereas the current flowing in PV string 2 is denoted by S2A. Note that the V-I characteristics are used in the algorithm after the feature selection process, which is explained in Section 4.4.
Furthermore, the description of the collected data is also presented to detail everything related to the data, such as features, range index, data type, etc. Table 3 presents the description of the acquired data in detail. There are three types of data with non-null conditions, and a length of 3000. The dataset is balanced according to the count value, and thus, it does not require further steps that are needed for unbalanced data. It should be noted that the unbalanced data and the non-linear nature of the V-I characteristics are two different things. The balanced-unbalanced data are related to the number of the data elements in each target class, whereas the nonlinear nature of the V-I characteristics indicates that data are not arranged in a sequential order. These differences are essential to know because the data description influences how the user understands and processes the raw dataset.
4.3. Data Preparation
The data preparation process is shown in the green box with dashed lines in Figure 2. First, the dataset is extensively explored, as explained in the previous part of dataset exploration, in order to obtain a better understanding prior to further processes. The dataset consists of eight features, including S1A, S2A, S1V, S2V, light, temperature, weather, and state. Not all of these features contribute to the good performance of the algorithm. As a result, the features are selected based on their importance value using a coefficient score. Current (S1A, S2A) and voltage (S1V, S2V) show the highest contribution to good performance, as shown in the following section of feature selection and data pre-processing. Thus, the V-I characteristics are used as input for the proposed EL-VLR-DT-SVM algorithm. Then, data pre-processing steps are conducted, such as label class partition, label encoder, and concatenation before data normalization. Three classes are used, namely normal/healthy condition, L-L fault, and OC fault, which were assigned the numerical values of 0, 1, and 2, respectively. The dataset is then split into two parts, 70% for training and 30% for testing. K-fold cross-validation with K equal to 10 is deployed before the data are fed to the proposed algorithm.
4.4. Feature Selection and Data Pre-Processing
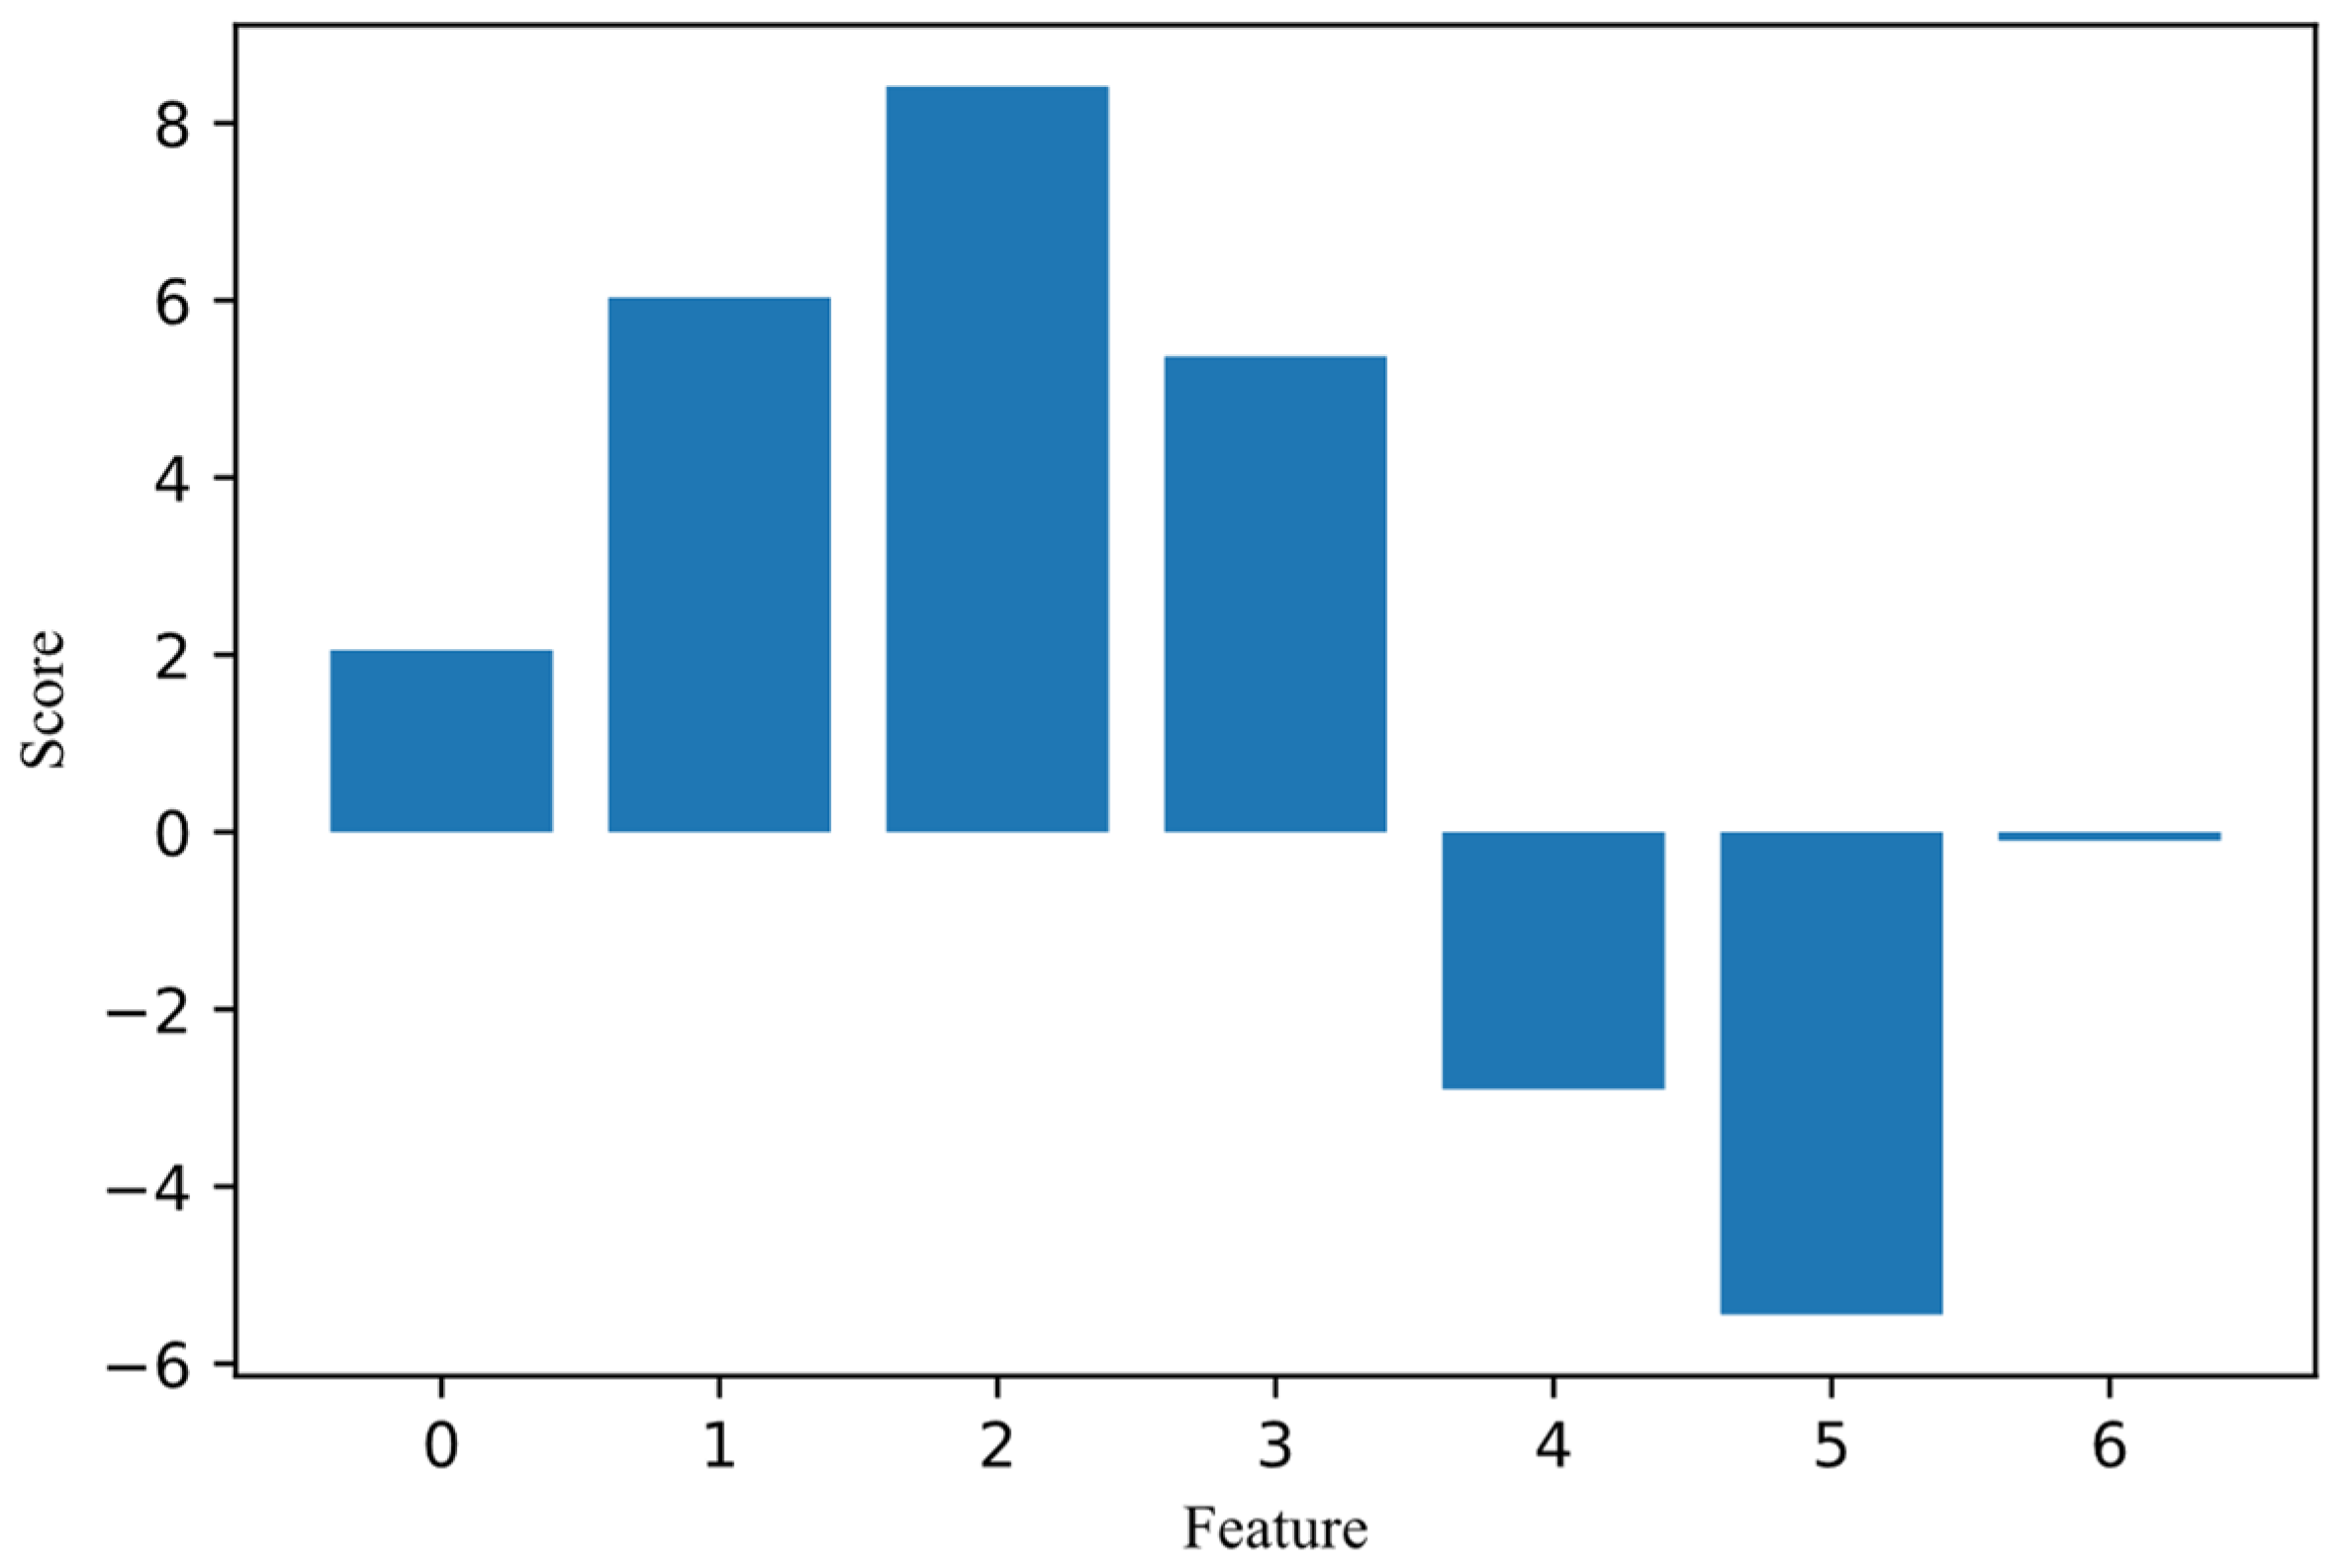
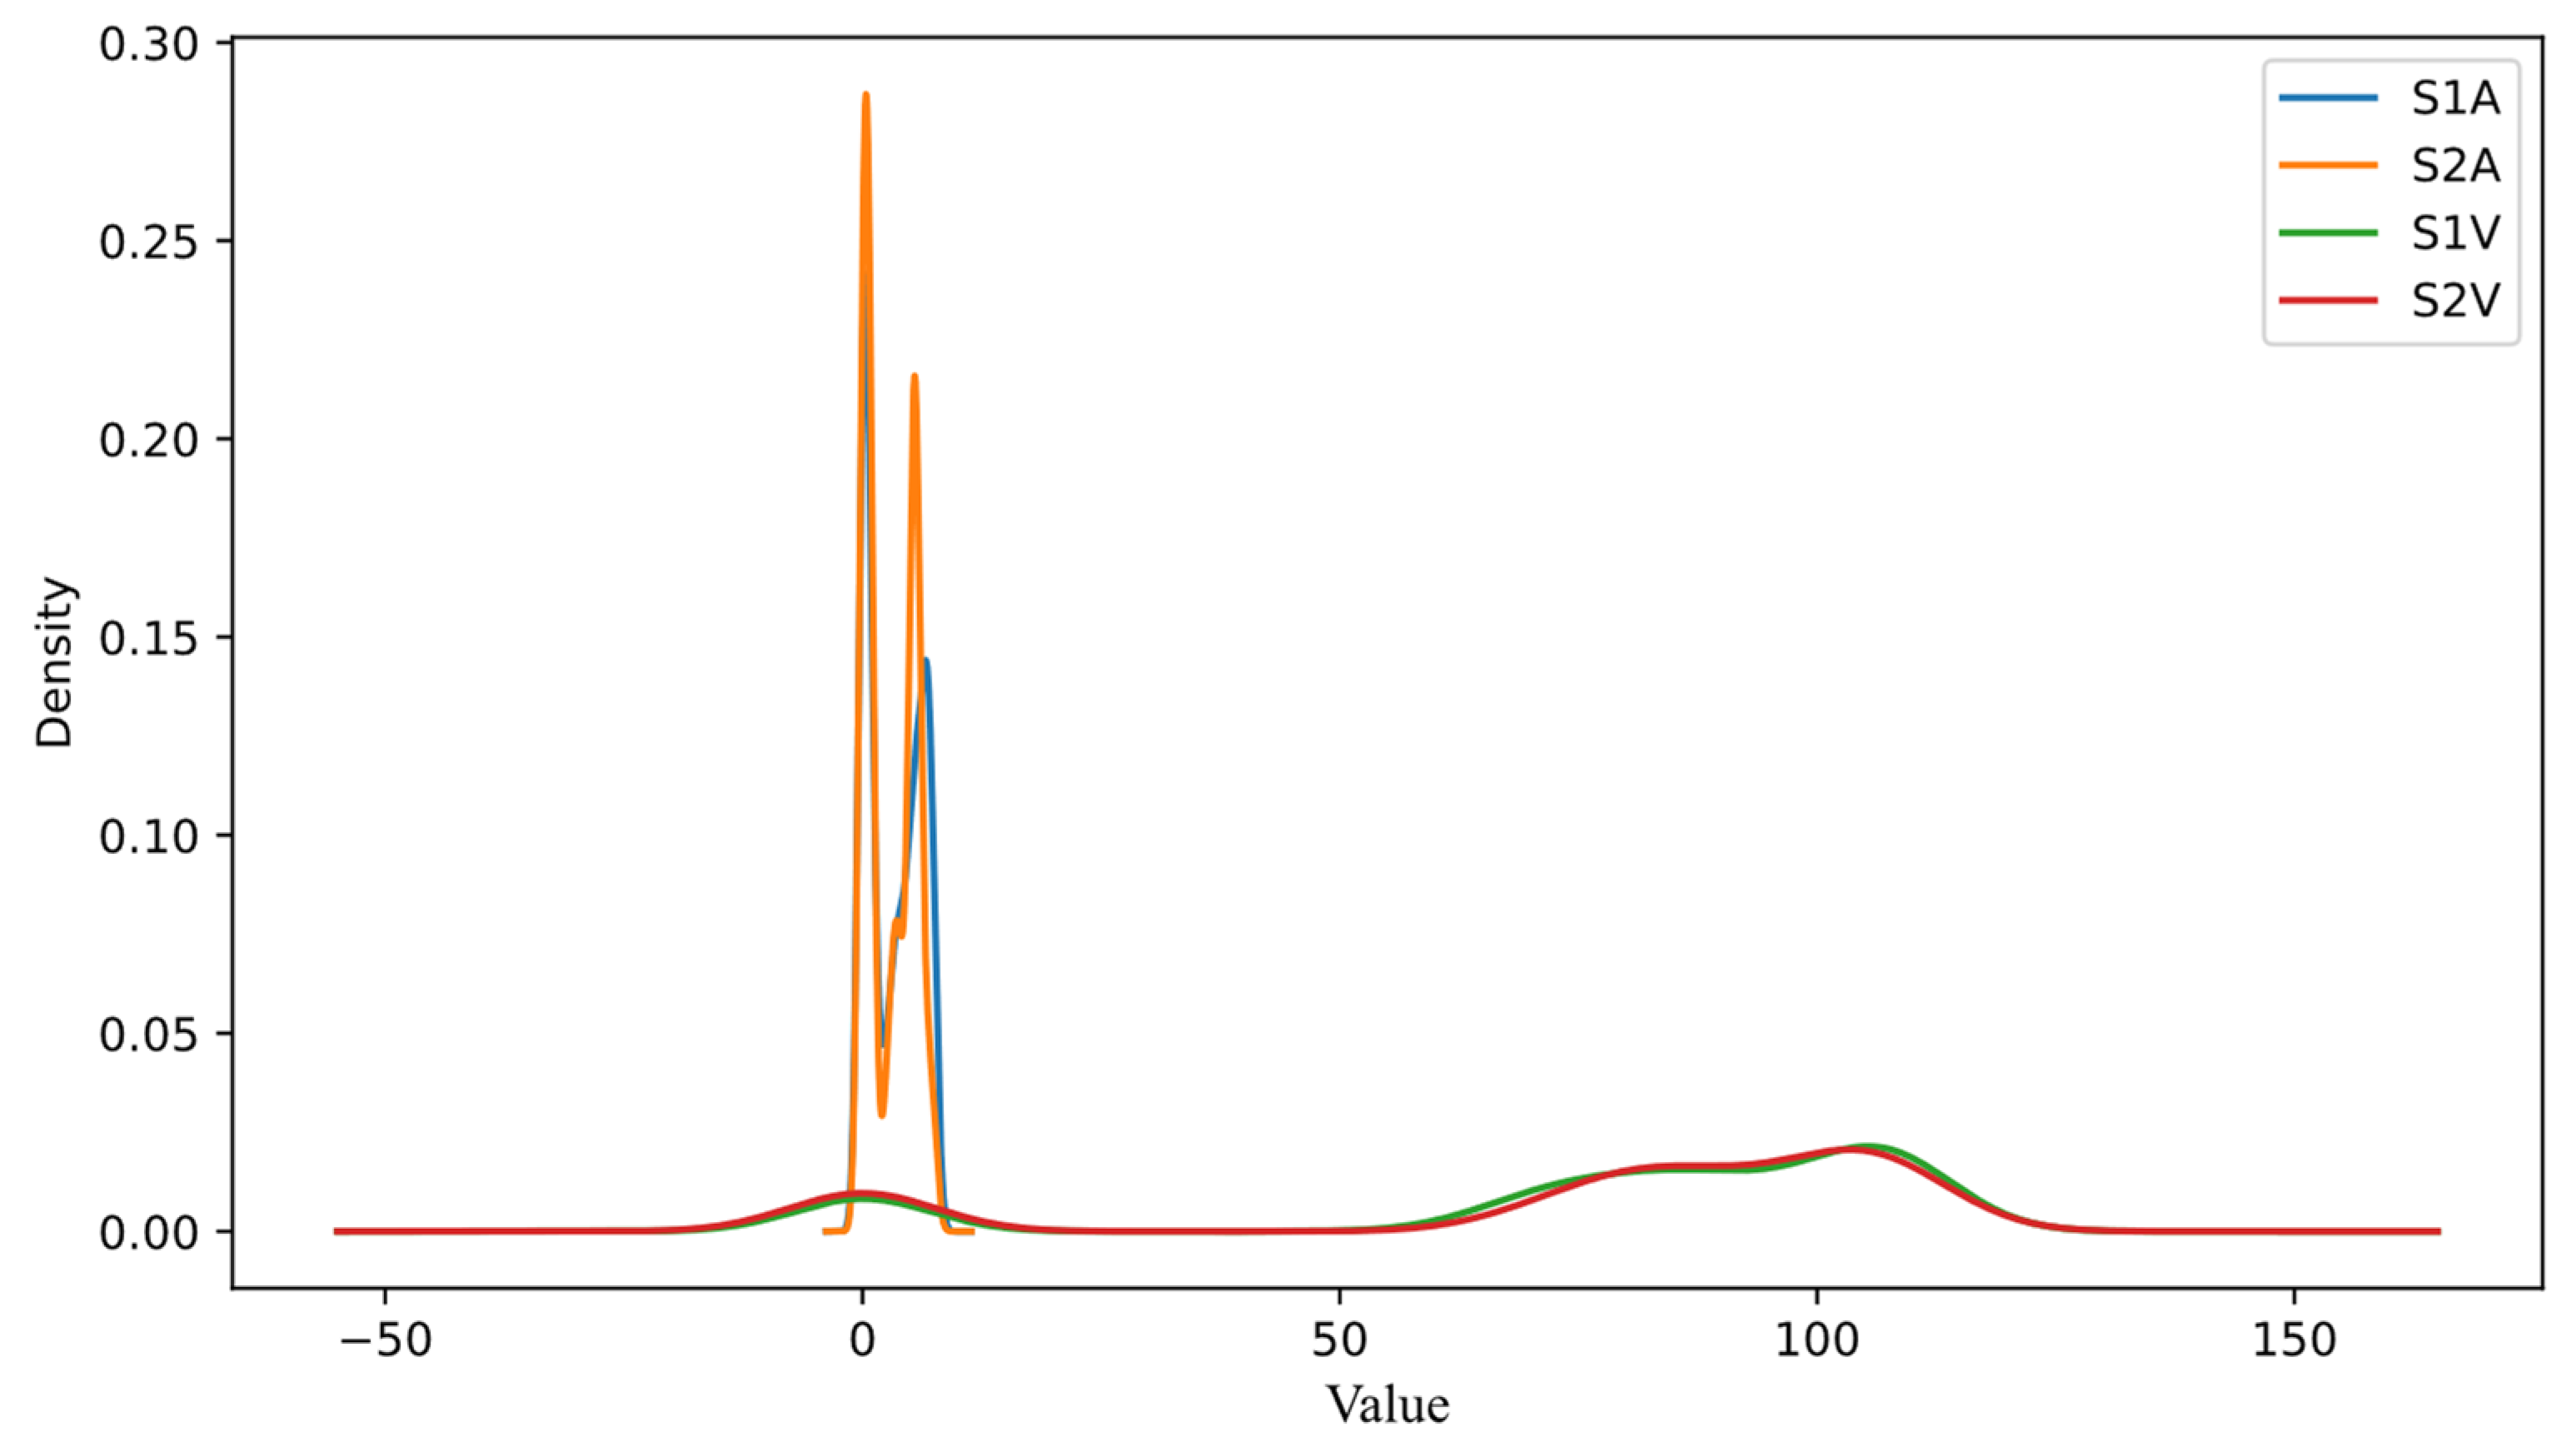
In this study, seven features are ranked using the coefficient score to obtain the most important features that are eventually used in the model. SIA, S2A, S1V, and S2V are selected and assigned a numerical value of 0, 1, 2, and 3, respectively. Additionally, light, temperature, and weather are assigned 4, 5, and 6, respectively. Note that the feature state is not used because it is composed of the target class. The performance of the feature importance score is shown in Figure 5. According to the coefficient score of each tested feature, a right decision can be made using a positive coefficient score. The V-I characteristics show the most important feature to be used for the algorithm to detect PV faults. The density of the V-I characteristics is illustrated in Figure 6. The data dispersion and correlation before normalization towards the target class can be seen in Figure 4, as explained in the previous section. Data normalization is then conducted using two types of normalization, called the MinMax scaler and Standard scaler. In the MinMax scaler, the range lies between 0 and 1, whereas the unit standard deviation and mean value are used in the Standard scaler. These two data normalizations are used, and the results are compared with the previous studies that have used any one of the two normalization methods [20,29].
4.5. Performance Assessment
The performance of the proposed EL-VLR-DT-SVM algorithm for three scenarios is assessed and compared to the other algorithms that are used as benchmarks. To better verify the reliability of the proposed algorithm, some performance indicators are used, including accuracy, precision, recall, F1 score, and computational time. These indicators are important to use because the dataset is acquired under different weather conditions where the nonlinear nature of the dataset can emerge. This nonlinearity makes the occurrence of PV faults difficult to recognize.
Finding the most appropriate algorithm for detecting the occurrence of PV faults is challenging. Many researchers face difficulties, and thus, sometimes, trial and error become a solution. However, this process is time consuming. In this proposed study, the probability of the proposed algorithm is determined and compared with other algorithms to prove that the proposed algorithm has a higher chance of recognizing the occurrence of PV faults. It is noteworthy that the probability cannot be found in some of the algorithms that are available in the literature. Thus, parameter adjustments are first conducted, such as setting the activation probability to True. In addition, this probability is used in one versus all classification. The probability of each algorithm is shown in Figure 7. This figure highlights that the proposed EL-VLR-DT-SVM algorithm is close to the perfectly calibrated line, showing a good performance in detecting the occurrence of PV faults.
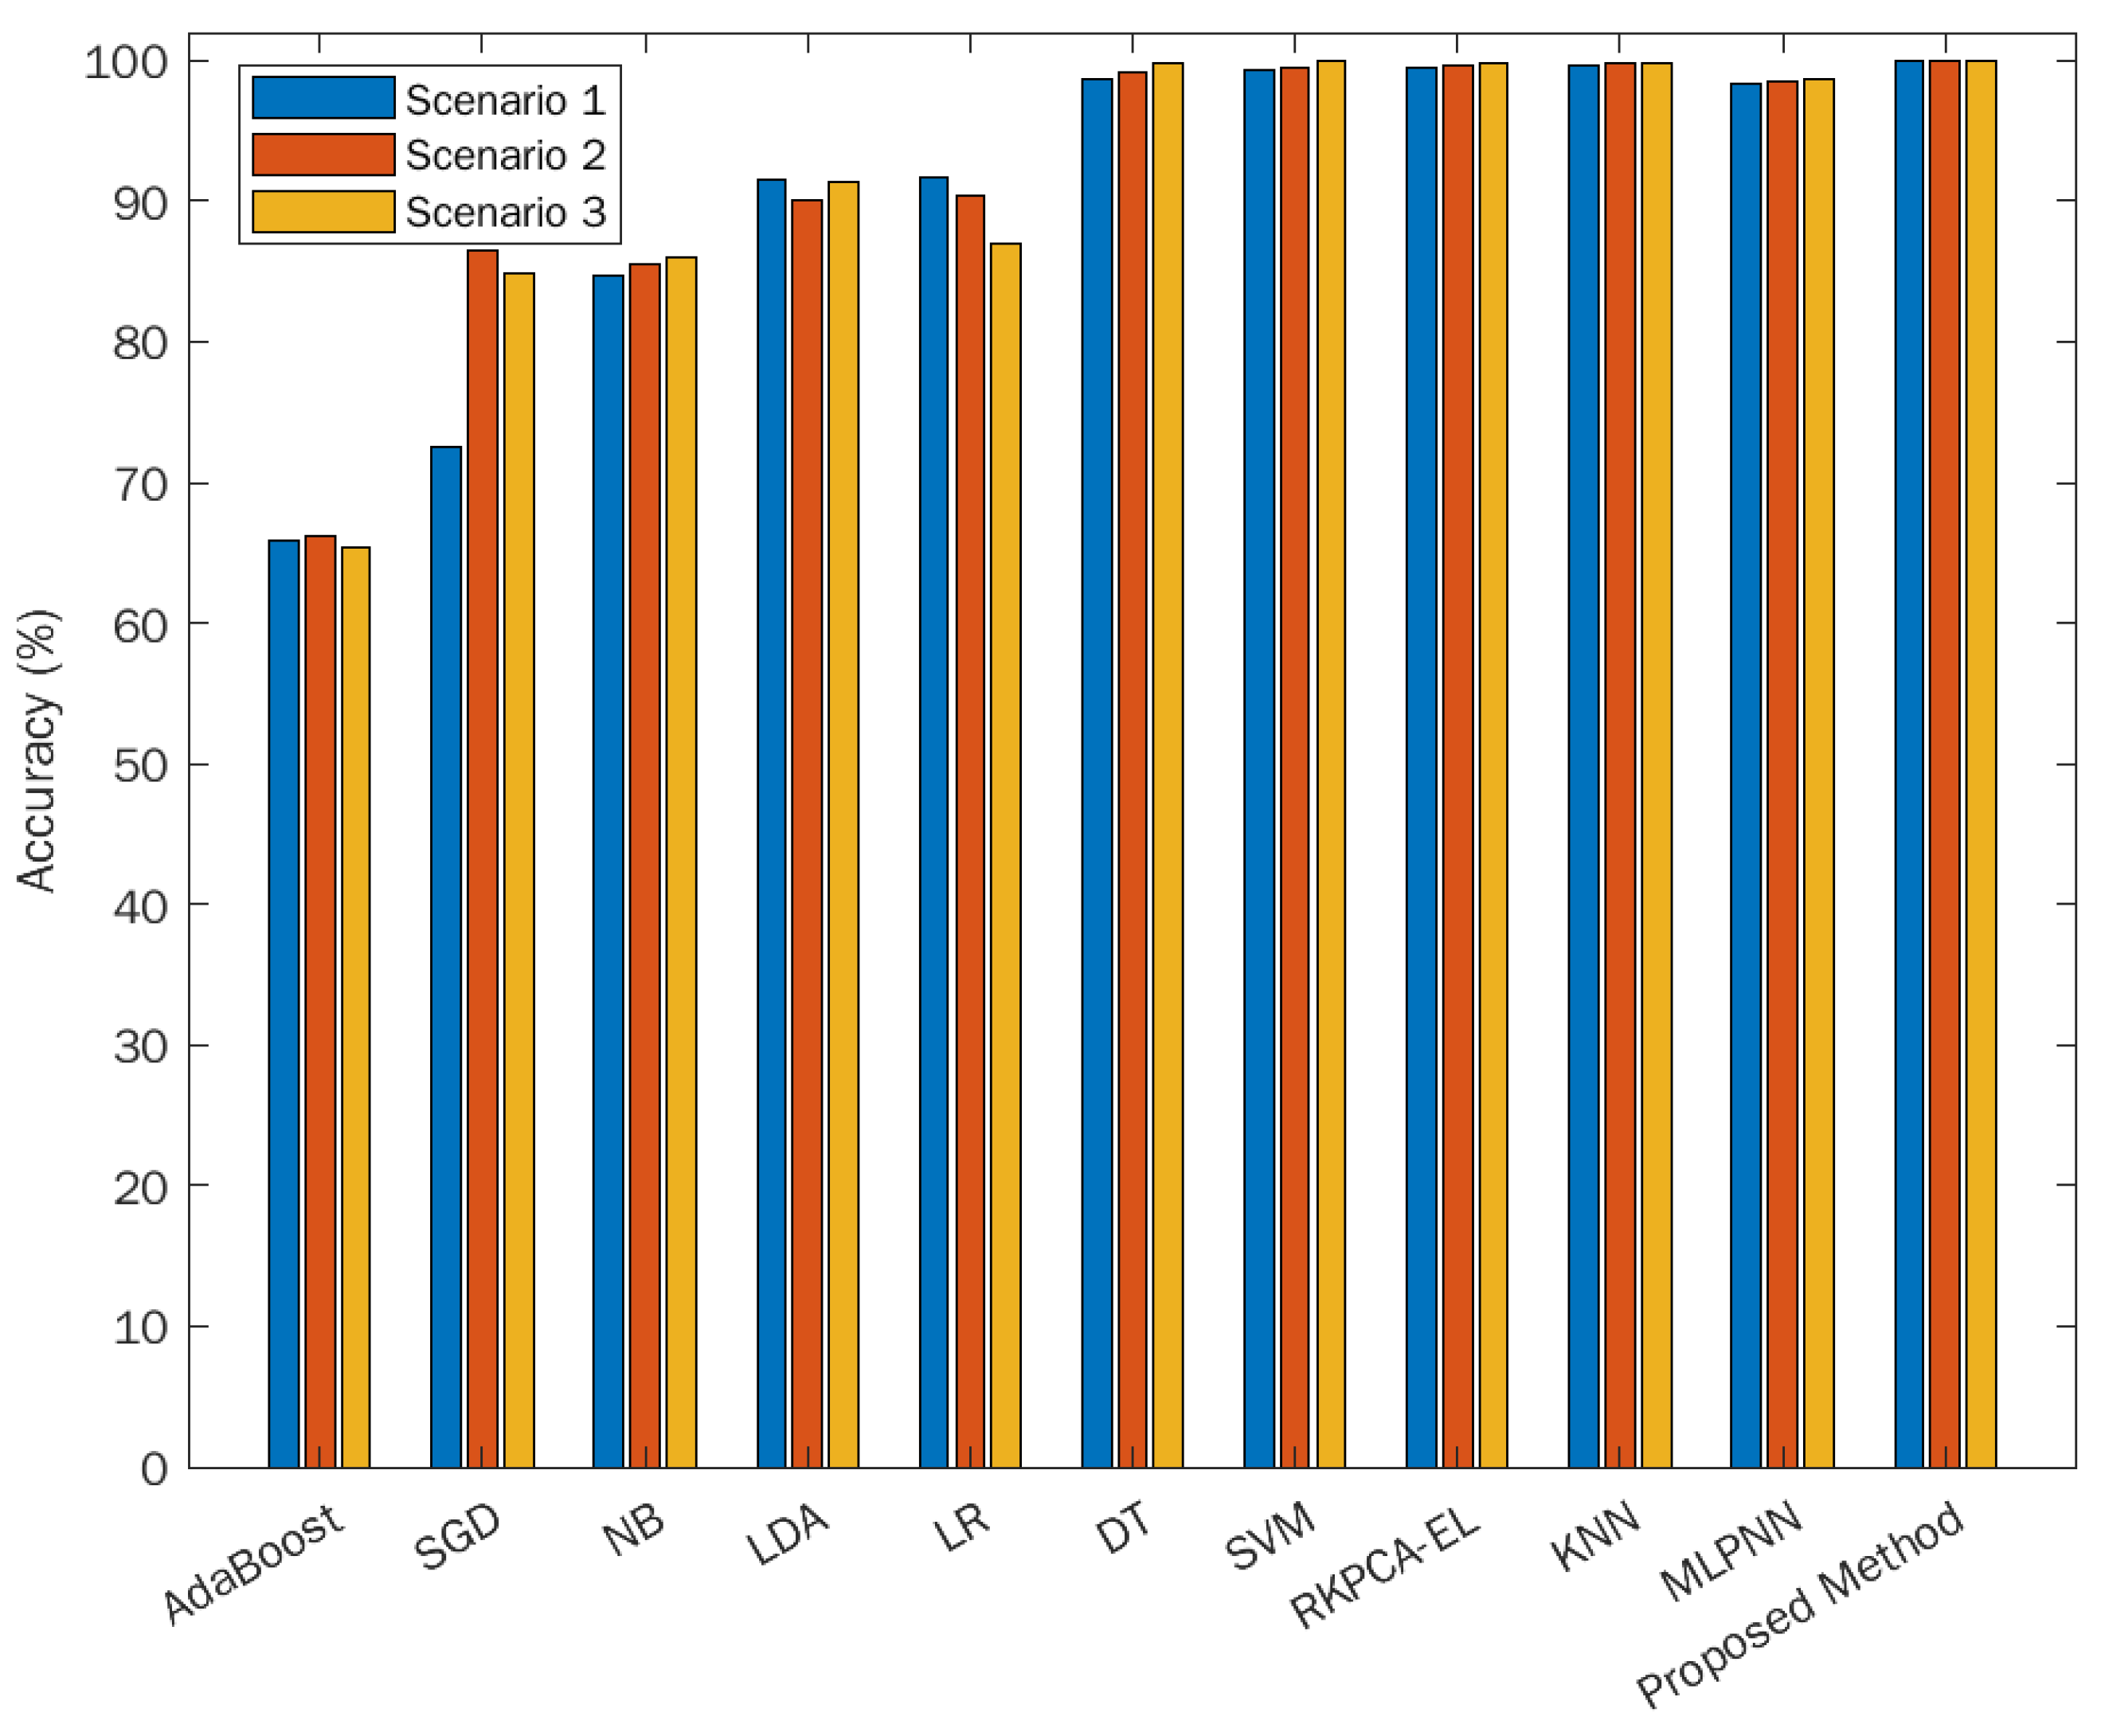
Figure 8 shows the comparison of the accuracy of the proposed algorithm with other algorithms. In all scenarios, the proposed EL-VLR-DT-SVM algorithm outperforms all other algorithms, namely AdaBoost, stochastic gradient descent (SGD), naïve Bayes (NB), linear discriminant analysis (LDA), linear regression (LR), decision tree (DT), and support vector machine (SVM), k-nearest neighbor (KNN), reduced kernel principal component analysis with the EL of SVM, KNN, and DT (RKPCA-EL), and multi-layer perceptron neural network (MLPNN). In Scenario 1, AdaBoost, SGD, and NB were only able to produce an accuracy of less than 90.00%. A higher accuracy of approximately 90.00% was obtained with LDA and LR, whereas the DT, SVM, RKPCA-EL, KNN, and MLPNN yielded approximately 99.00% accuracy. However, the proposed EL-VLR-DT-SVM algorithm produced an accuracy of 99.89% in detecting the L-L and OC faults in the PV system.
In the last two scenarios, L-L and OC faults are better recognized by the proposed algorithm than any other algorithms. The performance is 100.00% for both scenarios with the proposed algorithm. In contrast, DT, SVM, RKPCA-EL, KNN, and MLPNN yielded accuracies above 95.00%, whereas the remaining algorithms were only able to produce accuracy below 95.00%. The MLPNN and RKPCA-EL, which were proposed by [13,24], were not able to produce 100.00% accuracy when using the dataset in the current study. Under different weather conditions, the nonlinear nature of the dataset may make algorithms more difficult to recognize the occurrence of PV faults. Herein, to obtain a more intuitive understanding of the performance of the EL-VLR-DT-SVM for the detection of PV faults, a confusion matrix is shown in Table 4. In the confusion matrix of Scenario 1, the L-L and OC faults are well recognized. However, one misclassification occurs in the healthy condition, which is detected as an L-L fault. In the confusion matrix of Scenario 2 and 3, when a pre-processing of MinMax and Standard scaler normalization is deployed, it resulted in an increase in the accuracy. An excellent result of 100.00% accuracy is obtained for both scenarios, as evident from the confusion matrix with not even a single misclassification.
The precision, recall, and F-1 scores of different algorithms in all three scenarios are listed in Table 5. The values of these three indicators should be close to 1 for better results. In all three scenarios, the proposed EL-VLR-DT-SVM algorithm has outperformed all the other algorithms. Excellent performance is achieved in Scenarios 2 and 3 with perfect precision, recall, and F-1 scores.
In Scenario 1, the proposed EL-VLR-DT-SVM algorithm cannot produce excellent performance owing to one misclassified target class. However, it still shows better performance in comparison to other algorithms with a Precision, Recall, and F1 score of 0.998 each. From this performance, the deployment of data normalization, either the MinMax or Standard scaler, is strongly suggested to produce better results. In terms of computational time, scenarios with data normalization also show a faster response than those without data normalization, as shown in Table 6.
4.6. Comparison with Existing Studies
Efforts have been made to compare the proposed study with related studies to prove its reliability in detecting PV fault events and Table 7 shows this comparison. Eskandari et al. [20] proposed the EL algorithm by employing three classifiers namely SVM, NB, and KNN. Under different scenarios, this study produced good results in classifying the L-L fault of the PV system. Although this work reported satisfying result, different weather conditions were not considered in this study. In addition, no data normalizations were performed, and it detected only one L-L fault.
In [21], the EL algorithm was conducted by recognizing the anomaly energy production in PV systems. Two types of Els, namely bagging and stack-based method, were evaluated in this study. The stack-based method with 94.00% accuracy outperformed the bagging-based method having only 79.50% accuracy.
A good result of the PV fault detection was reported in [22]. They employed QDA-ETent-DT to yield an accuracy of 97.46% and 97.67% before and after optimization scenarios, respectively. However, different weather conditions were not considered in this study.
In the present study, EL-VLR-DT-SVM algorithm is developed. This study has considered different weather conditions for data acquisition. It also presents a further investigation on data normalization. The results of the proposed EL-VLR-DT-SVM have been validated with other algorithms for the purpose of benchmarking. The proposed study shows excellent results for three different scenarios. Therefore, this work can guide further research to improve the reliability of the PV systems.
5. Conclusions
An algorithm for voting-based ensemble learning with linear regression, decision tree, and support vector machine (EL-VLR-DT-SVM) was developed for PV fault detection and diagnosis (FDD). Different weather conditions were considered in this study because they cannot be ignored in real world applications. After the raw data were acquired, it was explored via exploratory data analysis (EDA). Data information, data description, missing values check, etc., were conducted. A coefficient score was computed to obtain the most important features of the PV fault classification. Thus, the selected features of the V-I characteristics were pre-processed with data normalization. Its two types were further investigated to determine their effects on the performance of the proposed algorithm where the aim was to prepare the data before feeding it to the proposed algorithm. The performance of the proposed EL-VLR-DT-SVM algorithm was comparatively assessed with other algorithms for the purpose of benchmarking, by using different performance indicators for better justification. The result showed that the proposed algorithm outperformed the compared algorithms on all indicators, such as accuracy, precision, recall, and F-1 score. The accuracies of 99.89%, 100.00%, and 100.00% were achieved for the proposed algorithm in Scenario 1–3, respectively. In terms of computational load, the proposed algorithm worked very well in Scenario 3 with a computational time of only 0.305 s, outperforming the computational time in Scenario 1 and 2. These results indicate that the proposed algorithm for PV fault detection has a good performance.
Author Contributions
Conceptualization, N.-C.Y.; Funding acquisition, N.-C.Y.; Investigation, N.-C.Y. and H.I.; Methodology, N.-C.Y. and H.I.; Software and python programing, N.-C.Y. and H.I.; Supervision, N.-C.Y.; Validation, N.-C.Y. and H.I.; Writing original manuscript, H.I.; Writing—review and editing, N.-C.Y. and H.I. All authors have read and agreed to the published version of the manuscript.
Funding
This work was partially supported by the Ministry of Science and Technology (MOST) in Taiwan (MOST 110-2622-8-011-012–SB) and the DELTA-NTUST Joint Research Center.
Institutional Review Board Statement
Not applicable.
Informed Consent Statement
Not applicable.
Data Availability Statement
Not applicable.
Acknowledgments
This work was partially supported by the Ministry of Science and Technology (MOST) in Taiwan. The authors would like to thank the funding provided by MOST (MOST 110-2622-8-011-012–SB) and DELTA-NTUST Joint Research Center.
Conflicts of Interest
The authors declare no conflict of interest.
References
- Khalil, I.U.; Ul-Haq, A.; Mahmoud, Y.; Jalal, M.; Aamir, M.; Ahsan, M.U.; Mehmood, K. Comparative Analysis of Photovoltaic Faults and Performance Evaluation of its Detection Techniques. IEEE Access 2020, 8, 26676–26700. (In English) [Google Scholar] [CrossRef]
- Harrou, F.; Sun, Y.; Taghezouit, B.; Saidi, A.; Hamlati, M.E. Reliable fault detection and diagnosis of photovoltaic systems based on statistical monitoring approaches. Renew. Energy 2018, 116, 22–37. (In English) [Google Scholar] [CrossRef] [Green Version]
- Chine, W.; Mellit, A.; Lughi, V.; Malek, A.; Sulligoi, G.; Pavan, A.M. A novel fault diagnosis technique for photovoltaic systems based on artificial neural networks. Renew. Energy 2016, 90, 501–512. (In English) [Google Scholar] [CrossRef]
- Triki-Lahiani, A.; Bennani-Ben Abdelghani, A.; Slama-Belkhodja, I. Fault detection and monitoring systems for photovoltaic installations: A review. Renew. Sustain. Energy Rev. 2018, 82, 2680–2692. (In English) [Google Scholar] [CrossRef]
- Mellit, A.; Tina, G.M.; Kalogirou, S.A. Fault detection and diagnosis methods for photovoltaic systems: A review. Renew. Sustain. Energy Rev. 2018, 91, 1–17. (In English) [Google Scholar] [CrossRef]
- Pillai, D.S.; Rajasekar, N. A comprehensive review on protection challenges and fault diagnosis in PV systems. Renew. Sustain. Energy Rev. 2018, 91, 18–40. (In English) [Google Scholar] [CrossRef]
- Livera, A.; Theristis, M.; Makrides, G.; Georghiou, G.E. Recent advances in failure diagnosis techniques based on performance data analysis for grid-connected photovoltaic systems. Renew. Energy 2019, 133, 126–143. (In English) [Google Scholar] [CrossRef]
- Appiah, A.Y.; Zhang, X.H.; Ayawli, B.B.K.; Kyeremeh, F. Review and Performance Evaluation of Photovoltaic Array Fault Detection and Diagnosis Techniques. Int. J. Photoenergy 2019, 2019, 6953530. (In English) [Google Scholar] [CrossRef]
- Li, B.; Delpha, C.; Diallo, D.; Migan-Dubois, A. Application of Artificial Neural Networks to photovoltaic fault detection and diagnosis: A review. Renew. Sustain. Energy Rev. 2021, 138, 110512. (In English) [Google Scholar] [CrossRef]
- Mellit, A.; Kalogirou, S. Artificial intelligence and internet of things to improve efficacy of diagnosis and remote sensing of solar photovoltaic systems: Challenges, recommendations and future directions. Renew. Sustain. Energy Rev. 2021, 143, 110889. (In English) [Google Scholar] [CrossRef]
- Tina, G.M.; Ventura, C.; Ferlito, S.; De Vito, S. A State-of-Art-Review on Machine-Learning Based Methods for PV. Appl. Sci. 2021, 11, 7550. (In English) [Google Scholar] [CrossRef]
- Madeti, S.R.; Singh, S.N. A comprehensive study on different types of faults and detection techniques for solar photovoltaic system. Sol. Energy 2017, 158, 161–185. (In English) [Google Scholar] [CrossRef]
- Ahmad, S.; Hasan, N.; Kurukuru, V.B.; Khan, M.A.; Haque, A. Fault classification for single phase photovoltaic systems using machine learning techniques. In Proceedings of the 2018 8th IEEE India International Conference on Power Electronics (IICPE), Jaipur, India, 13–15 December 2018; pp. 1–6. [Google Scholar]
- Garoudja, E.; Chouder, A.; Kara, K.; Silvestre, S. An enhanced machine learning based approach for failures detection and diagnosis of PV systems. Energy Convers. Manag. 2017, 151, 496–513. [Google Scholar] [CrossRef] [Green Version]
- Mandal, R.K.; Kale, P.G. Assessment of different multiclass SVM strategies for fault classification in a PV system. In Proceedings of the 7th International Conference on Advances in Energy Research, Bombay, India, 10–12 December 2019; Springer: Berlin/Heidelberg, Germany, 2021; pp. 747–756. [Google Scholar]
- Yi, Z.; Etemadi, A.H. A novel detection algorithm for Line-to-Line faults in Photovoltaic (PV) arrays based on support vector machine (SVM). In Proceedings of the 2016 IEEE Power and Energy Society General Meeting (PESGM), Boston, MA, USA, 17–21 July 2016; pp. 1–4. [Google Scholar]
- Yi, Z.H.; Etemadi, A.H. Line-to-Line Fault Detection for Photovoltaic Arrays Based on Multiresolution Signal Decomposition and Two-Stage Support Vector Machine. IEEE Trans. Ind. Electron. 2017, 64, 8546–8556. (In English) [Google Scholar] [CrossRef]
- Tao, C.; Wang, X.; Gao, F.; Wang, M. Fault Diagnosis of photovoltaic array based on deep belief network optimized by genetic algorithm. Chin. J. Electr. Eng. 2020, 6, 106–114. [Google Scholar] [CrossRef]
- Aziz, F.; Ul Haq, A.; Ahmad, S.; Mahmoud, Y.; Jalal, M.; Ali, U. A Novel Convolutional Neural Network-Based Approach for Fault Classification in Photovoltaic Arrays. IEEE Access 2020, 8, 41889–41904. (In English) [Google Scholar] [CrossRef]
- Eskandari, A.; Milimonfared, J.; Aghaei, M. Line-line fault detection and classification for photovoltaic systems using ensemble learning model based on I-V characteristics. Sol. Energy 2020, 211, 354–365. (In English) [Google Scholar] [CrossRef]
- Justin, D.; Concepcion, R.S.; Calinao, H.A.; Lauguico, S.C.; Dadios, R.P.; Vicerra, R.R.P. Application of Ensemble Learning with Mean Shift Clustering for Output Profile Classification and Anomaly Detection in Energy Production of Grid-Tied Photovoltaic System. In Proceedings of the 2020 12th International Conference on Information Technology and Electrical Engineering (ICITEE), Yogyakarta, Indonesia, 6–8 October 2020; pp. 286–291. [Google Scholar]
- Kapucu, C.; Cubukcu, M. A supervised ensemble learning method for fault diagnosis in photovoltaic strings. Energy 2021, 227, 120463. (In English) [Google Scholar] [CrossRef]
- Adhya, D.; Chatterjee, S.; Chakraborty, A.K. Performance assessment of selective machine learning techniques for improved PV array fault diagnosis. Sustain. Energy Grids Netw. 2022, 29, 100582. [Google Scholar] [CrossRef]
- Dhibi, K.; Mansouri, M.; Bouzrara, K.; Nounou, H.; Nounou, M. An Enhanced Ensemble Learning-Based Fault Detection and Diagnosis for Grid-Connected PV Systems. IEEE Access 2021, 9, 155622–155633. (In English) [Google Scholar] [CrossRef]
- Dhibi, K.; Fezai, R.; Mansouri, M.; Trabelsi, M.; Kouadri, A.; Bouzara, K.; Nounou, H.; Nounou, M. Reduced Kernel Random Forest Technique for Fault Detection and Classification in Grid-Tied PV Systems. IEEE J. Photovolt. 2020, 10, 1864–1871. (In English) [Google Scholar] [CrossRef]
- Chen, Z.C.; Han, F.; Wu, L.; Yu, J.; Cheng, S.; Lin, P.; Chen, H. Random forest based intelligent fault diagnosis for PV arrays using array voltage and string currents. Energy Convers. Manag. 2018, 178, 250–264. (In English) [Google Scholar] [CrossRef]
- Dhibi, K.; Fezai, R.; Mansouri, M.; Trabelsi, M.; Bouzrara, K.; Nounou, H.; Nounou, M. A Hybrid Fault Detection and Diagnosis of Grid-Tied PV Systems: Enhanced Random Forest Classifier Using Data Reduction and Interval-Valued Representation. IEEE Access 2021, 9, 64267–64277. (In English) [Google Scholar] [CrossRef]
- Pahwa, K.; Sharma, M.; Saggu, M.S.; Mandpura, A.K. Performance Evaluation of Machine Learning Techniques for Fault Detection and Classification in PV Array Systems. In Proceedings of the 2020 7th International Conference on Signal Processing and Integrated Networks (SPIN), Noida, India, 27–28 February 2020; pp. 791–796. [Google Scholar]
- Basnet, B.; Chun, H.; Bang, J. An Intelligent Fault Detection Model for Fault Detection in Photovoltaic Systems. J. Sens. 2020, 2020, 6960328. (In English) [Google Scholar] [CrossRef]
- Chen, C.-R.; Ouedraogo, F.B.; Chang, Y.-M.; Larasati, D.A.; Tan, S.-W. Hour-Ahead Photovoltaic Output Forecasting Using Wavelet-ANFIS. Mathematics 2021, 9, 2438. [Google Scholar] [CrossRef]
- Pillai, D.S.; Blaabjerg, F.; Rajasekar, N. A Comparative Evaluation of Advanced Fault Detection Approaches for PV Systems. IEEE J. Photovolt. 2019, 9, 513–527. (In English) [Google Scholar] [CrossRef]
- Sabbaghpur Arani, M.; Hejazi, M.A. The comprehensive study of electrical faults in PV arrays. J. Electr. Comput. Eng. 2016, 2016, 8712960. [Google Scholar] [CrossRef]
- Voutsinas, S.; Karolidis, D.; Voyiatzis, I.; Samarakou, M. Photovoltaic Faults: A comparative overview of detection and identification methods. In Proceedings of the 2021 10th International Conference on Modern Circuits and Systems Technologies (MOCAST), Thessaloniki, Greece, 5–7 July 2021; pp. 1–5. [Google Scholar]
- Chandrasekharan, S.; Subramaniam, S.K.; Natarajan, B. Current indicator based fault detection algorithm for identification of faulty string in solar PV system. IET Renew. Power Gen. 2021, 15, 1596–1611. [Google Scholar] [CrossRef]
- Zaki, S.A.; Zhu, H.; Yao, J.; Sayed, A.R.; Abdelbaky, M.A. Detection and localization the open and short circuit faults in PV system: A MILP approach. In Proceedings of the 2020 Asia Energy and Electrical Engineering Symposium (AEEES), Chengdu, China, 29–31 May 2020; pp. 187–193. (In English). [Google Scholar]
- Stanton, J.M. Galton, Pearson, and the peas: A brief history of linear regression for statistics instructors. J. Stat. Educ. 2001, 9, 1069–1898. [Google Scholar] [CrossRef]
- Benkercha, R.; Moulahoum, S. Fault detection and diagnosis based on C4.5 decision tree algorithm for grid connected PV system. Sol. Energy 2018, 173, 610–634. (In English) [Google Scholar] [CrossRef]
- Zhang, C.; Ma, Y. Ensemble Machine Learning: Methods and Applications; Springer: Berlin/Heidelberg, Germany, 2012. [Google Scholar]
- Bowles, M. Machine Learning with Spark and Python: Essential Techniques for Predictive Analytics; John Wiley & Sons: Hoboken, NJ, USA, 2019. [Google Scholar]
- Chun, H.; Basnet, B.; Bang, J. Dataset: Fault Detection in Photovoltaic Systems 2020. Available online: https://github.com/benjamin2044/PV_fault_Python/blob/master/Solar_categorical.csv (accessed on 1 December 2021).
Figure 1.
Fault occurrences in a PV system.

Figure 2.
Proposed algorithm.

Figure 3.
Confusion Matrix.

Figure 4.
Data dispersion and correlation towards PV faults.

Figure 5.
Feature importance score.

Figure 6.
Density of V-I characteristics from selected features.

Figure 7.
Probability of the proposed algorithm and other compared algorithms.

Figure 8.
Accuracy performance comparison.


Table 1.
Tuning hyperparameters for the proposed algorithm.
| Model | Items | Parameters |
|---|---|---|
| LR | Fit intercept | False |
| n-jobs | 1 | |
| DT | criterion | Entropy |
| max-depth | 1000 | |
| splitter | Random | |
| min-sample-split | 2 | |
| SVM | C | 3 |
| kernel | Poly | |
| degree | 8 | |
| gamma | scale | |
| coef0 | 0.2 |
Table 2.
PV array specification.
| Specification Parameter | Description/Value |
|---|---|
| 1.8 kW | |
| 9 A | |
| 39 V | |
| Parallel connection | 2 lines |
| Serial connection | 3 PV arrays |
| Connection type | Grid-connected |
Table 3.
Data description.
| Column/Feature | Count | Non-Null Condition | Data Type |
|---|---|---|---|
| S1A | 3000 | non-null | float64 |
| S2A | 3000 | non-null | float64 |
| S1V | 3000 | non-null | int64 |
| S2V | 3000 | non-null | int64 |
| Light | 3000 | non-null | float64 |
| Temperature | 3000 | non-null | int64 |
| Weather | 3000 | non-null | object |
| State | 3000 | non-null | object |
Table 4.
Confusion matrix of the proposed algorithm in three different scenarios.
| Confusion Matrix | ||
|---|---|---|
| Scenario 1 | Scenario 2 | Scenario 3 |
Table 5.
Algorithm performance indicators.
| Scenario | Algorithm | Precision | Recall | F-1 Score |
|---|---|---|---|---|
| Scenario 1 | AdaBoost | 0.496 | 0.666 | 0.550 |
| SGD | 0.503 | 0.666 | 0.560 | |
| NB | 0.866 | 0.856 | 0.853 | |
| LDA | 0.923 | 0.920 | 0.920 | |
| LR | 0.917 | 0.915 | 0.916 | |
| DT | 0.987 | 0.986 | 0.986 | |
| SVM | 0.993 | 0.993 | 0.993 | |
| RKPCA-EL | 0.994 | 0.994 | 0.995 | |
| KNN | 0.994 | 0.995 | 0.996 | |
| MLPNN | 0.990 | 0.992 | 0.991 | |
| Proposed Method | 0.998 | 0.998 | 0.998 | |
| Scenario 2 | AdaBoost | 0.50 | 0.666 | 0.553 |
| SGD | 0.856 | 0.856 | 0.853 | |
| NB | 0.866 | 0.856 | 0.856 | |
| LDA | 0.920 | 0.916 | 0.916 | |
| LR | 0.873 | 0.876 | 0.876 | |
| DT | 0.990 | 0.986 | 0.986 | |
| SVM | 0.998 | 0.998 | 0.998 | |
| RKPCA-EL | 0.995 | 0.995 | 0.995 | |
| KNN | 0.995 | 0.995 | 0.996 | |
| MLPNN | 0.992 | 0.992 | 0.993 | |
| Proposed Method | 1 | 1 | 1 | |
| Scenario 3 | AdaBoost | 0.493 | 0.666 | 0.550 |
| SGD | 0.890 | 0.883 | 0.8883 | |
| NB | 0.876 | 0.866 | 0.863 | |
| LDA | 0.923 | 0.923 | 0.920 | |
| LR | 0.918 | 0.916 | 0.916 | |
| DT | 0.997 | 0.997 | 0.997 | |
| SVM | 0.998 | 0.998 | 0.998 | |
| RKPCA-EL | 0.997 | 0.996 | 0.997 | |
| KNN | 0.996 | 0.996 | 0.996 | |
| MLPNN | 0.992 | 0.993 | 0.993 | |
| Proposed Method | 1 | 1 | 1 |
Table 6.
Computational time of the proposed method.
| Scenario | Scenario 1 | Scenario 2 | Scenario 3 |
|---|---|---|---|
| Time (second) | 0.581 | 0.508 | 0.305 |
Table 7.
Comparison with related studies.
| Year | Reference | Different Weather Conditions | Data Normalization | Resul | |
|---|---|---|---|---|---|
| Yes | No | ||||
| 2020 | [20] | ✓ | Standard scaler | 99.00% and 99.50% under different scenarios | |
| 2020 | [21] | ✓ | Not defined |
| |
| 2021 | [22] | ✓ | Not defined |
| |
| Proposed work | ✓ | MinMax scaler Standard scaler |
| ||
Publisher’s Note: MDPI stays neutral with regard to jurisdictional claims in published maps and institutional affiliations. |
© 2022 by the authors. Licensee MDPI, Basel, Switzerland. This article is an open access article distributed under the terms and conditions of the Creative Commons Attribution (CC BY) license (https://creativecommons.org/licenses/by/4.0/).
Share and Cite
MDPI and ACS Style
Yang, N.-C.; Ismail, H. Voting-Based Ensemble Learning Algorithm for Fault Detection in Photovoltaic Systems under Different Weather Conditions. Mathematics 2022, 10, 285. https://0-doi-org.brum.beds.ac.uk/10.3390/math10020285
AMA Style
Yang N-C, Ismail H. Voting-Based Ensemble Learning Algorithm for Fault Detection in Photovoltaic Systems under Different Weather Conditions. Mathematics. 2022; 10(2):285. https://0-doi-org.brum.beds.ac.uk/10.3390/math10020285
Chicago/Turabian StyleYang, Nien-Che, and Harun Ismail. 2022. "Voting-Based Ensemble Learning Algorithm for Fault Detection in Photovoltaic Systems under Different Weather Conditions" Mathematics 10, no. 2: 285. https://0-doi-org.brum.beds.ac.uk/10.3390/math10020285
Note that from the first issue of 2016, this journal uses article numbers instead of page numbers. See further details here.