Article

Developing an ANFIS-PSO Model to Predict Mercury Emissions in Combustion Flue Gases

by
Shahaboddin Shamshirband
1,2,
Masoud Hadipoor
3,
Alireza Baghban
4,
Amir Mosavi
5,6,7,*,
Jozsef Bukor
8 and
Annamária R. Várkonyi-Kóczy
5,8
1
Department for Management of Science and Technology Development, Ton Duc Thang University, Ho Chi Minh City, Vietnam
2
Faculty of Information Technology, Ton Duc Thang University, Ho Chi Minh City, Vietnam
3
Department of Petroleum Engineering, Ahwaz Faculty of Petroleum Engineering, Petroleum University of Technology (PUT), Ahwaz, Iran
4
Department of Chemical Engineering, Amirkabir University of Technology (Tehran Polytechnic), Mahshahr Campus, Mahshahr, Iran
5
Institute of Automation, Kando Kalman Faculty of Electrical Engineering, Obuda University, 1034 Budapest, Hungary
6
Faculty of Health, Queensland University of Technology, Victoria Park Road, Kelvin Grove 4059, Australia
7
School of Built the Environment, Oxford Brookes University, Oxford OX30BP, UK
8
Department of Mathematics and Informatics, J. Selye University, 94501 Komarno, Slovakia
*
Author to whom correspondence should be addressed.
Submission received: 30 June 2019 / Revised: 16 September 2019 / Accepted: 10 October 2019 / Published: 14 October 2019

Abstract

:
Accurate prediction of mercury content emitted from fossil-fueled power stations is of the utmost importance for environmental pollution assessment and hazard mitigation. In this paper, mercury content in the output gas of power stations’ boilers was predicted using an adaptive neuro-fuzzy inference system (ANFIS) method integrated with particle swarm optimization (PSO). The input parameters of the model included coal characteristics and the operational parameters of the boilers. The dataset was collected from 82 sample points in power plants and employed to educate and examine the proposed model. To evaluate the performance of the proposed hybrid model of the ANFIS-PSO, the statistical meter of MARE% was implemented, which resulted in 0.003266 and 0.013272 for training and testing, respectively. Furthermore, relative errors between the acquired data and predicted values were between −0.25% and 0.1%, which confirm the accuracy of the model to deal non-linearity and represent the dependency of flue gas mercury content into the specifications of coal and the boiler type.

1. Introduction

The huge dependency on fossil fuels in the production of energy to support industries, mobility, and urbanization have dramatically increased air pollution worldwide [1,2,3]. Population growth, industrialization, climate change, and the ever-growing fact of urbanization are further accelerating the production of emissions and the severe impacts on air quality [4,5,6]. Air pollution is known as a profound contributor to human mortality and as a potential danger to the environment and ecological systems [2,7,8]. Thus, intelligent monitoring of air pollutants is of the utmost importance to maintain acceptable levels of air quality for well-being [9,10,11,12].
Among the numerous industrial pollutants, mercury contamination has been identified as one of the most acute air pollutants produced by conventional fossil-fueled power stations [13,14,15,16]. Mercury contamination can cause significant ecological hazards with a considerable effect on human well-being around the world [17,18,19,20]. As a lethal and hugely volatile metal, mercury can cause contamination of surface streams and lakes, as well as groundwater [21]. It is the most dangerous hazard for infants and young adults as it influences the central nervous system, causing severe illnesses [22]. Previous studies (e.g., [7,8,9,10,11]) report that a substantial amount of mercury outflows into the environment come from coal-fired power plants. In 2010, roughly 1960 tonne/year of mercury flowed into the air from various industries worldwide [23], including the burning of coal, which had a relatively high share of 24% [24]. Power plants are responsible for approximately 33% of mercury outflows, and this type of emission is caused by human beings [25], while elemental mercury emissions constitute approximately 20–50% of mercury emissions, which originate from the combustion of coal [26,27]. Nowadays, mercury emission from coal consumption has become a global concern [12,13,14]. In 2006, total coal consumption in China was approximately 40.1% of world consumption, which is equivalent to 1238.3 million tons of oil [28]. Thus, some studies suggest that the amount of mercury emissions is more likely to increase over the next several years because of coal’s increasing use in developing countries [29]. The environmental protection agency of the United States of America has announced mercury as one of the most dangerous air pollutants. In 1999, an approximated amount of 45 tons of mercury flowed out from coal-consuming plants into the environment (Alto 2000) [25]. The growing concern over this type of contamination in the US has led government and specialists to start endeavors to recognize, estimate, and cut-off such anthropogenic emissions. As a result of the absence of cost-effective, promptly accessible, and efficient practical control methodologies in the US, discharge of this dangerous contaminant from coal-consuming boilers are still not under control. It gets worse when the greater part of the power supply in a country as large as the United States originates from utility boilers that use coal [30] and, furthermore, about 70% of electricity power in China is produced by burning coal, in which 50% of this coal is burned in coal-based power plants [31,32].
In 1998, paying attention to the enormous potential for environmental dangers, the EPA proposed a request to ask coal-consuming plants to publish information on the amount of mercury contaminant outflows from their systems. This request was designed to gather information in precisely three primary stages. The first and principal stage was intended to collect all standard data on coal-burning power plants around the US. Afterward, as the second stage of the program, analyzed feed data at the entrance of every plant over a year were collected. Eventually, in the third phase, the EPA picked 84 out of 1084 plants to gather data on mercury emission at specified points within the selected plants. This selection was based on statistical analysis of the feed specifications and also the operational structure of each plant. Obtained data from the third phase of the program was evaluated. Representing correlations were developed to predict the emission of mercury in each plant concerning coal qualities and operating conditions. It was found that the best input data were the characteristics of coal, for example, the concentration of mercury, heating value, chlorine sulfur, operating parameters, such as temperatures and pressures, and also yield parameters in boilers such as the amount of mercury oxidation.
Recently, intelligent and data-driven methods have become increasingly famous for the prediction of air pollution [33,34,35,36,37]. Among them, machine learning methods have been reported to deliver higher performance in terms of accuracy, robustness, and lower computational power in dealing with uncertainties and big data [38,39,40,41]. Several surveys report that ensemble and hybrid models are the future trends in machine learning due to the fact of their optimized algorithms for higher efficiency [42,43,44,45,46,47,48]. Hybrid machine learning models are shown to deliver higher performance in air pollution modeling and prediction [49,50,51,52,53,54]. However, the application of hybrid machine learning in modeling mercury emissions has been limited and presents a research gap. Consequently, this paper aimed to propose one of the newly advanced hybrid models for prediction of mercury emissions. This paper dealt with the problem of the prediction of mercury emissions in nature using an outstanding and new method—the adaptive neuro-fuzzy inference system with particle swarm optimization (ANFIS-PSO) model. We developed a powerful model enhanced with the PSO algorithm. Data were obtained from a survey of the literature and then analyzed using the proposed model.
The rest of the paper is organized as follows. In the Section 2, a review of the literature is provided and the advantages of using the ANFIS-PSO. In the Section 3, the model’s development is described. The results and conclusions are presented in the Section 4 and Section 5, respectively.

2. Literature Review

Artificial intelligence approaches are powerful tools to model and predict parameters of air pollution, including mercury emissions through finding correlations among variables [37,55,56,57,58]. Among artificial intelligence approaches, machine learning methods are particularly known as powerful algorithms for delivering insight into non-linear relationships among parameters [56,59,60]. A deep understanding of a power plant is needed to control the amount of mercury emissions [61,62,63]. Therefore, an accurate estimation of emissions is of the utmost importance to control and reduce mercury emissions [64]. Numerous investigations have been published in the literature regarding the application of artificial intelligence approaches [65,66,67,68,69]. Computational intelligence has been used to both predict the amount of mercury emissions and to model the elimination of elemental mercury from the outlet gas of boilers [56]. Dragomir and Oprea [70] presented a multi-agent prediction tool for intelligent monitoring of pollutants in power plants. They used a model based on neural networks to predict the amount of SO2, NOx, particulate matter (PM), and mercury emissions. Jensen et al. [71] presented a study on the relationship between mercury in the flue gas, coal specifications, and the type of boiler using a multilayer perceptron model. They derived an accurate model with a correlation coefficient of 0.9750. Antanasijevic et al. [72] developed a prediction model using neural networks and genetic algorithm (GA) to accurately calculate the amount of PM10 emissions for up to two years in the future. Zhao et al. [73] used a support vector machine to develop a model which provided better performance and accuracy. In 2016, Wang et al. [74] worked on the application of GA-back propagation (GA-BP) for predicting the amount of mercury in the flue gases of 20 different coal-fired boilers. Correlation coefficient training data points were as high as 0.895, and they showed that GA-BP is a promising method for this goal. Li et al. [75] employed a computational intelligence approach to cut-off the elemental mercury in coal-fired boilers, and they found that the increment of capture efficiency can be improved up to approximately 15%.
Although the application of machine learning for prediction of pollutants and mercury emissions is well established within the scientific community, the potential of novel machine learning models (e.g., ensembles and hybrids) has still not been explored for mercury prediction. In particular, a wide range of novel hybrid machine learning methods has recently been developed to deliver higher accuracy and performance [47,76,77]. For instance, the hybrid model of the ANFIS-PSO—which is an integration of an adaptive neuro-fuzzy inference system (ANFIS) and particle swarm optimization (PSO)—has shown promising results [78]. The hybrid model of the ANFIS-PSO (also known as PSO-ANFIS) appeared in the works of Catalao et al. [79,80] in early 2011 for the prediction of wind energy and electricity pricing. Since then, this method has been used in various applications, e.g., load shedding, electricity prices forecasting, hydrofoil, travel time estimation, prediction of viscosity of mixed oils, matrix membranes modeling, wax deposition, electric power forecasting, asphaltene precipitation, prediction of the density of bitumen diluted with solvents, heating value of biomass, predicted interfacial tension of hydrocarbons and brine, prediction of gas density, forecasting oil flocculated asphaltene, biodiesel efficiency, biomass heating modeling, prediction of property damage, and solar radiation forecasting [81,82,83,84,85,86,87,88,89,90,91,92,93,94,95,96,97]. The ability to generalize, higher accuracy, speed, and ease of use have been reported as the main characteristics of the ANFIS-PSO. Therefore, this hybrid method has been identified as a suitable candidate for modeling mercury emissions. Consequently, the aim of the present study was to find a reliable relationship between elemental mercury in the output gas, the specification of feed, and the type of boiler by utilizing an ANFIS-PSO-based approach.

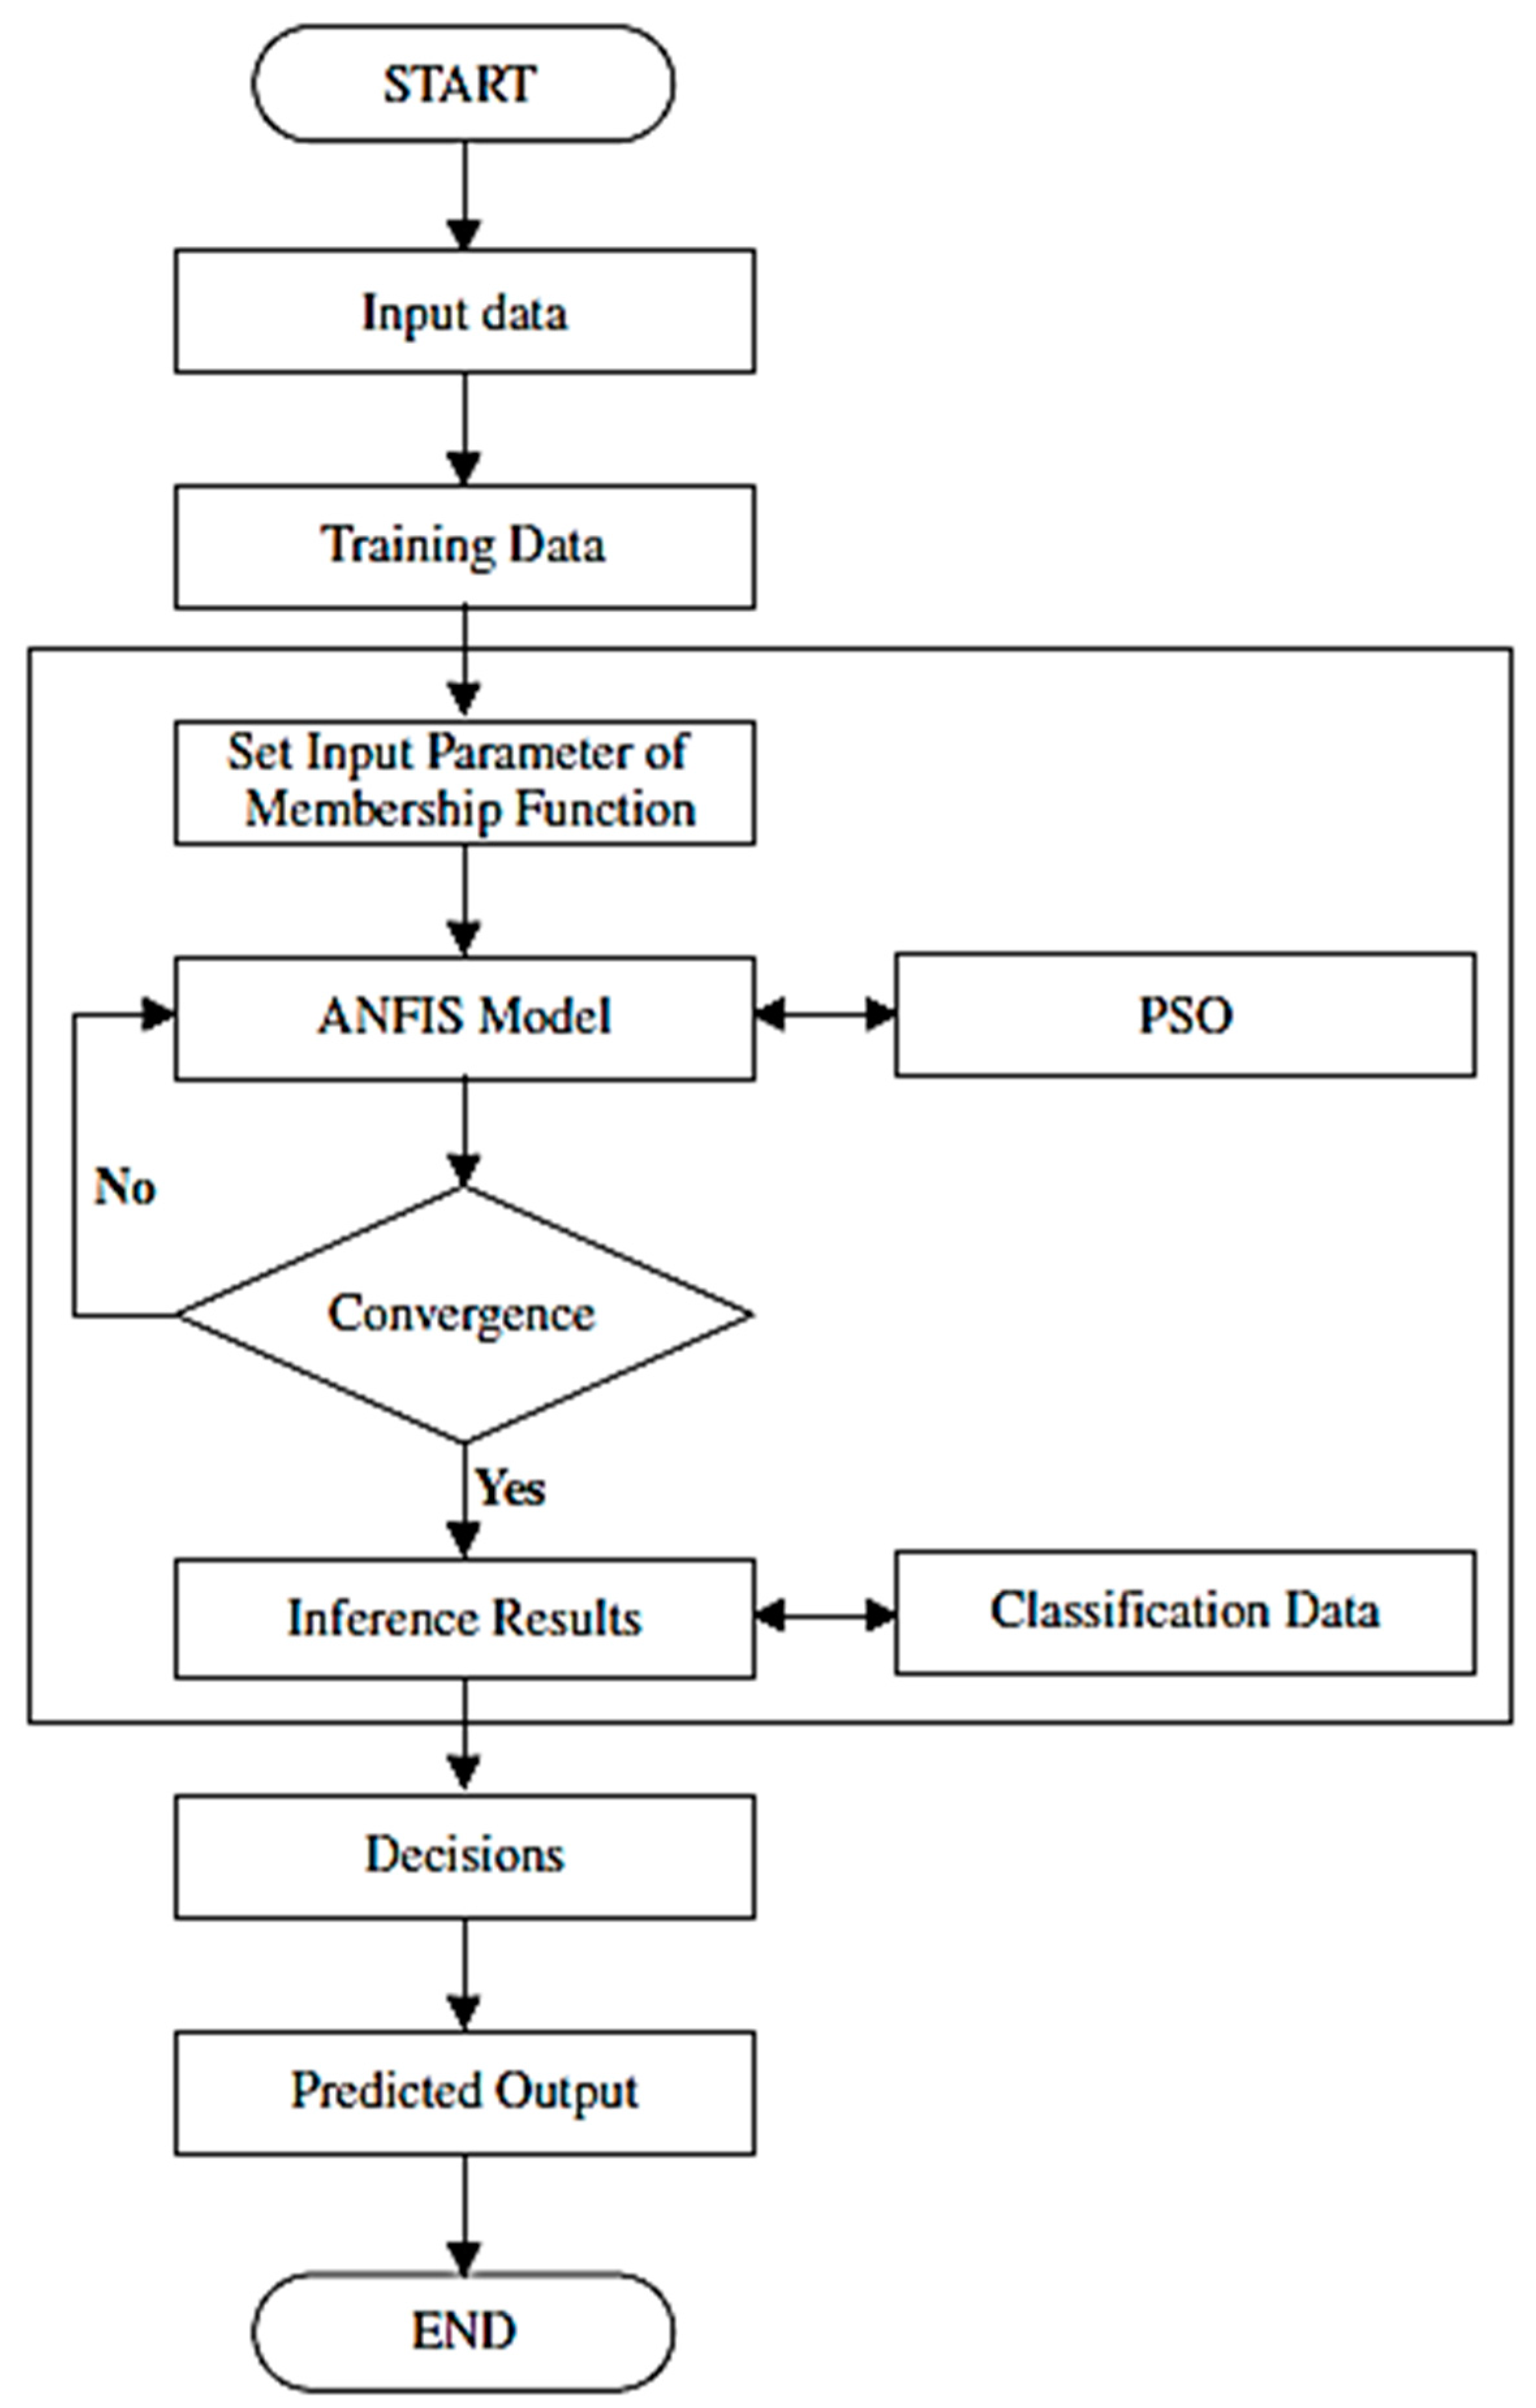
3. Model Development

The description of the hybrid model of the ANFIS-PSO is presented in Reference [37]. Note that, when there is not enough data on the detailed information of an operating power plant, it is extremely difficult to build a precise model to predict the amount of mercury outflow. In the present study, an endeavor was to develop a model to predict mercury outflows from boilers at specified testing locations. In these locations, every single factor that may influence mercury discharge was considered and incorporated into the model. A total number of 82 data points were gathered from the literature to train and evaluate the model [71]. The concentration of mercury in the inlet feed, ash content, chlorine content, the heating value of coal, sulfur content, and temperature were chosen as the most important variables. This data bank comprised a total number of 82 data points, from which 75% were used as training and the rest were exploited as testing samples. In the developed ANFIS model, six previously mentioned parameters were considered as input parameters, and elemental mercury emission was selected as the target variable. Furthermore, the PSO algorithm was used to find the optimized Gaussian membership function parameters of the proposed ANFIS model.
The method of ANFIS was proposed by Jang [98,99] and is a versatile and very intelligent hybrid system. The ANFIS approach can be expressed as a complete collaboration between computing activities and a neuro-fuzzy system [100]. This method integrates natural and neural networks and uses their strength to its advantage. Such a methodology exploits back-propagation calculation from the information gathering process to construct the essential basics of the fuzzy system.
The learning capability of the proposed network structure is a result of the combination of different types of neural networks’ capabilities, where the artificial neural networks (ANN) and fuzzy systems are combined to form a firmly structured network—a neuro-fuzzy system. In addition, they allow a really simple transformation of the whole system into if–then rules, which is one of the greatest advantage of these networks [6]. Its framework is related to an arrangement of fuzzy if–then rules which have the learning ability to estimate non-linear functions. Neuro-fuzzy inference systems have been used in many research activities and there is no doubt that neural-fuzzy combined systems are powerful in many fields. As can be concluded from their name, adaptive networks are constructed from nodes and directed paths, and all I/O values can be modified by different sets of parameters which are defined in the architecture of these networks [6]. On the other hand, ANFIS systems can utilize a various range of algorithms to decrease final errors in the training phase. For instance, the gradient descent approach can be combined with the least squares method to optimize the effectiveness of the search process for the best parameters. The convergence rate of hybrid approaches is too fast because they lower the dimensions of the search space in the backpropagation process [101].
The basics of the ANFIS method are approximately similar to a fuzzy system developed by Takagi, Sugeno, and Kang [102,103]. In the reverse spread learning capability of the ANFIS method, which is based on the calculation of the derivatives of squared errors in a backwards manner from output nodes to the input ones, a robust learning methodology based on a gradient least squares approach is constructed and utilized. To determine the consequence factors in the forward section, a least squares approach is utilized. Then, the preset parameters are reset by gradient descent in the regressive advance [104]. The adaptive network is constructed of five layers. Figure 1 shows these layers, their nodes, and connections with the assumption of two inputs into the fuzzy inference system expressed by “x” and ”y” and a single output of “f”. As an explanation of the configuration of ANFIS, it must be noted that two fuzzy ‘if–then’ rules were utilized which follow Sugeno FIS as:
f 1 = P 1 + q 1 y + r 1 , assume   x = A 1 , y = B 1 f 2 = P 2 + q 2 y + r 2 , assume   x = A 1 , y = B 1
The fuzzification layer, which is the first layer of the structure, produces all the membership grades for each variable. The node functions in this layer can be defined as follows:
O 1 , i = μ A i ( x )     i = 1 , 2
O 1 , j = μ B j ( x )     j = 1 , 2
The memberships of a fuzzy set are (Ai, Bi) and O1,i represents the resultant value from the ith node of the first layer. The input signals are generated by the nodes in layer 2.
O 2 , i = W i = μ A i ( x ) × μ B i ( x )    i = 1 , 2
The nodes of the third layer are used to compute the following parameter:
O 3 , i = w ¯ = W i W 1 + W 2     i = 1 , 2
where Wi is ruled by the firing strengths of node i, which has a normalized firing strength of ωi. The results of layer four can be written as follows:
O 4 , i = w ¯ f i = w ¯ i   ( P i + q i y + r i ) i = 1 , 2
In this notation, pi, qi, and ri are called consequent parameters. Eventually, the general output can be defined as follows, which is calculated in the nodes of layer 5:
O 5 , i = i = 1 2 w ¯ i f i = W 1 f 1 + W 2 f 2 W 1 + W 2
Thus, the final output of the ANFIS can be written as follows:
Z = W 1 W 1 + W 2 f 1 + W 2 W 1 + W 2 f 2 + + W n W n 1 + W n f n
In these networks, the combination of back propagation and the least squares approaches will result in faster convergence and more precise values and, as a consequence, a better learning ability. Least squares is very useful in determining the optimized values of the fourth layer which are called consequent parameters. In addition to that, the premise parameters which are located in the first layer must be optimized in order to define the best shape of the membership functions [18]. These parameters are optimized with respect to the output errors which must be minimized using the back propagation method [105].
The ANFIS has shown promising results in a wide range of applications for developing prediction models [106,107,108]. However, optimization of the model parameters can dramatically improve the quality and accuracy of modeling [78]. For that matter, a huge number of optimization methodologies, such as PSO, are available to reinforce the parameters and outputs of the ANFIS system [109]. Particle swarm optimization is extraordinary compared to other approaches with the end goal of optimization. This study opted for the benefits of this algorithm.
The PSO method was inspired by the behavior of birds seeking food [110,111]. In this model, particles update their positions and pathways based on their and others’ information; thus, it was proposed that the particle possesses a memory function. The optimization process is based on competition and collaboration among particles. When PSO is used to solve optimization problems, one can follow the particles’ states by their pathways and velocities.
Three vectors, Xi, Vi, and Pbesti, explain the properties of a particle: Xi is the current place; Vi, the current speed; and Pbesti, the best spatial placement sought by the particle and gbesti is the optimal solution searched for by the whole group of particles. The position and pathway of a particle will be updated gradually, based on the following formula:
v ( k + 1 ) = v ( k ) + c 1 r a n d ( 0 , 1 ) × [ p b e s t ( k ) p e r s e n t ( k ) ] + c 2 r a n d ( 0 , 1 ) × [ g b e s t ( k ) p e r s e n t ( k ) ]
p r e s e n t ( k + 1 ) = p r e s e n t ( k ) + v ( k + 1 )
where, v(·) is the particle speed in the kth and (k + 1)th iterations; present (·) is the particle position; c1 and c2 are the learning constants which are greater than zero, and a random number between [0, 1] is denoted using rand(·). Formula (7) represents the process to update a particle’s speed, which includes a particle’s historical velocities and personal and global best positions [112].
A diagram of the ANFIS-PSO approach is shown in Figure 2. A further detailed description and more information on the ANFIS-PSO is provided by Basser et al. [78]. Accordingly, a developed model for an estimation case was created based on the following three steps:
  • A dataset was partitioned into different clusters via kernel-based clustering approaches;
  • The cluster centers obtained from clustering were applied to create the fuzzy rule base of the ANFIS;
  • The resulting ANFIS model was trained using the PSO method.
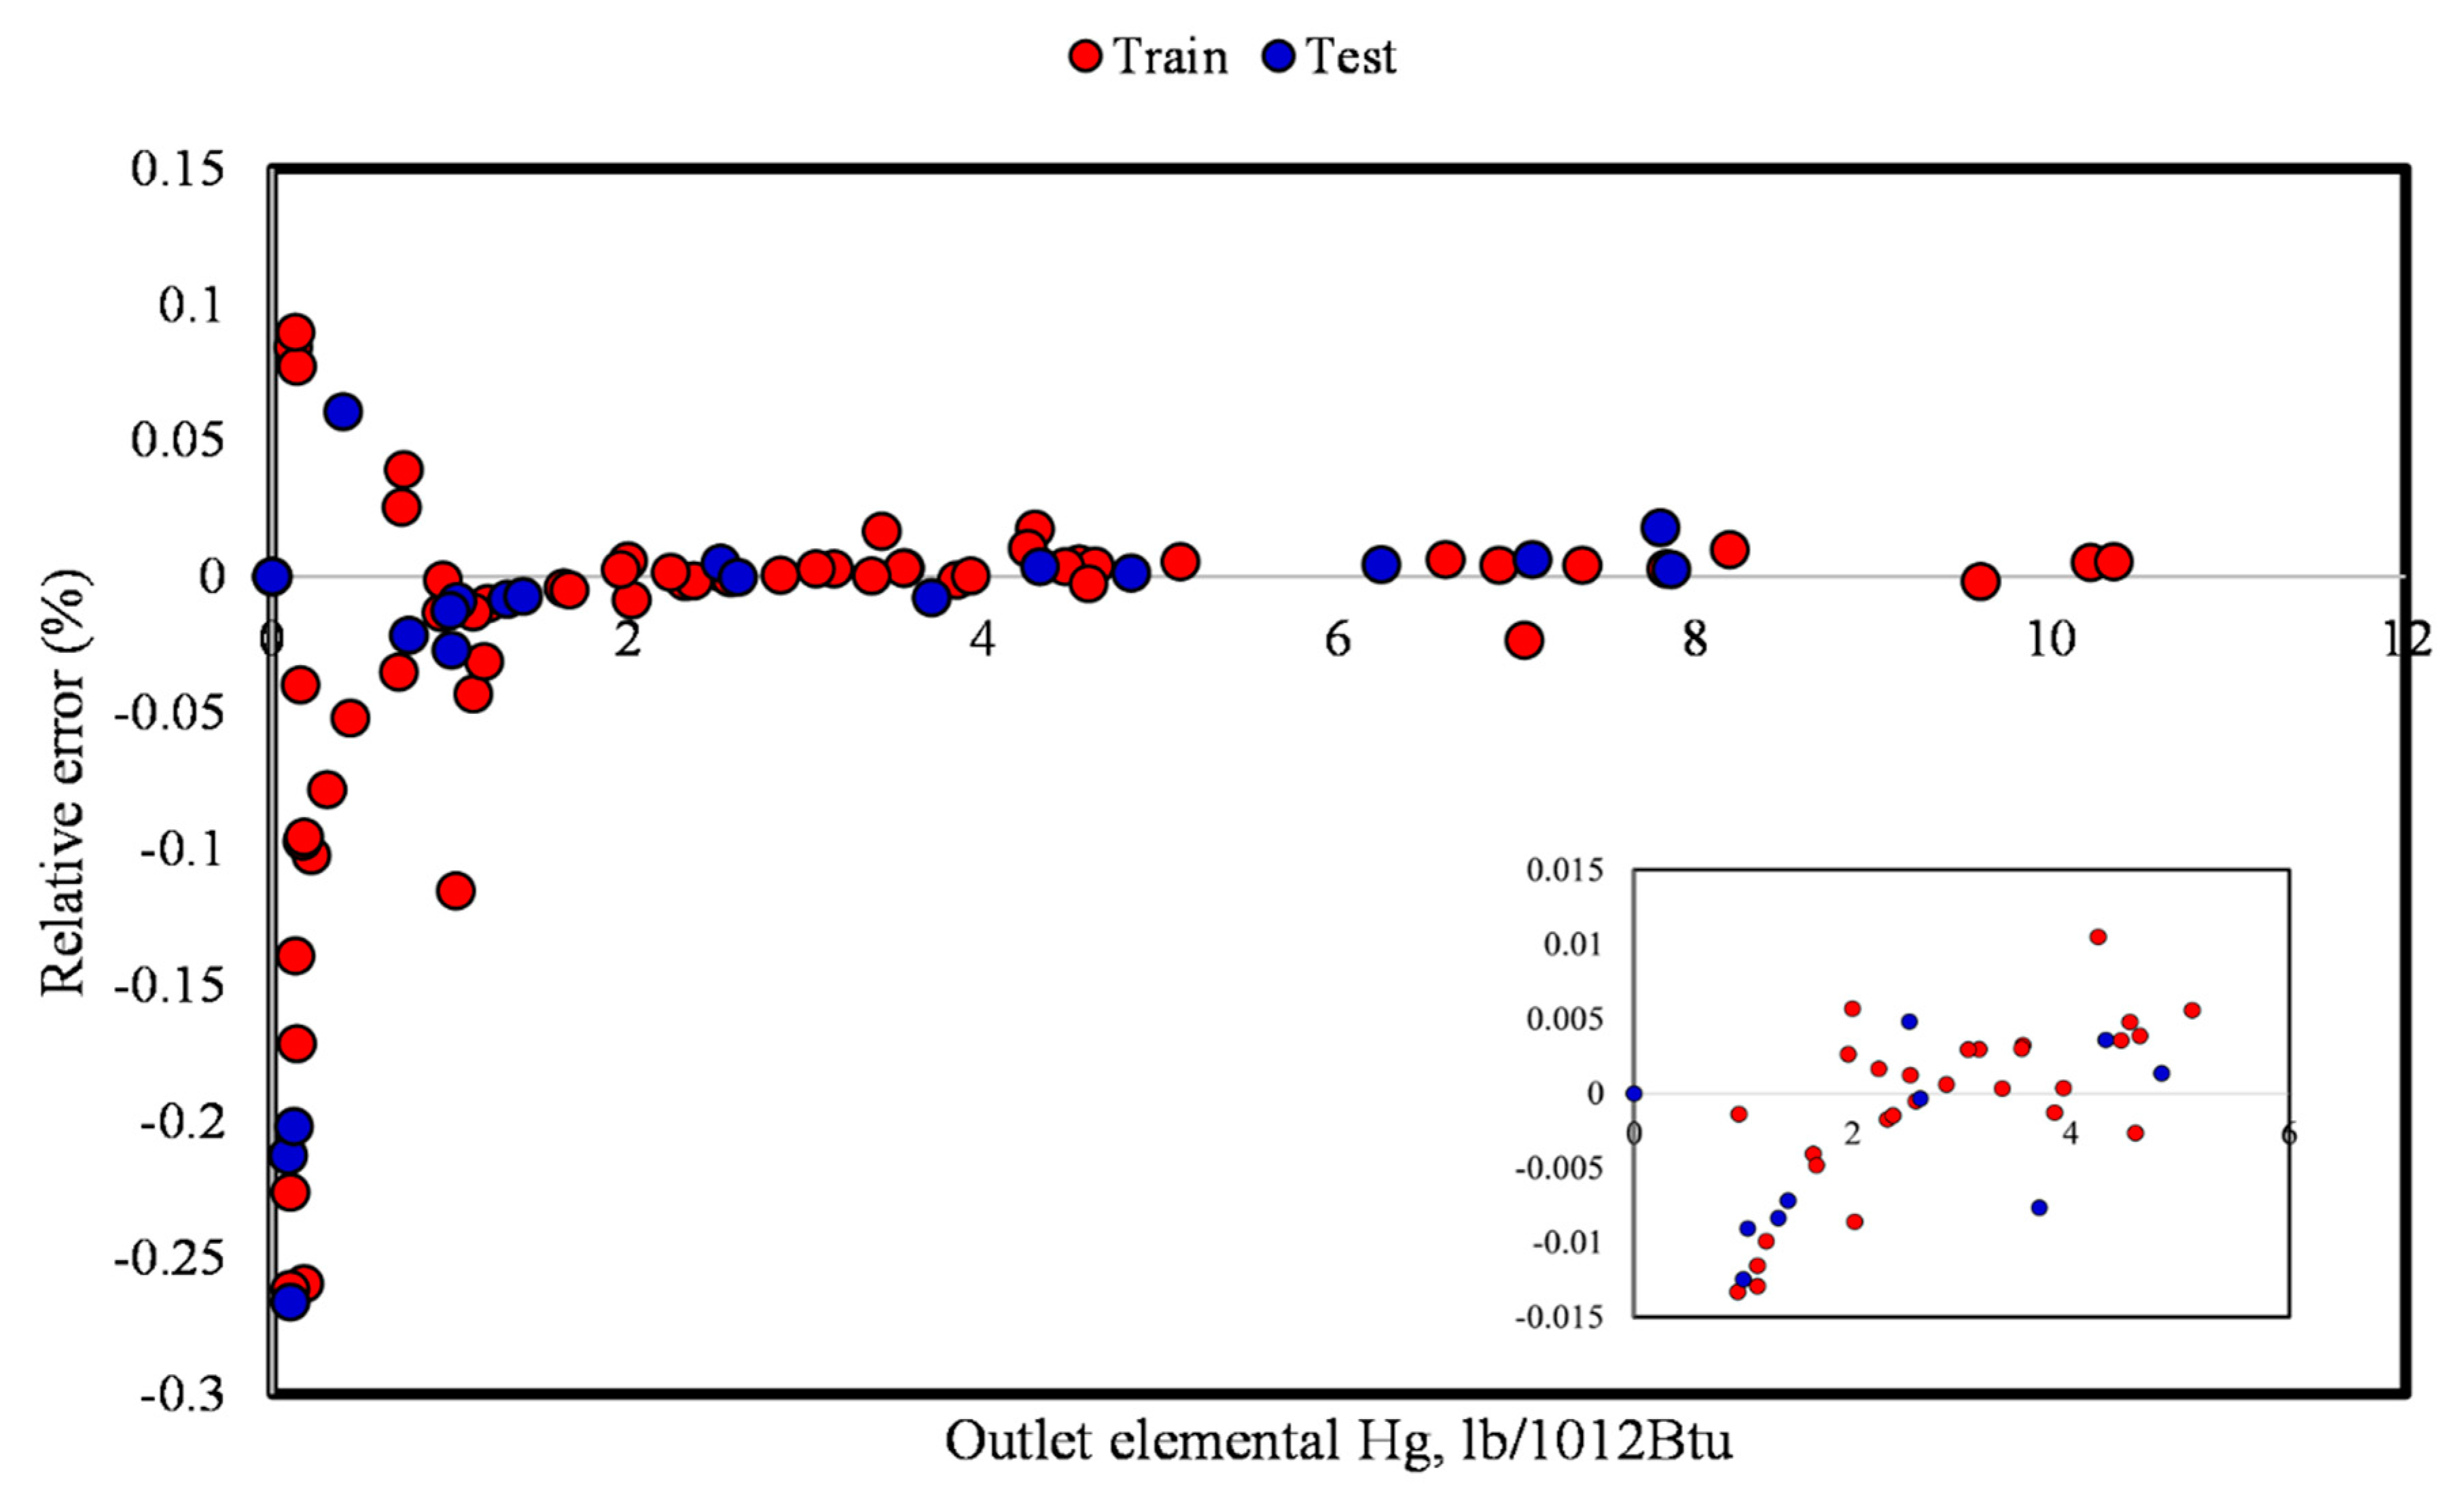
4. Results

The amount of mercury emissions was estimated using an ANFIS approach. The emission of mercury into the environment is generally a strong function of mercury’s six previously mentioned variables. We used MATLAB software to construct our model. A Gaussian function was used to optimize the parameters. In addition, a total number of 10 clusters were utilized in the ANFIS hybrid system. Optimization was conducted on a total number of parameters that were determined by:
N T = N c N n N m f
where the number of parameters for optimization is denoted by NT, Nmf is used to show the number of Gaussian membership functions, and Nυ and Nc show how many variables and clusters are used in the model, respectively. It is noteworthy to state that in this study, Gaussian membership function, seven input and output variables, and 10 clusters were used. Data were divided into defined clusters and, following this, cluster centers were calculated and used to construct the fuzzy base of the ANFIS approach. Eventually, using a PSO algorithm, optimization was conducted for 140 tuning parameters. As is shown in Figure 3, to evaluate the functionality of the PSO algorithm, a root mean square error (RMSE) analysis was used. The results show that with a total number of 1000 iterations, the minimum value of the RMSE was reached. Figure 4 indicates the trained membership function parameters for each input variable. It can be seen that the results of the presented model were in good agreement with the obtained data, which is the result of the great learning capability of the developed ANFIS model. Figure 5 illustrates the obtained data on mercury emissions versus the testing and training of the ANFIS hybrid system.
A scatter diagram is a straightforward statistical technique used to indicate a relationship between two parameters. It is frequently joined with a simple linear regression line used to fit a model between the two parameters. As is shown in Figure 6, actual and predicted mercury emissions are located on a straight line with an approximate slope of 1 (45° line), which indicates that the obtained information and the ANFIS predicted data are in good agreement. The obtained cross-fit line in both the testing and training datasets had an R 2 equal to 1, which shows the accuracy of the model. To compare the results of the model and evaluate its precision, the method of mean absolute relative error was used. For the training and testing steps, using the mean absolute relative error percentage (MARE%) method, percentage values of 0.003266 and 0.013272 were calculated, respectively. The resultant relative deviations are presented in Figure 7. Low relative deviations were observed due to the accurately predicted values. Different statistical analyses are also presented in Table 1 for the suggested model.

5. Conclusions

The emission of mercury is known as one of the most perilous environmental contaminations. In this study, a comprehensive literature review was conducted and a model was built to predict the amount of mercury emissions based on the characteristics of the coal supply, operational conditions, etc. The presented model was based on the ANFIS system, which utilizes a PSO algorithm to estimate the amount of mercury emissions into the environment. Eighty-two data points from power plants were used to train and develop the ANFIS model. Optimized corresponding membership functions for each of the clusters were separately. Between iterations 0 and 230, a dramatic and very fast decrease in the RMSE values were seen, and the figures stayed relatively stable afterward which reflects that the speed of convergence was relatively high. The percentages of MARE for training and testing were 0.003266 and 0.013272, respectively. Additionally, the MSE figures for the training and testing sections were 10−7 and 10−7, and the resulting values for MRE% of the training and testing sections of the modeling were 0.037 and 0.044, respectively. Furthermore, relative errors between the acquired data and predicted values were between −0.25% and 0.1%, which confirm the accuracy of the ANFIS-PSO model. It was seen that for both the training and testing parts, the coefficient of determination was calculated to equal unity, which reflects the accuracy of the proposed ANFIS-PSO-based model. Due to the acceptable level of accuracy, the proposed hybrid model can be used for intelligent monitoring of mercury emissions as well as a wide range of other air pollutants in real-world applications.

Author Contributions

Conceptualization, modeling, data curation, data analysis, and analysis of results, S.S., M.H., A.B., and A.M.; machine learning and soft computing expertise, S.S., M.H., A.B., A.M., J.B., and A.R.V.-K.; mathematics expertise, M.H., A.B., and J.B.; management, database, writing, administration, and methodology, M.H., A.B.; visualization, M.H. and A.B.; supervision, resources, software, expertise, revision, funding, and verification of the results, J.B. and A.R.V.-K.

Funding

This publication was funded by the project: “Support of research and development activities of the J. Selye University in the field of Digital Slovakia and creative industry” of the Research & Innovation Operational Programme (ITMS code: NFP313010T504) co-funded by the European Regional Development Fund.

Acknowledgments

This publication was supported by the project: “Support of research and development activities of the J. Selye University in the field of Digital Slovakia and creative industry” of the Research & Innovation Operational Programme (ITMS code: NFP313010T504) co-funded by the European Regional Development Fund.

Conflicts of Interest

The authors declare no conflict of interest.

References

  1. Feng, Y.; Wang, X.; Du, W.; Liu, J. Effects of air pollution control on urban development quality in Chinese cities based on spatial durbin model. Int. J. Environ. Res. Public Health 2018, 15, 2822. [Google Scholar] [CrossRef] [PubMed]
  2. Paramesh, H. Air Pollution and Allergic Airway Diseases: Social Determinantsand Sustainability in the Control and Prevention. Indian J. Pediatr. 2018, 85, 284–294. [Google Scholar] [CrossRef]
  3. Wang, J.; Fang, Y. Status, fiscal and taxation policy adjustment of air pollution in China. Nat. Environ. Pollut. Technol. 2018, 17, 917–924. [Google Scholar]
  4. Appiah, K.; Du, J.; Yeboah, M.; Appiah, R. Causal correlation between energy use and carbon emissions in selected emerging economies—Panel model approach. Environ. Sci. Pollut. Res. 2019, 26, 7896–7912. [Google Scholar] [CrossRef] [PubMed]
  5. Cui, Y.; Jiang, L.; Zhang, W.; Bao, H.; Geng, B.; He, Q.; Zhang, L.; Streets, D.G. Evaluation of China’s environmental pressures based on satellite NO2 observation and the extended STIRPAT model. Int. J. Environ. Res. Public Health 2019, 16, 1487. [Google Scholar] [CrossRef]
  6. Ye, L.; Ou, X. Spatial-temporal Analysis of Daily Air Quality Index in the Yangtze River Delta Region of China during 2014 and 2016. Chin. Geogr. Sci. 2019, 29, 382–393. [Google Scholar] [CrossRef]
  7. Moghim, S.; Garna, R.K. Countries’ classification by environmental resilience. J. Environ. Manag. 2019, 230, 345–354. [Google Scholar] [CrossRef]
  8. Xu, S.C.; Miao, Y.M.; Gao, C.; Long, R.Y.; Chen, H.; Zhao, B.; Wang, S.X. Regional differences in impacts of economic growth and urbanization on air pollutants in China based on provincial panel estimation. J. Clean. Prod. 2019, 208, 340–352. [Google Scholar] [CrossRef]
  9. Hong, E.; Lee, S.; Kim, G.B.; Kim, T.J.; Kim, H.W.; Lee, K.; Son, B.S. Effects of environmental air pollution on pulmonary function level of residents in Korean industrial complexes. Int. J. Environ. Res. Public Health 2018, 15, 834. [Google Scholar] [CrossRef]
  10. Jirik, V.; Brezna, B.; Machaczka, O.; Honkysova, S.; Miturova, H.; Janout, V. Associations between air pollution in the industrial and suburban parts of Ostrava city and their use. Environ. Monit. Assess. 2017, 189, 381. [Google Scholar] [CrossRef]
  11. Lyanguzova, I.V. Dynamic trends of heavy metal contents in plants and soil under different industrial air pollution regimes. Russ. J. Ecol. 2017, 48, 311–320. [Google Scholar] [CrossRef]
  12. Oyjinda, P.; Pochai, N. Numerical Simulation to Air Pollution Emission Control near an Industrial Zone. Adv. Math. Phys. 2017, 2017. [Google Scholar] [CrossRef]
  13. Gao, W.; Jiang, W.; Zhou, M. The spatial and temporal characteristics of mercury emission from coal combustion in China during the year 2015. Atmos. Pollut. Res. 2019, 10, 776–783. [Google Scholar] [CrossRef]
  14. Marczak, M.; Budzyń, S.; Szczurowski, J.; Kogut, K.; Burmistrz, P. Active methods of mercury removal from flue gases. Environ. Sci. Pollut. Res. 2019, 26, 8383–8392. [Google Scholar] [CrossRef] [PubMed]
  15. Sung, J.H.; Back, S.K.; Lee, E.S.; Jang, H.N.; Seo, Y.C.; Kang, Y.S.; Lee, M.H. Application of powdered activated carbon coating to fabrics in a hybrid filter to enhance mercury removal. J. Environ. Sci. (China) 2019, 80, 58–65. [Google Scholar] [CrossRef]
  16. Zhao, S.; Pudasainee, D.; Duan, Y.; Gupta, R.; Liu, M.; Lu, J. A review on mercury in coal combustion process: Content and occurrence forms in coal, transformation, sampling methods, emission and control technologies. Prog. Energy Combust. Sci. 2019, 73, 26–64. [Google Scholar] [CrossRef]
  17. Bourtsalas, A.C.; Themelis, N.J. Major sources of mercury emissions to the atmosphere: The U.S. case. Waste Manag. 2019, 85, 90–94. [Google Scholar] [CrossRef]
  18. Budnik, L.T.; Casteleyn, L. Mercury pollution in modern times and its socio-medical consequences. Sci. Total Environ. 2019, 654, 720–734. [Google Scholar] [CrossRef]
  19. Li, X.; Li, Z.; Wu, T.; Chen, J.; Fu, C.; Zhang, L.; Feng, X.; Fu, X.; Tang, L.; Wang, Z.; et al. Atmospheric mercury emissions from two pre-calciner cement plants in Southwest China. Atmos. Environ. 2019, 199, 177–188. [Google Scholar] [CrossRef]
  20. Zhou, H.; Hopke, P.K.; Zhou, C.; Holsen, T.M. Ambient mercury source identification at a New York State urban site: Rochester, NY. Sci. Total Environ. 2019, 650, 1327–1337. [Google Scholar] [CrossRef]
  21. Zhao, S.; Duan, Y.; Chen, L.; Li, Y.; Yao, T.; Liu, S.; Liu, M.; Lu, J. Study on emission of hazardous trace elements in a 350 MW coal-fired power plant. Part 1. Mercury. Environ. Pollut. 2017, 229, 863–870. [Google Scholar] [CrossRef] [PubMed]
  22. Mahavong, K.; Pataranawat, P.; Chinwetkitvanich, S. Mercury contamination in environment surrounding coal-fired power plant. Int. J. Geomate 2017, 12, 71–77. [Google Scholar] [CrossRef]
  23. Amap/Unep. Technical Background Report for the Global Mercury Assessment 2013; Arctic Monitoring and Assessment Programme: Oslo, Norway; UNEP Chemicals Branch: Geneva, Switzerland, 2013. [Google Scholar]
  24. Burmistrz, P.; Kogut, K.; Marczak, M.; Zwoździak, J. Lignites and subbituminous coals combustion in Polish power plants as a source of anthropogenic mercury emission. Fuel Process. Technol. 2016, 152, 250–258. [Google Scholar] [CrossRef]
  25. Alto, P. Power Plants and Mercury, Environmental Issues; Electric Power Research Institute: Palo Alto, CA, USA, 2001. [Google Scholar]
  26. Carpi, A. Mercury from combustion sources: A review of the chemical species emitted and their transport in the atmosphere. Water Air Soil Pollut. 1997, 98, 241–254. [Google Scholar] [CrossRef]
  27. Srivastava, R.K.; Hutson, N.; Martin, B.; Princiotta, F.; Staudt, J.X. Control of mercury emissions from coal-fired electric utility boilers. Environ. Sci. Technol. 2006, 40, 1385–1393. [Google Scholar] [CrossRef]
  28. Zhang, L.; Zhuo, Y.; Chen, L.; Xu, X.; Chen, C. Mercury emissions from six coal-fired power plants in China. Fuel Process. Technol. 2008, 89, 1033–1040. [Google Scholar] [CrossRef]
  29. Streets, D.G.; Zhang, Q.; Wu, Y. Projections of global mercury emissions in 2050. Environ. Sci. Technol. 2009, 43, 2983–2988. [Google Scholar] [CrossRef]
  30. Tian, H.; Wang, Y.; Cheng, K.; Qu, Y.; Hao, J.; Xue, Z.; Chai, F. Control strategies of atmospheric mercury emissions from coal-fired power plants in China. J. Air Waste Manag. Assoc. 2012, 62, 576–586. [Google Scholar] [CrossRef]
  31. Tian, H.; Wang, Y.; Xue, Z.; Qu, Y.; Chai, F.; Hao, J. Atmospheric emissions estimation of Hg, As, and Se from coal-fired power plants in China, 2007. Sci. Total Environ. 2011, 409, 3078–3081. [Google Scholar] [CrossRef]
  32. You, C.F.; Xu, X.C. Coal combustion and its pollution control in China. Energy 2010, 35, 4467–4472. [Google Scholar] [CrossRef]
  33. Chen, Z.F.; Young, L.; Yu, C.H.; Shiao, S.P.K. A meta-prediction of Methylenetetrahydrofolate-reductase polymorphisms and air pollution increased the risk of ischemic heart diseases worldwide. Int. J. Environ. Res. Public Health 2018, 15, 1453. [Google Scholar] [CrossRef] [PubMed]
  34. Girguis, M.S.; Li, L.; Lurmann, F.; Wu, J.; Urman, R.; Rappaport, E.; Breton, C.; Gilliland, F.; Stram, D.; Habre, R. Exposure measurement error in air pollution studies: A framework for assessing shared, multiplicative measurement error in ensemble learning estimates of nitrogen oxides. Environ. Int. 2019, 125, 97–106. [Google Scholar] [CrossRef] [PubMed]
  35. Kerckhoffs, J.; Hoek, G.; Portengen, L.; Brunekreef, B.; Vermeulen, R.C.H. Performance of Prediction Algorithms for Modeling Outdoor Air Pollution Spatial Surfaces. Environ. Sci. Technol. 2019, 53, 1413–1421. [Google Scholar] [CrossRef] [PubMed] [Green Version]
  36. Tao, Q.; Liu, F.; Li, Y.; Sidorov, D. Air Pollution Forecasting Using a Deep Learning Model Based on 1D Convnets and Bidirectional GRU. IEEE Access 2019, 7, 76690–76698. [Google Scholar] [CrossRef]
  37. Xiao, D.; Fang, F.; Zheng, J.; Pain, C.C.; Navon, I.M. Machine learning-based rapid response tools for regional air pollution modelling. Atmos. Environ. 2019, 199, 463–473. [Google Scholar] [CrossRef]
  38. Carlos, G.; Valeria, F.; Guillermo, V. Use of non-industrial environmental sensors and machine learning techniques in telemetry for indoor air pollution. ARPN J. Eng. Appl. Sci. 2018, 13, 2702–2712. [Google Scholar]
  39. Eldakhly, N.M.; Aboul-Ela, M.; Abdalla, A. A Novel Approach of Weighted Support Vector Machine with Applied Chance Theory for Forecasting Air Pollution Phenomenon in Egypt. Int. J. Comput. Intell. Appl. 2018, 17. [Google Scholar] [CrossRef]
  40. Martínez-España, R.; Bueno-Crespo, A.; Timón, I.; Soto, J.; Muñoz, A.; Cecilia, J.M. Air-pollution prediction in smart cities through machine learning methods: A case of study in Murcia, Spain. J. Univ. Comput. Sci. 2018, 24, 261–276. [Google Scholar]
  41. Xayasouk, T.; Lee, H. Air pollution prediction system using deep learning. WIT Trans. Ecol. Environ. 2018, 230, 71–79. [Google Scholar] [CrossRef]
  42. Choubin, B.; Borji, M.; Mosavi, A.; Sajedi-Hosseini, F.; Singh, V.P.; Shamshirband, S. Snow avalanche hazard prediction using machine learning methods. J. Hydrol. 2019, 577. [Google Scholar] [CrossRef]
  43. Dineva, A.; Mosavi, A.; Ardabili, S.; Vajda, I.; Shamshirband, S.; Rabczuk, T.; Chau, K.W. Review of soft computing models in design and control of rotating electrical machines. Energies 2019, 12, 49. [Google Scholar] [CrossRef]
  44. Mosavi, A.; Ozturk, P.; Chau, K.W. Flood prediction using machine learning models: Literature review. Water 2018, 10, 1536. [Google Scholar] [CrossRef]
  45. Mosavi, A.; Salimi, M.; Ardabili, S.F.; Rabczuk, T.; Shamshirband, S.; Varkonyi-Koczy, A.R. State of the art of machine learning models in energy systems, a systematic review. Energies 2019, 12, 1301. [Google Scholar] [CrossRef]
  46. Mosavi, A.; Shamshirband, S.; Salwana, E.; Chau, K.W.; Tah, J.H.M. Prediction of multi-inputs bubble column reactor using a novel hybrid model of computational fluid dynamics and machine learning. Eng. Appl. Comput. Fluid Mech. 2019, 13, 482–492. [Google Scholar] [CrossRef]
  47. Qasem, S.N.; Samadianfard, S.; Nahand, H.S.; Mosavi, A.; Shamshirband, S.; Chau, K.W. Estimating daily dew point temperature using machine learning algorithms. Water 2019, 11, 582. [Google Scholar] [CrossRef]
  48. Torabi, M.; Hashemi, S.; Saybani, M.R.; Shamshirband, S.; Mosavi, A. A Hybrid clustering and classification technique for forecasting short-term energy consumption. Environ. Prog. Sustain. Energy 2019, 38, 66–76. [Google Scholar] [CrossRef]
  49. Fan, J.; Wu, L.; Ma, X.; Zhou, H.; Zhang, F. Hybrid support vector machines with heuristic algorithms for prediction of daily diffuse solar radiation in air-polluted regions. Renew. Energy 2020, 145, 2034–2045. [Google Scholar] [CrossRef]
  50. Kaimian, H.; Li, Q.; Wu, C.; Qi, Y.; Mo, Y.; Chen, G.; Zhang, X.; Sachdeva, S. Evaluation of different machine learning approaches to forecasting PM2.5 mass concentrations. Aerosol. Air Qual. Res. 2019, 19, 1400–1410. [Google Scholar] [CrossRef]
  51. Li, C.; Zhu, Z. Research and application of a novel hybrid air quality early-warning system: A case study in China. Sci. Total Environ. 2018, 626, 1421–1438. [Google Scholar] [CrossRef]
  52. Qi, X.; Luo, Y.; Wu, G.; Boriboonsomsin, K.; Barth, M. Deep reinforcement learning enabled self-learning control for energy efficient driving. Transp. Res. Part C Emerg. Technol. 2019, 99, 67–81. [Google Scholar] [CrossRef]
  53. Requia, W.J.; Coull, B.A.; Koutrakis, P. Evaluation of predictive capabilities of ordinary geostatistical interpolation, hybrid interpolation, and machine learning methods for estimating PM2.5 constituents over space. Environ. Res. 2019, 175, 421–433. [Google Scholar] [CrossRef] [PubMed]
  54. Wang, D.; Wei, S.; Luo, H.; Yue, C.; Grunder, O. A novel hybrid model for air quality index forecasting based on two-phase decomposition technique and modified extreme learning machine. Sci. Total Environ. 2017, 580, 719–733. [Google Scholar] [CrossRef] [PubMed]
  55. Chen, K.H.; Yien, J.M.; Chiang, C.H.; Tsai, P.C.; Tsai, F.S. Identifying key sources of city air quality: A hybrid MCDM model and improvement strategies. Appl. Sci. 2019, 9, 1414. [Google Scholar] [CrossRef]
  56. Li, Q.; Wu, J.; Wei, H. Reduction of elemental mercury in coal-fired boiler flue gas with computational intelligence approach. Energy 2018, 160, 753–762. [Google Scholar] [CrossRef]
  57. Metia, S.; Ha, Q.P.; Duc, H.N.; Azzi, M. Estimation of Power Plant Emissions with Unscented Kalman Filter. IEEE J. Sel. Top. Appl. Earth Obs. Remote Sens. 2018, 11, 2763–2772. [Google Scholar] [CrossRef]
  58. Zhang, H.; Deng, Q. Deep learning based fossil-fuel power plant monitoring in high resolution remote sensing images: A comparative study. Remote Sens. 2019, 11, 1117. [Google Scholar] [CrossRef]
  59. Baghban, A.; Ahmadi, M.A.; Shahraki, B.H. Prediction carbon dioxide solubility in presence of various ionic liquids using computational intelligence approaches. J. Supercrit. Fluids 2015, 98, 50–64. [Google Scholar] [CrossRef]
  60. Frontalini, F.; Greco, M.; Di Bella, L.; Lejzerowicz, F.; Reo, E.; Caruso, A.; Cosentino, C.; Maccotta, A.; Scopelliti, G.; Nardelli, M.P.; et al. Assessing the effect of mercury pollution on cultured benthic foraminifera community using morphological and eDNA metabarcoding approaches. Mar. Pollut. Bull. 2018, 129, 512–524. [Google Scholar] [CrossRef]
  61. Ahn, S.J.; Kim, L.; Kwon, O. Korea’s social dynamics towards power supply and air pollution caused by electric vehicle diffusion. J. Clean. Prod. 2018, 205, 1042–1068. [Google Scholar] [CrossRef]
  62. Dhammapala, R. Analysis of fine particle pollution data measured at 29 US diplomatic posts worldwide. Atmos. Environ. 2019, 213, 367–376. [Google Scholar] [CrossRef]
  63. Gong, J.W.; Li, Y.P.; Suo, C. Full-infinite interval two-stage credibility constrained programming for electric power system management by considering carbon emission trading. Int. J. Electr. Power Energy Syst. 2019, 105, 440–453. [Google Scholar] [CrossRef]
  64. Song, J.; Romero, C.E.; Yao, Z.; He, B. A globally enhanced general regression neural network for on-line multiple emissions prediction of utility boiler. Knowl. Based Syst. 2017, 118, 4–14. [Google Scholar] [CrossRef]
  65. Jha, S.K.; Bilalovikj, J. Short-term wind speed prediction at Bogdanci power plant in FYROM using an artificial neural network. Int. J. Sustain. Energy 2019, 38, 526–541. [Google Scholar] [CrossRef]
  66. Lee, C.Y.; Wang, K. Nash marginal abatement cost estimation of air pollutant emissions using the stochastic semi-nonparametric frontier. Eur. J. Oper. Res. 2019, 273, 390–400. [Google Scholar] [CrossRef]
  67. Leung, W.H.; Ma, W.M.; Chan, P.K.Y. Nuclear accident consequence assessment in Hong Kong using JRODOS. J. Environ. Radioact. 2018, 183, 27–36. [Google Scholar] [CrossRef]
  68. Liu, K.; Liu, T.Z.; Jian, P.; Lin, Y. The re-optimization strategy of multi-layer hybrid building’s cooling and heating load soft sensing technology research based on temperature interval and hierarchical modeling techniques. Sustain. Cities Soc. 2018, 38, 42–54. [Google Scholar] [CrossRef]
  69. Mlakar, P.; Božnar, M.Z.; Grašič, B.; Breznik, B. Integrated system for population dose calculation and decision making on protection measures in case of an accident with air emissions in a nuclear power plant. Sci. Total Environ. 2019, 666, 786–800. [Google Scholar] [CrossRef]
  70. Dragomir, E.G.; Oprea, M.J.I.P.V. A Multi-Agent System for Power Plants Air Pollution Monitoring. IFAC Proc. Vol. 2013, 46, 89–94. [Google Scholar] [CrossRef]
  71. Jensen, R.R.; Karki, S.; Salehfar, H. Artificial neural network-based estimation of mercury speciation in combustion flue gases. Fuel Process. Technol. 2004, 85, 451–462. [Google Scholar] [CrossRef]
  72. Antanasijević, D.Z.; Pocajt, V.V.; Povrenović, D.S.; Ristić, M.Đ.; Perić-Grujić, A.A. PM10 emission forecasting using artificial neural networks and genetic algorithm input variable optimization. J. Sci. Total Environ. 2013, 443, 511–519. [Google Scholar] [CrossRef]
  73. Zhao, B.; Zhang, Z.; Jin, J.; Pan, W.P. Modeling mercury speciation in combustion flue gases using support vector machine: Prediction and evaluation. J. Hazard. Mater. 2010, 174, 244–250. [Google Scholar] [CrossRef] [PubMed]
  74. Wang, F.; Tian, G.; Wang, X.; Liu, Y.; Deng, S.; Wang, H.; Zhang, F. Application of genetic algorithm-back propagation for prediction of mercury speciation in combustion flue gas. Clean Technol. Environ. Policy 2016, 18, 1211–1218. [Google Scholar] [CrossRef]
  75. Choubin, B.; Abdolshahnejad, M.; Moradi, E.; Querol, X.; Mosavi, A.; Shamshirband, S.; Ghamisi, P. Spatial hazard assessment of the PM10 using machine learning models in Barcelona, Spain. Sci. Total Environ. 2019, 134474. [Google Scholar] [CrossRef]
  76. Ardabili, S.F.; Najafi, B.; Alizamir, M.; Mosavi, A.; Shamshirband, S.; Rabczuk, T. Using SVM-RSM and ELM-RSM approaches for optimizing the production process of methyl and ethyl esters. Energies 2018, 11, 2889. [Google Scholar] [CrossRef]
  77. Torabi, M.; Mosavi, A.; Ozturk, P.; Varkonyi-Koczy, A.; Istvan, V. A Hybrid Machine Learning Approach for Daily Prediction of Solar Radiation. In Lecture Notes in Networks and Systems; Springer: New York, NY, USA, 2019; Volume 53, pp. 266–274. [Google Scholar]
  78. Basser, H.; Karami, H.; Shamshirband, S.; Akib, S.; Amirmojahedi, M.; Ahmad, R.; Jahangirzadeh, A.; Javidnia, H. Hybrid ANFIS-PSO approach for predicting optimum parameters of a protective spur dike. Appl. Soft Comput. J. 2015, 30, 642–649. [Google Scholar] [CrossRef]
  79. Catalão, J.P.S.; Pousinho, H.M.I.; Mendes, V.M.F. Hybrid wavelet-PSO-ANFIS approach for short-term electricity prices forecasting. IEEE Trans. Power Syst. 2011, 26, 137–144. [Google Scholar] [CrossRef]
  80. Catalão, J.P.S.; Pousinho, H.M.I.; Mendes, V.M.F. Hybrid wavelet-PSO-ANFIS approach for short-term wind power forecasting in Portugal. IEEE Trans. Sustain. Energy 2011, 2, 50–59. [Google Scholar] [CrossRef]
  81. Anemangely, M.; Ramezanzadeh, A.; Tokhmechi, B. Shear wave travel time estimation from petrophysical logs using ANFIS-PSO algorithm: A case study from Ab-Teymour Oilfield. J. Nat. Gas Sci. Eng. 2017, 38, 373–387. [Google Scholar] [CrossRef]
  82. Atuahene, S.; Bao, Y.; Yevenyo Ziggah, Y.; Semwaah Gyan, P.; Li, F. Short-term electric power forecasting using dual-stage hierarchical wavelet-Particle swarm optimization-Adaptive neuro-fuzzy inference system pso-ANFIS approach based on climate change. Energies 2018, 11, 2822. [Google Scholar] [CrossRef]
  83. Banashooshtari, H.; Ashtari Larki, S.; Shokrollahzadeh Behbahani, H. A PSO-ANFIS framework for prediction of density of bitumen diluted with solvents. Pet. Sci. Technol. 2018, 36, 122–129. [Google Scholar] [CrossRef]
  84. Ceylan, Z.; Pekel, E.; Ceylan, S.; Bulkan, S. Biomass higher heating value prediction analysis by ANFIS, PSO-ANFIS and GA-ANFIS. Glob. Nest J. 2018, 20, 589–597. [Google Scholar] [CrossRef]
  85. Chu, Z.Q.; Sasanipour, J.; Saeedi, M.; Baghban, A.; Mansoori, H. Modeling of wax deposition produced in the pipelines using PSO-ANFIS approach. Pet. Sci. Technol. 2017, 35, 1974–1981. [Google Scholar] [CrossRef]
  86. Darvish, H.; Rahmani, S.; Maleki Sadeghi, A.; Emami Baghdadi, M.H. The ANFIS-PSO strategy as a novel method to predict interfacial tension of hydrocarbons and brine. Pet. Sci. Technol. 2018, 36, 654–659. [Google Scholar] [CrossRef]
  87. Djavareshkian, M.H.; Esmaeili, A. Heuristic optimization of submerged hydrofoil using ANFIS-PSO. Ocean Eng. 2014, 92, 55–63. [Google Scholar] [CrossRef]
  88. Esfandyari, M.; Esfandyari, M.; Jafari, D. Prediction of thiophene removal from diesel using [BMIM][AlCl4] in EDS Process: GA-ANFIS and PSO-ANFIS modeling. Pet. Sci. Technol. 2018, 36, 1305–1311. [Google Scholar] [CrossRef]
  89. Isazadeh, G.; Hooshmand, R.A.; Khodabakhshian, A. Modeling and optimization of an adaptive dynamic load shedding using the ANFIS-PSO algorithm. Simulation 2012, 88, 181–196. [Google Scholar] [CrossRef]
  90. Keybondorian, E.; Taherpour, A.; Bemani, A.; Hamule, T. Application of novel ANFIS-PSO approach to predict asphaltene precipitation. Pet. Sci. Technol. 2018, 36, 154–159. [Google Scholar] [CrossRef]
  91. Liu, Z.; Zhang, D.; Peng, W. A Novel ANFIS-PSO Network for forecasting oil flocculated asphaltene weight percentage at wide range of operation conditions. Pet. Sci. Technol. 2018, 36, 1044–1050. [Google Scholar] [CrossRef]
  92. Malmir, P.; Suleymani, M.; Bemani, A. Application of ANFIS-PSO as a novel method to estimate effect of inhibitors on Asphaltene precipitation. Pet. Sci. Technol. 2018, 36, 597–603. [Google Scholar] [CrossRef]
  93. Mir, M.; Kamyab, M.; Lariche, M.J.; Bemani, A.; Baghban, A. Applying ANFIS-PSO algorithm as a novel accurate approach for prediction of gas density. Pet. Sci. Technol. 2018, 36, 820–826. [Google Scholar] [CrossRef]
  94. Pousinho, H.M.I.; Mendes, V.M.F.; Catalão, J.P.S. Short-term electricity prices forecasting in a competitive market by a hybrid PSO-ANFIS approach. Int. J. Electr. Power Energy Syst. 2012, 39, 29–35. [Google Scholar] [CrossRef]
  95. Rezakazemi, M.; Dashti, A.; Asghari, M.; Shirazian, S. H2-selective mixed matrix membranes modeling using ANFIS, PSO-ANFIS, GA-ANFIS. Int. J. Hydrog. Energy 2017, 42, 15211–15225. [Google Scholar] [CrossRef]
  96. Salisu, S.; Mustafa, M.W.; Mustapha, M.; Mohammed, O.O. Solar radiation forecasting in Nigeria based on hybrid PSO-ANFIS and WT-ANFIS approach. Int. J. Electr. Comput. Eng. 2019, 9, 3916–3926. [Google Scholar] [CrossRef]
  97. Suleymani, M.; Bemani, A. Application of ANFIS-PSO algorithm as a novel method for estimation of higher heating value of biomass. Energy Sources Recover. Util. Environ. Eff. 2018, 40, 288–293. [Google Scholar] [CrossRef]
  98. Roger, J.J.S. ANFIS: Adaptive-network-based fuzzy inference system. IEEE Trans. Syst. ManCybern. 1993, 23, 665–685. [Google Scholar]
  99. Jang, J.S.R. Fuzzy Modeling Using Generalized Neural Networks and Kalman Filter Algorithm. AAAI 1991, 91, 762–767. [Google Scholar]
  100. Baghban, A. Application of the ANFIS strategy to estimate vaporization enthalpies of petroleum fractions and pure hydrocarbons. Pet. Sci. Technol. 2016, 34, 1359–1366. [Google Scholar] [CrossRef]
  101. Hamdan, H.; Garibaldi, J.M. Adaptive neuro-fuzzy inference system (ANFIS) in modelling breast cancer survival. In Proceedings of the International Conference on Fuzzy Systems, Barcelona, Spain, 18–23 July 2010; pp. 1–8. [Google Scholar]
  102. Takagi, T.; Sugeno, M. Fuzzy identification of systems and its applications to modeling and control. Trans. Syst. Man Cybern. 1985, SMC-15, 116–132. [Google Scholar] [CrossRef]
  103. Sugeno, M.; Kang, G.T. Structure identification of fuzzy model. Fuzzy Sets Syst. 1988, 28, 15–33. [Google Scholar] [CrossRef]
  104. Baghban, A.; Bahadori, M.; Ahmad, Z.; Kashiwao, T.; Bahadori, A. Modeling of true vapor pressure of petroleum products using ANFIS algorithm. Pet. Sci. Technol. 2016, 34, 933–939. [Google Scholar] [CrossRef]
  105. Walia, N.; Singh, H.; Sharma, A. ANFIS: Adaptive neuro-fuzzy inference system-a survey. Int. J. Comput. Appl. 2015, 123, 32–38. [Google Scholar] [CrossRef]
  106. Dehghani, M.; Riahi-Madvar, H.; Hooshyaripor, F.; Mosavi, A.; Shamshirband, S.; Zavadskas, E.K.; Chau, K.W. Prediction of hydropower generation using Grey wolf optimization adaptive neuro-fuzzy inference system. Energies 2019, 12, 289. [Google Scholar] [CrossRef]
  107. Choubin, B.; Moradi, E.; Golshan, M.; Adamowski, J.; Sajedi-Hosseini, F.; Mosavi, A. An ensemble prediction of flood susceptibility using multivariate discriminant analysis, classification and regression trees, and support vector machines. Sci. Total Environ. 2019, 651, 2087–2096. [Google Scholar] [CrossRef] [PubMed]
  108. Rezakazemi, M.; Mosavi, A.; Shirazian, S. ANFIS pattern for molecular membranes separation optimization. J. Mol. Liq. 2019, 274, 470–476. [Google Scholar] [CrossRef]
  109. Baghban, A.; Kashiwao, T.; Bahadori, M.; Ahmad, Z.; Bahadori, A. Estimation of natural gases water content using adaptive neuro-fuzzy inference system. Pet. Sci. Technol. 2016, 34, 891–897. [Google Scholar] [CrossRef]
  110. Chen, G.; Huang, X.; Jia, J.; Min, Z. Natural exponential inertia weight strategy in particle swarm optimization. In Proceedings of the 2006 6th World Congress on Intelligent Control and Automation, Dalian, China, 21–23 June 2006; pp. 3672–3675. [Google Scholar]
  111. El-Gallad, A.; El-Hawary, M.; Sallam, A.; Kalas, A. Enhancing the particle swarm optimizer via proper parameters selection. In Proceedings of the IEEE CCECE2002. Canadian Conference on Electrical and Computer Engineering: Conference Proceedings (Cat. No. 02CH37373), Winnipeg, MB, Canada, 12–15 May 2002; pp. 792–797. [Google Scholar]
  112. Meng, X.; Pian, Z. Intelligent Coordinated Control of Complex Uncertain Systems for Power Distribution and Network Reliability; Elsevier: Amsterdam, The Netherlands, 2015. [Google Scholar]
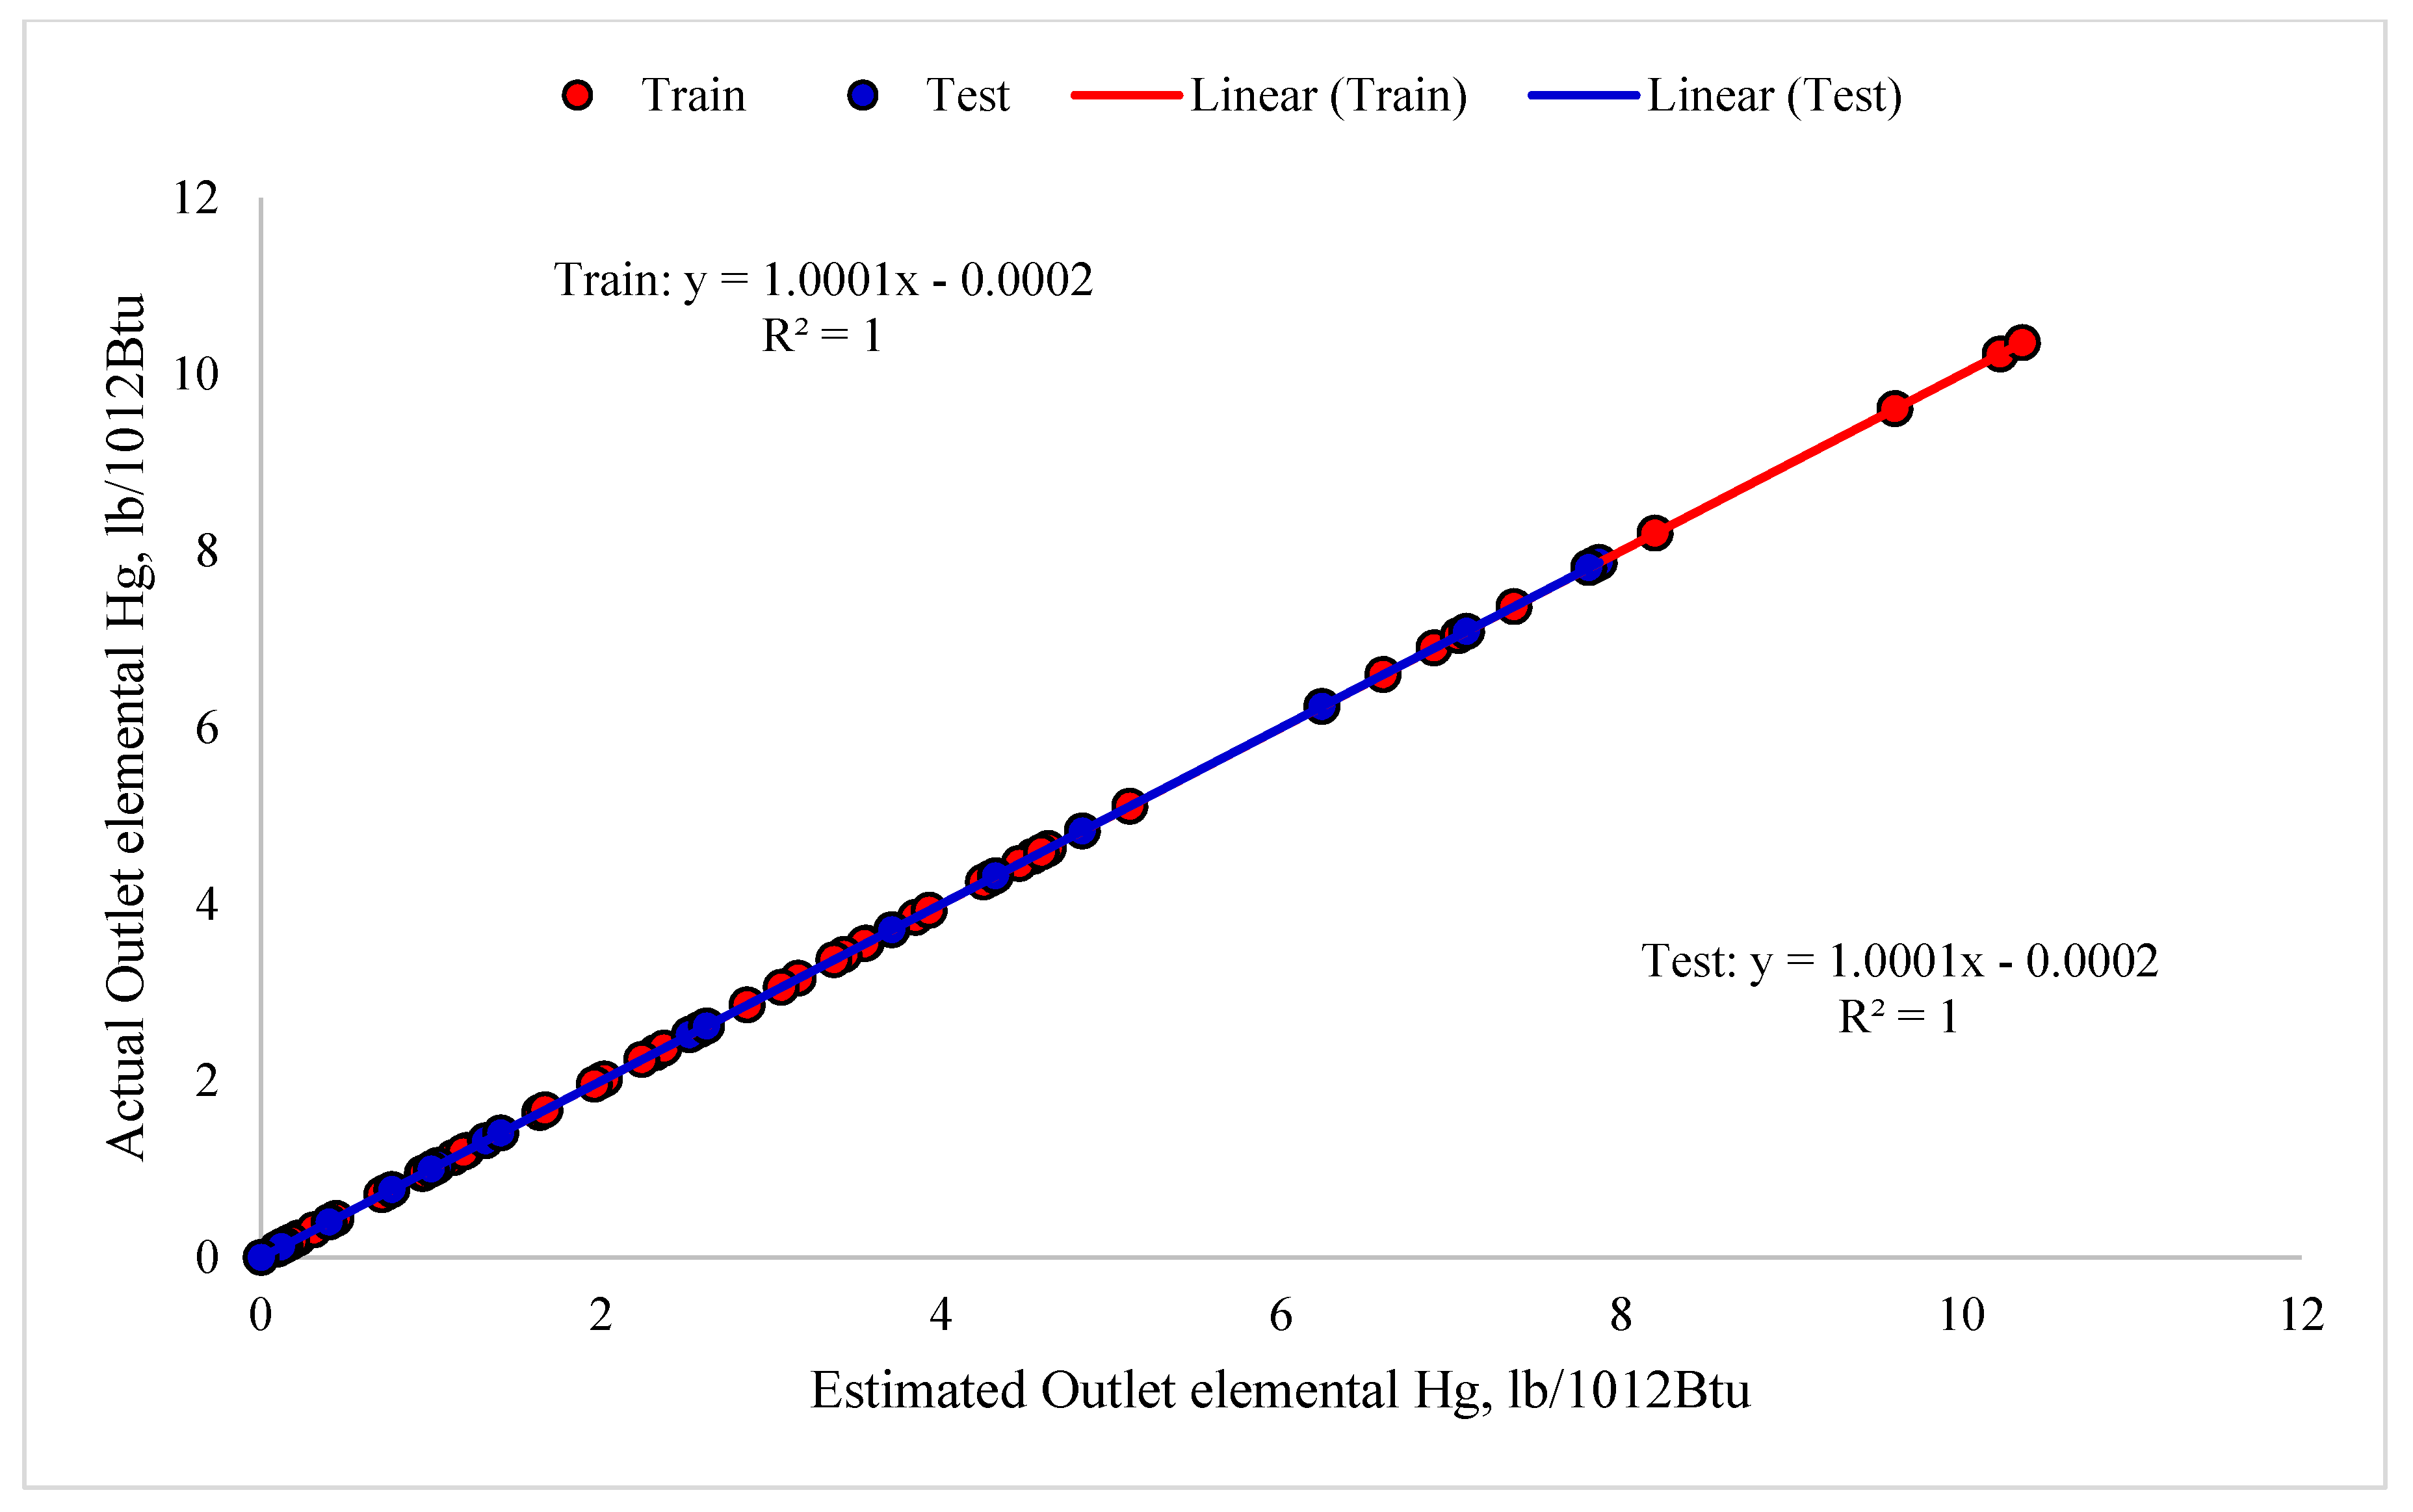
Figure 1. A schematic view of the intelligent adaptive neuro-fuzzy inference system (ANFIS).
Mathematics 07 00965 g001
Figure 2. Diagram of the optimized ANFIS structure using the particle swarm optimization (PSO) algorithm (ANFIS-PSO).
Mathematics 07 00965 g002
Figure 3. Root mean square errors versus the number of iterations.
Mathematics 07 00965 g003
Figure 4. Trained membership function parameters.
Mathematics 07 00965 g004
Figure 5. Obtained data from the plants and the ANFIS values for mercury emissions during the stages of training and testing.
Mathematics 07 00965 g005
Figure 6. Regressions derived between the estimated and collected data on mercury emissions.
Mathematics 07 00965 g006
Figure 7. The deviation between the obtained data from plants and predicted mercury emissions.
Mathematics 07 00965 g007
Table 1. Statistical analysis of the model for all phases.
Evaluation MetricsTrainTest
R21.0001.000
MSE10−710−7
MRE (%)0.0370.044

