The Application of Fractional Calculus in Chinese Economic Growth Models


1
School of Mathematics and Statistics, Guizhou University, Guiyang 550025, China
2
School of Mathematical Sciences, Qufu Normal University, Qufu 273165, China
3
Department of Mathematical Analysis and Numerical Mathematics, Faculty of Mathematics, Physics and Informatics, Comenius University in Bratislava, Mlynská Dolina, 842 48 Bratislava, Slovakia
4
Mathematical Institute, Slovak Academy of Sciences, Štefánikova 49, 814 73 Bratislava, Slovakia
*
Author to whom correspondence should be addressed.
Mathematics 2019, 7(8), 665; https://0-doi-org.brum.beds.ac.uk/10.3390/math7080665
Submission received: 2 June 2019
/
Revised: 19 July 2019
/
Accepted: 23 July 2019
/
Published: 25 July 2019
(This article belongs to the Special Issue Mathematical Economics: Application of Fractional Calculus)
Abstract
:In this paper, we apply Caputo-type fractional order calculus to simulate China’s gross domestic product (GDP) growth based on R software, which is a free software environment for statistical computing and graphics. Moreover, we compare the results for the fractional model with the integer order model. In addition, we show the importance of variables according to the BIC criterion. The study shows that Caputo fractional order calculus can produce a better model and perform more accurately in predicting the GDP values from 2012–2016.
1. Introduction
As one of the most important macroeconomic statistics indicators, GDP is an effective tool for people to understand and grasp the macroeconomic operation of a country; it is also an important basis for formulating economic policies. However, the calculation of GDP is very complicated, so a good economic growth model (EGM) can effectively form the economic progress problem, and it can reduce the loss of human and material resources.
Derivatives and integrals are often used to describe the process of economic development. However, there are still some shortcomings in using classical calculus to model real data. In recent years, the existence of solutions to fractional order differential equations have been studied in [1,2,3]. In addition, fractional calculus is widely used to construct economic models; it incorporates the effects of memory in evolutionary processes; experimental results show that the fractional order model is superior to integer order model, such as [4,5,6,7,8,9,10,11,12,13].
Recently, Luo et al. [14] improved the fractional EGM model in [5] and adopted different computational methods to simulate GDP via MATLAB, SPSS, and R software. The simulation results showed that the newly-established fractional hybrid model had better performance than the classical model.
In this paper, we adopt the idea in [14] to apply Caputo fractional order EGM and integer order to study China’s GDP growth, as well as the minimum mean-squared-error (MSE) to estimate the parameters in the model. In order to compare the fitting effect between the integer order and the fractional order model, we establish the minimum absolute error coefficient, determination, and the BIC index. Finally, we use the prediction effect of the absolute relative error evaluation model.
Summarizing, based on fractional calculus, this paper conducts modeling of China’s economic growth. Through a case study, it shows that fractional calculus has a better effect than integral calculus in modeling. It would be possible to use Monte Carlo simulation to generate sample data (see [15,16]) and then conduct modeling comparison. In this paper, real data are used for modeling and then showing the advantage of fractional calculus. The purpose of the two methods is the same, but the case analysis is often more complex and difficult than simulation, so a simulation is not used in this paper.
2. Models Description
We select six explanatory variables in this paper, and they are land area (LA) (km), cultivated area (CL) (km), total population (TP) (million), total capital formation (TCF) (billion), exports of goods and services (EGS) (billion), and general government final consumer spending (GGFCS) (billion), and the explained variable is GDP (billion). The data used in this paper were all Chinese data from the world bank from 1961–2016.
In order to simplify the expression, we define the following symbols:
| y | n | k | t | ||||||
The general expression of the EGM is , where f is the given function. Thus, the integer order model (IOM) and Caputo fractional order model (CFOM) are considered as:
- IOM:
- CFOM:where and represent the starting year and order respectively; in addition, the Caputo derivative for a given function is defined as (see [1]):
In order to facilitate the comparison of GDP between different years, the GDP, TCF, EGS, and GGFCE used here were converted into unchangeable local currency. The data from 1961–2011 were selected as the training sample, and data from 2012–2016 were used as the test sample. Moreover, we used the average absolute deviation (MAD) and the coefficient of determination (R) to evaluate the model, and the absolute relative error criterion was used to compare the prediction effect of the model. Recall the following definitions:
and:
and:
We often used the Akaike information criterion (AIC) and Bayesian information criterion (BIC) for the selection of variables in the model. Compared with the BIC criterion, the AIC criterion has the phenomenon of over-fitting. Therefore, we adopted the following BIC criterion:
and:
3. Main Results
3.1. Economic Data for China
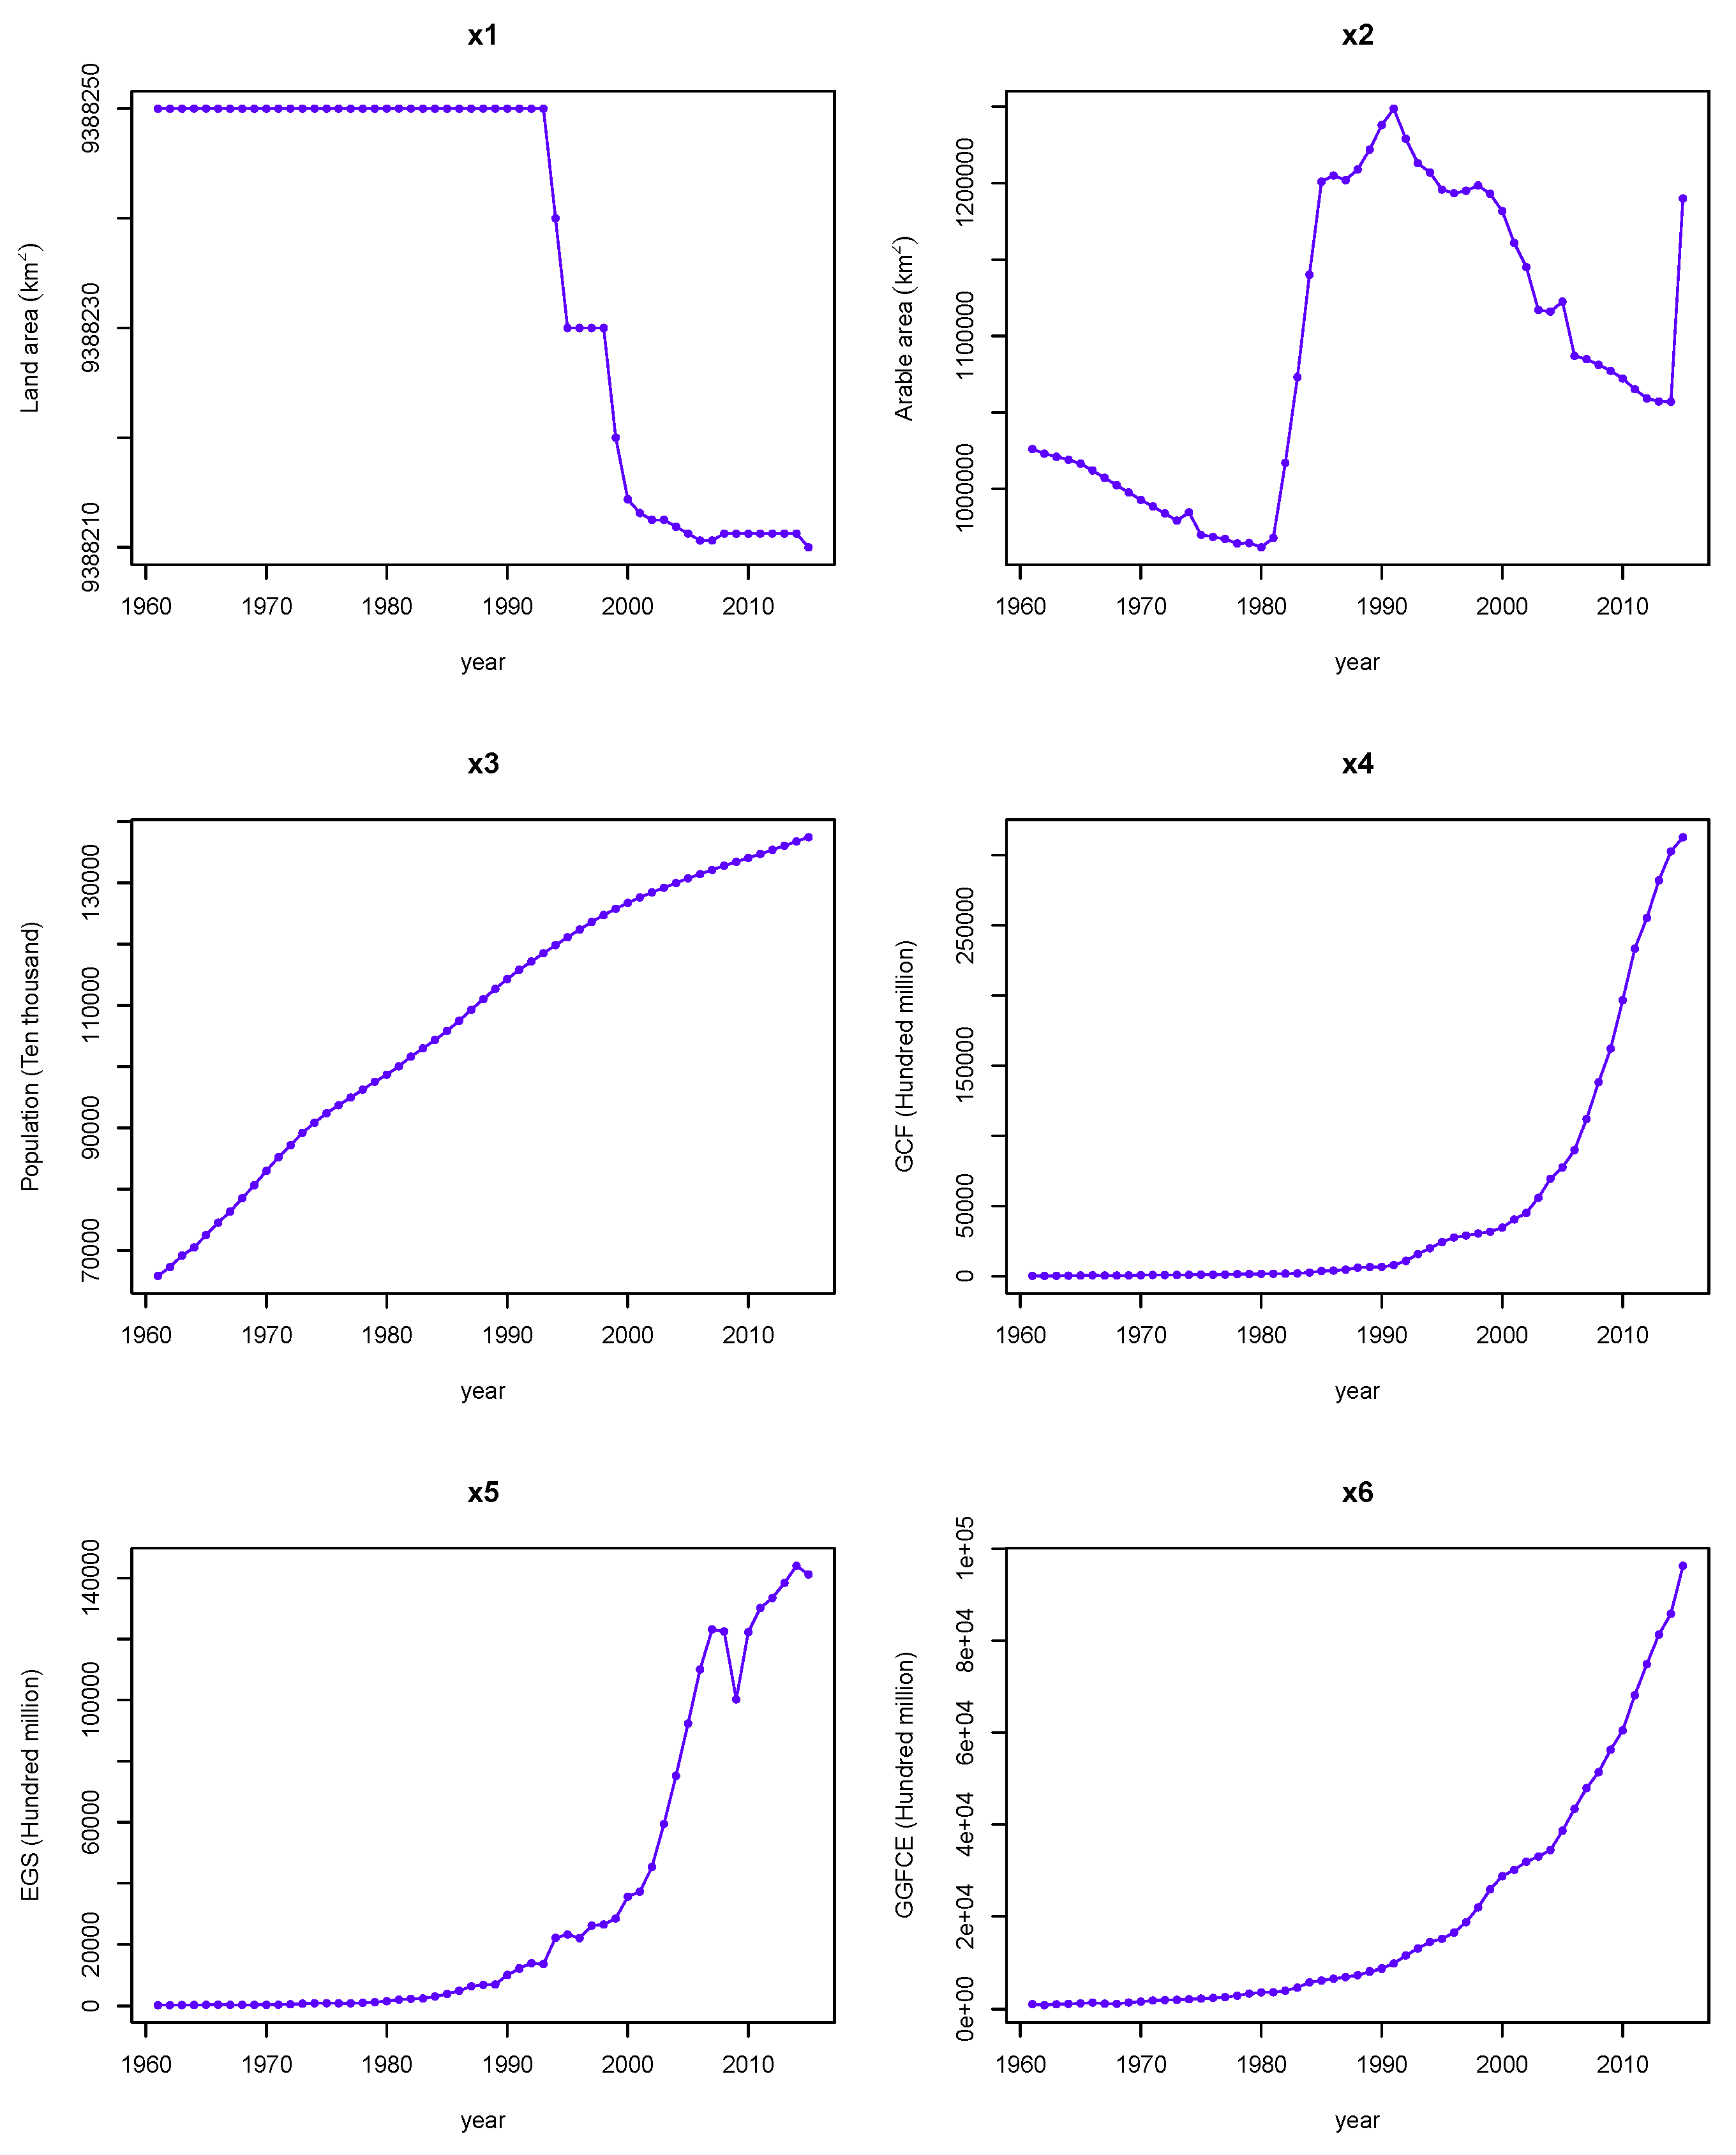
By using the Chinese economic data from 1961–2016 in unchangeable local currency, we apply R software to get the following figure (see Figure 1).
3.2. Parameter Estimation
In this paper, we used R software and the least squares method to obtain the coefficient estimation in the integer order and Caputo fractional order models. Moreover, according to the MSE criteria, we gave the order of the Caputo fractional order model, and the following data were obtained (see Table 1).Table 2 shows the significance test results of the IOM and CFOM coefficients.
The results in Table 2 show that when the significance level was 0.05, the coefficients of IOM and CFOM passed the significance test.
3.3. Model Evaluation
In order to compare the performance of limited samples between IOM and CFOM, we present the values of MAD, R, and BIC index in the training sample set (see Table 3).
We adopted the BIC criterion to select variables in the model, and the importance of each variable was obtained, represented by (see Table 4).
3.4. Fitting Results
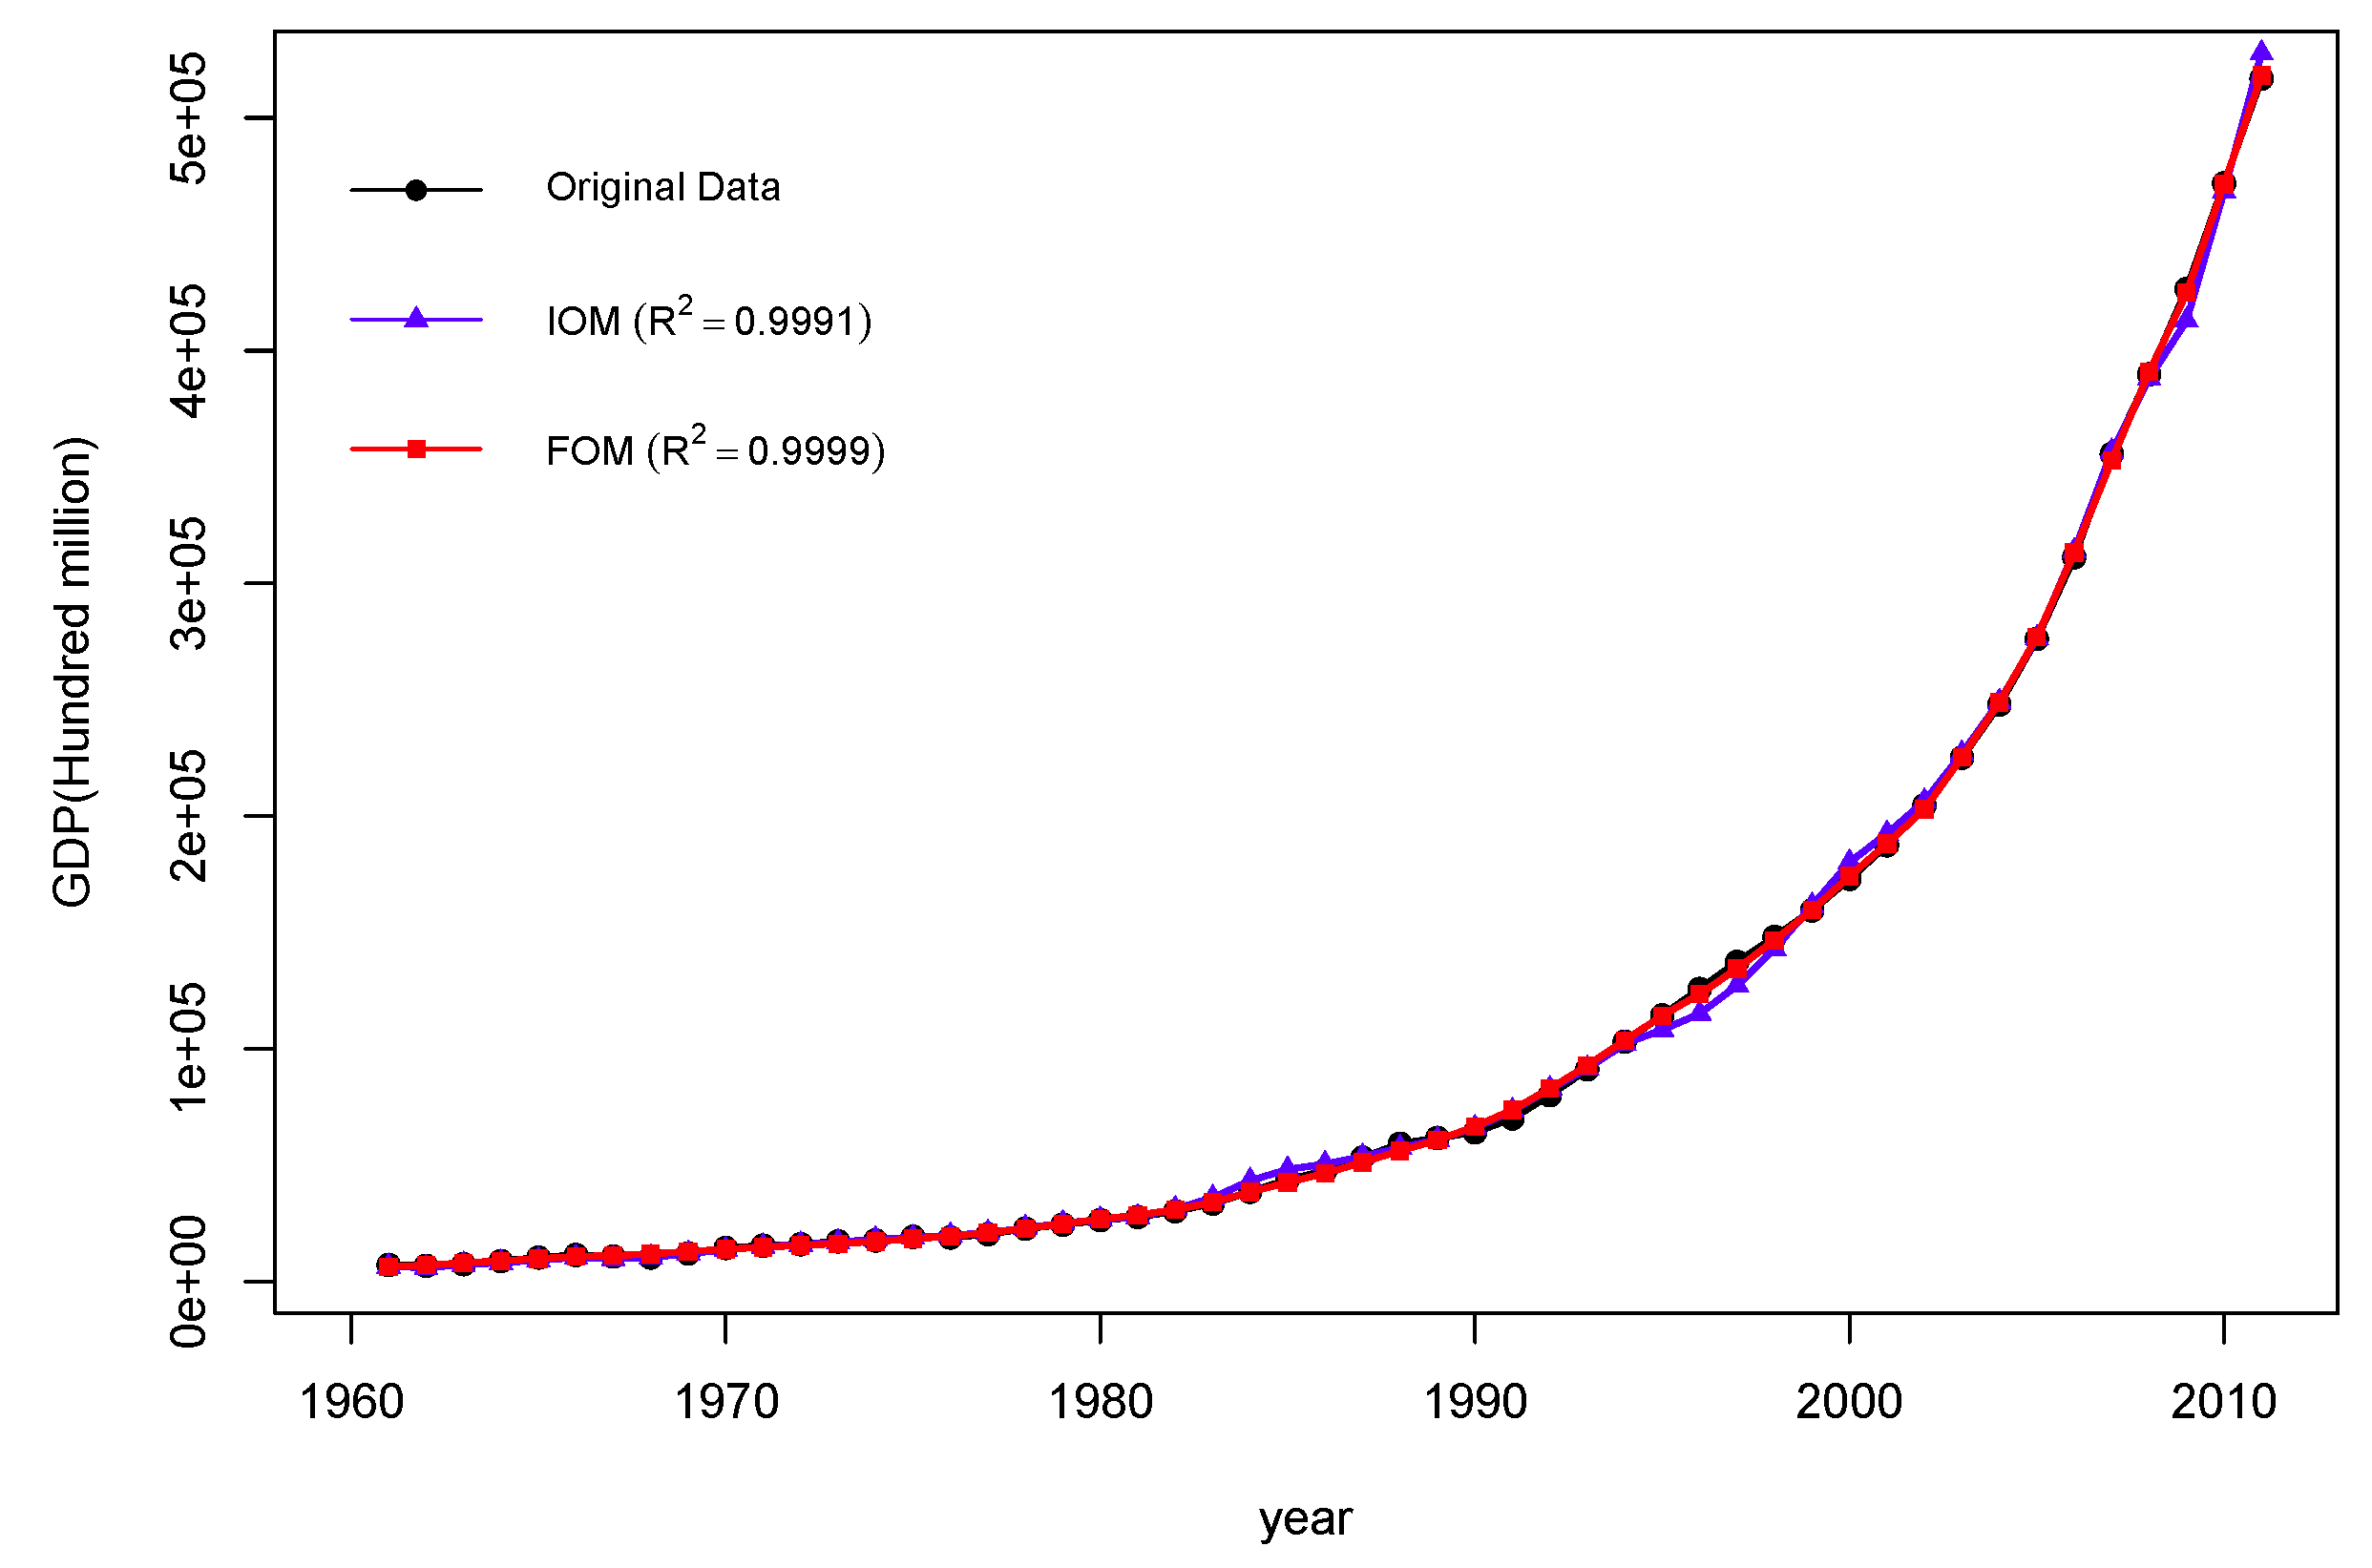
Now, we give the fitting results of IOM and CFOM based on R software (see Figure 2).
3.5. Predicted Results
Finally, we present the forecast results of the IOM and CFOM models for China’s GDP data from 2012–2016, and we calculate ARE index values, as shown in Table 5.
4. Conclusions
We selected six economic indicators in this paper and used IOM and CFOM to model China’s GDP growth from 1961–2011. The fitting results showed that CFOM was significantly better than IOM. To further illustrate the forecasting effect of the CFOM model, we presented the GDP forecast for China from 2012–2016 and compared it with the real value. It was found that the CFOM model not only had an advantage in fitting China’s GDP growth, but also predicted it better. Finally, since all data were discrete, we intend to extend our study by applying the Caputo differences to create a fractional discrete time EGM.
Author Contributions
The contributions of all authors (H.M., J.W. and M.F.) are equal. All the main results were developed together.
Funding
This work is partially supported by the National Natural Science Foundation of China (11661016), the Major Research Project of Innovative Group in Guizhou Education Department ([2018]012), the Slovak Research and Development Agency under Contract No. APVV-14-0378, and the Slovak Grant Agency VEGANo. 2/0153/16 and No. 1/0078/17.
Acknowledgments
The authors thank the referees for their careful reading of the article and insightful comments.
Conflicts of Interest
The authors declare no conflict of interest.
References
- Kilbas, A.A.; Srivastava, H.M.; Trujillo, J.J. Theory and Applications of Fractional Differential Equations; Elsevier: Amsterdam, The Netherlands, 2006. [Google Scholar]
- Diethelm, K. The Analysis of Fractional Differential Equations; Lecture Notes in Mathematics; Springer: New York, NY, USA, 2010. [Google Scholar]
- Zhou, Y.; Wang, J.; Zhang, L. Basic Theory of Fractional Differential Equations, 2nd ed.; World Scientifc: Singapore, 2016. [Google Scholar]
- Škovránek, T.; Podlubny, I.; Petráš, I. Modeling of the national economies in state-space: A fractional calculus approach. Econ. Model. 2012, 29, 1322–1327. [Google Scholar] [CrossRef]
- Tejado, I.; Valério, D.; Pérez, E.; Valério, N. Fractional calculus in economic growth modelling: The Spanish and Portuguese cases. Int. J. Dyn. Control 2017, 5, 208–222. [Google Scholar] [CrossRef]
- Machado, J.A.T.; Mata, M.E. A fractional perspective to the bond graph modelling of world economies. Nonlinear Dyn. 2015, 80, 1839–1852. [Google Scholar] [CrossRef]
- Machado, J.A.T.; Mata, M.E.; Lopes, A.M. Fractional state space analysis of economic systems. Entropy 2015, 17, 5402–5421. [Google Scholar] [CrossRef]
- Machado, J.A.T.; Mata, M.E. Pseudo phase plane and fractional calculus modeling of western global economic downturn. Commun. Nonlinear Sci. Numer. Simulat. 2015, 22, 396–406. [Google Scholar] [CrossRef]
- Tarasova, V.V.; Tarasov, V.E. Elasticity for economic processes with memory: Fractional differential calculus approach. Fract. Differ. Calc. 2016, 6, 219–232. [Google Scholar] [CrossRef]
- Tarasov, V.E.; Tarasova, V.V. Harrod-Domar growth model with memory and distributed lag. Axioms 2019, 8, 9. [Google Scholar] [CrossRef]
- Tarasov, V.E.; Tarasova, V.V. Dynamic Keynesian model of economic growth with memory and lag. Mathematics 2019, 7, 178. [Google Scholar] [CrossRef]
- Tarasov, V.E.; Tarasova, V.V. Macroeconomic models with long dynamic memory: Fractional calculus approach. Appl. Math. Comput. 2018, 338, 466–486. [Google Scholar] [CrossRef]
- Tarasov, V.E. Generalized memory: Fractional calculus approach. Fractal Fract. 2018, 2, 23. [Google Scholar] [CrossRef]
- Luo, D.; Wang, J.; Fečkan, M.F. Applying fractional calculus to analyze economic growth modelling. J. Appl. Math. Stat. Inform. 2018, 14, 25–36. [Google Scholar] [CrossRef]
- Fulger, D.; Scalas, E.; Germano, G. Monte Carlo simulation of uncoupled continuous-time random walks yielding a stochastic solution of the space-time fractional diffusion equation. Phys. Rev. E 2008, 77, 021122. [Google Scholar] [CrossRef] [PubMed] [Green Version]
- Gerardo-Giorda, L.; Germano, G.; Scalas, E. Large-scale simulations of synthetic markets. Commun. Appl. Ind. Math. 2014, 6, 535. [Google Scholar]
Figure 1.
Data for China from 1961–2016. EGS, exports of goods and services.

Figure 2.
Data fitting.


Table 1.
The coefficients and orders of the integer order model (IOM) and the Caputo fractional order model (CFOM).
Table 1.
The coefficients and orders of the integer order model (IOM) and the Caputo fractional order model (CFOM).
| IOM | CFOM | IOM | CFOM | ||
|---|---|---|---|---|---|
| 0 | −0.5389 | −0.0051 | 0.0027 | ||
| 0 | −1.3704 | 0.0286 | 0.0029 | ||
| 0 | −0.6873 | 0.3220 | −0.3619 | ||
| −1 | 0.0960 | 0.1147 | 0.6058 | ||
| 0 | −0.7777 | 0.4229 | 0.2329 | ||
| 0 | 0.0331 | 3.5943 | 1.3208 | ||
| 1 | 3.5251 | 0.7978 | 0.1087 |
Table 2.
Significance level of the Caputo model.
| IOM | CFOM | |||
|---|---|---|---|---|
| Variable | t-Value | p-Value | t-Value | p-Value |
| −5.066 | 10.750 | |||
| 2.853 | 12.048 | |||
| 4.127 | −10.697 | |||
| 6.601 | 16.408 | |||
| 5.498 | 19.996 | |||
| 10.692 | 6.645 | |||
| 2.128 | 2.304 | |||
Table 3.
Sample performance of IOM and CFOM.
| Index | MSE | MAD | R | BIC |
|---|---|---|---|---|
| IOM | 15,497,849 | 2430.793 | 0.9991 | 17.0959 |
| CFOM | 1906,429 | 1070.643 | 0.9999 | 15.0004 |
Table 4.
The importance of variables based on BIC.
| Variable | IOM | CFOM | |
|---|---|---|---|
| BIC without one variable | 17.47825 | 15.81924 | |
| 17.18849 | 16.06651 | ||
| 17.34602 | 15.91584 | ||
| 17.70702 | 15.02607 | ||
| 17.54180 | 15.73556 | ||
| 18.29923 | 16.06451 | ||
| 17.11674 | 15.02607 | ||
| found from the BIC without one variable | 14.40% | 12.92% | |
| 16.64% | 11.42% | ||
| 15.38% | 12.31% | ||
| 12.84% | 19.22% | ||
| 13.95% | 13.48% | ||
| 9.55% | 11.43% | ||
| 17.25% | 19.22% |
Table 5.
Our results.
| Year | Real Value | IOM | CFOM | ||
|---|---|---|---|---|---|
| Predict Value | Predict Value | ||||
| 2012 | 557,487.6 | 554,010.4 | 0.6237% | 558,937.6 | 0.2601% |
| 2013 | 600,735.4 | 611,769.9 | 1.8368% | 601,514.2 | 0.1296% |
| 2014 | 644,575.1 | 665,424.7 | 3.2346% | 638,231.2 | 0.9842% |
| 2015 | 689,052.1 | 741,602.5 | 7.6265% | 675,637.3 | 1.9468% |
| 2016 | 735,218.6 | 810,156.9 | 10.1927% | 714,153.2 | 2.8652% |
© 2019 by the authors. Licensee MDPI, Basel, Switzerland. This article is an open access article distributed under the terms and conditions of the Creative Commons Attribution (CC BY) license (http://creativecommons.org/licenses/by/4.0/).
Share and Cite
MDPI and ACS Style
Ming, H.; Wang, J.; Fečkan, M. The Application of Fractional Calculus in Chinese Economic Growth Models. Mathematics 2019, 7, 665. https://0-doi-org.brum.beds.ac.uk/10.3390/math7080665
AMA Style
Ming H, Wang J, Fečkan M. The Application of Fractional Calculus in Chinese Economic Growth Models. Mathematics. 2019; 7(8):665. https://0-doi-org.brum.beds.ac.uk/10.3390/math7080665
Chicago/Turabian StyleMing, Hao, JinRong Wang, and Michal Fečkan. 2019. "The Application of Fractional Calculus in Chinese Economic Growth Models" Mathematics 7, no. 8: 665. https://0-doi-org.brum.beds.ac.uk/10.3390/math7080665
Note that from the first issue of 2016, this journal uses article numbers instead of page numbers. See further details here.