Kidney and Renal Tumor Segmentation Using a Hybrid V-Net-Based Model


1
Computer Engineering, Graduate School of Natural and Applied Sciences, Kirikkale University, Kirikkale 71451, Turkey
2
Electrica & Electronics Engineering, Graduate School of Natural and Applied Sciences, University of Kirikkale, Kirikkale 71451, Turkey
3
Computer Engineering, Faculty of Technology, Gazi University, Ankara 06560, Turkey
*
Author to whom correspondence should be addressed.
Mathematics 2020, 8(10), 1772; https://0-doi-org.brum.beds.ac.uk/10.3390/math8101772
Submission received: 3 September 2020
/
Revised: 11 October 2020
/
Accepted: 13 October 2020
/
Published: 14 October 2020
(This article belongs to the Special Issue Advances in Machine Learning Prediction Models)
Abstract
:Kidney tumors represent a type of cancer that people of advanced age are more likely to develop. For this reason, it is important to exercise caution and provide diagnostic tests in the later stages of life. Medical imaging and deep learning methods are becoming increasingly attractive in this sense. Developing deep learning models to help physicians identify tumors with successful segmentation is of great importance. However, not many successful systems exist for soft tissue organs, such as the kidneys and the prostate, of which segmentation is relatively difficult. In such cases where segmentation is difficult, V-Net-based models are mostly used. This paper proposes a new hybrid model using the superior features of existing V-Net models. The model represents a more successful system with improvements in the encoder and decoder phases not previously applied. We believe that this new hybrid V-Net model could help the majority of physicians, particularly those focused on kidney and kidney tumor segmentation. The proposed model showed better performance in segmentation than existing imaging models and can be easily integrated into all systems due to its flexible structure and applicability. The hybrid V-Net model exhibited average Dice coefficients of 97.7% and 86.5% for kidney and tumor segmentation, respectively, and, therefore, could be used as a reliable method for soft tissue organ segmentation.
1. Introduction
Developing countries are home to the most diverse cancer types, which can be explained by social and economic factors. However, lifestyle also has a great effect on these statistics [1]. Cancer statistics data reveal that more than 400,000 cases of kidney cancer were detected worldwide in 2018. Most people diagnosed with kidney cancer were between the ages of 60 and 70, with the statistics also indicating that the number of asymptomatic kidney tumors is increasing [2]. Smoking, obesity, and hypertension are among the determining risk factors for kidney cancer [3].
Kidney tumors can be divided into two distinct groups, namely, benign and malignant. Benign tumors are mostly harmless, but some may cause symptoms such as muscle pain or hematuria as the mass grows [4,5]. Malignant tumors are considered risky. The majority of these tumors are renal cell carcinomas (RCC) [6]. While kidney or tumor removal was an effective treatment method used in previous years, preventive treatment is gaining more importance thanks to the advanced imaging techniques available today [7]. Oncological treatments are not ignored, while promising studies focused on the prevention of unnecessary surgeries are also attracting attention [8]. In recent years, deep learning methods have found their footing in the medical field, with medical segmentation also becoming more popular. However, not many algorithms exist in the literature regarding kidney and kidney tumor segmentation [9,10,11]. Therefore, more research is needed on deep learning methods in regard to their use in kidney tumors.
Recent studies in computerized image recognition emphasized the success of Convolutional Neural Networks (CNN) in dealing with challenging tasks such as segmentation. This success is based on the ability of CNNs to learn on their own using original data without the need for human intervention [12]. Inputs are processed through network layers, with higher values provided from the extracted features. Deeper layers can even capture a smaller amount of local data due to the filters used for larger data [13]. However, new studies in this field are still of great importance since effective and accurate segmentation always has room to improve, especially considering that even minor medical errors should not be overlooked. New research opens up new routes for future studies while improving the shortcomings of previous studies. Therefore, our study is also very important in this sense; it is a flexible model designed to be used not only for kidney and tumor segmentation but in all situations where segmentation might be difficult. The model we developed, which was designed by taking into account the basic shortcomings of existing U-Net models, can be easily integrated into local application and all international application systems. Thus, it can be used easily in all image segmentation models.
The segmentation of kidneys and kidney tumors is a challenging process for physicians, thereby representing an area for further study. Most kidney image analyses are generally based on kidney segmentation rather than on kidney tumor measurement because monitoring the evolution of kidney cancers is difficult with manual segmentation. This process is not only time consuming, but it can also cause errors in calculations and can lead to bias in two-dimensional (2D) tumor monitoring [14]. Since calcifications and cystic tissues may be present in the tumor [15], it should be considered that some kidney cancers have diverse appearances on Computed Tomography (CT) images. Different methods and techniques can be used in accordance with automatic and manual segmentation to solve this problem [16]. This study was conducted using the KiTS19 dataset to develop a new hybrid V-Net model with the purpose of achieving the most accurate segmentation results, taking into account the structural properties of the kidneys, which originate from soft tissue. Our model, which was designed in a different manner to its counterparts, is supported by original architectural structures. We also compared the results obtained from this study with results from other models using the same dataset in the literature. Similar studies found in the literature are included in Section 2. Section 3 discusses the materials and methods. A discussion and conclusions can be found in Section 4. Conclusions and future directions form the last section of this manuscript.
2. Related Works
Xin Yang et al. [17] proposed a method for kidney segmentation which firmly provided segmentation accuracy for a wide variety of Dynamic Contrast Enhanced–Magnetic Resonance Imaging (DCE–MRI) data, stressing that very few manual operations and parameter settings were required for this approach. A five-step correction procedure was applied, with the authors reporting that the model was superior to other models, with an accurate segmentation rate of 95%.
Dehui Xiang et al. [18] proposed a method for automatic renal cortex segmentation, presenting an approach for the fully automatic identification of kidney and cortex tissues from CT scans. The method was tested on a dataset consisting of 58 CTs. Experimental results were found to be 97.86% ± 2.41% and 97.48% ± 3.18% for kidney and renal cortex segmentation, respectively.
Seda Arslan Tuncer and Ahmet Alkan [19] proposed a decision support system for the detection of renal cell cancer as the most common type of kidney cancer. They reported that the rapid spread of renal cell cancer and failure of early diagnosis often led to death. A machine learning-based decision support system was proposed to distinguish between healthy kidney cells and kidney cells with renal carcinoma, achieving a Dice coefficient segmentation success rate of 89.3% in their study, conducted using 130 datasets obtained from Fırat University.
Guanyu Yang et al. [20] proposed a three-dimensional, Fully Convolutional Neural Network (FCNN) model for the automatic segmentation of kidney and renal tumors. They stated that renal cancer is one of the ten most common types of cancer and emphasized that the prerequisite for surgical planning was accurate renal and tumor segmentation on CT images, adding that this is still a problem in automatic imaging. A new fully convolutional network model (FCN) combining a three-dimensional (3D) pyramid pooling module (PPM) and a gradually enhanced feature module (GEFM) was proposed. The proposed network architecture was an end-to-end learning system using 3D volumetric images, whereby a structure with 3D information was used to improve the lesion of the tumor as well as the segmentation of the kidney. As a result of experiments on 140 patients, the target structures were shown to be successfully segmented. The average Dice coefficients obtained for kidney and renal tumors were calculated as 0.931 and 0.802, respectively.
Florent Marie et al. [21] proposed an approach to segment deformed kidneys using CNN networks. In a medical context, segmentation provides surgeons with a lot of information but is rarely performed. These researchers are focused on kidneys deformed by nephroblastoma, proposing a new CNN assessment after different training sets for manual segmentation. An Over Learning Vector (OV2 ASSION) for Valid Sparse Segmentation was used to train the CNN. The study achieved a Dice coefficient rate of 89.7%.
Couteaux et al. [22] developed a 2D U-Net model based on computed tomography images. Segmentation of the kidney cortex was performed using the current U-Net models, with the authors reporting that the segmentation results of their algorithm matched the renal cortex with good precision, reaching a Dice score of 0.867, ranking them first in the data challenge. However, they emphasized that it would be more accurate to apply the process in 3D by measuring the renal cortex volume, thereby requiring labeling effort to train deep networks.
Antoniya et al. [23] recently performed a study on renal cyst segmentation using CT images. They reported making several innovations in the CT images to optimize renal cyst diagnosis using a new hybrid segmentation approach. The segmentation was based on several basic techniques, with the study based on the idea that an optimized prepropagation algorithm is the core of kidney segmentation in CT images. Color-based, k-means clustering algorithms were used, achieving a success rate of 92.12% for kidney segmentation and 91.24% for cyst segmentation.
Rundo et al. [24] developed a U-Net-based model for prostate segmentation, stating that prostate cancer is very common and its diagnosis with MRI is difficult. They proposed a novel CNN, called USE-Net, incorporating Squeeze-and-Excitation (SE) blocks into U-Net where the SE blocks were added after every Encoder (Enc USE-Net) or Encoder–Decoder block (Enc–Dec USE-Net). SE blocks can be defined as block structures formed by a series of operations of “residual + global pooling + sigmoid” functions. This model was compared with the classical U-Net models. The Enc-Dec U-Net model showed higher performance and achieved a better Dice coefficient than the other Enc U-Net and U-Net models. However, the effectiveness of SE blocks at certain stages remains open for discussion, and its contributions to the system should be further examined in terms of running speed. However, this developed model provides important clues regarding the development of new architectures in the future.
Fuzhe et al. [25] proposed a study using artificial neural networks. They tried to both reduce data size and increase the success of existing algorithms in various. The Heterogeneous Modified Artificial Neural Network (HMANN) was used for the early detection and segmentation of chronic kidney disease. These authors aimed to segment the region of interest of the kidneys in the ultrasound image and reported that the proposed HMANN method achieved 97.5% classification success and significantly reduced processing time.
Luana Batista da Cruz et al. [26] proposed an automatic method to delimit the kidneys in CT images using image processing techniques and deep CNNs to minimize false positives. They mentioned that the precise segmentation of kidneys and kidney tumors could help physicians to diagnose diseases and improve treatment. Manual segmentation of the kidneys was stated to be difficult, therefore presenting the need for automatic. This method was used on the KiTS19 database and reached an average Dice coefficient of 93.03%.
Chen Li et al. [27] developed a deep learning-based model (ANU-Net) segmentation network for medical image segmentation. They stated that an automated medical image segmentation model is required to help doctors diagnose and treat organ lesions. They also stated that medical segmentation is a challenging task due to the irregular shapes of the target organs. The proposed network model was stated to have a deeply controlled encoder–decoder architecture and a redesigned dense skip connection. ANU-Net creates the network structure with nested pleated blocks, then the extracted features can be combined with a selection. This ANU-Net model achieved four types of medical image segmentation tasks with a Dice similarity coefficient of 90.10%.
Nithya et al. [28] proposed a method for the detection and segmentation of kidney diseases using artificial neural networks. They emphasized that ultrasound imaging plays an important role in kidney stone detection and segmentation for surgery and treatment, adding that kidney stone segmentation in ultrasound images is often performed manually in clinical practice. Having eliminated noise in the input image, the authors classified it using artificial neural networks and finally segmented stones and tumors separately, with a success rate of 99.61%.
Wenshuai Zhao et al. [29] developed a 3D U-Net-based architecture for kidney and tumor segmentation. They reported that the segmentation was performed by the physicians by examining the CT images obtained during clinical analysis. They also argued that this process was difficult, and the system could fail in the case of lack of previous experience. The U-Net-based architecture was, therefore, developed to segment the kidneys, on the argument that a simpler architecture could be more successful than complex models. They tested this architecture, called MSS U-Net, in the KiTS19 challenge, finding kidney and tumor Dice coefficients of 0.969 and 0.805, respectively.
Isensee et al. [30] proposed nnU-Net, a deep learning framework condensing the current domain knowledge and autonomously making the key decisions required to transfer basic architecture to different datasets and segmentation tasks. The nnU-Net surpassed most specialized deep learning pipelines without manual tuning. This model is based on the principle of making the system more simple and orderly using a systematic approach by clearing the complex structure of the system without adding a new network structure. The authors stated that the model might have deficiencies in situations that require high performance, since the focus is only on the Dice coefficient. In contrast to state-of-the-art performance, some hyperparameters, such as missing functions, may need to be adjusted manually. For this reason, the nnU-Net model can be turned into a semiautomatic system by manually making additions; therefore, the deficiencies of the model can be eliminated by external intervention, thereby making the network performance more successful.
3. Materials and Methods
3.1. Image Preprocessing
In this study, 210 datasets were prepared for use, which are open to public access and can be downloaded through the cancer imaging archive page [31]. Additional explanations on the preparation of the dataset as well as the ethics committees are available on the main web page of the KiTS19 dataset [32]. Manual segmentation can cause a number of errors in the subsequent monitoring of the kidney or tumor. Additionally, it is time consuming and could slow system performance [33]. Despite these negative effects, we used the KiTS19 dataset because of the scarcity of available datasets in the literature. We prepared the clinical features of the existing patients, the imaging data, and the renal and tumor borders using the manual segmentation method. Figure 1 shows an example dataset prepared by the manual segmentation method.
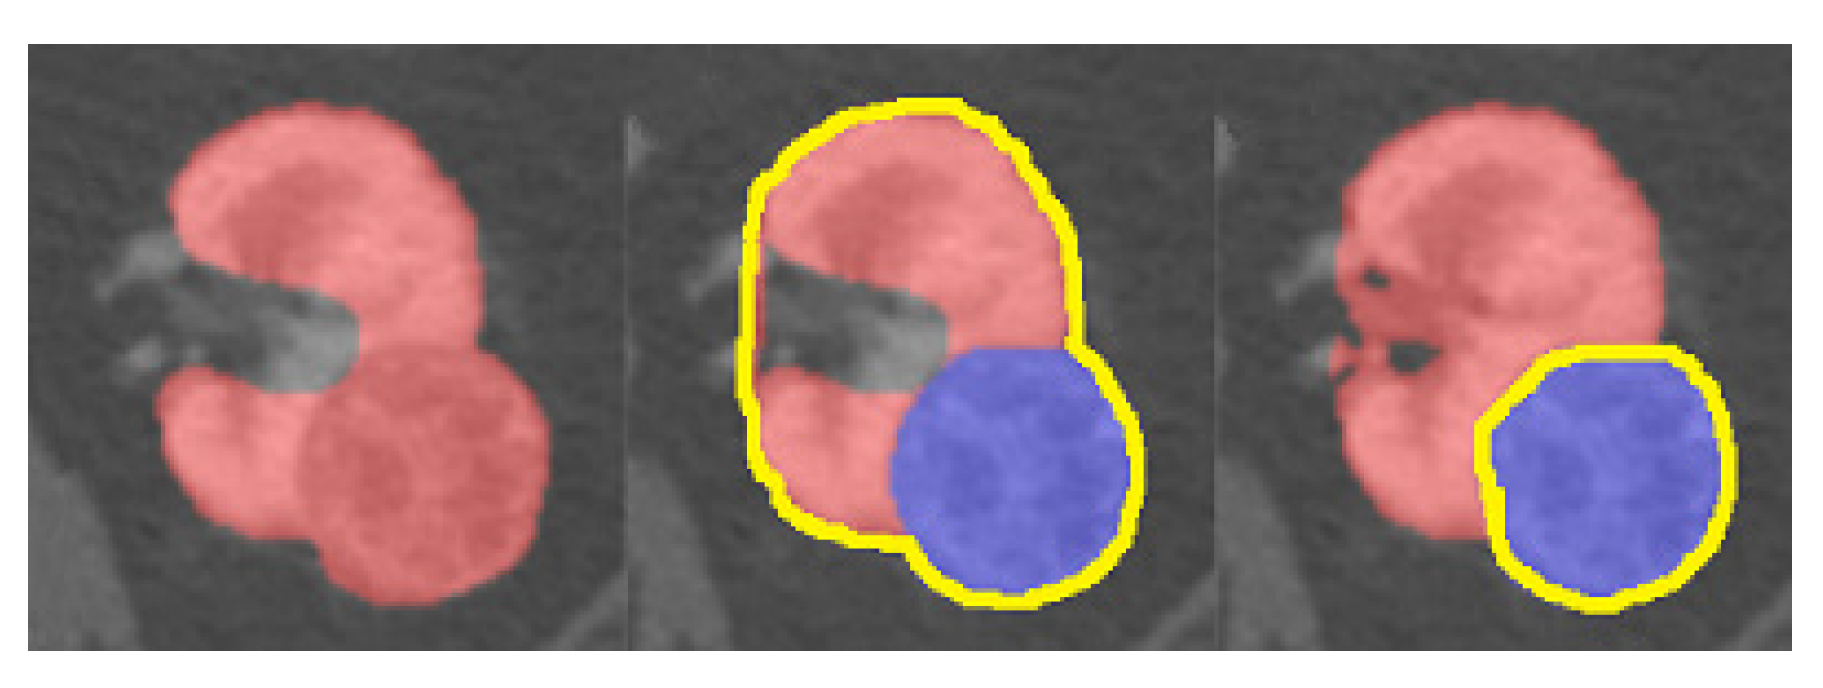
The imaging and ground-truth labels were presented in an anonymized nii file to image (NIFTI) format [34]. We resized the CT images in the dataset to 16 × 256 × 256 and divided the pixel value by 255 to normalize it between 0 and 1. The model parameters were initialized randomly, and no transfer learning was used. Patches of 64 × 128 × 128 in size were randomly sampled from the resampled volumes for training. The dataset consisted of 210 patients in total, with 190 in the training dataset. The remaining 20 were used for testing. These operations were arranged randomly. The model was trained by Adam Optimizer with a learning coefficient set at 0.001. The batch size was determined as 3, and the total epochs were set to 100,000. Training this model took about five days on the NVIDIA Tesla V100 (32 GB, NVLink) Graphic Processing Unit (GPU). We used the features of the TensorFlow library during the training. Figure 2 shows 3D volume rendering of the segmented regions (kidney and renal cancer in blue and purple) and also the 2D kidney and renal cancer images. In the image process phase, the CT image is analyzed to determine the slice thickness, window width, and position information. The kidney and renal tumor regions are preserved unchanged. In addition, original pictures and masks of these regions are created.
3.2. V-Net Architecture
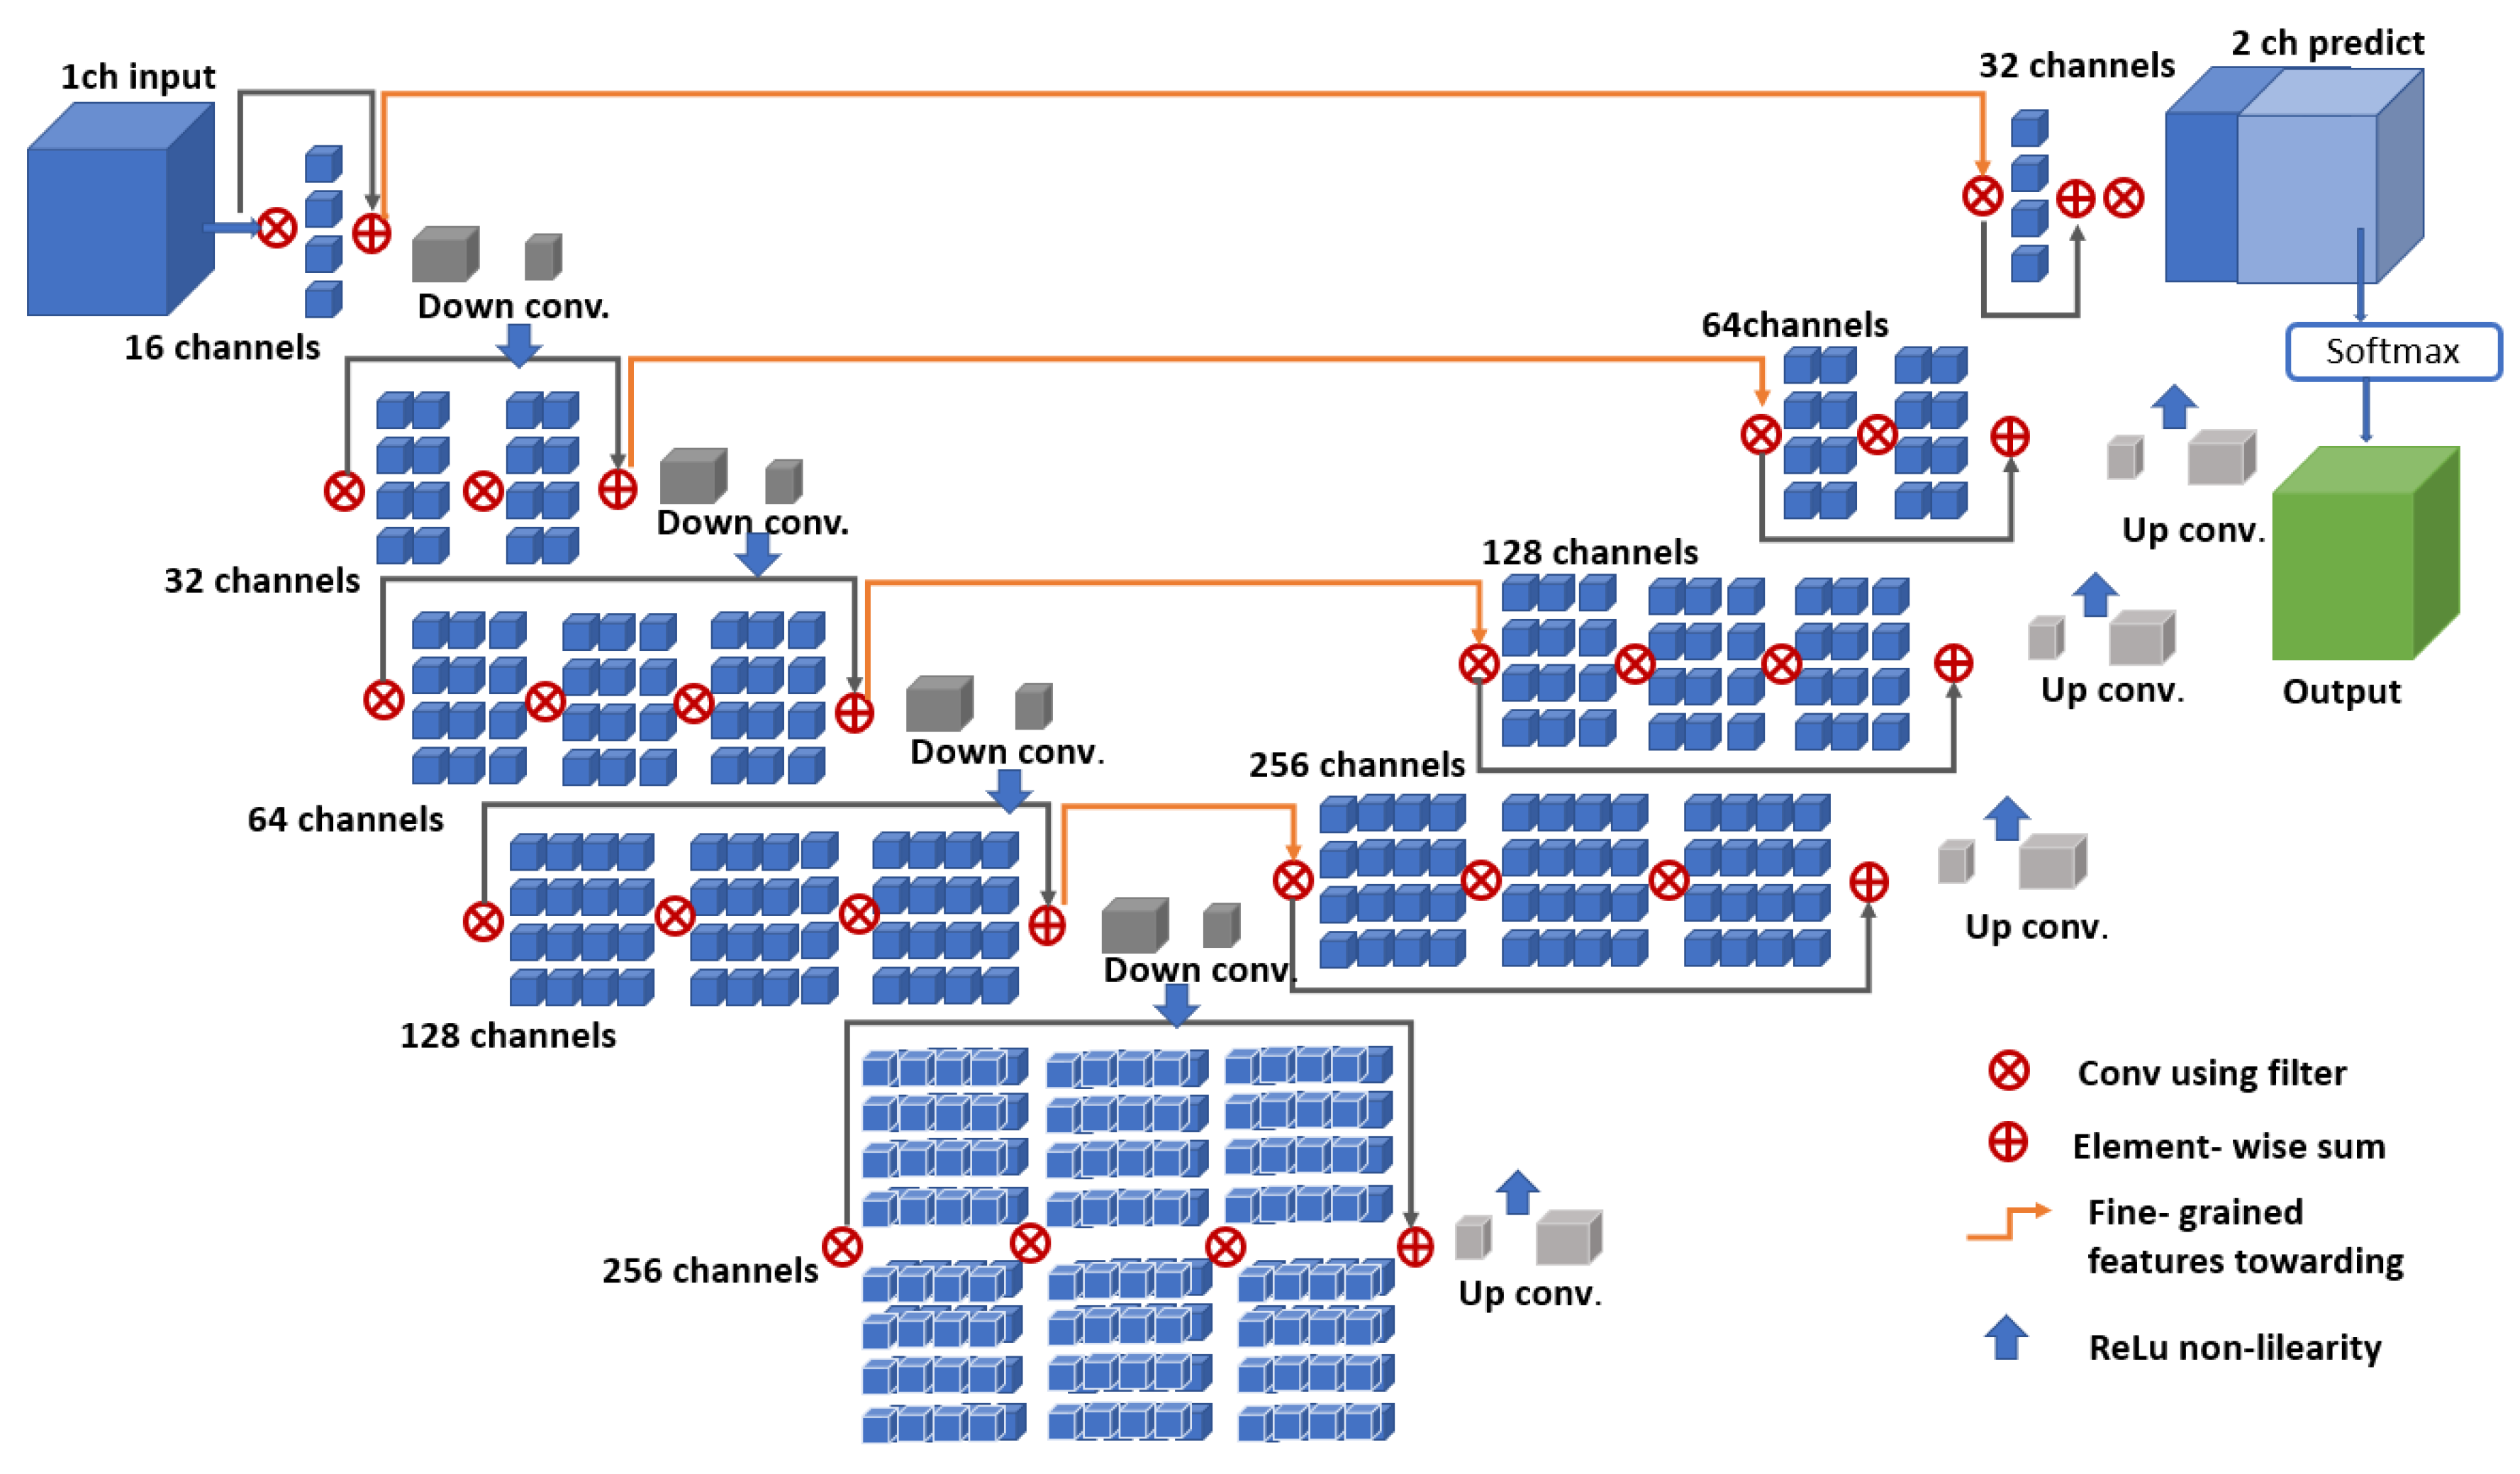
Figure 3 shows the network structure of the classic V-Net architecture. The network architecture consists of the encoding and decoding portions, as in the basic U-Net architecture. Therefore, it is a derivation of U-Net architecture, except with a volumetric design, which is suitable for use in tissues where it is difficult to identify organs and tumors (such as prostate or kidney) on CT imaging [12].
The V-Net architecture has a convolutional structure to extract features and reduce the resolution by following the right path. Classical pooling methods sometimes ignore important details during the segmentation process, so the V-Net convolutions are used to avoid this by downsampling, whereby the size of the data transmitted as input is reduced and the data are transmitted to the receiving properties calculated in the next network layers [13]. Each layer on the encoder side of the V-Net architecture consists of feature set calculation sections that are two times higher than the previous layer. The decoder section of the network aims to provide two-channel volumetric segmentation. For this reason, feature maps are provided in order to obtain the necessary information. After each layer in the encoder part of the network architecture, a deflection operation is performed to increase the size of the entries, with the same operations performed in the reverse direction to reduce the dimensions in the decoder section. The properties of the neural network removed from each stage of the encoder phase are transferred to the decoder phase. This is shown schematically in Figure 3 with horizontal connections [35]. Therefore, small details are able to be collected that would otherwise be lost in the encoder part, thereby increasing the estimated segmentation quality.
3.3. Fusion V-Net Architecture
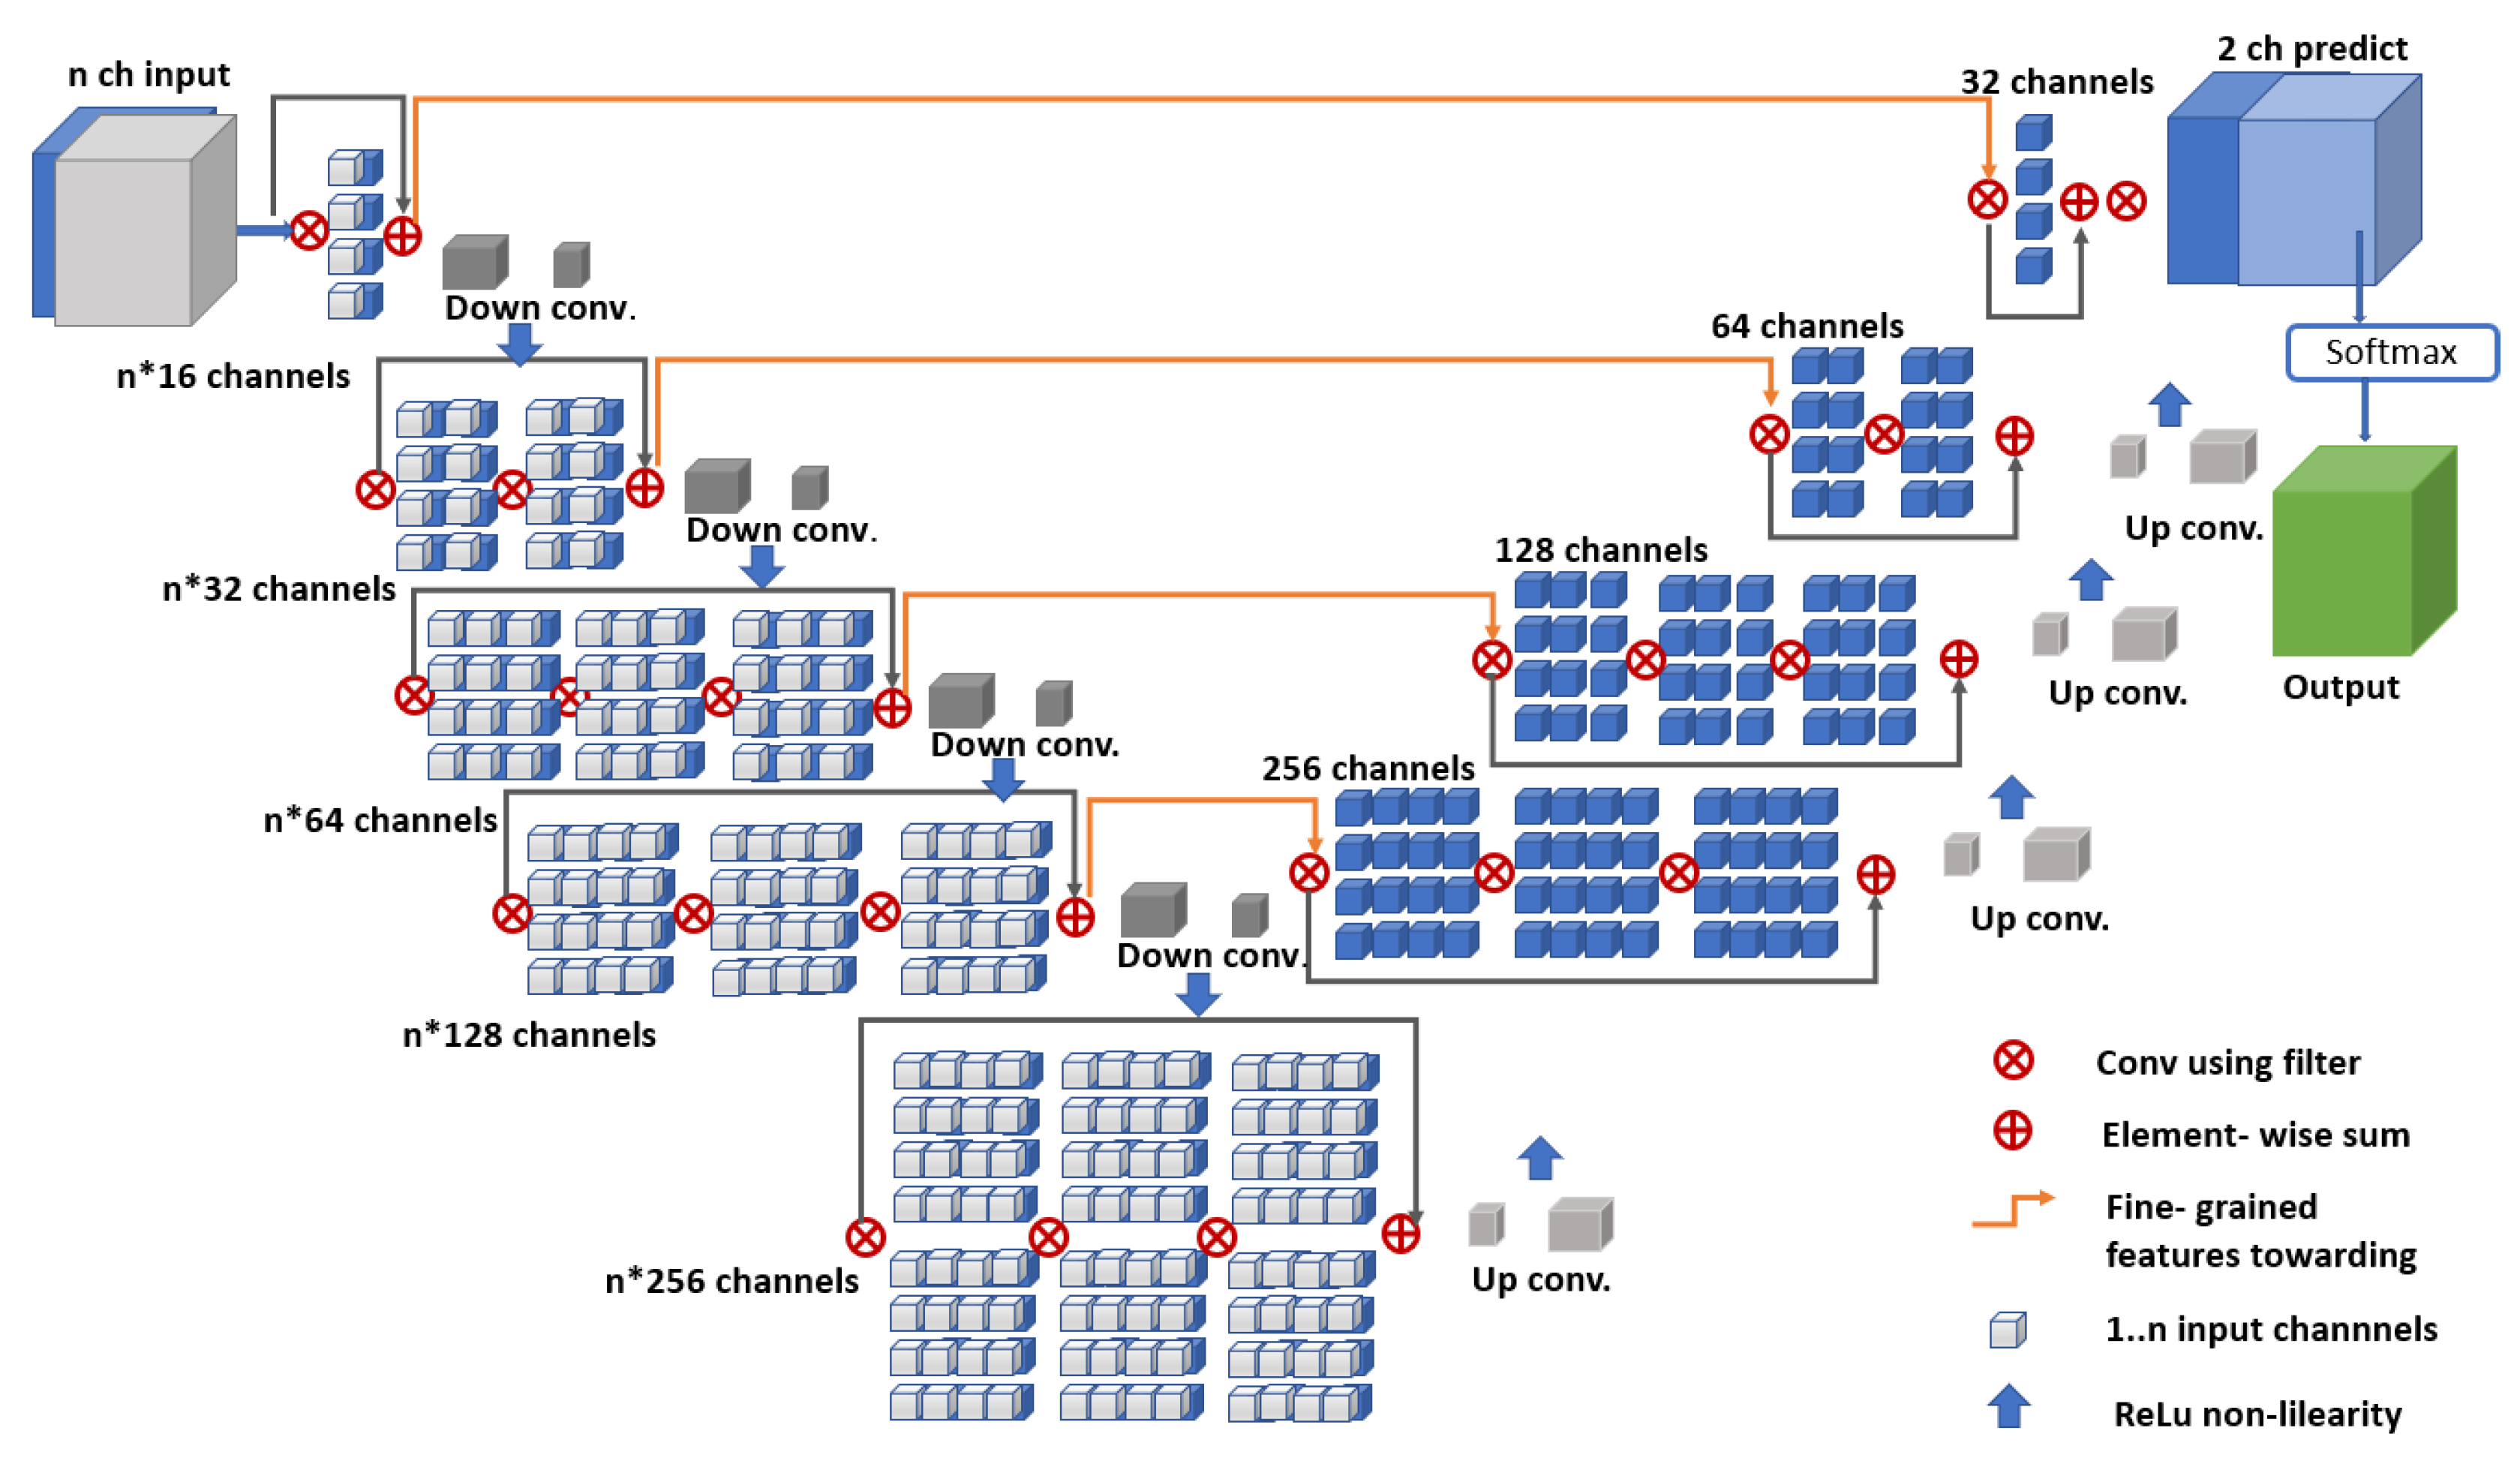
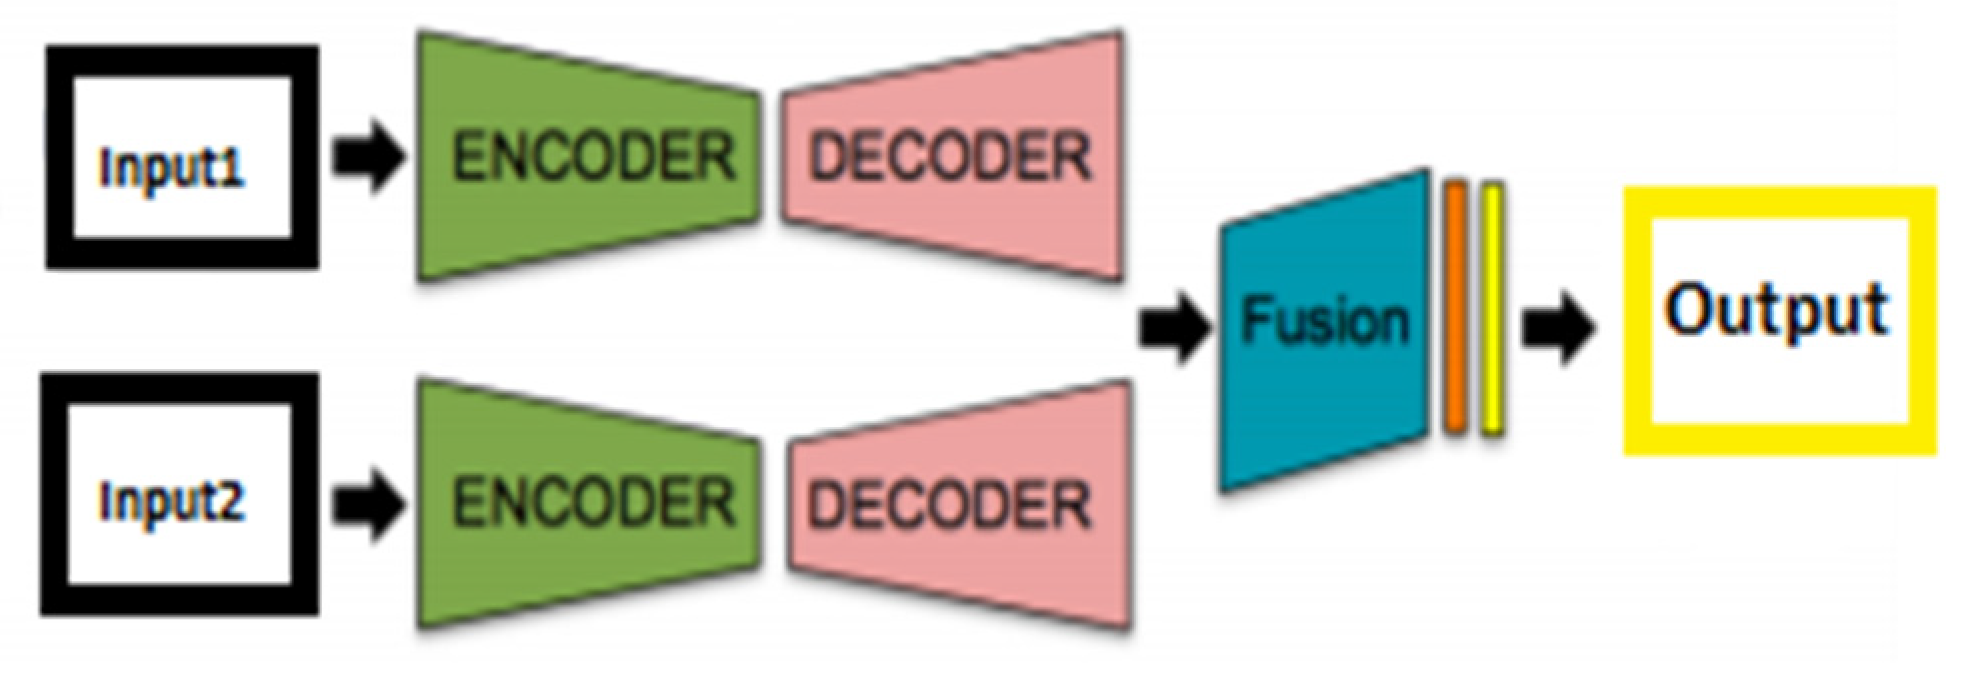
Figure 4 shows the network structure of the fusion V-Net architecture. The aim is to detect more features of the same scene by using fewer modalities. Coding the basic information for the architectural structure provides a level of learning without large amounts of data, so the use of a small-scale dataset also enables successful results in terms of performance [36]. Based on this idea, the fusion V-Net model inputs multiple parameters to the network in the encoder part. Figure 3 shows the encoder part of this structure. At this point, there is no limit to the reproduction of input parameters. However, increasing the number of parameters unnecessarily can disrupt and tire the network architecture; therefore, input parameters should be increased in a certain format and unnecessary duplication should be avoided. Figure 5 shows a simple late fusion architecture structure.
3.4. ET-Net Architecture
In the architecture shown in Figure 6, an edge guidance module (EGM) is used to determine edge displays and maintain local edge characteristics. A weighted aggregation module (WAM) is then used to collect the side-outputs from the decoding layers. In this way, Edge-Attention Guidance Network (ET-Net) architecture is created by combining two different network structures [37]. While “Conv” symbolizes the convolutional layer, “U”, “C” and “+” mean upsampling, concatenation, and aggregation, respectively.
The main goal of the architecture is to transmit edge attention impressions to the upper layers to improve the output from the decoder phase. The first inputs for each encoder block pass through the feature extraction section, consisting of a (1 × 1)–(3 × 3)–(1 × 1) convolutional layer stack, and then the system is operated by gathering the shortcuts of the inputs to achieve the desired outputs.
3.5. Hybrid V-Net Architecture
Figure 7 shows the proposed hybrid V-Net architecture consisting of the encoder and decoder blocks, as in the classic V-Net architecture. (For codes: https://github.com/turkfuat/KiTS19-Hybird-V-Net-Model). Combining two different V-net models in the encoder and decoder phases, the hybrid architecture is also supported with a unique ResNet layer before the output layer.
The encoder block was created based on the fusion V-Net model, and the input parameters were set to be input1 and input2. The decoder block was designed based on the ET-Net architecture. In the encoder block, the input parameters were aimed to pass through the fusion V-Net model to capture all features during segmentation. The goal of the ET-Net model was to catch even the smallest edge features for segmentation. In the decoder phase, the layers were connected by using the edge extraction features of the ET-Net model, which were forwarded to the ResNet++ block, the architecture of which is shown in Figure 8 below.
This block can be thought of as two nested ResNet blocks. Unlike a normal ResNet model, this block connects the output layer with the preceding two layers. Thus, small residual blocks before the output can also be captured. Adding this layer to all blocks makes the network very slow, so adding it to the correct layer is extremely important.
The ResNet1 and ResNet2 structures are shown in Equations (1) and (2). These two blocks represent the classic ResNet architecture [40].
ResNet1 = F1(x) + x
ResNet2 = F2(x) + x
To clarify Equations (1) and (2), let the output layer be layer_n. In this case, the previous layer is represented as layer_ (n − 1). This situation is shown in Equations (3) and (4).
ResNet1 = (layer_(n − 2) + layer_(n − 1))
ResNet2 = (layer_(n − 1) + layer_(n))
In Equation (5), we see that the ResNet++ architecture combines the two ResNet blocks. The ResNet1 architecture runs first, followed by the ResNet2 architecture.
ResNet++ = (ResNet1) + (ResNet2)
Equation (6) shows the internal structure of the ResNet1 and ResNet2 blocks.
ResNet++ = ((layer_(n − 2) + layer_(n − 1)) + (layer_(n − 1) + layer_(n)))
In Equation (7), the F3 (x) function is executed last. Here, the architecture turns into a single block structure, and the last two layers form a nested architecture called ResNet++.
ResNet++ = F3(x) + x
The ResNet++ block is implemented only in the final stage of the decoding phase, while the ResNet block is implemented in all phases. A detailed demonstration of this hybrid V-Net architecture is given in Table 1.
3.6. Dice Similarity Coefficient
The Dice similarity coefficient (DSC) measures the spatial similarity or overlap between two segmentations [41]. It is commonly used as a metric to evaluate the ground truth and segmentation performance in medical images [42]. Figure 9 shows the DSC area chart.
The DSC calculation is shown in Equation (8).
where S represents the result of segmentation and R is the corresponding ground-truth label. DSC is designed for image segmentation and is an accepted method to compare binary segmentation of the same image. Generally, a comparison is made between segmentation accuracy and the results of automatic or semiautomatic segmentation methods [43].
4. Results and Discussion
Having run the V-Net, fusion V-Net, the ET-Net, and the hybrid V-Net models, results were obtained and are discussed below in detail. All four models were run with the same hyperparameters, though all had different network architectures. We computed the Dice coefficient values for the kidneys, taking into account the ground-truth values and tumor labels.
The results shown in this section were calculated based on the average of the five-fold, cross-validation results obtained from the training dataset. Figure 10 demonstrates the five-fold, cross-validation algorithm scheme. Each section was run separately, and the average validation result was calculated. In this way, we aimed to obtain a higher validation sensitivity in the training phase.
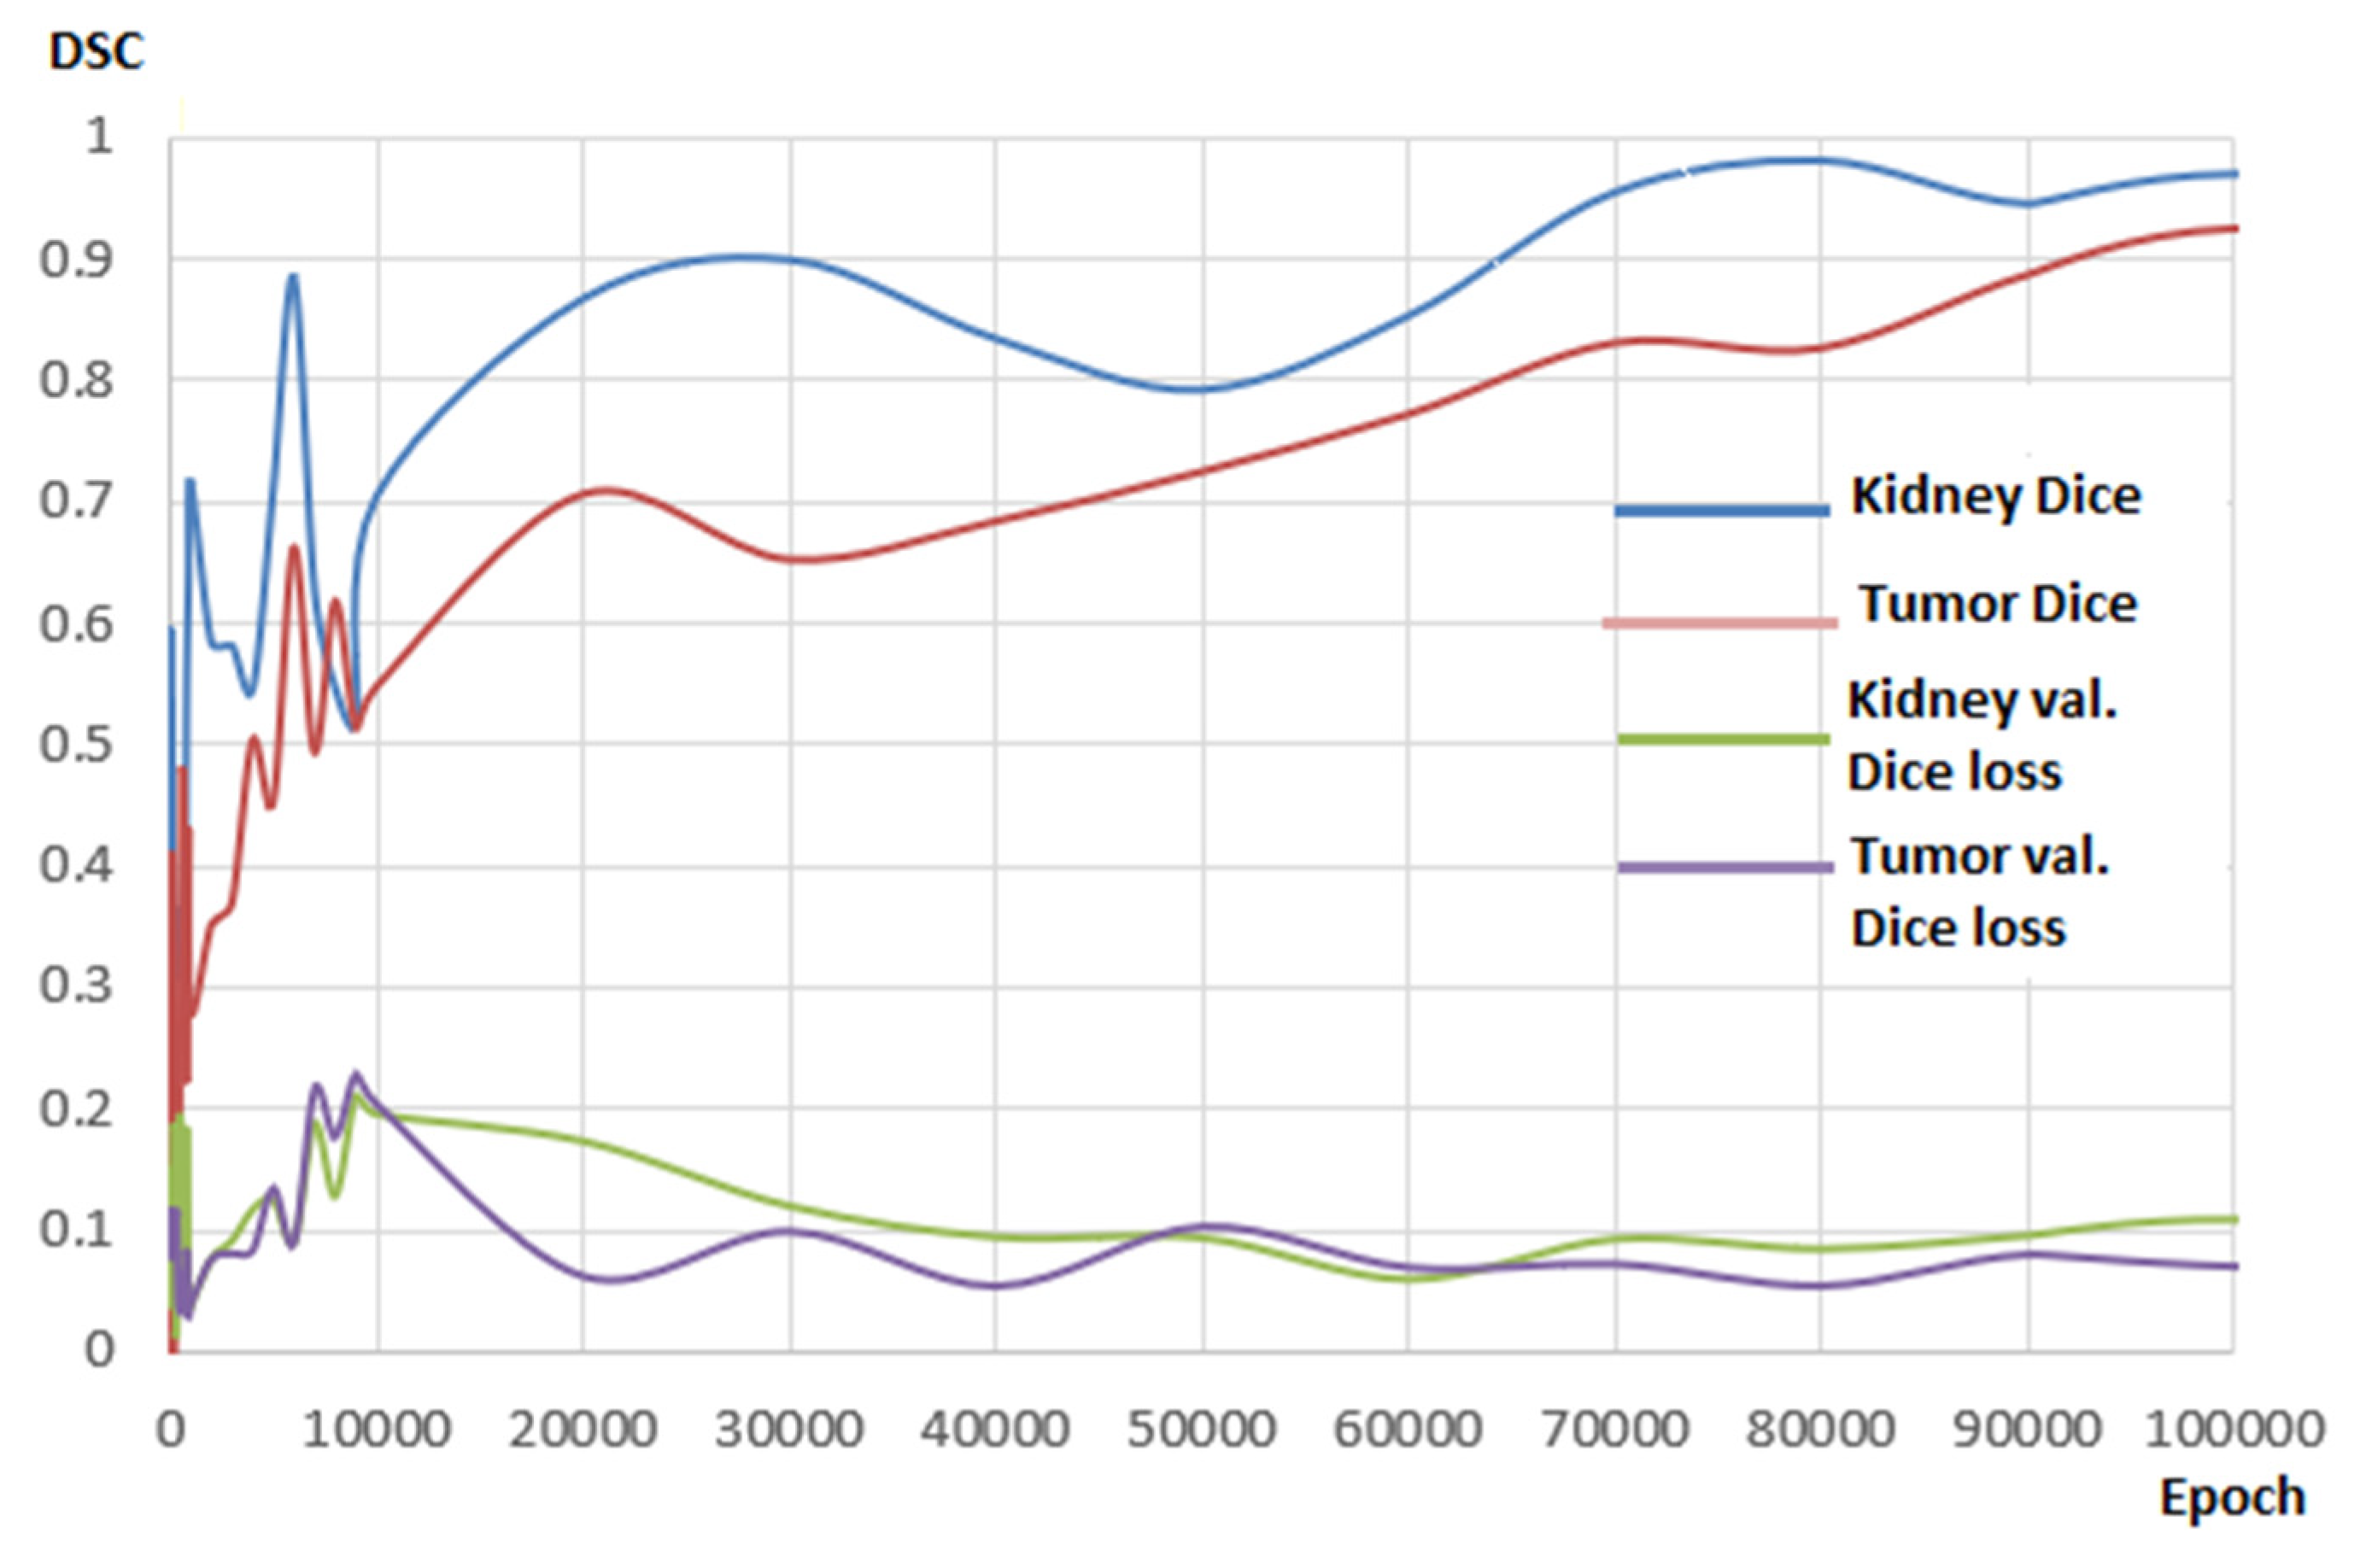
Figure 11 shows the kidney and tumor DSC graphs obtained during the training period. A wavy curve was observed during the early stages of the training, possibly because of the difficulty level of the segmentation. In the following steps, The DSC values were gradually fixed and reached the desired level. Validation Dice loss charts initially showed partial fluctuations but remained at low, reasonable levels thereafter.
Table 2 shows the Dice coefficients obtained from the validation and test results. The validation and test results indicated that all V-Net models achieved a certain success rate. For kidney segmentation, the classical V-Net model produced the most successful result, with a Dice coefficient of 0.940. For tumor segmentation, the hybrid V-Net model reached the highest Dice coefficient, at 0.865. However, the hybrid V-Net model, which achieved a more consistent and higher Dice coefficient than other models, seemed to be more successful in both kidney segmentation and tumor detection. As above, these results were obtained from the network architecture we prepared for this study using the KiTS19 training dataset.
Table 3 shows a general comparison of the results obtained from other kidney and renal tumor segmentation studies in the literature with the results obtained from this study. Although the datasets were different, our model seemed to be successful in calculating the Dice coefficient when kidney segmentation was taken into account. This model for kidney and kidney tumor segmentation was further compared with the model that came first in the Kits19 challenge. Although the training and test sets were not the same, our model seemed to be particularly successful in calculating the kidney tumor membrane coefficient. Currently, 90 test sets in the Kits19 challenge cannot be due to unavailable public access.
Tuncer and Alkan [19] were able to perform kidney segmentation on 100 images with a Dice coefficient of 0.893 using the decision support method, which is a machine learning model.
Cuingnet et al. [44] performed 3D kidney segmentation using the random forest machine-learning algorithm. The average Dice coefficient value reached 0.97.
Zheng et al. [45] developed an architecture called CNN + MSL, with which they performed precise segmentation, with a Dice coefficient of 0.905.
Milletari et al. [12], though the first implementers of the V-Net model, improved the U-Net model, aiming to achieve success particularly for organs of which segmentation is challenging. They ran the model on a total of 27 test sets and achieved a Dice coefficient of 0.856.
Chenglong et al. [46] developed a deep learning architecture based on Fully Convolutional Networks (FCN). They used the same dataset as Milletari et al. and were able to perform kidney segmentation with a Dice coefficient of 0.95.
Guanyu Yang et al. [20] developed a 3D-FCN-based deep learning architecture for the diagnosis of renal cancer. After testing this architecture on 140 patients, Dice coefficients of 0.931 and 0.802 were achieved for kidney and kidney tumor segmentation, respectively.
Price Jackson et al. [47] managed to segment the left and right kidneys with a CNN-based model, testing this architecture on 89 CT images and achieving Dice coefficients of 0.91 and 0.86 for the right and left kidneys, respectively.
Luana Btista et al. [26] developed a CNN-based model using the Kits19 dataset and achieved a Dice coefficient of 0.963.
Wenshuai Zhao et al. [29] developed a U-Net-based model and tested it on the Kits19 dataset, achieving Dice coefficients of 0.969 and 0.805 for kidney segmentation and tumor segmentation, respectively.
Isensee et al. [34] designed a U-Net-based model using the Kits19 challenge dataset, securing first place in the challenge. They obtained Dice coefficients of 0.979 and 0.854 for kidney and tumor segmentation, respectively.
As for the hybrid-based V-Net model designed in this work, the model achieved coefficients of 0.977 and 0.865 using the Kits19 dataset for kidney and tumor segmentation, respectively.
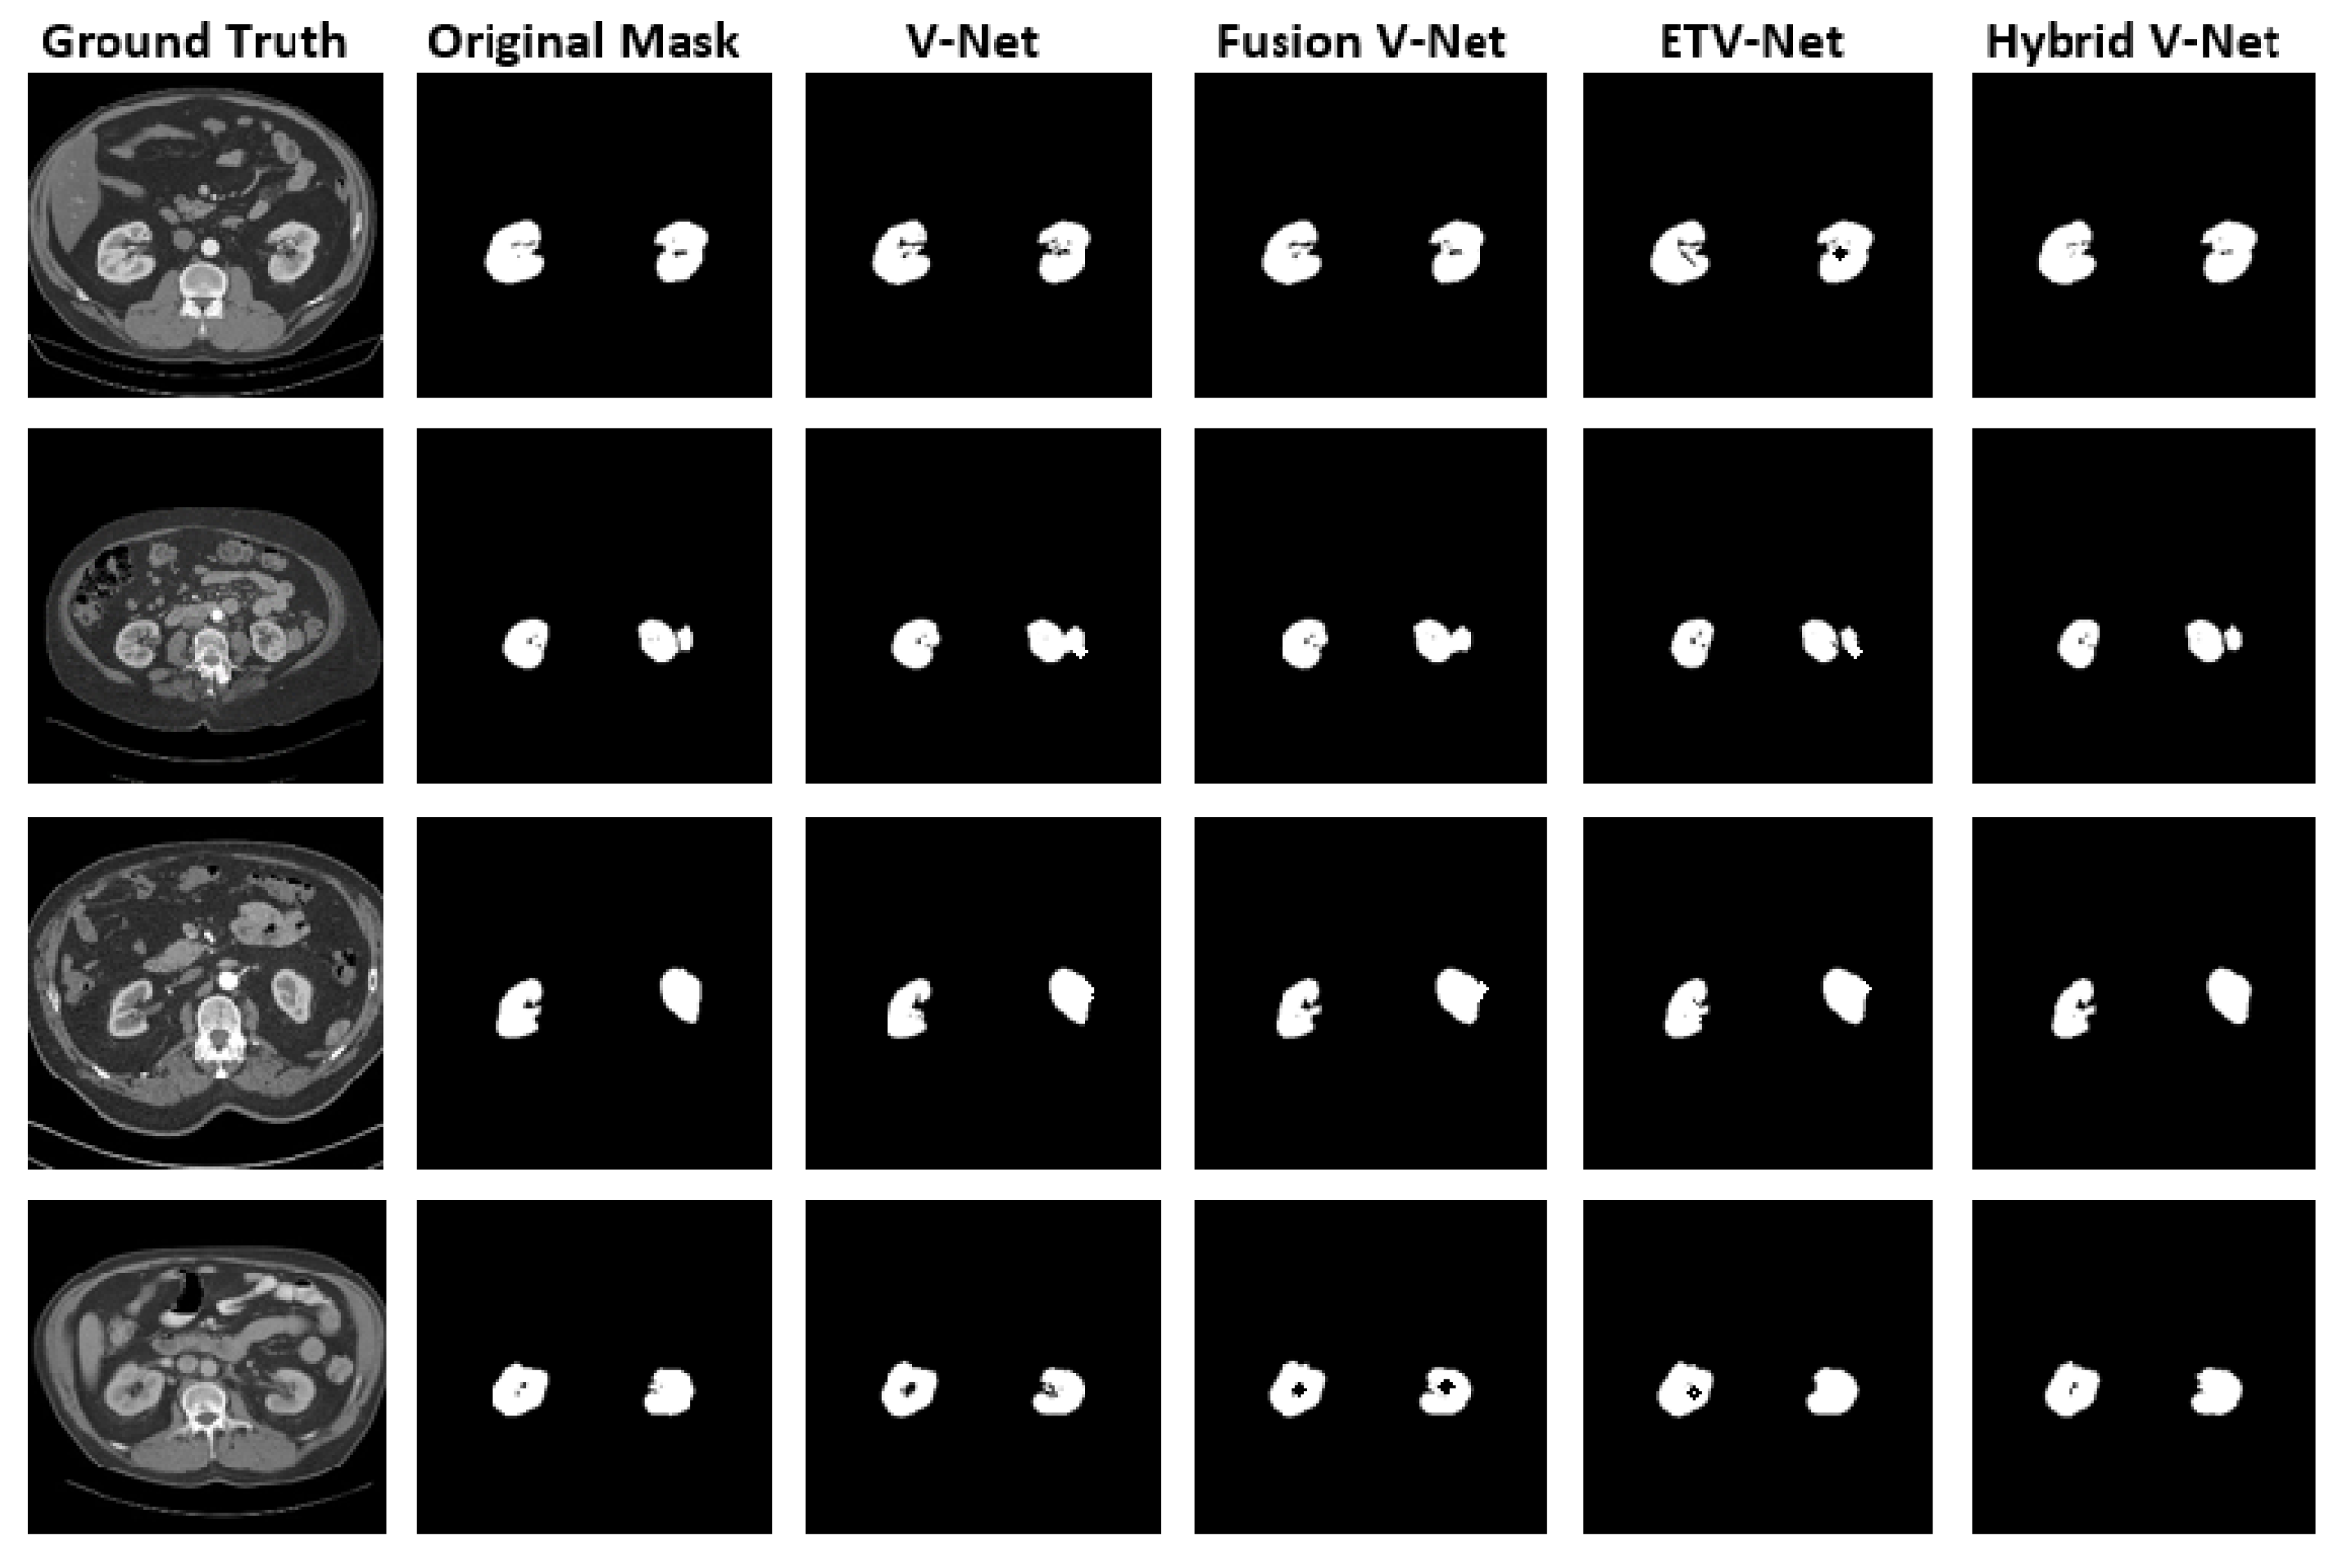
Figure 12 demonstrates the original images and masks used for kidney segmentation in V-Net models and the segmentation results. V-Net models demonstrate high training and test success, so the results appeared very similar. However, a closer look revealed that the hybrid V-Net model was more successful than the current V-Net models in detecting small details, suggesting that the improvements made in the hybrid V-Net model yielded positive results.
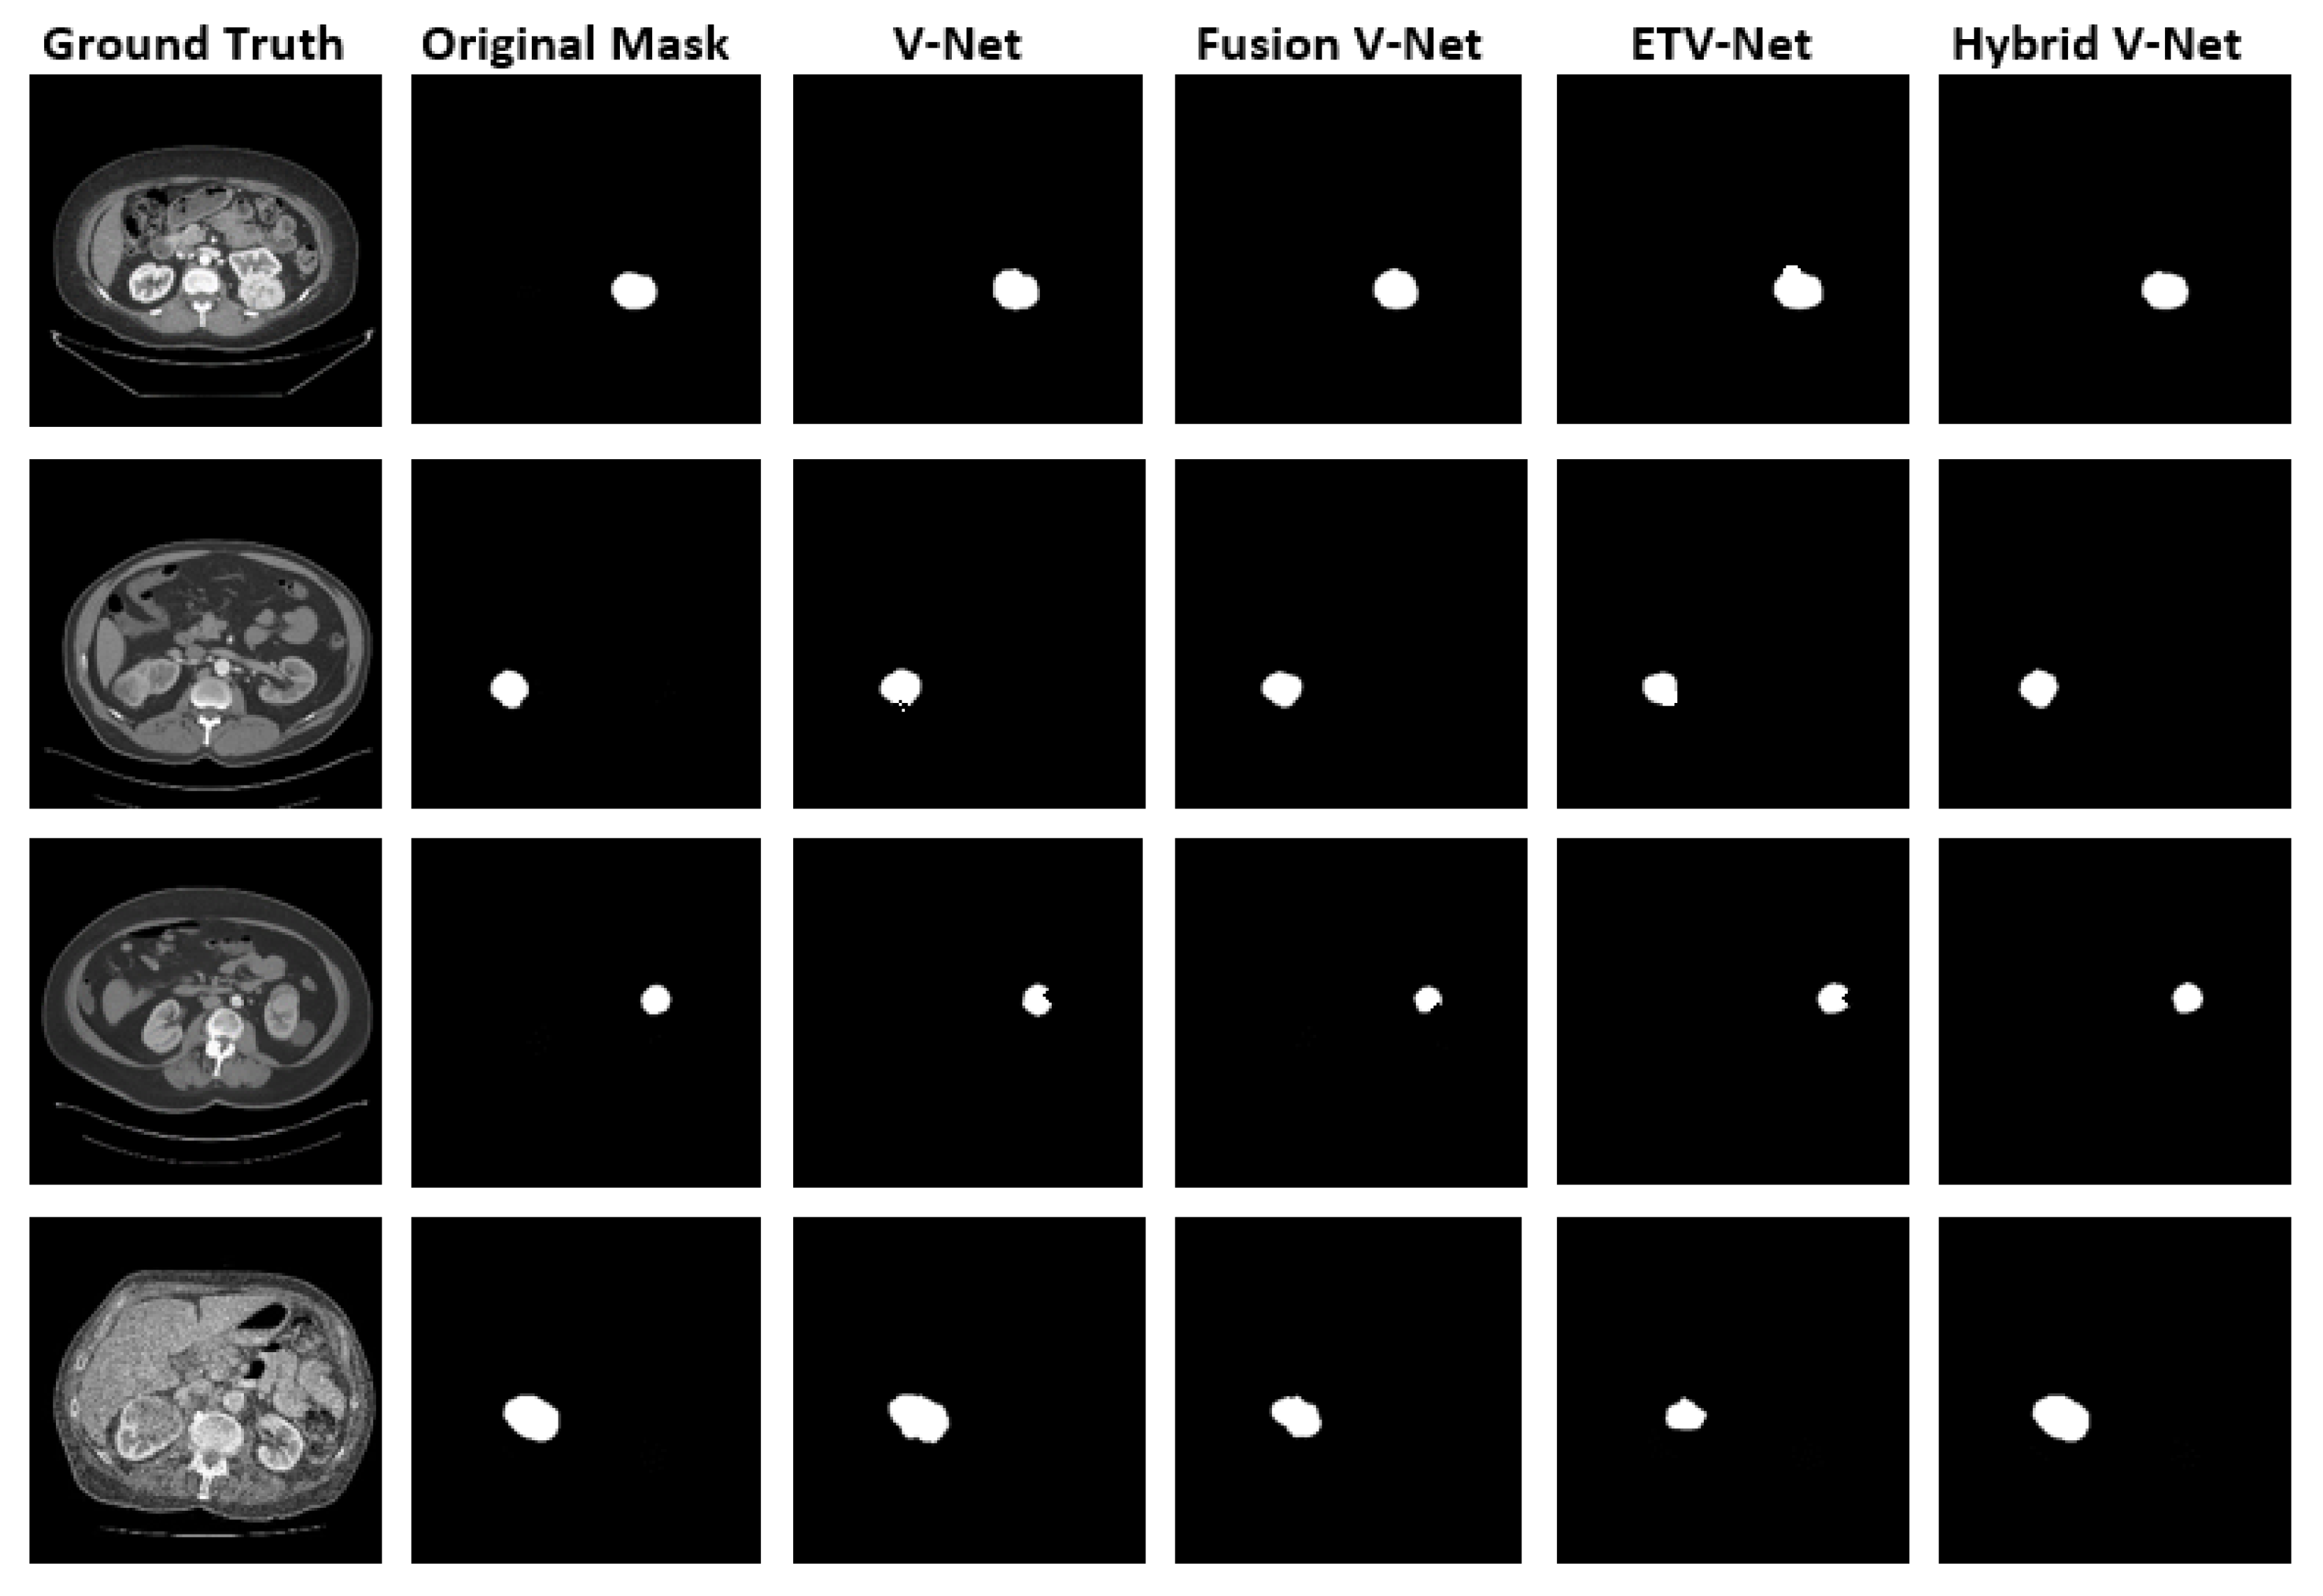
Figure 13 shows the original images and masks used for renal tumor segmentation in the V-Net models and the segmentation results. The figure indicates that each V-Net model achieved an acceptable success rate for kidney tumors. Comparing manual segmentation results for tumor detection, the hybrid V-Net model successfully demonstrated the details, even drawn with sharp lines in many cases. The hybrid V-Net model produced more successful output in the encoder portion when integrated with the fusion V-Net model and in the decoder portion in combination with the ETV-Net model.
Our hypothesis was supported by the fact that the hybrid V-Net model, developed for soft tissues where kidney and tumor segmentation are challenging, yielded more successful results than other models. We, therefore, designed a model that produced better results by improving the existing V-Net models. Inspired by the fusion architecture, we used the encoder phase as two separate encoder phases and combined the layers in the decoder phase to capture edge features. As a result, we obtained a model with better performance. It is evident from the Dice coefficient results we obtained that, with the effect of the ResNet++ block on the output, the model can capture even small details. However, despite the improvements in the hybrid V-Net model, the training took an average of five days. In saying that, considering the additional processing volume in this model (such as ResNet++), our model could be thought to run faster than existing models. The creation of new models to shorten the training period is possible in our future studies. We should also emphasize that such fully automatic segmentation systems as Fuzzy C-Means clustering and iterative optimal threshold selection algorithms [33] can be more successful on existing datasets, considering the difficulties of manual segmentation such as processing time and detection of errors in the segmentation process.
5. Conclusions
In this study, we proposed a new hybrid V-Net model using the superior features of existing V-Net models. We ran four models, including the hybrid V-Net model, on this dataset and performed kidney and tumor segmentation separately. The results showed that the hybrid V-Net model yielded more successful results for kidney and renal tumor segmentation than other V-Net models, with rates of 0.977 and 0.865 DSC, respectively.
This study showed that V-Net models successfully perform organ and tumor segmentation via computerized images and that more successful models can be developed from existing V-Net models by considering the encoding and decoding stages separately. More suitable models could be designed for multiple organ segmentation using medical images. This study could also be used as a guide for future hybrid models as the success of the implementation of the hybrid V-Net model for the first time was positively contributed to by the ResNet++ architecture. The ResNet++ architecture was applied only to the output layer, making it possible to capture small details in the segmentation. This situation is extremely important for model design because each parameter can only be successful when added to the appropriate blocks of the model. The results presented here suggest that more research regarding the hyperparameters of this model is pertinent.
Following this study, we aim to investigate the shortcomings of our hybrid V-Net model; by eliminating these, we plan to develop more practical systems for kidney or other organ segmentation in medical imaging. Future studies regarding deep learning designs, especially in the field of medical imaging, should not be based on systems with complex structures. On the contrary, research should be concentrated on areas where better results can be obtained with small improvements to existing models (such as changing hyperparameters), thereby removing unnecessary load and improving existing model effectiveness. Future studies should further focus on shortening the training period of deep learning models. It is necessary to simplify the systems to which the models could be applied and reduce complexity to develop more successful models that can be used in various fields.
Author Contributions
Conceptualization, F.T. and N.B; methodology, F.T.; software, F.T.; validation, F.T., M.L. and N.B; writing—original draft preparation, F.T.; writing—review and editing, F.T. and N.B.; visualization, M.L. All authors have read and agreed to the published version of the manuscript.
Funding
This research received no external funding.
Acknowledgments
We would like to thank Tubitak TRUBA for its services in artificial intelligence.
Conflicts of Interest
The authors declare no conflict of interest.
References
- Bray, F.; Me, J.F.; Soerjomataram, I.; Siegel, R.; Torre, L.A.; Jemal, A. Global cancer statistics 2018: GLOBOCAN estimates of incidence and mortality worldwide for 36 cancers in 185 countries. CA Cancer J. Clin. 2018, 68, 394–424. [Google Scholar] [CrossRef] [PubMed] [Green Version]
- Heller, N.; Sathianathen, N.; Kalapara, A.; Walczak, E.; Moore, K.; Kaluzniak, H.; Rosenberg, J.; Blake, P.; Rengel, Z.; Oestreich, M.; et al. The KiTS19 Challenge Data: “300 Kidney Tumor Cases with Clinical Context, CT Semantic Segmentations, and Surgical Outcomes”. arXiv 2019, arXiv:1904.00445. [Google Scholar]
- Chow, W.H.; Dong, L.M.; Devesa, S.S. Epidemiology and risk factors for kidney cancer. Nat. Rev. Urol. 2010, 7, 245–257. [Google Scholar] [CrossRef] [PubMed]
- Melisai, J.; Monoarfa, A.; Tjandra, F. Profil Penderita Karsinoma Sel Ginjal (Renal Cell Carcinoma). e-Clinic 2016, 4, 2. [Google Scholar]
- Calıskan, S.; Koca, O.M.; Akyuz, M.I. Böbrek tümörü öntanısıyla radikal veya parsiyel nefrektomi yapılan hastalardaki benign tümörler. New J. Urol. 2014, 9, 34–37. [Google Scholar]
- Tangal, S.; Önal, K.; Yığman, M.; Haliloğlu, A.H. Relation of neutrophil lymphocyte ratio with tumor characteristics in localized kidney tumors. New J. Urol. 2018, 13, 12–15. [Google Scholar]
- Sun, M.; Abdollah, F.; Bianchi, M.; Trinh, Q.D.; Jeldres, C.; Thuret, R.; Tian, Z.; Shariat, S.F.; Montorsi, F.; Perrotte, P.; et al. Treatment management of small renal masses in the 21st century: A paradigm shift. Ann. Surg. Oncol. 2012, 19, 2380–2387. [Google Scholar] [CrossRef]
- Mir, M.C.; Darwish, I.; Porpiglia, F.; Zargar, H.; Mottrie, A.; Autorino, R. Partial nephrectomy versus radical nephrectomy for clinical t1b and t2 renal tumors: A systematic review and meta-analysis of comparative studies. Eur. Urol. 2017, 71, 606–617. [Google Scholar] [CrossRef] [PubMed]
- YU, Q.; Shi, Y.; Sun, J.; Gao, Y.; Dai, Y.; Zhu, J. Crossbar-net: “A novel convolutional network for kidney tumor segmentation in ct images”. arXiv 2018, arXiv:1804.10484. [Google Scholar] [CrossRef] [PubMed] [Green Version]
- Yang, G.; Gu, J.; Chen, Y.; Liu, W.; Tang, L.; Shu, H.; Toumoulin, C. Automatic kidney segmentation in ct images based on multi-atlas image registration. In Proceedings of the 36th Annual International Conference of the IEEE Engineering in Medicine and Biology Society, Chicago, IL, USA, 26–30 August 2014; pp. 5538–5541. [Google Scholar]
- Mohanapriya, D.; Kalaavathi, B. Adaptive Image Enhancement Using Hybrid Particle Swarm Optimization and Watershed Segmentation. Intell. Autom. Soft Comput. 2019, 25, 663–672. [Google Scholar] [CrossRef]
- Milletari, F.; Nassir, N.; Ahmadi, S.A. V-Net: Fully Convolutional Neural Networks for Volumetric Medical Image Segmentation. In Proceedings of the 2016 Fourth International Conference on 3D Vision (3DV), Stanford, CA, USA, 25–28 October 2016; pp. 565–571. [Google Scholar]
- Zeiler, M.D.; Fergus, R. Visualizing and understanding convolutional networks. In Computer Vision–ECCV; Springer: Cham, Switzerland, 2014; pp. 818–833. [Google Scholar]
- Lingurarua, M.G.; Yaoa, J.; Gautamb, R.; Petersonb, J.; Li, Z.; Linehanb, W.M.; Ronald, M.S. Renal tumor quantification and classification in contrast-enhanced abdominal CT. Pattern Recognit. 2009, 42, 1149–1161. [Google Scholar] [CrossRef] [PubMed] [Green Version]
- Burkill, G.; Allen, S.; A’hern, R.; Gore, M.; King, D. Significance of tumour calcification in ovarian carcinoma. Br. J. Radiol. 2009, 82, 640–644. [Google Scholar] [CrossRef] [PubMed]
- Rundo, L.; Beer, L.; Ursprung, S.; Gonzalez, P.M.; Markowetz, F.; James, D.B.; Ortuzar, M.C.; Sala, E.; Woitek, R. Tissue-specific and interpretable sub-segmentation of whole tumour burden on CT images by unsupervised fuzzy clustering. Comput. Biol. Med. 2020, 120, 103751. [Google Scholar] [CrossRef] [PubMed]
- Xin, Y.; Minh, H.L.; Cheng, K.T.; Sung, K.H.; Liu, W. Renal Compartment segmentation in DCE-MRI images. Med. Image Anal. 2016, 32, 269–280. [Google Scholar]
- Xiang, D.; Ulas, B.; Jin, C.; Shi, F.; Zhu, W.; Yao, J.; Sonka, M.; Chen, X. CorteXpert: “A model-based method for automatic renal cortex segmentation”. Med. Image Anal. 2017, 42, 257–273. [Google Scholar] [CrossRef]
- Tuncer, S.A.; Alkan, A. A decision support system for detection of the renal cell cancer in the kidney. Measurument 2018, 298, 303. [Google Scholar] [CrossRef]
- Yang, G.; Guoqing, T.; Pan, Y.; Kong, J.; Wu, H.; Shu, L. Automatic Segmentation of Kidney and Renal Tumor in CT Images Based on 3D Fully Convolutional Neural Network with Pyramid Pooling Module. In Proceedings of the 2018 24th International Conference on Pattern Recognition (ICPR), Beijing, China, 20–24 August 2018. [Google Scholar]
- Marie, F.; Corbat, L.; Chaussy, Y.; Delavelle, T.; Henriet, J.; Christophe., J. Segmentation Of deformed kidneys and nephroblastoma using Case-Based Reasoning and Convolutional Neural Network. Expert Syst. Appl. 2019, 127, 282–294. [Google Scholar] [CrossRef] [Green Version]
- Couteaux, V.; Si-Mohamed, S.; Renard-Penna, R.; Nempont, O.; Lefevre, T.; Popoff, A.; Pizaine, G.; Villain, N.; Bloch, I.; Behr, J.; et al. Kidney cortex segmentation in 2D CT with U-Nets ensemble aggregation. Diagn. Interv. Imaging 2019, 100, 211–217. [Google Scholar] [CrossRef]
- Antoniya, D.; Mihaylova, M.; Georgieva, P.; Petrov, P.P.; Aleksandar, T. Novel Algorithm for Segmentation of Renal cyst from CT Image Sequence. In Proceedings of the 2019 14th International Conference on Advanced Technologies, Systems and Services in Telecommunications (TELSIKS), Nis, Serbia, 23–25 October 2019. [Google Scholar]
- Rundo, L.; Han, C.; Nagano, Y.; Zhang, J.; Hataya, R.; Militello, C.; Tangherloni, A.; Nobile, M.S.; Ferretti, C.; Besozzi, D.; et al. USE-Net: Incorporating Squeeze-and-Excitation blocks into U-Net for prostate zonal segmentation of multi-institutional MRI datasets. Neurocomputing 2019, 365, 31–43. [Google Scholar] [CrossRef] [Green Version]
- Fuzhe, M.; Sun, L.; Liu, H.; Jing, H. Detection and diagnosis of chronic kidney disease using deep learning-based heterogeneous modified artificial neural network. Future Gener. Comput. Syst. 2020, 111, 17–26. [Google Scholar]
- CruzaJosé, L.B.; Lima, D.; Jonnison, A.; Ferreira, L.; Otávio, J.; Dinizab, B.; Corrêa, A.; João, S.; Sousade, D.; Anselmo, A.; et al. Kidney segmentation from computed tomography images using deep neural network. Comput. Biol. Med. 2020, 123, 103906. [Google Scholar]
- Li, C.; Tan, Y.; Chen, W.; Luo, X.; He, Y.; Gao, Y.; Li, F. ANU-Net: Attention-based Nested U-Net To exploit full resolution features for medical image segmentation. Comput. Graph. 2020, 90, 11–20. [Google Scholar] [CrossRef]
- Nithya, A.; Appathurai, A.; Venkatadric, N.; Ramjia, D.R.; Anna Palagan, C. Kidney disease detection and segmentation using artificial neural network and multi-kernel k-means clustering for ultrasound images. Measurement 2020, 149, 106952. [Google Scholar] [CrossRef]
- Zhao, W.; Jiang, D.; Queralta, J.P.; Westerlund, T. MSS U-Net: 3D segmentation of kidneys and tumors from CT images with a multi-scale supervised U-Net. Inform. Med. 2020, 19, 100357. [Google Scholar] [CrossRef]
- Isensee, F.; Jäger, P.F.; Kohl, S.A.; Petersen, J.; Maier-Hein, K.H. Automated Design of Deep Learning Methods for Biomedical Image Segmentation. arXiv 2019, arXiv:1904.08128. [Google Scholar]
- The Cancer Imaging Archive (TCIA). 10 October 2020. Available online: https://wiki.cancerimagingarchive.net/pages/viewpage.action?pageId=61081171 (accessed on 13 October 2020).
- The KiTS19 Grand Challenge). 10 October 2020. Available online: https://kits19.grand-challenge.org/data/ (accessed on 13 October 2020).
- Militello, C.; Vitabile, S.; Rundo, L.; Russo, G.; Midiri, M.; Gilardi, M.C. A fully automatic 2D segmentation method for uterine fibroid in MRgFUS treatment evaluation. Comput. Biol. Med. 2015, 62, 277–292. [Google Scholar] [CrossRef]
- Isensee, F.; Jäger, P.F.; Kohl, S.A.A.; Petersen, J.; Maier-Hein, K.H. The state of the art in kidney and kidney tumor segmentation in contrast-enhanced CT imaging: Results of the KiTS19 Challenge. arXiv 2019, arXiv:1912.01054. [Google Scholar]
- Ronneberger, O.; Fischer, P.; Brox, T. U-net: Convolutional networks for biomedical image segmentation. In Medical Image Computing and Computer-Assisted Intervention–MICCAI; Springer: Berlin, Germany, 2015; pp. 234–241. [Google Scholar]
- Yifei, Z.; Olivier, M.; Blanchon, M.; Seulin, R.; Rastgoo, M.; Sidibé, D. Exploration of Deep Learning-based Multimodal Fusion for Semantic Road Scene Segmentation. VISAPP 2019. [CrossRef]
- Zhang, Z.; Huazhu, F.; Dai, H.; Shen, J.; Pang, Y.; Shao, L. ET-Net: A Generic Edge-aTtention Guidance Network for Medical Image Segmentation. arXiv 2019, arXiv:1907.10936v1. [Google Scholar]
- Fu, H.; Cheng, J.; Xu, Y.; Wong, D.W.K.; Liu, J.; Cao, X. Joint Optic Disc and Cup Segmentation Based on Multilabel Deep Network and Polar Transformation. IEEE Trans. Med. Imaging 2018, 37, 1597–1605. [Google Scholar] [CrossRef] [Green Version]
- Wang, W.; Shen, J.; Ling, H. A deep network solution for attention and aesthetics aware photo cropping. IEEE Trans. Pattern Anal. Mach. Intell. 2019, 41, 1531–1544. [Google Scholar] [CrossRef] [PubMed]
- He, K.; Zhang, X.; Ren, S.; Sun, J. Deep Residual Learning for Image Recognition. In Proceedings of the IEEE Conference on Computer Vision and Pattern Recognition (CVPR), Las Vegas, NV, USA, 27–30 June 2016; pp. 770–778. [Google Scholar]
- Sudre, C.H.; Li, W.; Vercauteren, T.; Ourselin, S.; Cardoso, M.J. Generalized Dice overlap as a deep learning loss function for highly unbalanced segmentations. In Deep Learning in Medical Image Analysis and Multimodal Learning for Clinical Decision Support; DLMIA 2017, Lecture Notes in Computer Science; Springer: Berlin, Germany, 2017; Volume 10553, pp. 240–248. [Google Scholar]
- Chen, S.; Holger, R.; Hirohisa, O.; Masahiro, O.; Yuichiro, H.; Kazunari, M.; Kensaku, M. On the influence of Dice loss function in multi-class organ segmentation of abdominal CT using 3D fully convolutional networks. arXiv 2018, arXiv:1801.05912v1. [Google Scholar]
- Andrews, S.; Hamarneh, G. Multi-Region Probabilistic Dice Similarity Coefficient using the Aitchison Distance and Bipartite Graph Matching. arXiv 2015, arXiv:1509.07244v3. [Google Scholar]
- Cuingnet, R.; Prevost, R.; Lesage, D.; Cohen, L.D.; Mory, B.; Ardon, R. Automatic Detection and Segmentation of Kidneys in 3D CT Images Using Random Forests. In International Conference on Medical Image Computing and Computer-Assisted Intervention, MICCAI; Springer: Berlin, Germany, 2012; pp. 66–74. [Google Scholar]
- Zheng, Y.; Georgescu, B.; Ling, H.; Zhou, S.K.; Scheuering, M.; Comaniciu, D. Constrained marginal space learning for efficient 3D anatomical structure detection in medical images. In Proceedings of the Conference on Computer Vision and Pattern Recognition (CVPR), Miami, FL, USA, 20–25 June 2009. [Google Scholar]
- Wanga, C.; Roth, H.R.; Kitasakac, T.; Oda, M.; Hayashi, Y.; Yoshino, Y.; Yamamoto, T.; Sassa, N.; Goto, M.; Mori, K. Precise estimation of renal vascular dominant regions using spatially aware fully convolutional networks, tensor-cut and Voronoi diagrams. Comput. Med. Imaging Graph. 2019, 77, 101642. [Google Scholar] [CrossRef] [PubMed] [Green Version]
- Jackson, P.; Hardcastle, N.; Dawe, N.; Kron, T.; Hofman, M.S.; Hicks, R.J. Deep Learning Renal Segmentation for Fully Automated Radiation Dose Estimation in Unsealed Source Therapy. Front. Oncol. 2018, 8, 215. [Google Scholar] [CrossRef] [PubMed] [Green Version]
Publisher’s Note: MDPI stays neutral with regard to jurisdictional claims in published maps and institutional affiliations. |
Figure 1.
A kidney image prepared by manual segmentation.

Figure 2.
(Left): 3D volume rendering of the segmented regions (kidney and renal cancer in blue and purple). (Right): 2D kidney and renal cancer image.
Figure 2.
(Left): 3D volume rendering of the segmented regions (kidney and renal cancer in blue and purple). (Right): 2D kidney and renal cancer image.

Figure 3.
Schematic representation of the V-Net architecture consisting of encoder and decoder phases with a classical structure.
Figure 3.
Schematic representation of the V-Net architecture consisting of encoder and decoder phases with a classical structure.

Figure 4.
Schematic representation of the fusion V-Net architecture. The encoder phase consists of two fusion blocks, while the decoder phase consists of the classical V-Net block.
Figure 4.
Schematic representation of the fusion V-Net architecture. The encoder phase consists of two fusion blocks, while the decoder phase consists of the classical V-Net block.

Figure 5.
Late fusion architecture.

Figure 6.
ET-Net architecture.

Figure 7.
Schematic representation of the hybrid V-Net architecture. The encoder phase consists of two fusion blocks while the decoder phase consists of the ET-Net architecture and the output layer ResNet++ blocks.
Figure 7.
Schematic representation of the hybrid V-Net architecture. The encoder phase consists of two fusion blocks while the decoder phase consists of the ET-Net architecture and the output layer ResNet++ blocks.

Figure 8.
ResNet++ architecture.

Figure 9.
Dice similarity coefficient.

Figure 10.
Five-fold, cross-validation algorithm scheme.

Figure 11.
Kidney and tumor Dice and validation Dice loss.

Figure 12.
Original input CT images and kidney segmentation output images.

Figure 13.
Original input CT images and kidney tumor segmentation output images.


Table 1.
Hybrid V-Net model architecture.
| Layer | Input Size (x1, x2) | Operators | Layer | Input Size (x) | Operators |
|---|---|---|---|---|---|
| L-Stage1 | 3 × 3 × 3 × image channel × 16(input) | Conv, Rectified Lineer Unit (ReLU), ResNet | R-Stage1 | 3 × 3 × 3 × 256 × 128 | Up conv, ReLU, ResNet |
| L-Stage2 | 3 × 3 × 3 × (16 × 2) × 16 | Down conv, ReLU, ResNet | R-Stage2 | 3 × 3 × 3 × 128 × 64 | Up conv, ReLU, ResNet |
| L-Stage3 | 3 × 3 × 3 × (32 × 2) × 32 | Down conv, ReLU, ResNet | R-Stage3 | 3 × 3 × 3 × 64 × 32 | Up conv, ReLU, ResNet |
| L-Stage4 | 3 × 3 × 3 × (64 × 2) × 64 | Down conv, ReLU, ResNet | R-Stage4 | 3 × 3 × 3 × 32 × 16 | Up conv, ReLU, ResNet |
| L-Stage5 | 3 × 3 × 3 × (128 × 2) × 128 | Down conv, ReLU, ResNet | R-Stage5 | 3 × 3 × 3 × 16 × 16 | Up conv, ReLU, ResNet++ |
| L-Stage6 | 3 × 3 × 3 × (256 × 2) × 256 | Down conv, ReLU, ResNet | R-Stage6 | 1 × 1 × 1 × 16 × 16 | EGM, WAM, conv sigmoid (output) |
Table 2.
Testing and validation Dice similarity coefficient (DSC) of the four models.
| Kidney Dice | Tumor Dice | Composite | |||
|---|---|---|---|---|---|
| Model | DSC Val. | DSC Test | DSC Val. | DSC Test | Test |
| V-Net | 0.940 | 0.951 | 0.919 | 0.823 | 0.887 |
| Fusion V-Net | 0.861 | 0.937 | 0.923 | 0.835 | 0.886 |
| ET-Net | 0.925 | 0.886 | 0.905 | 0.818 | 0.852 |
| Hybrid V-Net | 0.937 | 0.977 | 0.931 | 0.865 | 0.921 |
Table 3.
Comparison of kidney and tumor segmentation methods for Computed Tomography (CT) images.
| Reference | Method | Case Num | Kidney Dice-Tumor Dice |
|---|---|---|---|
| Tuncer and Alkan [19] | Decision support | 100 images | 0.893 |
| Cuingnet et al. [44] | Random forest | Train: 233, Test: 179 | 0.97 |
| Zheng et al. [45] | CNN + MSL | Train: 370, Test: 78 | 0.905 |
| Milletari et al. [12] | VNet | 27 (8-fold) | 0.856 |
| Chenglong et al. [46] | FCN based | 27 (8-fold) | 0.95 |
| Guanyu Yang et al. [20] | 3DFCN-PPM | 140 patients | 0.931 |
| Price Jackson et al. [47] | CNN | 89 images | 0.91,0.86 0.979–0.854 |
| Luana Batista da Cruz et al. [26] | CNN | Train: 179, Test: 31 | 0.963 |
| Wenshuai Zhao et al. [29] | U-Net | Train: 168, Test: 42 | 0.969–0.805 Comp. (0.887) |
| Isensee et al. [34] | nnU-Net | Train: 210, Test: 90 | 0.979–0.854 Comp. (0.916) |
| Our Hybrid V-Net | V-Net | Train: 190, Test: 20 | 0.977–0.865 Comp. (0.921) |
© 2020 by the authors. Licensee MDPI, Basel, Switzerland. This article is an open access article distributed under the terms and conditions of the Creative Commons Attribution (CC BY) license (http://creativecommons.org/licenses/by/4.0/).
Share and Cite
MDPI and ACS Style
Türk, F.; Lüy, M.; Barışçı, N. Kidney and Renal Tumor Segmentation Using a Hybrid V-Net-Based Model. Mathematics 2020, 8, 1772. https://0-doi-org.brum.beds.ac.uk/10.3390/math8101772
AMA Style
Türk F, Lüy M, Barışçı N. Kidney and Renal Tumor Segmentation Using a Hybrid V-Net-Based Model. Mathematics. 2020; 8(10):1772. https://0-doi-org.brum.beds.ac.uk/10.3390/math8101772
Chicago/Turabian StyleTürk, Fuat, Murat Lüy, and Necaattin Barışçı. 2020. "Kidney and Renal Tumor Segmentation Using a Hybrid V-Net-Based Model" Mathematics 8, no. 10: 1772. https://0-doi-org.brum.beds.ac.uk/10.3390/math8101772
Note that from the first issue of 2016, this journal uses article numbers instead of page numbers. See further details here.