1. Introduction
Changes in global climate, societal and cultural pressures, and a rapid decrease in the cost of renewable technologies have stimulated the increased participation of intermittent renewable energy sources in the power generation grid [
1]. Analysis and projections of electricity generation fuels show an increase of natural gas and renewables participation, along with a decrease in coal usage. Specifically, by 2050, it is expected for the natural gas participation to increase from 34% to 39%, while the renewables participation to increase from 18% to 31%, and the coal participation to decrease from 28% to 17% [
2]. Within the renewable energy sources, the two technologies enabling the rapid deployment are wind and solar [
2]. Intermittent or variable renewable energy sources, such as solar and wind, are known to be non-dispatchable, i.e., the energy is only available when the fuel source is available and cannot be produced as required by the demand. Furthermore, solar and wind are also known to have limited alignment with electricity demand [
3], e.g., the period when the availability of the renewable energy sources peaks is not necessarily the same period when the electricity demand peaks. Thus, baseload thermal power plants, such as natural gas-fired and coal-fired power plants, are often allocated to supply the net load demand [
4]. The behavior of ramping up/down the baseload power plants to accommodate variability, which could have various sources such as demand variability or renewables variability, will be considered from now on in the paper as cycling of the power plant. Some of the main concerns associated with an increase in cycling of baseload power plants are the power plant minimum operating loads, environmental performance during cycling, and the potential of prohibitive ramping rates. Therefore, at high penetration rates, the integration of variable renewable energy sources into the grid becomes even more challenging.
Regarding coal, although its usage is predicted to decrease, it still has a significant participation [
2] in electricity generation. The competition between coal, natural gas, and renewable sources [
5] has discouraged the launching of new coal-fired power plants. Thus, there is a high possibility that most of the coal-fired power plants being utilized are originally designed to be operated in a baseload manner. Furthermore, these coal-fired power plants are mostly operated at off-design conditions to provide flexible power generation [
6]. Enforcing cycling operation on designed baseload power plants may introduce inefficiencies to the systems, as these plants are no longer operating at their optimal design points. Cycling may also increase the emissions from the power plant side and decrease the power plant lifetime due to unexpected wear and tear [
4,
6].
One way to attenuate the increase in wear and tear in power plants would be to consider the damage that the equipment could suffer when subjected to cycling operations. Researches regarding damage models show that fatigue and creep damages can be estimated considering start-up [
7] as well as partial load operations [
8]. Consequently, start-up procedure or the design optimization of specific components can be determined to improve the lifetime under cycling. However, currently, there is a gap in how the wear and tear knowledge may be applied during the optimal dispatch of power plants under cycling operation.
Additionally, without a sufficiently flexible grid, thermal power plants may not be able to reduce their power output, and wind and solar generation need to be restricted [
3]. For instance, a key limiting factor for deploying photovoltaics (PV) is curtailment, i.e., the generated PV energy would need to be rejected by system operators to maintain the supply/demand balance of the system [
9]. As curtailment increases, the solar/wind energy offsets less fossil-based generation. Demand response and storage are enabling technologies that could reduce curtailment and facilitate higher penetrations of intermittent renewables into the grid [
3,
10]. In addition, if natural gas prices were to rise in the future, a large-scale energy system based on such technologies may be used in utility and industrial scales at a lower level of CO
2 emissions [
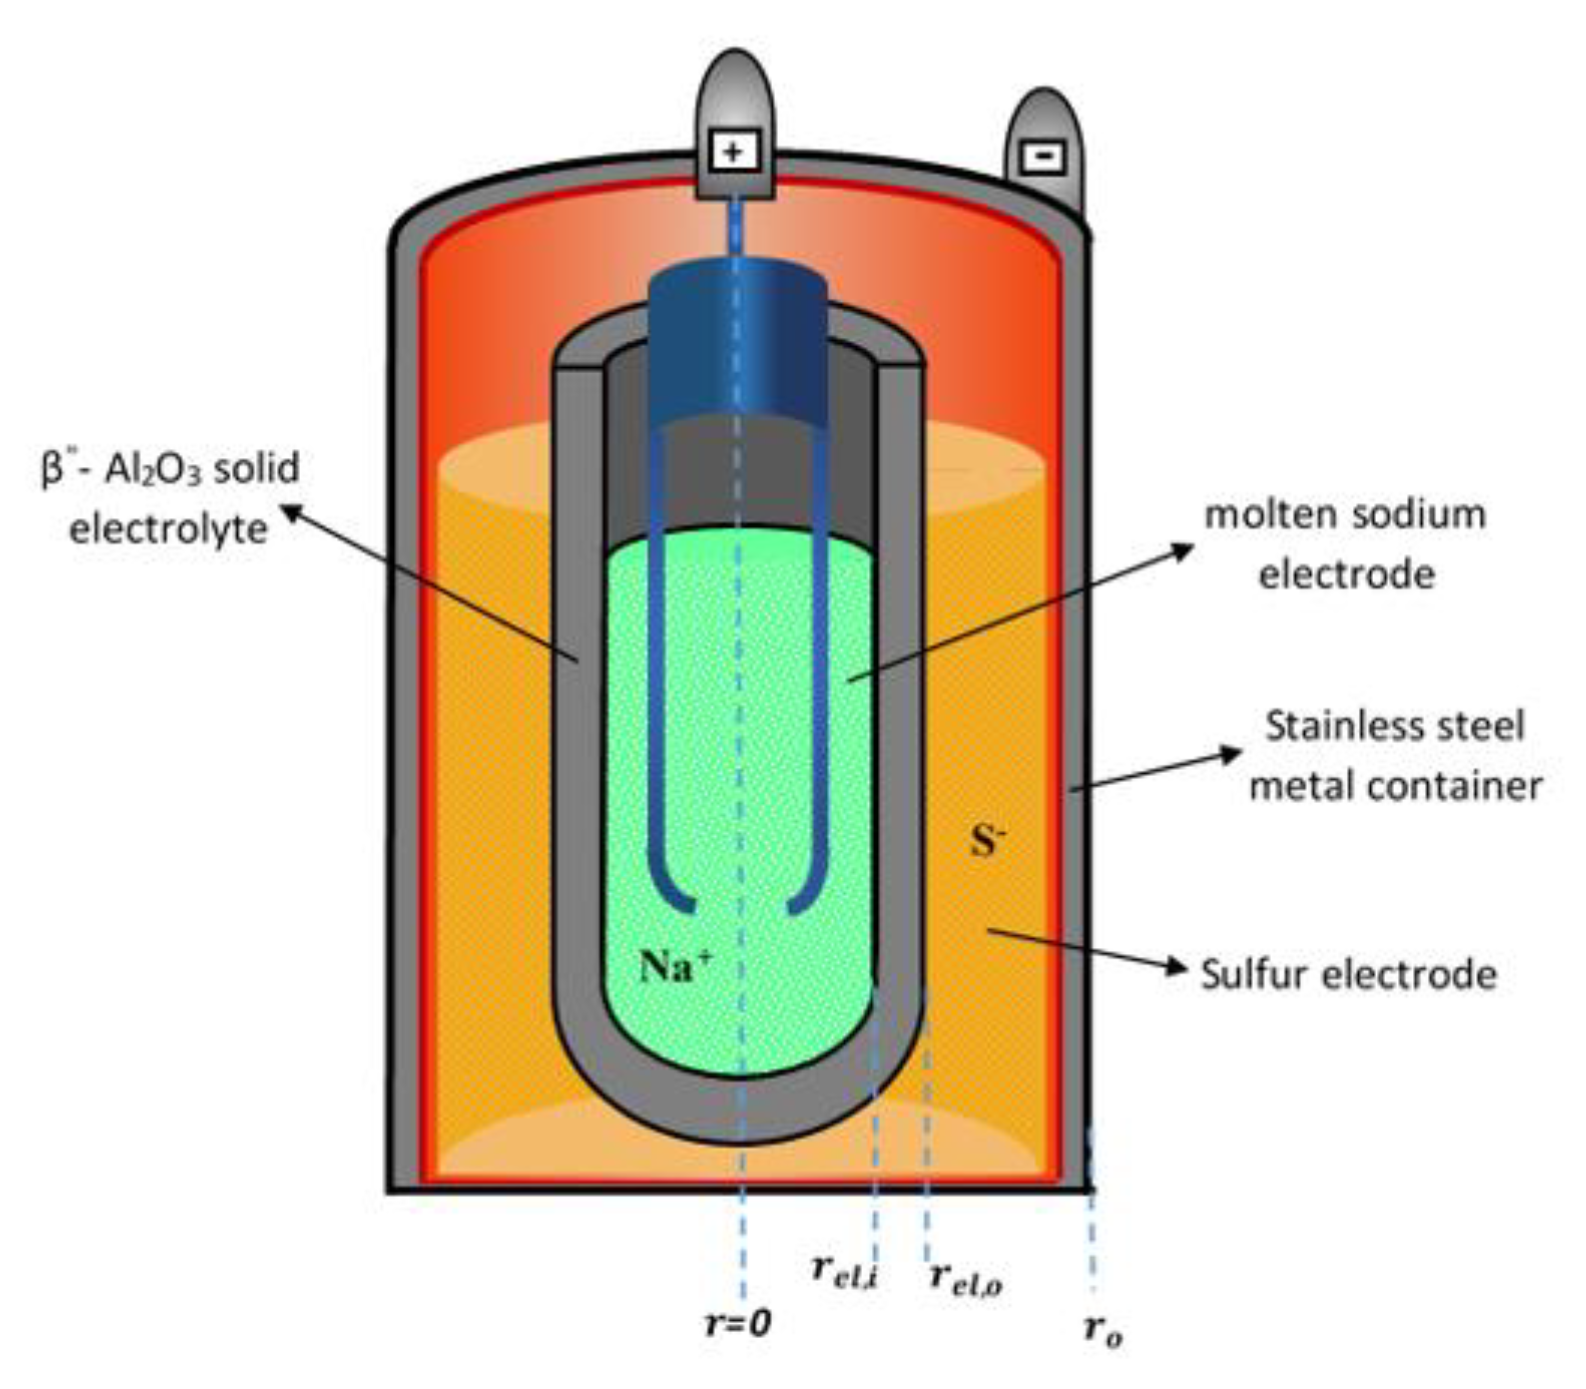
11]. From the grid operation side, within the energy storage technologies, sodium sulfur batteries are a promising technology. At the grid level, sodium sulfur batteries have high potential for electric storage due to their high energy density, the low cost of the reactants, high open-circuit voltage, and they are also one of the most mature technologies [
12,
13]. Some challenges associated with these batteries are the exclusivity of the technology (as it is currently produced by only one company), the high installation and operating cost, as well as the thermal management challenge that arises during the operation of several sodium sulfur cells [
13,
14]. Due to the challenges in quantifying the point at which energy storage becomes the least-costly flexibility option, evaluating the role of storage interventions in power systems with a high penetration of intermittent renewables requires continued analysis, improved data, and the implementation of advanced process systems techniques.
Flexibility requirements of the grid that facilitate the integration of high penetration levels of renewables have been a subject of recent studies [
9,
15,
16]. The impact of cycling on individual thermal generators under high flexibility conditions is also a topic of concern [
6,
17,
18,
19,
20] regarding economic, environmental, and power plant health objectives. The integration of different energy systems in a microgrid considering an economic objective as well as demand response battery installations are of interest [
10,
16,
21]. However, there is a scarcity of studies on methods that analyze grid-level dynamic power plant models and energy storage units with different levels of variable renewable integration considering the damage of cycling on the power plants.
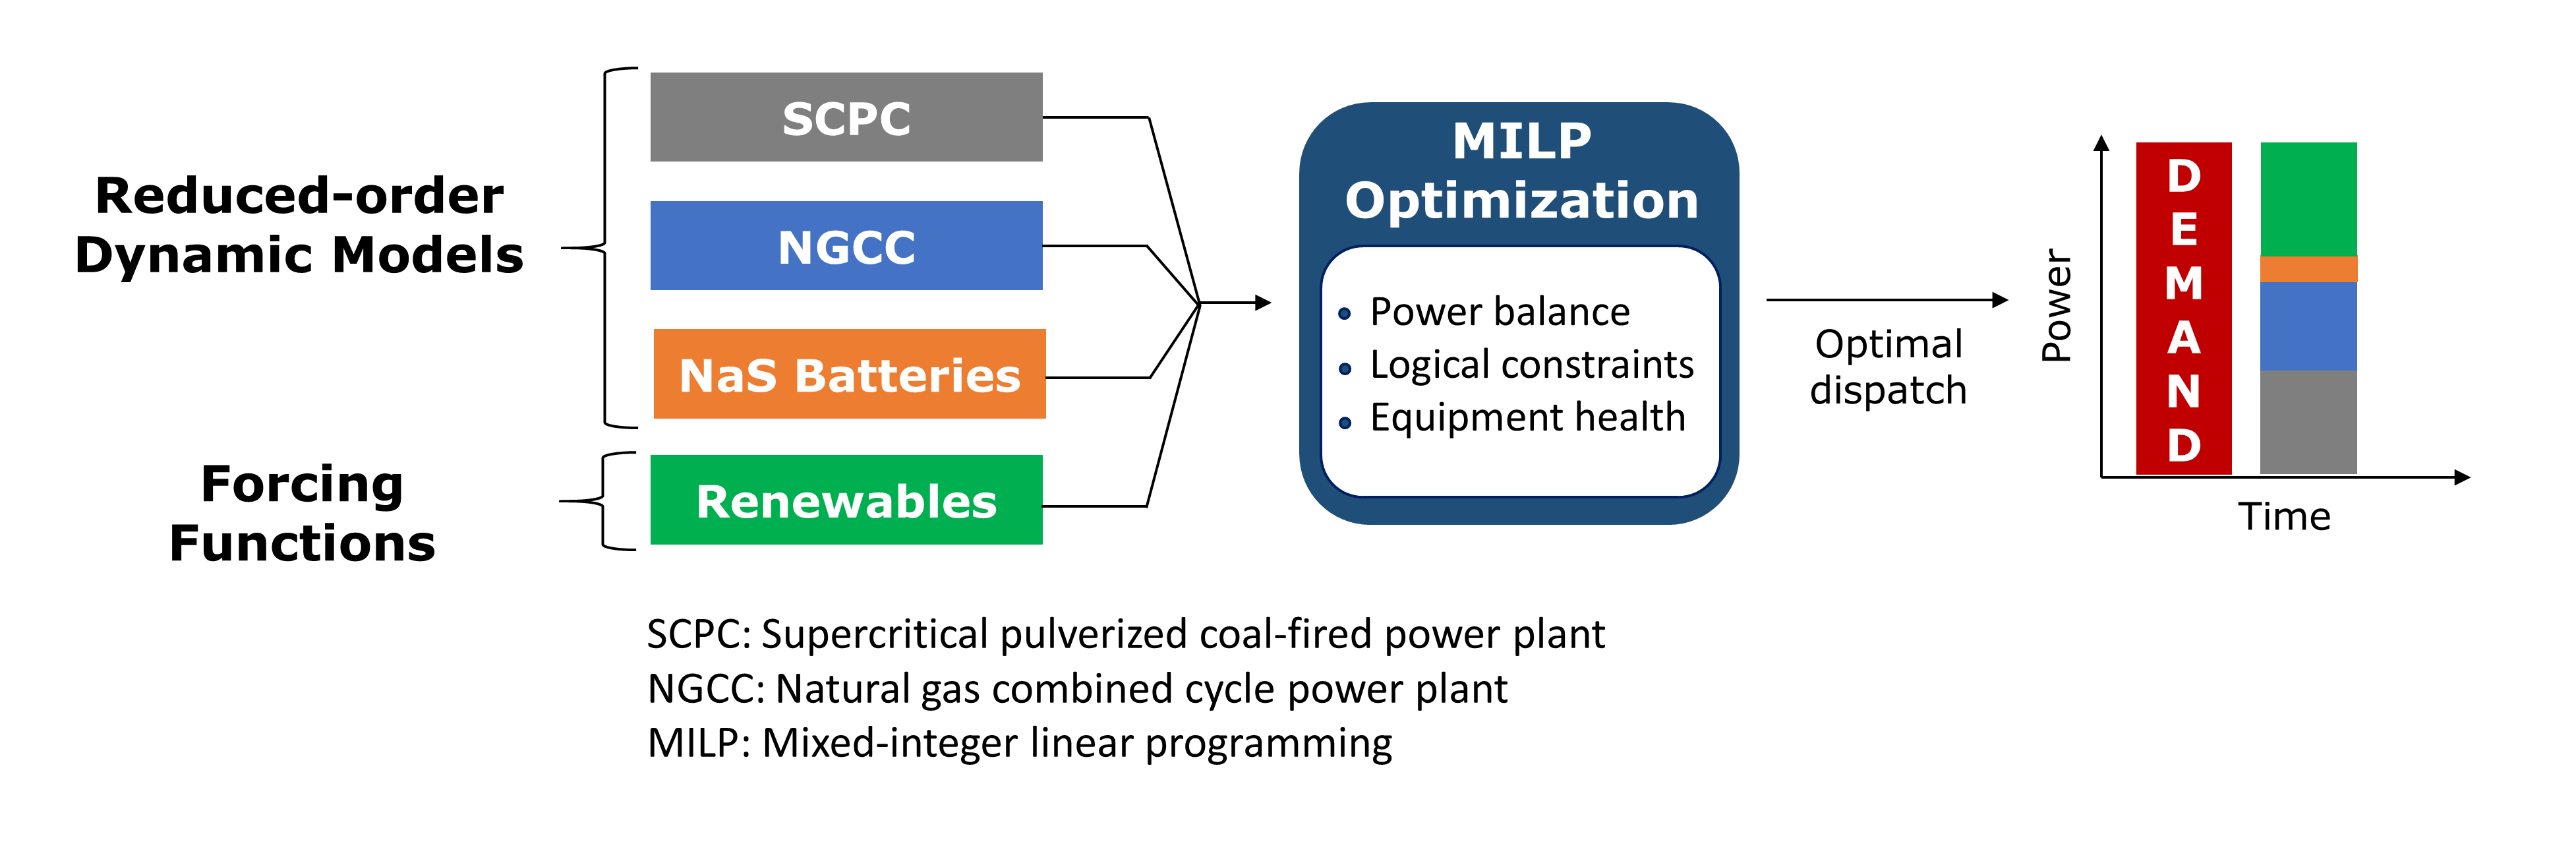
In this work, a mixed-integer linear programming (MILP)-based dynamic optimization strategy is explored to contribute in closing the aforementioned gap by determining the optimal dispatch and the integration of fossil-fueled power plants, energy storage units, and renewable energy production considering the damage of cycling. Natural gas-fired [
17] and coal-fired [
22] power plants correspond to the fossil-fueled power plants. The energy storage unit is represented by the sodium sulfur batteries [
12]. The MILP optimization objective is to minimize the overall economic cost. The curtailment of variable renewable energy is kept as minimal as possible. In addition, a damage model for the stressed components in the natural gas-fired power plant is considered in order to determine the optimal ramping rates and dispatch while maintaining acceptable component life. Ultimately, the generated optimal policy of different energy modules could be sent to advanced model-based controllers [
23,
24].
This paper is organized into four sections. In
Section 2, the energy systems models, the main constraints, and the MILP-based optimization problem statement are introduced. Then, the results of the case studies and their respective implications are presented in
Section 3. Finally, the paper conclusions are summarized in
Section 4.
2. Modeling and Optimization Approach
The mathematical definition of optimization is to find the best solution for a set of systems within the process constraints in a systematic manner. The quality of the solution is evaluated by the objective function. Dynamic optimization considers the process dynamics to determine the optimality [
19]. In particular, the optimal dispatch problem addressed here is formulated as a dynamic MILP optimization that includes integer and continuous decision variables, and the linear dynamic models and grid power balance as some of the constraints. The general dynamic MILP optimization formulation is expressed in Equations (1)–(4):
subject to:
in which
is the objective function to be minimized,
f is the dynamic model that describes the system,
g are the equality constraints,
h are the inequality constraints,
x are the state variables,
u are the input/decision variables,
y are the integer variables, and
k is the current time step of the discretization. The posed optimization problem was solved using branch and bound in the
intlinprog subroutine available in MATLAB 2017a
® considering every 6-min time step dispatch scenario for a 30-day time horizon. The optimality gap tolerances were set to the subroutine default values. A perfect demand forecast of at least 6 min ahead of time is assumed. The overall framework could be easily adapted to incorporate the most updated forcing function data accordingly. The energy systems are assumed to be always committed at this level by an independent scheduler; thus, shutdown/startup procedures are not considered in this study during the dispatch.
The objective is to minimize the overall cost of dispatch defined in Equation (5):
in which ES represents the energy systems in the grid. The “
CostES” and “
RevenueES” variables are further defined in Equations (6) and (7):
The “PenaltyES” variable in Equation (6) represents the penalty from a potential policy that penalizes the curtailment of renewables or the investment cost per cycle of the battery.
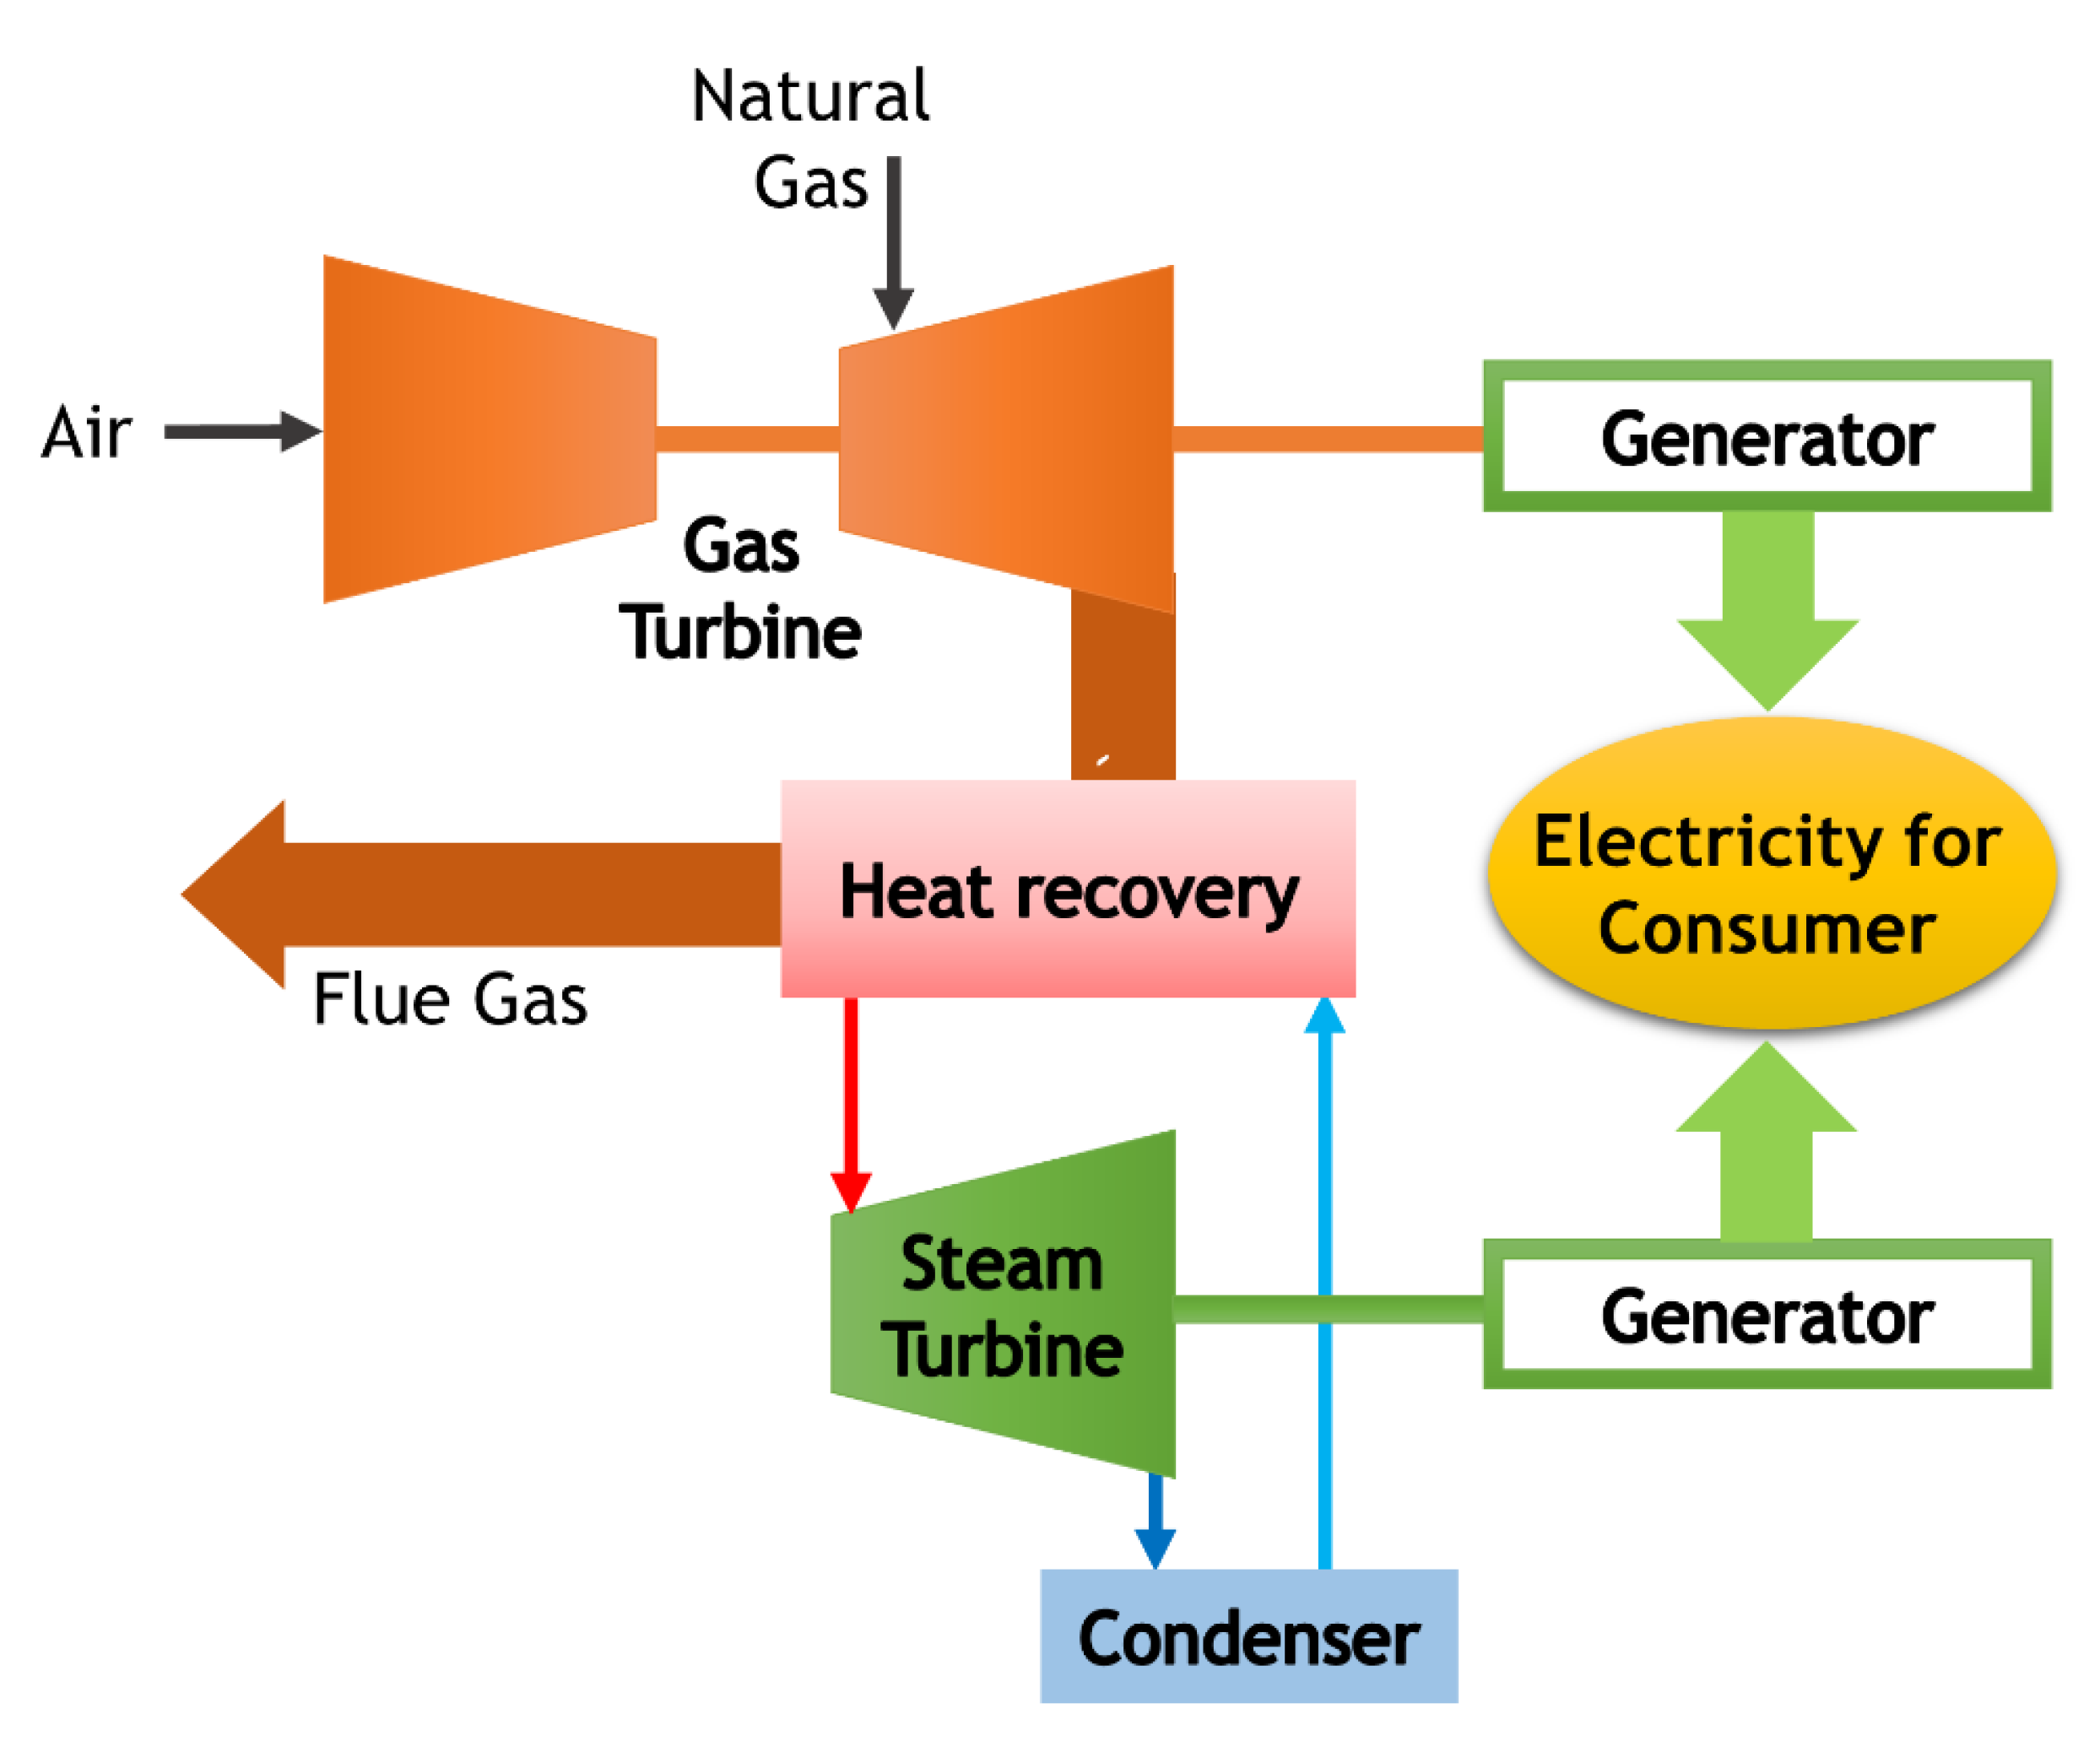
The dynamic models of the energy systems considered are linearized models of the high-fidelity first-principle models of the charge and discharge models of the sodium sulfur (NaS) batteries [
12], natural gas-fired combined cycle (NGCC) power plant [
17,
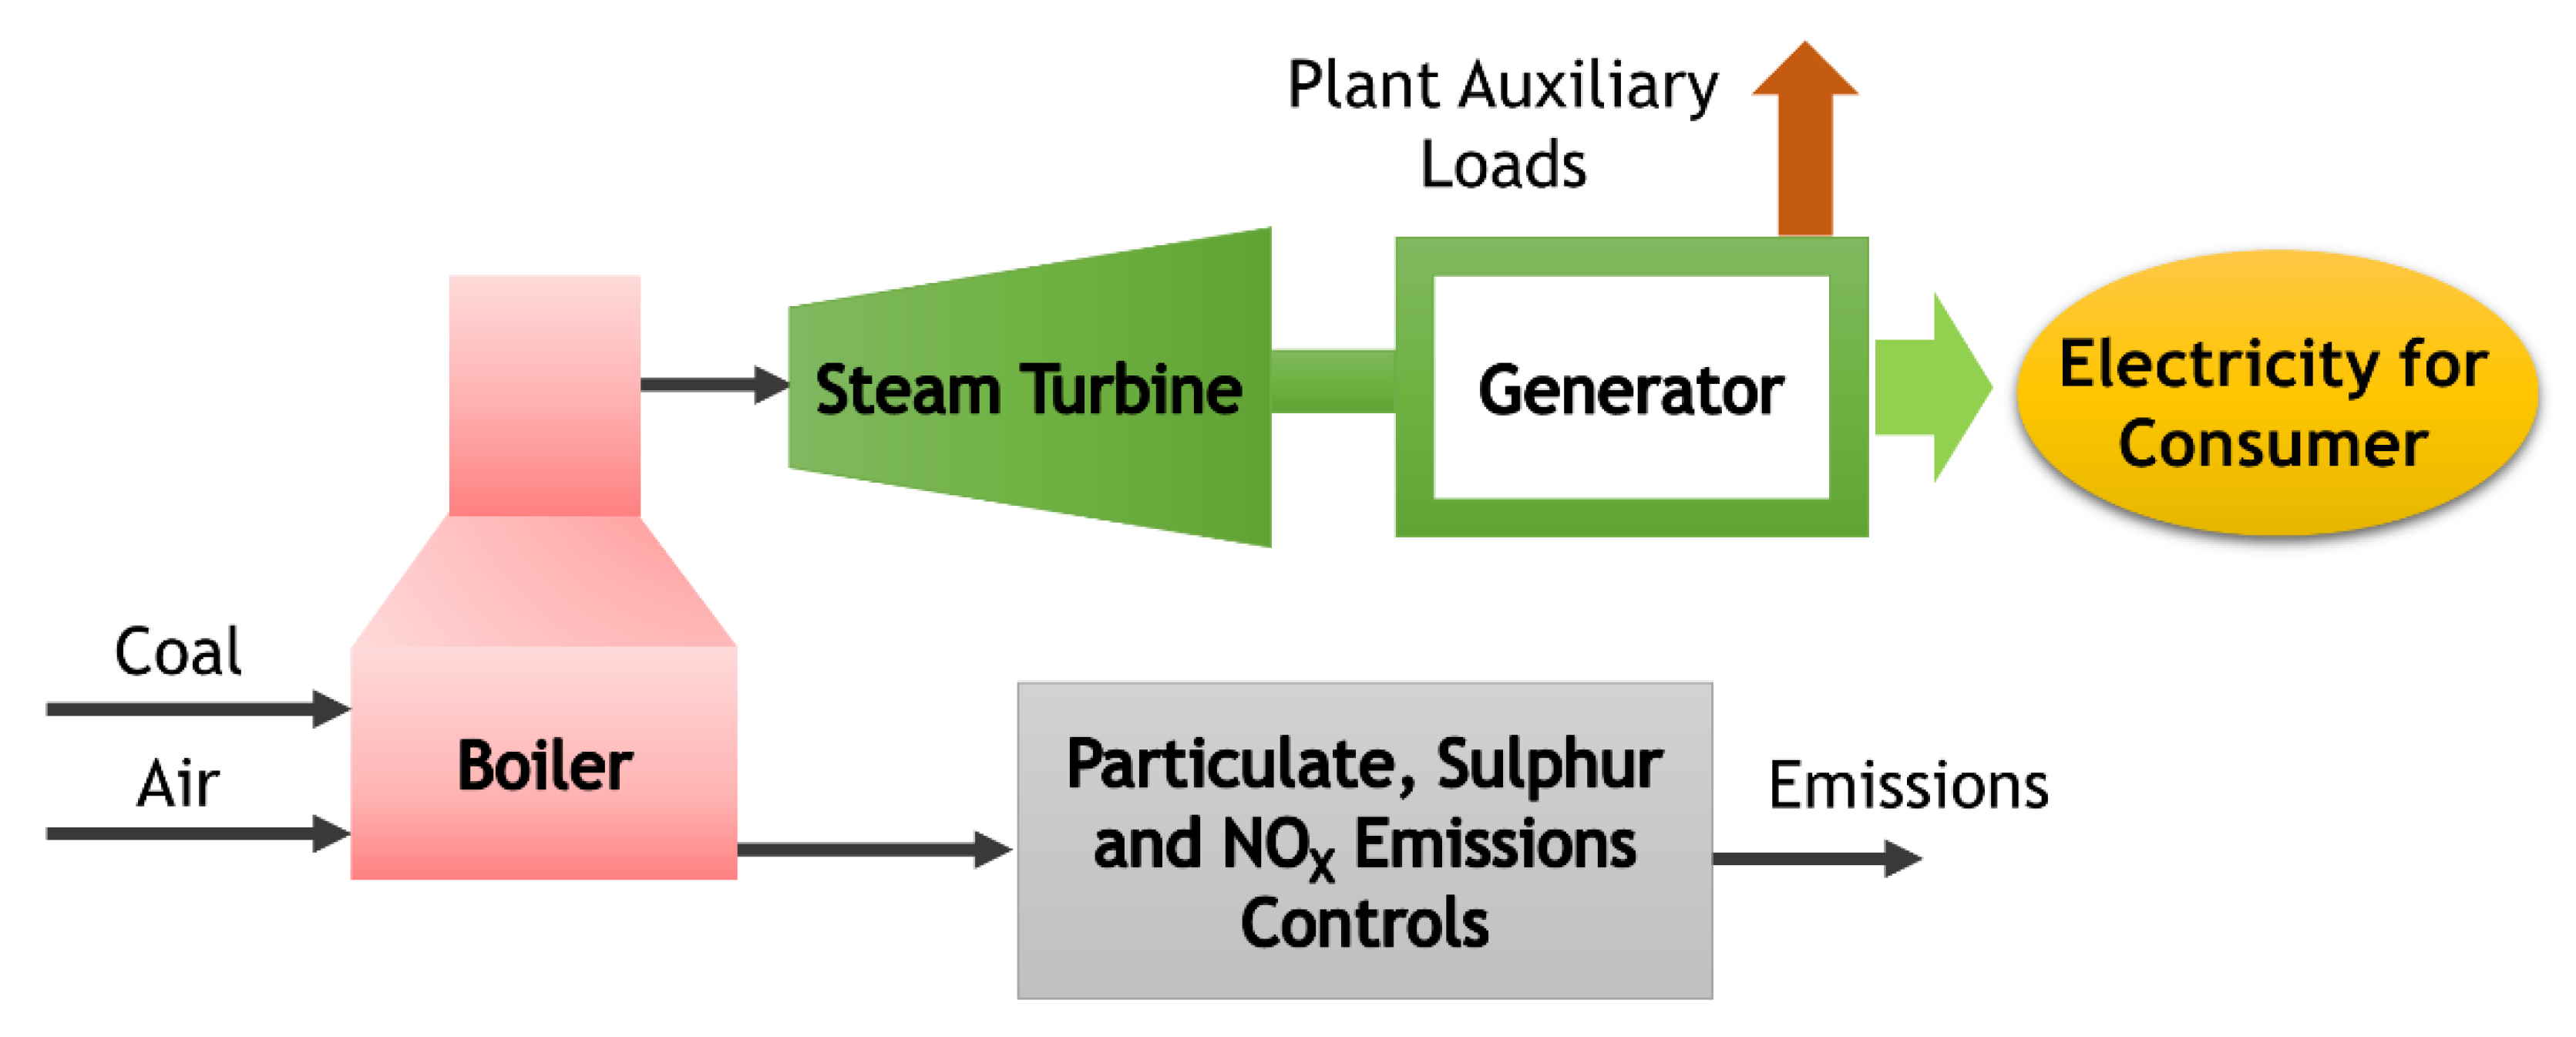
18], and supercritical pulverized coal-fired (SCPC) power plant [
22], as depicted in
Figure 1,
Figure 2 and
Figure 3, respectively. The wind and solar power generation are considered as forcing functions based on historical data [
25]. Thus, the energy system set is defined as
ES = {NaS batteries, NGCC, SCPC}.
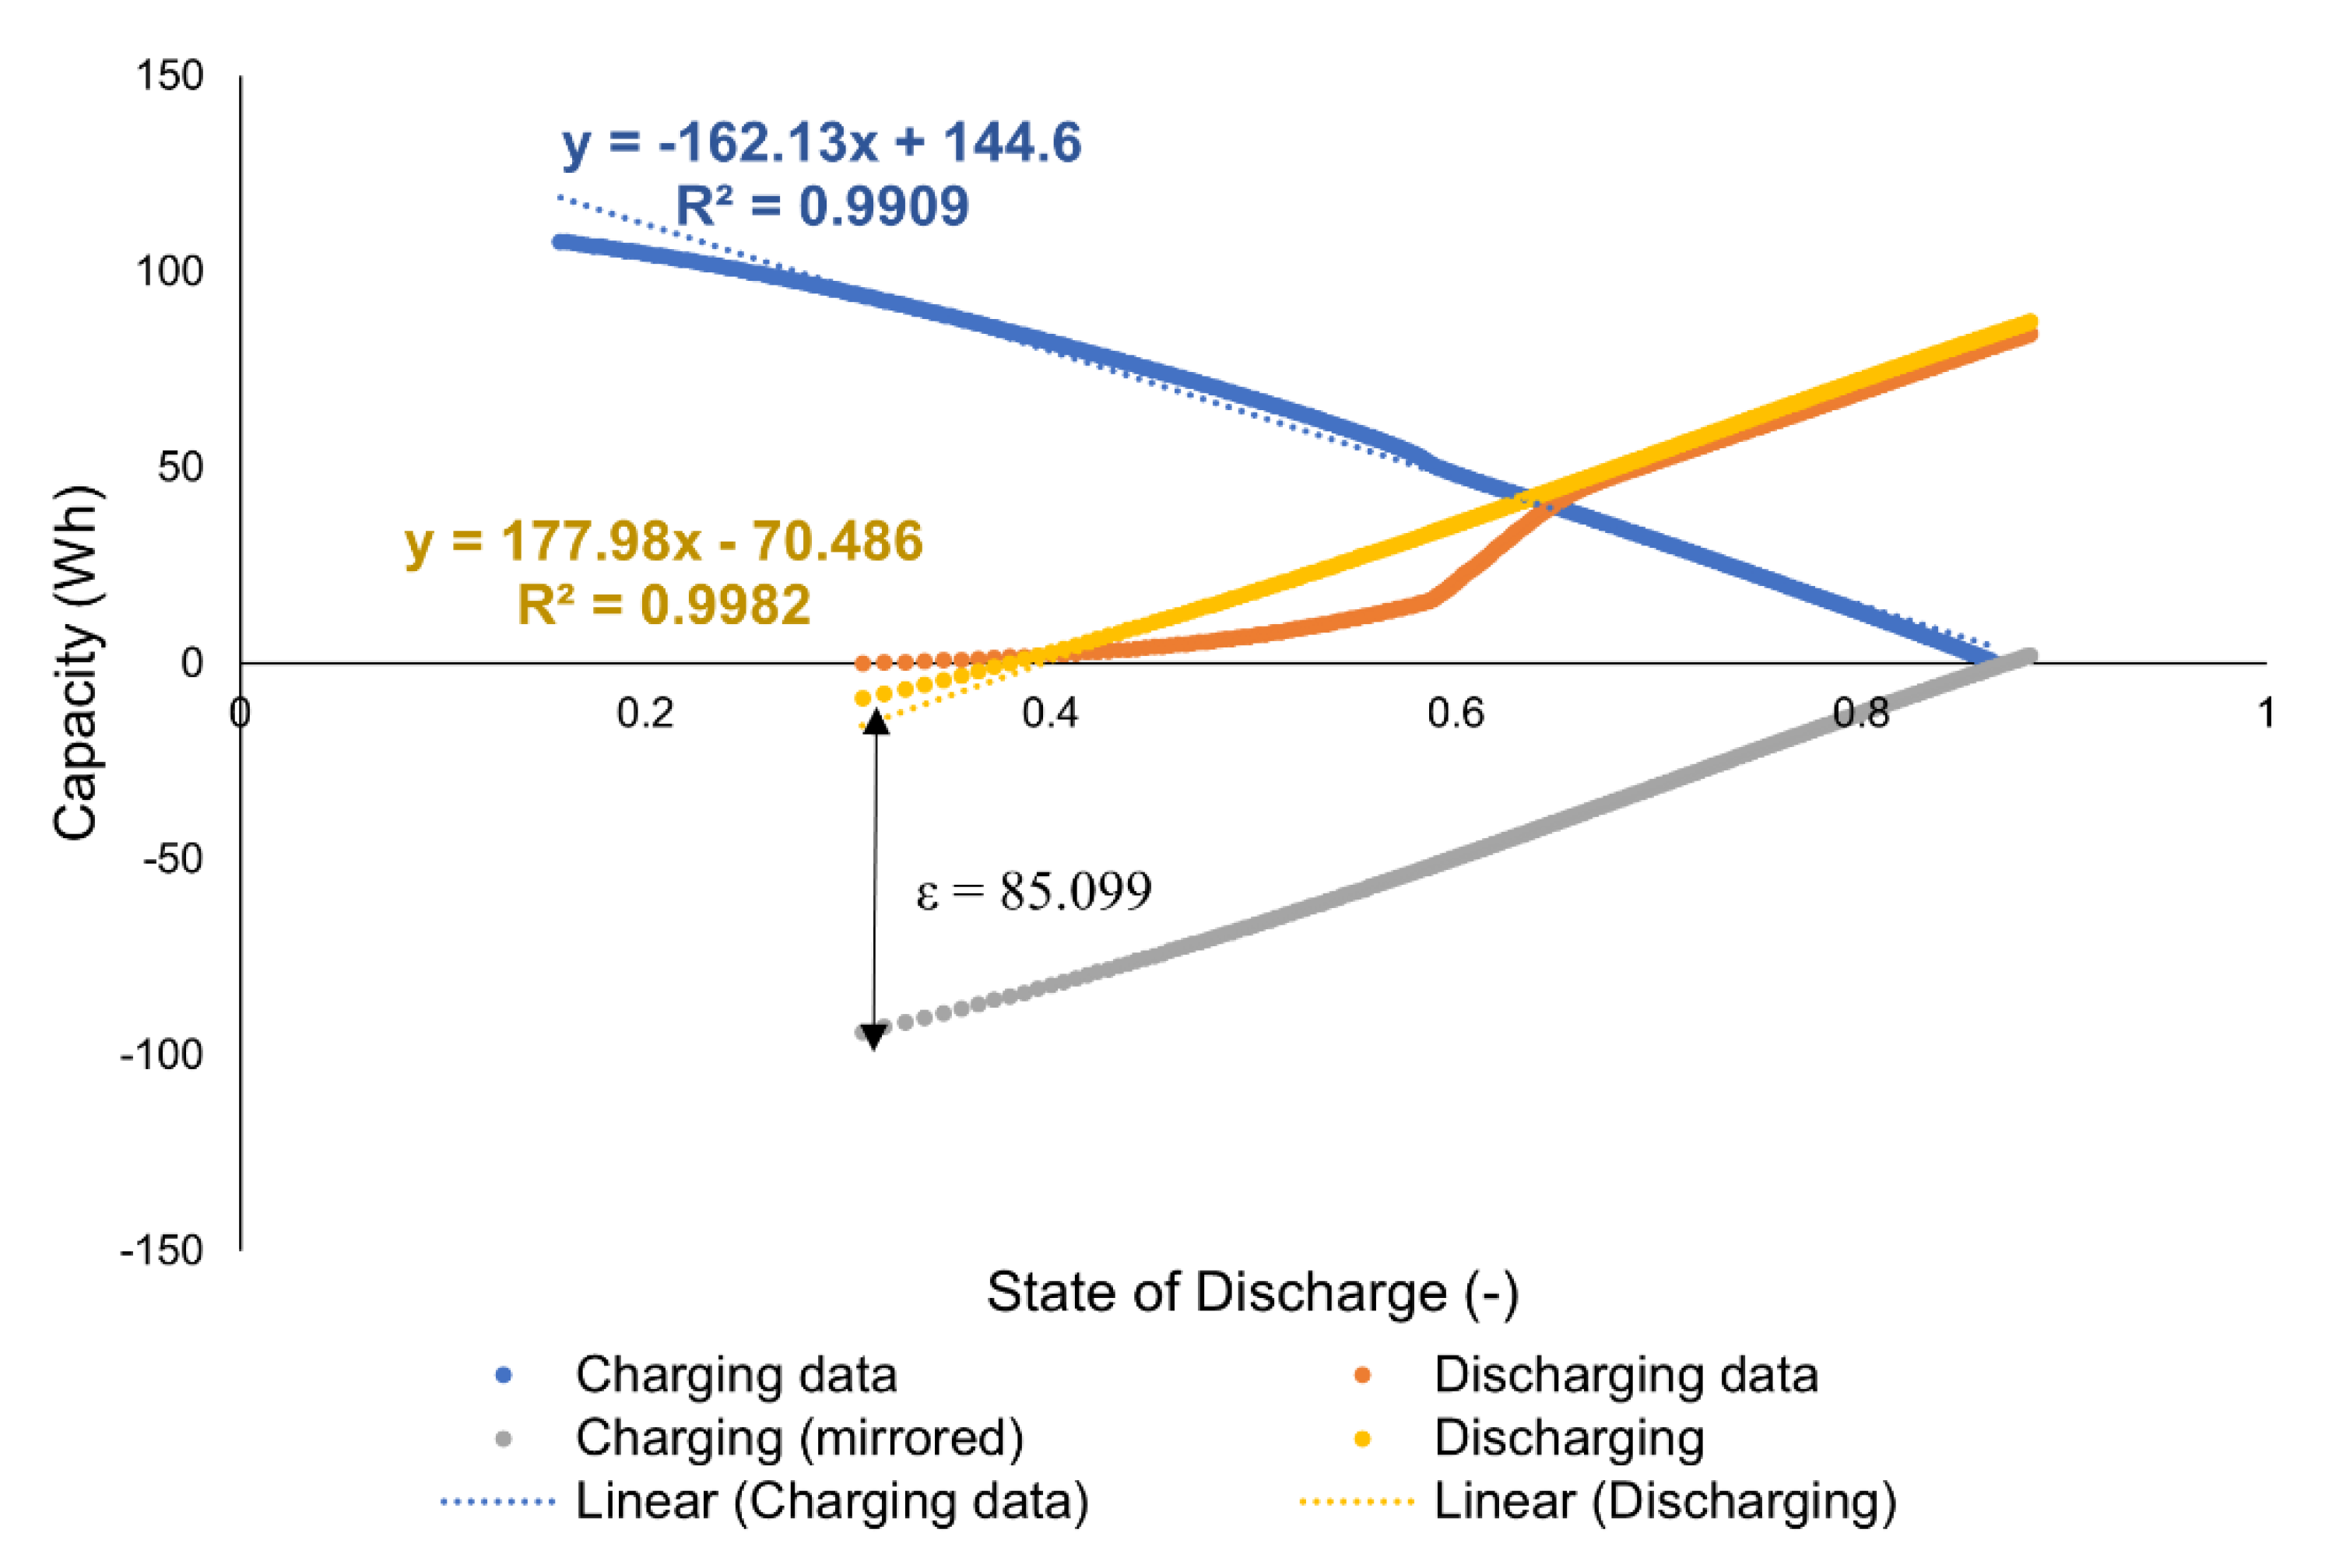
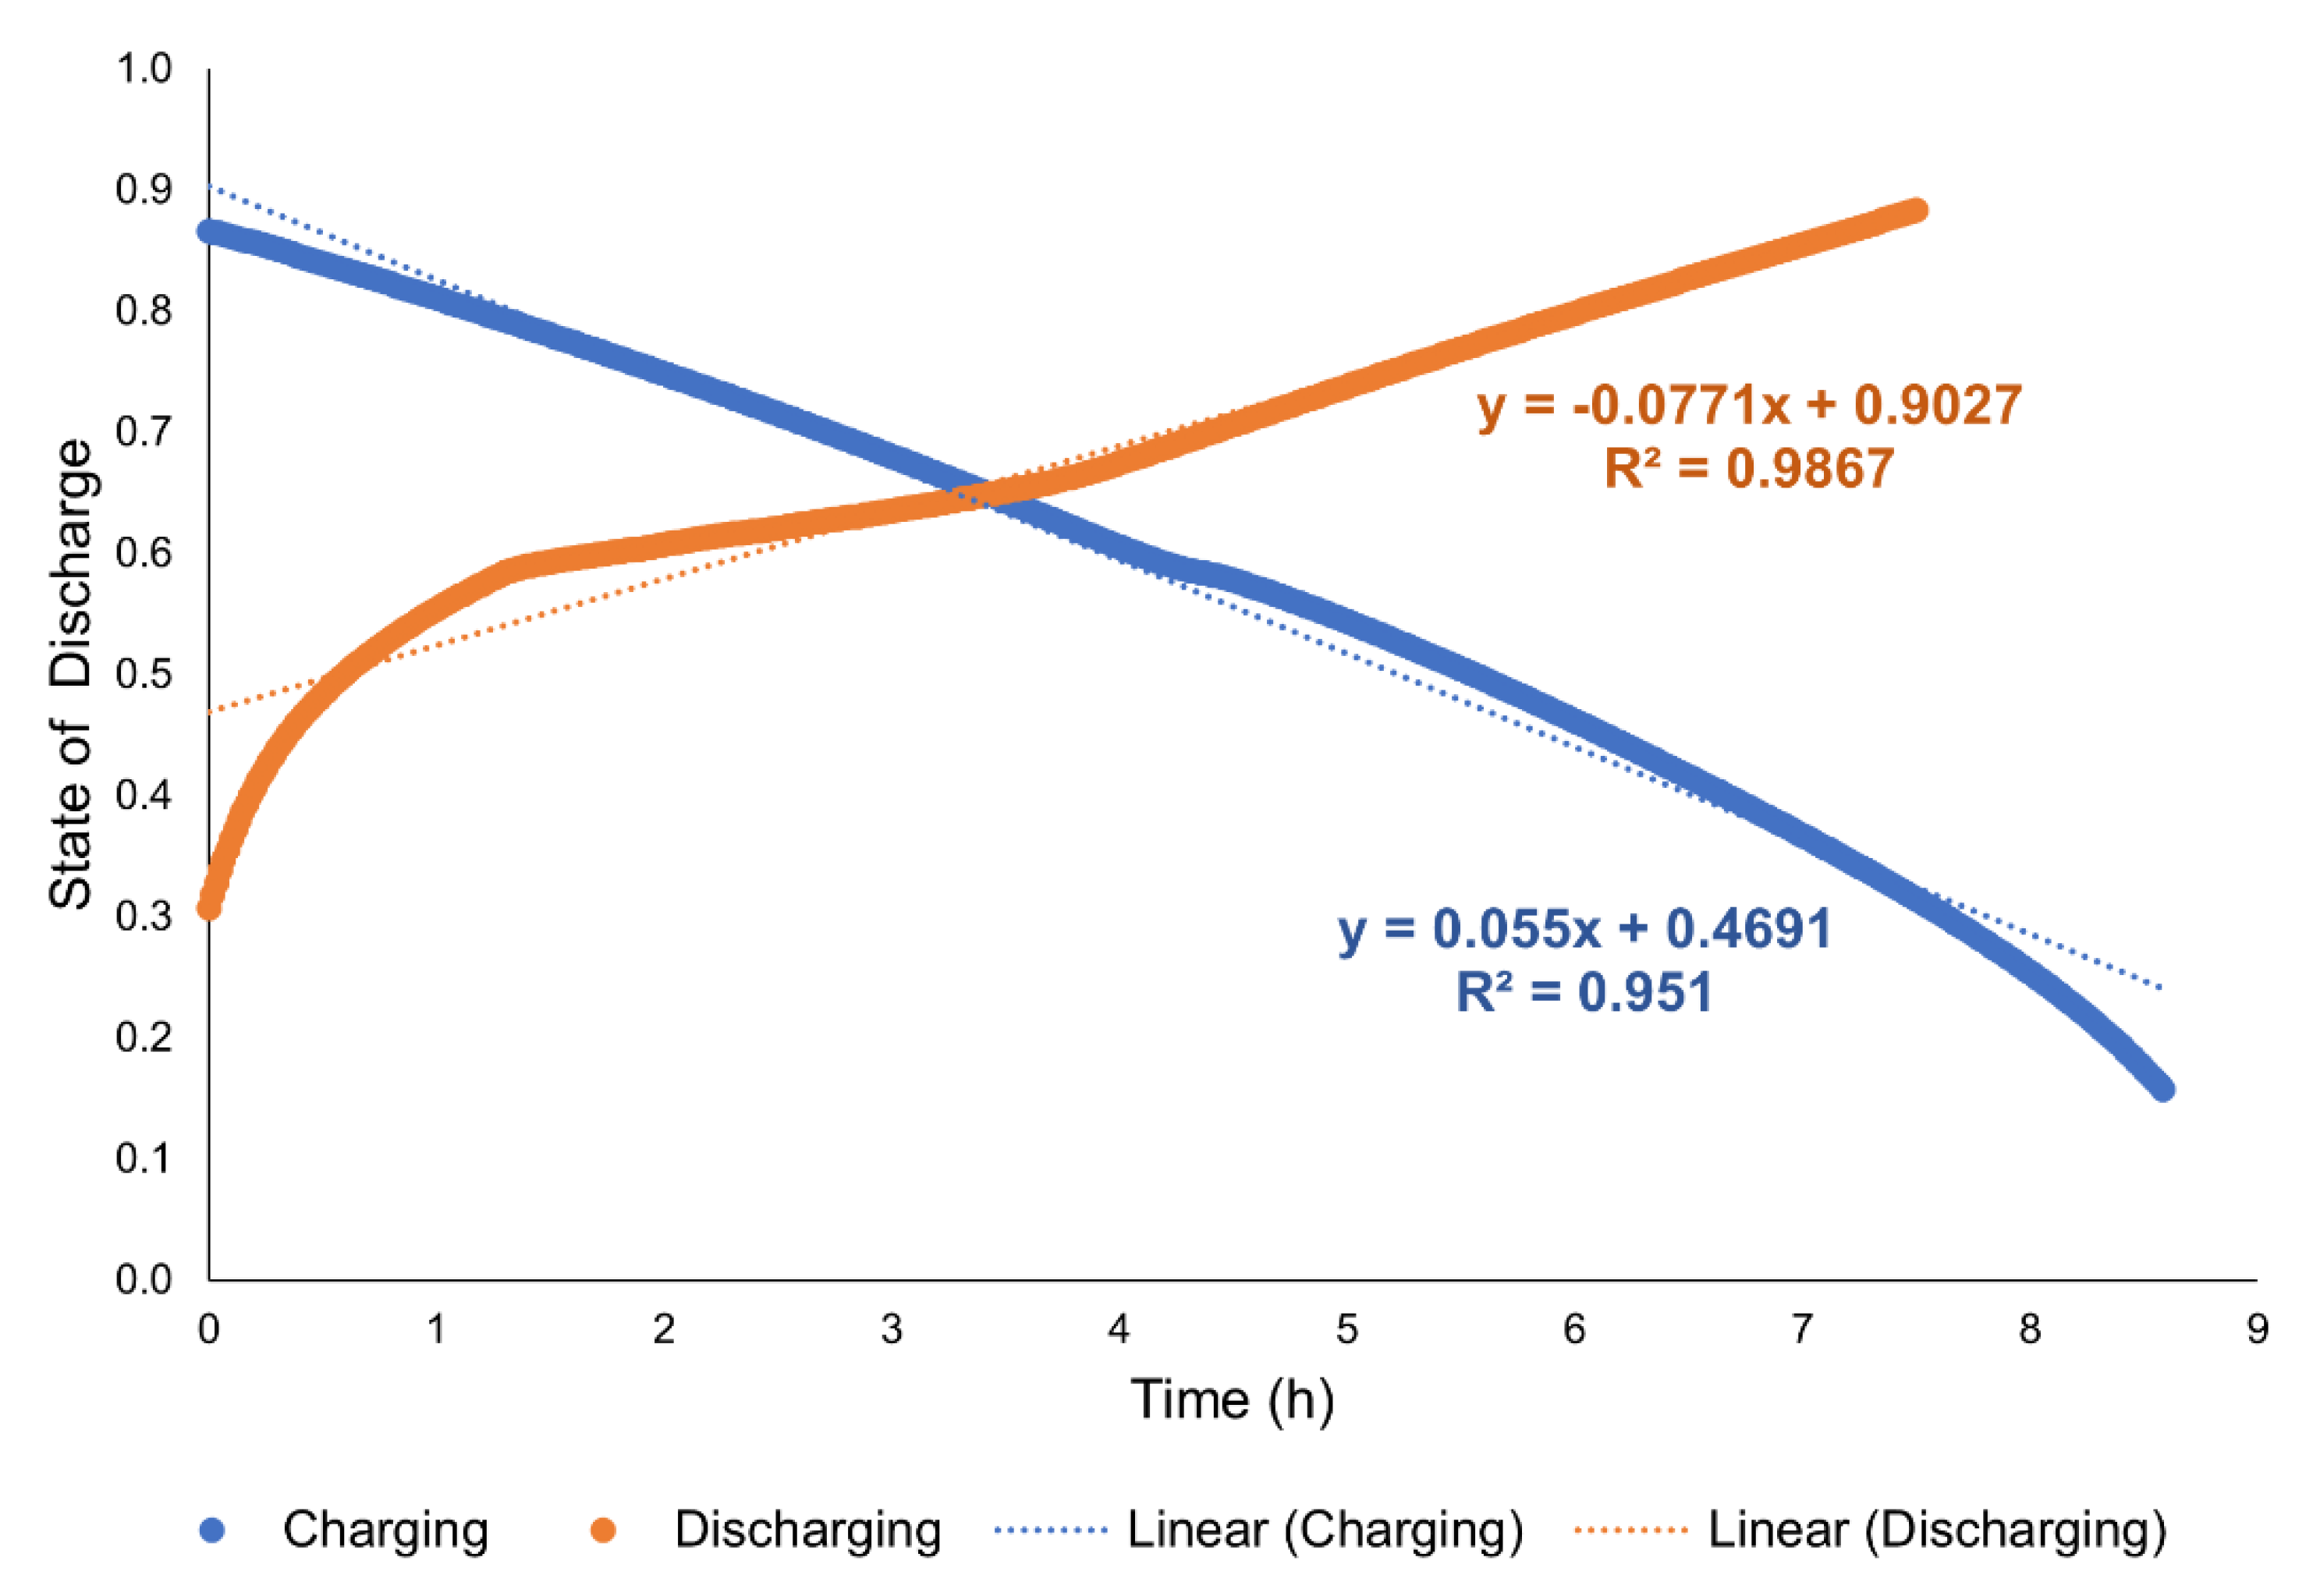
The data used to obtain the parameters for the linear models of the NaS batteries for charge and discharge cycles are shown in
Figure 4 and
Figure 5.
The NaS battery linear charging model parameters expressed in Equations (8) and (9) are calculated by linear regression of the charging data obtained by exciting the high-fidelity model in Aspen Custom Modeler [
12]:
in which
SOD is the state of discharge (fractional),
t is the time in hour, and
Capacity is the capacity in Wh.
The NaS battery linear discharging model parameters expressed in Equations (10) and (11) are calculated by considering the charging data and adding a deviation term
to shift the model predictions for alignment with the discharging data. The discharging data were also obtained from the high-fidelity model in Aspen Custom Modeler [
12]. A limitation in the linear representation of the discharging model is observed regarding the mismatch between the prediction and the data at lower levels of SOD. This issue arises due to the phase change characteristics of NaS batteries during charging/discharging that alter their dynamic behavior [
26].
The calculated R2 considering all of the linear regressions performed for the NaS batteries is higher than 95%.
The reduced-order linear model for the NGCC, obtained by linearization of a nonlinear high-fidelity model in Aspen Dynamics [
17], is a state-space model as shown in Equations (12) and (13). For conciseness, parameters of the NGCC linear model are provided in the
Supplementary Materials.
In Equations (12) and (13), k is the time step, zNGCC is the output vector, and (ANGCC, BNGCC, CNGCC, DNGCC) are the NGCC system matrices. The NGCC input is the natural gas flowrate (kg/h) and the outputs are the gross power output (MWe), gas turbine power output (MWe), the main steam temperature (°C), the reheat steam temperature (°C), the drum body mechanical stress (MPa), and the thermal drum body stress (MPa). In particular, the formulation for the stress components is explained later.
The reduced-order linear model for the SCPC obtained by linear regression using the generated data from the high-fidelity model in Aspen Dynamics [
22] is an autoregressive with exogenous inputs (ARX) model, as shown in Equation (14):
in which
k is the time step,
zSCPC is the output vector, and (
ASCPC,
BSCPC) are the SCPC system matrices. The SCPC regressors are composed of the past and current coal feedrates (kg/s) and the output vector contains the past and current gross power outputs (kWe). Further details regarding parameters and regressors of the SCPC linear model are also provided in the
Supplementary Materials. The datasets used for the linear regression of the power plants were obtained by exciting the input and recording the output responses. Linearization of the high-fidelity nonlinear models inherently introduced inaccuracies in the representation of the energy systems. In particular, the mechanical stress is underestimated at full load, and the thermal stress is underestimated at peaks. However, the overall dynamic behavior of the integrated energy system is still captured by the reduced-order model.
The nominal power generation for the NGCC is 641 MWe, for the SCPC is 600 MWe, and for the NaS batteries is 99.4 MW/845 MWh of storage capacity with the considered capacity of a single sodium sulfur cell being 102 Wh. The maximum discharge and charge rates of a single NaS cell are considered to be 12.5 Wh and 8.9 Wh, respectively. Furthermore, the optimization problem statement also includes the constraints expressed in Equations (15)–(28).
The smart-grid power balance is expressed in Equation (15).
The “
Electricity consumedi” variable refers to the case in which the energy system requires electricity from the grid that cannot be supplied from within the energy system (for instance, when the battery requires electricity to charge). The “
Renewables” variable considers the wind and solar power generation as forcing function profiles built from data that were obtained from the PJM Regional Transmission Organization [
25]. More specifically, the data used corresponds to 30 days of hourly aggregate demand loads and the electricity price in August 2019, which were interpolated with the chosen time step of 6 min. The absolute values of the considered demand and the renewable power generation were adjusted to be proportional to the available energy sources’ nominal maximum and minimum power generations, while maintaining the load demand slopes. These actions were taken to guarantee feasibility to the current forcing functions that use 2019 information. However, further modifications to the forcing functions (the modified 2019 load and the 2050 renewables projection) might render the problem infeasible. Thus, to partially manage this issue, renewables curtailment was allowed and flexibility requirements of the grid analyzed. The proportionality factors used for the scaling of renewable generation in 2050 were based on information in
Table 1.
A logical constraint using disjunctive programming is also included, as the NaS batteries cannot be charged and discharged at the same time. This constraint is expressed in Equations (16) and (17).
The NaS batteries range of operation considering the regression data fit is shown in Equation (18).
Finally, constraints regarding the damage of the drum, the superheater, and reheater are also included. Two distinct mechanisms can influence and change the material lifetime, namely creep and fatigue. Creep is due to the prolonged exposure to high temperature, while fatigue is caused by the repeated and fluctuating stress that results from both temperature and pressure transients under load-following conditions [
7].
In the optimization problem, the maximum stress that is allowed for the drum is considered as a constraint along with a constraint on the maximum temperature to avoid overheating of the NGCC superheater and reheater.
Stress analysis of the NGCC drum was based on the European norm [
27], design rules for steam boilers [
28], and available literature in this area [
7]. Dimensions of the drum main body and drum branches as well as the material properties of the drum are shown in
Table 2.
The tangential stress defined in Equations (19)–(21) is used to represent the limiting stress as it is the highest stress component. These equations were added in the high-fidelity model.
In Equation (19), is the overall tangential stress on the body of the drum, is the tangential stress due to pressure further defined in Equation (20), and is the tangential stress due to temperature also further defined in Equation (21). In Equation (20), p is the operating pressure (MPa) and p0 is the outside pressure (MPa), while is the temperature transient (K·h−1) in Equation (21).
To define the threshold for the stress constraint on the body of the drum, the maximum allowable stress (
MAS) is defined in Equation (22). Specifically, the material SA-515 grade 70 requires the tensile strength to be within the range of 485–620 MPa and the minimum yield strength of 260 MPa [
29].
The calculated
MAS value is about
, which is more conservative than the threshold considered in a similar work [
7]. The
MAS value is used to determine the maximum tangential stress value during dispatch according to Equations (23) and (24):
In Equation (23), E is the joint efficiency of the shell–branch connection, with E = 0.95.
Then, the constraint on the overall stress that the drum body endures is given by Equation (25).
Finally, to avoid overheating of the superheater and reheater, temperature constraints given by Equations (26) and (28) are considered:
Additionally, two post-optimization analyses are carried out: one considering the stress of the most stressed part of the drum and the other on the CO
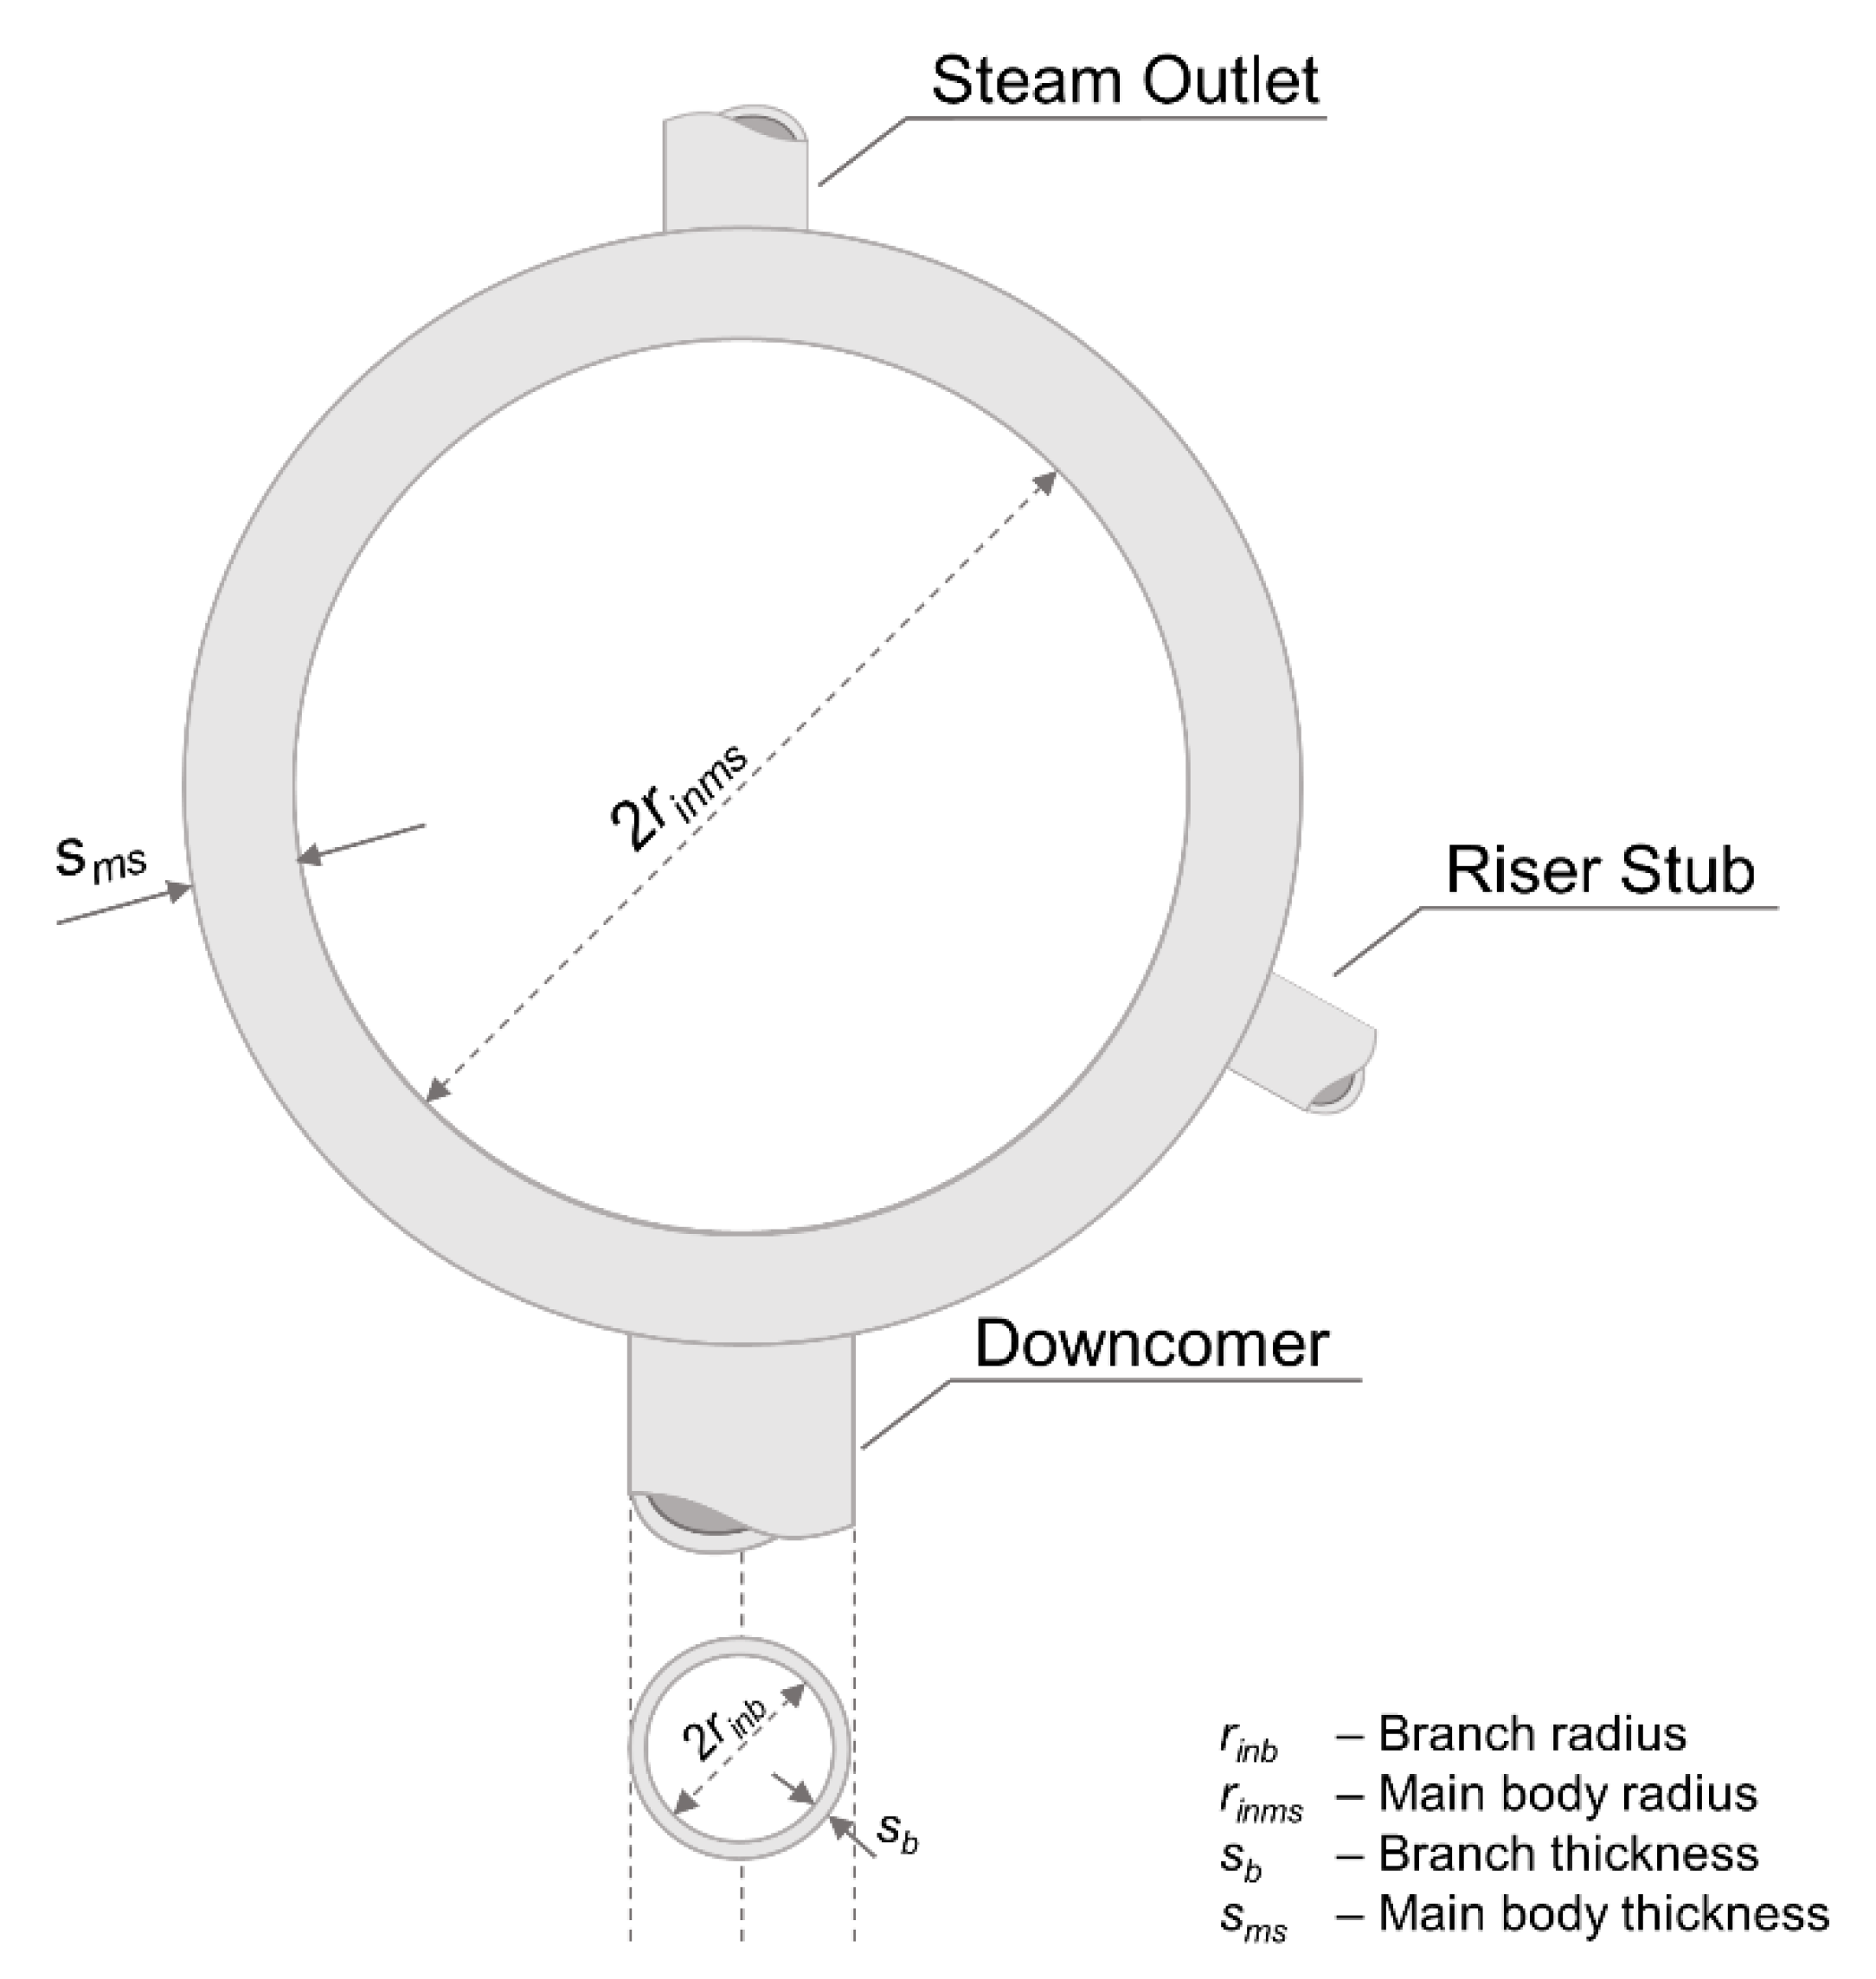
2 equivalent assessment. The post-optimization analysis of the most stressed part of the drum is performed by using Equations (29)–(36) along with Equation (19) after the optimal dispatch is determined. Equations (29) and (30) are developed by modifying Equations (21) and (22) using the stress concentration factors due to the shell–branch connections (e.g., drum–downcomer junction). A diagram of the steam drum is shown in
Figure 6.
In Equations (29) and (30)
is the stress concentration factor due to pressure and is calculated using Equations (31)–(34), while
is the stress concentration factor due to temperature and is calculated using Equations (35) and (36).
In Equations (34) and (36), dmb and dms are the branch and main body mean diameters.
Regarding the environmental CO
2 equivalent analysis, complete combustion of the fuel (natural gas and coal) is assumed for the calculation of the CO
2 emissions. The coal considered is a bituminous Illinois no. 6 with
Table 3 showing its composition [
30].
Table 4 shows the composition used for the natural gas [
30].
Considering the statement above, the optimization problem is solved for different renewable power generations and power grid components.
3. Results and Discussion
Overall, five case studies are considered. Initially, four case studies are assessed considering the dispatch of NGCC, SCPC, and NaS batteries to accommodate different levels of renewable penetrations into the grid, while supplying the demand using the optimization problem statement in
Section 2.
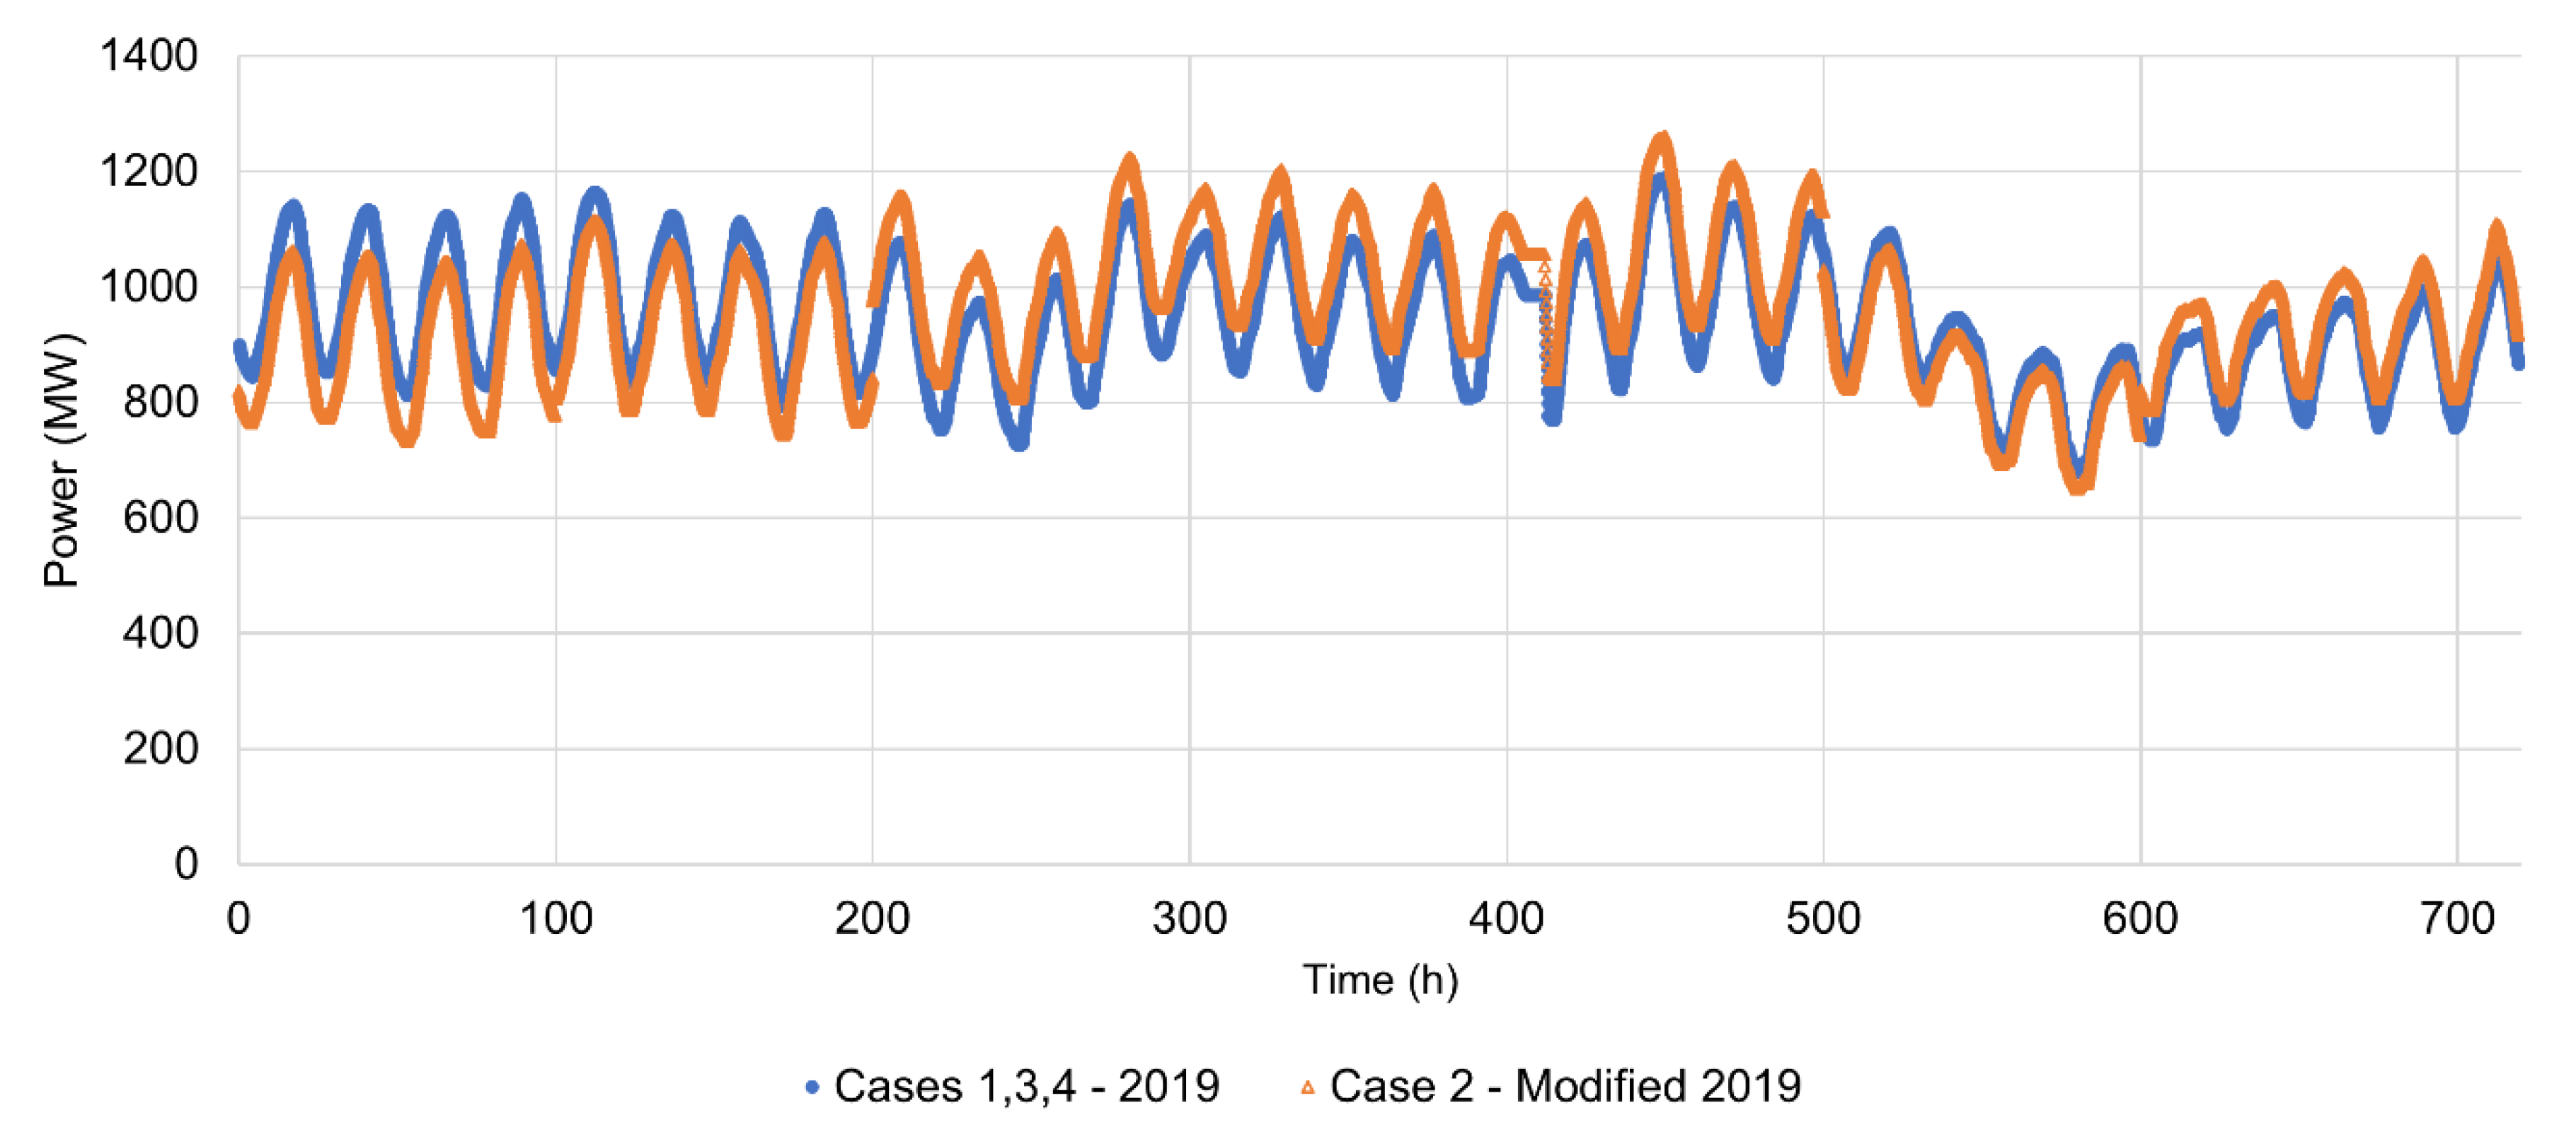
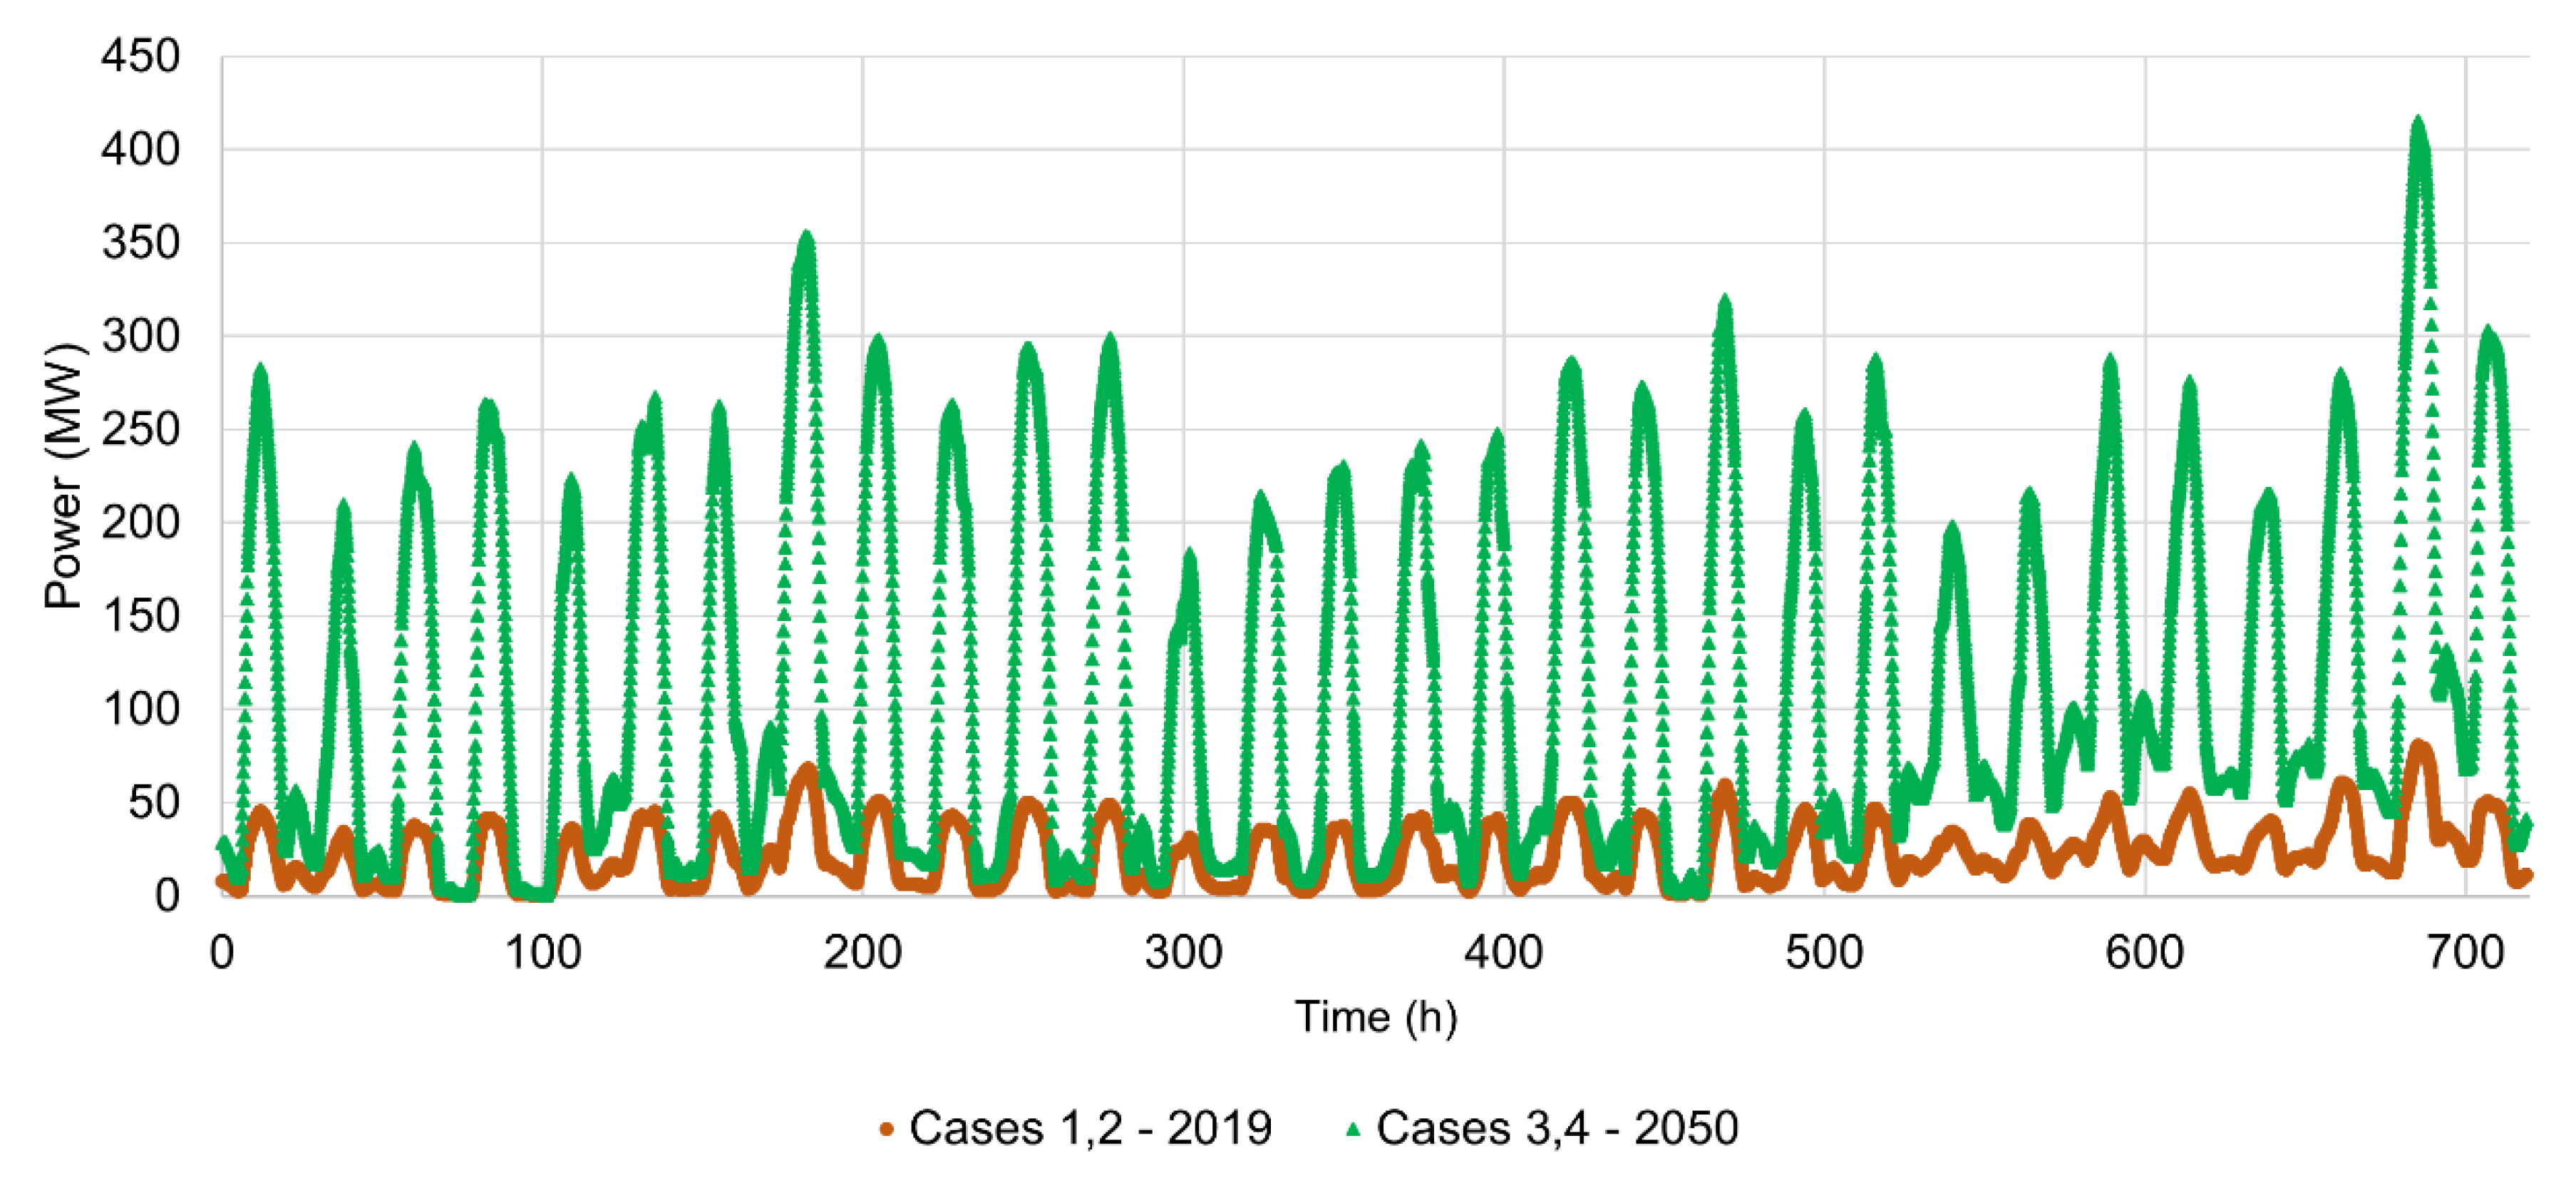
Figure 7 and
Figure 8 show the different power demands and renewable penetration levels considered in these four case studies. Then, for the fifth case study, a more challenging renewable penetration scenario is elaborated, and an in-depth stress analysis is performed.
A technology-invariant curtailment penalty of 110 US
$/MWh based on available literature [
31] was considered in all case studies. The main purpose of this penalty is to maintain the curtailment at minimum levels, i.e., the wind/solar supply is only curtailed when the lack of curtailment renders the dispatch infeasible. The battery lifecycle is assumed to be relatively shorter than the lifetime of the power plants, as it depends on the degradation and the number of cycles. In this study, a penalty term is considered in the objective to take into account each cycle completed by the NaS batteries with a cost of 300 US
$/kWh and a maximum number of 2500 cycles. A complete charge/discharge of the battery is considered as a cycle.
Figure 9,
Figure 10,
Figure 11,
Figure 12 and
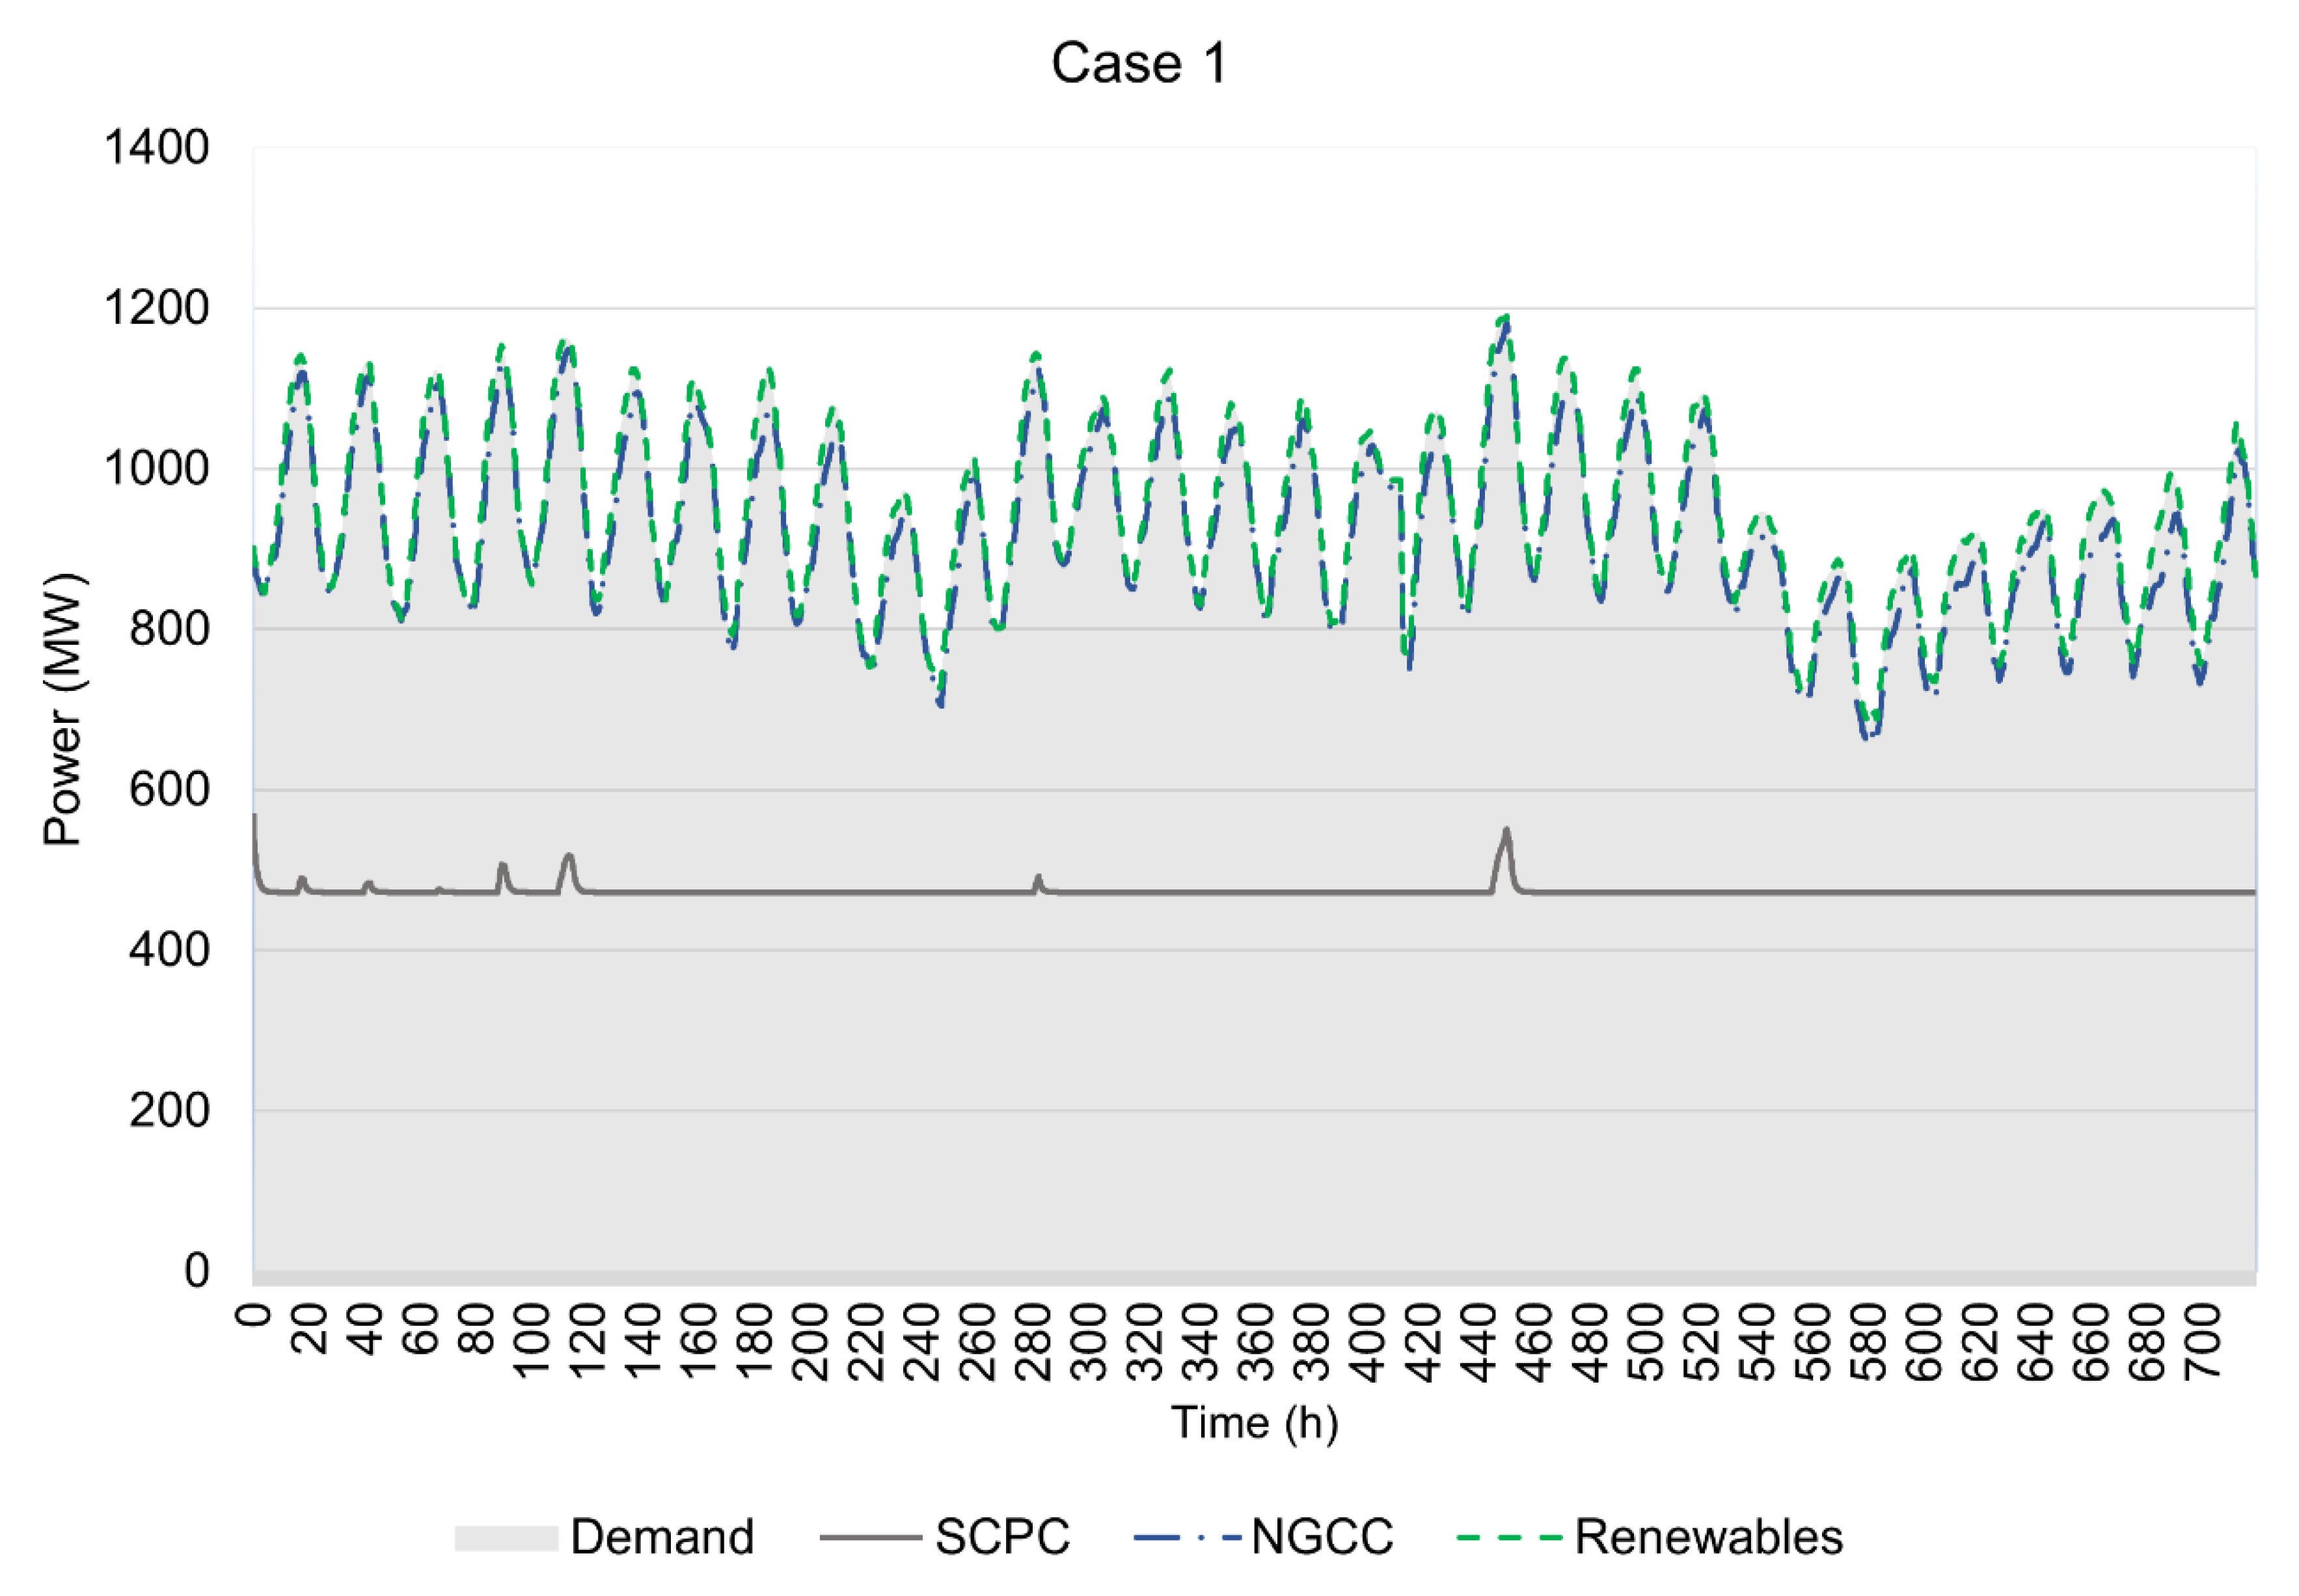
Figure 13 show the results as stacked plots for the four case studies, i.e., the plot is shown as cumulative in the order of appearance of each technology (SCPC, NGCC, NGCC 2, NaS batteries, and renewables). For instance, if at some time instance a second line superimposes the first line, the energy system of the second line is not providing energy at that instance. The amount of energy being provided by a specific energy system is the subtraction between the previous and current energy system. This type of plot is chosen to rapidly verify if the power of the grid is balanced. If the line that represents the last energy source to be added matches the contour of the gray shaded area (demand), that means the power is balanced.
Case 1 considers the year 2019 for electricity price, demand, and solar/wind penetration into the grid. The power grid in this case is composed of SCPC, NGCC, and NaS batteries. The main reason for simulating Case 1 is to check the optimizer’s ability to dispatch the energy systems considering the power demand without curtailment of renewables. Results depicted in
Figure 9 show that for Case 1, the load demand is supplied by the SCPC and NGCC with no curtailment of the renewable energy sources while considering potential damage for the NGCC power plant. The NaS batteries are not utilized at any point. The results obtained are in agreement with the usual strategy employed nowadays, as there is no large-scale deployment of NaS batteries. Essentially, the results indicated that at the 2019 renewables penetration levels, the already installed SCPC and NGCC are sufficient to supply the energy within the acceptable planned damage maximum without requiring curtailment or introduction of NaS batteries.
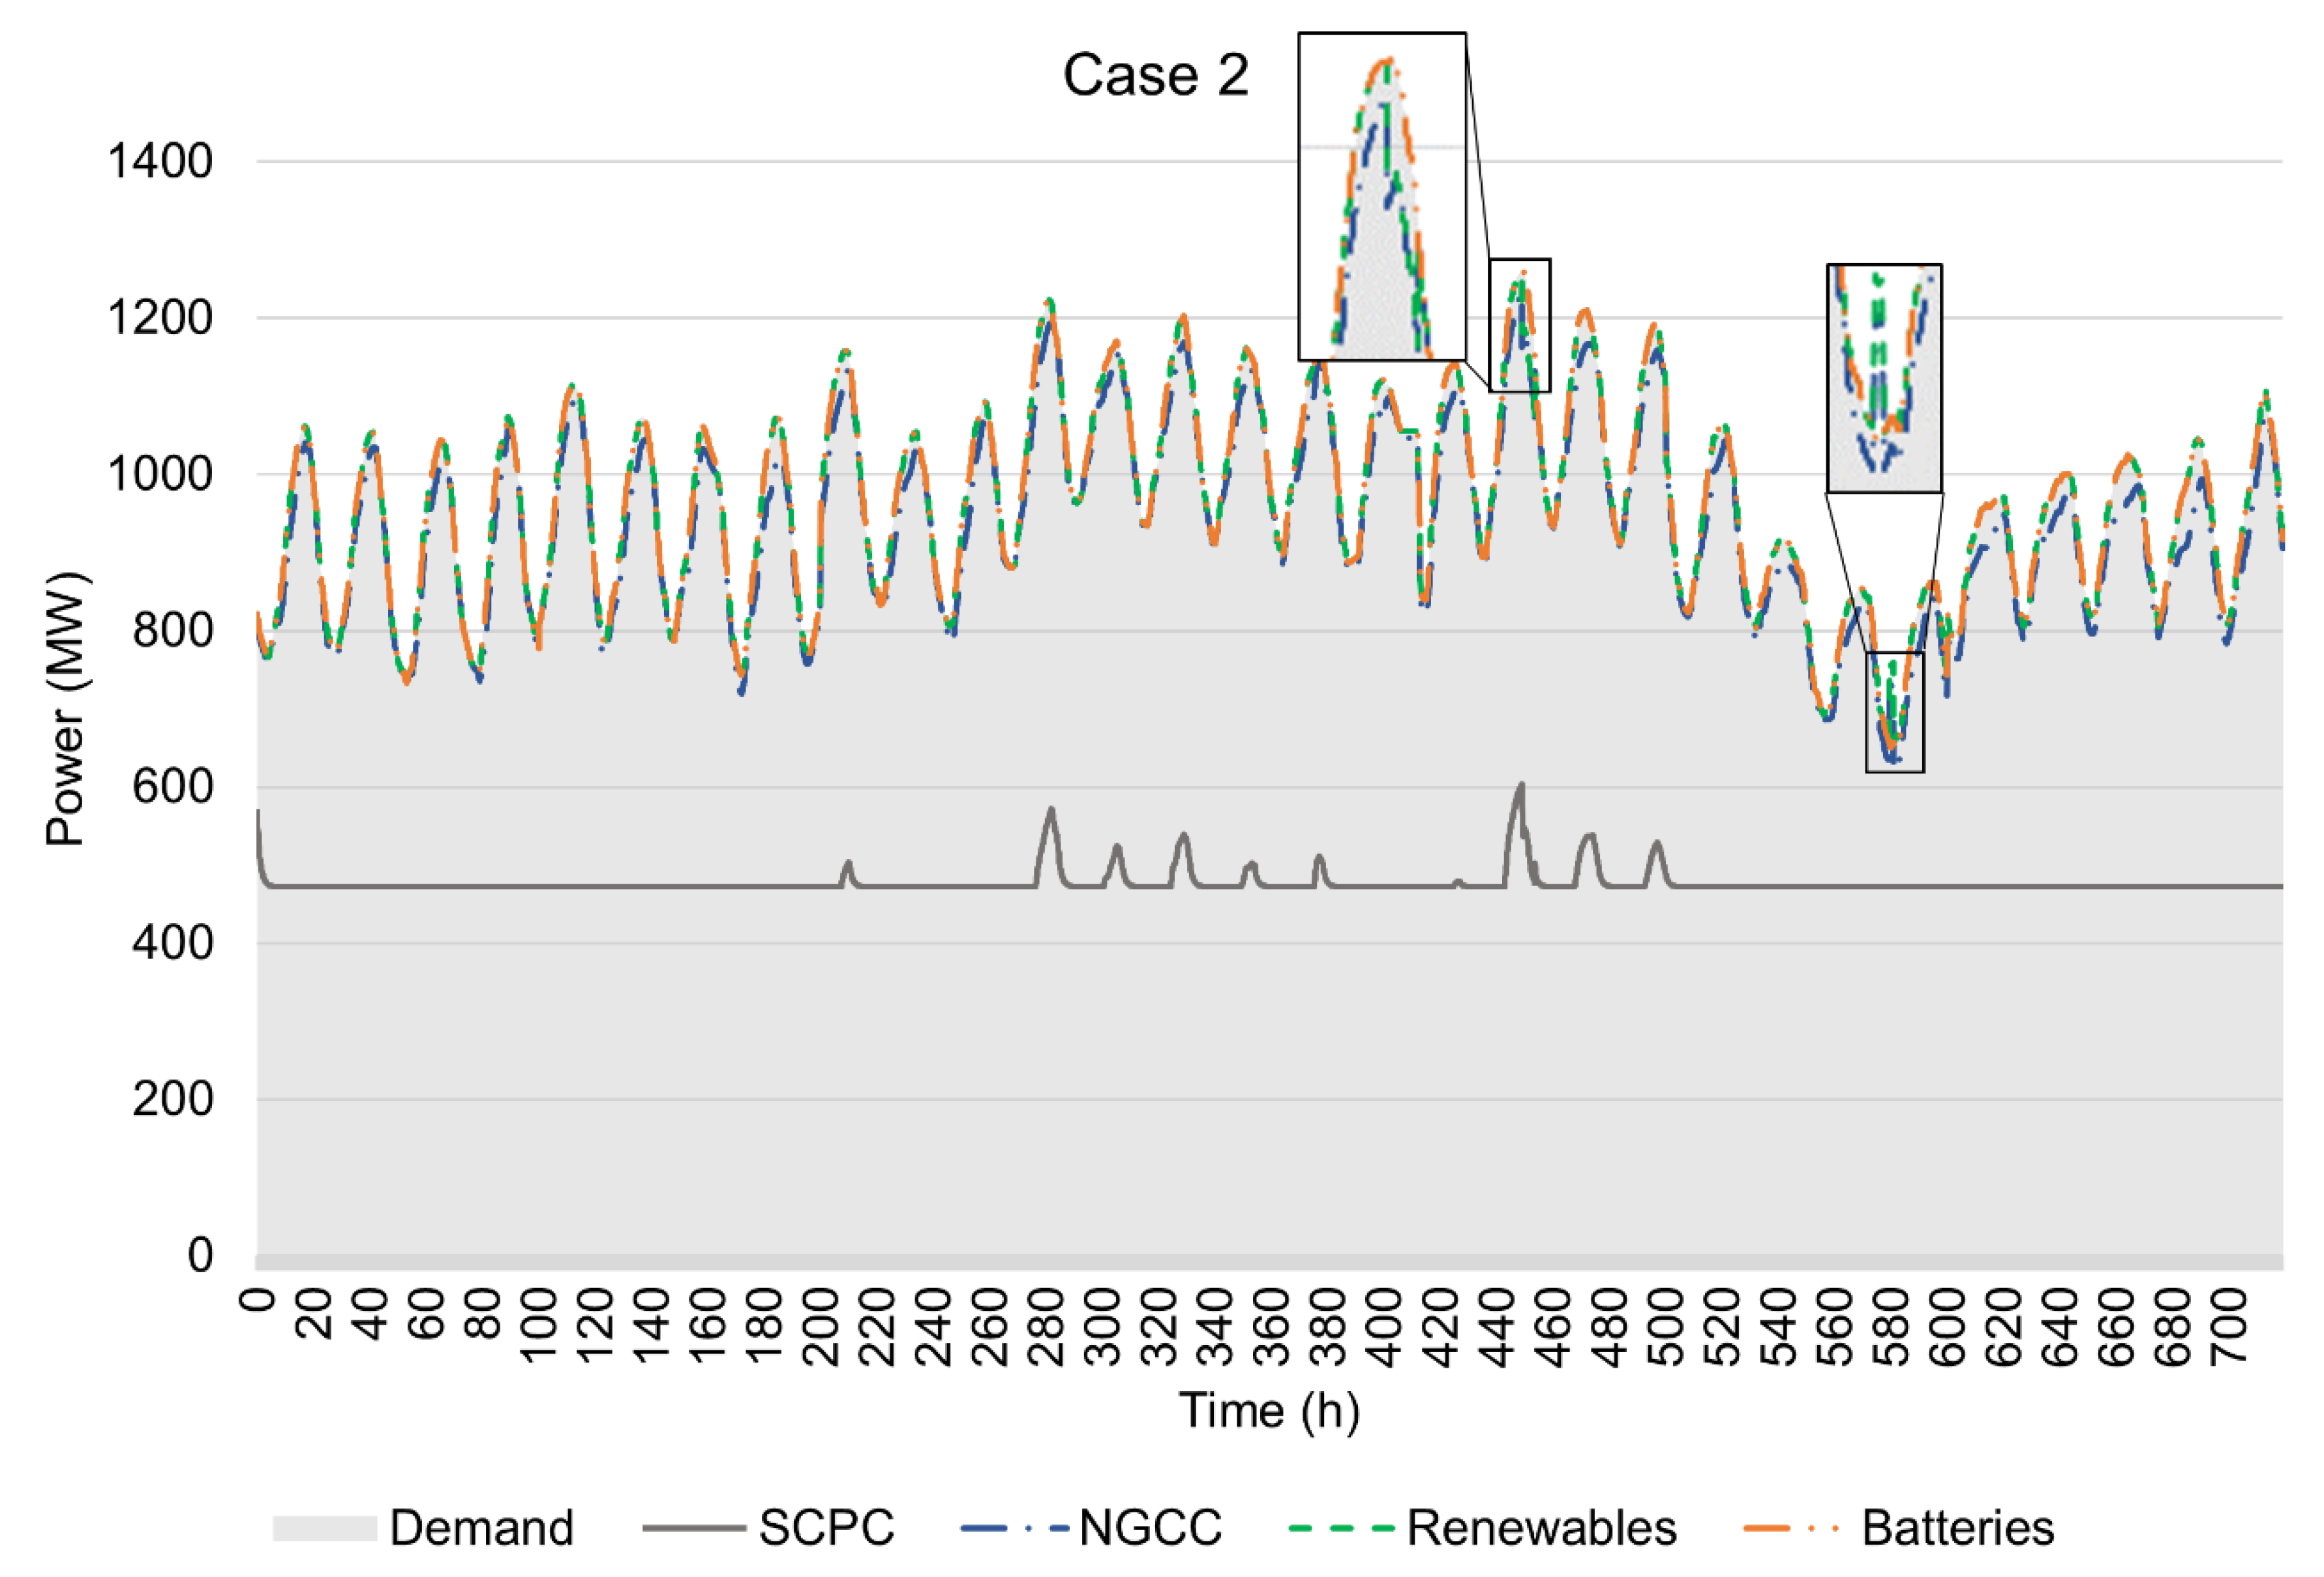
Case 2 considers a minor modification to the 2019 demand by increasing the minimum and maximum loads, i.e., the valleys and peaks, which would require faster ramping abilities from the grid. The electricity price and solar/wind penetrations into the grid are considered to be the same as in Case 1. The rationale in Case 2 is to verify the grid’s capability to supply the demand under a more challenging demand peak/valley scenario. In this case, the results depicted in
Figure 10 show that the load demand is supplied mainly by the SCPC and NGCC, while the NaS batteries are used only twice (as highlighted in
Figure 10) to smooth the peak at the approximate time of 450 h and to smooth the valley at the approximate time of 580 h. Specifically, at approximately 580 h, the sum of energy provided by the SCPC, NGCC, and renewables (green dashed line) surpasses the total load demand (shaded area). The reason is that there is an excess of electricity in the grid, which is used to recharge the batteries (orange line matches with shaded area). Due to the battery operating costs, they are used sparingly to prevent infeasibility. The detected behavior indicates that in case an unexpected demand was to happen, that would lead to suboptimal dispatch, and the batteries could be used more often for frequency regulation to satisfy the demand. As a perfect demand forecast of 6 min is assumed by the dispatcher, it is considered that any sudden deviation that was to happen could be supplied by spinning reserves. The results obtained in Case 2 are in accordance with the literature, in which the batteries are often employed in the absence of transmission structure or isolated areas where energy sources are scarce [
13].
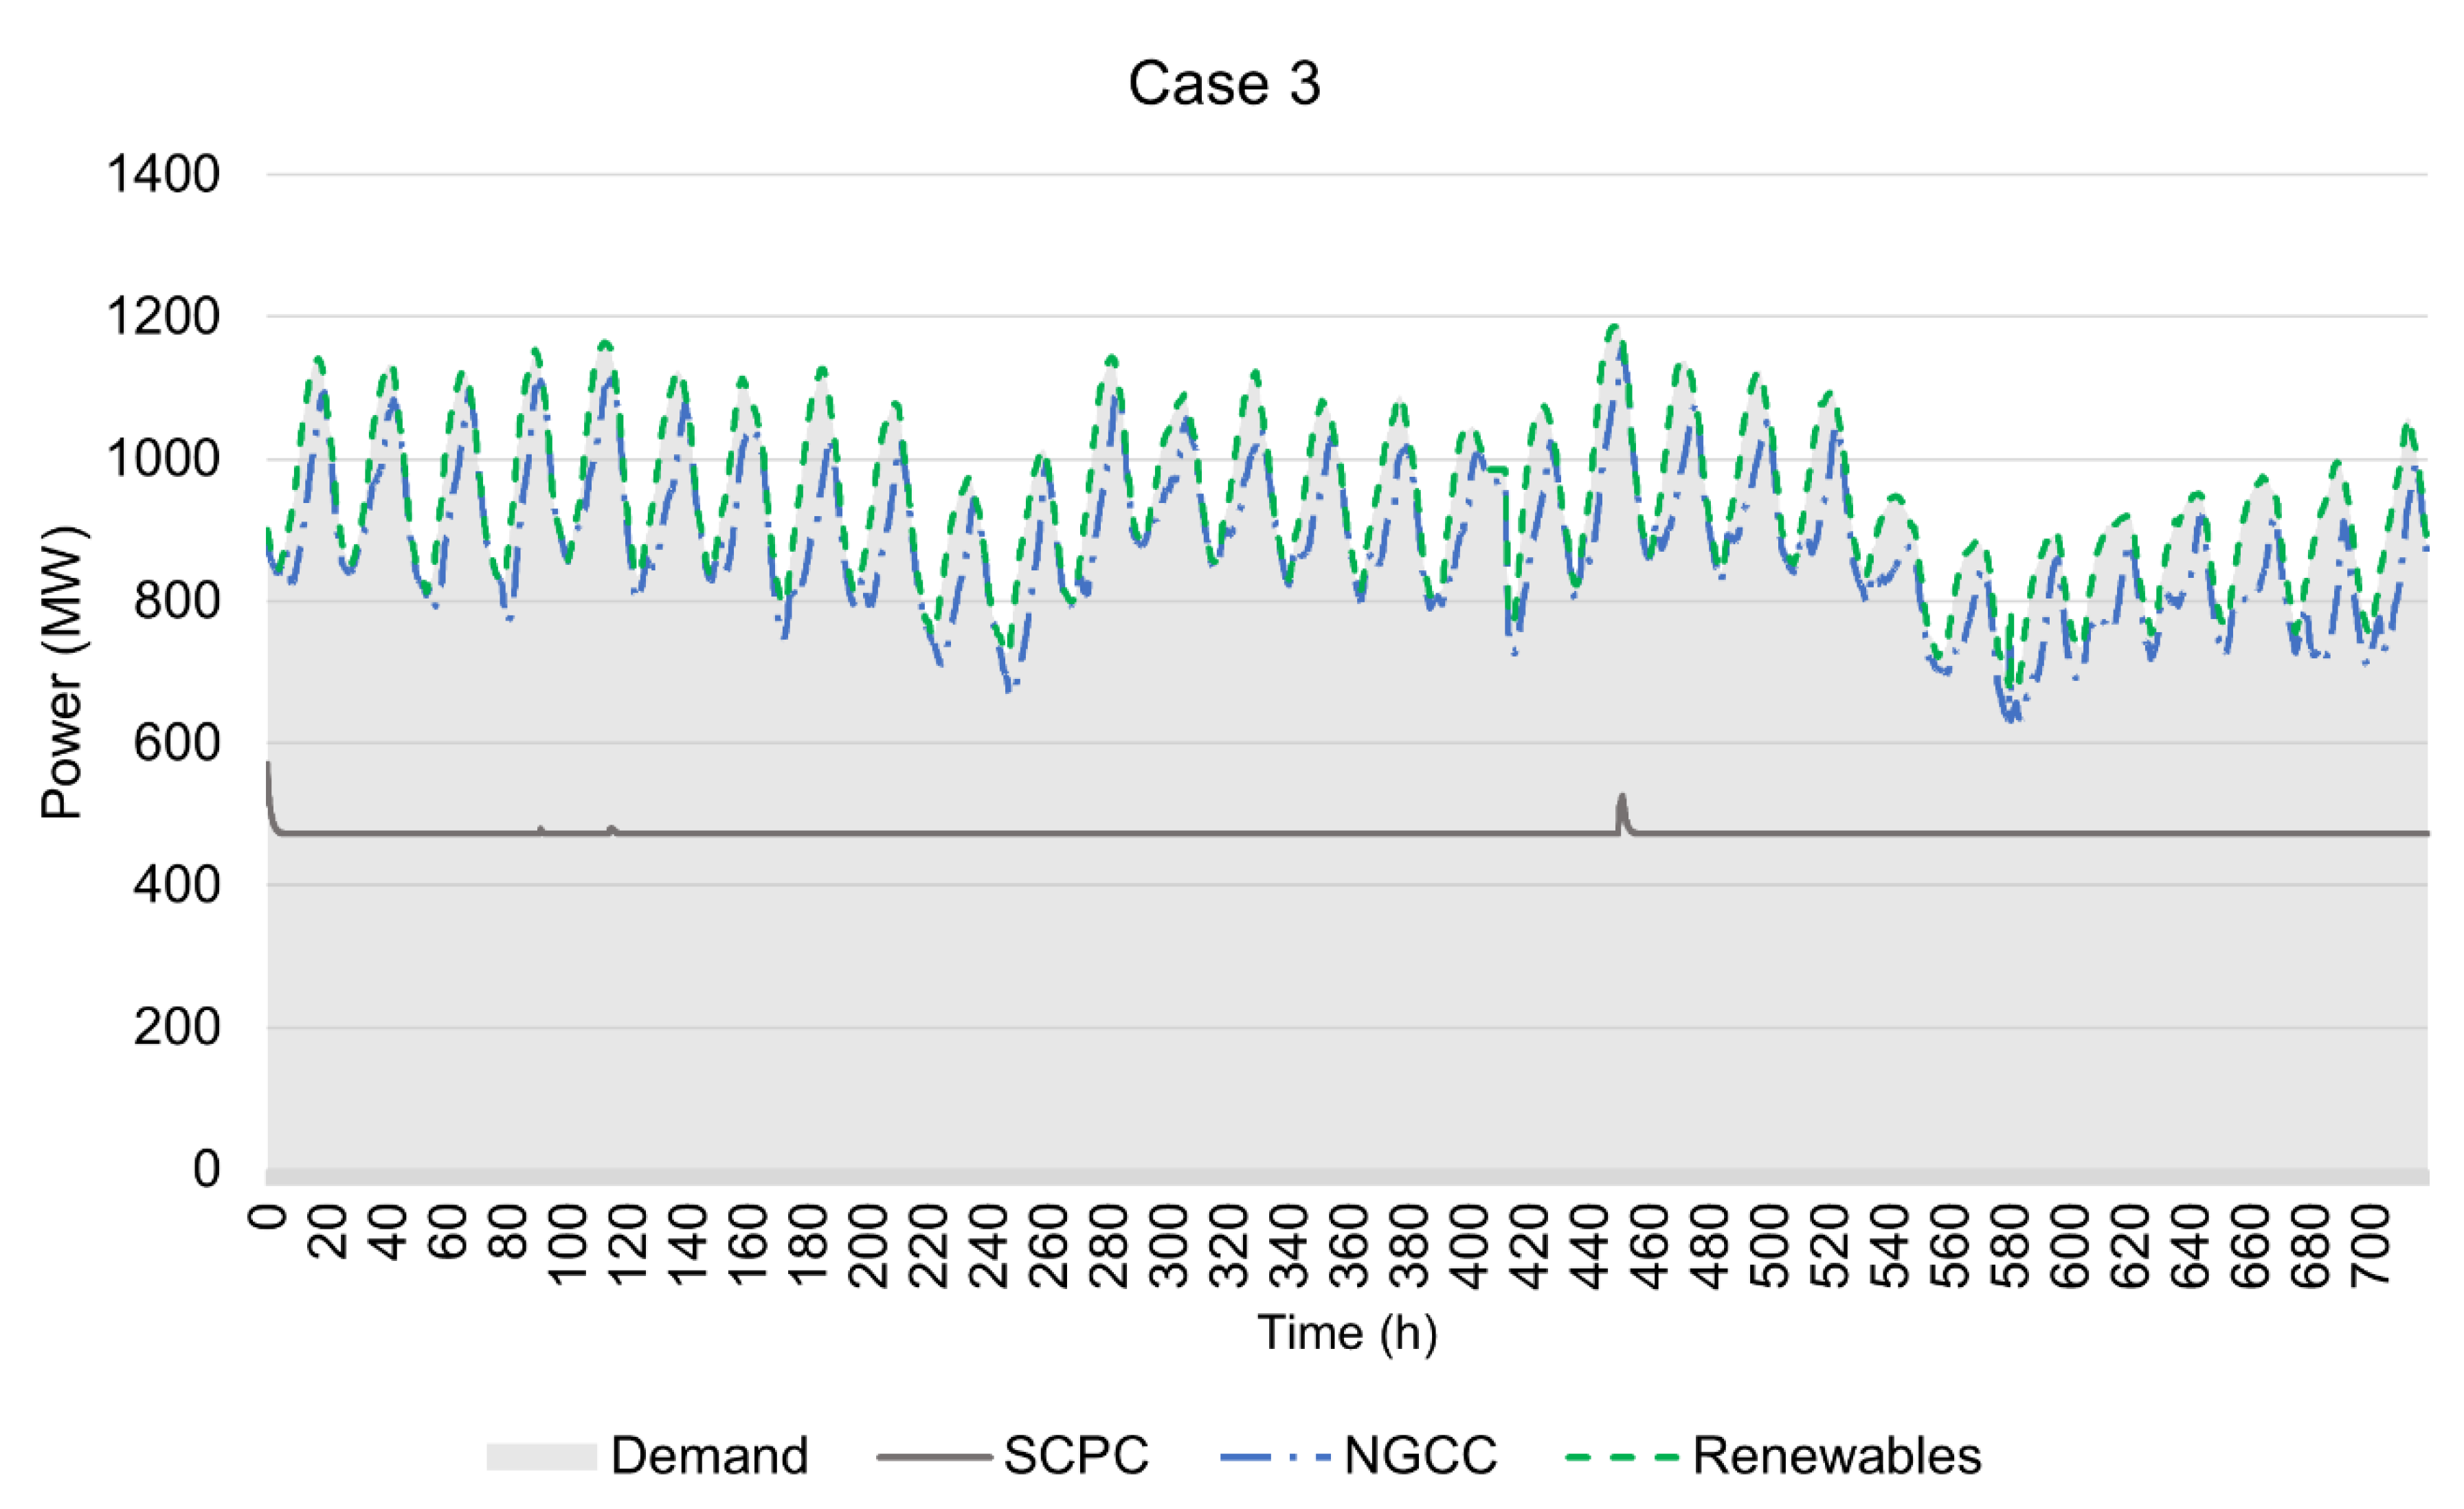
In Case 3, the electricity price, grid components, and demand are held constant and equal to those in Case 1, while the solar/wind penetrations are switched from 2019 to 2050 values. The 2050 wind/solar penetrations are shown in
Figure 8. The 2050 intermittent renewable energy penetration is based on the 2019 penetration and
Table 1 proportionality factors. The main goal of simulating Case 3 is to verify the potential of the 2019 grid components to supply the demand considering the high penetration of wind/solar sources. The results for Case 3 depicted in
Figure 11 show that the load demand is supplied by the SCPC and NGCC components. However, to avoid infeasibility during dispatch, a 45% maximum curtailment is allowed.
Figure 12 shows the curves for the accepted and curtailed renewable levels in Case 3. Under these circumstances, the batteries are not enough to avoid curtailment. To lower levels of curtailment, the optimizer stopped mostly after utilizing the energy available in the battery. This result indicates that considering the 2050 renewables penetration projection, the current grid is not sufficiently flexible to prevent curtailment. The reasons may be because the power plants are not capable to ramp up/down fast enough, the minimum load of the power plant is too high, and the batteries do not have enough capacity available to manage the variability introduced by the renewables.
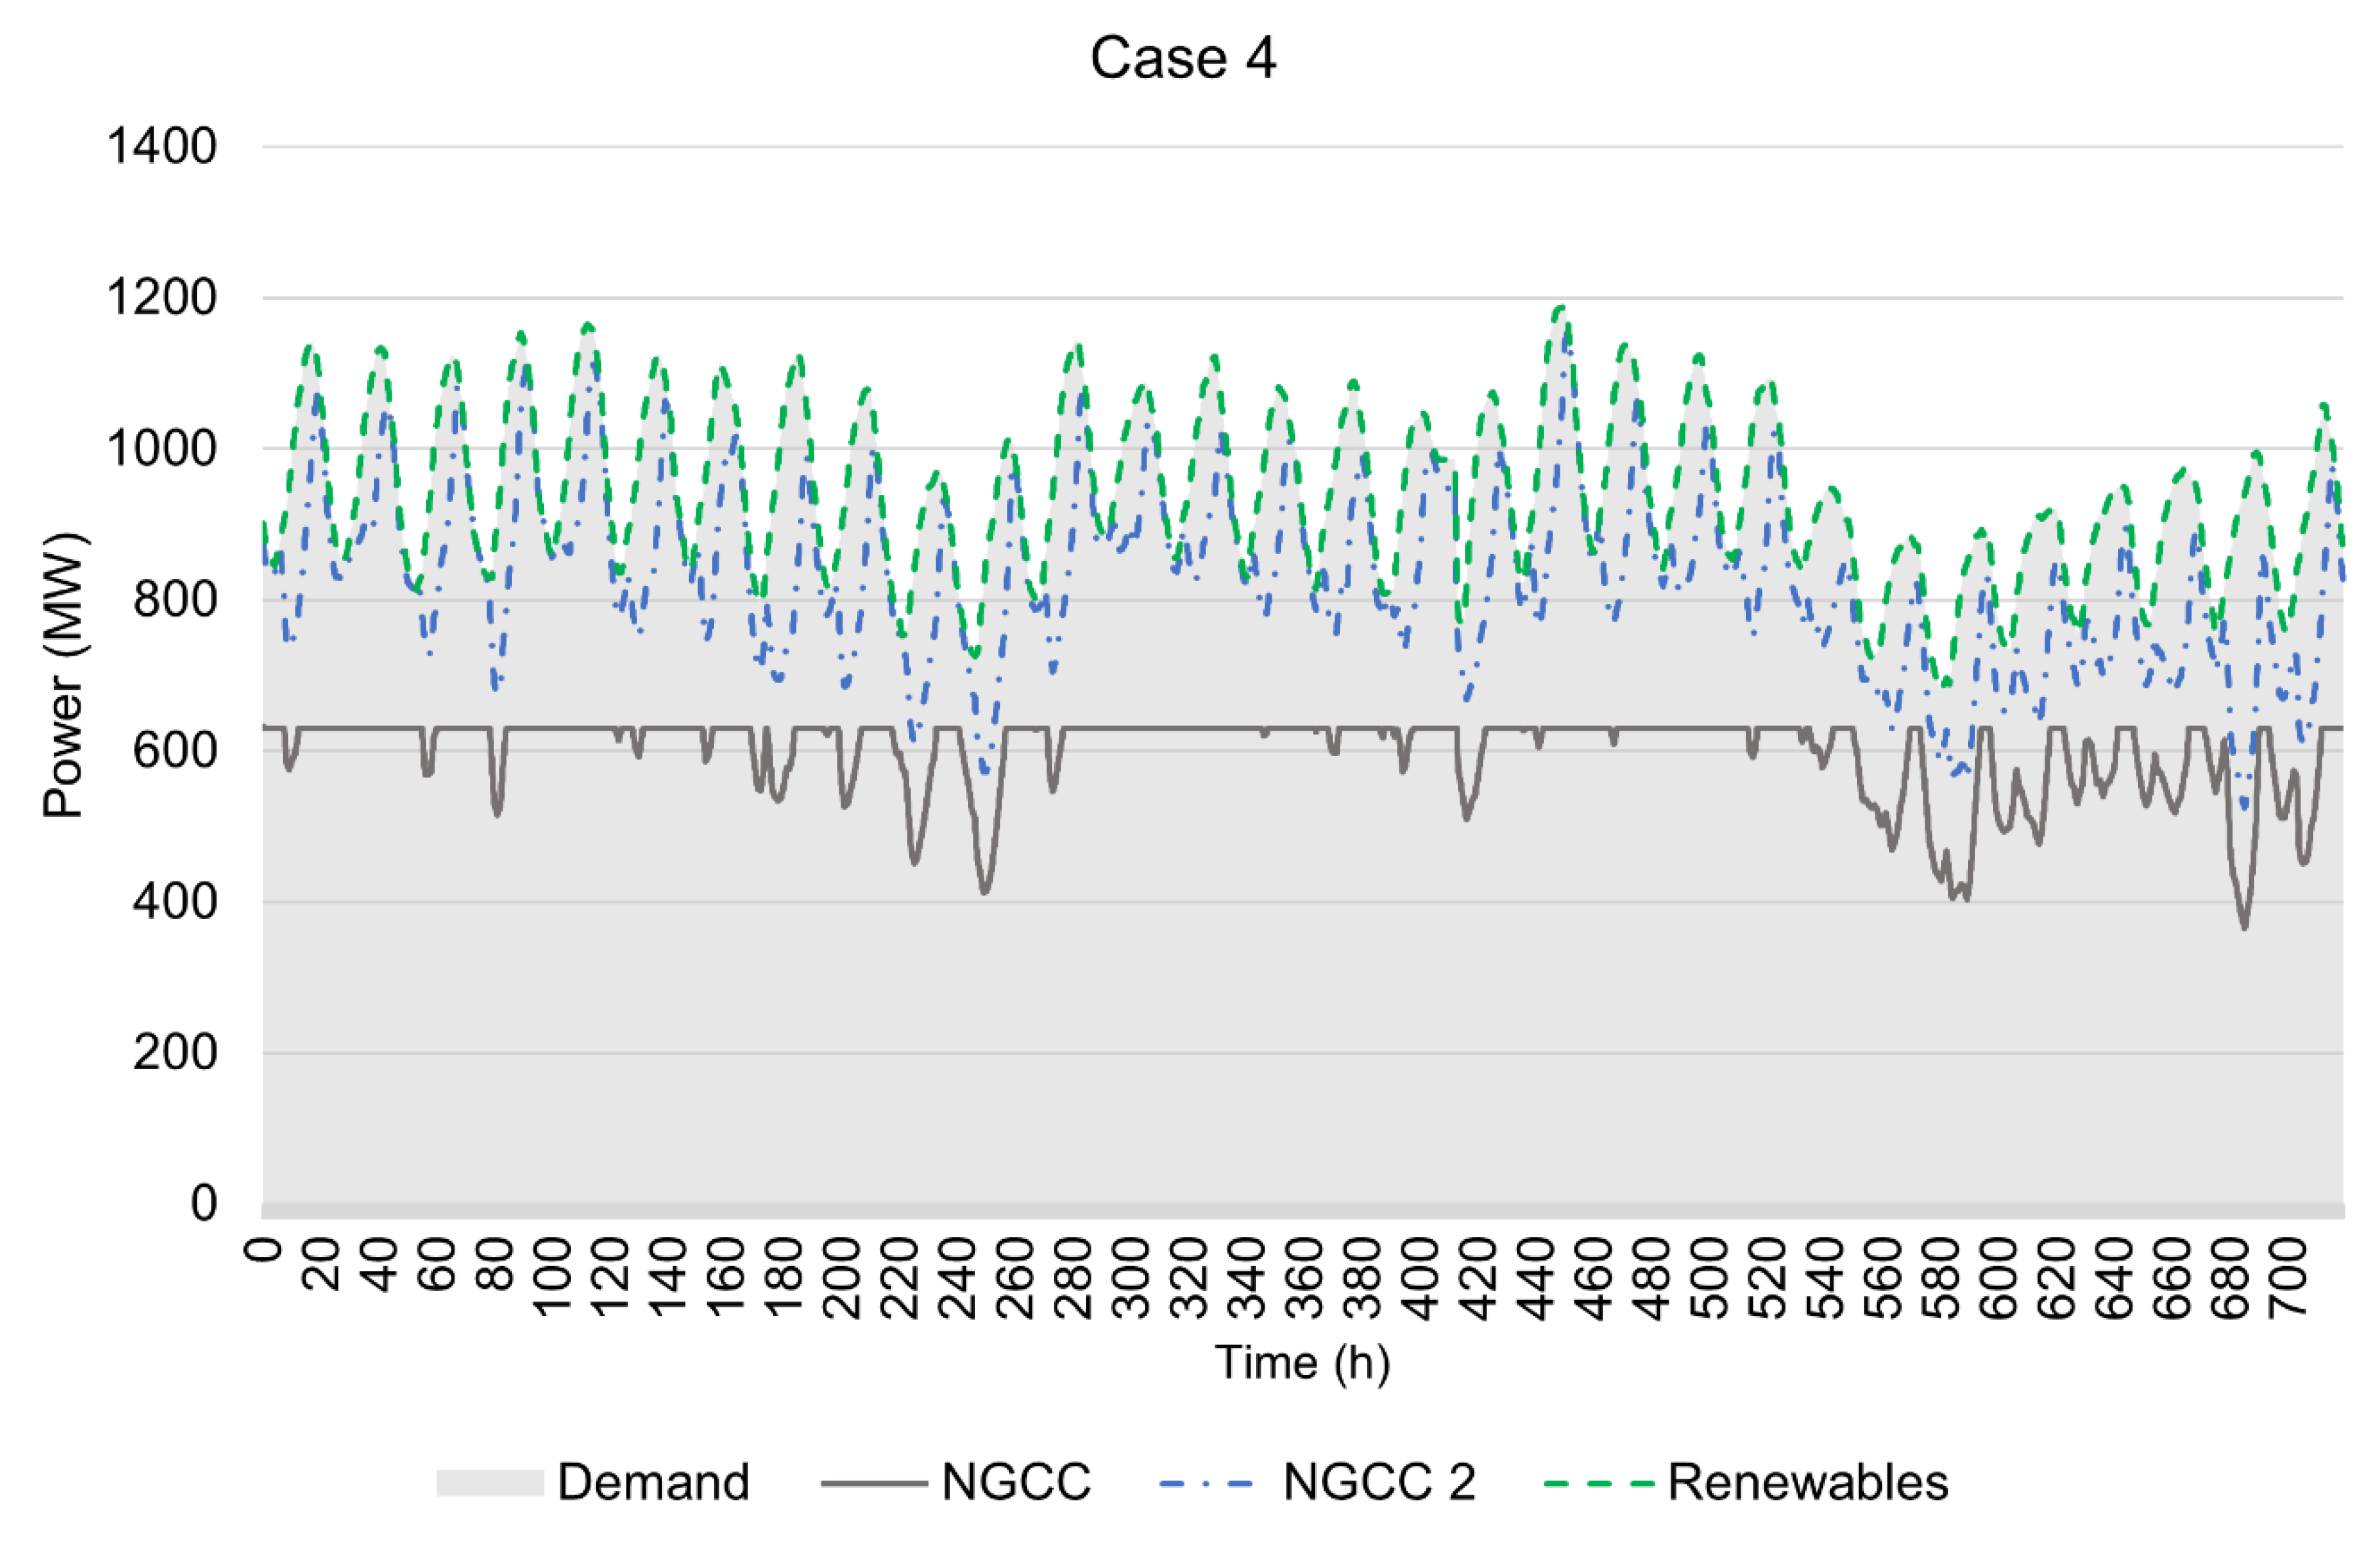
Finally, Case 4 considers the same forcing functions as in Case 3; however, the grid is revised by retiring the SCPC and including another 641 MWe NGCC. The goal of this case study is to assess how the change in grid components may impact renewable curtailment. The results depicted in
Figure 13 show that the demand load is supplied by the two NGCC power plants: one operated as a baseload power plant and the other operated as a load-following power plant, while achieving 0% renewable curtailment levels for 2050. This result indicates that for the grid to absorb higher variable renewable integration, there is a need to substantially increase grid flexibility. In Case 4, the simulated scenario is to replace the SCPC by an NGCC, but other alternatives would include retrofitting the SCPC, increasing NaS batteries capacity—albeit not being necessarily cost effective, or introducing an alternative energy storage system with higher capacity than the NaS batteries for a lower cost, such as pumped hydro.
Table 5 shows a summary of the four analyzed cases regarding the year of demand, electricity price, wind/solar production, grid components, and a brief description of findings.
Overall, it is observed that the SCPC is dispatched as a baseload power plant while the NGCC is dispatched as load-following power plant when both technologies are available. This behavior is expected as the SCPC is a less flexible technology than the NGCC. The average calculation time to determine the optimal dispatch for Case 1 to 4 was approximately 1200 s for each entire profile. The computational time considering the optimal dispatch problem is promising for extending the overall problem into a more complex unit commitment problem, which would include managing energy systems reserves for coping with uncertainties regarding demand and renewable levels.
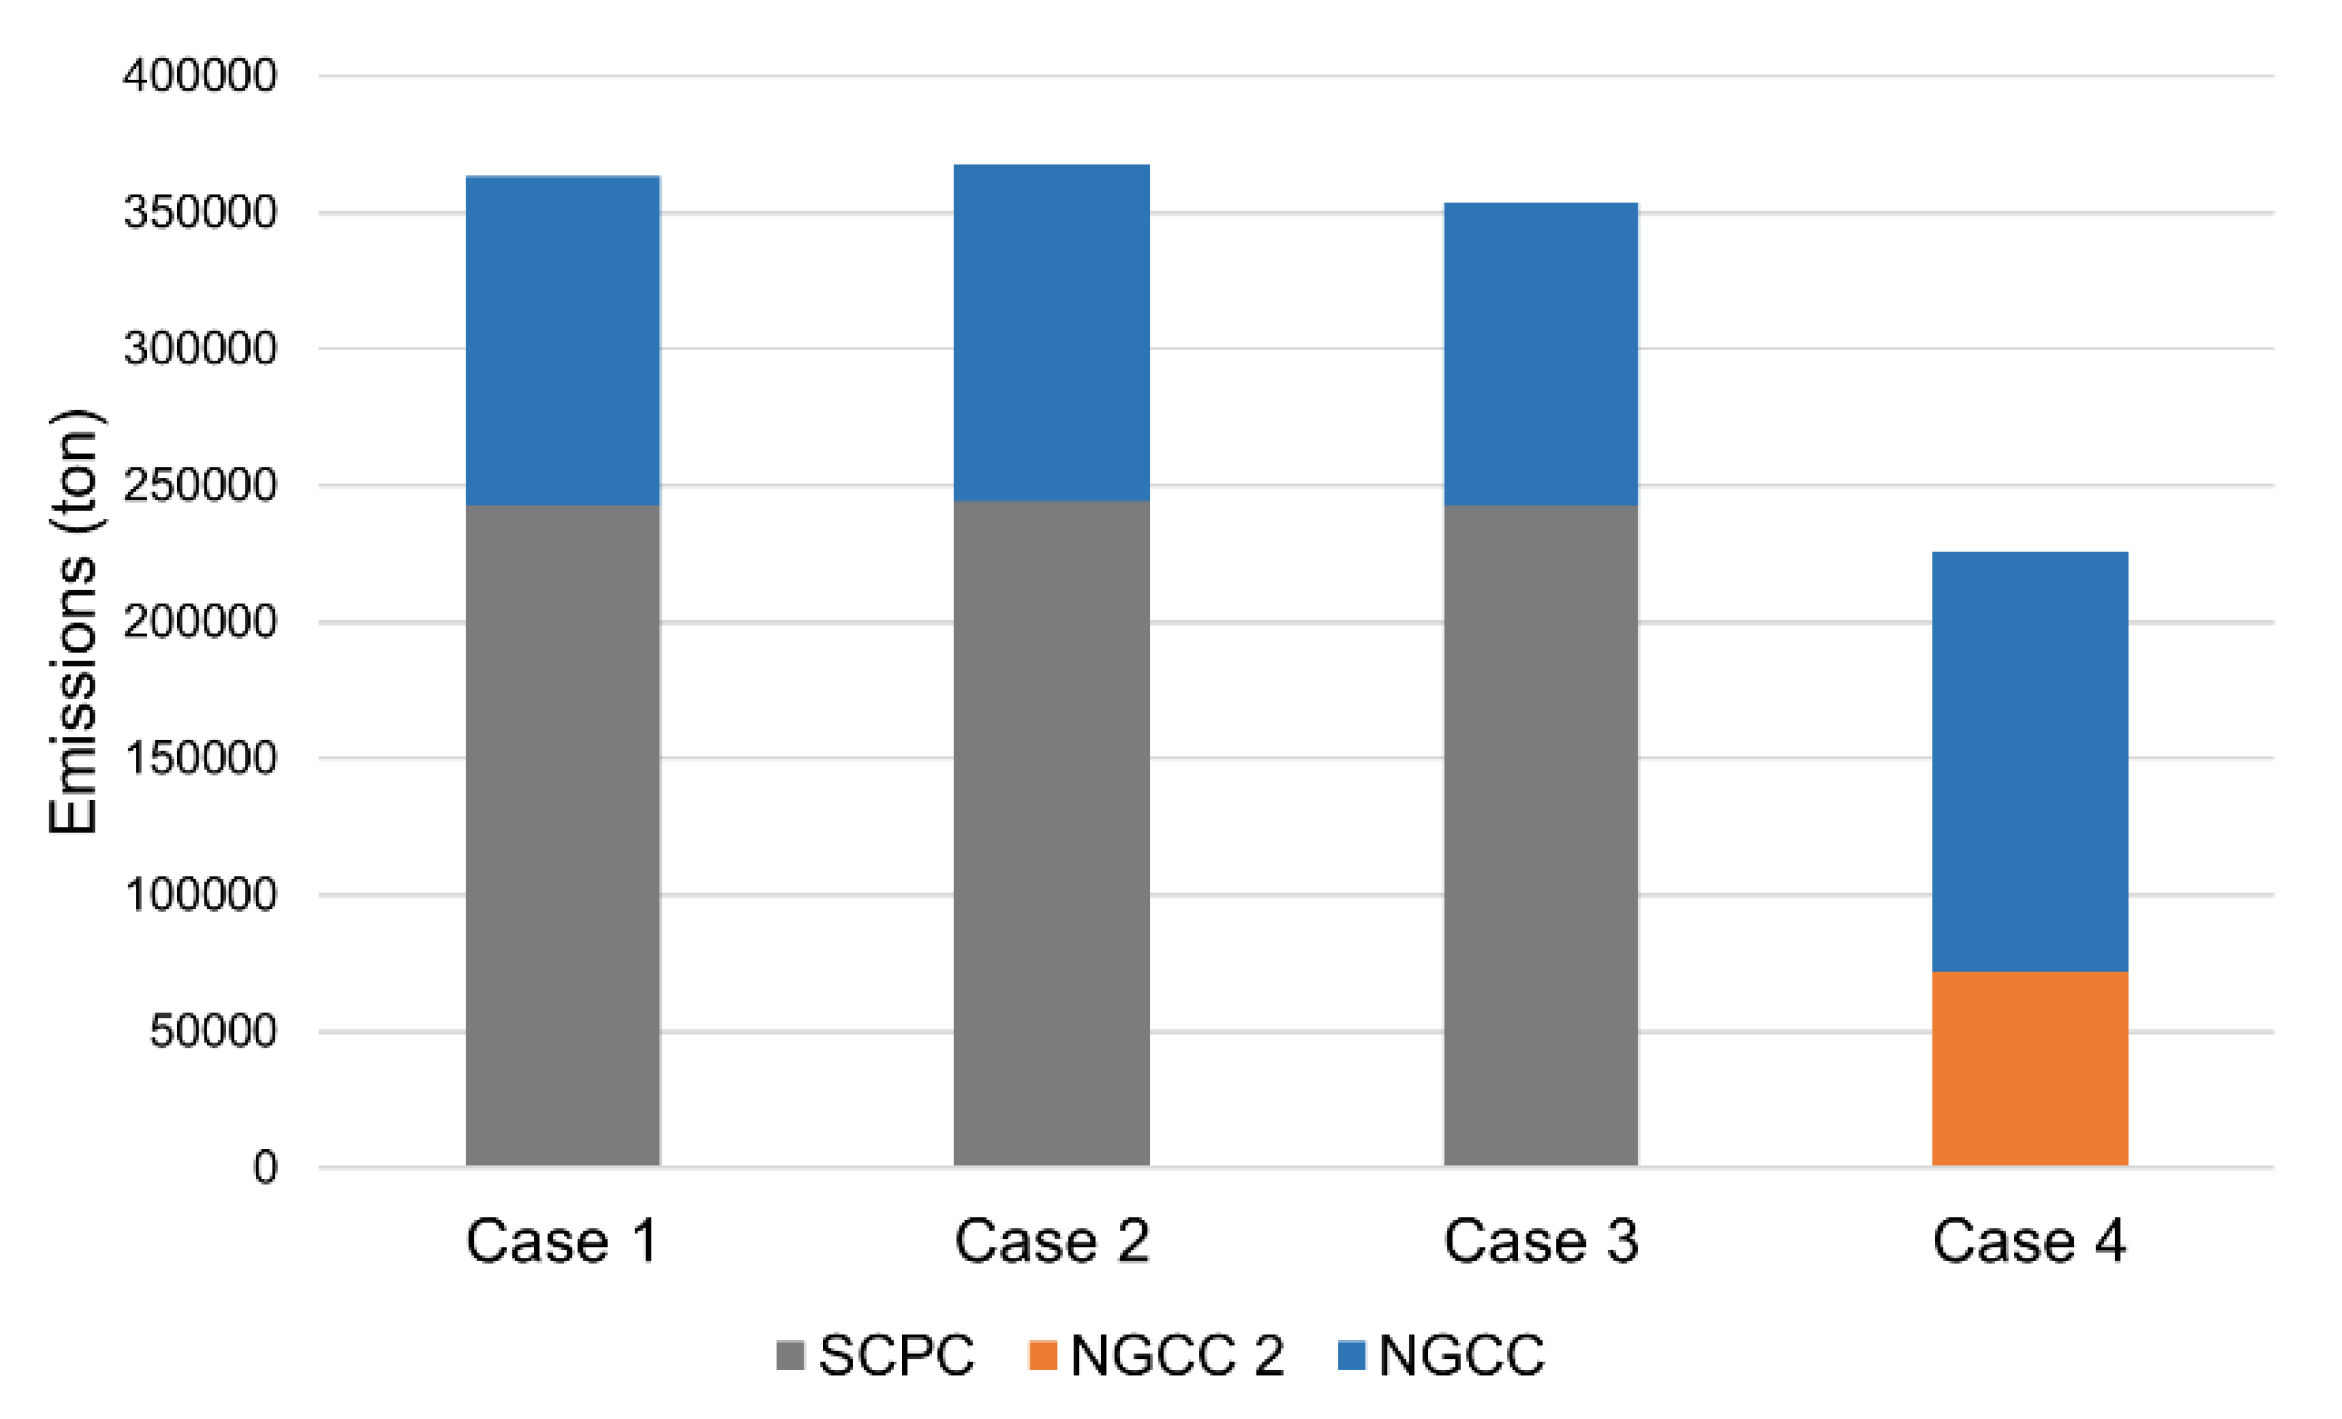
As mentioned above, after the optimal dispatch is determined, CO
2 equivalent and concentrated stress analyses are then performed for each case study. The calculated CO
2 equivalent is for the 30-day timespan and is depicted in
Figure 14.
In
Figure 14, note that most of the CO
2 emissions derive from the SCPC power plant, as the NGCC has a lower rate of CO
2 emissions per generated unit of power. In particular, even though Case 3 has the 2050 renewable power generation, the amount of CO
2 emissions is similar to that in Cases 1 and 2, as renewables curtailment was allowed. This result implies that increasing the renewable production should be done along with increasing grid flexibility; otherwise, the environmental performance may not improve as expected. A possibility to lower the emissions would be to combine the SCPC with a carbon capture technology. The carbon capture unit would have an energy penalty for the SCPC [
20,
22], but it could substantially decrease the CO
2 emissions. In addition, a multi-objective optimization considering economic and environmental objectives could also be applied to target emission reduction while determining the optimal dispatch.
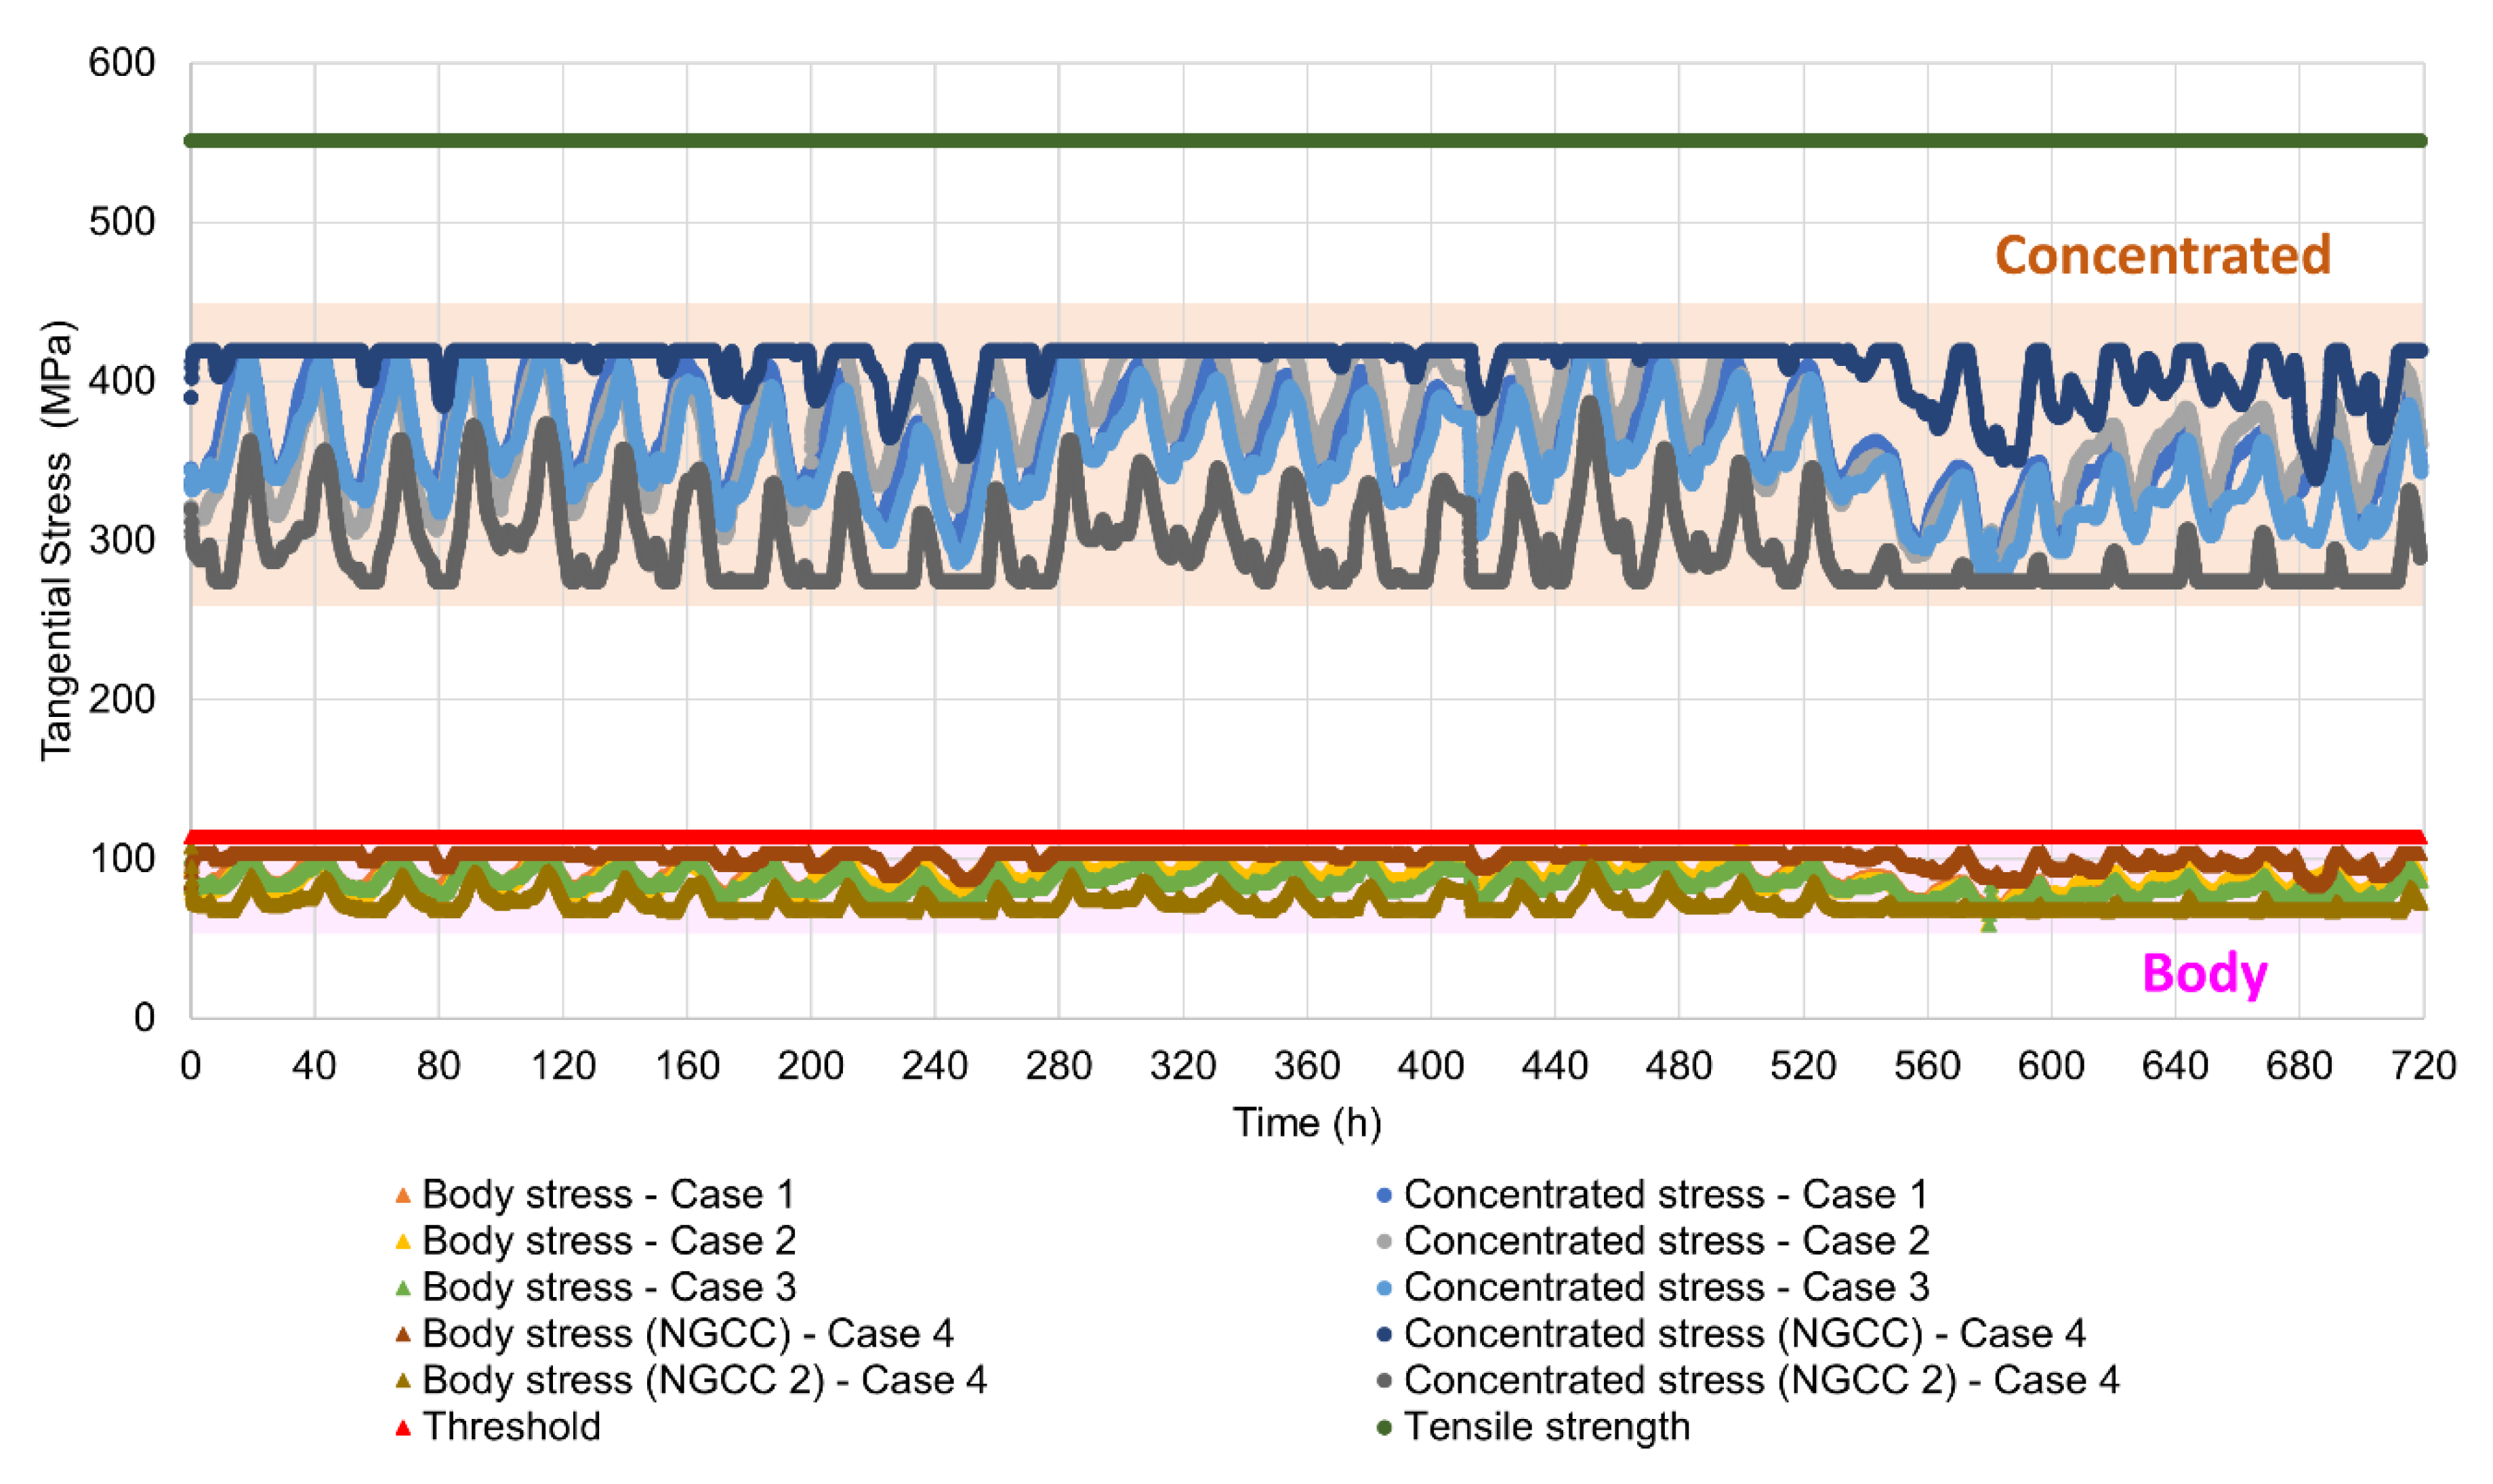
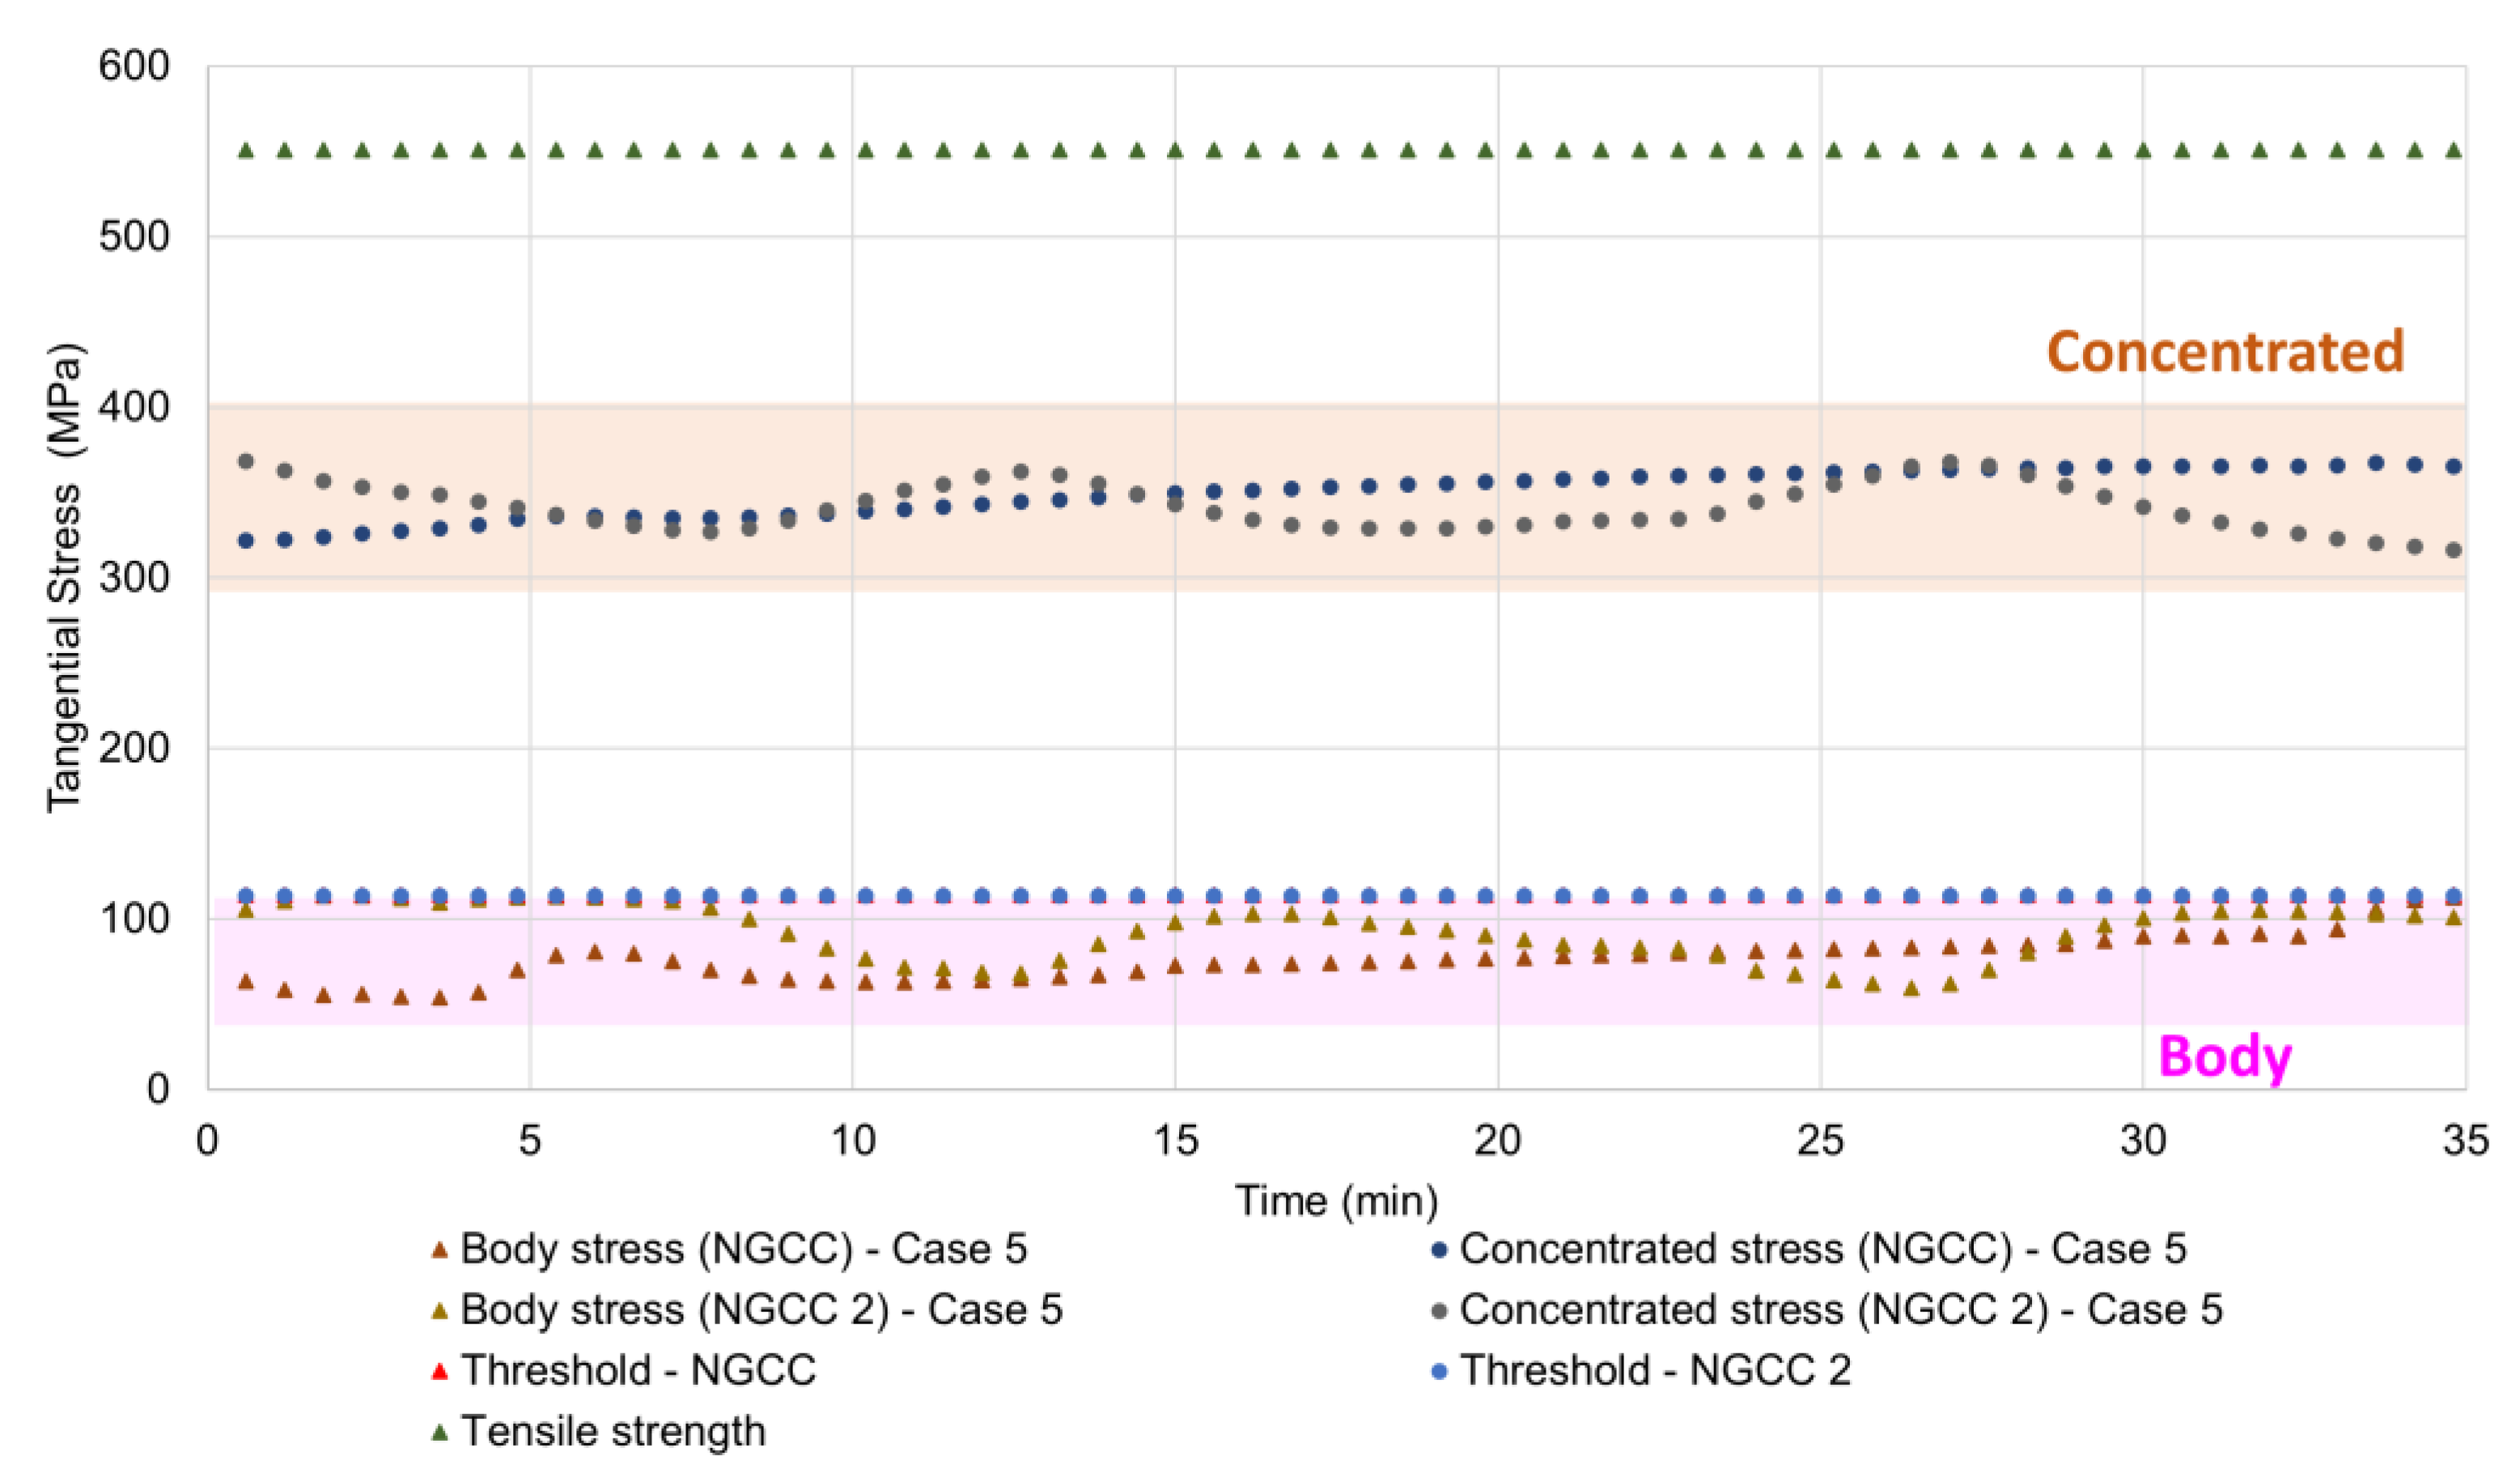
Figure 15 shows both stress results on the body and at the most stressed part of the NGCC drum for all case studies. Specifically, as Case 4 has two NGCCs in operation, stress analysis is performed to both power plants.
In
Figure 15, there are two distinct regions, namely, “Body” (highlighted in pink in
Figure 15) and “Concentrated” (highlighted in orange in
Figure 15). The “Body” section refers to the overall stress that the body of the drum is subjected to, and the maximum value of this stress is considered as a constraint in the optimal dispatch algorithm, as mentioned in
Section 2. Although close to the threshold value, the optimal dispatch was determined without the body stress constraint ever becoming active. The “Concentrated” section in
Figure 15 refers to the post-optimization stress analysis in the most stressed part of the drum. The stress in this specific part remained higher than the body stress threshold as well as the yield strength (260 MPa), while it was lower than the tensile strength. Thus, local uniform plastic deformation is expected to occur during a number of initial cycles in the most stressed part of the NGCC drum. However, the stress does not exceed the elastic shakedown limit, which is defined as twice the yield strength (520 MPa), and fully elastic behavior is anticipated in subsequent cycles.
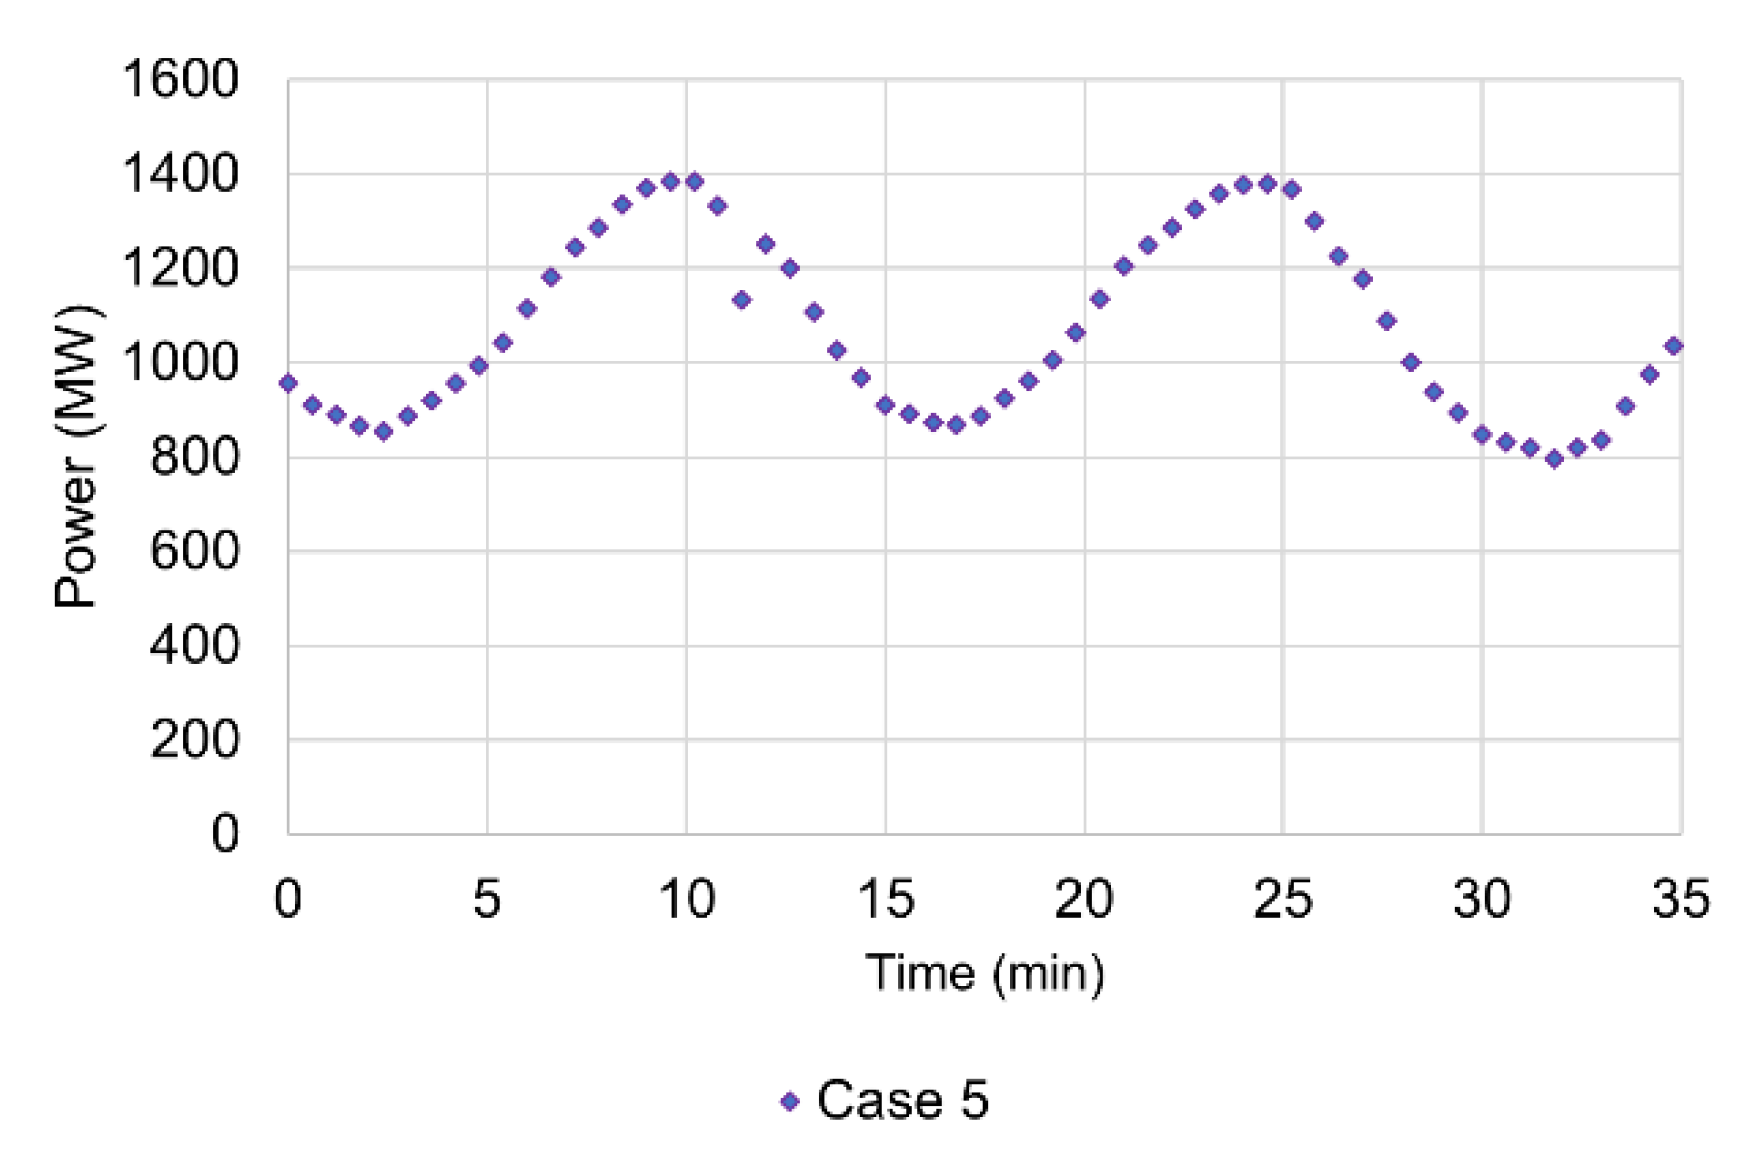
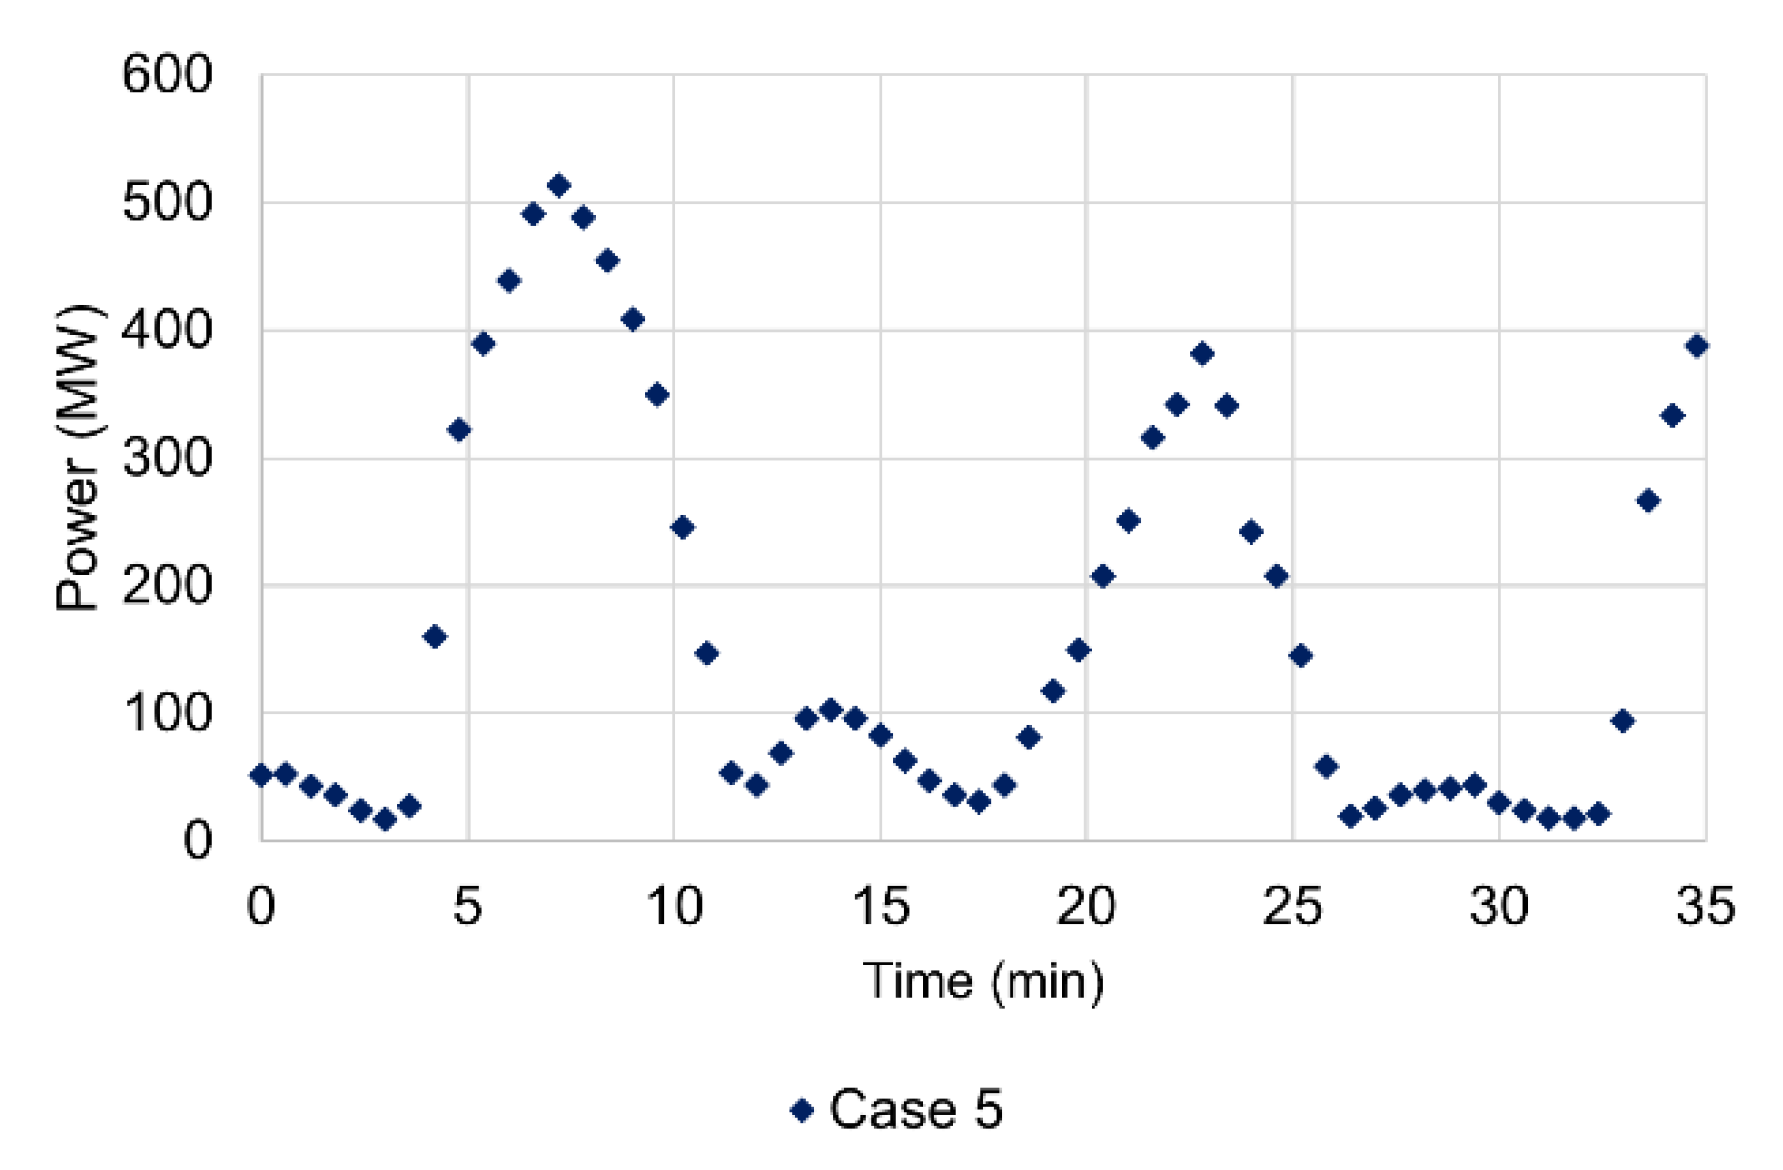
Based on Case 4 results, Case 5 was elaborated under an even more challenging scenario regarding renewable penetration that demands up to 30%/min ramping rates from the power plants and shorter time steps (36 sec). Therefore, a shorter overall time horizon load and renewable penetration curves are created and shown in
Figure 16 and
Figure 17. The grid components are the same as Case 4, i.e., the two NGCCs and the NaS batteries.
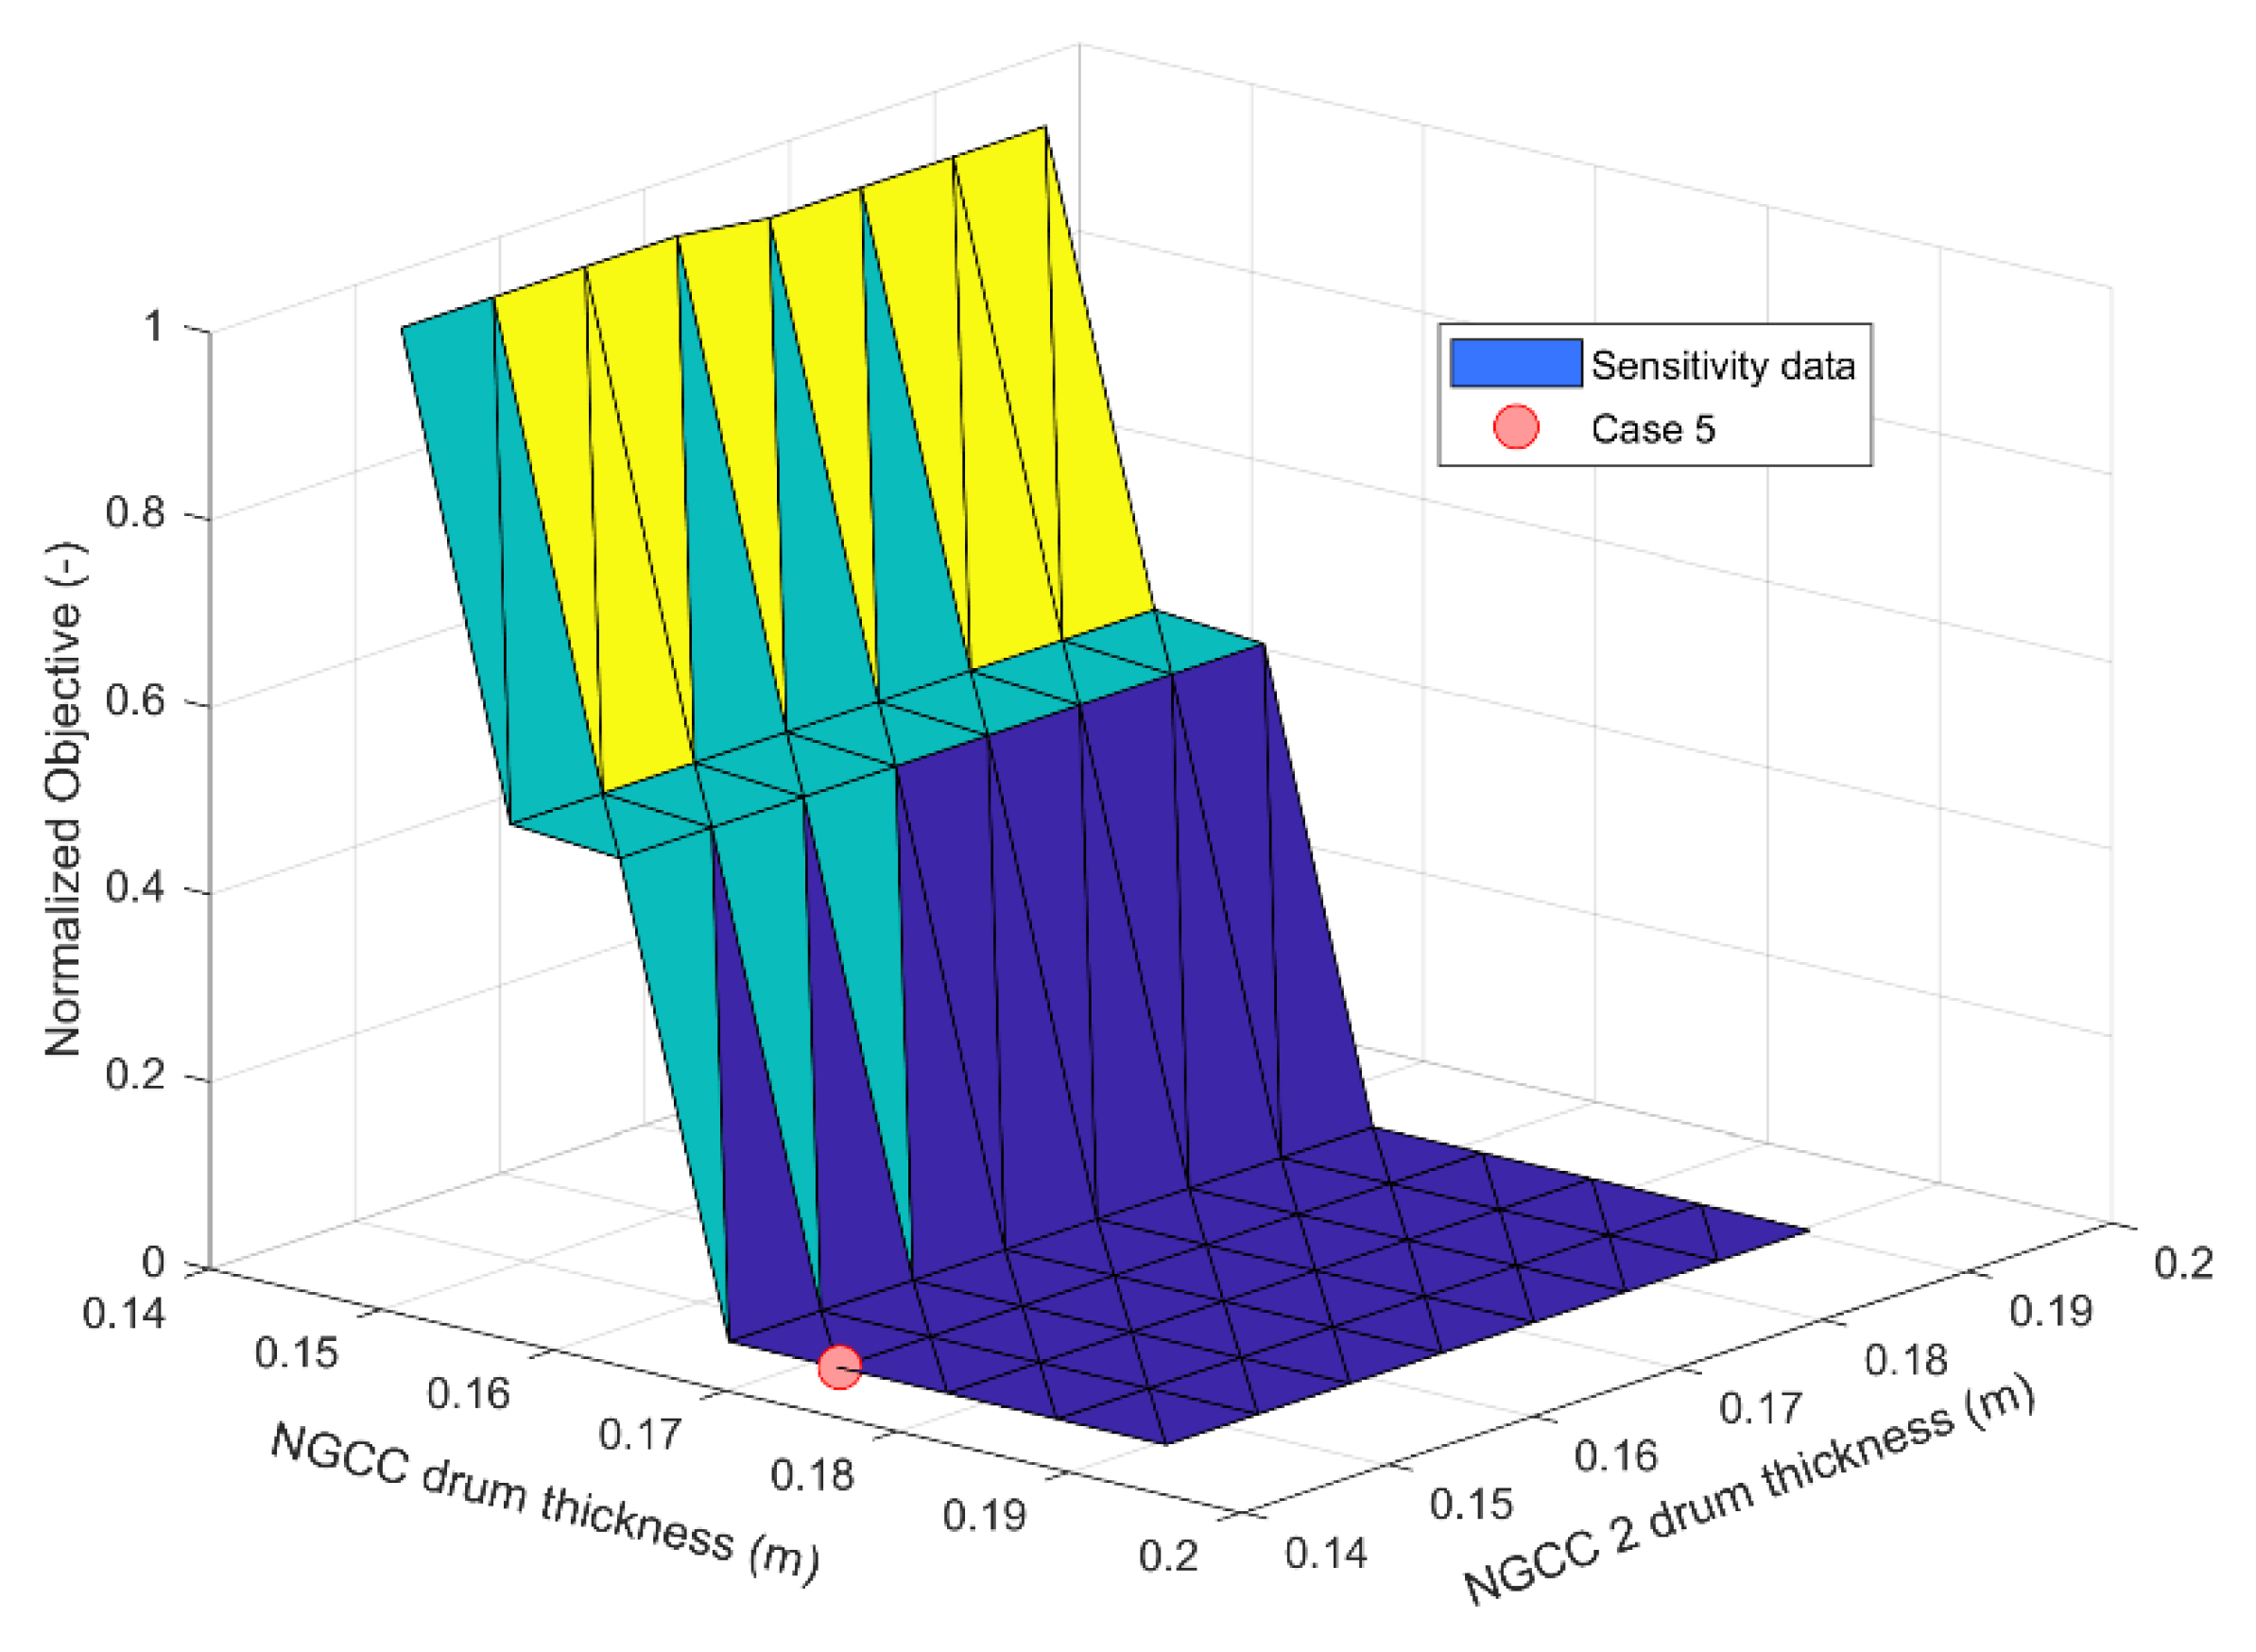
The goal of this new case study is to give an insight about the NGCC drum thickness influence on the optimization objective function as well as the stresses on the NGCC’s drums under high ramping rates scenario. Therefore, a sensitivity study is conducted initially considering a range of [0.1461 m, 0.1905 m] for both drums’ thicknesses (from NGCC and NGCC 2), while holding all other forcing functions constant. The results of the sensitivity study are shown in
Figure 18. The results indicate that for cases in which the cycling leads to prohibitive stresses, the optimization objective showed some sensitivity to the drum thickness. It is expected for the objective to become more sensitive as the number of NGCC’s considered in the grid increases. It was also observed that the thicknesses are not the same for baseload and load-following power plants to achieve the strict minimum value in the sensitivity analysis. At drum thicknesses higher than 0.1905 m, the dispatch was not completed, as prohibitive stresses reduced the feasible space to null at certain time instances.
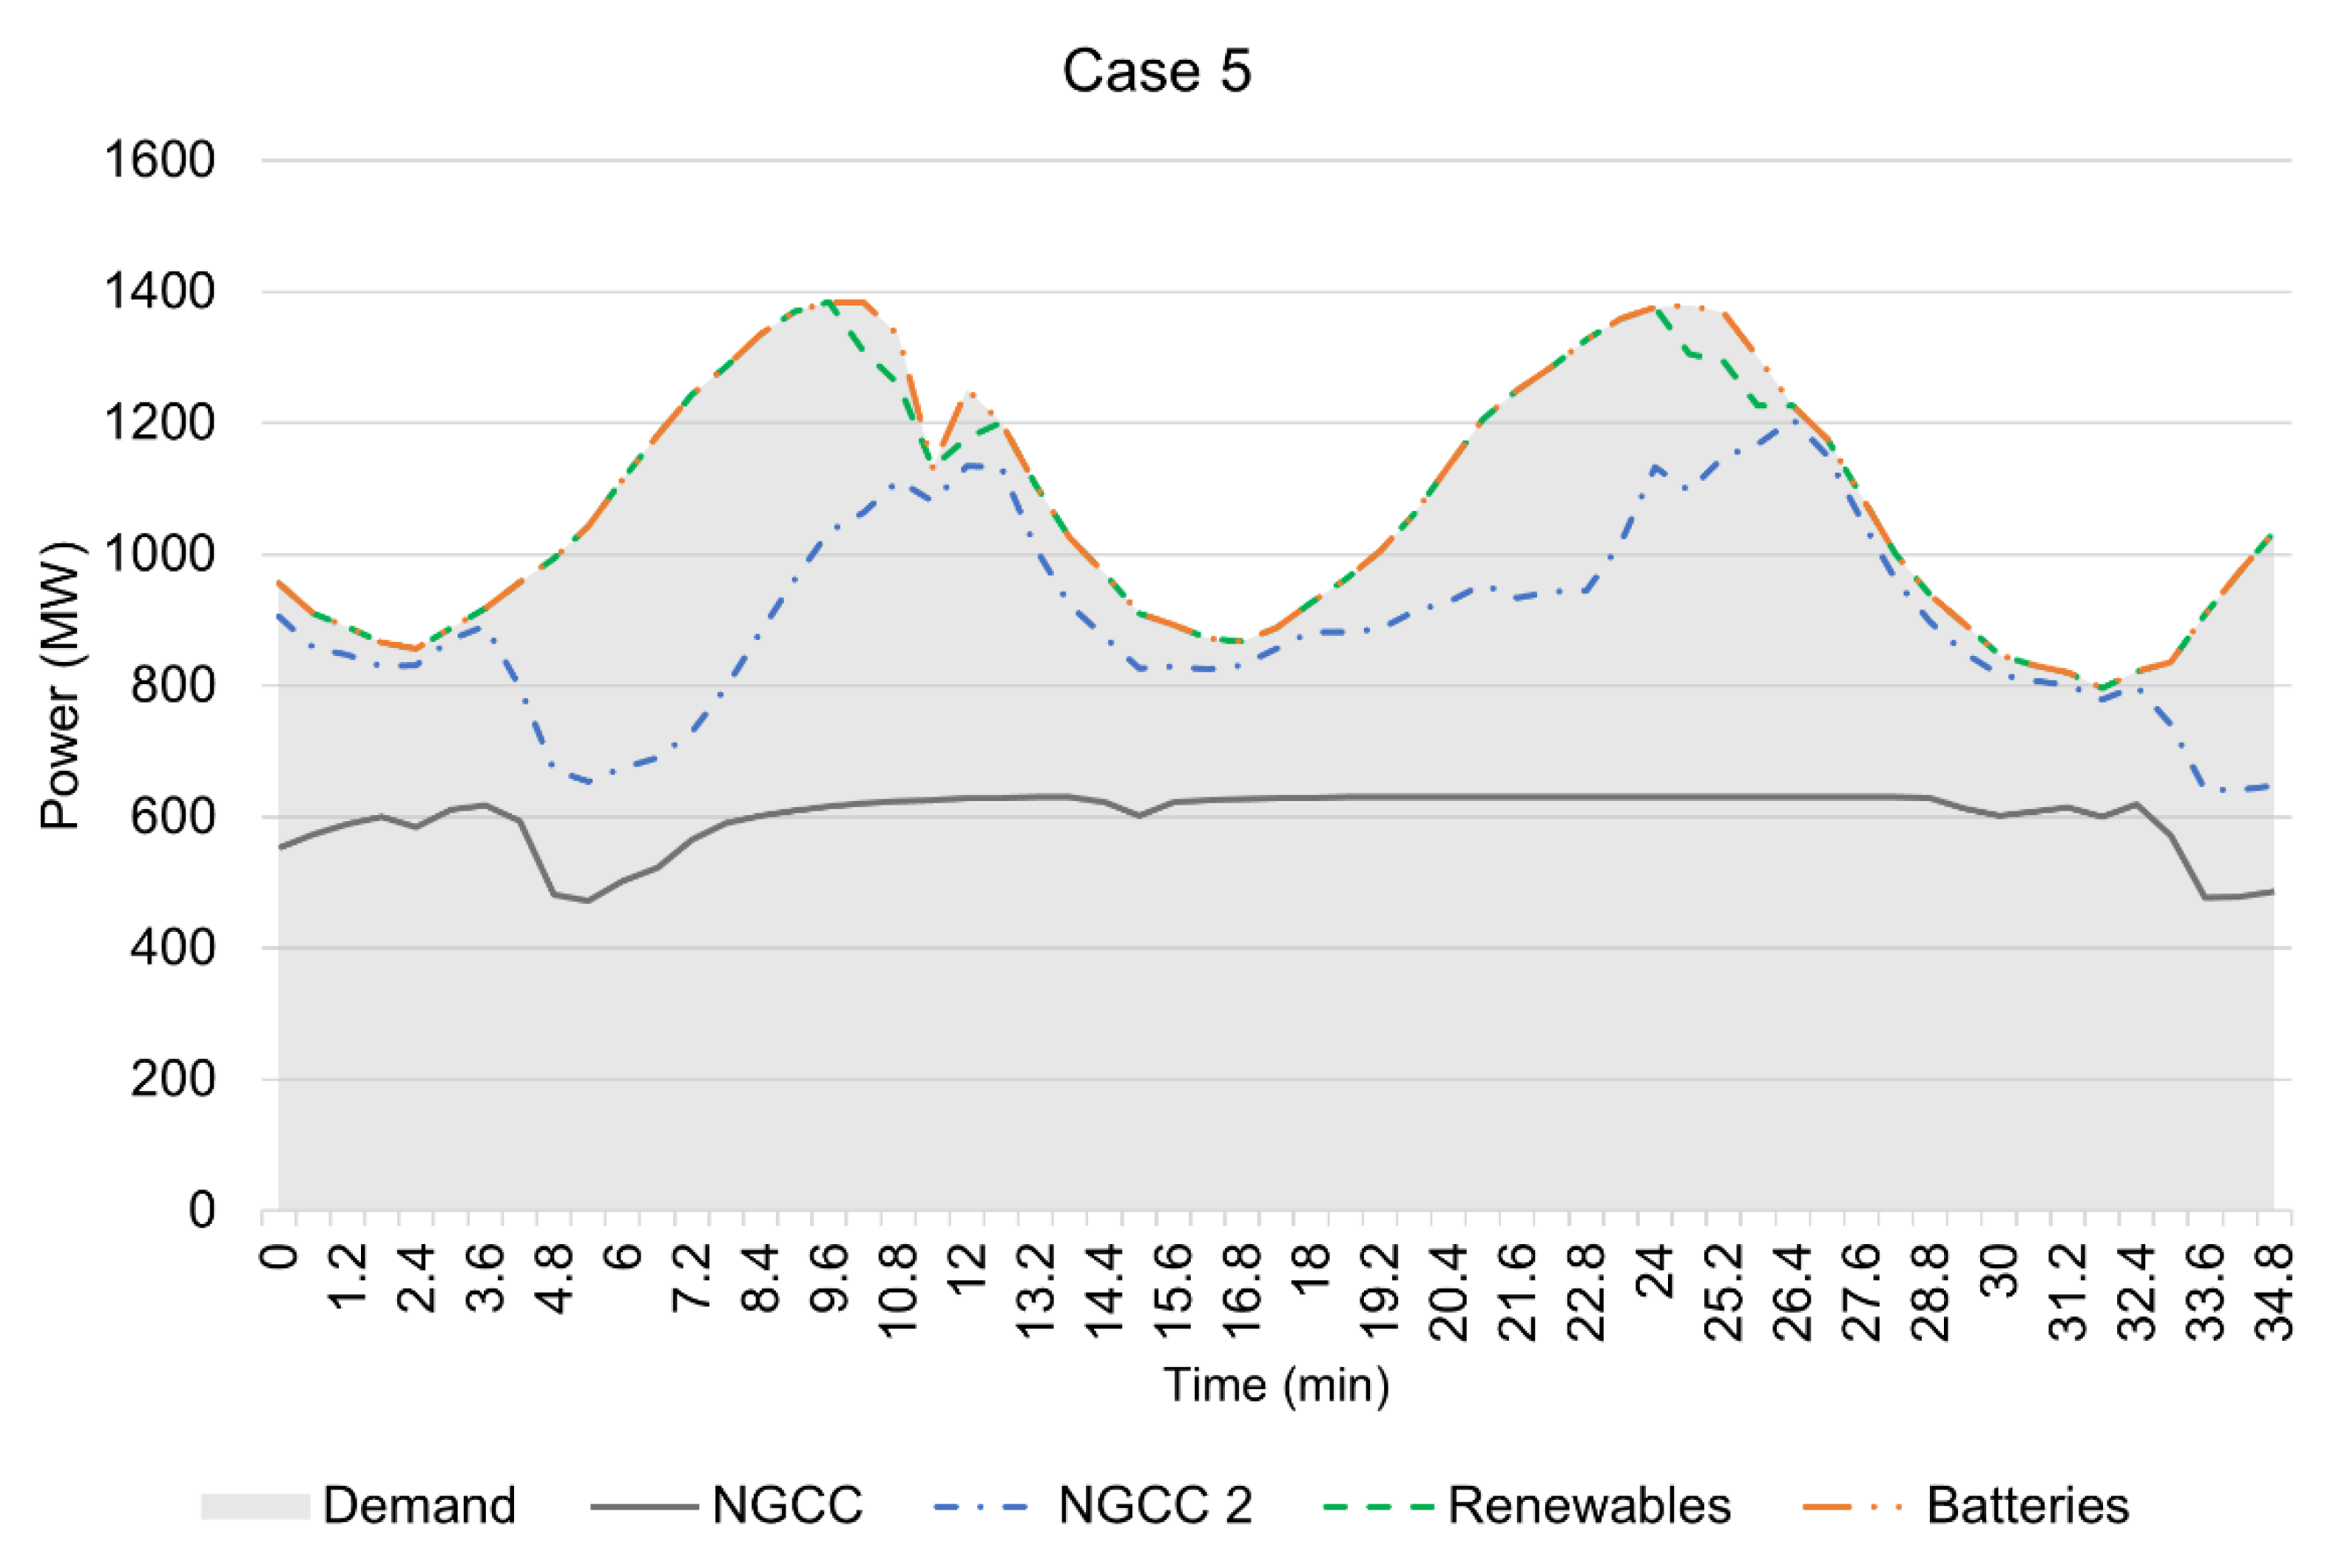
After the sensitivity analysis was complete, a point for the normalized objective equal to zero is chosen for the optimal dispatch simulation, as shown in
Figure 16. The drum thickness for the NGCC is 0.17145 m and for the NGCC 2, it is equal to 0.1461 m. The results of the optimal dispatch and corresponding stresses are shown in
Figure 19 and
Figure 20.
Figure 19 shows that under a highly variable renewables scenario that demands faster ramping rates, the NaS batteries are used more often, discharging at approximately t = 9.6 min and t = 24 min. These results indicate that under more aggressive ramp rates (> 30%/min), the use of batteries could have a larger participation in the grid. Curtailment is still avoided under this scenario, while NGCC acts as baseload power plant, ramping down when there is excess of renewable energy, and NGCC 2 acts as load following power plant, cycling its load more often than the other NGCC.
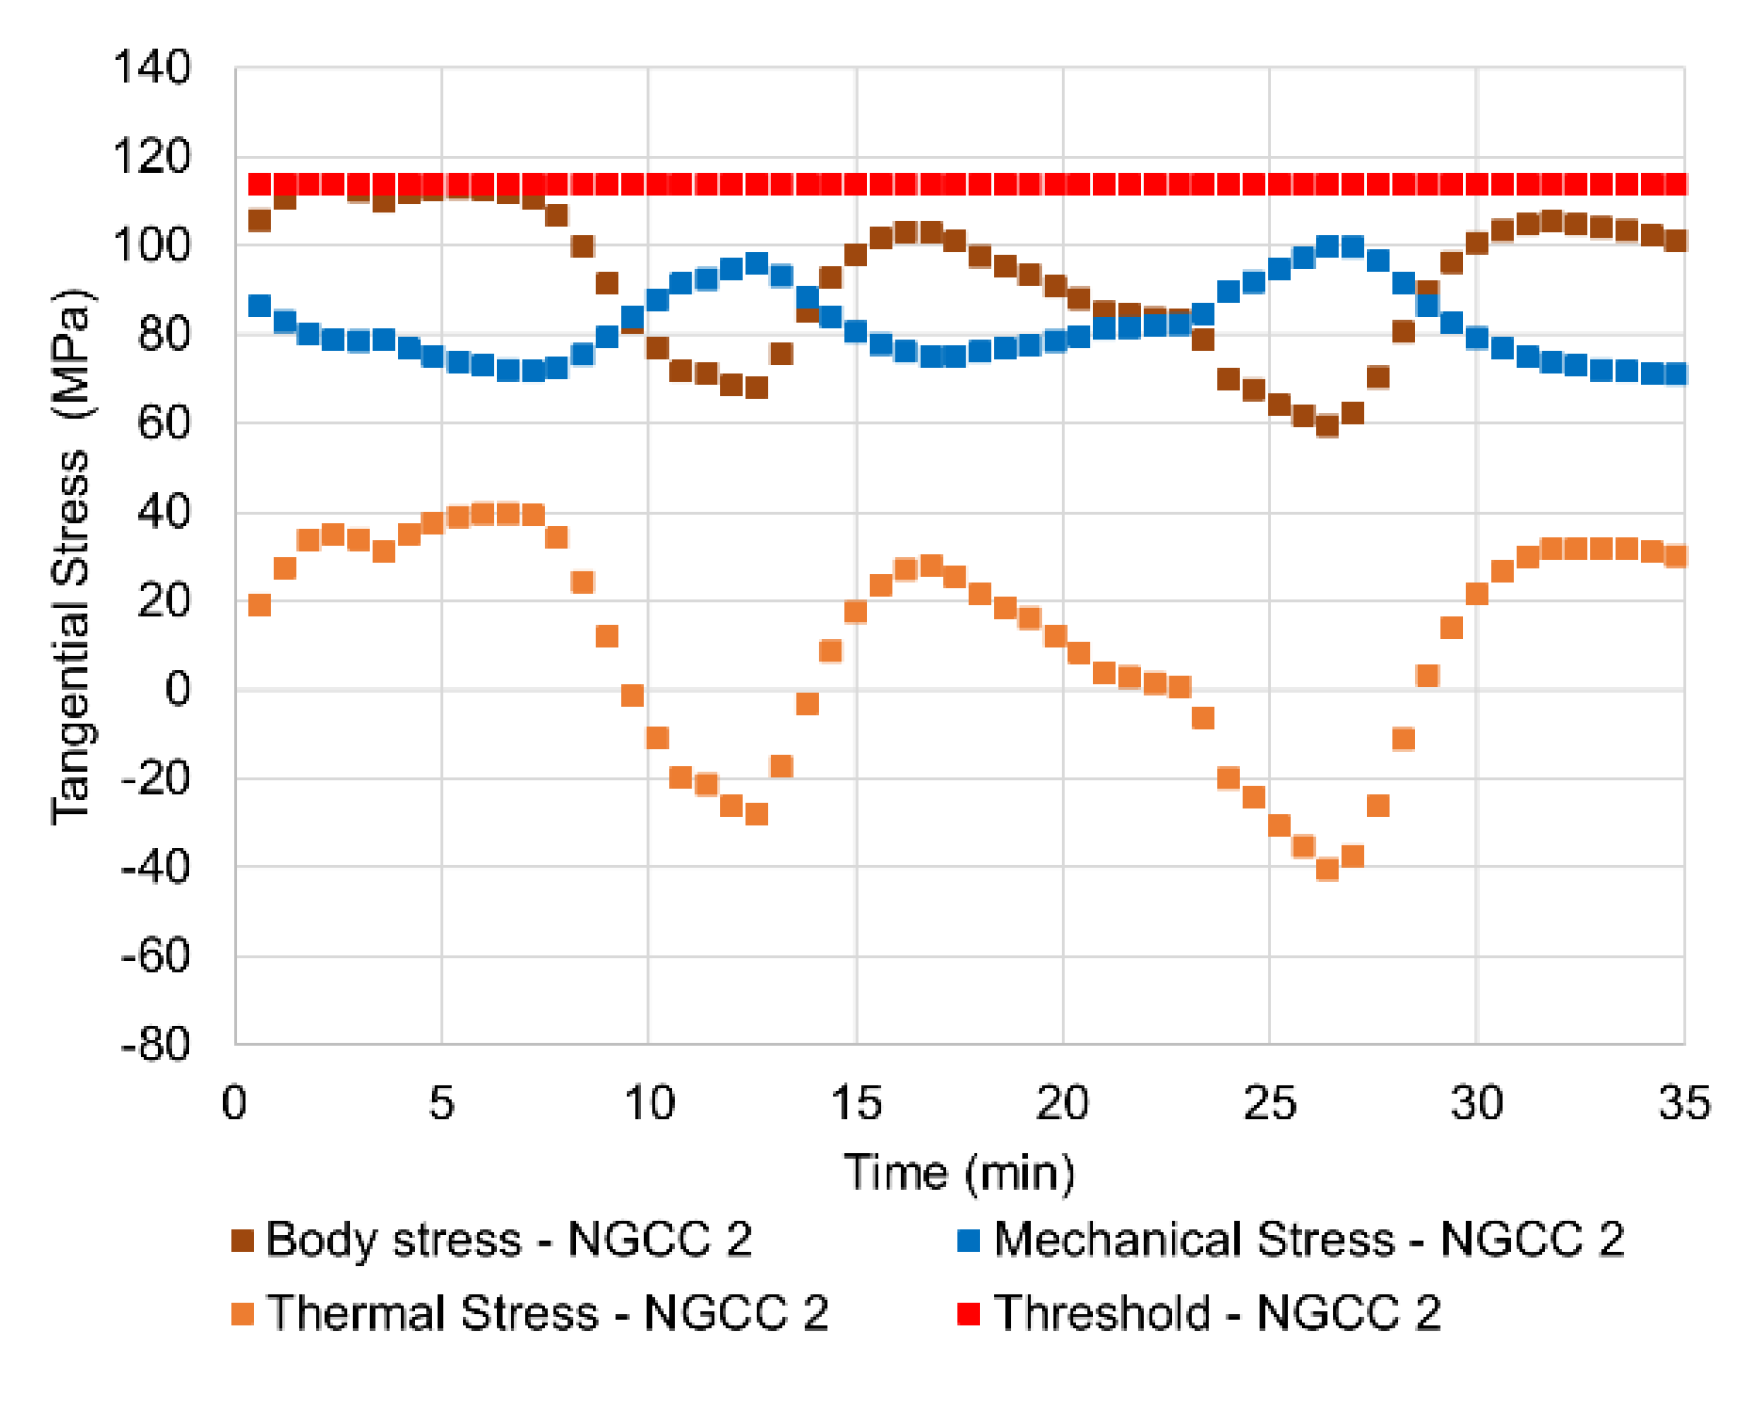
Figure 20 shows that the drum body stress constraint was active at times for NGCC 2, while for the other NGCC, the stress value was close but below the threshold. In addition, as the threshold is dependent on drum thickness, the thresholds for NGCC and NGCC 2 are slightly different.
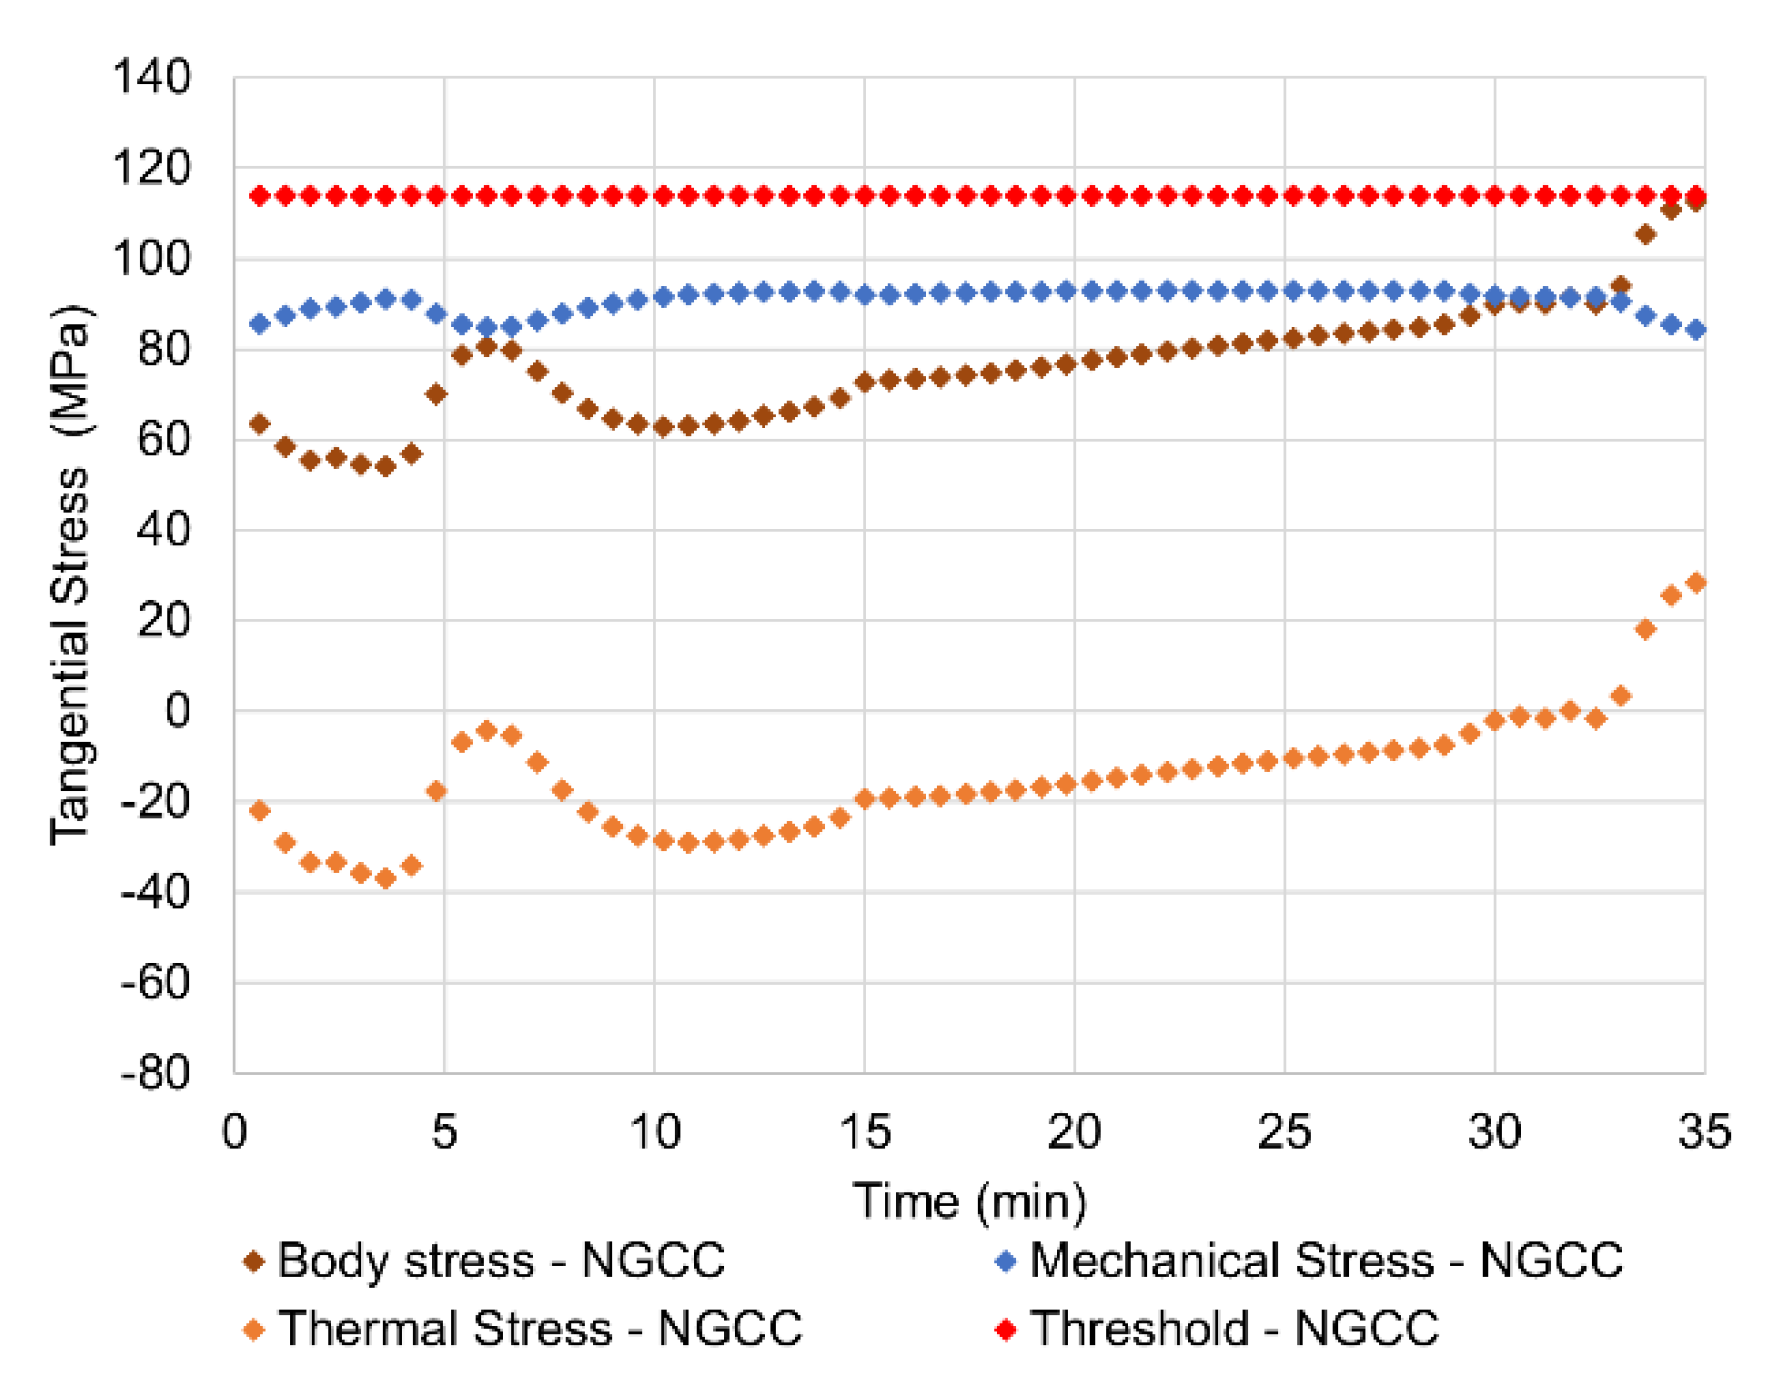
Further analysis is performed considering the individual components of the body stress depicted in
Figure 21 and
Figure 22. For the NGCC, the mechanical stress, which is tensile in nature, was mostly at its design point, with the thermal stress frequently being compressive and relieving the overall body stress. This behavior agrees with the NGCC dispatch, which is employed often as baseload with minimal cycling. For the NGCC 2, the mechanical stress was often lower than its design point, which allowed a larger margin for thermal stress to vary between tensile and compressive stresses. This behavior agrees with the NGCC 2 dispatch, which is employed often as load-following and with more frequent cycling.

 ,
, 


