
Fractal Dimension as Quantifier of EEG Activity in Driving Simulation

 ,
,
Abstract
:1. Introduction
2. Materials and Methods
2.1. Methods
2.2. Data Collection and Analysis
3. Results
4. Discussion
Author Contributions
Funding
Institutional Review Board Statement
Informed Consent Statement
Data Availability Statement
Acknowledgments
Conflicts of Interest
References
- Micheloyannis, S.; Vourkas, M.; Bizas, M.; Simos, P.; Stam, C.J. Changes in linear and nonlinear EEG measures as a function of task complexity. Brain Topogr. 2003, 15, 239–247. [Google Scholar] [CrossRef] [PubMed]
- Namazi, H.; Kulish, V.V. Fractional diffusion based modelling and prediction of human brain response to external stimuli. Comput. Math. Methods Med. 2015, 2015, 148534. [Google Scholar] [CrossRef] [PubMed] [Green Version]
- Blanco, S.; García, H.; Quiroga, R.Q.; Romanelli, L.; Rosso, O.A. Stationarity of the EEG series. IEEE Eng. Med. Biol. 1995, 14, 395–399. [Google Scholar] [CrossRef]
- He, B.; Astolfi, L.; Valdés-Sosa, P.A.; Marinazzo, D.; Palva, S.O.; Bénar, C.G.; Michel, C.M.; Koenig, T. Electrophysiological brain connectivity: Theory and implementation. IEEE Trans. Biomed. Eng. 2019. [Google Scholar] [CrossRef] [PubMed] [Green Version]
- Rioul, O.; Vetterli, M. Wavelets and Signal Processing. IEEE Signal Process. Mag. 2001, 8, 14–38. [Google Scholar] [CrossRef] [Green Version]
- Theiler, J.; Rapp, P. Re-examination of the evidence for low-dimensional, nonlinear structure in the human electroencephalogram. Electroenceph. Clin. Neurophysiol. 1996, 98, 213–222. [Google Scholar] [CrossRef]
- Mandelbrot, B.B.; Pignoni, R. The Fractal Geometry of Nature; WH Freeman: Ney York, NY, USA, 1983; Volume 173. [Google Scholar]
- Paramanathan, P.; Uthayakumar, R. Application of fractal theory in analysis of human electroencephalographic signals. Comput. Biol. Med. 2008, 38, 372–378. [Google Scholar] [CrossRef] [PubMed]
- Phothisonothai, M.; Nakagama, M. EEG signal classification method based on fractal features and neural network. In Proceedings of the Engineering in Medicine and Biology Society, EMBS 2008, 30th Annual International Conference of the IEEE, Vancouver, BC, Canada, 20–24 August 2008; pp. 3880–3883. [Google Scholar]
- Namazi, H.; Daneshi, A.; Azarnoush, H.; Jafari, S.; Towhidkhah, F. Fractal based analysis of the influence of auditory stimuli on eye movements. Fractals 2018, 26, 1850040. [Google Scholar] [CrossRef]
- Zappasodi, F.; Olejarczyk, E.; Marzetti, L.; Assenza, G.; Pizzella, V.; Tecchio, F. Fractal dimension of EEG activity senses neuronal impairment in acute stroke. PLoS ONE 2014, 9, e100199. [Google Scholar] [CrossRef] [Green Version]
- Finotello, F.; Scarpa, F.; Zanon, M. EEG signal features extraction based on fractal dimension. In Proceedings of the 37th Annual International Conference of the IEEE Engineering in Medicine and Biology Society (EMBC), Milano, Italy, 25–29 August 2015. [Google Scholar]
- Ruiz-Padial, E.; Ibáñez-Molina, A.J. Fractal dimension of EEG signals and heart dynamics in discrete emotional states. Biol. Psychol. 2018, 137, 42–48. [Google Scholar] [CrossRef] [PubMed]
- Navascués, M.A.; Sebastián, M.V. Fitting curves by fractal interpolation: An application to the quantification of cognitive brain processes. In Thinking in Patterns: Fractals and Related Phenomena in Nature; Novak, M.M., Ed.; World Scientific Publishers: Singapore, 2004; pp. 143–154. [Google Scholar]
- Sebastián, M.V.; Navascués, M.A. A relation between fractal dimension and Fourier transform. Electroencephalographic study using spectral and fractal parameters. Int. J. Comput. Math. 2008, 85, 657–665. [Google Scholar] [CrossRef]
- Navascués, M.A.; Sebastián, M.V.; Valdizán, J.R. Fractal and smooth complexities in electroencephalographic processing. J. Appl. Comput. Math. 2015, 4, 1–6. [Google Scholar]
- Campbell, K.; Bell, I.; Bastien, C. Evoked potential measures of information processing during natural sleep. In Sleep, Arousal and Performance; Broughton, R.J., Ogilvie, R.D., Eds.; Birkhäuser: Boston, MA, USA, 1992; pp. 88–116. [Google Scholar]
- Navascués, M.A.; Chand, A.K.B.; Viswanathan, P.; Sebastián, M.V. Fractal interpolation functions: A short survey. Spec. Issue Fractal Theory Appl. Appl. Math. 2014, 5, 1834–1841. [Google Scholar] [CrossRef] [Green Version]
- Navascués, M.A.; Sebastián, M.V. Construction of affine fractal functions close to classical interpolants. J. Comp. Anal. Appl. 2007, 9, 271–285. [Google Scholar]
- Hurst, H.E.; Black, R.P.; Simaika, Y.M. Long-Term Storage: An Experimental Study; Constable: London, UK, 1965. [Google Scholar]
- Dombrowe, I.; Hilgetag, C.C. Occipitoparietal alpha-band responses to the graded allocation of top-down spatial attention. J. Neurophysiol. 2014, 112, 1307–1316. [Google Scholar] [CrossRef] [PubMed]
- Dussault, C.; Jouanin, J.C.; Philippe, M.; Guezennec, C.Y. EEG and ECG changes during simulator operation reflect mental workload and vigilance. Aviat. Space Environ. Med. 2005, 76, 344–351. [Google Scholar] [PubMed]
- Borghini, G.; Vecchiato, G.; Toppi, J.; Astolfi, L.; Maglione, A.; Isabella, R.; Caltagirone, C.; Kong, W.; Wei, D.; Zhou, Z.; et al. Assessment of mental fatigue during car driving by using high resolution EEG activity and neurophysiologic indices. In Proceedings of the 2012 Annual International Conference of the IEEE Engineering in Medicine and Biology Society, San Diego, CA, USA, 28 August–1 September 2012; pp. 6442–6445. [Google Scholar]
- Yang, H.; Wang, Y.; Wang, C.J.; Tai, H.M. Correlation dimensions of EEG changes during mental tasks. In Proceedings of the 26th Annual International Conference of the IEEE EMBS, San Francisco, CA, USA, 1–5 September 2004; pp. 616–619. [Google Scholar]
- Idiázabal-Alecha, M.A.; Sebastián-Guerrero, M.V.; Navascués-Sanagustín, M.A.; Arcos-Sánchez, C.; Arana-Aritméndiz, M.V.; Ruiz-López, C.; Iso-Pérez, J.M. A cortical study of the attention in military simulation test. Rev. Neurol. 2018, 66, 331–339. [Google Scholar] [PubMed]
- Sebastián, M.V.; Arana, M.V.; Sánchez, C.; Navascués, M.A.; Idiázabal, M.A.; Ruiz, C.; Iso, J.M. Attention processes in military simulation tasks: Gender-associated differences. Rev. Cient. Soc. Esp. Enferm. Neurol. 2018, 48, 2–8. [Google Scholar] [CrossRef]


| Channel | Correlation Coef. |
|---|---|
| F3 | 0.988259 |
| F4 | 0.990549 |
| O1 | 0.990549 |
| O2 | 0.987347 |
| T3 | 0.989813 |
| T4 | 0.980922 |
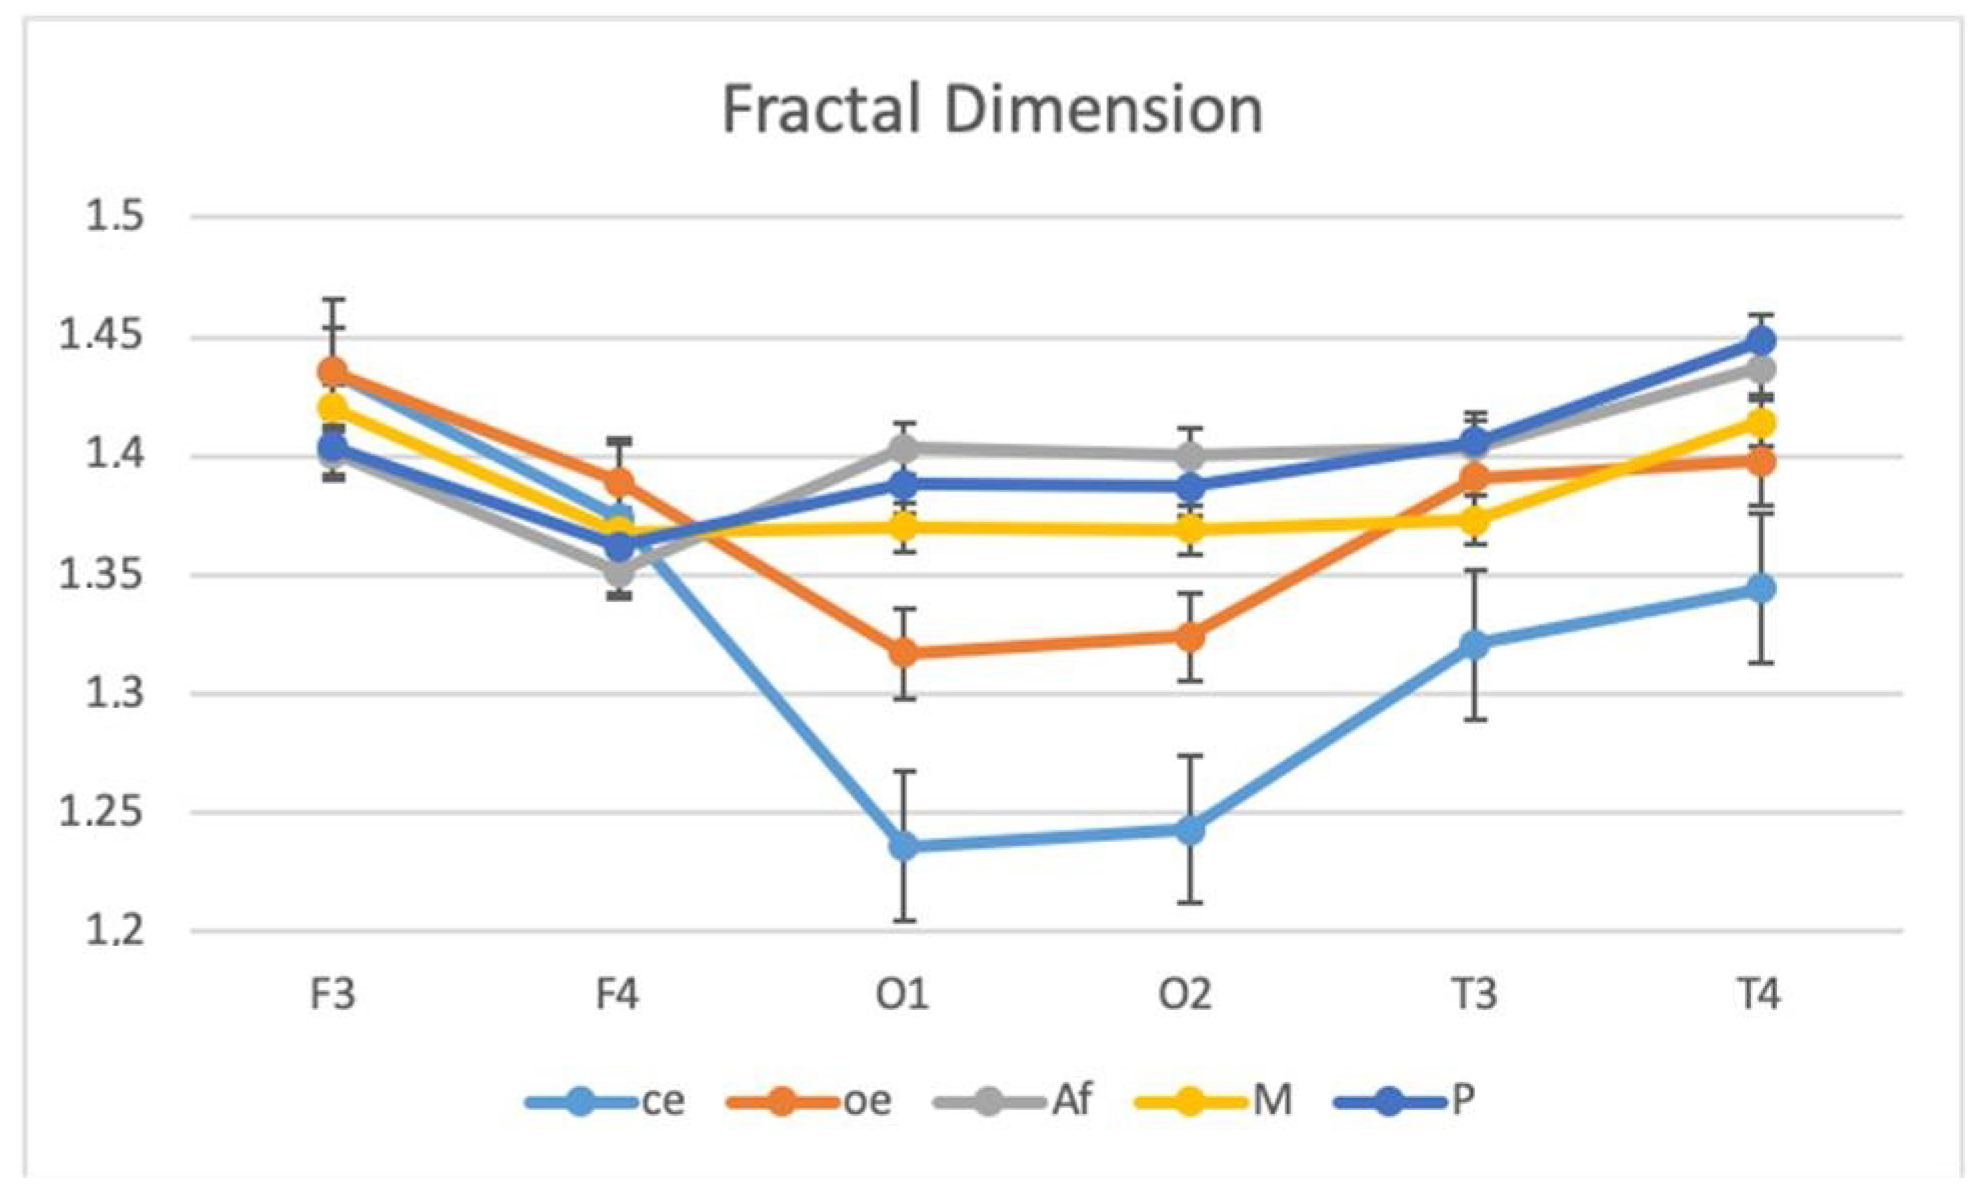
| FRACTAL DIMENSION | ||||||
|---|---|---|---|---|---|---|
| CHANNEL | ce | oe | Af | M | P | OE2 |
| F3 | 1.435 ± 0.092 | 1.435 ± 0.079 | 1.401 ± 0.069 | 1.420 ± 0.073 | 1.404 ± 0.058 | 1.412 ± 0.080 |
| F4 | 1.374 ± 0.070 | 1.389 ± 0.060 | 1.351 ± 0.066 | 1.368 ± 0.075 | 1.362 ± 0.063 | 1.383 ± 0.081 |
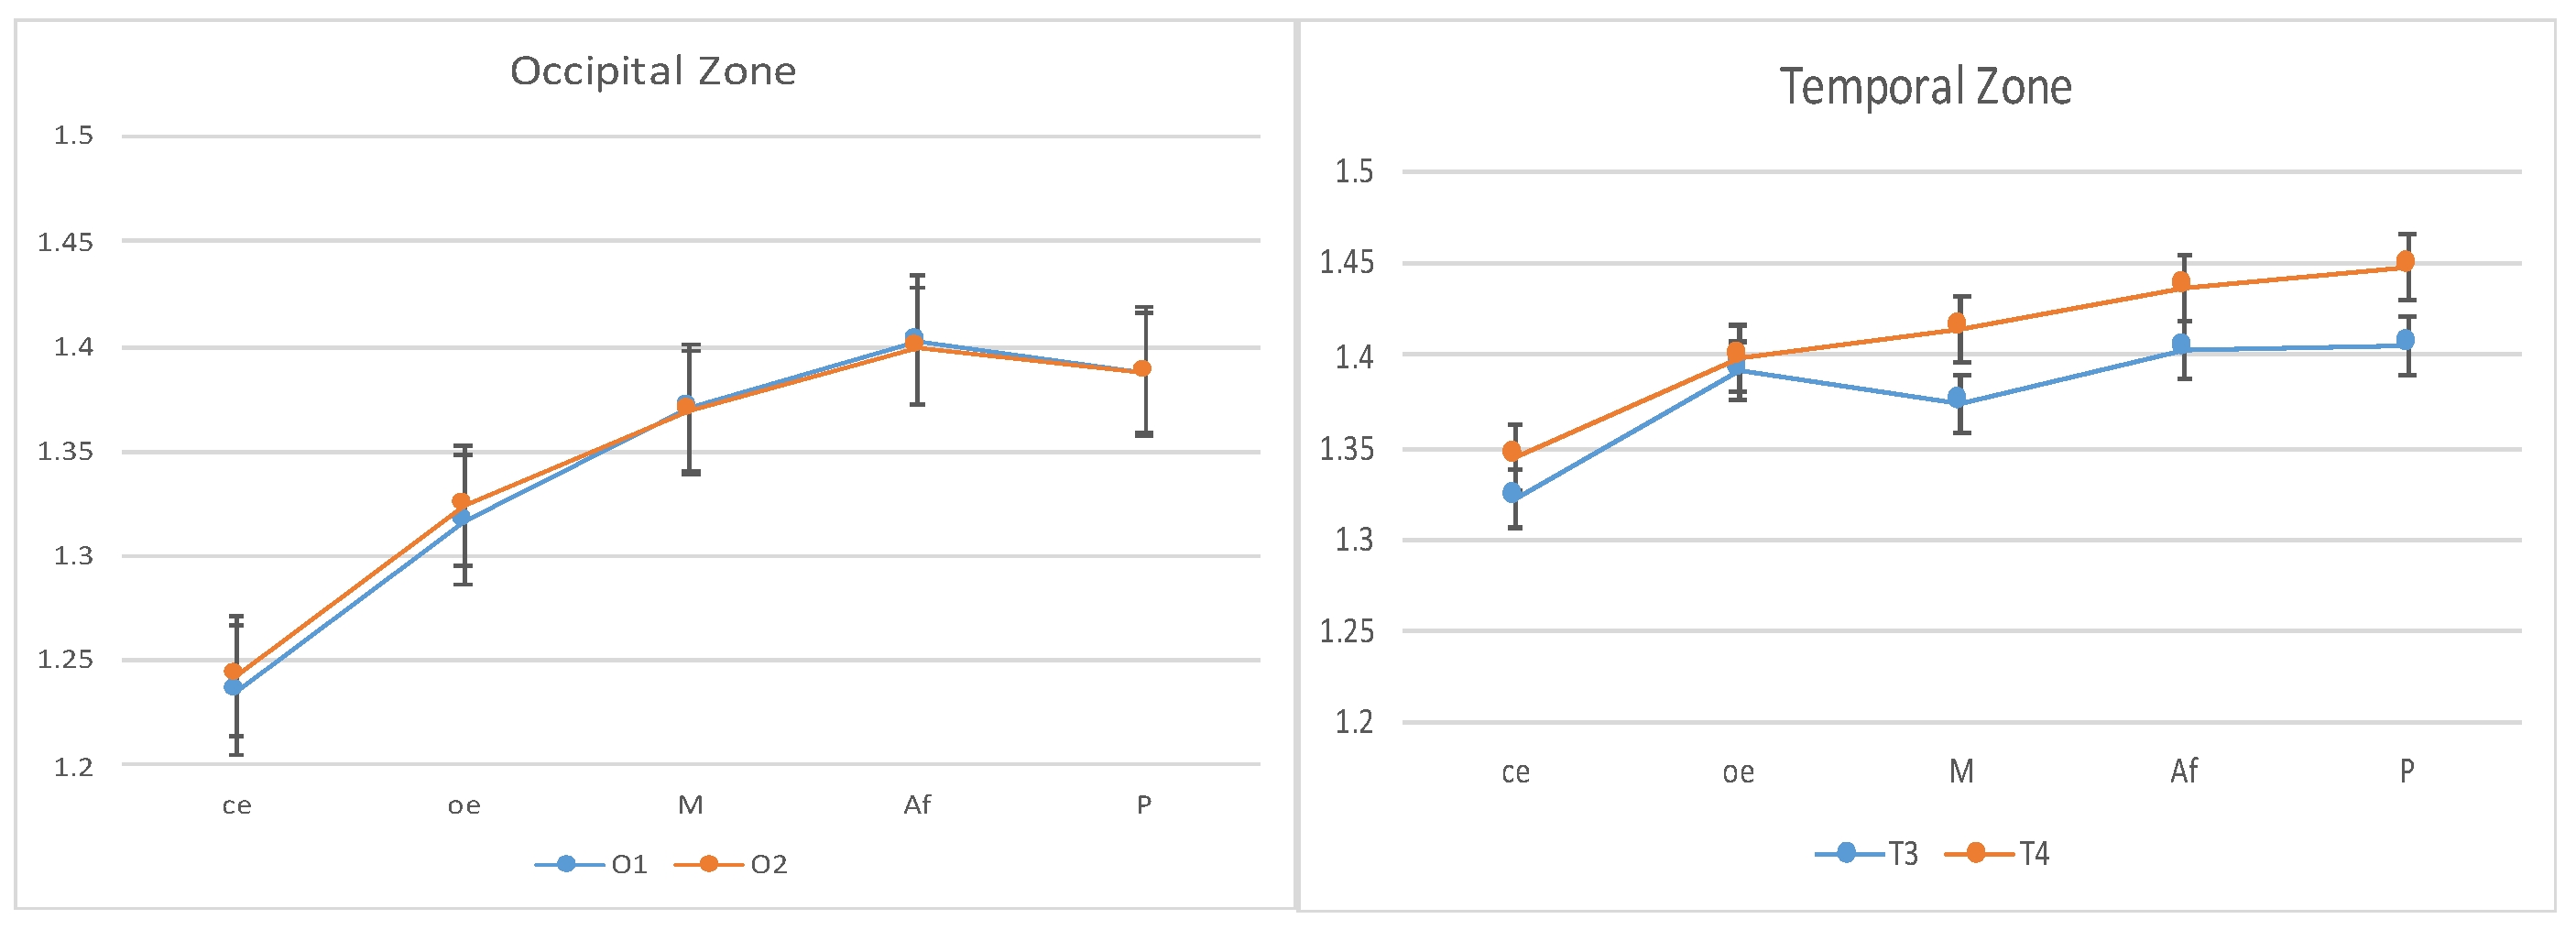
| O1 | 1.236 ± 0.059 | 1.317 ± 0.051 | 1.403 ± 0.063 | 1.370 ± 0.064 | 1.388 ± 0.060 | 1.315 ± 0.049 |
| O2 | 1.243 ± 0.067 | 1.324 ± 0.057 | 1.400 ± 0.071 | 1.369 ± 0.069 | 1.387 ± 0.069 | 1.322 ± 0.053 |
| T3 | 1.321 ± 0.085 | 1.391 ± 0.084 | 1.404 ± 0.089 | 1.373 ± 0.082 | 1.406 ± 0.069 | 1.382 ± 0.084 |
| T4 | 1.344 ± 0.079 | 1.398 ± 0.086 | 1.437 ± 0.100 | 1.414 ± 0.088 | 1.448 ± 0.083 | 1.391 ± 0.074 |
| Cortical Mean | 1.326 ± 0.076 | 1.376 ± 0.071 | 1.399 ± 0.078 | 1.386 ± 0.076 | 1.399 ± 0.068 | 1.368 ± 0.071 |
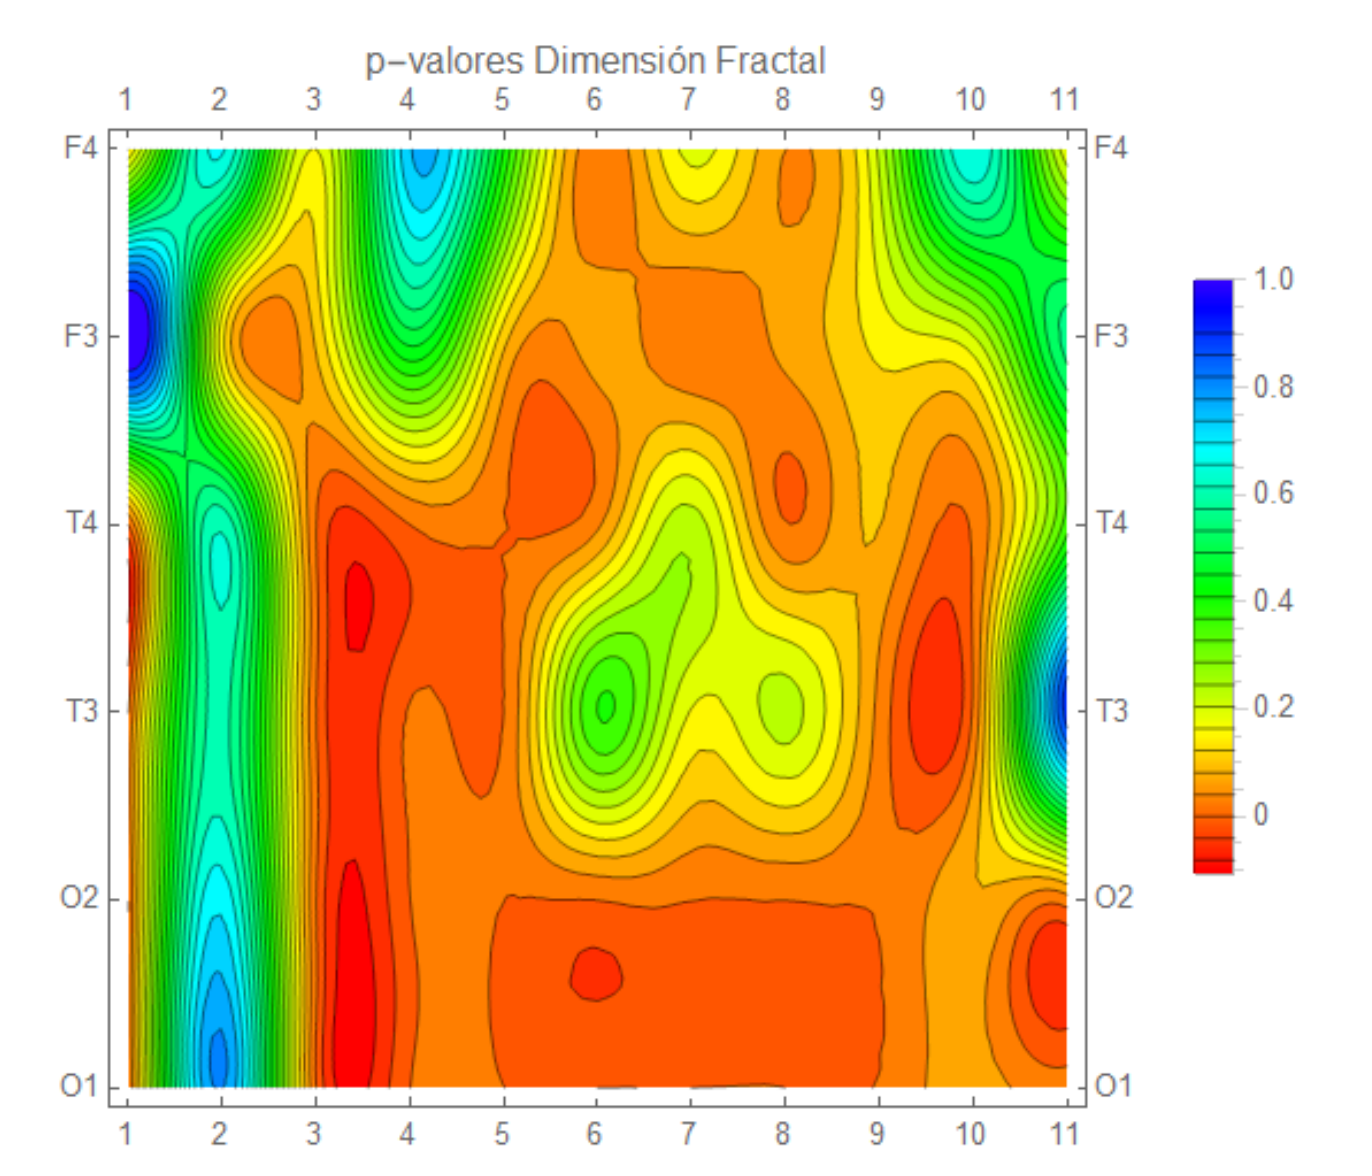
| FRACTAL DIMENSION (p-Values) | ||||||||||
|---|---|---|---|---|---|---|---|---|---|---|
| oe-ce | A-ce | M-ce | P-ce | A-oe | M-oe | P-oe | A-M | P-M | P-A | |
| F3 | 0.983 | 0.091 | 0.473 | 0.099 | 0.060 | 0.001 | 0.053 | 0.139 | 0.201 | 0.551 |
| F4 | 0.122 | 0.164 | 0.734 | 0.407 | 0.009 | 0.178 | 0.040 | 0.216 | 0.656 | 0.174 |
| O1 | 0.000 | 0.000 | 0.000 | 0.000 | 0.000 | 0.000 | 0.000 | 0.002 | 0.062 | 0.023 |
| O2 | 0.000 | 0.000 | 0.000 | 0.000 | 0.000 | 0.000 | 0.000 | 0.004 | 0.079 | 0.022 |
| T3 | 0.000 | 0.000 | 0.004 | 0.000 | 0.370 | 0.160 | 0.221 | 0.028 | 0.006 | 0.885 |
| T4 | 0.000 | 0.000 | 0.000 | 0.000 | 0.033 | 0.226 | 0.002 | 0.083 | 0.006 | 0.352 |
Publisher’s Note: MDPI stays neutral with regard to jurisdictional claims in published maps and institutional affiliations. |
© 2021 by the authors. Licensee MDPI, Basel, Switzerland. This article is an open access article distributed under the terms and conditions of the Creative Commons Attribution (CC BY) license (https://creativecommons.org/licenses/by/4.0/).
Share and Cite
Sebastián, M.V.; Navascués, M.A.; Otal, A.; Ruiz, C.; Idiazábal, M.Á.; Stasi, L.L.D.; Díaz-Piedra, C. Fractal Dimension as Quantifier of EEG Activity in Driving Simulation. Mathematics 2021, 9, 1311. https://0-doi-org.brum.beds.ac.uk/10.3390/math9111311
Sebastián MV, Navascués MA, Otal A, Ruiz C, Idiazábal MÁ, Stasi LLD, Díaz-Piedra C. Fractal Dimension as Quantifier of EEG Activity in Driving Simulation. Mathematics. 2021; 9(11):1311. https://0-doi-org.brum.beds.ac.uk/10.3390/math9111311
Chicago/Turabian StyleSebastián, Mª Victoria, Mª Antonia Navascués, Antonio Otal, Carlos Ruiz, Mª Ángeles Idiazábal, Leandro L. Di Stasi, and Carolina Díaz-Piedra. 2021. "Fractal Dimension as Quantifier of EEG Activity in Driving Simulation" Mathematics 9, no. 11: 1311. https://0-doi-org.brum.beds.ac.uk/10.3390/math9111311