
Performance of Gradient-Based Optimizer on Charging Station Placement Problem
by
 , , , and
Essam H. Houssein
1,* ,
,
Sanchari Deb
2, 
Diego Oliva
3,4,* ,
,
Hegazy Rezk
5,
Hesham Alhumade
6,7 and
Mokhtar Said
8 1
Faculty of Computers and Information, Minia University, Minia 61519, Egypt
2
School of Engineering, University of Warwick, Coventry CV4 7AL, UK
3
División de Electrónica y Computación, Universidad de Guadalajara, CUCEI, Av. Revolución 1500, Guadalajara 44430, Mexico
4
School of Computer Science & Robotics, Tomsk Polytechnic University, 634050 Tomsk, Russia
5
College of Engineering at Wadi Addawaser, Prince Sattam Bin Abdulaziz University, Al-Kharj 11911, Saudi Arabia
6
Chemical and Materials Engineering Department, Faculty of Engineering, King Abdulaziz University, Jeddah 21589, Saudi Arabia
7
Center of Excellence in Desalination Technology, King Abdulaziz University, Jeddah 21589, Saudi Arabia
8
Electrical Engineering Department, Faculty of Engineering, Fayoum University, Fayoum 43518, Egypt
*
Authors to whom correspondence should be addressed.
Mathematics 2021, 9(21), 2821; https://0-doi-org.brum.beds.ac.uk/10.3390/math9212821
Submission received: 27 September 2021
/
Revised: 29 October 2021
/
Accepted: 2 November 2021
/
Published: 6 November 2021
(This article belongs to the Special Issue Bioinspired Intelligent Algorithms for Optimization, Modeling and Control: Theory and Applications)
Abstract
:The electrification of transportation is necessary due to the expanded fuel cost and change in climate. The management of charging stations and their easy accessibility are the main concerns for receipting and accepting Electric Vehicles (EVs). The distribution network reliability, voltage stability and power loss are the main factors in designing the optimum placement and management strategy of a charging station. The planning of a charging stations is a complicated problem involving roads and power grids. The Gradient-based optimizer (GBO) used for solving the charger placement problem is tested in this work. A good balance between exploitation and exploration is achieved by the GBO. Furthermore, the likelihood of becoming stuck in premature convergence and local optima is rare in a GBO. Simulation results establish the efficacy and robustness of the GBO in solving the charger placement problem as compared to other metaheuristics such as a genetic algorithm, differential evaluation and practical swarm optimizer.
1. Introduction
The progress of energy is a main objective in human life [1,2,3,4,5]. Electrical vehicles (EV) are spread out in most countries due to the emissions of gases from internal combustion vehicles [6]. The management strategy and design of the placement of a charging station (CS) play an imperative part in distribution network reliability, power loss and voltage stability [7], the coordination between the distribution network in the road network and the layout of EV charging stations. Most researchers are interested in optimizing the layout of EV CSs. This problem can be solved with several optimization algorithms [8,9,10,11].
In [12], the geographic information system and greedy algorithm are used for locating fast-charging stations. In [13], an overview for the management of a charging station EV placement and its control aspects is discussed. In [14], a study integrating a power grid with EV charging stations is provided. In addition, an efficient solution is proposed for Public Fast-Charging Stations [15]. In [16], a genetic algorithm is applied in solving the placement of EV charging stations with the objective function of minimizing the cost. In [17], a comparison between a practical swarm and adaptive practical swarm optimization is discussed with the objective function of running and construction costs. In [18], an extraction of the location and number of CSs is performed using a hybridization of a genetic algorithm with k-means for clustering. In [19], a genetic algorithm is applied for solving the placement of EV charging stations with the objective function of minimizing the missed trip.
Various approaches have been applied to design the optimum placement of EV charging stations [20] and Electric vehicle charging station [21,22,23]. Charging stations can be designed optimally depending on the EV usage in an enhanced system performance and supplying a peak load. For that reason, the reduction in losses, better economics and the minimizing of voltage deviation are achieved using EVs [24]. The problem of charging stations placement was also solved using practical swarm optimization algorithms [25]. In this sense, the incorporation of CO in the optimum design of an EV charging station was discussed in [26]. The optimization of the layout for charging stations based on maximizing the reliability of a network, minimizing voltage deviation and power losses is applied using a K-means clustering algorithm [27]. The determination of optimum sizing and siting of charging stations and photovoltaic can avoid their negative effects [28]. Solar energy has also been used in charging stations to reduce the negative effect of EVs [29]. The distribution network voltage deviation, power losses and charging service have been used as a multi-objective function in the optimization placement of charging stations. This problem has been tested on a road network of 25 nodes and an IEEE 33 bus network by using a cross-entropy method and data envelopment analysis [30]. genetic algorithm was applied in solving the CS placement issue with the objective function dependent on the operation grid cost, the traffic circulation and the cost of station development [31].
The optimal design of a charging station has also been performed by using the TLBO and CSO algorithms with the objective function of minimizing the cost and the behaviour improvement of the distribution network was taken into consideration. The proposed method was tested on a case study of Guwahati City, India, with information from [32]. A modified primal dual interior point algorithm was applied in the estimation of an optimal charging station design based on the cost being a single-objective function. The proposed technique was tested on the IEEE 123 bus system [33]. A hierarchical genetic algorithm was applied in the estimation of an optimal charging station design based on cost as an objective function and the constraints of the maximum capacity ofa charging station and limits of power loss. Here, the proposed technique was tested on the IEEE 123 bus system [34]. An ant colony optimization was applied in the determination of the optimal charging station placement based on an objective function that maximizes the ability of the charging service [35]. A differential evolution was applied in designing the charging station placement based on the objective function of minimizing the cost and constraints of limiting voltage, current and power consumption [36]. Moreover, the information matrix from the household trip origin and dynamic vehicle model is the objective function used to determine the proper allocation of charging stations [37]. The recharging decisions, interactions of travels and the adjustments spontaneous of drivers are taken into consideration in the design of the placement of charging stations on a road network [38]. The determination of the charging infrastructure location was performed based on a cluster analysis for the urban area of Rome [39]. Based on the data of an EV operation and real trajectory of the trajectory-interception method, the facility designing of an EV taxi charging station was discussed [40].
A hybrid ant, lion and chicken swarm optimization algorithm (ALO CSO) was used for solving the single-objective charger placement problem with cost as the objective function [41]. It was observed that the proposed ALO-CSO performed better than the other metaheuristics. A multi-objective formulation of the charger placement problem is presented in [42] with cost, reliability, power loss as the objective function and the Teaching–Learning-Based Optimization (TLBO) was used for searching the optimal solution. A scheme for the placement of Level 1, Level 2 and Level 3 chargers in the active distribution network is presented in [43], with the installation cost and power losses as objective functions. Here, the PSO is implemented as a search strategy. A scheme for the charger allocation considering ride sharing was proposed in [44] considering the minimization of the vehicle idle time as the objective function. The optimization issue was handled by a surrogate-assisted optimization approach. In [45], a novel CSO-driven metaheuristic was proposed for the solving, planning and operation of charging stations. Meanwhile, in [46], a novel teaching–learning-based CSO is used for the charger placement problem. In [47], authors have proposed the implementation of the JAYA algorithm for solving the charger placement problem with cost as the objective function. In [48], a comprehensive framework for optimizing solar-powered charging stations is presented.
Recently, a Gradient-Based Optimizer (GBO) [49] was performed by Ahmadianfar et al. in a promising algorithm for solving the problem of CS placement in this work. The GBO is inspired by the gradient-based Newton method. In this paper, the performance of the GBO is evaluated to solve the problem of CS placement for a superimposed network of the 33 distribution bus and 25 road node. In addition, the effectiveness of the GBO is compared with other meta-heuristic algorithms such as the Genetic algorithm (GA) [50], Differential evolution (DE) [51] and Particle swarm optimization (PSO) [52].
The contributions of this work can be assembled in the following items:
- The use of the novel GBO to solve the charger placement problem.
- The charger placement problem is a combinatorial optimization issue that decides on three variables: the number of slow-charging stations, number of fast-charging stations and their places among a set of predefined nodes.
- A comparison of the GBO with other Metaheuristics such as the genetic algorithm, differential evaluation, practical swarm optimizer is discussed regarding the charger placement problem.
- GBO performance is studied based on a statistical analysis for 50 independent runs.
2. Charger Placement Problem
The placement of a CS is a multi-dimensional issue where the output is the number and location of charging stations. Symbolically, the decision parameters were b, and , b ∈ P, where b is the charging station placement bus, is the slow CS number at bus b, is the fast CS number at bus b and P is the set of CS nodes. Thus, the decision variables were position and the number of slow as well as fast-charging stations to be placed was determined.
The three variables were integers, and the initial solution generated was also an integer. Each solution was tested for constraint satisfaction. If constraints were not satisfied, the solutions were discarded, and a new solution was generated. The process continued until a feasible solution was generated.
The fitness function was the minimization of the overall cost of charging stations. Furthermore, the summation of the direct and indirect cost was the overall cost. The fitness function was defined mathematically as:
The operating and installation costs were the main direct cost () of the charging station, which was elaborated as:
The indirect cost () was the sum of the travel time and cost of penalty paid. The mathematical form for the indirect cost discussed was as follows:
In this work, the forward–backward sweep [53] was the method used in the computation of all bus voltages in the network.
A penalty was assigned for violating the safe limits of AENS as shown in Equation (12). AENS is a reliability index of a power distribution network as shown in Equation (13). Further, the cost of travelling the distance from the point of charging demand to the charger location was also included as an objective function as shown in Equation (14).
The equality constraints could be expressed by the balance of the power flow equation, and the inequality constraints of the fitness function were formulated as follows:
3. Gradient-Based Optimizer
The GBO algorithm was created by Ahmadianfar et al., and it is an algorithm that mimics population-based and gradient-based methods [49]. Newton’s method was used in the GBO to investigate the search space for a collection of search metrics. The GBO’s main steps are clarified in the following subsections.
3.1. The Initialization Process
The GBO balanced and switched between exploration and exploitation using the control parameters and probability rate. The population and iteration counts were proportional to the complexity of the problem. In the GBO, X represents each member of the population and was used to describe the vector of N sub-vectors in D-dimensional space using Equation (19) as follows:
In the D-dimensional search space, the initial vectors for the GBO were typically generated by using a random distribution. The initialization in the GBO was then characterized as follows:
where , and denote the bounds of the decision parameters X, and denotes a random number between the range 0 and 1.
3.2. Gradient Search Rule (GSR)
The GSR is a process used to ensure a balance between exploration and exploitation. To achieve near-global optimum points, the GBO employed the following significant factor :
where and are constant values of 0.2 and 1.2, respectively, and m denotes the current iteration and M denotes the total iterations number. Parameter in particular was responsible for balancing the exploration and exploitation using the sine function . The parameter’s value changed over time; it began with a large value during the initial optimization iterations to increase population diversity, and then decreased in value during the subsequent iterations to accelerate population convergence. The parameter value was increased over a defined number of iterations within the range [550, 750], in order to increase the diversity of solutions and to converge around the best obtained solution while also exploring additional solutions. This allowed the algorithm to avoid local sub-regions. As a result, the GSR could be calculated as follows:
where, randn is the normally distributed random number and is a small number.
The concept provided the GBO algorithm with random behaviour during iterations, enhancing exploration behaviour and allowing for escape from local optima. In Equation (24), the term refers to the difference between the optimal solution and a randomly chosen solution . Due to the following Equation (27), the parameter was changed during iterations. Additionally, a random number () was included to aid in exploration:
where is a vector containing N random values between 0 and 1. Additionally, four randomly selected integers from [1, N] were , , and , such that . represents a scaling factor defined by and . To accomplish convergence, directional movement was used to traverse the solution field .
To avoid the local search convergence of the GBO, the DM term selected the best vector from a set of suggested vectors and moved the current vector in the direction of the best vector as follows:
where rand is a uniformly distributed number between 0 and 1, a function of two parameters, and is a random parameter used to fine tune the phase size of each vector agent. Additionally, the parameter took into account important parameters in the GBO exploration process. This was the formula for calculating the parameter:
Eventually, using the terms GSR and DM, we modified Equations (30) and (31) to account for the current vector location .
where is the modified vector as a result of the modification of . According to Equations (23) and (28), the transformation of was as follows:
where are equal to and , vector is equal to the average of two vectors: the current solution and the vector, which were calculated by the following formula:
Although represents the vector of current solution, represents a vector of random solution of dimension n, and denote the worst and best solutions, respectively, and is defined by Equation (25).
Using Equation (31), we obtained by substituting the best solution vector for the current solution vector :
To be more precise, the GBO aimed to improve both the exploitation and exploration phases by utilising Equation (31) to enhance global search capabilities during the exploration phase and Equation (33) to enhance local search capabilities during the exploitation phase. Finally, the following procedure was used to generate the new solution for the next iteration:
where , and are randomly generated numbers in the range , and is defined as:
3.3. The Local Escaping Operator (LEO)
The LEO was used to boost the performance of an optimization technique by assisting in the solution of difficult engineering problems. The LEO operator assisted the algorithm in rapidly switching out of local optima points, which sped up the algorithm’s convergence. To develop a new solution that was more efficient, the LEO operator focused on by several solutions ( was the best solution, were randomly selected from the population, and were randomly generated solutions). The current solution was updated effectively by using the following process:
The procedure from Equation (36) was applied only if the probability condition was true. was a probability value equal to 0.5, , and were uniform distribution random numbers , and were generated randomly as follows:
where is a random number between 0 and 1 and is any value within the range .
The preceding equations for and had the following explanation:
where is a binary parameter with a value of 0 or 1; for example, if was 0.5, the value of , otherwise .
was generated in the following manner:
generated a random solution using the following formula:
where is a randomly chosen solution from the population, while is a random number between 0 and 1. For additional information about the GBO, see [49]. The pseudo code of the GBO is described in [49]. The three variables were integers and the initial solution generated was also an integer. Each solution was tested for constraint satisfaction. If constraints were not satisfied, the solutions were discarded, and a new solution was generated. The process continued until a feasible solution was generated. Continuous values were mapped into discrete values based on probability. For each decision variable, the probability was calculated, and a random number was generated. If the random number was less than the probability value, the variable was rounded to the nearest integer value greater than the current value. If the random number was greater than or equal to the probability value, then the variable was rounded to the nearest integer value less than the current value. This preserved the structure of the GBO and moved the position of population to a discrete space.
The pseudo code of the GBO was described in the Methods [49] Algorithm 1.
| Algorithm 1 The Pseudo code of the Gradient-based Optimizer |
|
4. Experimental Results and Numerical Analysis
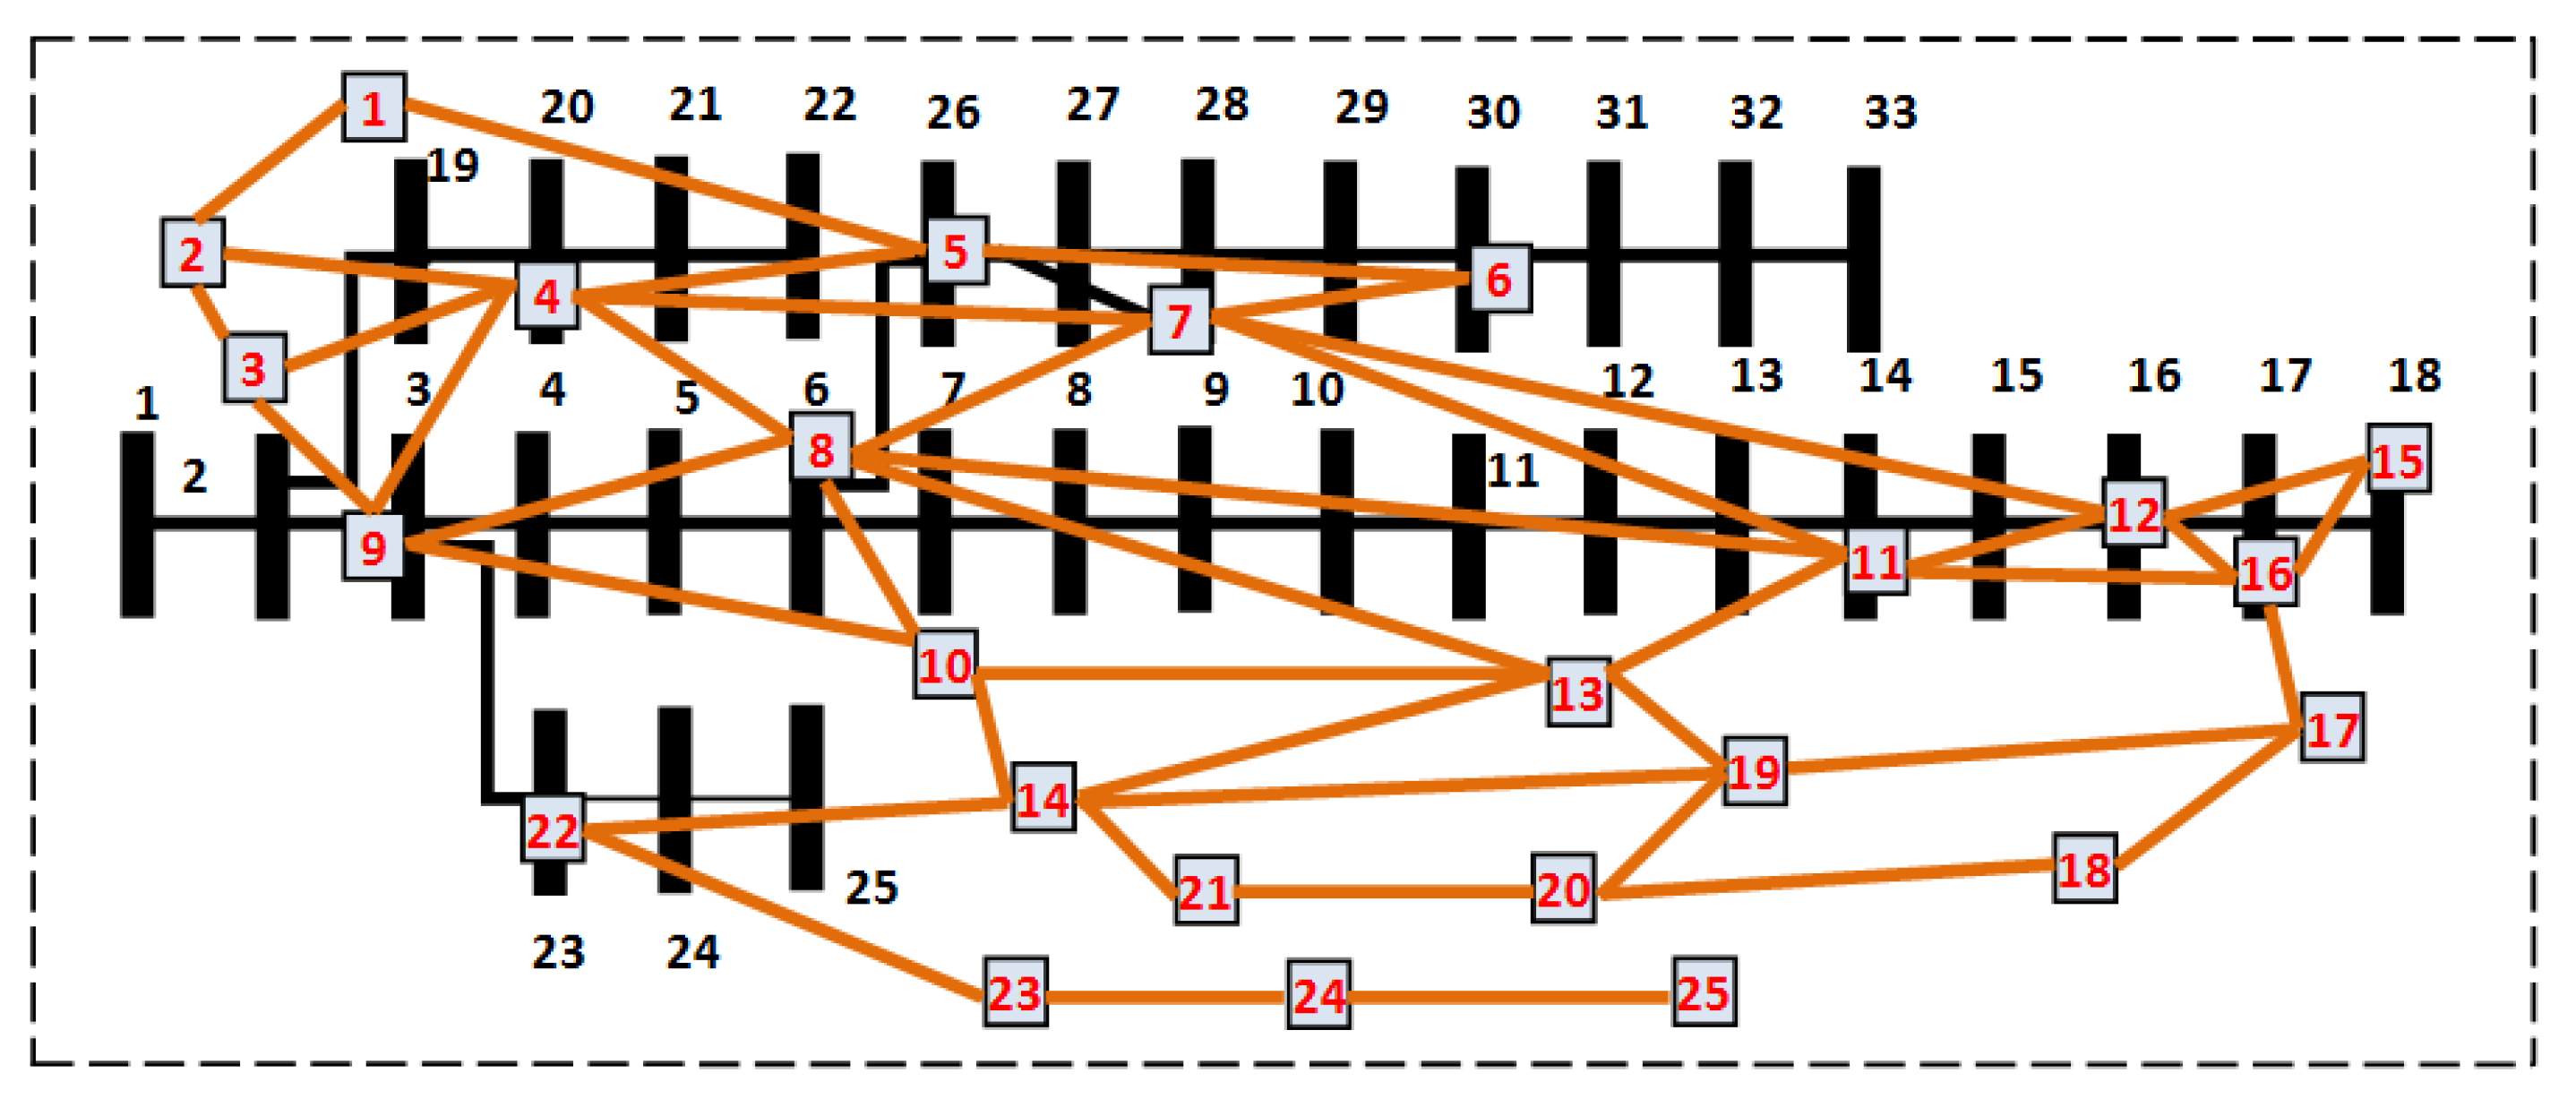
The charger placement problem was solved by the GBO for the superimposed network of 33 distribution bus and 25 road nodes as shown in Figure 1; the two routes were assumed for following the pass of EVs:
- Route 1-(1-2-3-4-5-6-7-8-9-10-13-11-12-15-16-17-18-20-21-14-22-23-24-25);
- Route 2-(1-2-3-4-5-6-7-8-9-10-13-11-12-15-16-17-19-20-21-14-22-23-24-25).
Figure 1.
Test network [7].
Figure 1.
Test network [7].

The performance of the GBO rivalled with several of the benchmark algorithms such as PSO, DE and GA, each with 50 independent runs. The settings of the parameters of the algorithms were as shown in Table 1. The general specific parameters of the algorithm were selected by fine tuning that was achieved by trial and error. It was observed that the algorithm performed best for the settings considered in this work. For other problems or other test networks, the settings may change. Metaheuristics have a set of general and specific parameters [54]. The best settings of the algorithm-specific parameters were obtained by trial and error for the considered test network. For networks of other configurations, algorithm specific parameters could also be set by the trial-and-error method. Moreover, our future work will consider developing an adaptive version of the GBO.
Table 2 reports the values of input parameters of the CS problem. Table 3 reports the optimal locations and numbers of chargers to be placed computed by the algorithms mentioned in Table 1. It was observed that the GBO, PSO and DE yielded the best fitness value of 1.4898 and performed better than the GA. Table 4 reports the values of operating distribution network parameters such as the voltage deviation, AENS and power losses after and before the placement of charging stations. It was noted that a voltage deviation of 0.0114 pu occurred post the placement of chargers at the locations mentioned in Table 3. The AENS value also changed from 1.9369 kWhr/yr to 2.5233 kWhr/yr post the placement of chargers at the locations mentioned in Table 3. Further, the power losses of the network also increased from 0.0021 pu to 0.0062 pu. Thus, the distribution network operating parameters degraded, but were still within safe limits.
Further, the statistical comparison ofthe GBO with the other benchmark algorithms listed in Table 1 was performed. The results of the statistical comparison of the GBO with other benchmark algorithms is presented in Table 4. It was noted that the performance of the GBO was competitive as compared to the other metaheuristics.
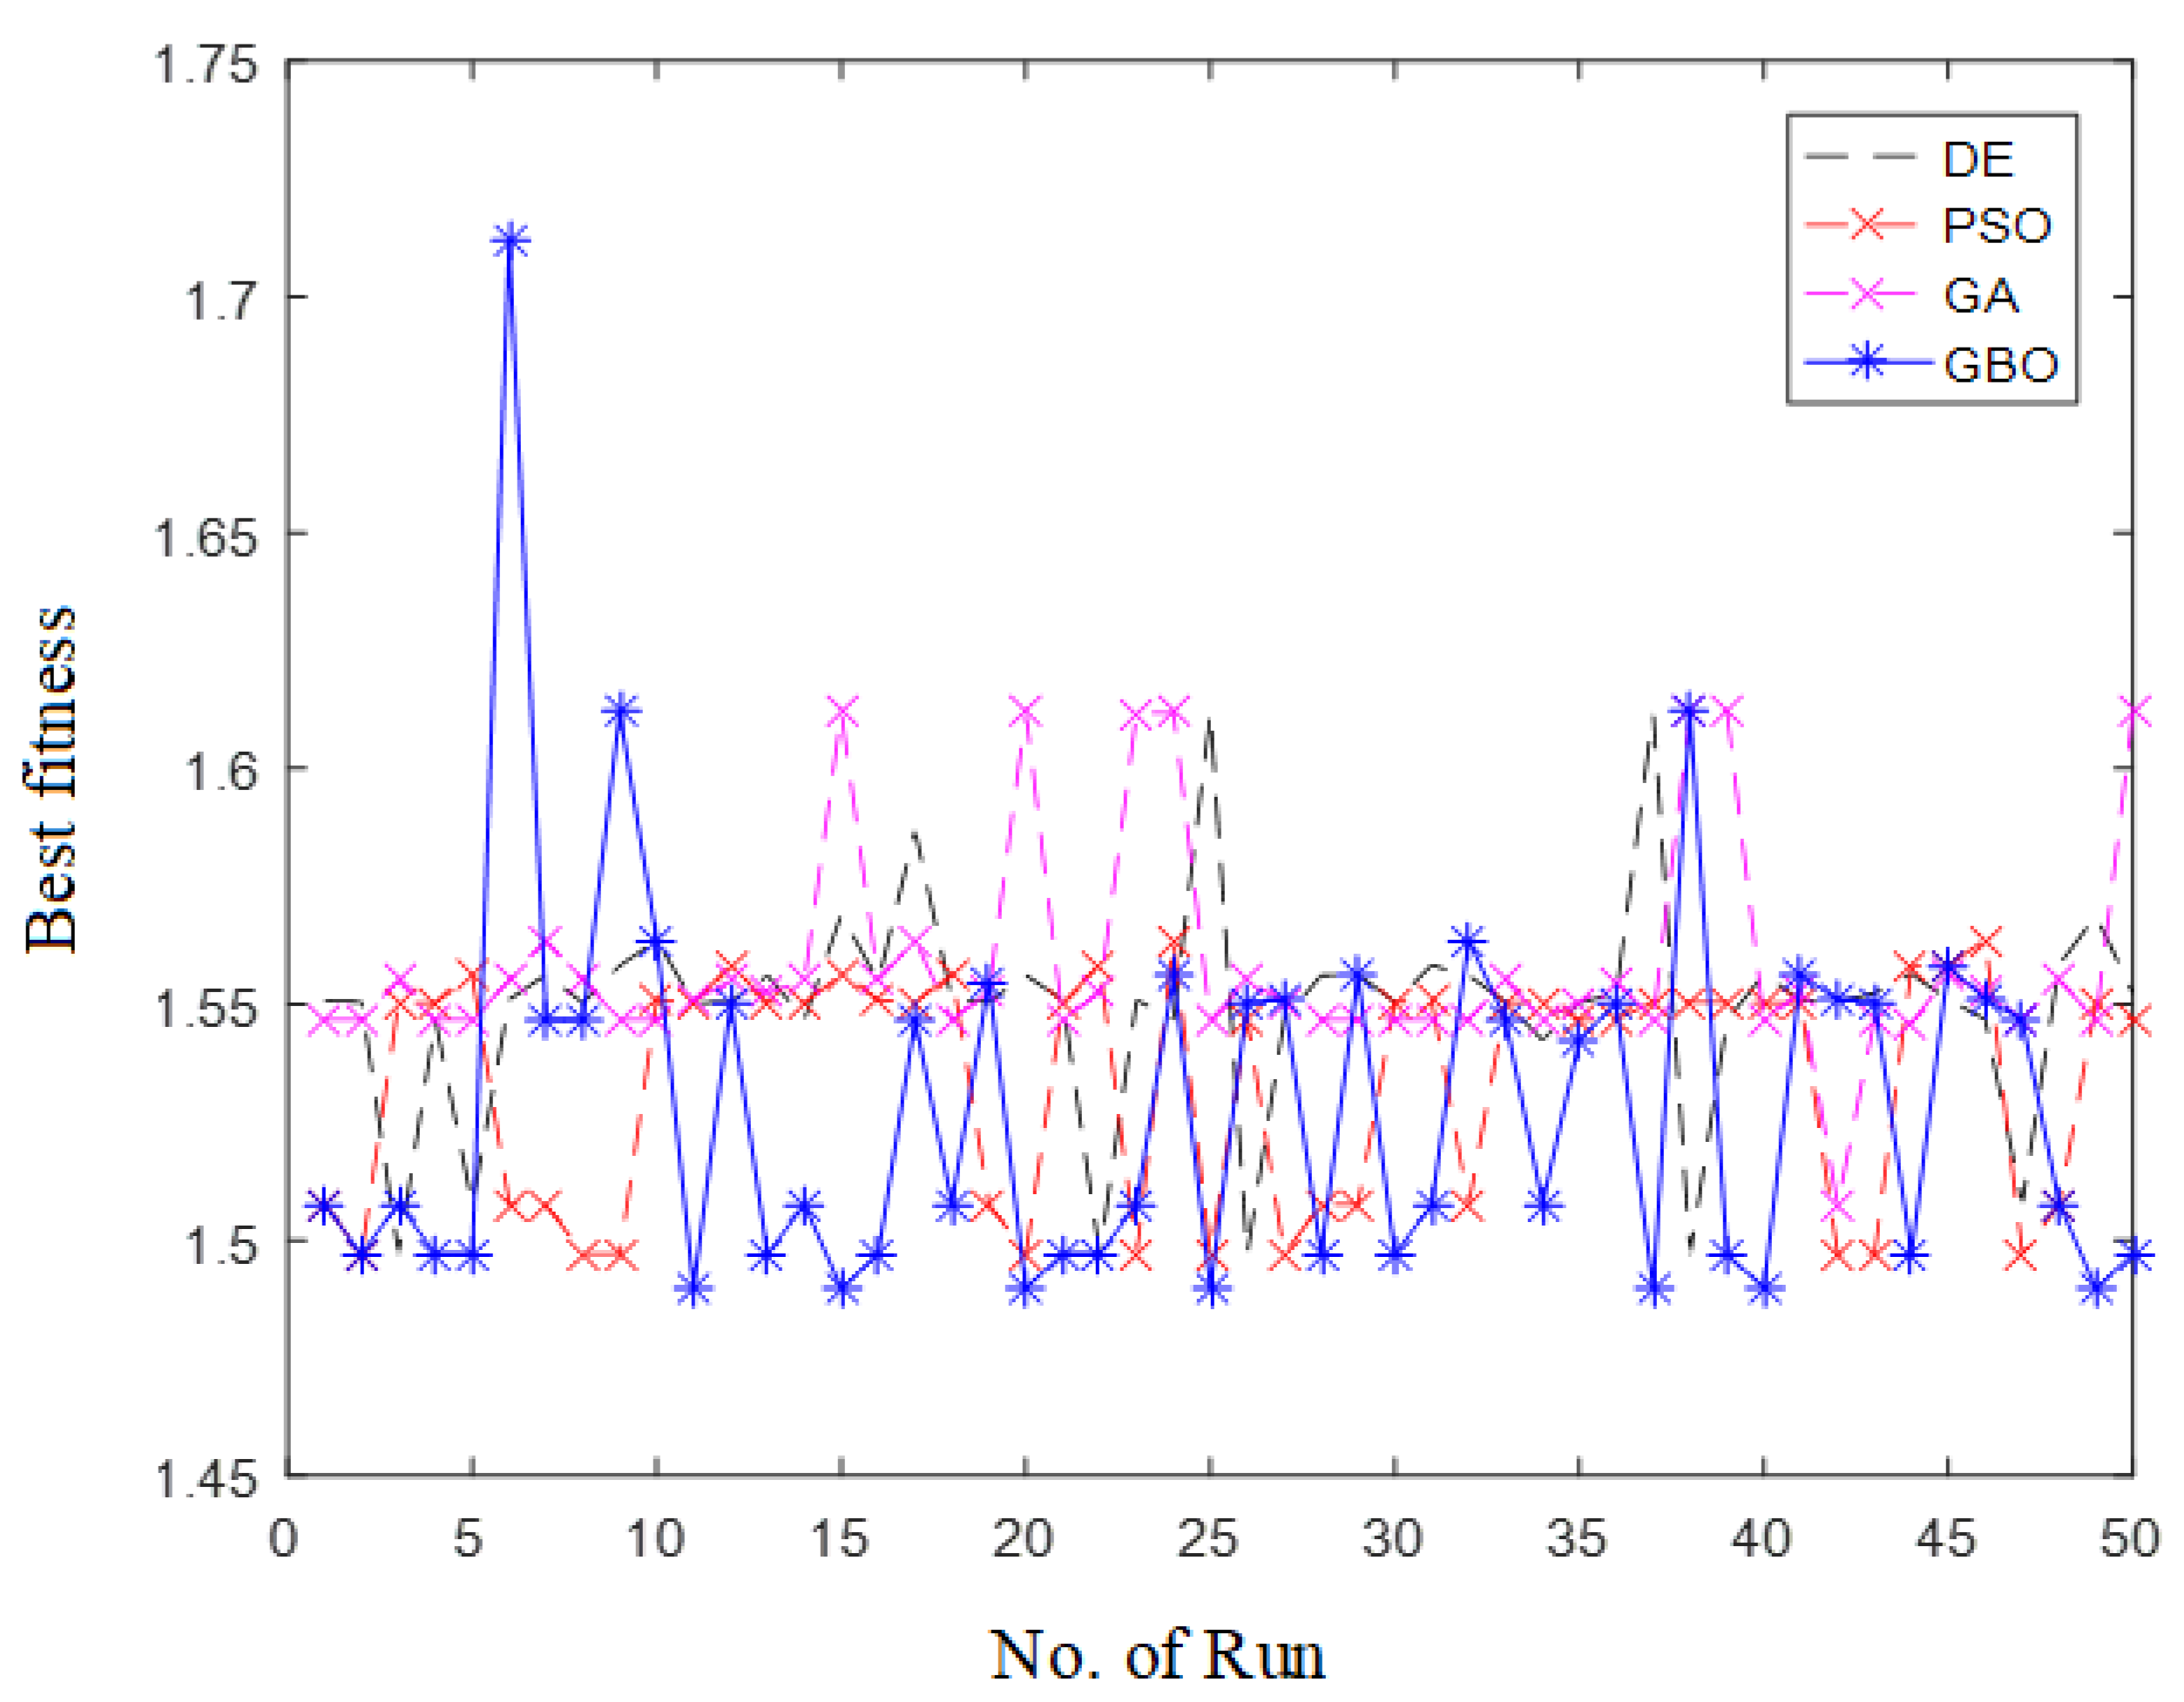
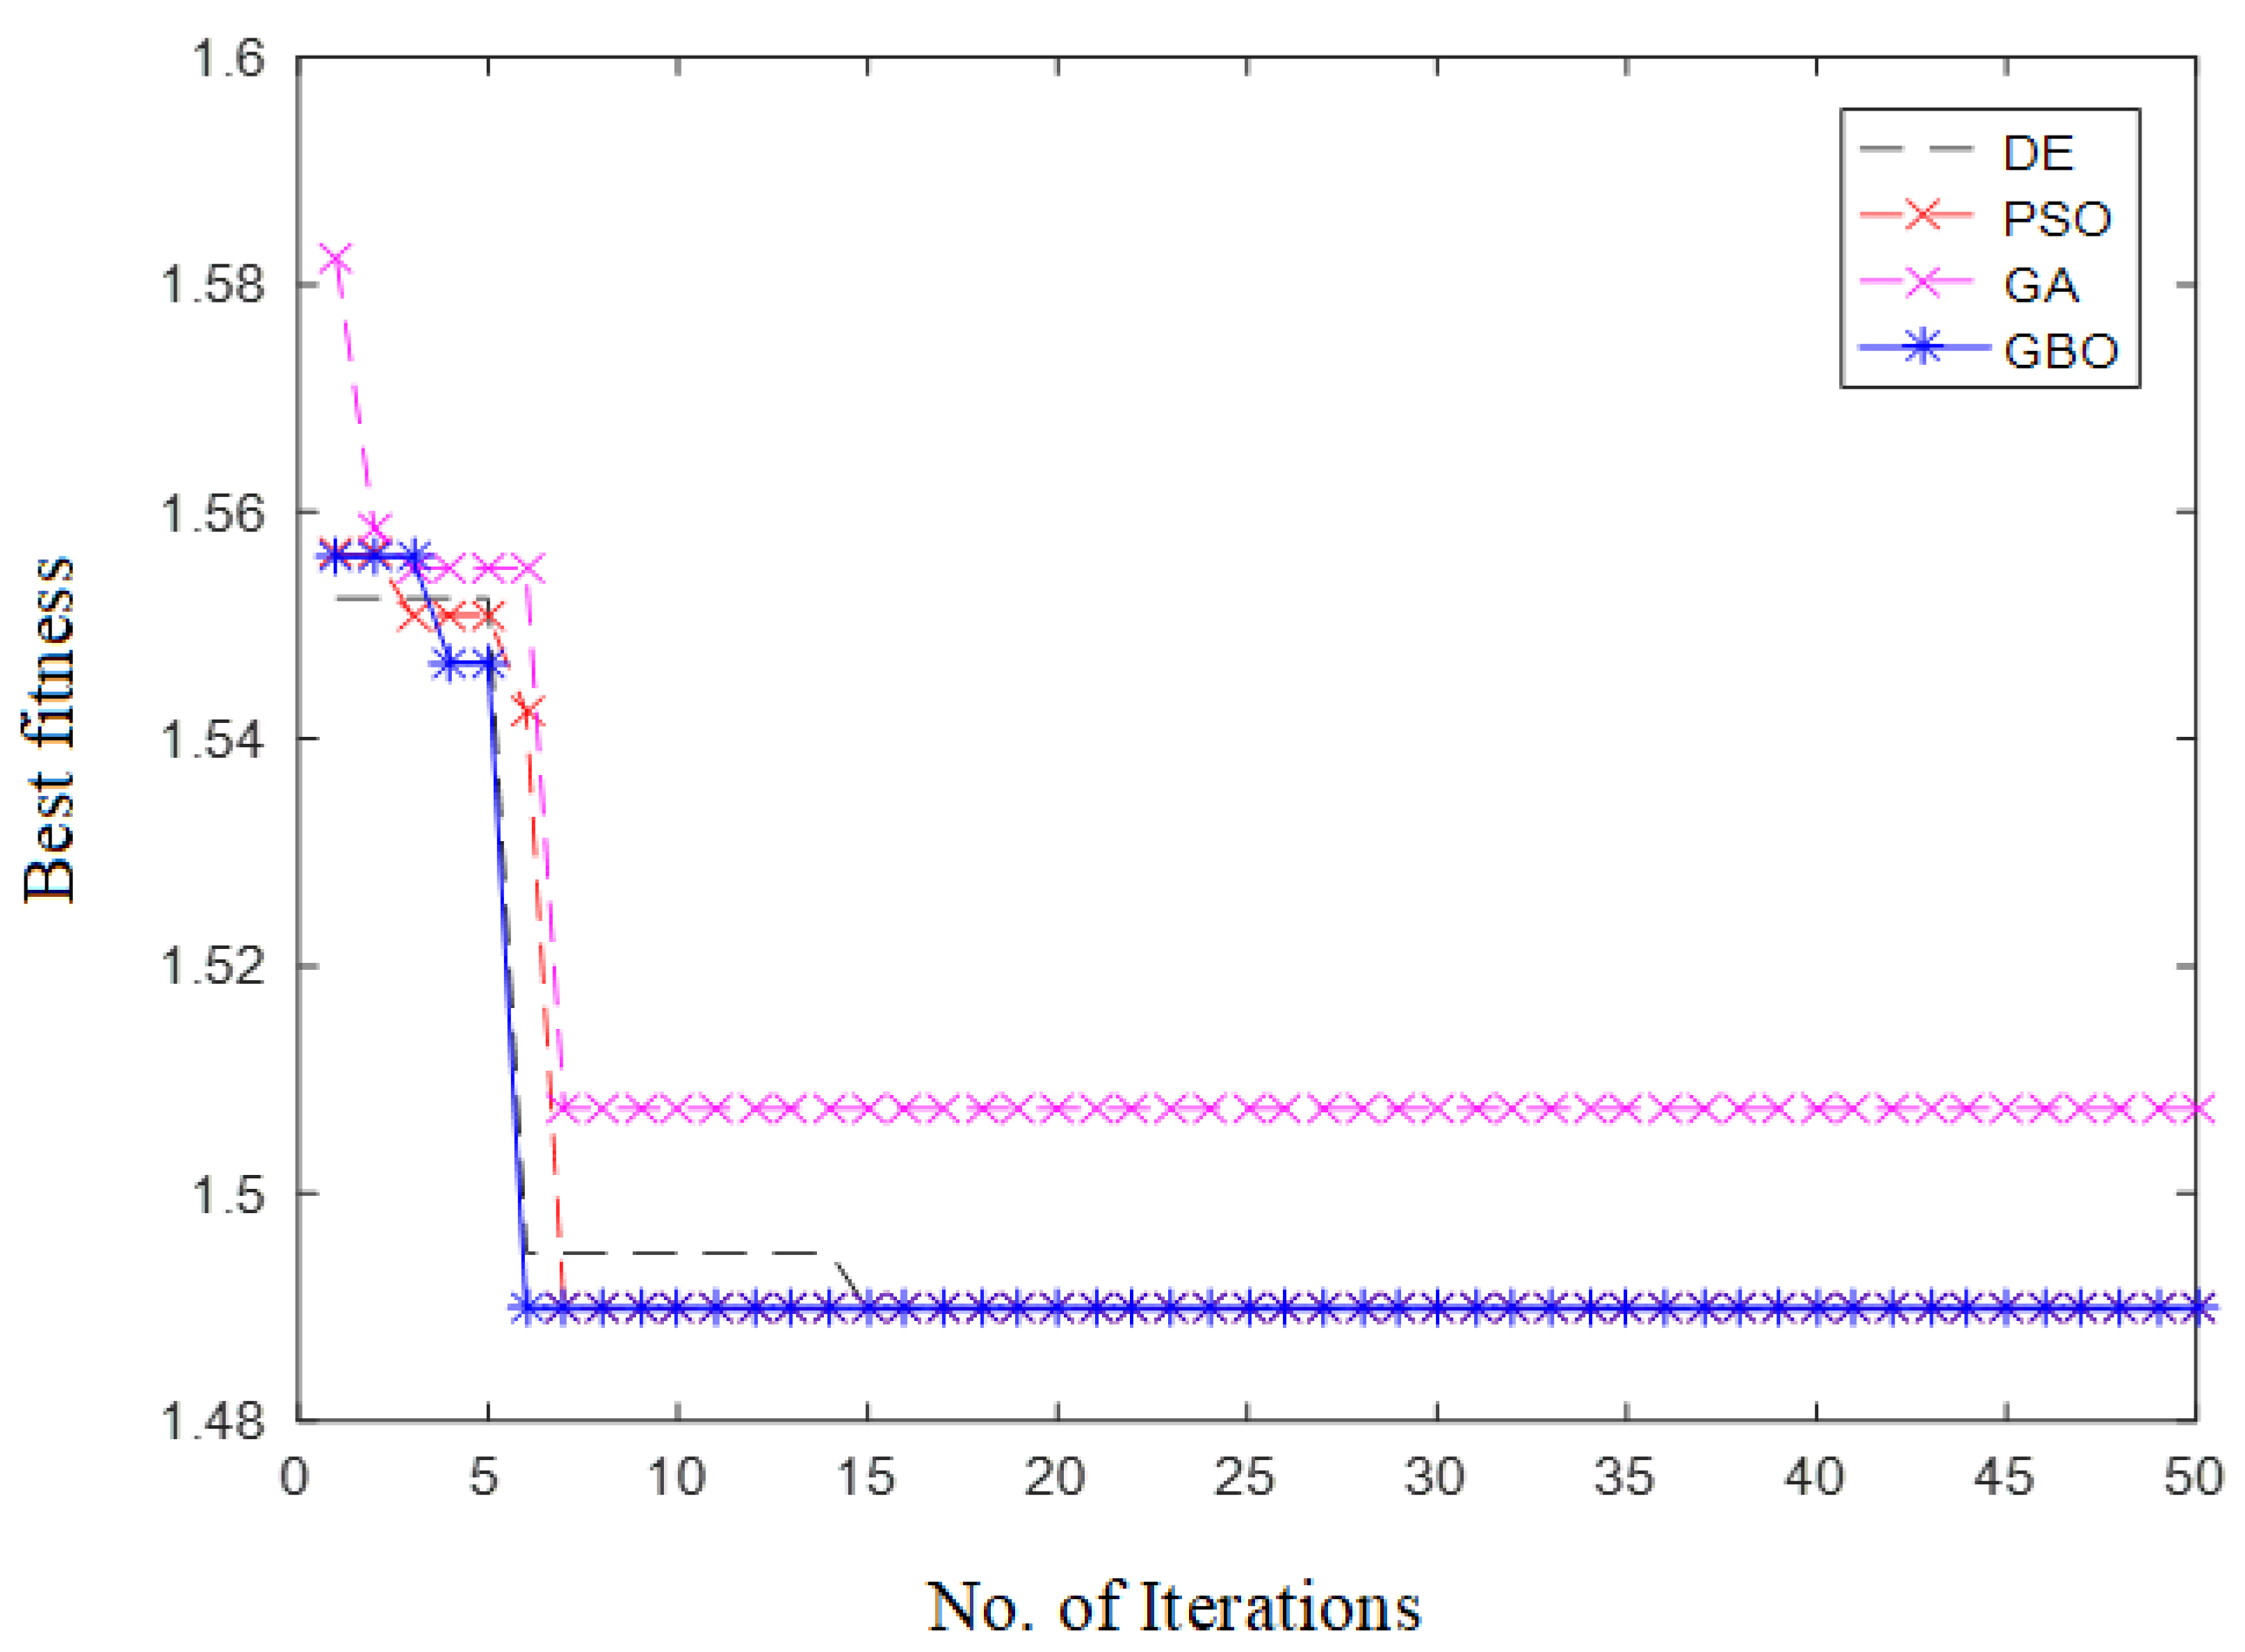
The robustness curve and the convergence curve of the algorithms in the case of solving the charger placement problem are shown in Figure 2 and Figure 3, respectively. It was observed that a good balance between exploitation and exploration was achieved by the GBO. Furthermore, the likelihood of becoming stuck in premature convergence and local optima was rare in the GBO.
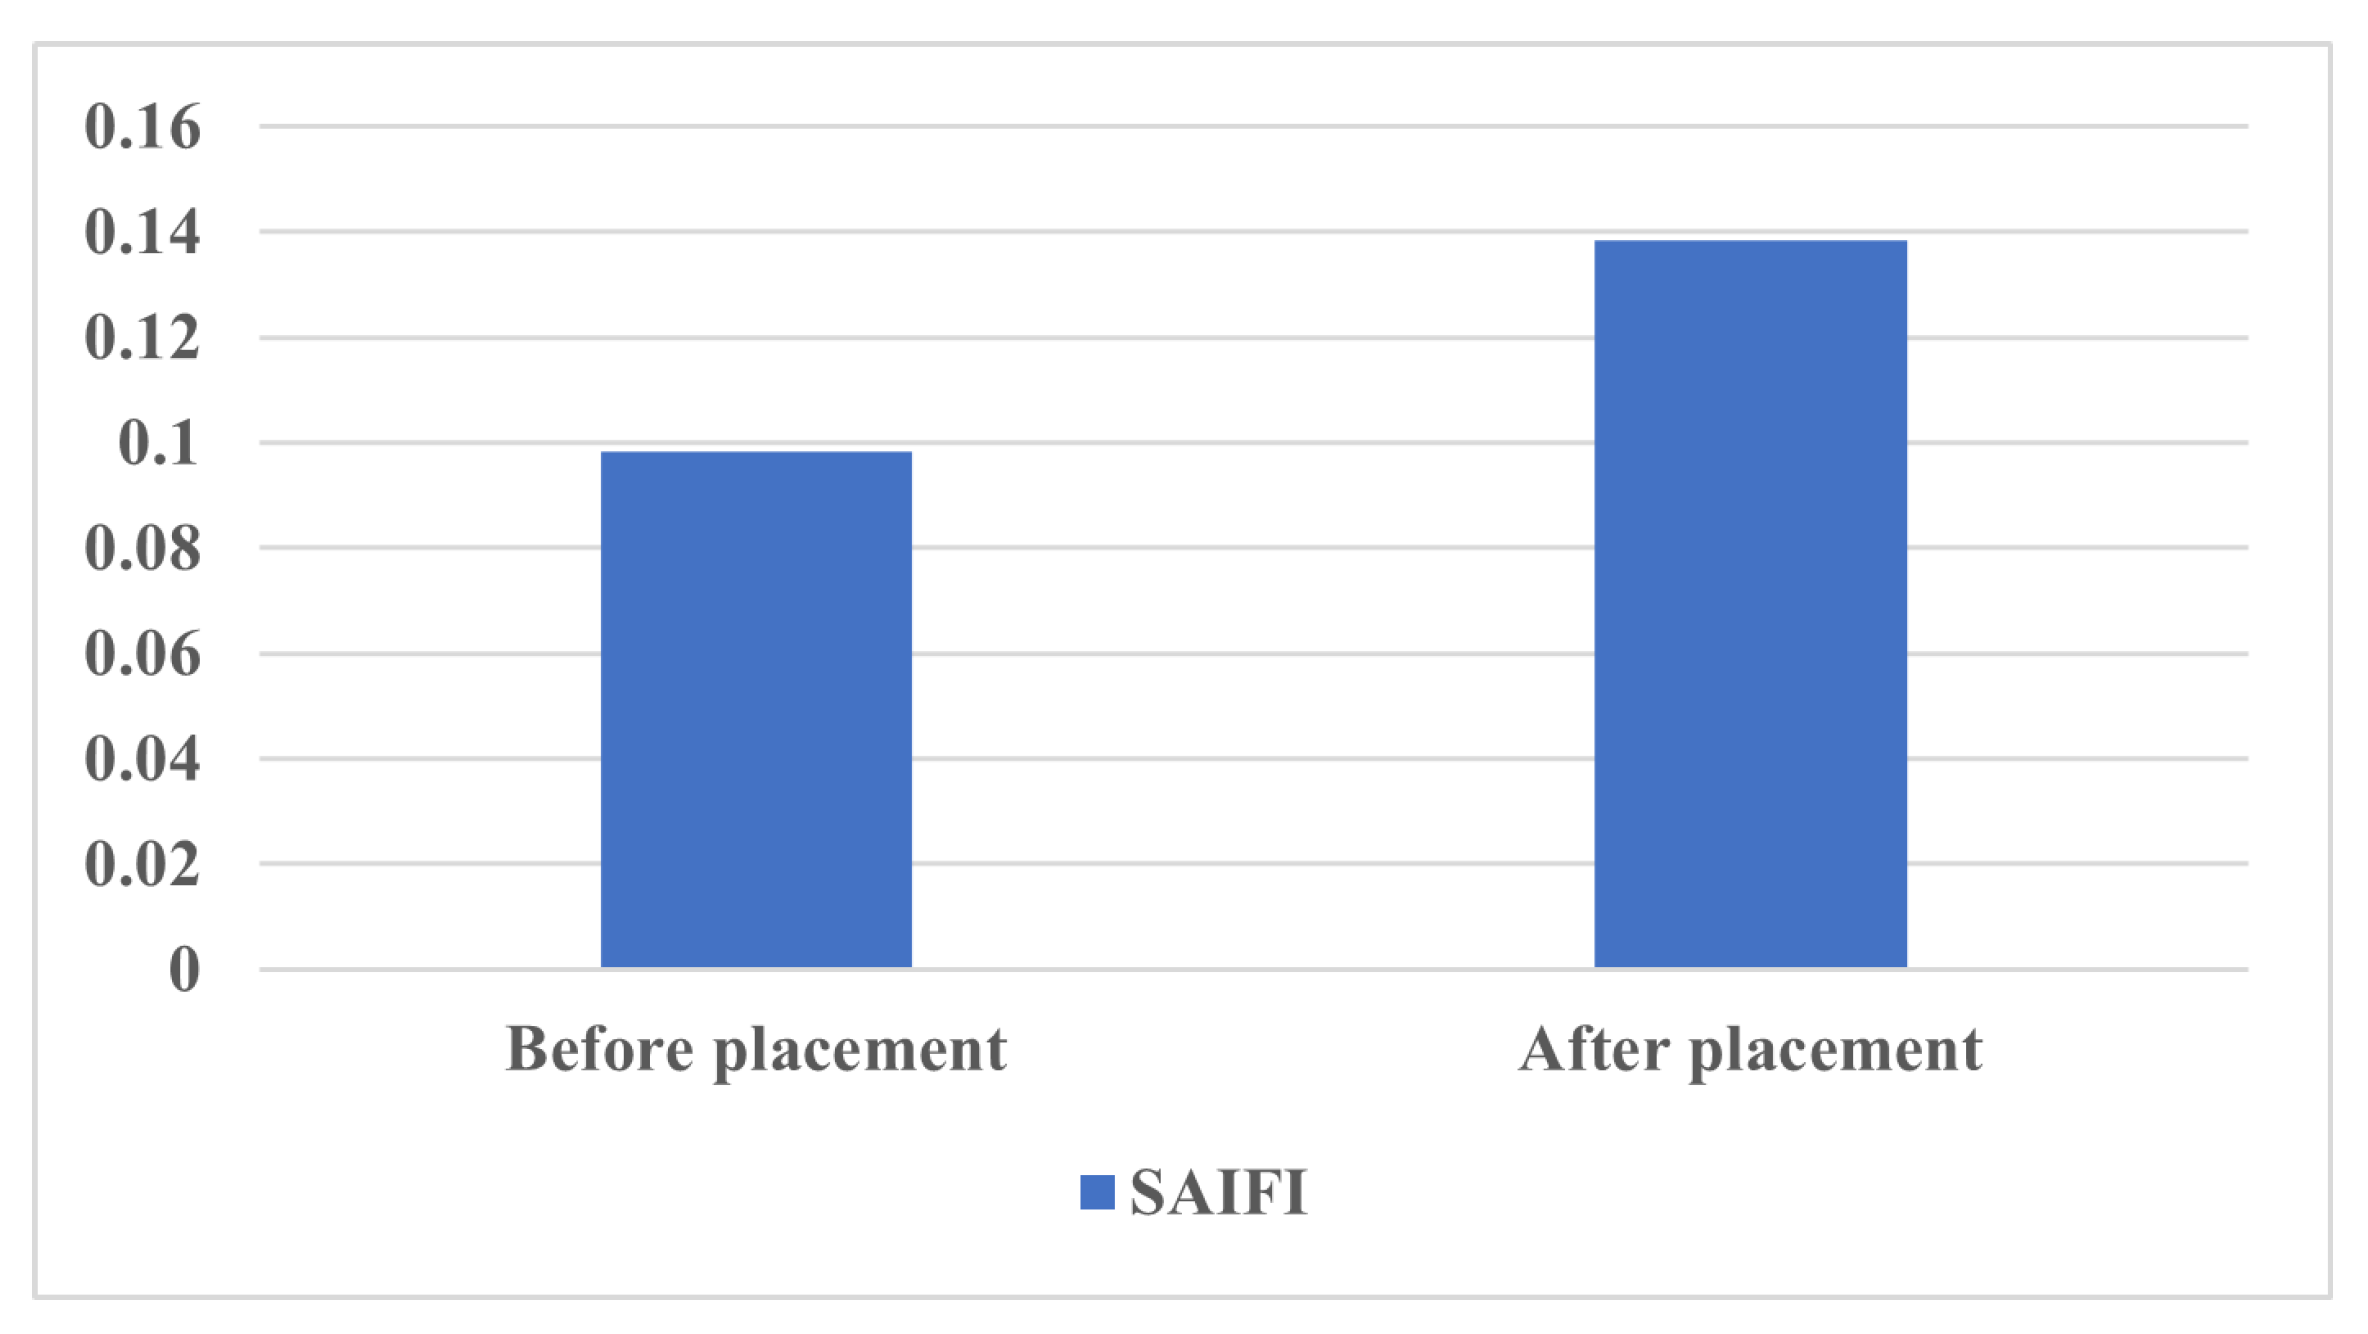
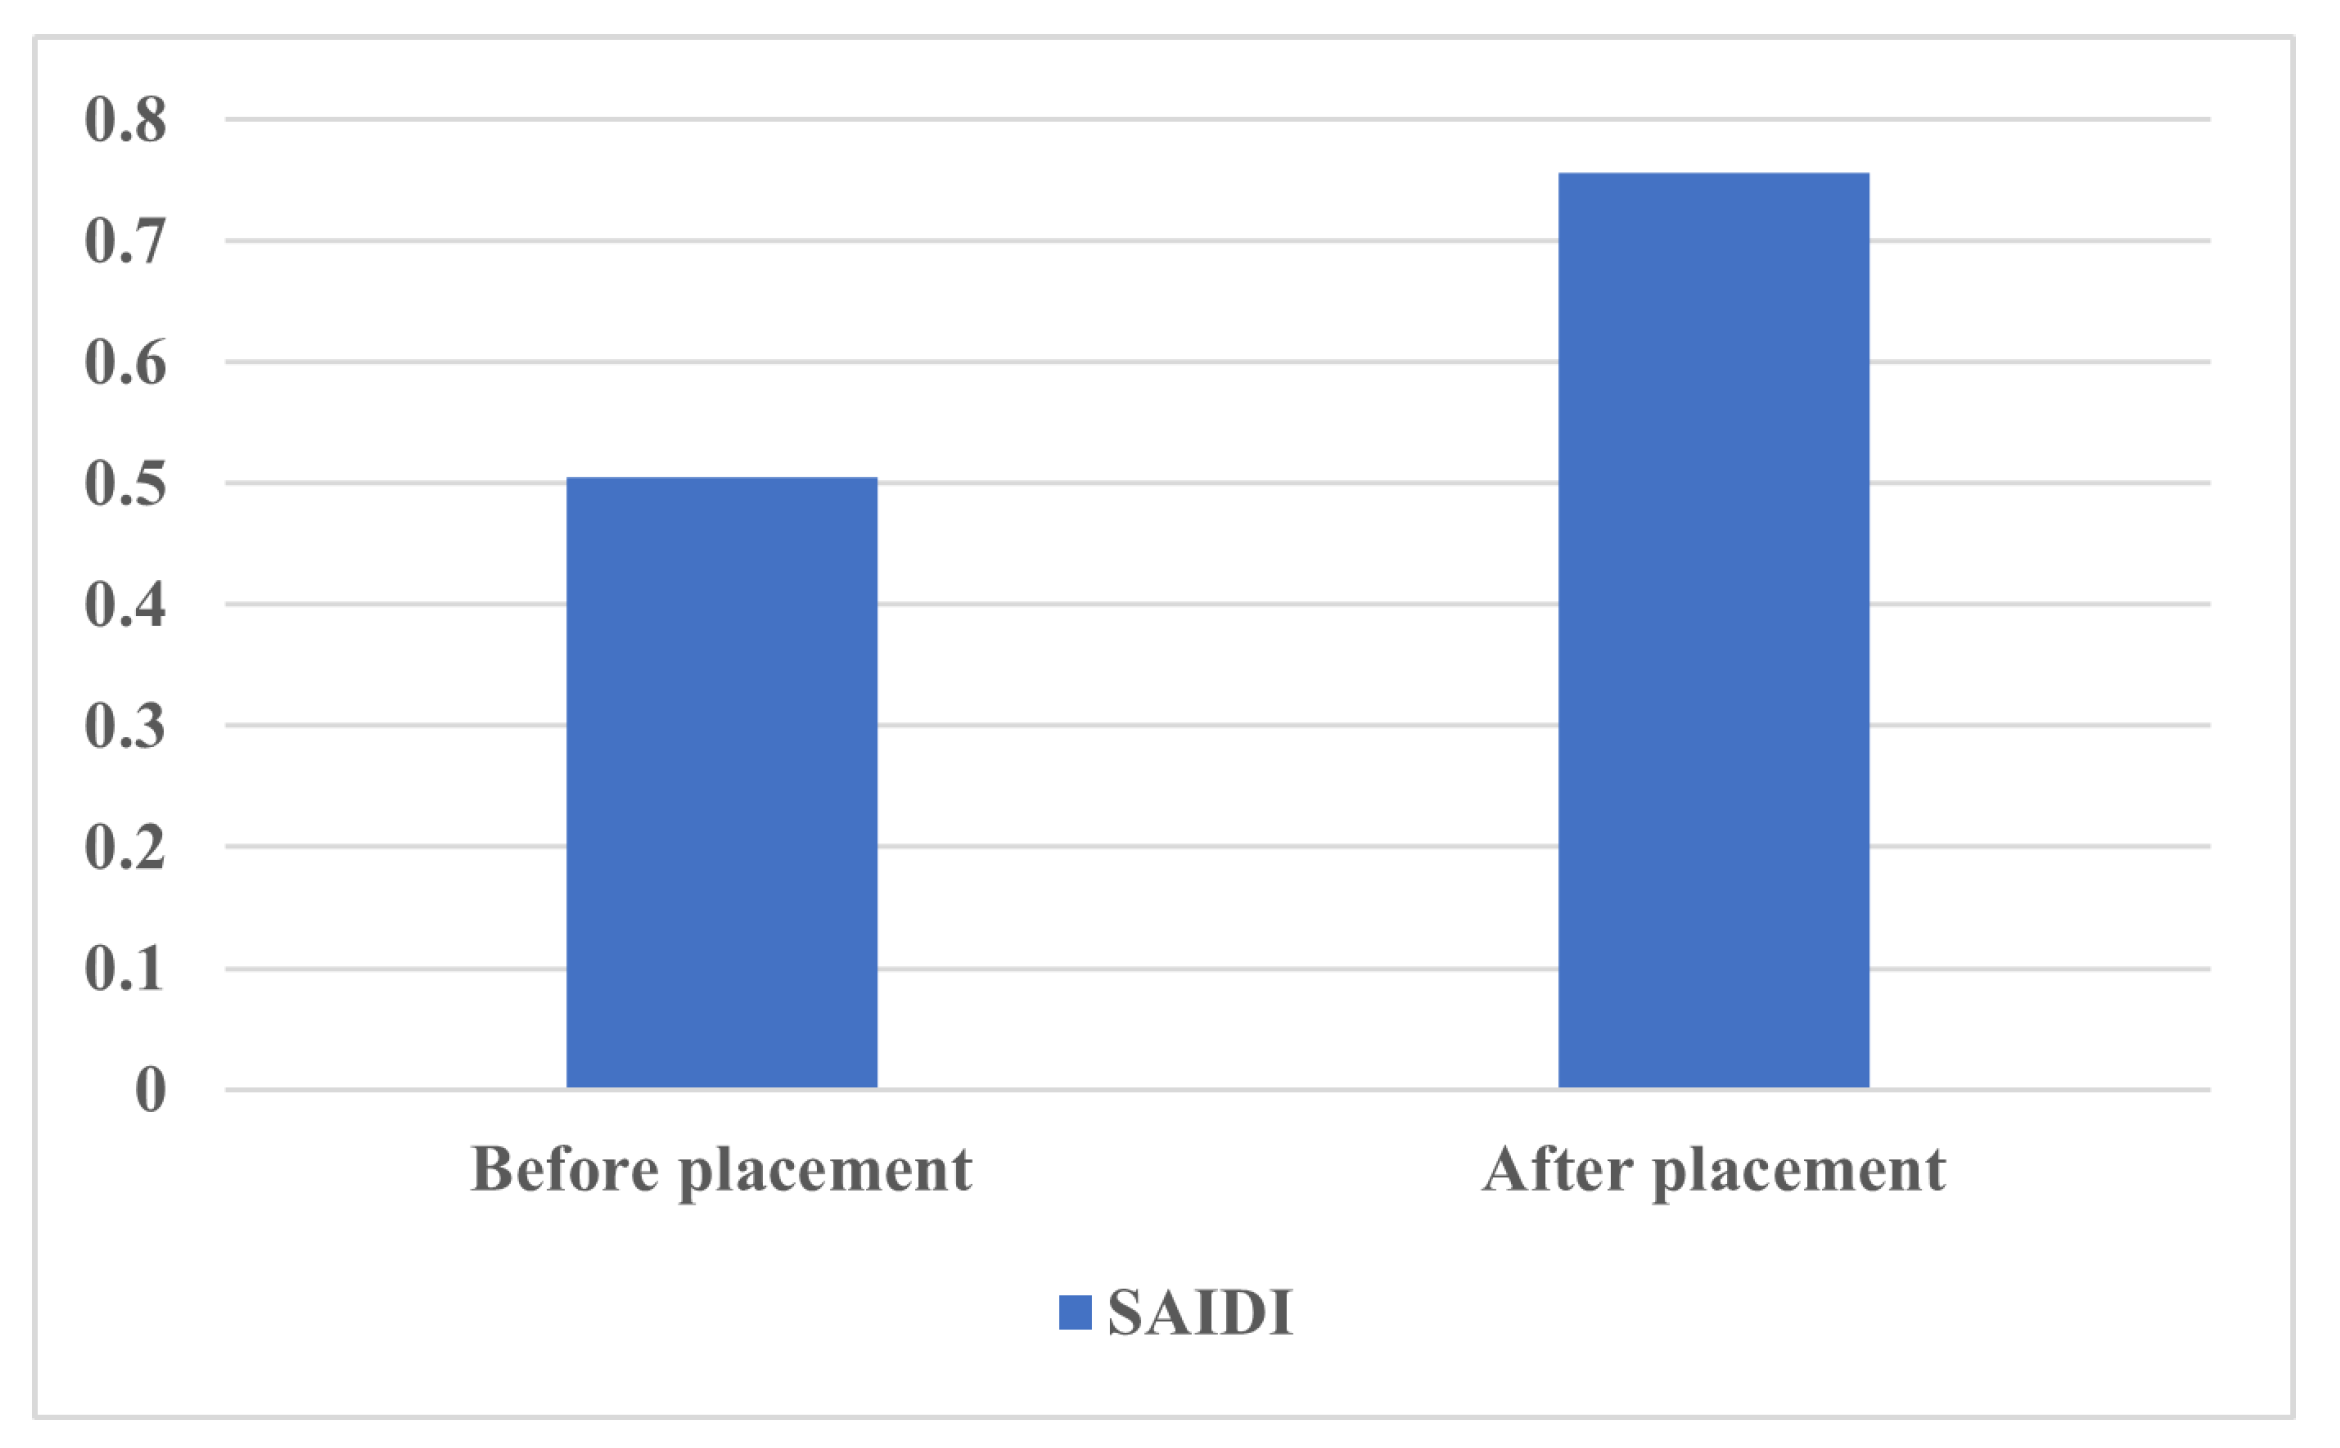
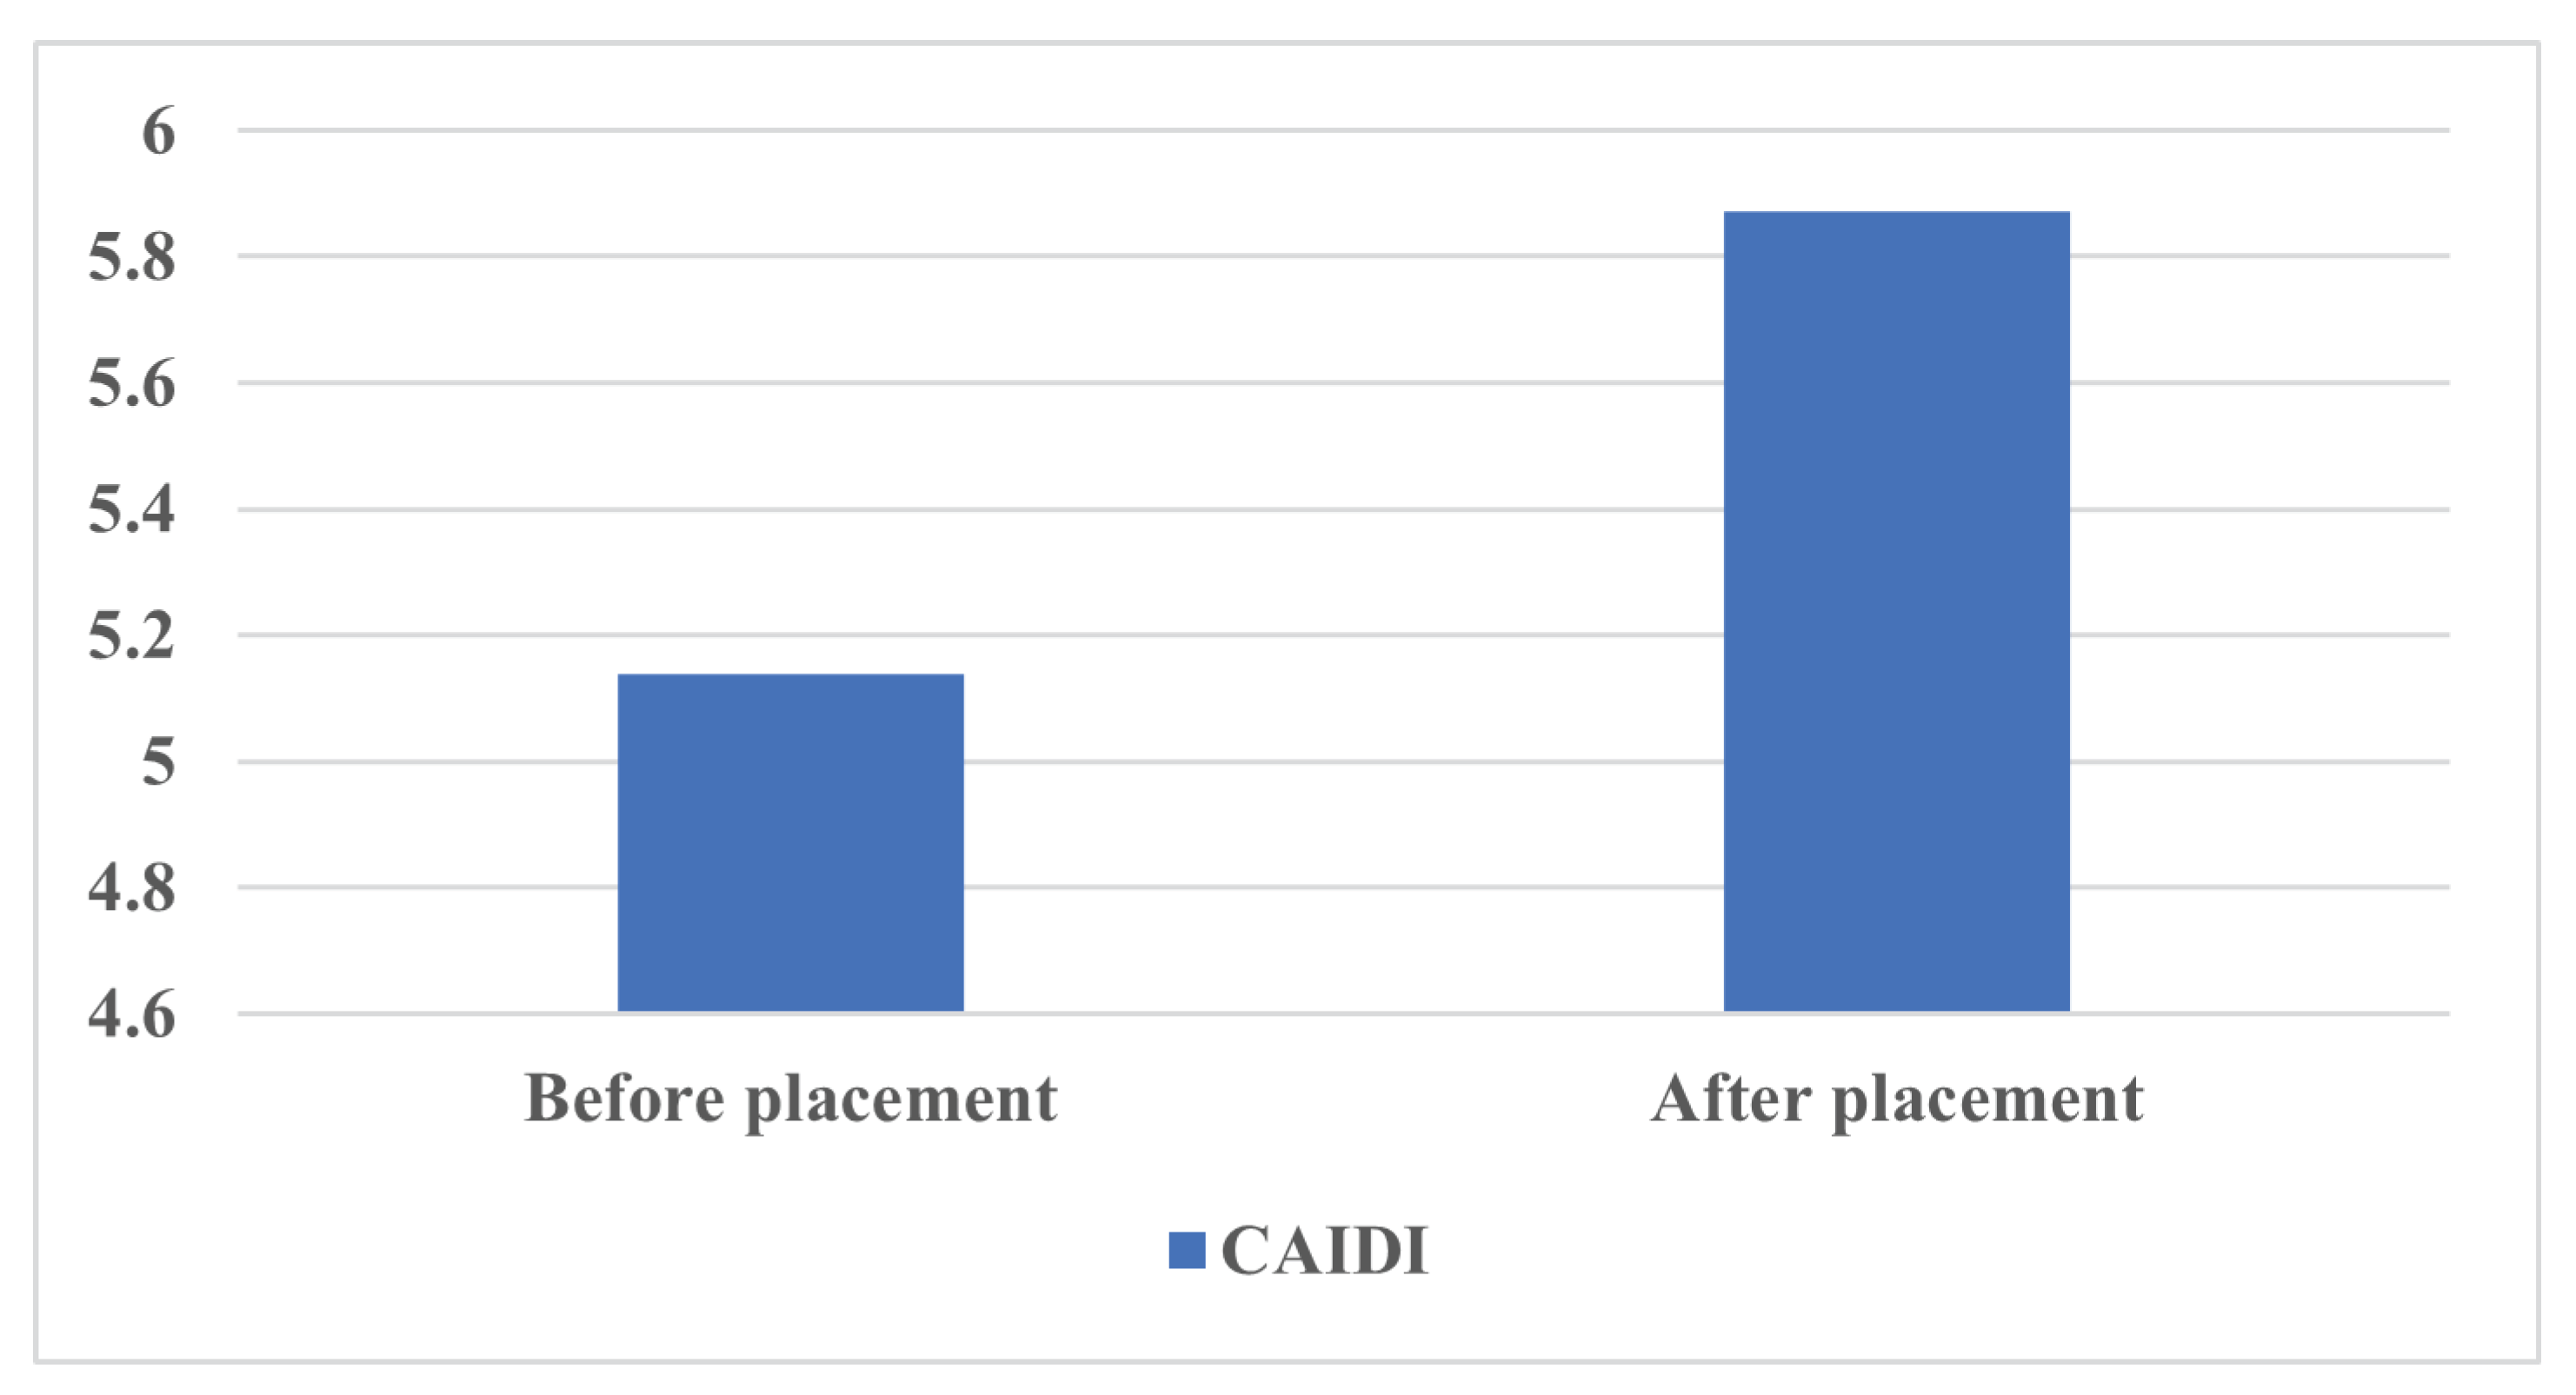
Further, the impact of the charger placement on typical distribution network reliability indices such as SAIDI, SAIFI and CAIDI was analysed. SAIFI gave an idea about the frequency of interruption, SAIDI gave an idea about the duration of interruption and CAIDI was an index representing customer dissatisfaction because of interruption. Figure 4, Figure 5 and Figure 6 depict the values of SAIFI, SAIDI and CAIDI after and before the charger allocation, respectively. It could be inferred that the degraded values of the reliability indices were within the safe limits. Table 5 discusses the evaluation of the GBO performance based on a statistical analysis of independent runs for this algorithm and other compared algorithms for the same case study. Based on this results, the GBO method achieved a better accuracy than all competitor algorithms.
5. Conclusions
The growing concerns regarding climate change, global warming and increased fuel price have initiated transportation electrification. For the adoption and acceptance of Electric Vehicles (EVs) amongst the masses, it is necessary to set up a sustainable and easily accessible charging infrastructure. The management strategy and the placement of the charging station play a significant role in maintaining the distribution network reliability, power loss and voltage stability. The charger placement formulation presented in this work was a single-objective formulation with cost as the objective function. The problem was solved considering the worst-case scenario. The uncertainty in road traffic, different scenarios of charging load, coordinated charging and the impact of vehicle grid integration were not considered in this work. A novel metaheuristic named GBO was used in this work for solving the charger placement problem. The Newton method was the main inspiration of the Gradient-based optimizer (GBO), that involves the LEO and GSR concepts. The performance of the GBO was compared with other metaheuristics such as DE, GA and PSO. The best fitness value of 1.4898 was achieved by the proposed GBO, PSO and DE algorithms. Furthermore, the values of SAIFI, SAIDI and CAIDI after and before the charger allocation were within the safe limits. A voltage deviation of 0.0114 occurred based on the best location extracted from the GBO algorithm. It was noted that the GBO presented comparatively well as competed to the aforesaid algorithms. Our future formulations will consider these aforementioned factors. Our future work will concentrate on testing the GBO behaviour on multi-objective charger placement problems, and several applications such as optimal load flow, the identification of a super-capacitor and fuel cell parameters, extraction of transformer parameters and optimization of a wind farm layout.
Author Contributions
E.H.H.: Supervision, methodology, conceptualization, software, formal analysis, investigation, visualization, writing—review and editing. S.D.: Formal analysis, resources, writing—review and editing. D.O.: Visualization, conceptualization, formal analysis, methodology, writing—review and editing. H.R.: Visualization, conceptualization, formal analysis, resources, data curation, writing—review and editing. H.A.: Visualization, conceptualization, formal analysis, resources, data curation, writing—review and editing. M.S.: Software, investigation, visualization, conceptualization, formal analysis, resources, writing—original draft. All authors have read and agreed to the published version of the manuscript.
Funding
The Deanship of Scientific Research (DSR) at King Abdulaziz University, Jeddah, Saudi Arabia has funded this project, under grant no. (FP-122-43).
Institutional Review Board Statement
Not applicable.
Informed Consent Statement
Not applicable.
Data Availability Statement
Not applicable.
Acknowledgments
The Deanship of Scientific Research (DSR), at the King Abdulaziz University, Jeddah, Saudi Arabia, funded this project, under grant no. (FP-122-43).
Conflicts of Interest
The authors declare that there is no conflict of interest.
Abbreviations
The following abbreviations are used in this manuscript:
| AENS | Available Energy Not Served |
| GBO | Gradient-based Optimizer |
| EV | Electric Vehicle |
| GA | Genetic Algorithm |
| CS | Charging Station |
| SAIFI | System Average Interruption Frequency Index |
| DE | Differential Evolution |
| SAIDI | System Average Interruption Duration Index |
| CAIDI | Customer Average Interruption Duration Index |
| b | Charging station placement bus |
| Slow-charging station number at bus b | |
| Fast-charging station number at bus b | |
| P | Set of charging stations nodes |
| Fast-charging stations installation cost | |
| Slow-charging stations installation cost | |
| Power consumption of fast-charging stations | |
| Power consumption of slow-charging stations | |
| Electricity cost per unit | |
| The utility penalty paid per unit voltage deviation | |
| The utility penalty paid per unit energy not served | |
| Distance between charging demand and charging station point | |
| Load demand of bus i | |
| Number of customer connected to bus i | |
| Interruption duration bus i | |
| Deviation of voltage at bus i | |
| Voltage at bus i | |
| Base voltage at bus i | |
| Fast charger number at bus i | |
| Slow charger number at bus i | |
| Maximum fast-charging stations number | |
| Maximum slow-charging stations number | |
| Minimum reactive power limit | |
| Reactive power at bus i | |
| Maximum reactive power limit s | |
| L | Net load of the network |
| Loading margin of the network | |
| Buses number | |
| Nodes number | |
| Planning period | |
| Installation cost function | |
| Operating cost function | |
| Penalty paid | |
| Voltage deviation penalty | |
| AENS penalty | |
| Cost of travelling distance |
References
- Ismaeel, A.A.; Houssein, E.H.; Oliva, D.; Said, M. Gradient-based optimizer for parameter extraction in photovoltaic models. IEEE Access 2021, 9, 13403–13416. [Google Scholar] [CrossRef]
- Houssein, E.H.; Helmy, B.E.D.; Rezk, H.; Nassef, A.M. An enhanced Archimedes optimization algorithm based on Local escaping operator and Orthogonal learning for PEM fuel cell parameter identification. Eng. Appl. Artif. Intell. 2021, 103, 104309. [Google Scholar] [CrossRef]
- Houssein, E.H.; Zaki, G.N.; Diab, A.A.Z.; Younis, E.M. An efficient Manta Ray Foraging Optimization algorithm for parameter extraction of three-diode photovoltaic model. Comput. Electr. Eng. 2021, 94, 107304. [Google Scholar] [CrossRef]
- Houssein, E.H.; Mahdy, M.A.; Fathy, A.; Rezk, H. A modified Marine Predator Algorithm based on opposition based learning for tracking the global MPP of shaded PV system. Expert Syst. Appl. 2021, 183, 115253. [Google Scholar] [CrossRef]
- Korashy, A.; Kamel, S.; Houssein, E.H.; Jurado, F.; Hashim, F.A. Development and application of evaporation rate water cycle algorithm for optimal coordination of directional overcurrent relays. Expert Syst. Appl. 2021, 185, 115538. [Google Scholar] [CrossRef]
- Parastvand, H.; Bass, O.; Masoum, M.A.; Chapman, A.; Lachowicz, S.W. Robust Placement and Sizing of Charging Stations From a Novel Graph Theoretic Perspective. IEEE Access 2020, 8, 118593–118602. [Google Scholar] [CrossRef]
- Deb, S.; Gao, X.Z.; Tammi, K.; Kalita, K.; Mahanta, P. A novel chicken swarm and teaching learning based algorithm for electric vehicle charging station placement problem. Energy 2021, 220, 119645. [Google Scholar] [CrossRef]
- Lam, A.Y.; Leung, Y.W.; Chu, X. Electric vehicle charging station placement: Formulation, complexity, and solutions. IEEE Trans. Smart Grid 2014, 5, 2846–2856. [Google Scholar] [CrossRef] [Green Version]
- Abdelminaam, D.S.; Said, M.; Houssein, E.H. Turbulent flow of water-based optimization using new objective function for parameter extraction of six photovoltaic models. IEEE Access 2021, 9, 35382–35398. [Google Scholar] [CrossRef]
- Shaban, H.; Houssein, E.H.; Pérez-Cisneros, M.; Oliva, D.; Hassan, A.Y.; Ismaeel, A.A.; AbdElminaam, D.S.; Deb, S.; Said, M. Identification of Parameters in Photovoltaic Models through a Runge Kutta Optimizer. Mathematics 2021, 9, 2313. [Google Scholar] [CrossRef]
- Zahrani, H.K.; Nadimi-Shahraki, M.H.; Sayarshad, H.R. An intelligent social-based method for rail-car fleet sizing problem. J. Rail Transp. Plan. Manag. 2021, 17, 100231. [Google Scholar]
- Csiszár, C.; Csonka, B.; Földes, D.; Wirth, E.; Lovas, T. Location optimisation method for fast-charging stations along national roads. J. Transp. Geogr. 2020, 88, 102833. [Google Scholar] [CrossRef]
- Hu, J.; Morais, H.; Sousa, T.; Lind, M. Electric vehicle fleet management in smart grids: A review of services, optimization and control aspects. Renew. Sustain. Energy Rev. 2016, 56, 1207–1226. [Google Scholar] [CrossRef] [Green Version]
- Yang, Z.; Li, K.; Foley, A. Computational scheduling methods for integrating plug-in electric vehicles with power systems: A review. Renew. Sustain. Energy Rev. 2015, 51, 396–416. [Google Scholar] [CrossRef]
- Pal, A.; Bhattacharya, A.; Chakraborty, A.K. Placement of Public Fast-Charging Station and Solar Distributed Generation with Battery Energy Storage in Distribution Network Considering Uncertainties and Traffic Congestion. J. Energy Storage 2021, 41, 102939. [Google Scholar] [CrossRef]
- Ge, S.; Feng, L.; Liu, H. The planning of electric vehicle charging station based on grid partition method. In Proceedings of the 2011 International Conference on Electrical and Control Engineering, Mongolia, China, 15–17 July 2011; pp. 2726–2730. [Google Scholar]
- Liu, Z.F.; Zhang, W.; Ji, X.; Li, K. Optimal planning of charging station for electric vehicle based on particle swarm optimization. In Proceedings of the IEEE PES Innovative Smart Grid Technologies, Washington, DC, USA, 16–20 January 2012; pp. 1–5. [Google Scholar]
- Bendiabdellah, Z.; Senouci, S.M.; Feham, M. A hybrid algorithm for planning public charging stations. In Proceedings of the 2014 Global Information Infrastructure and Networking Symposium (GIIS), Paris, France, 21–25 May 2014; pp. 1–3. [Google Scholar]
- Dong, J.; Liu, C.; Lin, Z. Charging infrastructure planning for promoting battery electric vehicles: An activity-based approach using multiday travel data. Transp. Res. Part C Emerg. Technol. 2014, 38, 44–55. [Google Scholar] [CrossRef] [Green Version]
- Deb, S.; Gao, X.Z.; Tammi, K.; Kalita, K.; Mahanta, P. Nature-inspired optimization algorithms applied for solving charging station placement problem: Overview and comparison. Arch. Comput. Methods Eng. 2021, 28, 91–106. [Google Scholar] [CrossRef]
- Londoño, A.; Granada-Echeverri, M. Optimal placement of freight electric vehicles charging stations and their impact on the power distribution network. Int. J. Ind. Eng. Comput. 2019, 10, 535–556. [Google Scholar] [CrossRef]
- Xiong, Y.; Gan, J.; An, B.; Miao, C.; Bazzan, A.L. Optimal electric vehicle fast charging station placement based on game theoretical framework. IEEE Trans. Intell. Transp. Syst. 2017, 19, 2493–2504. [Google Scholar] [CrossRef]
- Lindgren, J.; Lund, P.D. Identifying bottlenecks in charging infrastructure of plug-in hybrid electric vehicles through agent-based traffic simulation. Int. J. Low-Carbon Technol. 2015, 10, 110–118. [Google Scholar] [CrossRef] [Green Version]
- Khalkhali, K.; Abapour, S.; Moghaddas-Tafreshi, S.M.; Abapour, M. Application of data envelopment analysis theorem in plug-in hybrid electric vehicle charging station planning. IET Gener. Transm. Distrib. 2015, 9, 666–676. [Google Scholar] [CrossRef]
- Zhang, Y.; Zhang, Q.; Farnoosh, A.; Chen, S.; Li, Y. GIS-based multi-objective particle swarm optimization of charging stations for electric vehicles. Energy 2019, 169, 844–853. [Google Scholar] [CrossRef]
- Liu, Q.; Liu, J.; Le, W.; Guo, Z.; He, Z. Data-driven intelligent location of public charging stations for electric vehicles. J. Clean. Prod. 2019, 232, 531–541. [Google Scholar] [CrossRef]
- Neyestani, N.; Damavandi, M.Y.; Shafie-Khah, M.; Contreras, J.; Catalão, J.P. Allocation of plug-in vehicles’ parking lots in distribution systems considering network-constrained objectives. IEEE Trans. Power Syst. 2014, 30, 2643–2656. [Google Scholar] [CrossRef]
- Pashajavid, E.; Golkar, M. Optimal placement and sizing of plug in electric vehicles charging stations within distribution networks with high penetration of photovoltaic panels. J. Renew. Sustain. Energy 2013, 5, 053126. [Google Scholar] [CrossRef]
- Fazelpour, F.; Vafaeipour, M.; Rahbari, O.; Rosen, M.A. Intelligent optimization to integrate a plug-in hybrid electric vehicle smart parking lot with renewable energy resources and enhance grid characteristics. Energy Convers. Manag. 2014, 77, 250–261. [Google Scholar] [CrossRef]
- Wang, G.; Xu, Z.; Wen, F.; Wong, K.P. Traffic-constrained multiobjective planning of electric-vehicle charging stations. IEEE Trans. Power Deliv. 2013, 28, 2363–2372. [Google Scholar] [CrossRef]
- Rajabi-Ghahnavieh, A.; Sadeghi-Barzani, P. Optimal zonal fast-charging station placement considering urban traffic circulation. IEEE Trans. Veh. Technol. 2016, 66, 45–56. [Google Scholar] [CrossRef]
- Deb, S.; Tammi, K.; Kalita, K.; Mahanta, P. Charging station placement for electric vehicles: A case study of guwahati city, india. IEEE Access 2019, 7, 100270–100282. [Google Scholar] [CrossRef]
- Liu, Z.; Wen, F.; Ledwich, G. Optimal planning of electric-vehicle charging stations in distribution systems. IEEE Trans. Power Deliv. 2012, 28, 102–110. [Google Scholar] [CrossRef]
- Yan, X.; Duan, C.; Chen, X.; Duan, Z. Planning of electric vehicle charging station based on hierarchic genetic algorithm. In Proceedings of the 2014 IEEE Conference and Expo Transportation Electrification Asia-Pacific (ITEC Asia-Pacific), Beijing, China, 31 August–3 September 2014; pp. 1–5. [Google Scholar]
- Phonrattanasak, P.; Leeprechanon, N. Optimal placement of EV fast charging stations considering the impact on electrical distribution and traffic condition. In Proceedings of the 2014 International Conference and Utility Exhibition on Green Energy for Sustainable Development (ICUE), Pattaya City, Thailand, 19–21 March 2014; pp. 1–6. [Google Scholar]
- Zheng, Y.; Dong, Z.Y.; Xu, Y.; Meng, K.; Zhao, J.H.; Qiu, J. Electric vehicle battery charging/swap stations in distribution systems: Comparison study and optimal planning. IEEE Trans. Power Syst. 2013, 29, 221–229. [Google Scholar] [CrossRef]
- Baouche, F.; Billot, R.; Trigui, R.; El Faouzi, N.E. Efficient allocation of electric vehicles charging stations: Optimization model and application to a dense urban network. IEEE Intell. Transp. Syst. Mag. 2014, 6, 33–43. [Google Scholar] [CrossRef]
- He, F.; Yin, Y.; Zhou, J. Deploying public charging stations for electric vehicles on urban road networks. Transp. Res. Part C Emerg. Technol. 2015, 60, 227–240. [Google Scholar] [CrossRef]
- Andrenacci, N.; Ragona, R.; Valenti, G. A demand-side approach to the optimal deployment of electric vehicle charging stations in metropolitan areas. Appl. Energy 2016, 182, 39–46. [Google Scholar] [CrossRef]
- Han, D.; Ahn, Y.; Park, S.; Yeo, H. Trajectory-interception based method for electric vehicle taxi charging station problem with real taxi data. Int. J. Sustain. Transp. 2016, 10, 671–682. [Google Scholar] [CrossRef]
- Deb, S.; Gao, X.Z. A hybrid ant lion optimization chicken swarm optimization algorithm for charger placement problem. Complex Intell. Syst. 2021, 1–18. [Google Scholar] [CrossRef]
- Babu, P.; Swarnasri, K. Multi-Objective Optimal Allocation of Electric Vehicle Charging Stations in Radial Distribution System Using Teaching Learning Based Optimization. Int. J. Renew. Energy Res. 2020, 10, 366–377. [Google Scholar]
- Fokui, W.S.T.; Saulo, M.J.; Ngoo, L. Optimal Placement of Electric Vehicle Charging Stations in a Distribution Network with Randomly Distributed Rooftop Photovoltaic Systems. IEEE Access 2021, 9, 132397–132411. [Google Scholar] [CrossRef]
- Ma, T.Y.; Xie, S. Optimal fast charging station locations for electric ridesharing with vehicle-charging station assignment. Transp. Res. Part D Transp. Environ. 2021, 90, 102682. [Google Scholar] [CrossRef]
- Sachan, S.; Deb, S.; Singh, S.N.; Singh, P.P.; Sharma, D.D. Planning and operation of EV charging stations by chicken swarm optimization driven heuristics. Energy Convers. Econ. 2021. [Google Scholar] [CrossRef]
- Deb, S.; Gao, X.Z.; Tammi, K.; Kalita, K.; Mahanta, P. A new teaching–learning-based chicken swarm optimization algorithm. Soft Comput. 2020, 24, 5313–5331. [Google Scholar] [CrossRef]
- Mohanty, A.K.; Babu, P.S. Optimal Placement of Electric Vehicle Charging Stations Using JAYA Algorithm. In Recent Advances in Power Systems; Springer: Berlin/Heidelberg, Germany, 2021; pp. 259–266. [Google Scholar]
- Ahmad, F.; Khalid, M.; Panigrahi, B.K. An enhanced approach to optimally place the solar powered electric vehicle charging station in distribution network. J. Energy Storage 2021, 42, 103090. [Google Scholar] [CrossRef]
- Ahmadianfar, I.; Bozorg-Haddad, O.; Chu, X. Gradient-based optimizer: A new Metaheuristic optimization algorithm. Inf. Sci. 2020, 540, 131–159. [Google Scholar] [CrossRef]
- Holland, J.H. Genetic algorithms. Sci. Am. 1992, 267, 66–73. [Google Scholar] [CrossRef]
- Storn, R.; Price, K. Differential evolution–a simple and efficient heuristic for global optimization over continuous spaces. J. Glob. Optim. 1997, 11, 341–359. [Google Scholar] [CrossRef]
- Kennedy, J.; Eberhart, R. Particle swarm optimization. In Proceedings of the ICNN’95-International Conference on Neural Networks, Perth, WA, Australia, 27 November–1 December 1995; Volume 4, pp. 1942–1948. [Google Scholar]
- Rupa, J.M.; Ganesh, S. Power flow analysis for radial distribution system using backward/forward sweep method. Int. J. Electr. Comput. Electron. Commun. Eng. 2014, 8, 1540–1544. [Google Scholar]
- Zamani, H.; Nadimi-Shahraki, M.H.; Gandomi, A.H. CCSA: Conscious neighborhood-based crow search algorithm for solving global optimization problems. Appl. Soft Comput. 2019, 85, 105583. [Google Scholar] [CrossRef]
Figure 2.
Robustness curve of algorithms for charging station problem.

Figure 3.
Algorithms convergence curve for charging station problem.

Figure 4.
Impact of charger placement on SAIFI.

Figure 5.
Impact of charger placement on SAIDI.

Figure 6.
Impact of charger placement on CAIDI.


Table 1.
Parameter setting.
| Algorithm | Parameters |
|---|---|
| Common settings | Size of population : N = 30 Maximum iterations_Itr = 50 |
| PSO | w = 0.1, c1 = c2 = 2 |
| DE | F = 1.5, CR = 0.6 |
| GBO | pr = 0.5 |
Table 2.
The charging station input parameters [7].
Table 2.
The charging station input parameters [7].
| Parameter | Value |
|---|---|
| 3000 USD | |
| 2500 USD | |
| 50 kW | |
| 19.2 kW | |
| 65 USD/MWhr | |
| 1,000,000) USD | |
| 0.18 USD/MWhr |
Table 3.
Optimal charging stations allocation.
| Optimization Algorithm | Best Fitness Value | b | ||
|---|---|---|---|---|
| GBO | 1.4898 | 23 | 1 | 3 |
| 6 | 1 | 2 | ||
| 3 | 1 | 3 | ||
| PSO | 1.4898 | 23 | 1 | 2 |
| 6 | 1 | 3 | ||
| 3 | 1 | 3 | ||
| DE | 1.4898 | 23 | 1 | 2 |
| 6 | 1 | 3 | ||
| 3 | 1 | 3 | ||
| GA | 1.5075 | 23 | 1 | 2 |
| 3 | 1 | 3 | ||
| 28 | 1 | 3 |
Table 4.
Value of distribution network variables of after and before placement of CS.
| Variables | Before | After |
|---|---|---|
| Deviation of voltage (pu) | 0 | 0.0114 |
| AENS in kWhr/yr | 1.9369 | 2.5233 |
| Loss of power (pu) | 0.0021 | 0.0062 |
Table 5.
Statistical analysis for solving problem of charging station placement.
| Algorithm | Min Fitness | Max Fitness | Mean Fitness |
|---|---|---|---|
| GBO | 1.4898 | 1.7116 | 1.5286 |
| GA | 1.5075 | 1.6199 | 1.5584 |
| DE | 1.4898 | 1.6199 | 1.5497 |
| PSO | 1.4898 | 1.5636 | 1.5341 |
Publisher’s Note: MDPI stays neutral with regard to jurisdictional claims in published maps and institutional affiliations. |
© 2021 by the authors. Licensee MDPI, Basel, Switzerland. This article is an open access article distributed under the terms and conditions of the Creative Commons Attribution (CC BY) license (https://creativecommons.org/licenses/by/4.0/).
Share and Cite
MDPI and ACS Style
Houssein, E.H.; Deb, S.; Oliva, D.; Rezk, H.; Alhumade, H.; Said, M. Performance of Gradient-Based Optimizer on Charging Station Placement Problem. Mathematics 2021, 9, 2821. https://0-doi-org.brum.beds.ac.uk/10.3390/math9212821
AMA Style
Houssein EH, Deb S, Oliva D, Rezk H, Alhumade H, Said M. Performance of Gradient-Based Optimizer on Charging Station Placement Problem. Mathematics. 2021; 9(21):2821. https://0-doi-org.brum.beds.ac.uk/10.3390/math9212821
Chicago/Turabian StyleHoussein, Essam H., Sanchari Deb, Diego Oliva, Hegazy Rezk, Hesham Alhumade, and Mokhtar Said. 2021. "Performance of Gradient-Based Optimizer on Charging Station Placement Problem" Mathematics 9, no. 21: 2821. https://0-doi-org.brum.beds.ac.uk/10.3390/math9212821
Note that from the first issue of 2016, this journal uses article numbers instead of page numbers. See further details here.