
Genetic Algorithm-Based Fuzzy Inference System for Describing Execution Tracing Quality


1
Faculty of Computing, Engineering and Media, Institute of Artificial Intelligence (IAI), De Montfort University, Leicester LE1 9BH, UK
2
Andalusian Research Institute on Data Science and Computational Intelligence (DaSCI), University of Granada, 18071 Granada, Spain
3
Software Technology Research Laboratory (STRL), Faculty of Computing, Engineering and Media, De Montfort University, Leicester LE1 9BH, UK
*
Authors to whom correspondence should be addressed.
Mathematics 2021, 9(21), 2822; https://0-doi-org.brum.beds.ac.uk/10.3390/math9212822
Submission received: 30 September 2021
/
Revised: 22 October 2021
/
Accepted: 1 November 2021
/
Published: 6 November 2021
(This article belongs to the Section Fuzzy Sets, Systems and Decision Making)
Abstract
:Execution tracing is a tool used in the course of software development and software maintenance to identify the internal routes of execution and state changes while the software operates. Its quality has a high influence on the duration of the analysis required to locate software faults. Nevertheless, execution tracing quality has not been described by a quality model, which is an impediment while measuring software product quality. In addition, such a model needs to consider uncertainty, as the underlying factors involve human analysis and assessment. The goal of this study is to address both issues and to fill the gap by defining a quality model for execution tracing. The data collection was conducted on a defined study population with the inclusion of software professionals to consider their accumulated experiences; moreover, the data were processed by genetic algorithms to identify the linguistic rules of a fuzzy inference system. The linguistic rules constitute a human-interpretable rule set that offers further insights into the problem domain. The study found that the quality properties accuracy, design and implementation have the strongest impact on the quality of execution tracing, while the property legibility is necessary but not completely inevitable. Furthermore, the quality property security shows adverse effects on the quality of execution tracing, but its presence is required to some extent to avoid leaking information and to satisfy legal expectations. The created model is able to describe execution tracing quality appropriately. In future work, the researchers plan to link the constructed quality model to overall software product quality frameworks to consider execution tracing quality with regard to software product quality as a whole. In addition, the simplification of the mathematically complex model is also planned to ensure an easy-to-tailor approach to specific application domains.
1. Introduction
Execution tracing is a tool used in the course of software development and software maintenance to identify the internal routes of execution and state changes while the software operates. As a term, it is used interchangeably with logging in the scope of this study. Execution tracing quality has a high influence on the duration of the analysis required to locate software faults, especially in cases when reproducing the issue with a debugger is not a feasible option [1]. Nevertheless, execution tracing quality has not been described by a quality model, nor is it included in software product quality frameworks in an appropriate manner, which is an impediment while measuring software product quality and formulating quality targets for software products [1,2].
Moreover, the ability to describe and assess a software product from any point of view that involves human evaluation results in uncertainty to some extent [3]. Nevertheless, the evaluation of how the software operates and relates to its environment and the extent to which the end user is satisfied with it are aspects that cannot be covered by static code analysis, only by human assessment. The input variables of logging quality elicited in [1]—accuracy, design and implementation, legibility, and security—involve human assessment. Thus, modelling the problem requires the implicit uncertainty to be handled.
An urge appears in different publications to improve the quality of execution tracing, but no overall guidelines exist for software developers to follow at present [1,4,5,6,7,8,9,10,11,12,13,14,15].
Consequently, there is a significant gap in the field, which the present study addresses and attempts to solve by defining a quality model for execution tracing. Such a quality model makes it possible to consider each previous individual endeavour for logging improvement and to see their relations to each other and to the quality as a whole, as well as to articulate general guidelines or requirements with which good execution tracing quality can be achieved. Furthermore, the model would support the measurement and assessment of logging quality, allowing researchers to compare the same project at different milestones of its development and maintenance or to compare different projects.
To describe the uncertainty associated with the quality modelling process, fuzzy logic [16,17] was used in this study. A basic and concise summary of the main concepts of fuzzy set theory and fuzzy logic is presented in [18]. The current research preferred fuzzy logic to evidential reasoning [19,20] due to its efficient modelling language implemented by linguistic rules and its capability to build adaptive systems. Linguistic rules are if–then rules that contain linguistic variables in the form of fuzzy sets [21,22]. As fuzzy sets make the description of a partial membership in a given set possible, the antecedents of the linguistic rules do not require a full match with the given conditions. In such cases, the consequent part is also partially applied according to the degrees of memberships. The effects of the different consequent parts of the linguistic rules are combined by the inference mechanism implemented, which is Takagi–Sugeno–Kang inference [23] in the present study. The basic steps of how to define a fuzzy inference system can be summarised in the following manner: (1) determining the inputs and input partitions—i.e., the regions to describe with fuzzy sets, (2) determining the outputs and output partitions, (3) determining the type of inference, (4) defining the membership functions for the inputs and for the output, (5) defining the linguistic rules, and (6) testing the system. The parameters of the membership functions and the number of the linguistic rules can be tuned adaptively [24,25,26,27].
1.1. Research Question
The goal of the study can be formalised in the form of a research question in the following manner:
- RQ:
- How can execution tracing quality be modelled with regard to the uncertainty inherently present in the quality measurement process?
1.2. Research Protocol
Conducting the research encompassed the following steps: (1) investigating the current state of the research in the field, (2) determining the goal of the study, (3) designing the data collection including (a) the identification of the study population and (b) the determination of the sampling method, (4) collecting the data with an online questionnaire [28], (5) performing exploratory data analysis and preprocessing the data, (6) constructing the model by the extraction of the linguistic rules of a fuzzy inference system by means of genetic algorithms from the collected data, (7) verifying the constructed model’s performance through a different machine learning approach (ANFIS) [24,25], (8) carrying out pre-validation and model adjustments in a mini-focus group, (9) validating the constructed model by engaging international experts through another online questionnaire [28] and tuning the model based on the feedback, and (10) writing the research report.
1.3. Contributions
The study contributes to the body of knowledge in the following fields: (1) data collection based on human experiences regarding execution tracing quality, (2) using intelligence systems to extract knowledge from the accumulated human experiences on logging, and (3) constructing a quality model to describe execution tracing quality with the consideration of the inherent uncertainty present in quality measurements. The constructed quality model can appropriately describe execution tracing quality.
1.4. Structure of the Study
The structure of the research report follows the steps of the research protocol. Section 2 gives an account of the works related to the current study; Section 3 presents the research methods, including the data collection, the sampling strategy and modelling of human experiences; Section 4 highlights the results with regard to the collected data, the exploratory data analysis, and the model construction; Section 5 is devoted to the validation of the study; Section 6 outlines the limitations; Section 7 presents the discussions, and the research closes with the concluding remarks and future work plans in Section 8. Appendix A, Appendix B, Appendix C, Appendix D, Appendix E and Appendix F highlight important steps of the model construction stages, including verification and model validation.
2. Related Works
The studies related to the current research lie in two different fields: (1) logging quality, which forms the problem domain; and (2) quality modelling with adaptive methods, including the consideration of uncertainty, which constitute tools to deal with the problem domain from the point of view of modelling. The major points in both fields relevant for the research conducted are briefly summarised below.
2.1. Logging
Overall guidelines on how to construct logging do not exist but would be desirable as stated in [4,5,8,10,29]. Present studies mainly focus on three distinct areas: (1) where to insert log statements in the source code of the application [6,7,8,9,11,13,14,15], (2) what data to log to make sufficient information available for error analysis [10,12,13,14] and (3) how to log [5,13,14], as summarised in Table 1. Moreover, tool support is provided to offer assistance for each of the three facets listed above [6,10,11,12,13,14,15]. The Apache Common Best Practices formulates recommendations for creating consistent severity levels in the logging code statements, but the description does not contain overall guidelines for execution tracing [30]. Zeng et al. explicitly claim that the usefulness of logging depends on the quality of logs, and support is needed for logging decisions with respect to (1) the severity level, (2) logging code location, (3) text in the log message and (4) when to update the log statements [31].
Yuan et al. conducted a study on the efficiency of logging practices, in which they included 5 large software systems, 250 randomly chosen error reports, and the analysis of the related source code [13]. They found that the error analysis based on the existing log data caused a problem in 57% of cases [13]. Furthermore, log messages can reduce the median time of analysis required to locate errors and accelerate the diagnosis between 1.4 and 3 times in terms of median values [13,32]. In addition, 39% of the program faults were not logged in the investigated cases [13].
Moreover, Yuan et al.’s measurement in [32] including four large C/C++ software projects concluded that logging is pervasive, as 30 lines of source code contains a log statement on average. The study was replicated by Chen at al. investigating Java projects, who found on average a log statement for each 51 lines of source code [33], which supported the claim of tje pervasiveness of logging.
Logging mechanisms can be constructed by a proprietary log implementation or by the use of log libraries. Kabbina et al. investigated 223 Apache Software Fundation projects and found that log library migration took place in 33 of them [34]. More than 70% of the migrated projects had post-migration errors [34]. In addition, the median log library migration time amounted to 26 days for the 33 projects [34], which indicates that log library migration is not a straightforward and trivial task.
Zheng et al., based on the analysis of 1.444 open-source Android applications, found that logging practices deviated from the practices applied in desktop and server applications; moreover, log statements in the mobile applications are less pervasive and far less maintained than in their desktop and server counterparts [31].
Galli et al. investigated the complete software product quality models and their tailored variants published in the past 20 years [2]. The term complete software product quality model refers to quality models that aim to cover and describe each presently known aspect of software product quality. The study identified 23 software product quality model families, as listed in Table 2, and found that none of them considers logging quality in an appropriate manner [1,2].
In spite of the extensive research in the field, the basic issue remains: there are no overall guidelines available for logging, and no model exists to measure the quality of logging as a whole. Furthermore, it is not feasible at present to quantitatively compare logging quality in the same project at different milestones or to compare the logging quality of different projects. Galli et al. explored the variables on which logging quality depends [1]. This step opened the way to the creation of a quality model for execution tracing to consider each identified aspect of its quality and to perform quantitative measurements.
2.2. Adaptive Methods in Quality Modelling
As human experiences and human qualities need to be considered while modelling execution tracing quality, artificial intelligence (AI) methods were used in the present study. AI and machine learning have found several application areas in the field of software quality modelling, including software defect prediction, bug report classification, uncertainty modelling, and multi-criteria decision-making problems as summarised below. Nevertheless, none of the listed studies focused on logging quality.
Lai et al. lay down key performance metrics for computer network quality and predict customer satisfaction by means of recurrent neural networks [93]. Software defect prediction became an intensively researched field with different machine learning methods, including AI, used to forecast errors or system breakdowns [94]. Pradhan et al. use machine learning to predict software defects in large systems [95]. Madera and Tomon apply machine learning to identify source code artefacts that are probably endangered by software defects [96]. Software defect prediction is highly influenced by the amount of availability of data for training the machine learning models, including neural networks, SVM, KNN, K-Means Clustering, Naive Bayes, decision trees, logistic and linear regression models, as well as their combinations with ensemble learning [97]. Khan et al. use transfer learning to utilise the data of different projects and to overcome the data availability barrier [97]. Blas predicts the quality of the software by means of simulation and modelling based on the architecture defined in [98]. Xing et al. predict software quality based on complexity-related quality metrics by means of SVM [99]. Lafi et al. apply classification for bug reports to reduce the maintenance efforts [100]; their method assigns an action to the fault report with the following labels: (1) faults to repair, (2) new functionality desired, (3) existing functionality needs change, and (4) the software needs adaptation to new environments.
Ubayashi et al. give an account of the uncertainty that developers face in the software development [101]. Their publication reveals the potential for the use of fuzzy logic. Singh et al. determine four quality metrics—(1) separation of concerns, (2) coupling, (3) cohesion, and (4) size—to describe the reliability of aspect-oriented software systems while they use fuzzy modelling [102]. The linguistic rules were constructed on the basis of the opinions of experts. Li et al. defined a quality model for software products involved in digitalising antiquarian resources with the use of fuzzy logic [62]. Li et al. took over concepts from the ISO/IEC 9126 standard [64], but they defined a separate quality model [62]. Fuzzy mathematics is applied to evaluate the membership of the defined quality properties in the fuzzy sets: excellent, good, general, unqualified [62]. Liang and Lien extend the quality model of the ISO/IEC 9126 standard [64] to encompass enterprise resource planning (ERP) software-related properties [65]; moreover, they describe the selection of the optimal ERP software as a multi-criteria decision-making problem and use a fuzzy analytic hierarchy process to produce a ranking with regard to the criteria considered [65]. In addition, Aggarwal et al., Nerurkar et al., Canfora et al., and Mittal and Bhatia applied fuzzy modelling to consider qualitative and quantitative data to assess the reusability and maintainability of software components in [103,104,105,106]. Galli et al. carried out a pilot study in [18,107] to test the performance of the different fuzzy inference methods with different membership functions in the context of modelling execution tracing quality. The study resulted in the findings that (1) Takagi–Sugeno–Kang inference with overlapping Gaussian-shaped membership functions achieved the best performance, and (2) the manual linguistic rule creation is error-prone, and contradictions can easily be introduced in the rule-base. For these reasons, the study concludes that Takagi–Sugeno–Kang inference with overlapping Gaussian-shaped membership functions should be used to describe execution tracing quality with an adaptive fuzzy system, where the linguistic rules are constructed automatically from the collected data.
Malhotra and Lata outline the machine learning approaches used for software maintainability in [108].
3. Methods
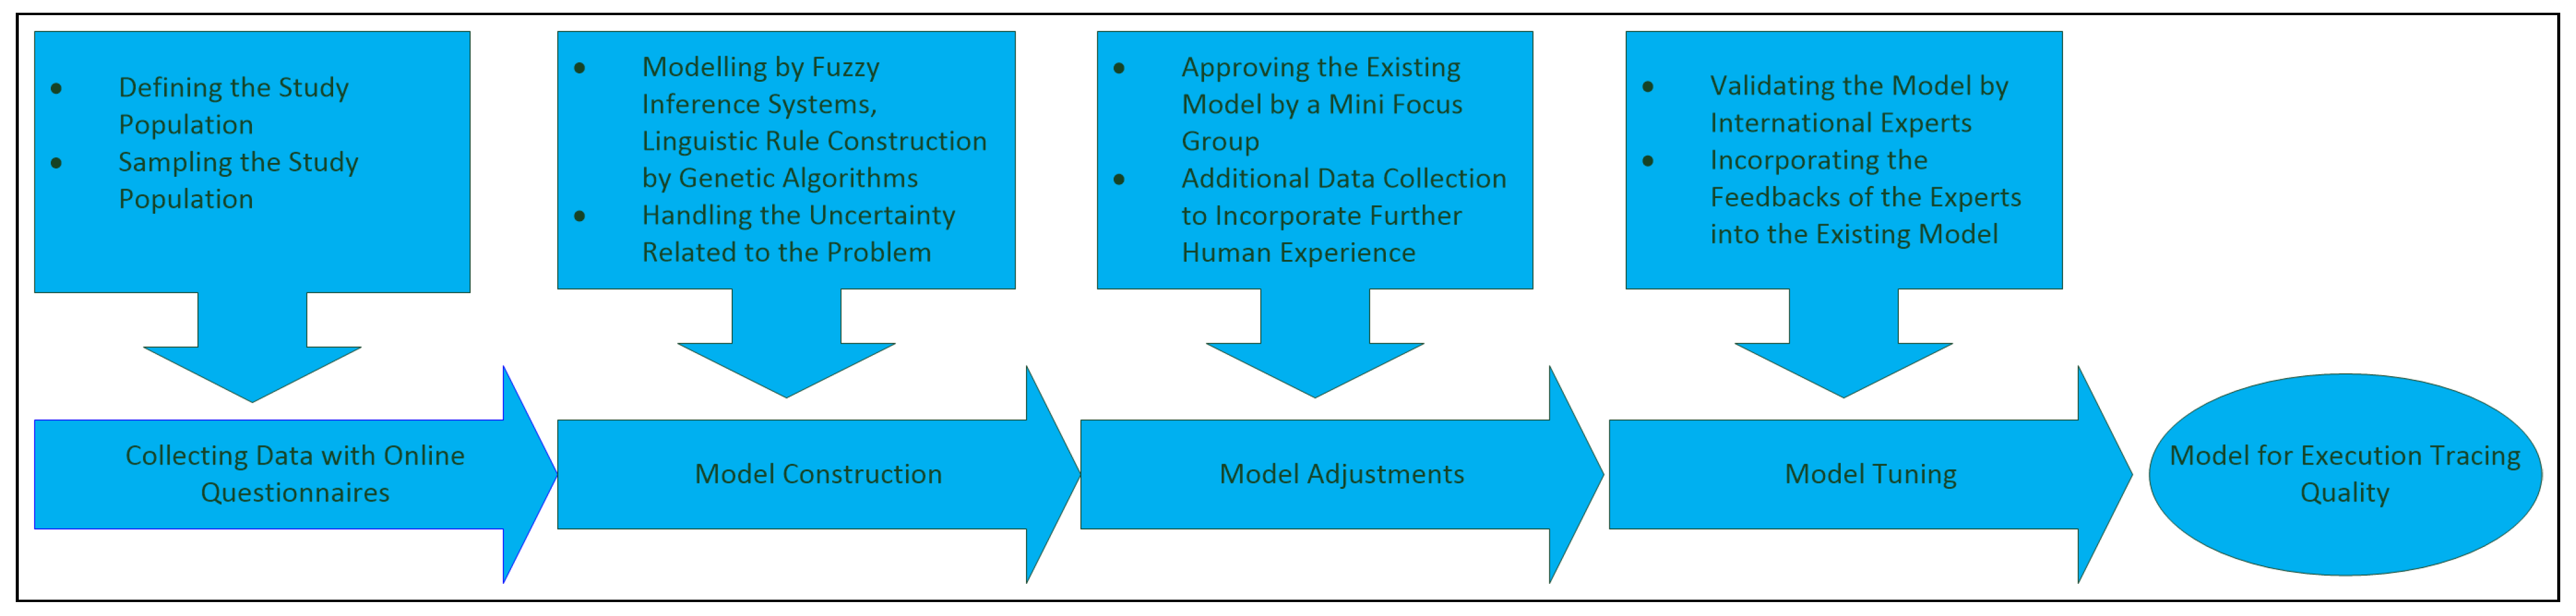
In this section, the research methods are briefly explained, including the data collection, modelling, pre-validation, and validation stages. As the study is empirical, it collects and processes experiences of software professionals accumulated in the IT domain, as illustrated in Figure 1.
Uncertainty and vagueness are inherently present in the software product quality measurement and assessment process as explained in Section 1 and Section 2. In the scope of a pilot study [107], it was tested how the uncertainty and vagueness in the context of execution tracing quality can be approximated in the most appropriate manner. The findings of the pilot study [107] were used in the current research; therefore, an adaptive fuzzy system with overlapping, Gaussian-shaped membership functions at the inputs and with Takagi-Sugeno-Kang inference [23] was selected for modelling.
3.1. Data Collection
The study population was defined as an approachable and geographically localised group of software professionals in Hungary including software developers, software maintainers, and testers, from software companies of the competitive sector, the main activity of which is in the IT service delivery domain (TEAOR ID 620× at the Hungarian Central Statistical Office); furthermore, the employee count of the companies exceeded 1000 people. Many companies may have the TEAOR ID 620× or its sub-IDs beside having a different main TEAOR ID, but only those were included in the study population for whom the main activity belonged to the TEAOR ID 620× or to one of its sub-IDs. Such software houses are usually international software companies with coding guidelines and a company culture that spans across countries, including premises also in Hungary. For this reason, the geographical localisation does not impose an impediment for the generalisability of the study. However, extra measures were taken, as described at the validation stage, to mitigate this risk.
The size of the study population is estimated to be (data originate from August 2017) full-time employees. Multistage random sampling [109,110] was applied to achieve the desired target; i.e., the companies of the study population were sampled, and then the employees of the selected companies were sampled. Random sampling possesses several advantages over stratified sampling [110], but the major advantage in the research context can be characterised by the fact that the different strata do not need to be known in the study population in advance to achieve a trustworthy sample.
Information and consent letters were sent to the management of the chosen companies, and in the case of approval, employees were also selected. Before involvement, each selected employee was informed about the research to be able to give informed and voluntary consent for their participation in the study.
The data were collected through an online questionnaire [28], which was tested by two software professionals before sending it out. Furthermore, the coefficient and Cronbach’s were computed for the collected data. The online questionnaire [28] collected the input variable values—i.e., values for (1) accuracy, (2) legibility, (3) design and implementation, and (4) security—and the corresponding values for the output variable—i.e., for execution tracing quality to produce the data for supervised machine learning. The online survey contained three parts.
Part 1 of the questionnaire [28] introduced eight use cases with a textual description of each use case to provide background information and sample log data. The demonstrated use cases showed different execution tracing mechanisms and trace outputs ranging from poor quality to good quality, where the respondents had to assign a score value in the range of to each use case for the inputs (1) accuracy, (2) legibility, (3) design and implementation, and (4) security; moreover, they assigned a score for the output: execution tracing quality. Necessary variable definitions were provided for the respondents. Altogether, 40 questions were contained in this part of the survey.
Part 2 of the questionnaire [28] collected data about the quality of logging in two real projects to which the respondents were assigned in the past. In addition to the input variables and the output variable given above, the software professionals had to answer a question about the type of the application: (1) server application, (2) desktop application, (3) web UI, (4) mobile application, or (5) embedded application. Altogether, 12 questions were contained in this part.
Part 3 of the questionnaire [28] introduced extreme input variable value combinations for (1) accuracy, (2) legibility, (3) design and implementation, and (4) security, which might not be frequent in real-life but which need also to be considered by the model construction. The respondents had to assign an output variable value—i.e., execution tracing quality—to each listed combination of inputs. This part of the survey contained 23 questions altogether.
Two further questions were also included in the questionnaire [28] about the professional background of participants and about the opinion of the respondents on whether the type of the application—(1) server application, (2) desktop application, (3) web UI, (4) mobile application, or (5) embedded application—had an influence on the responses to the questions in the survey.
3.2. Data Processing, Exploratory Data Analysis, and Modelling
After concluding the data collection stage, the data were cleaned—i.e., checked for valid responses—and the distribution of the data was analysed, exploratory data analysis was carried out, outliers were removed, and the confidence intervals were determined. The variable with the worst—i.e., the largest—confidence interval was considered; moreover, with regard to the confidence interval and to the statistical reliability of the sample, the model validation was designed. The collected data were reshaped to achieve the format necessary for machine learning, and the data were randomly split into a training and a checking set. The training set was used to fit the model to the data, while the checking set was used to test the training process and to avoid overfitting. Constructing the quality model was accomplished by an adaptive fuzzy system, in which genetic algorithms provided the learning capability [27]. The performance of the constructed model was verified by a different machine learning approach: ANFIS [24,25].
3.3. Model Adjustment and Pre-Validation
The created fuzzy systems with different numbers of linguistic rules were reviewed by a mini focus group containing three software professionals with many years of experience in industrial and academic settings. The optimal model was selected, adjusted, and checked for validity.
3.4. Model Validation
The data used for model validation were collected by a second online questionnaire [28]. The responses stemmed from selected international experts located in different countries, including Austria, Germany, and Hungary (countries are listed in alphabetic order). The questionnaire [28] contained the linguistic variables and the model in the form of linguistic rules; moreover, the impacts of the model’s pairwise inputs in the output were also depicted in charts. The experts were asked to check the model and its fit and the model’s responses to the changes in the inputs through an online meeting if necessary. In addition, the authors also validated the model prepared by face validity. Thus, the UK was also represented in the list of countries of origin of the experts to perform the validation. The model was tuned according to the responses of the experts. Consequently, the risk of geographical localisation in the course of the data collection from international companies was mitigated.
4. Results
4.1. Data Collection
The employee count of the software companies which declared themselves to be ready to participate in the study amounted to approximately 6000 people. Thus, the first stage of sampling covered nearly 50% of the study population. The goal was to achieve a completely random sample from the companies involved, possibly selecting individuals randomly from the register and then contacting them, but this was practically infeasible. Thus, all the employees of selected areas at the selected companies received an email notification with information and with the link to the online questionnaire [28] to fill in. The individuals of the selected areas of the selected companies showed low response rates, which might have been caused by the long and complex questionnaire [28]. Overall, 41 software professionals filled in the survey, which had three parts with 77 questions in total.
The reliability indicators, coefficient, and Cronbach’s in Table 3 were computed for each separate part of the questionnaire [28] after removing the rows with NA values and removing the outliers as discussed in Section 4.2.
The extreme high reliability indicator values for the use cases might have been caused by the repeating questions, which are valid in the context of the present research as each use case represents a different setting, where the respondents rated the corresponding input and output variable values.
4.2. Data Processing and Exploratory Data Analysis
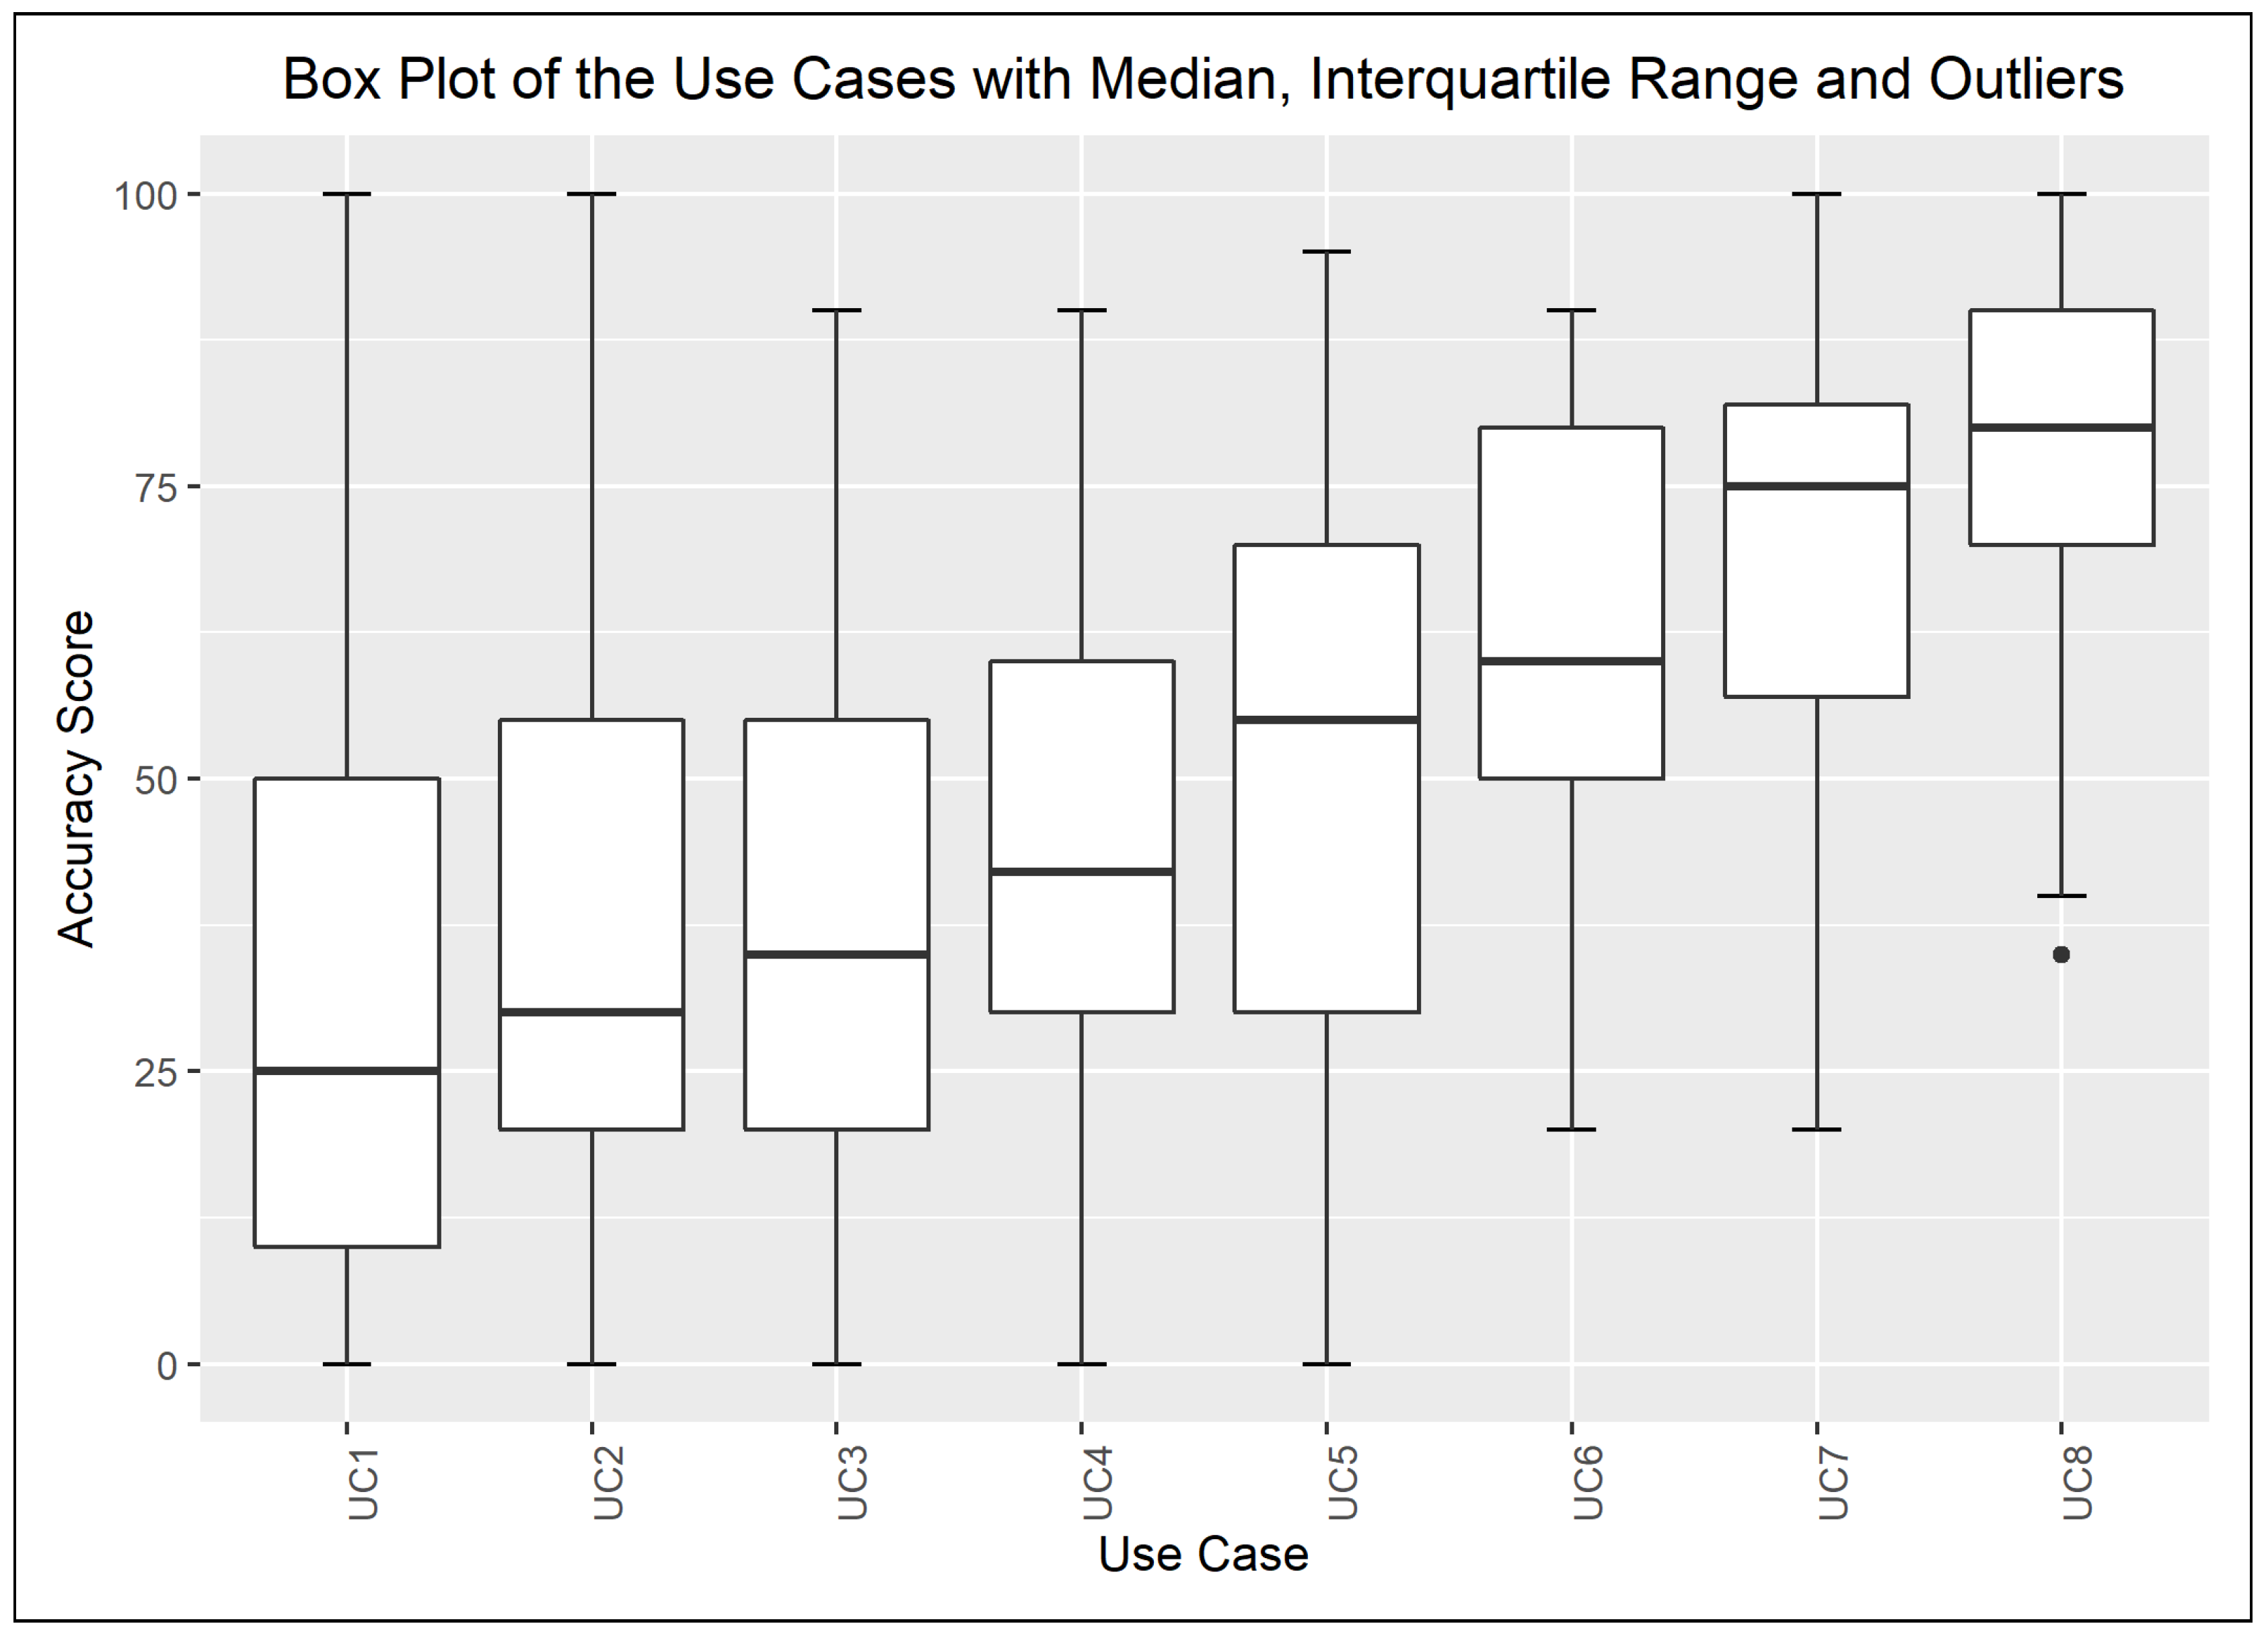
The data collected were examined for each question answered, and the responses were depicted in box plots to see the dispersion and the outliers. The questions in part 2 of the survey constituted an exception from the outlier detection as each respondent could think of a different project in the past, leading to valid input–output data pairs from the point of view of the data collection, but they did not necessarily come from the same probability distribution.
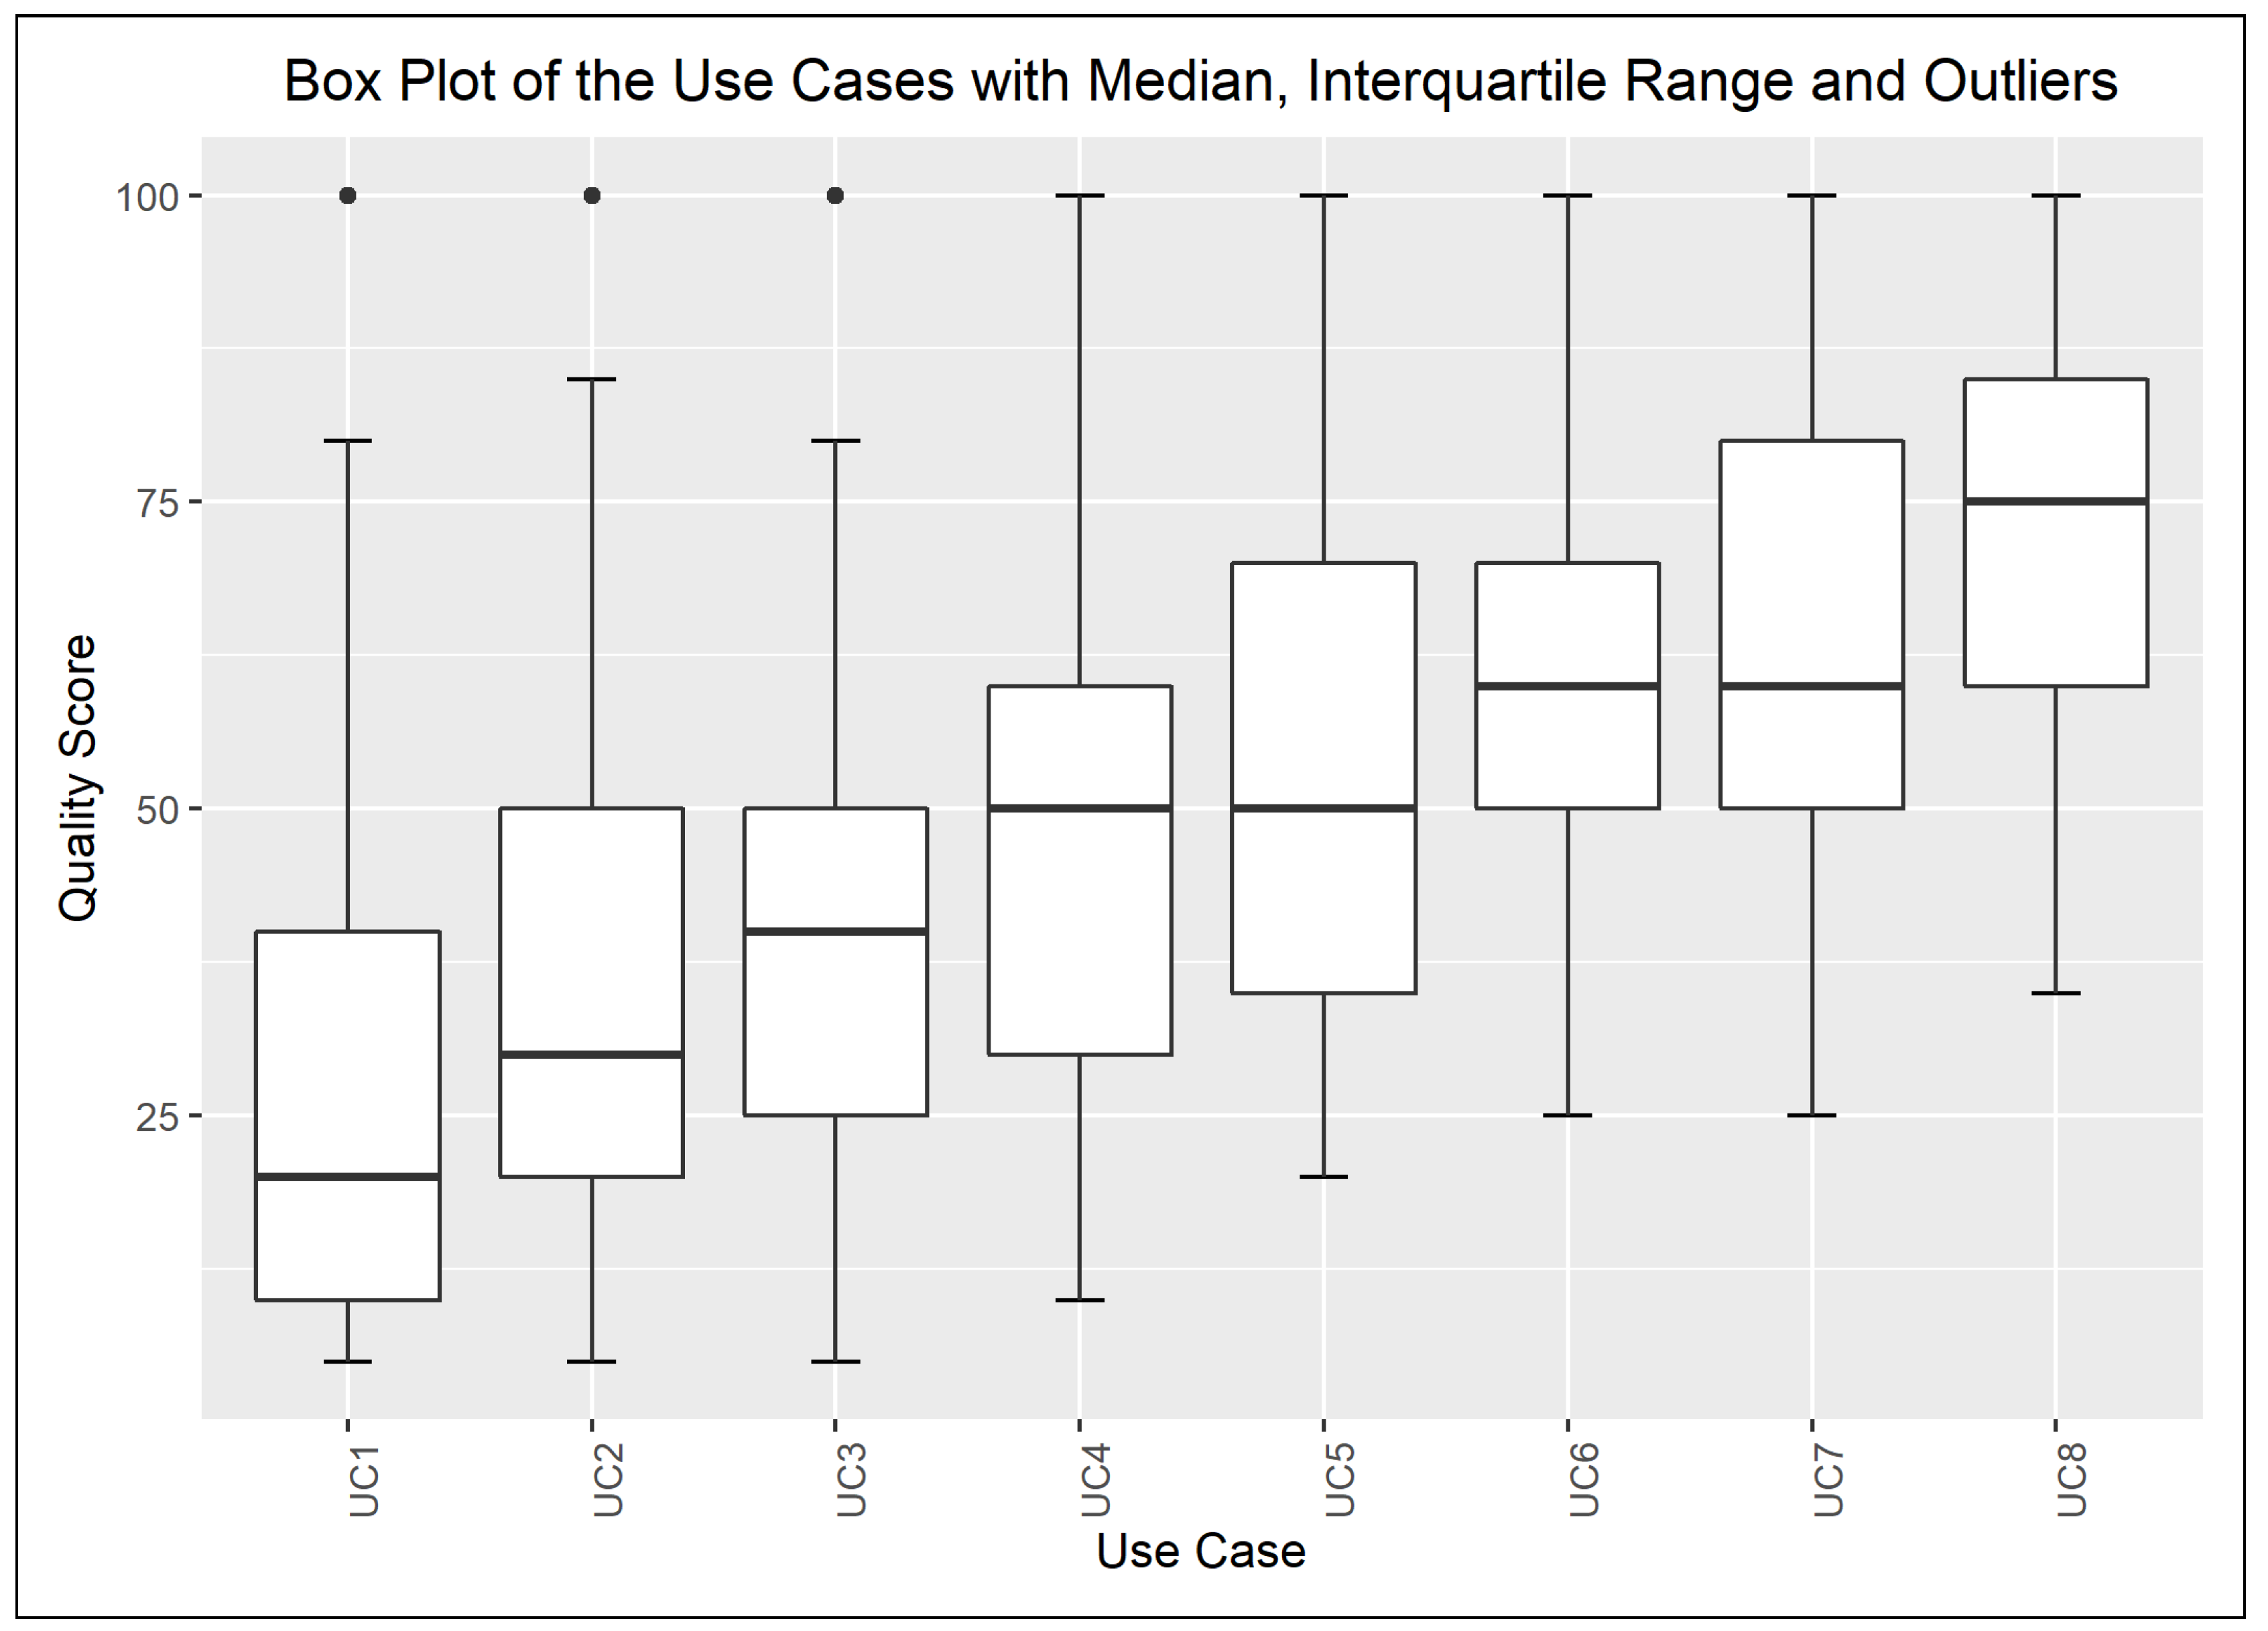
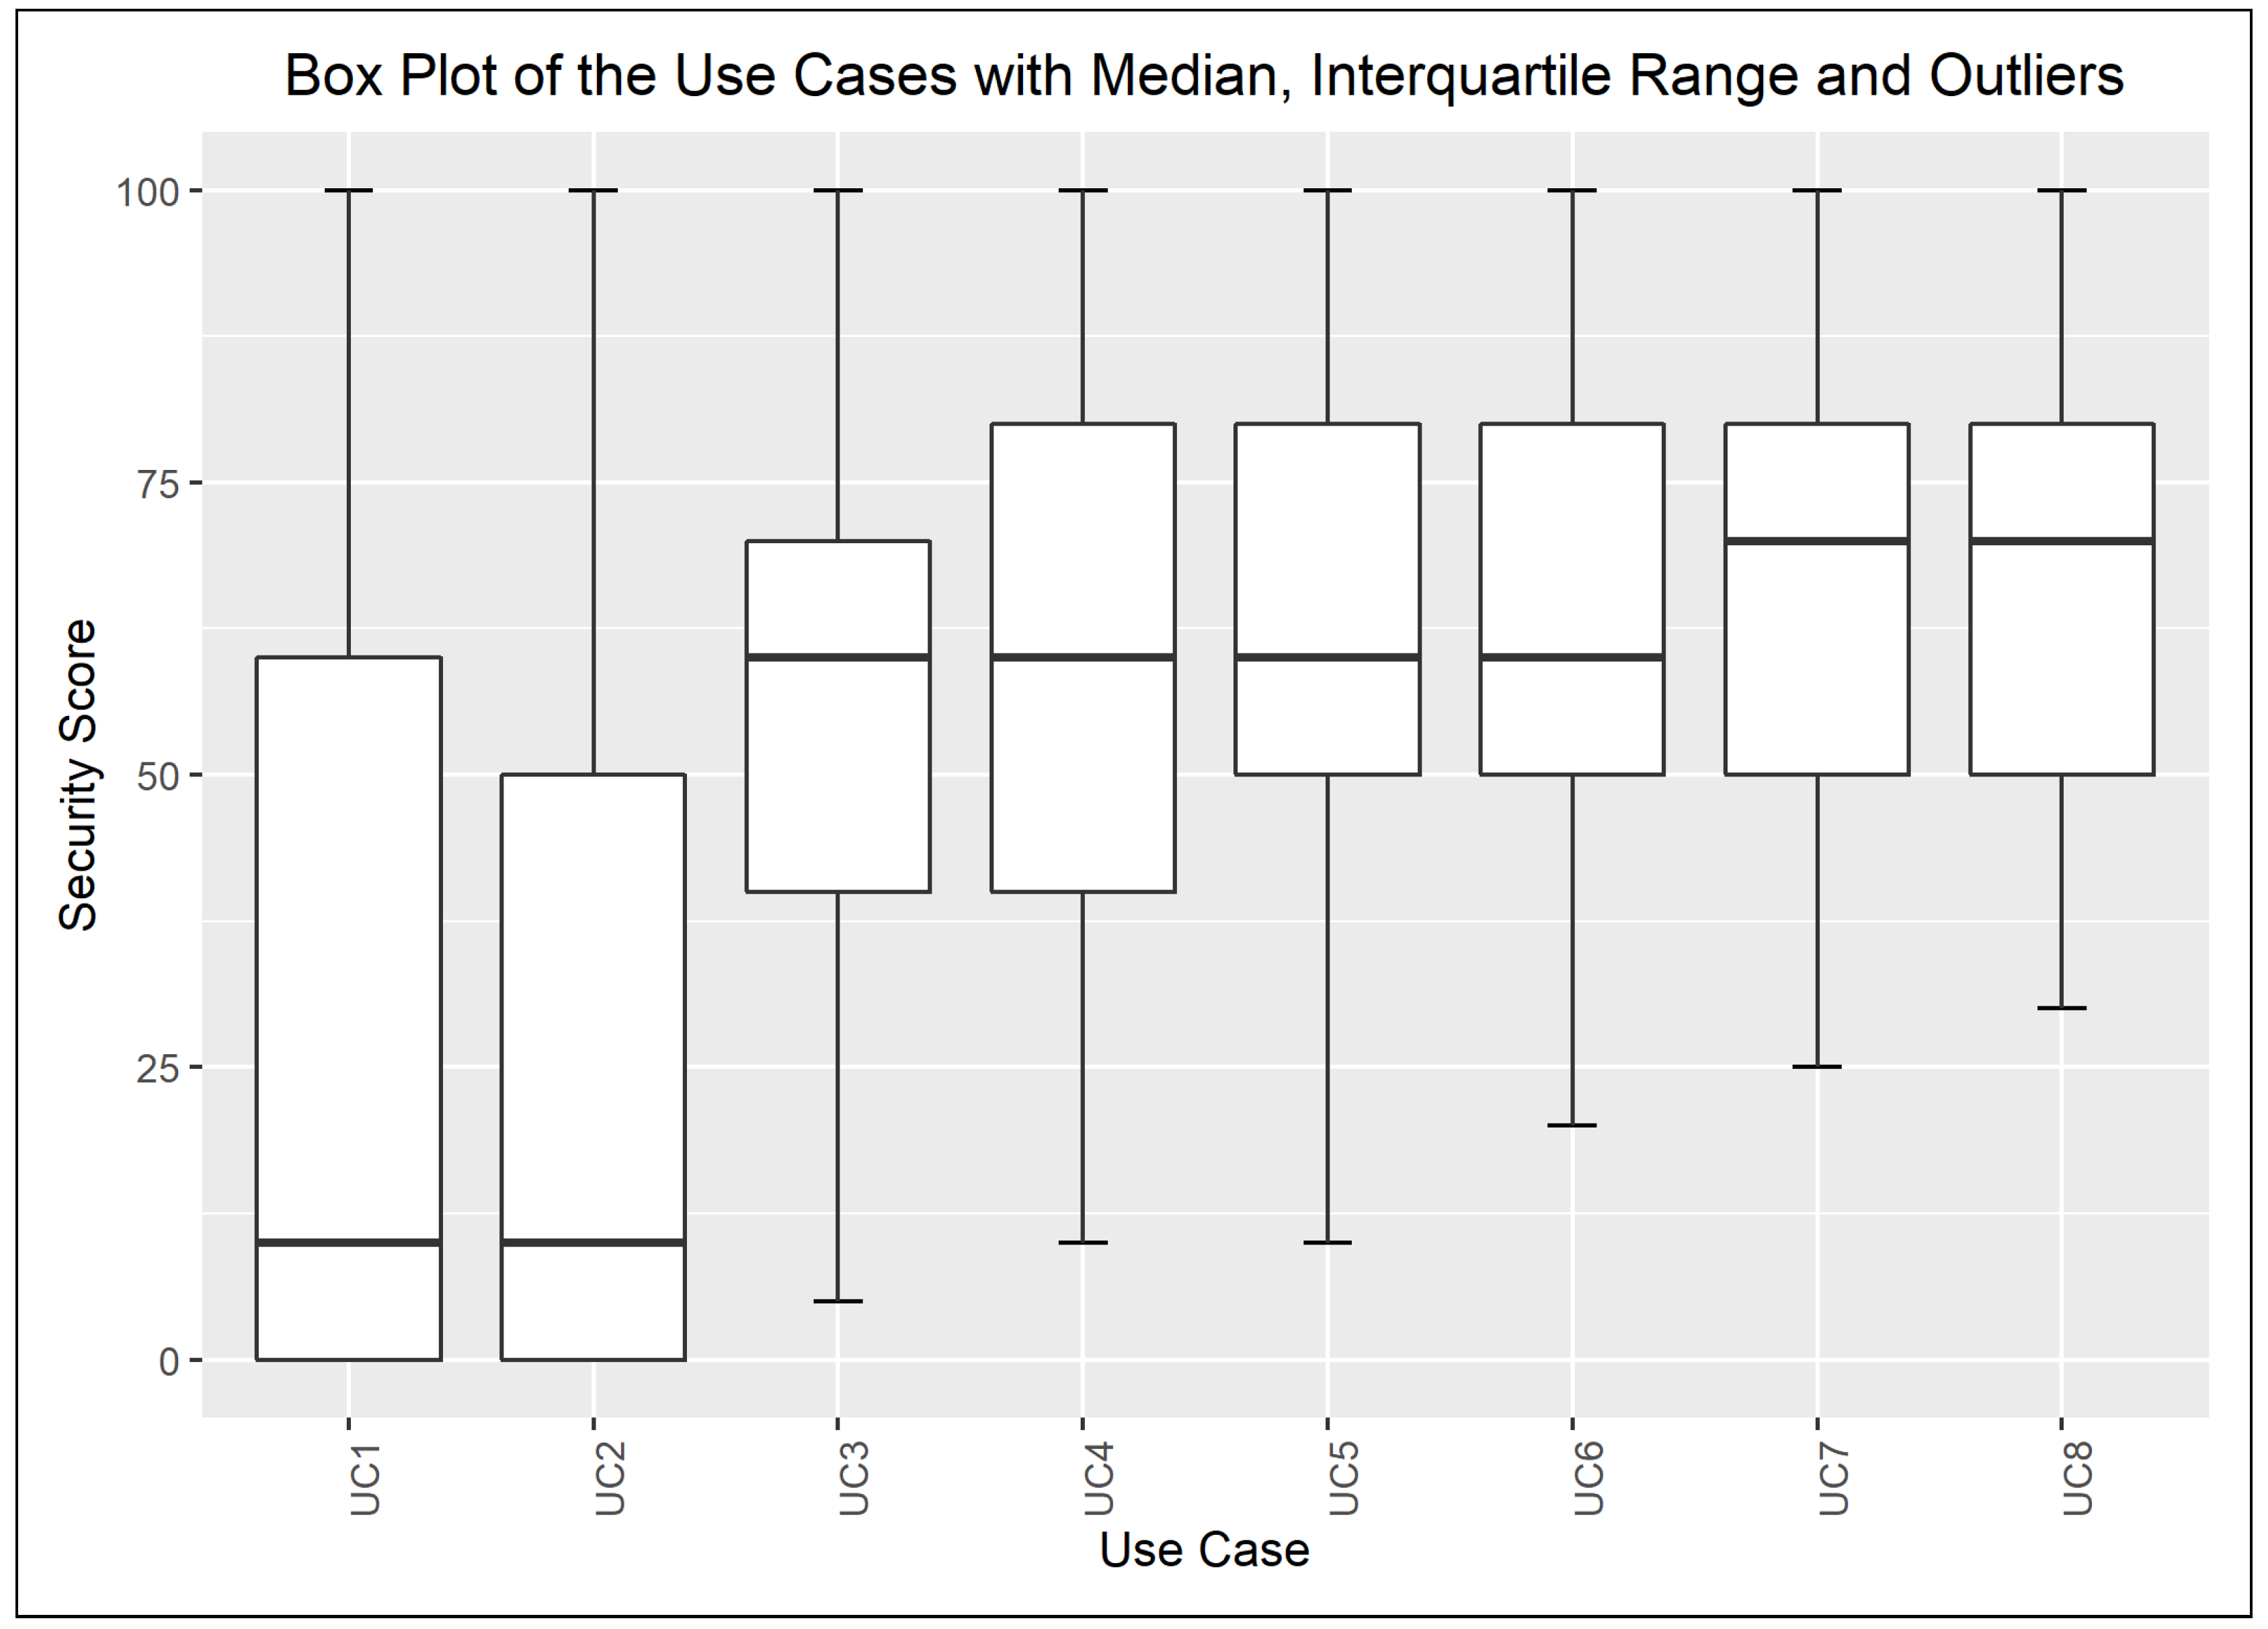
The box plots depict the Q1 and Q3 quartiles with a box, which is called the interquartile range; i.e., 50% of the data fall into this range. The median is shown by the middle bold line in each box, while the outliers are highlighted with dots over the whiskers. The distance of the whiskers (W) from the Q1 and Q3 quartiles is computed by 1.5 times the interquartile range. If the exact W value computed is not present in the data set, then the whiskers are placed to the closest value towards the median.
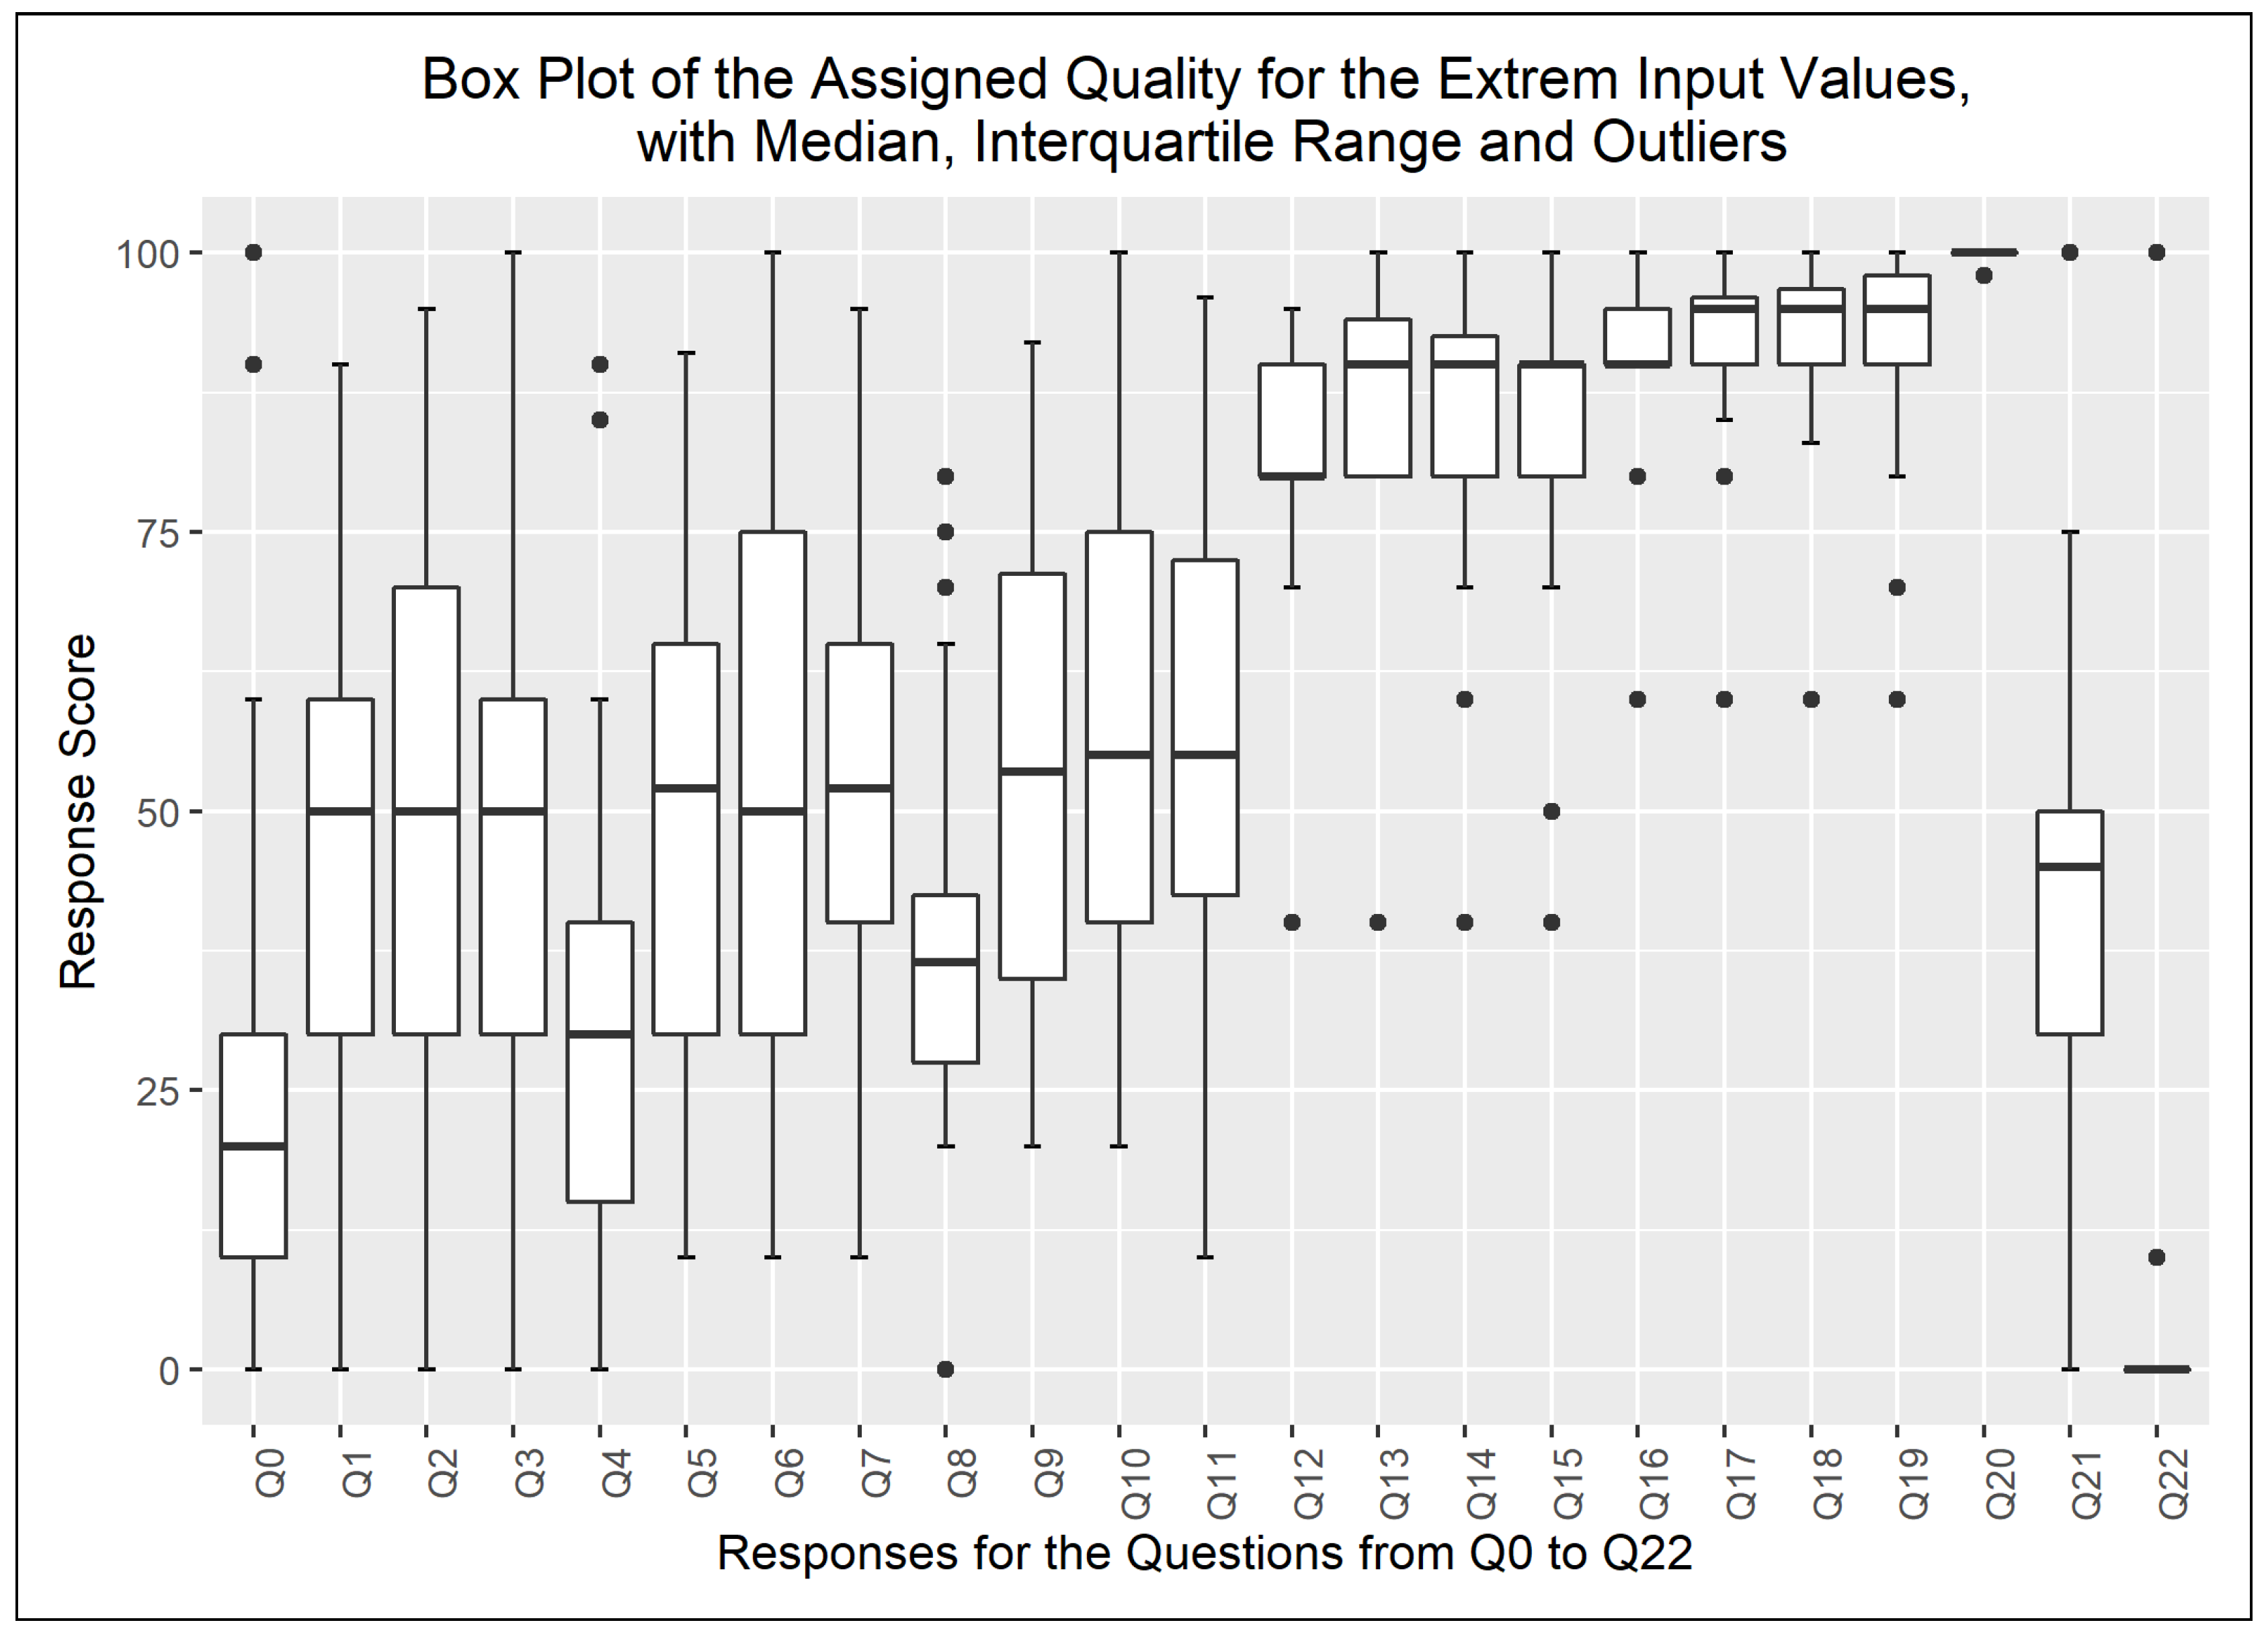
The chart on Figure 2 illustrates the dispersion of the assigned quality scores—i.e., the output values—of the defined use cases. An upwards trend in the median value can be observed, which mirrors the description of the use cases and the quality of the log excerpts rated by the respondents. The box plots of the input variable values are given in Appendix A and depicted in the charts of Figure A1, Figure A2, Figure A3 and Figure A4. In addition, Figure 3 highlights the Q1, Q3, and median values of the quality scores assigned to the combination of the extreme input values.
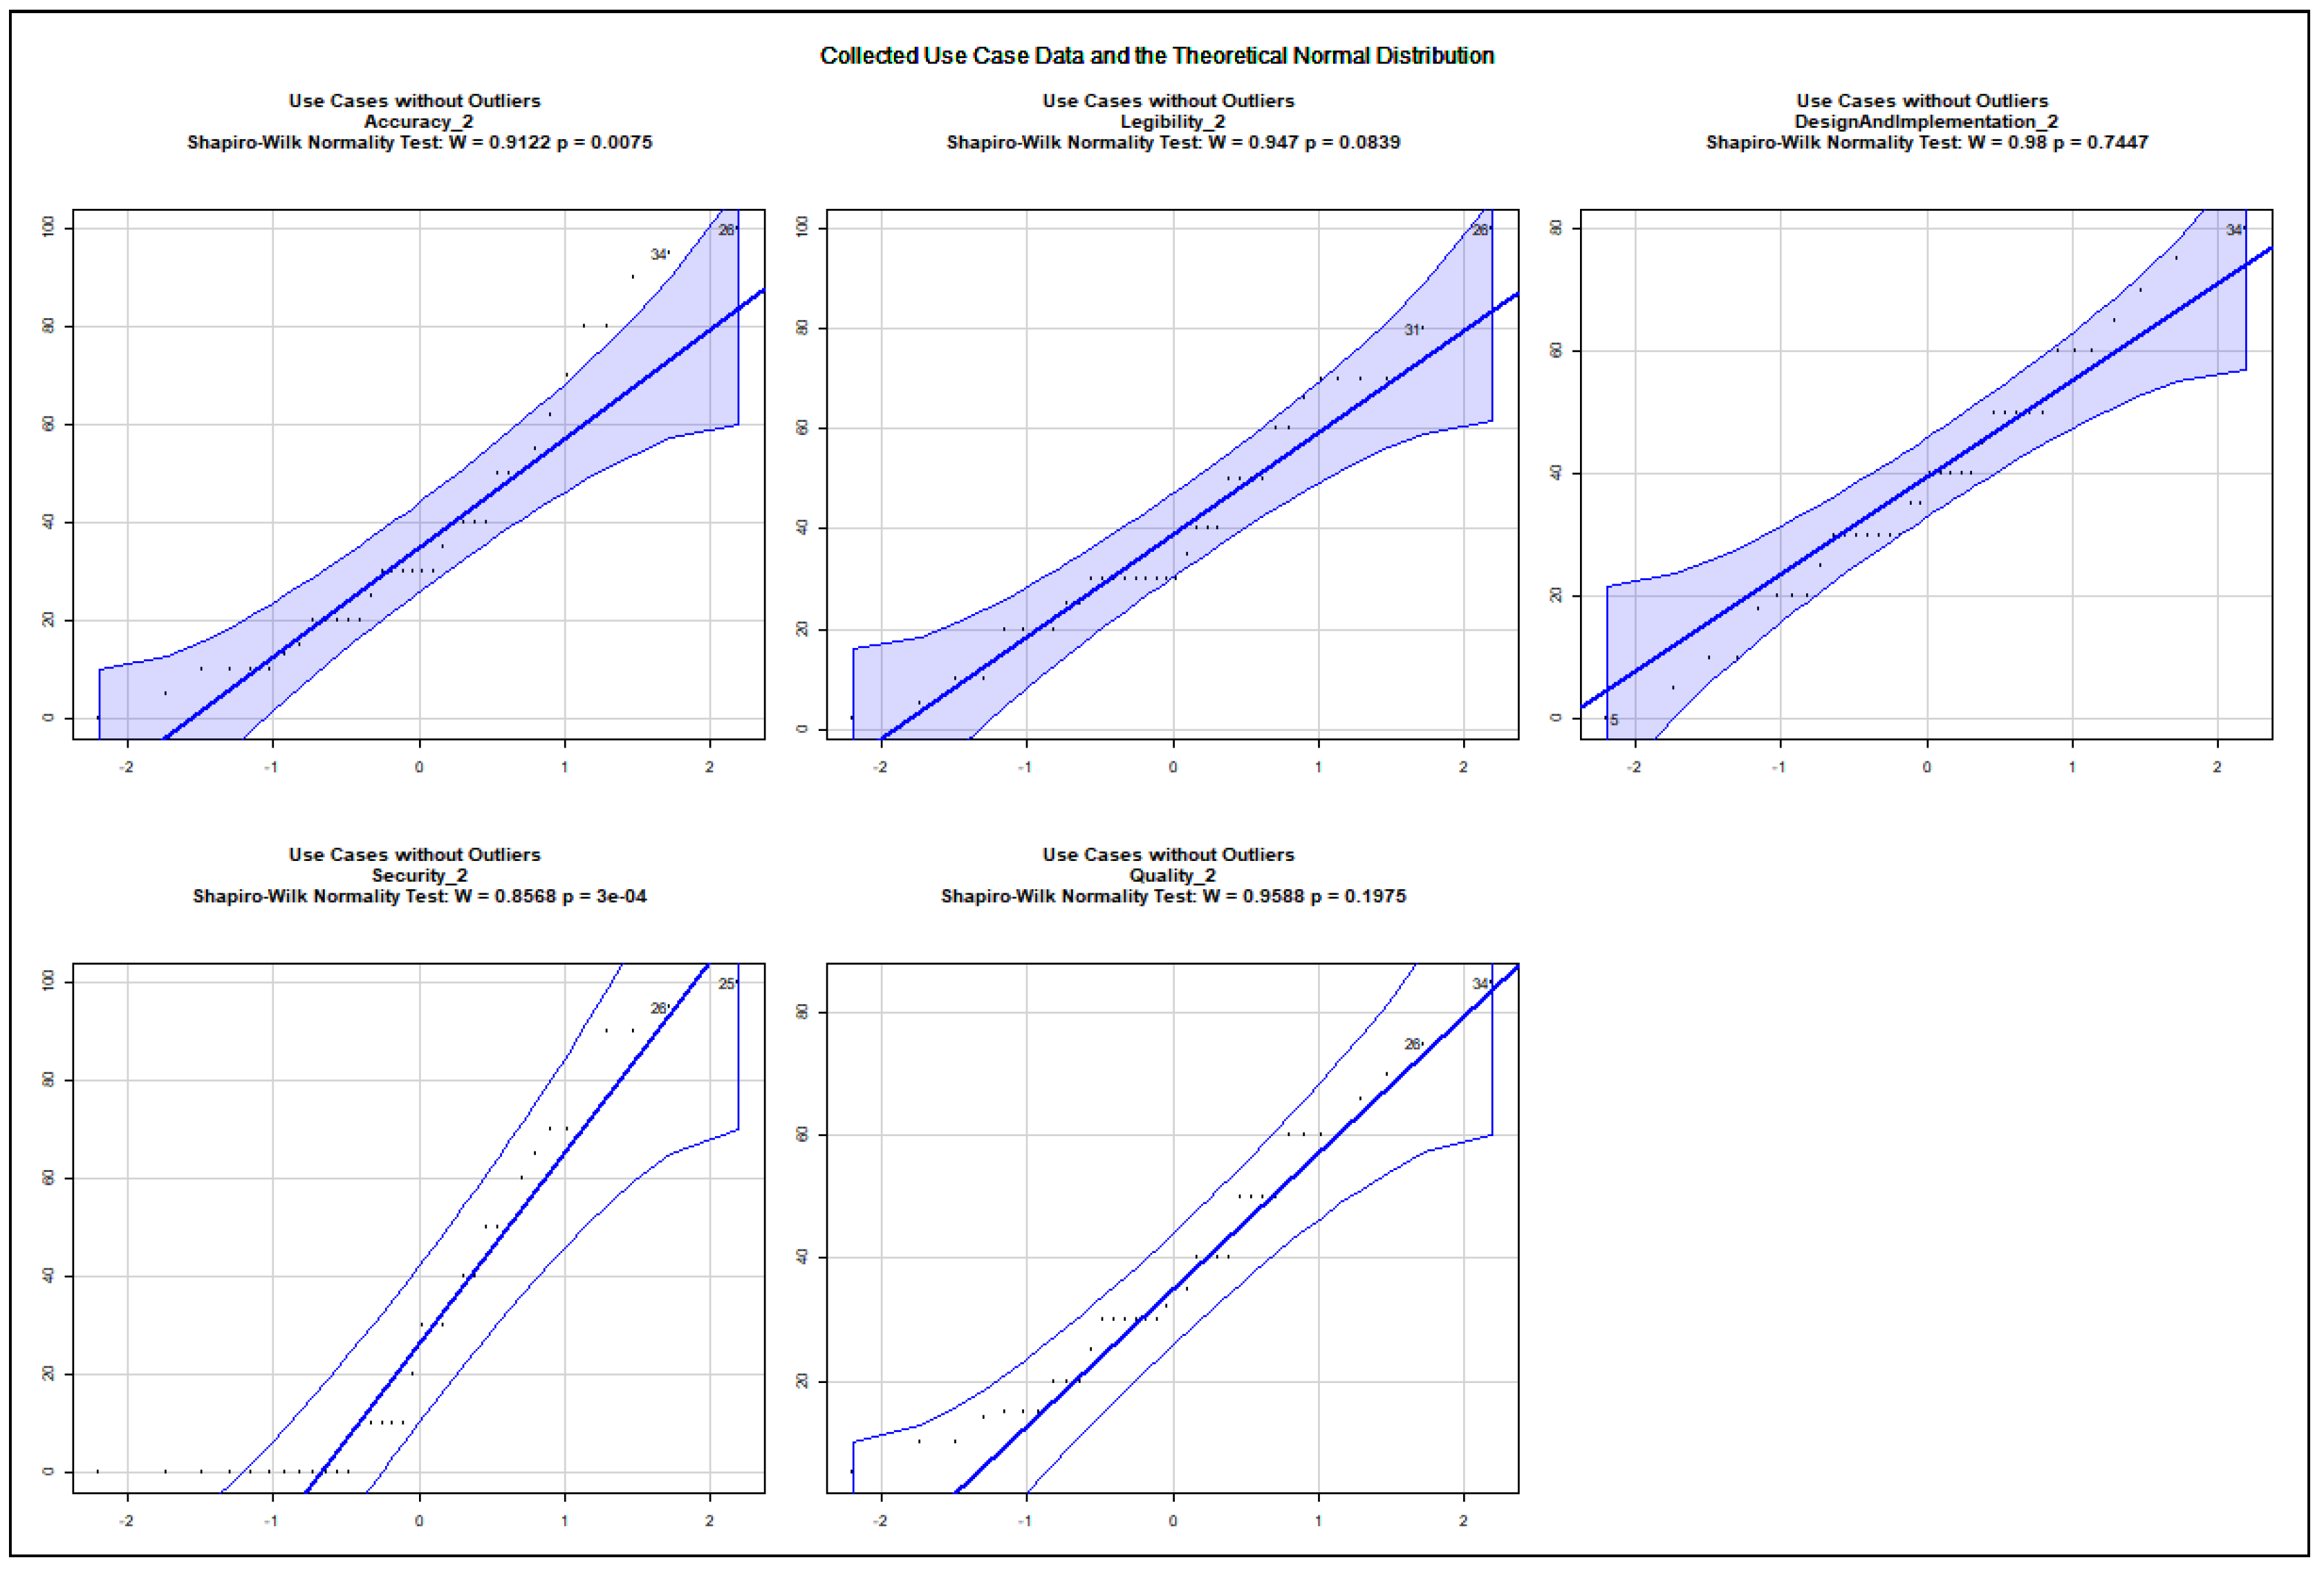
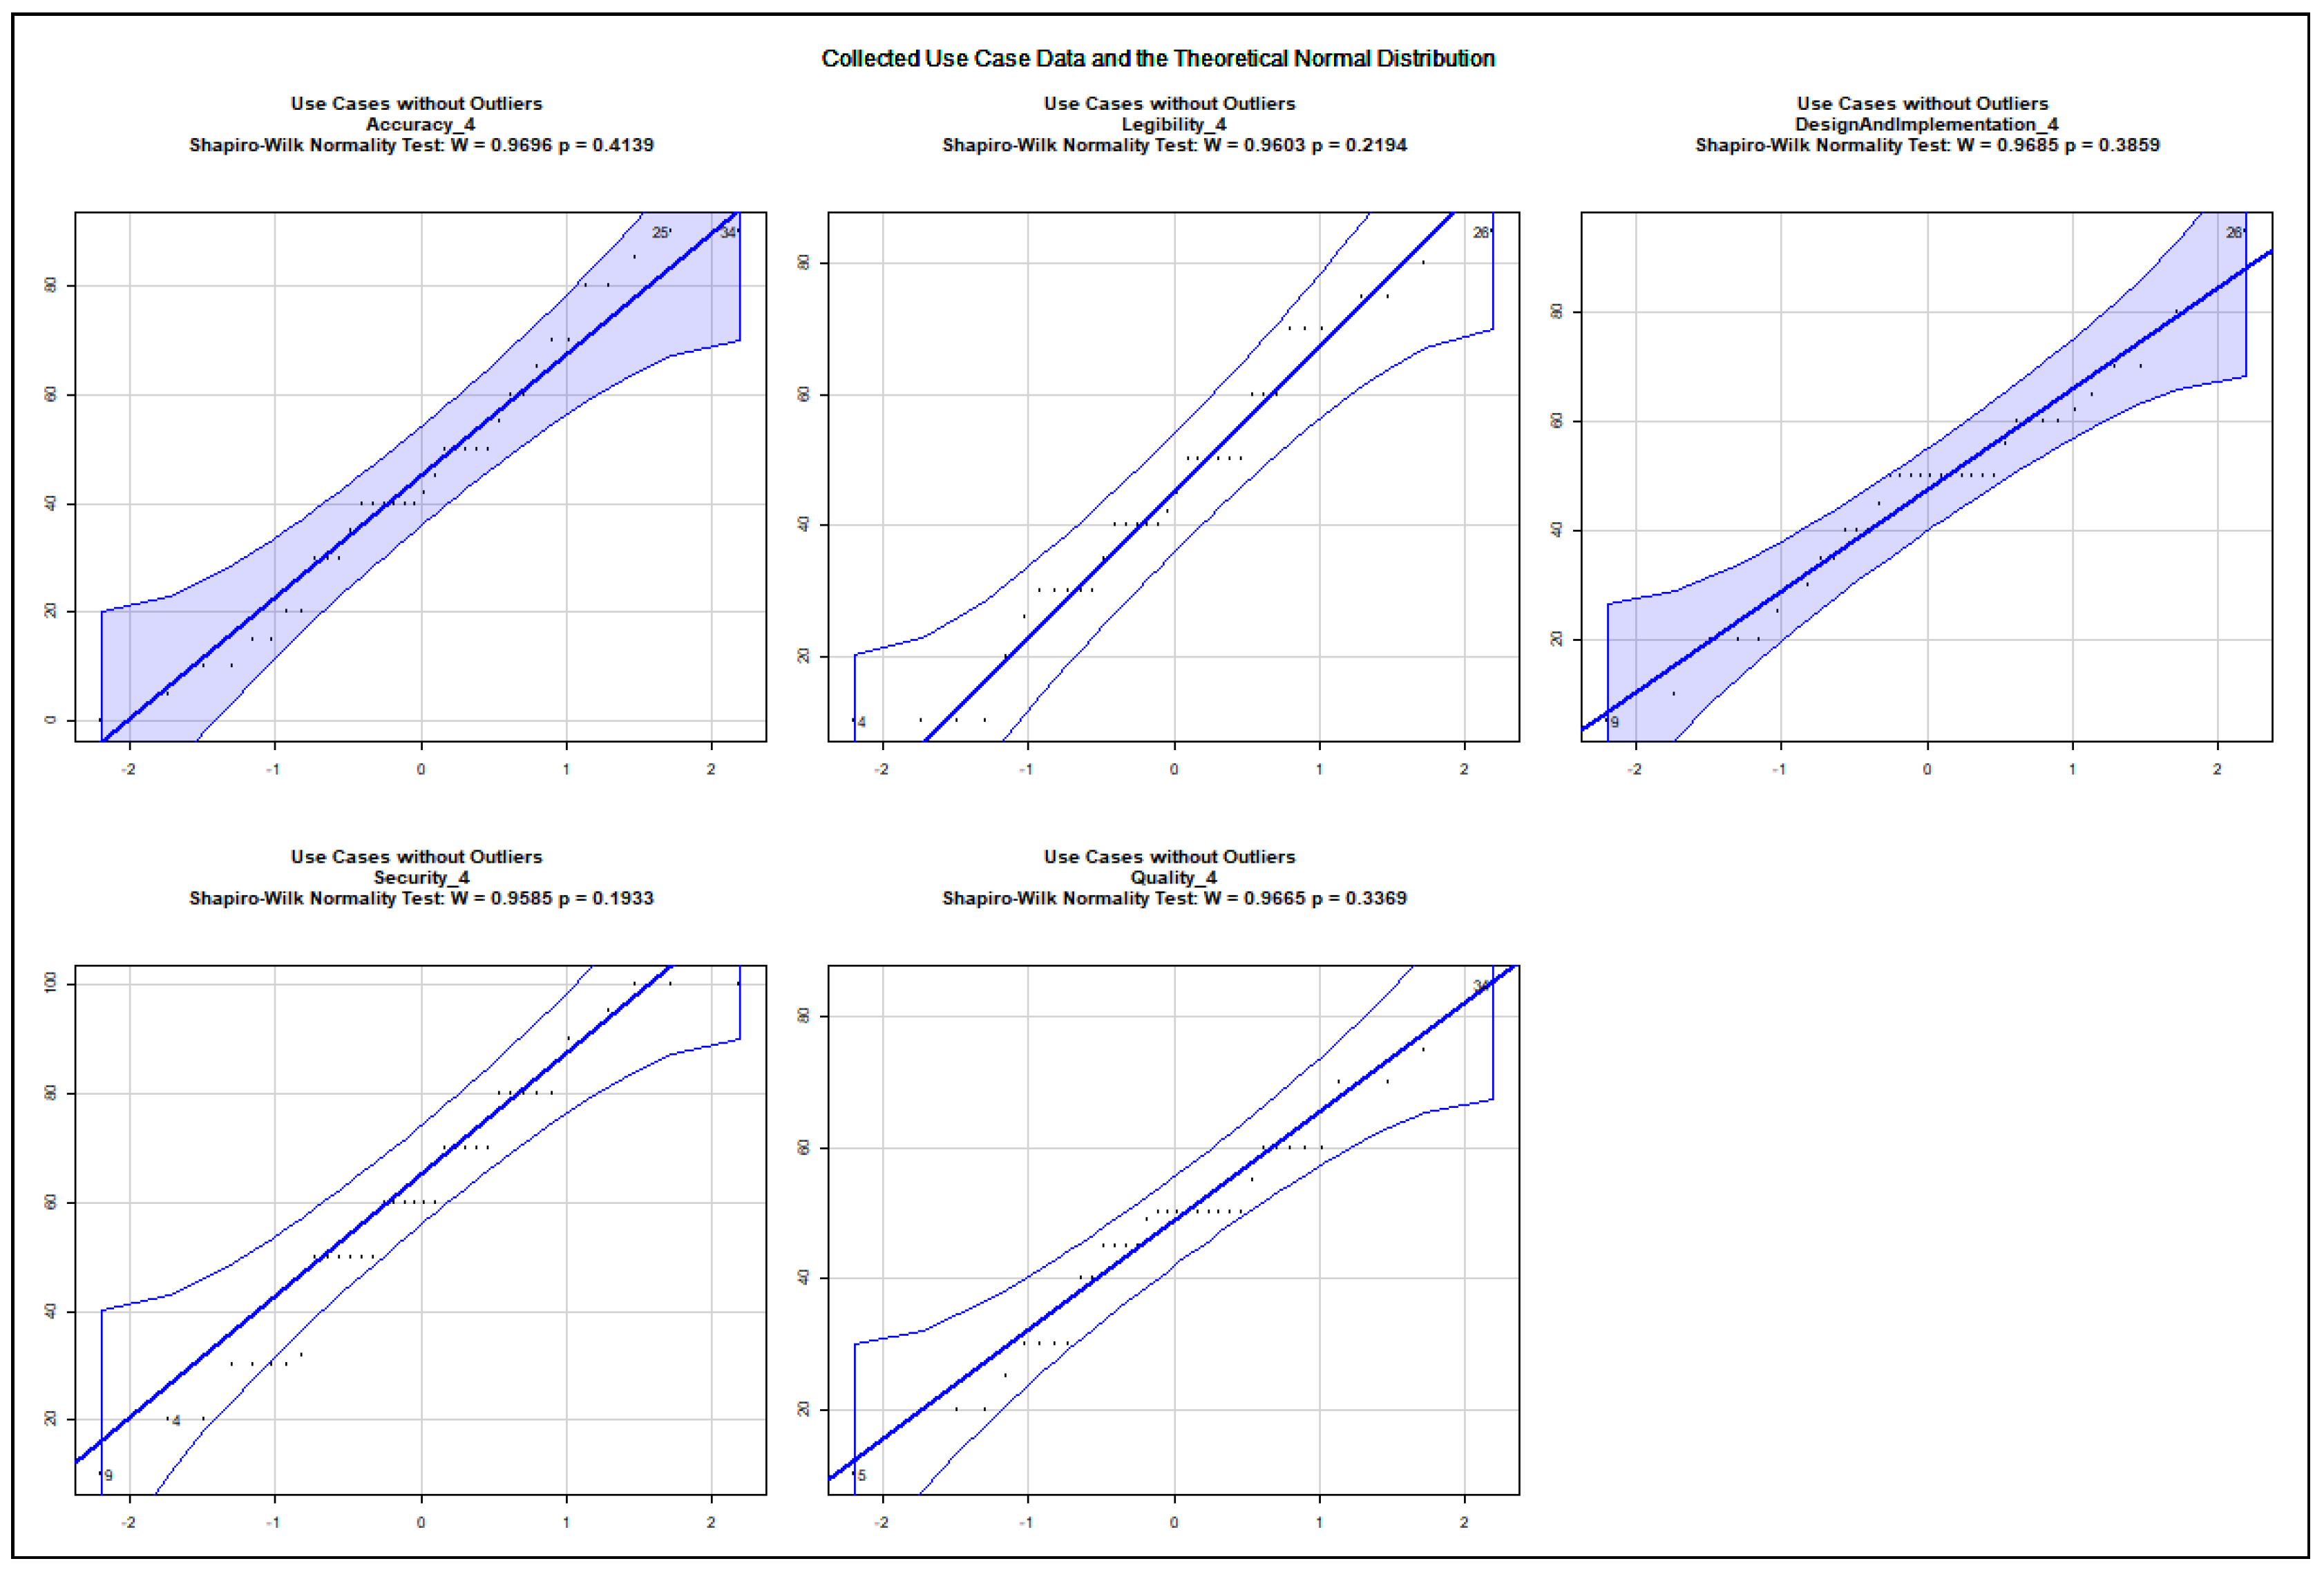
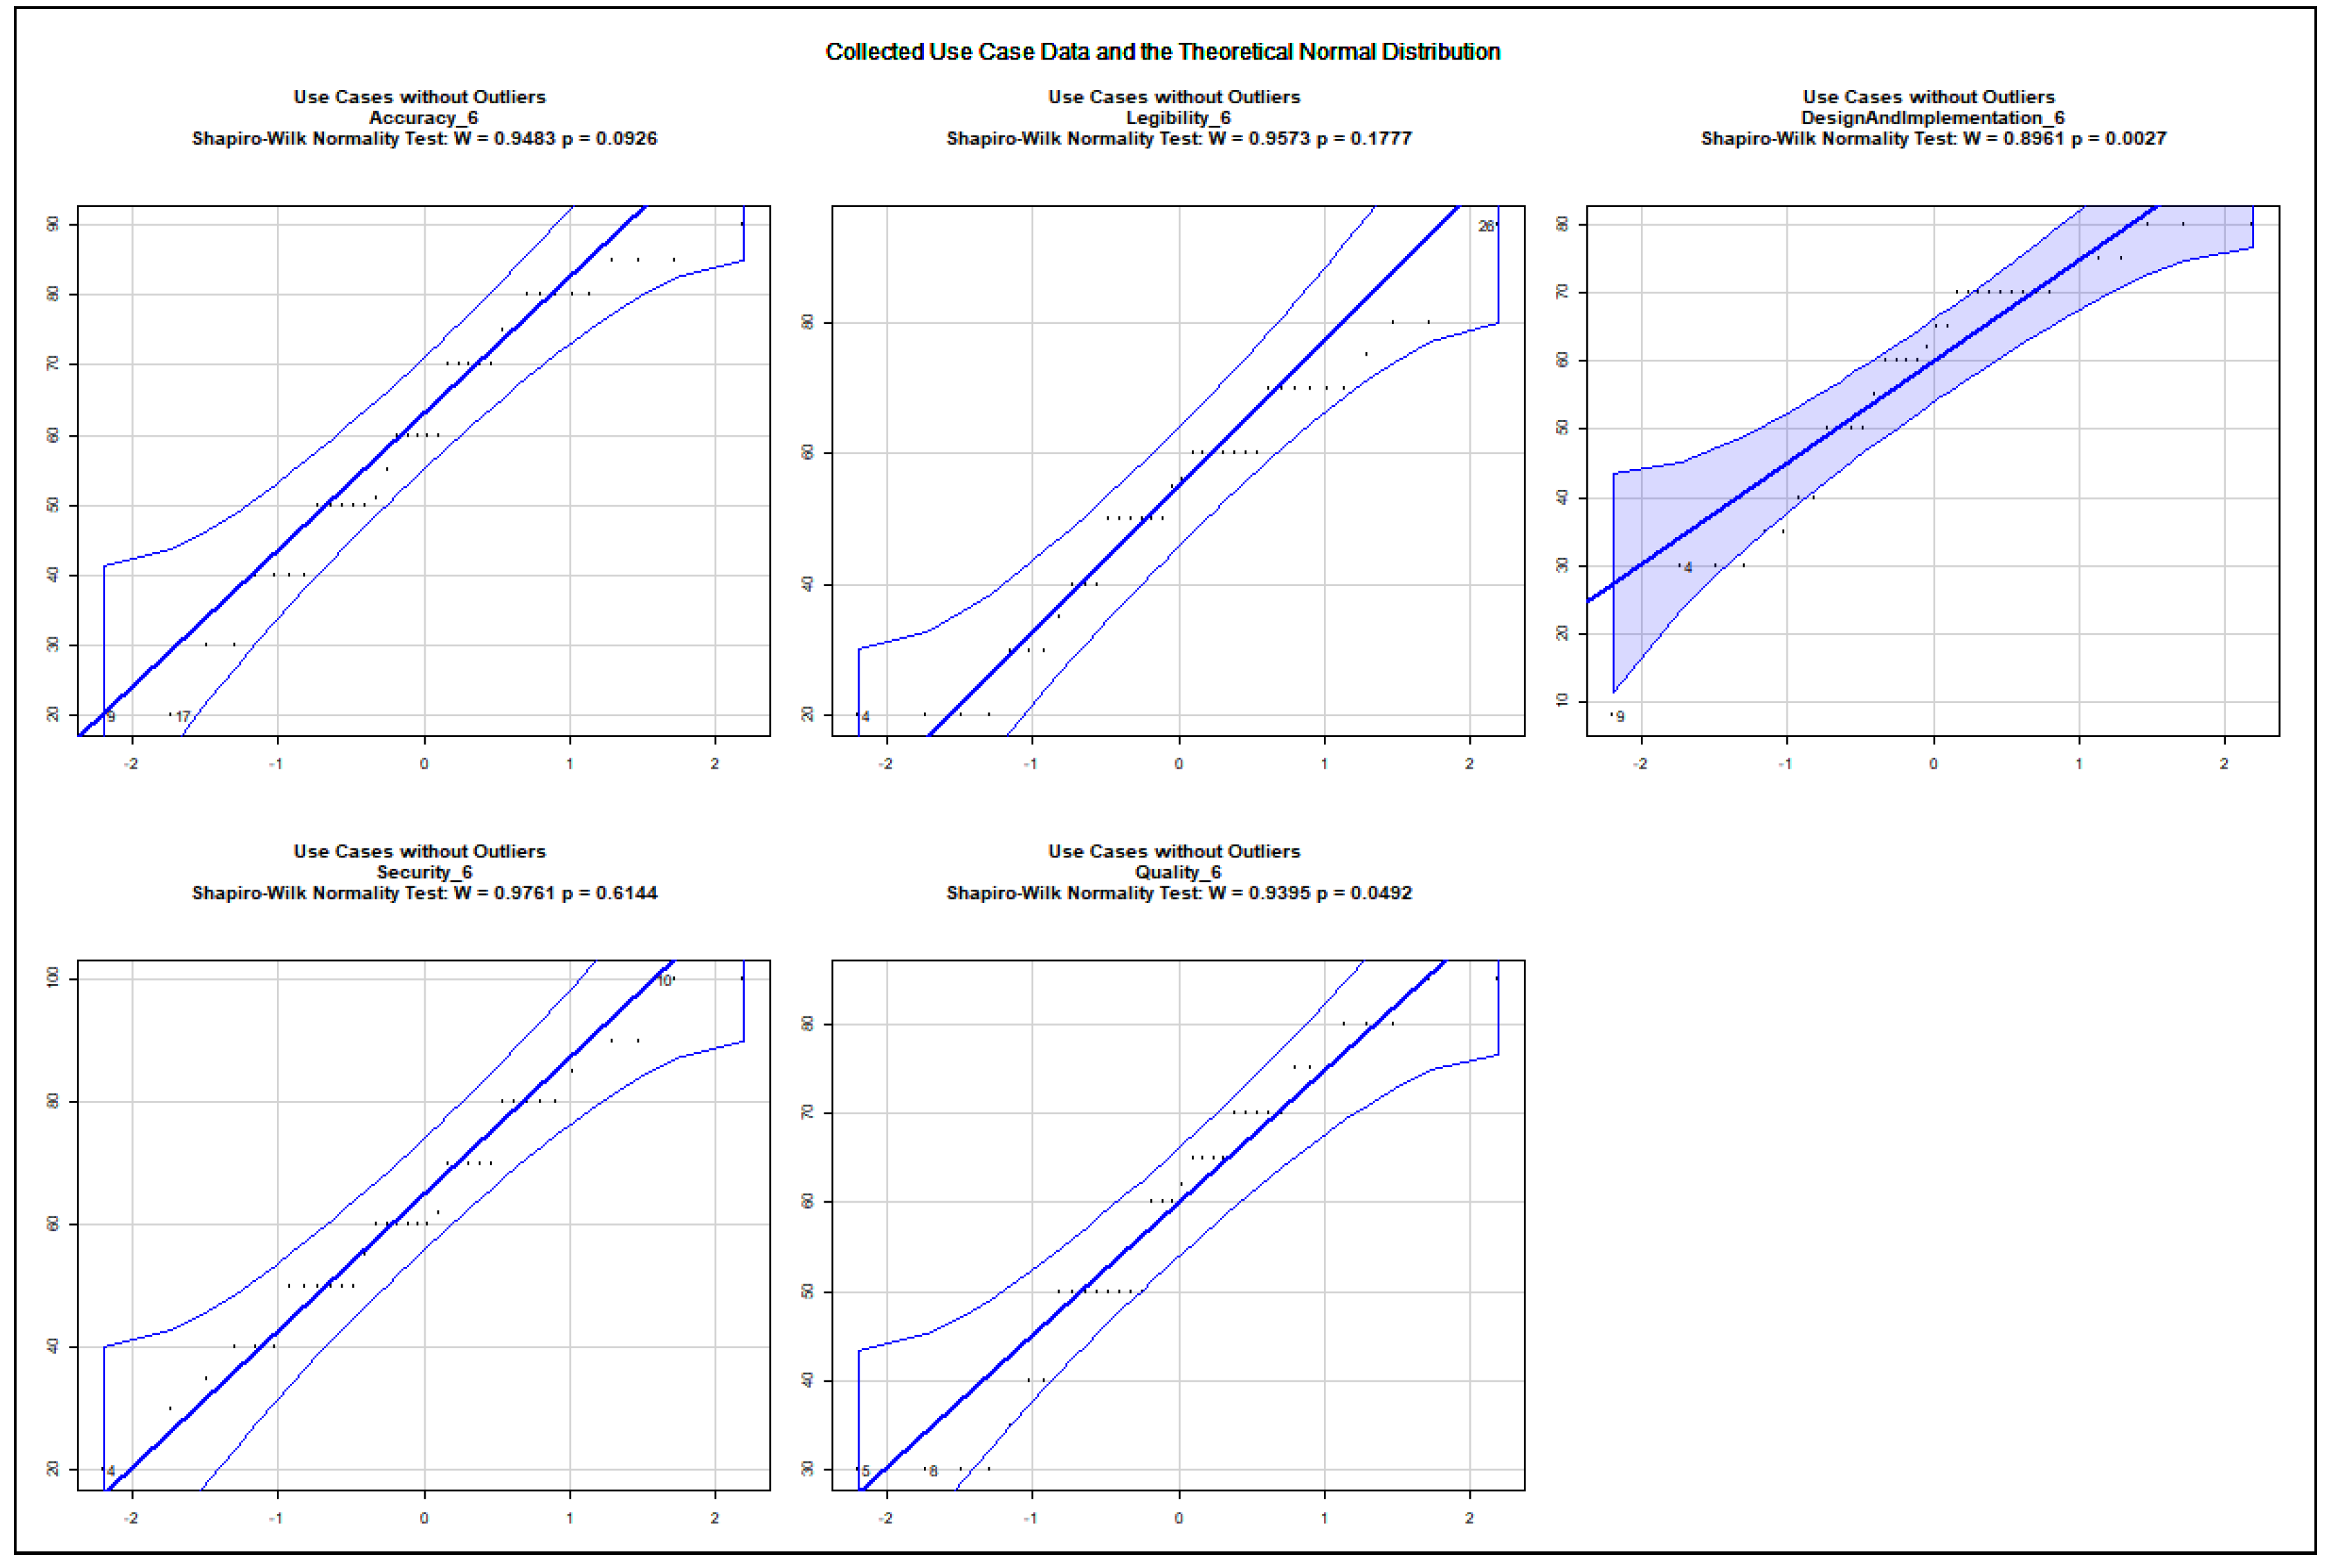
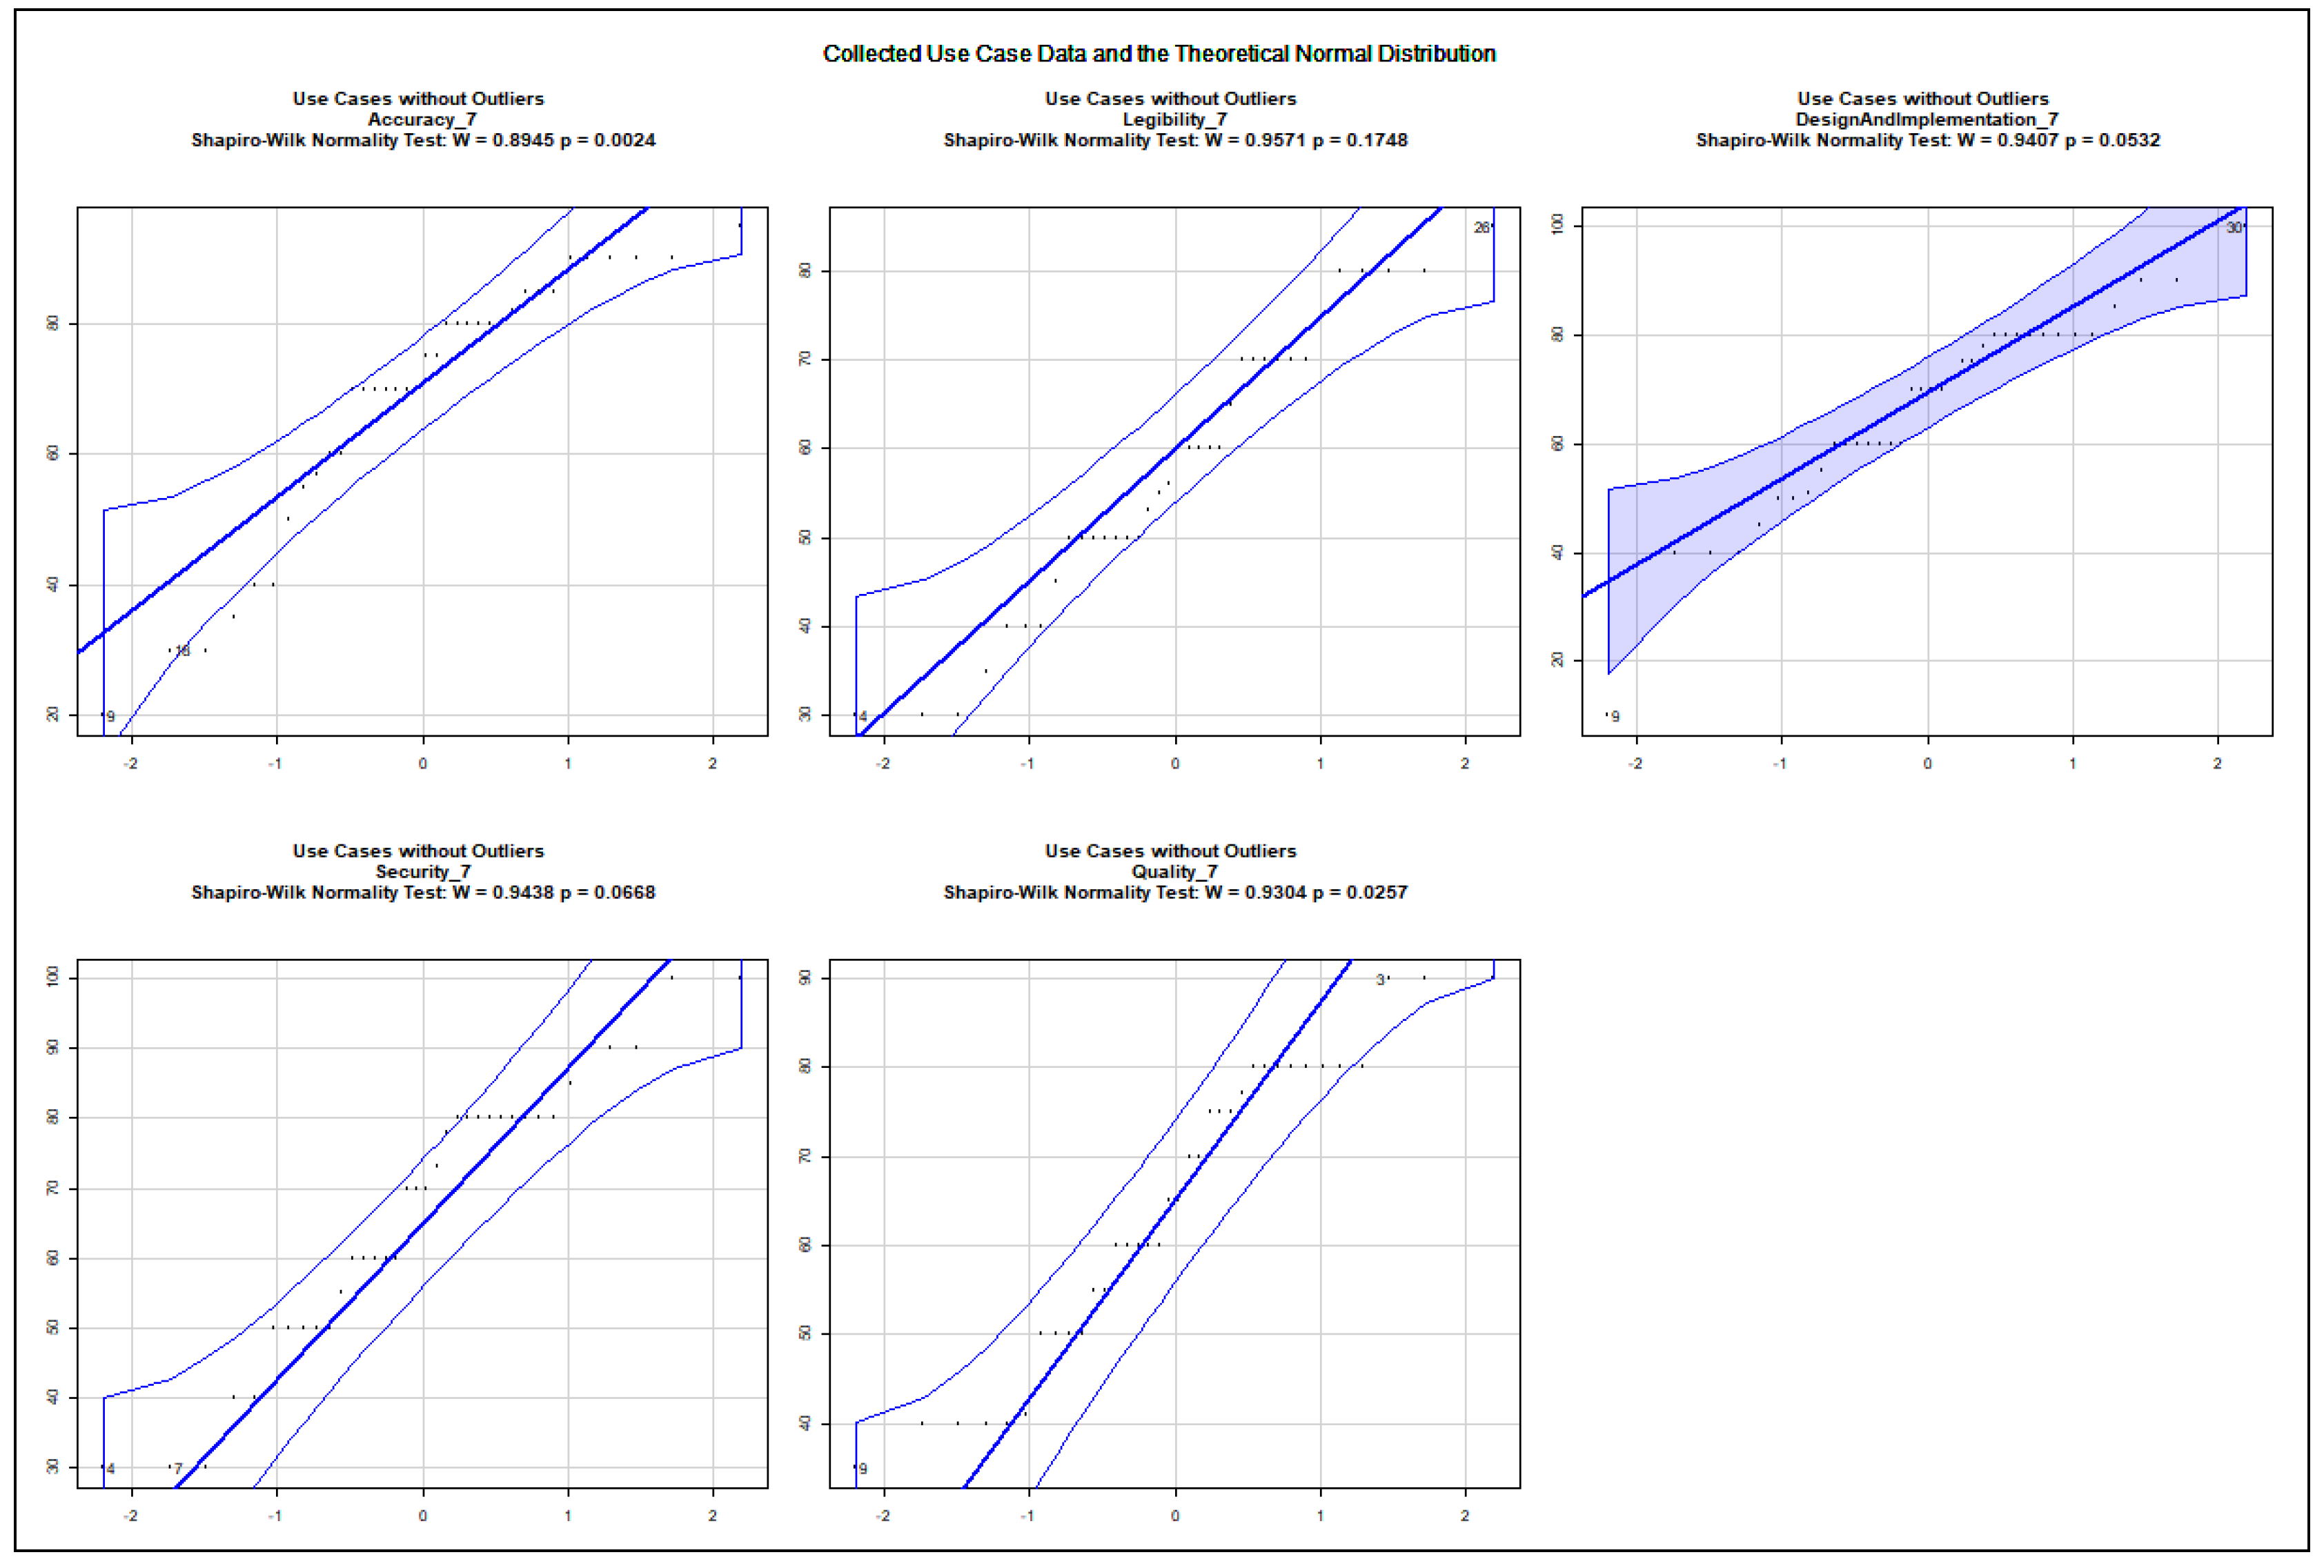
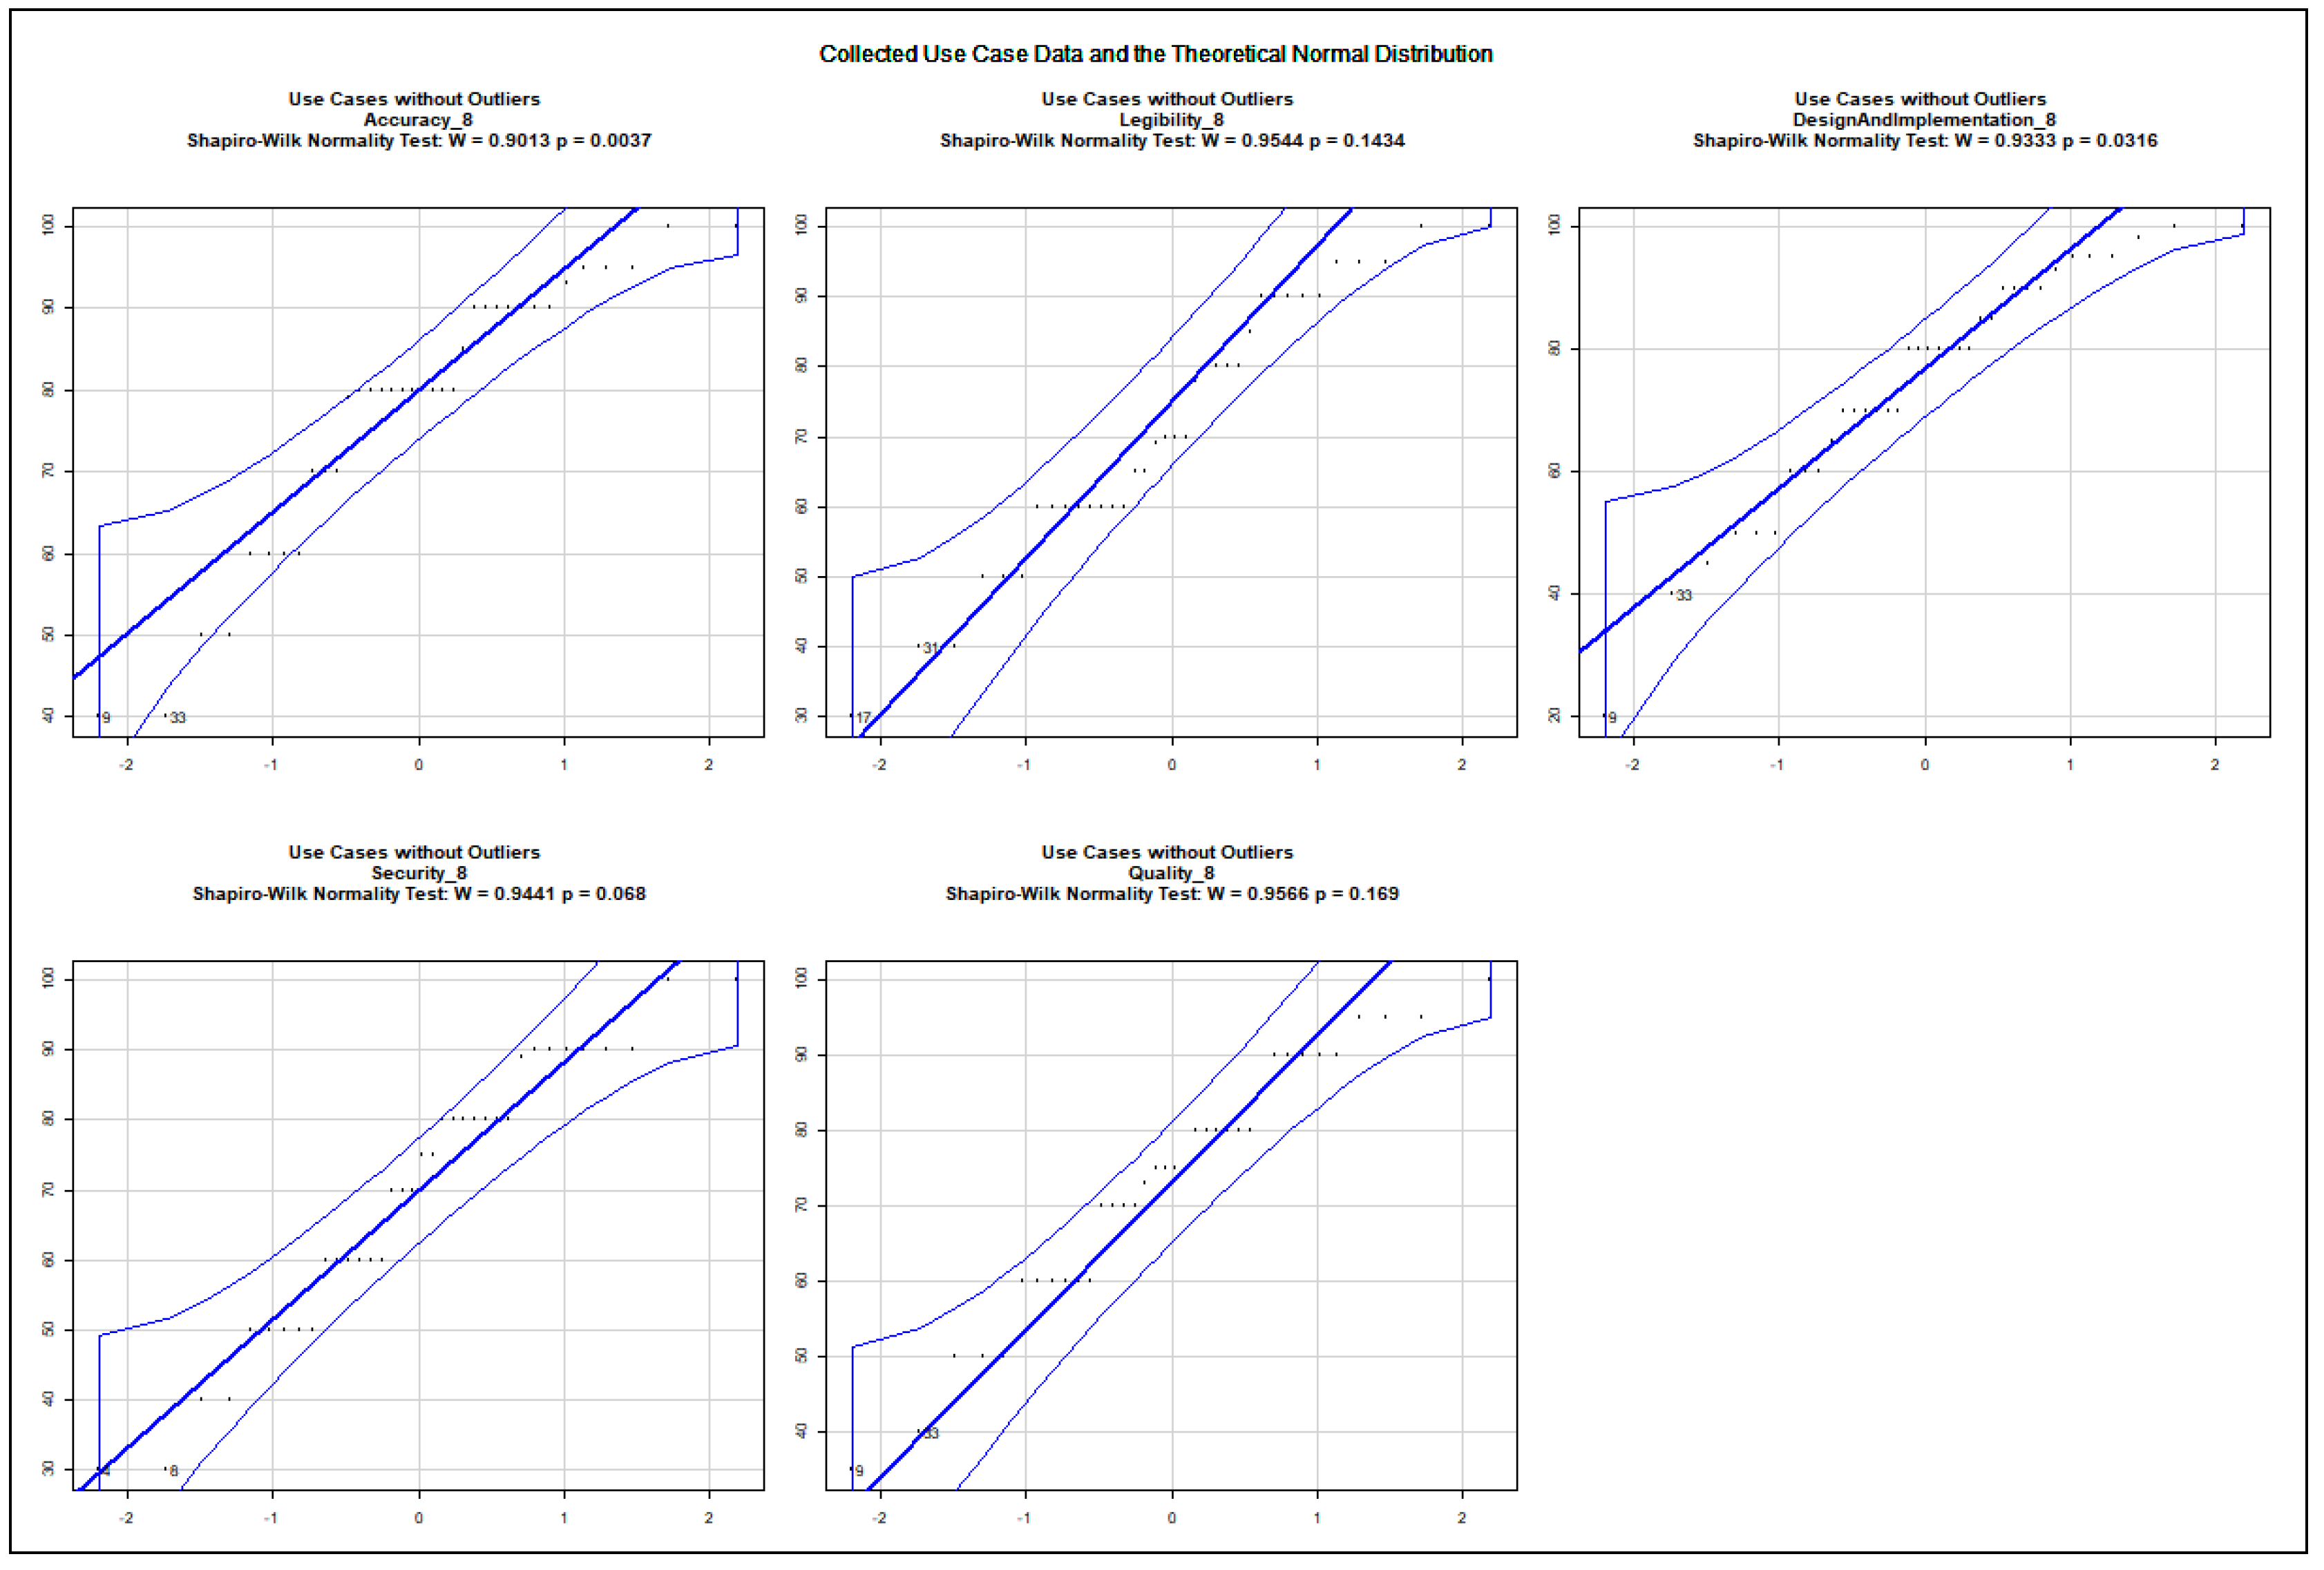
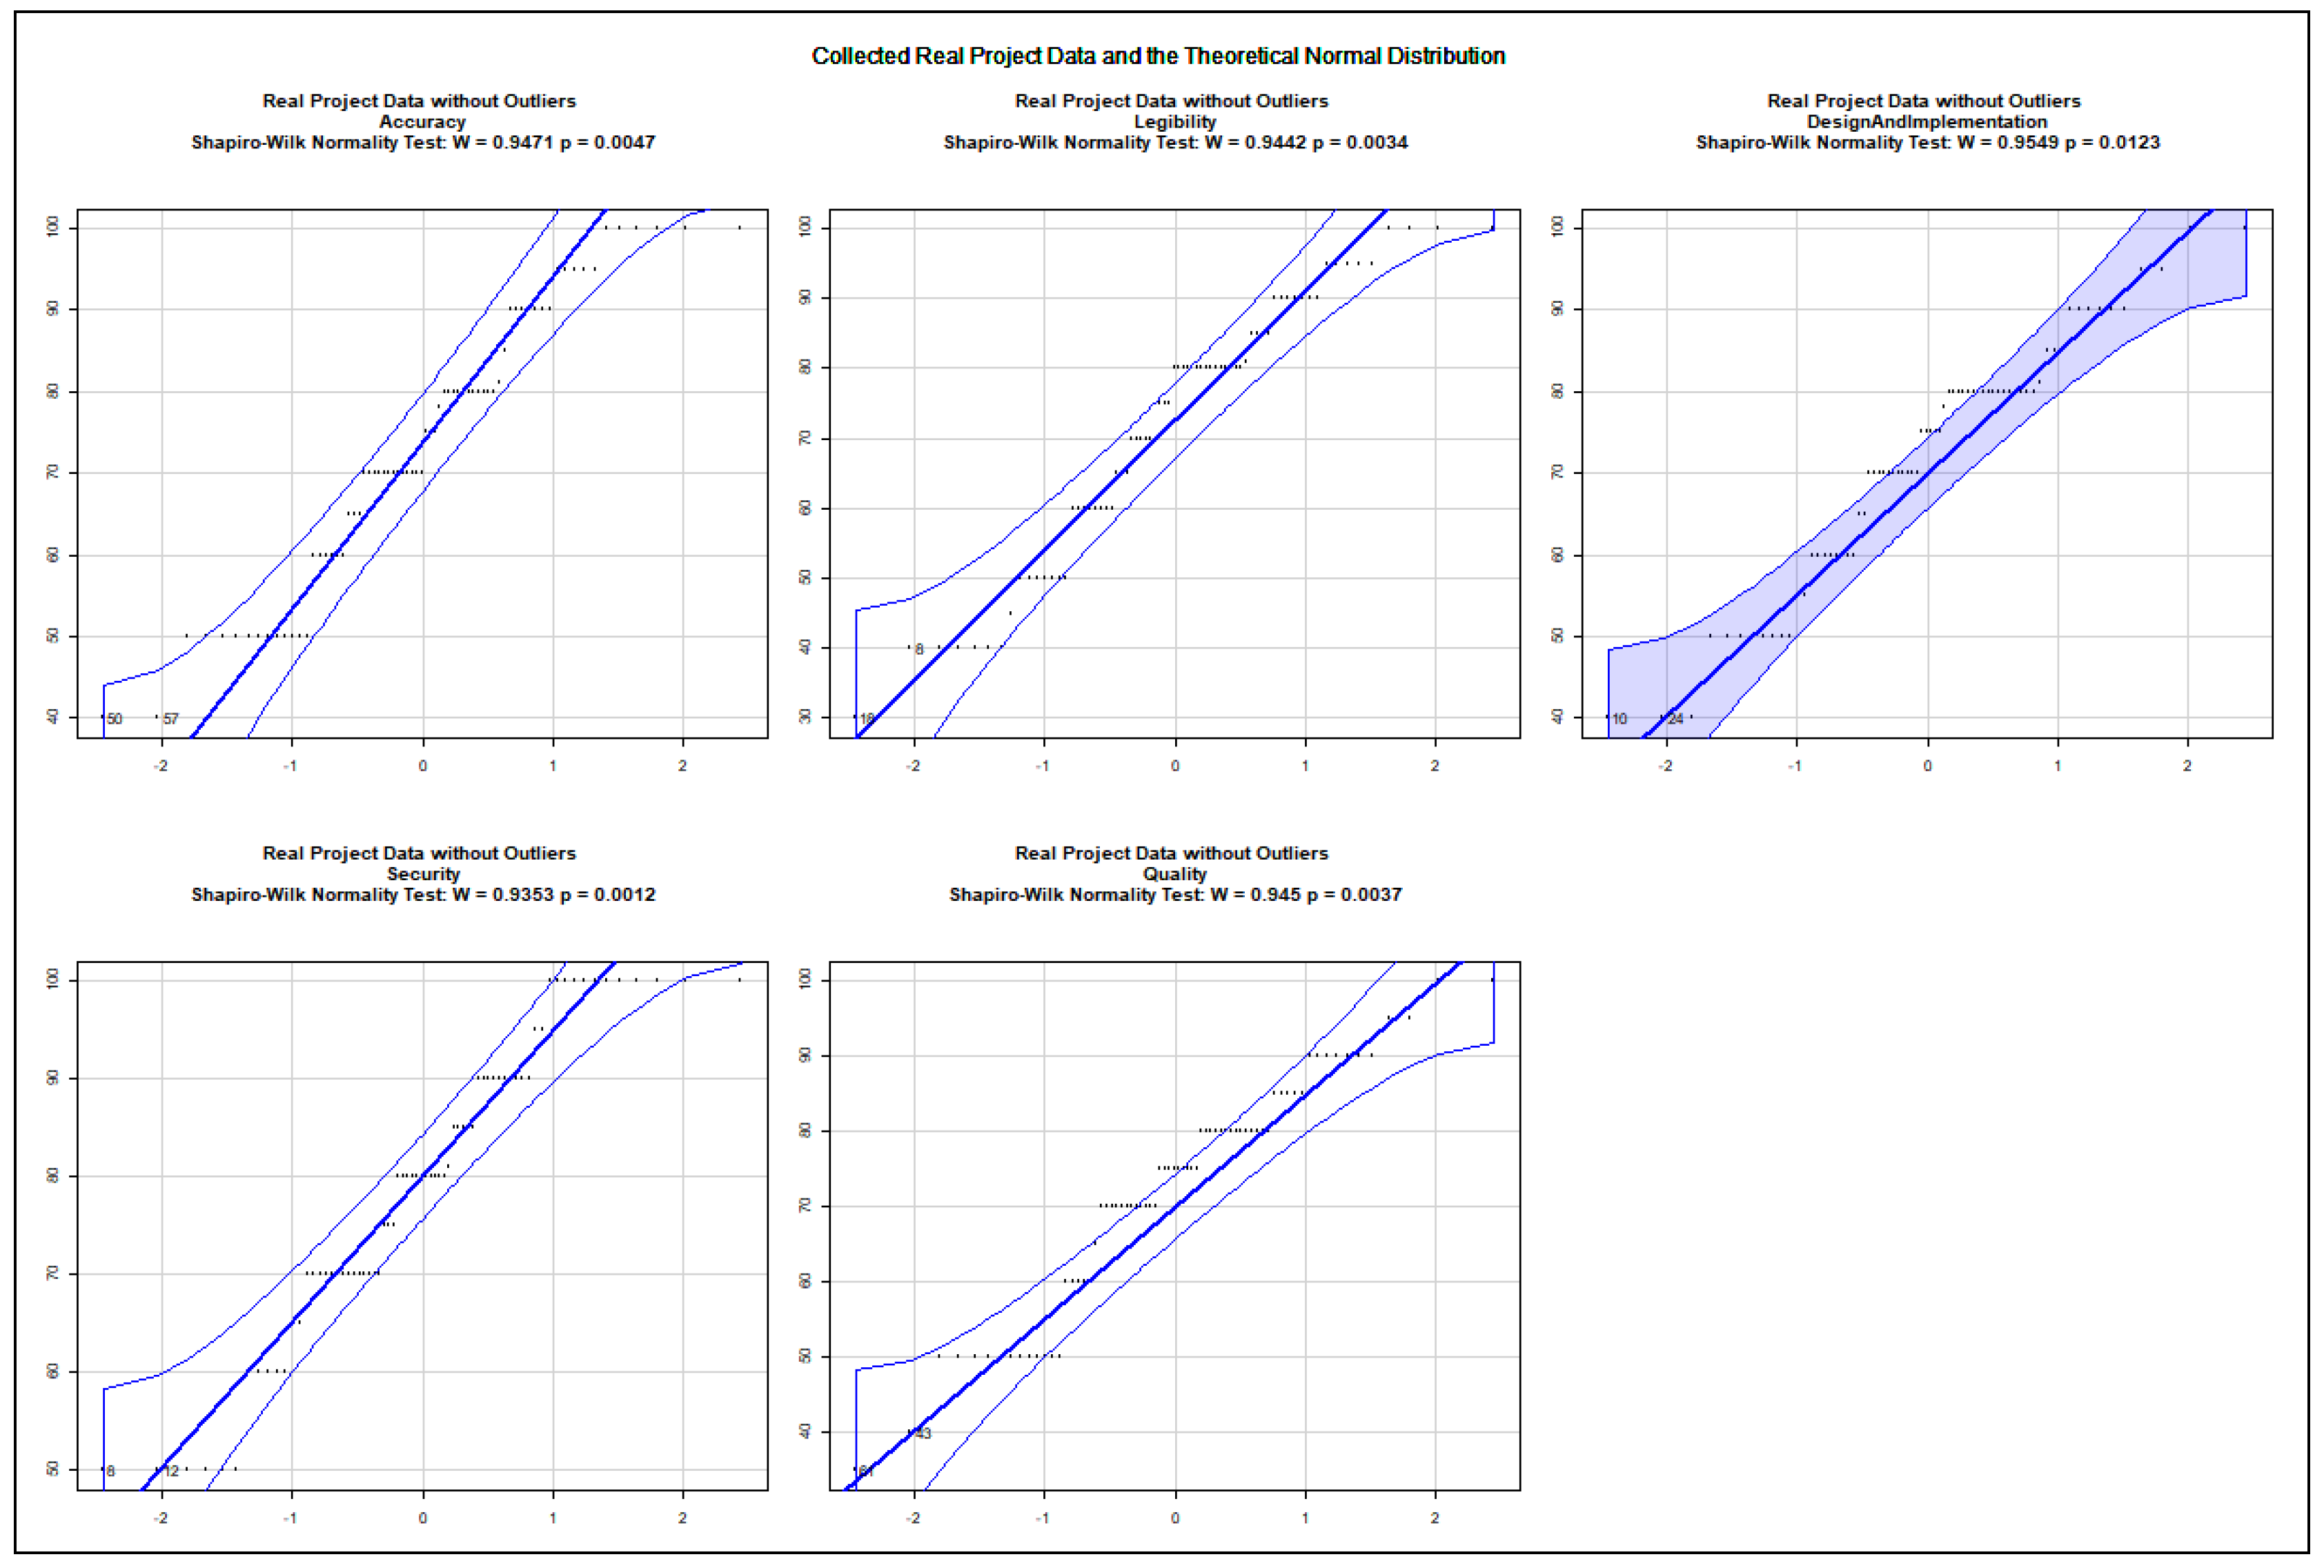
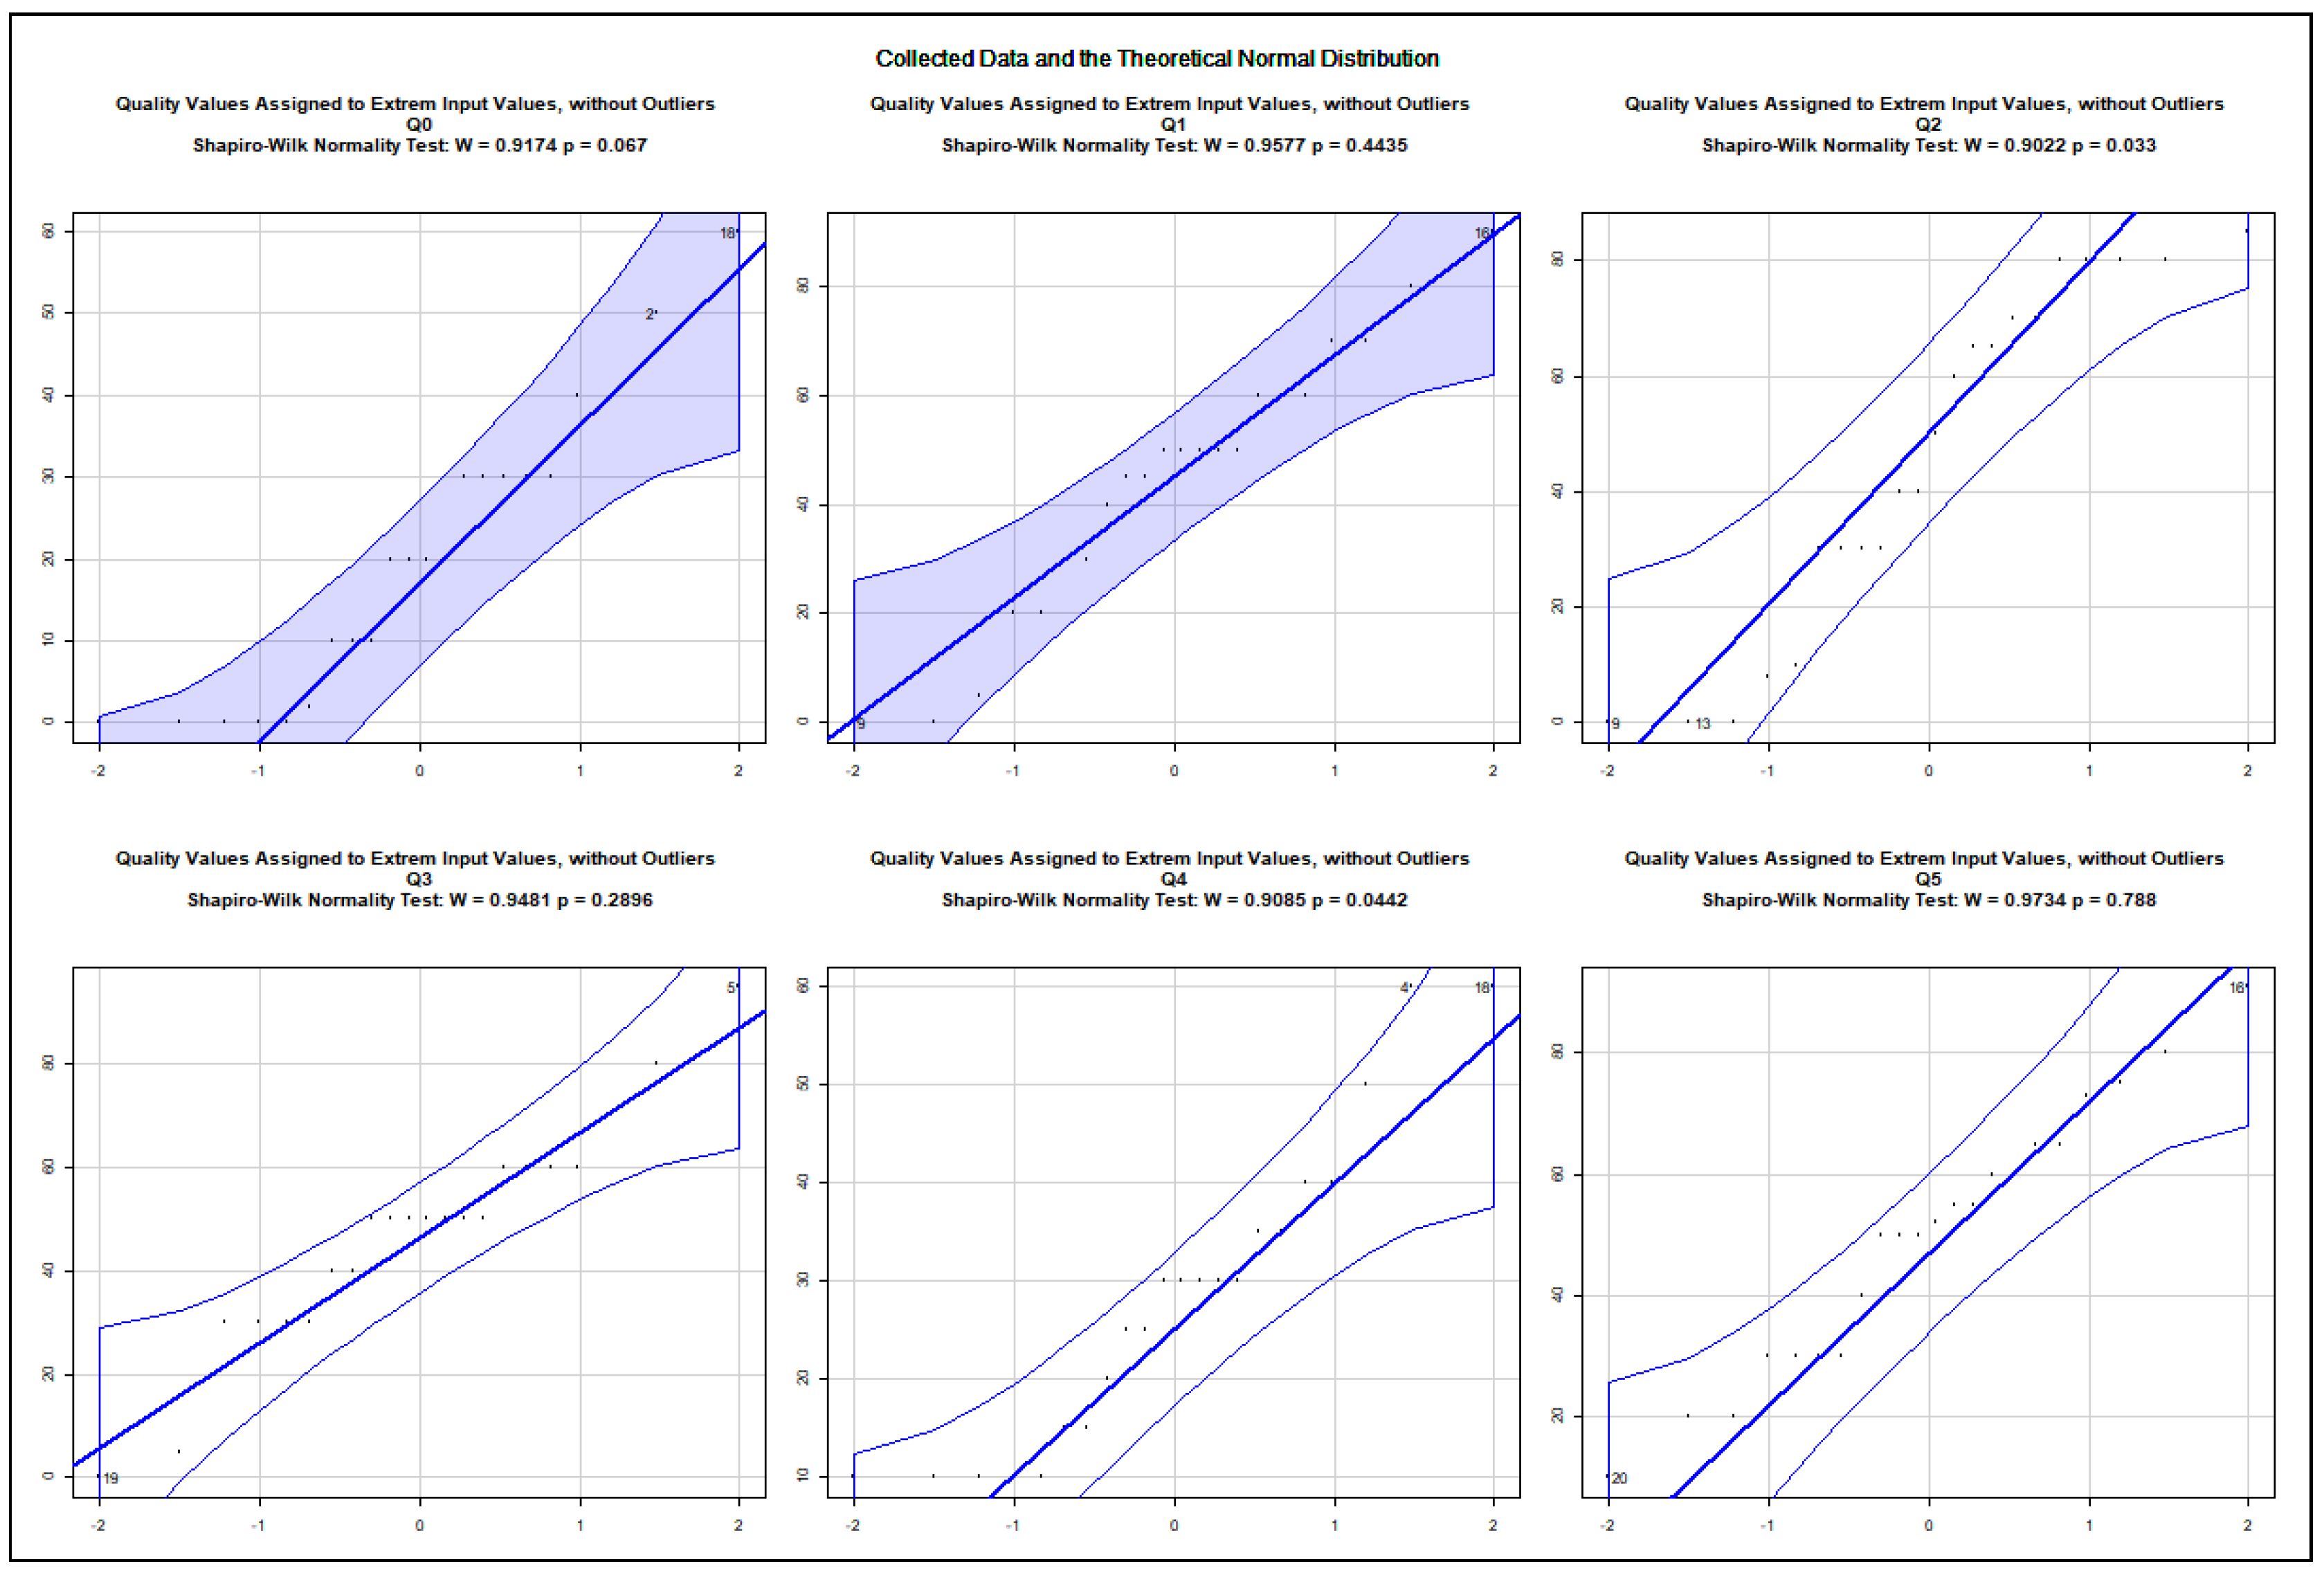
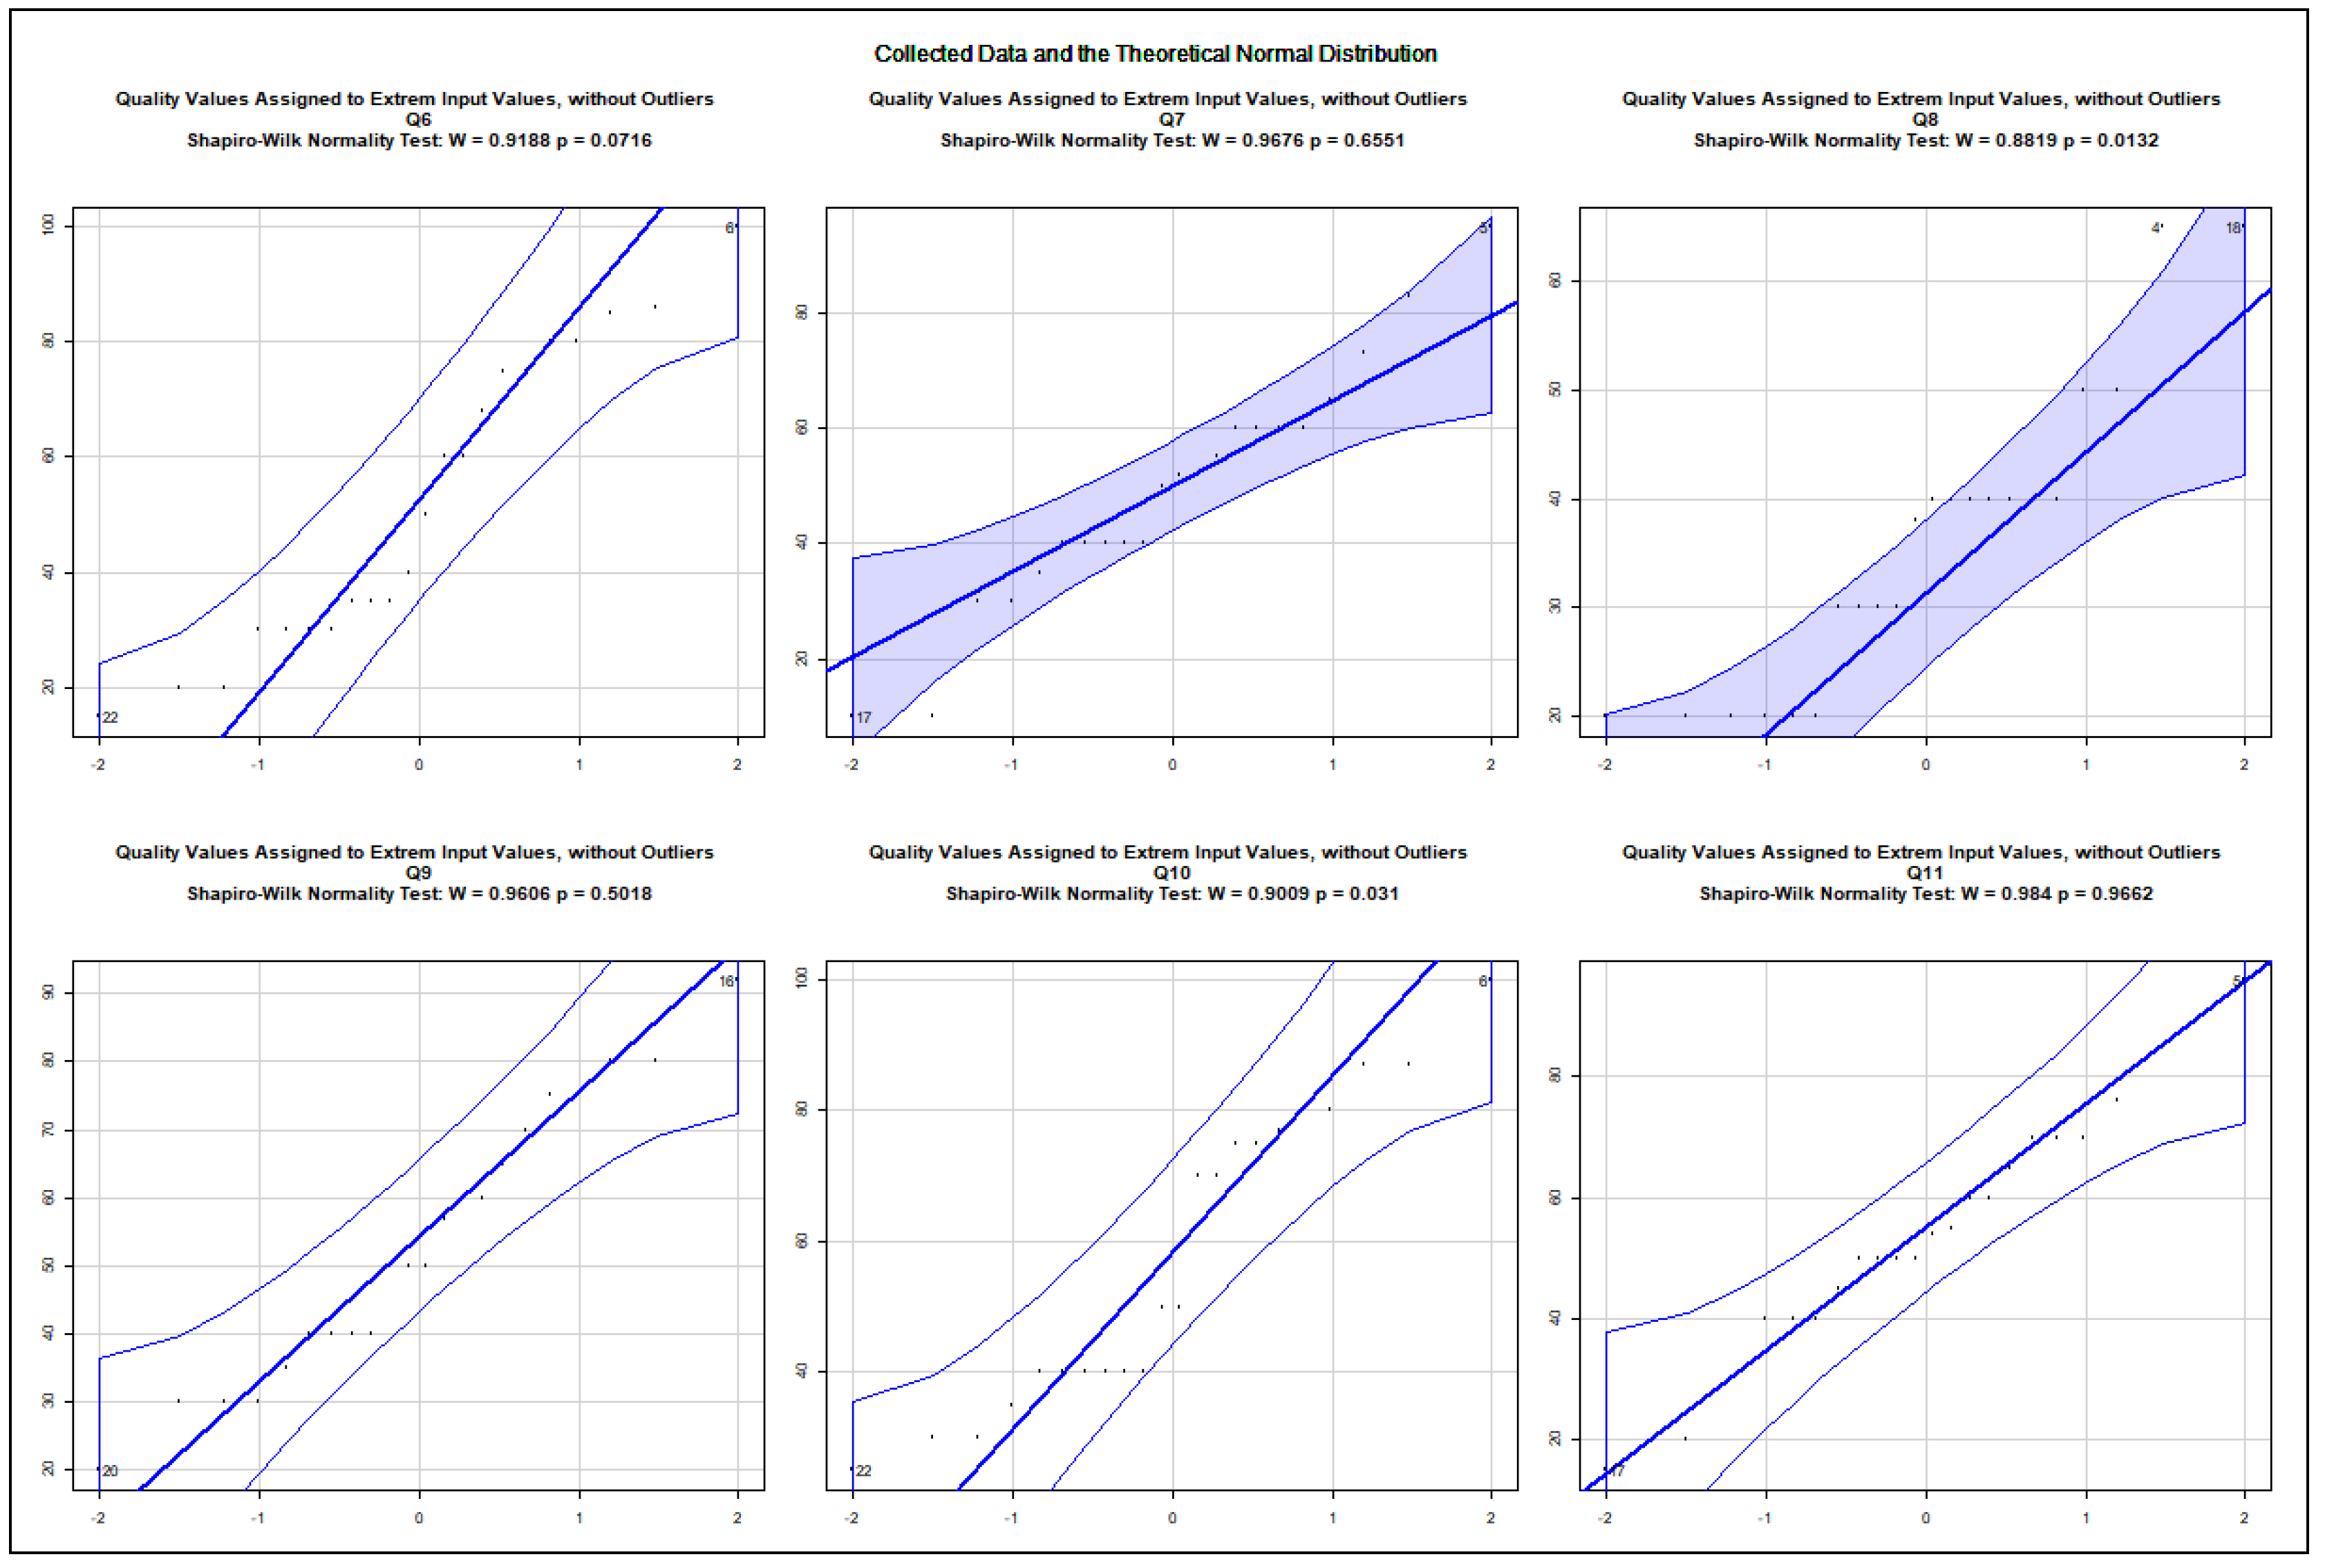
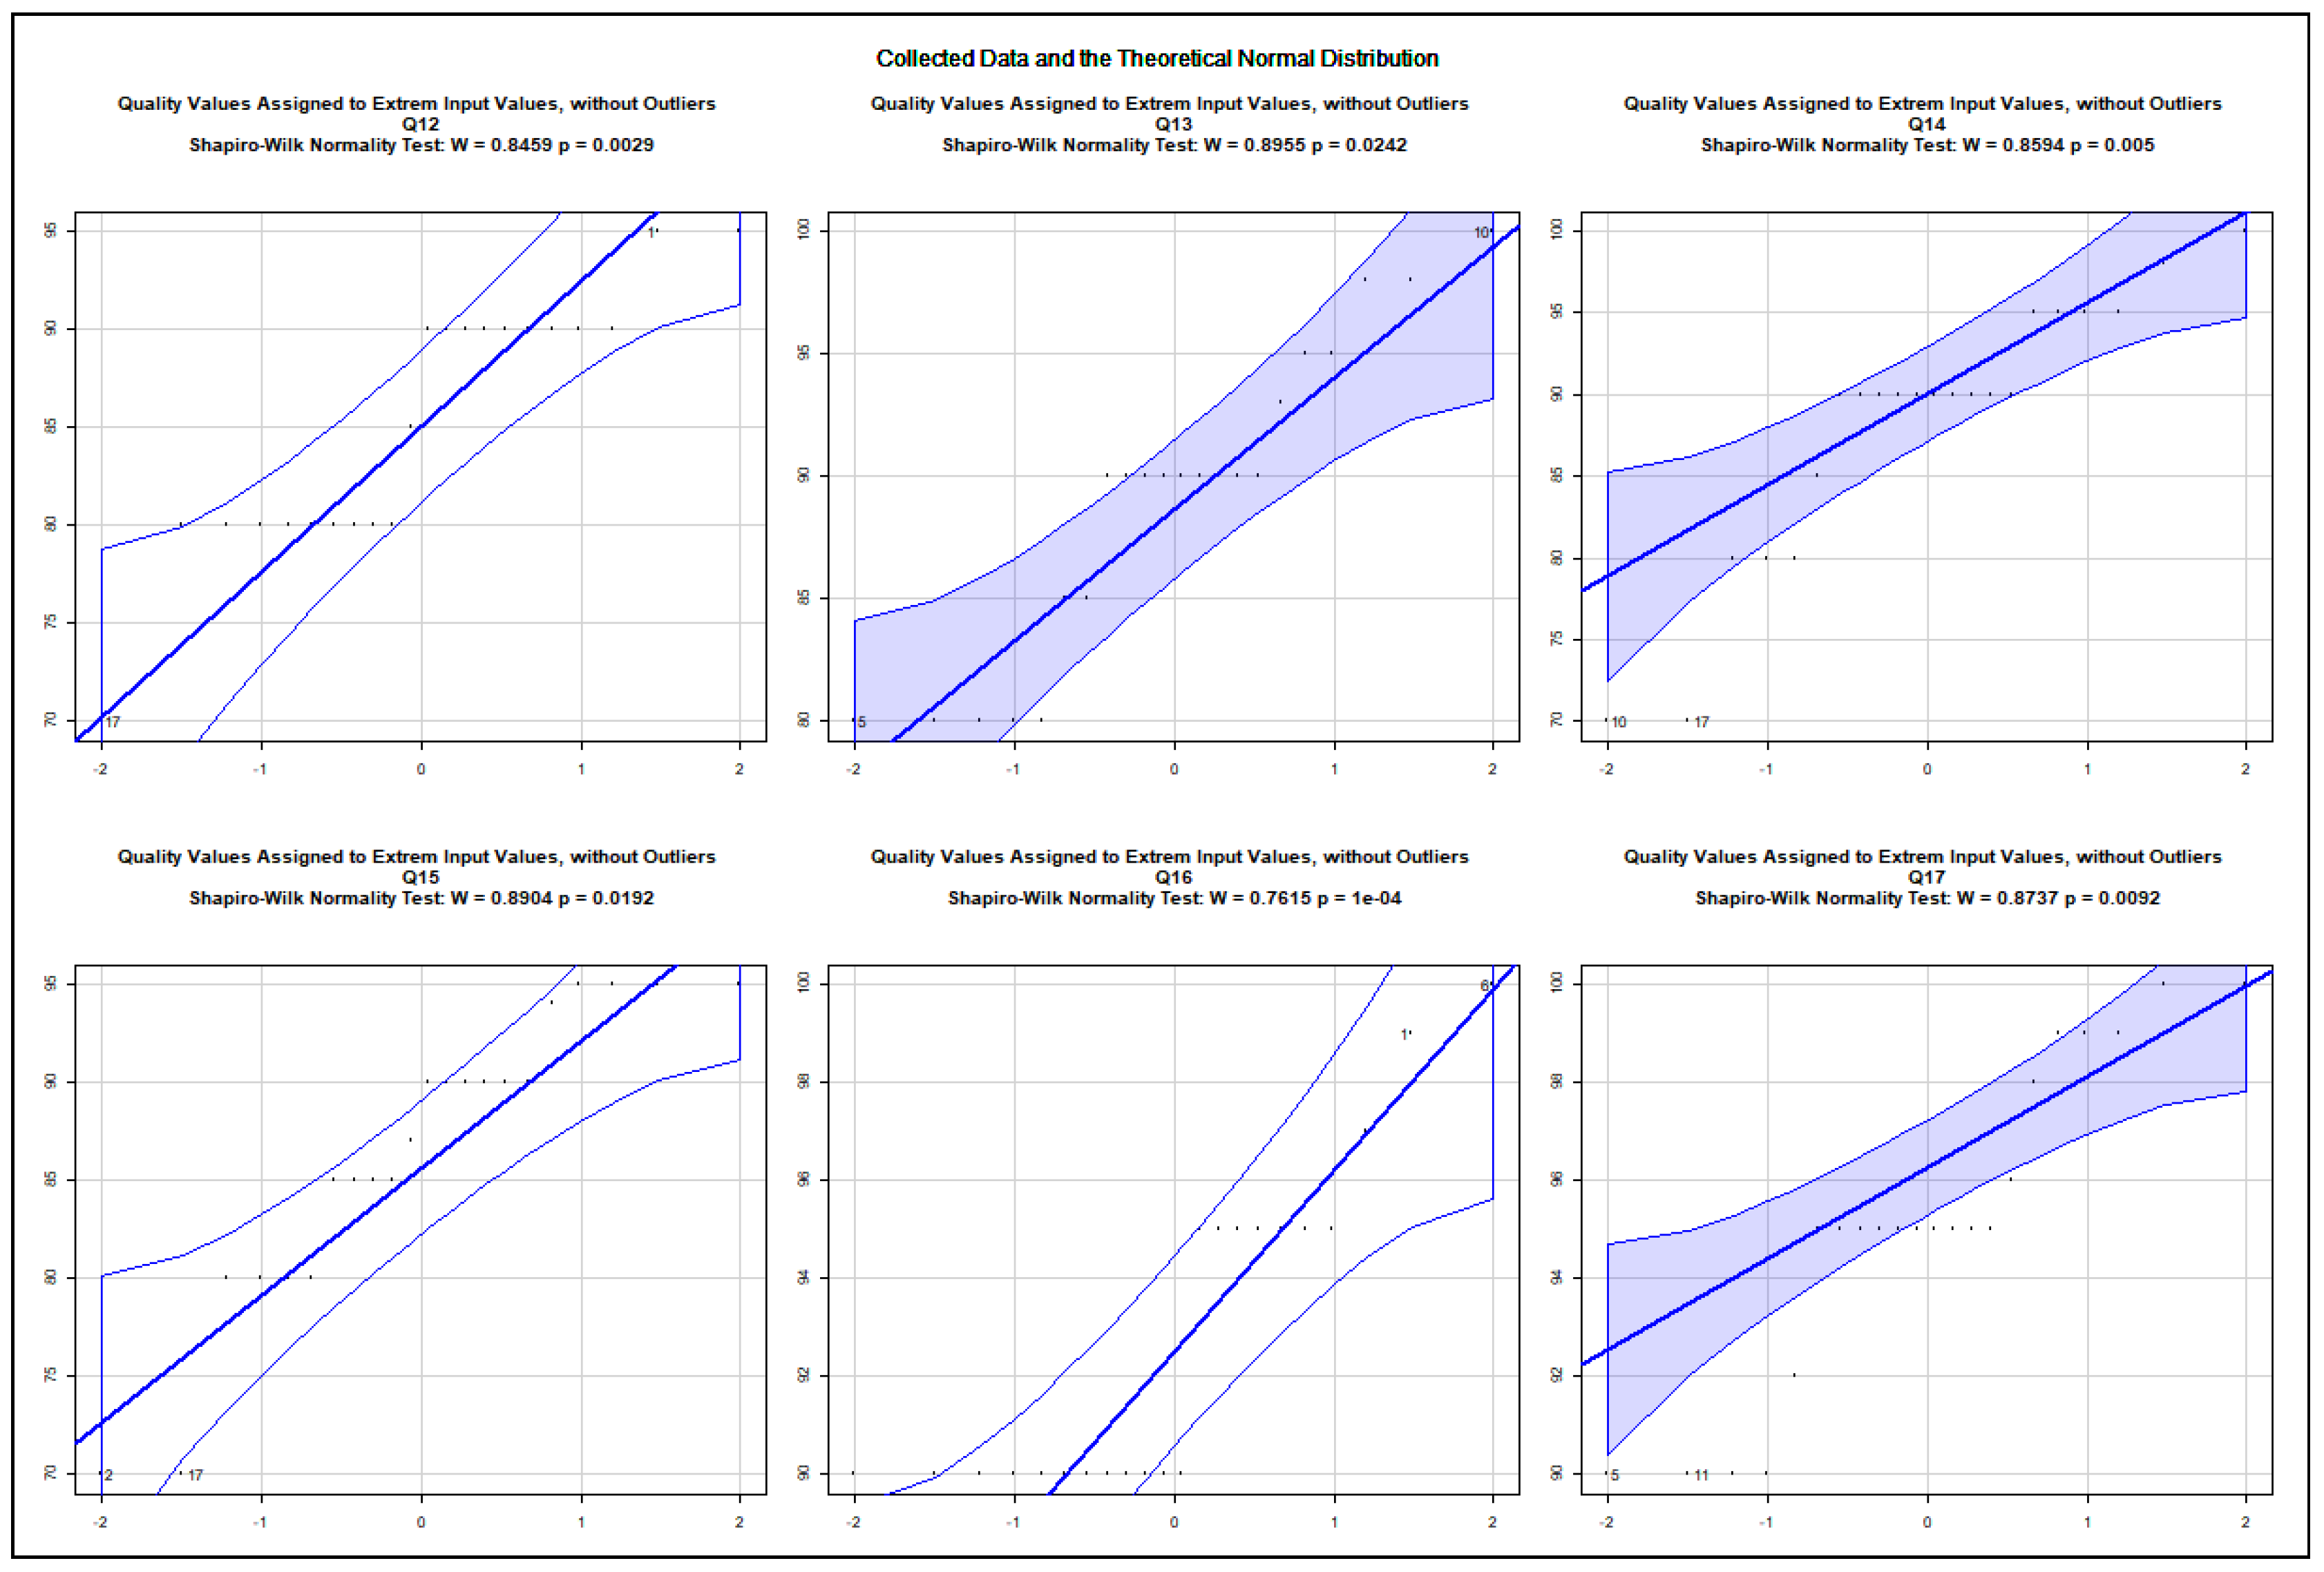
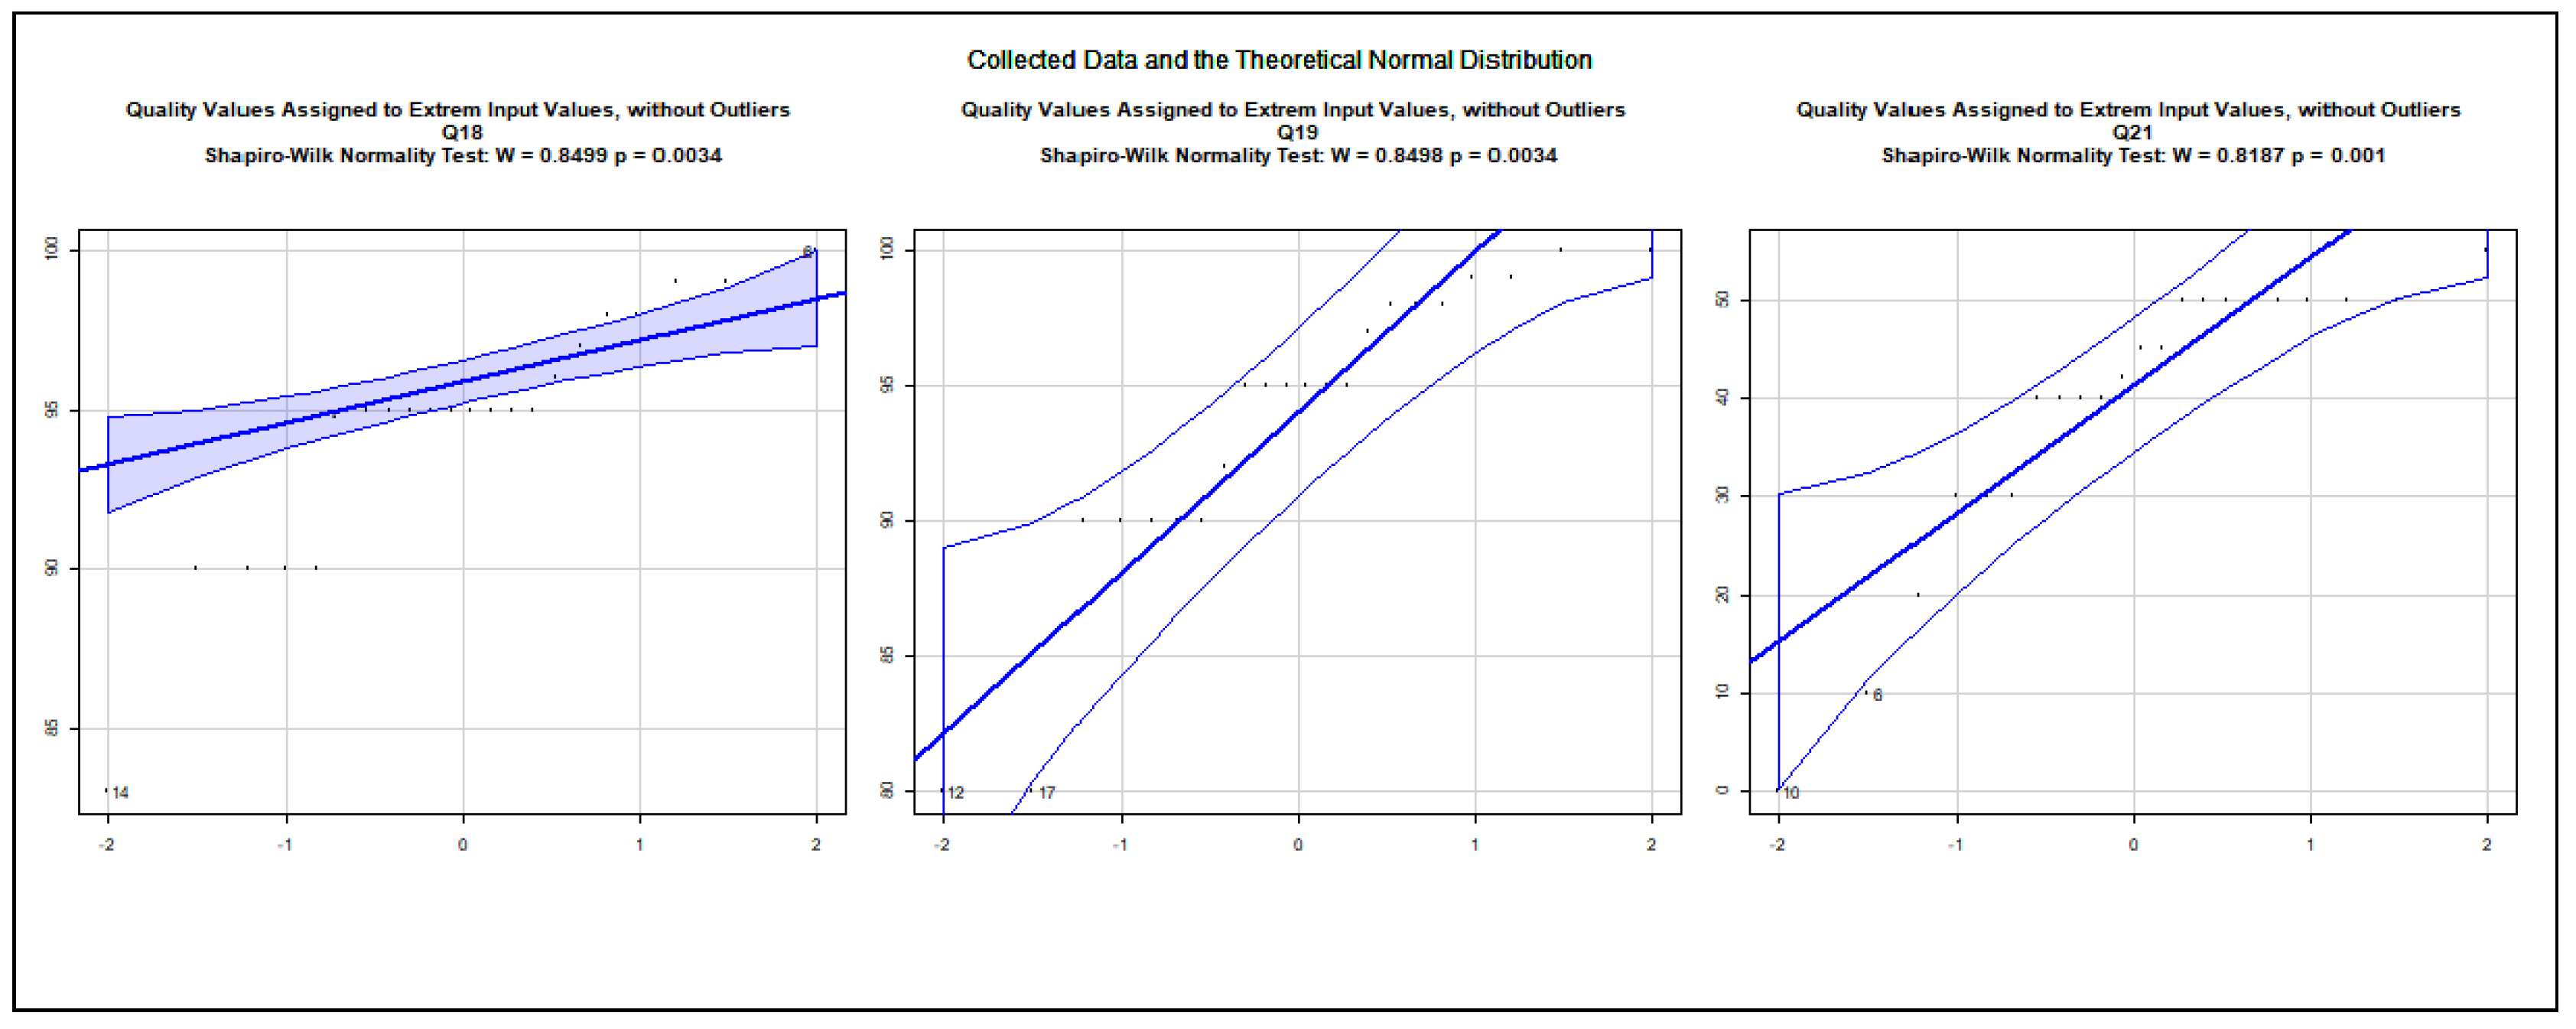
The data show an asymmetric dispersion and skewness regarding the majority of the collected variables. Nevertheless, quantile–quantile plots were computed to check how the collected data approximate the theoretical normal distribution. The charts, presented in Appendix A.2, show the 0.95% confidence intervals and the computed Sharpio–Wilk normality tests. Before computing the quantile–quantile plots, the outliers and the rows with NA values were removed. The use case data are illustrated in Figure A5, Figure A6, Figure A7, Figure A8, Figure A9, Figure A10, Figure A11 and Figure A12. The following variables do not approximate the theoretical normal distribution on : use case 1: all variables; use case 2: accuracy, security; use case 3: accuracy; use case 4: none of the variables; use case 5: design and implementation; use case 6: design and implementation, quality; use case 7: accuracy, quality; use case 8: accuracy, design and implementation. The collected data about real projects are not normally distributed, as shown in Figure A13, but they may represent different projects. The following variables do not approximate the theoretical normal distribution on regarding the data assigned to the extreme input variable values Q2, Q4, Q8, Q10, Q12, Q13, Q14, Q15, Q16, Q17, Q18, Q19, and Q21 as illustrated in the charts of Figure A14, Figure A15, Figure A16 and Figure A17. The variables Q20 and Q22 were excluded from the normality test as they only possessed identical values.
As many of the variables collected were not normally distributed, as illustrated above, the p = 90% confidence interval was computed by the non-parametric Wilcoxon test [111]. To highlight the uncertainty related to all questions in a meaningful way, the lower and upper values of the confidence intervals are not reported below but the range they encompass.
The ranges of confidence intervals for the input and out variable values without the outliers, related to the described eight use cases, possess the following characteristics: min value: 9.99, max value: 24.99, median: 12.49. The 24.99 range of the confidence interval emerged for the values of the input variable security for use case 1 and use case 2, while the ranges of the other variables approximated the median.
The assigned execution tracing quality—i.e., the output variable—to the extreme input variable value combinations showed a lower dispersion than the responses to the use cases. The most definite answers were found when all the four input variables had the maximum value of 100 for question Q20 and when they all had the value of 0 for question Q22. In these cases, 100 was assigned for Q20 and 0 was assigned for Q22 by all respondents, not counting the outliers. The ranges of the confidence intervals show the following characteristics after removing the outliers: min value: 1, max value: 15, median: 10.
In conclusion, the collected data after removing the outliers show a median value of 12.5 for uncertainty related to the constructed use cases and median value of 10 for uncertainty related to the extreme input variable value combinations on a scale from 0–100 when p = 90%. Thus, the uncertainty on the scale 0–100 at this specified probability value lies between 10 % and 12.5 % with regard to the medians of the confidence intervals. An approximately 10% uncertainty while rating software quality on a ratio scale is an acceptable value; however, the small sample size (n = 41) makes a stronger validation necessary, as usual.
4.3. Modelling: Machine Learning
The data collection and exploratory data analysis resulted in a tabular representation of the data in which the questions of the survey form the columns; however, another data format is necessary for machine learning that contains the input and output pairs. To achieve this, the data were transformed into a matrix representation, where the columns represent (a) the four input variables—(1) accuracy, (2) legibility, (3) design and implementation, and (4) security—and (b) the corresponding output: execution tracing quality. The rows of the matrix represent input and output pairs. Where an outlier was marked in the rows of the matrix, the complete row was removed. After reshaping the data this way and removing the outliers, 1185 pairs of inputs and the corresponding output were created; i.e., the matrix possessed 1185 rows suitable for machine learning. The data set was randomly split into proportions of 70% and 30% for training data and checking data, as introduced in Section 3.
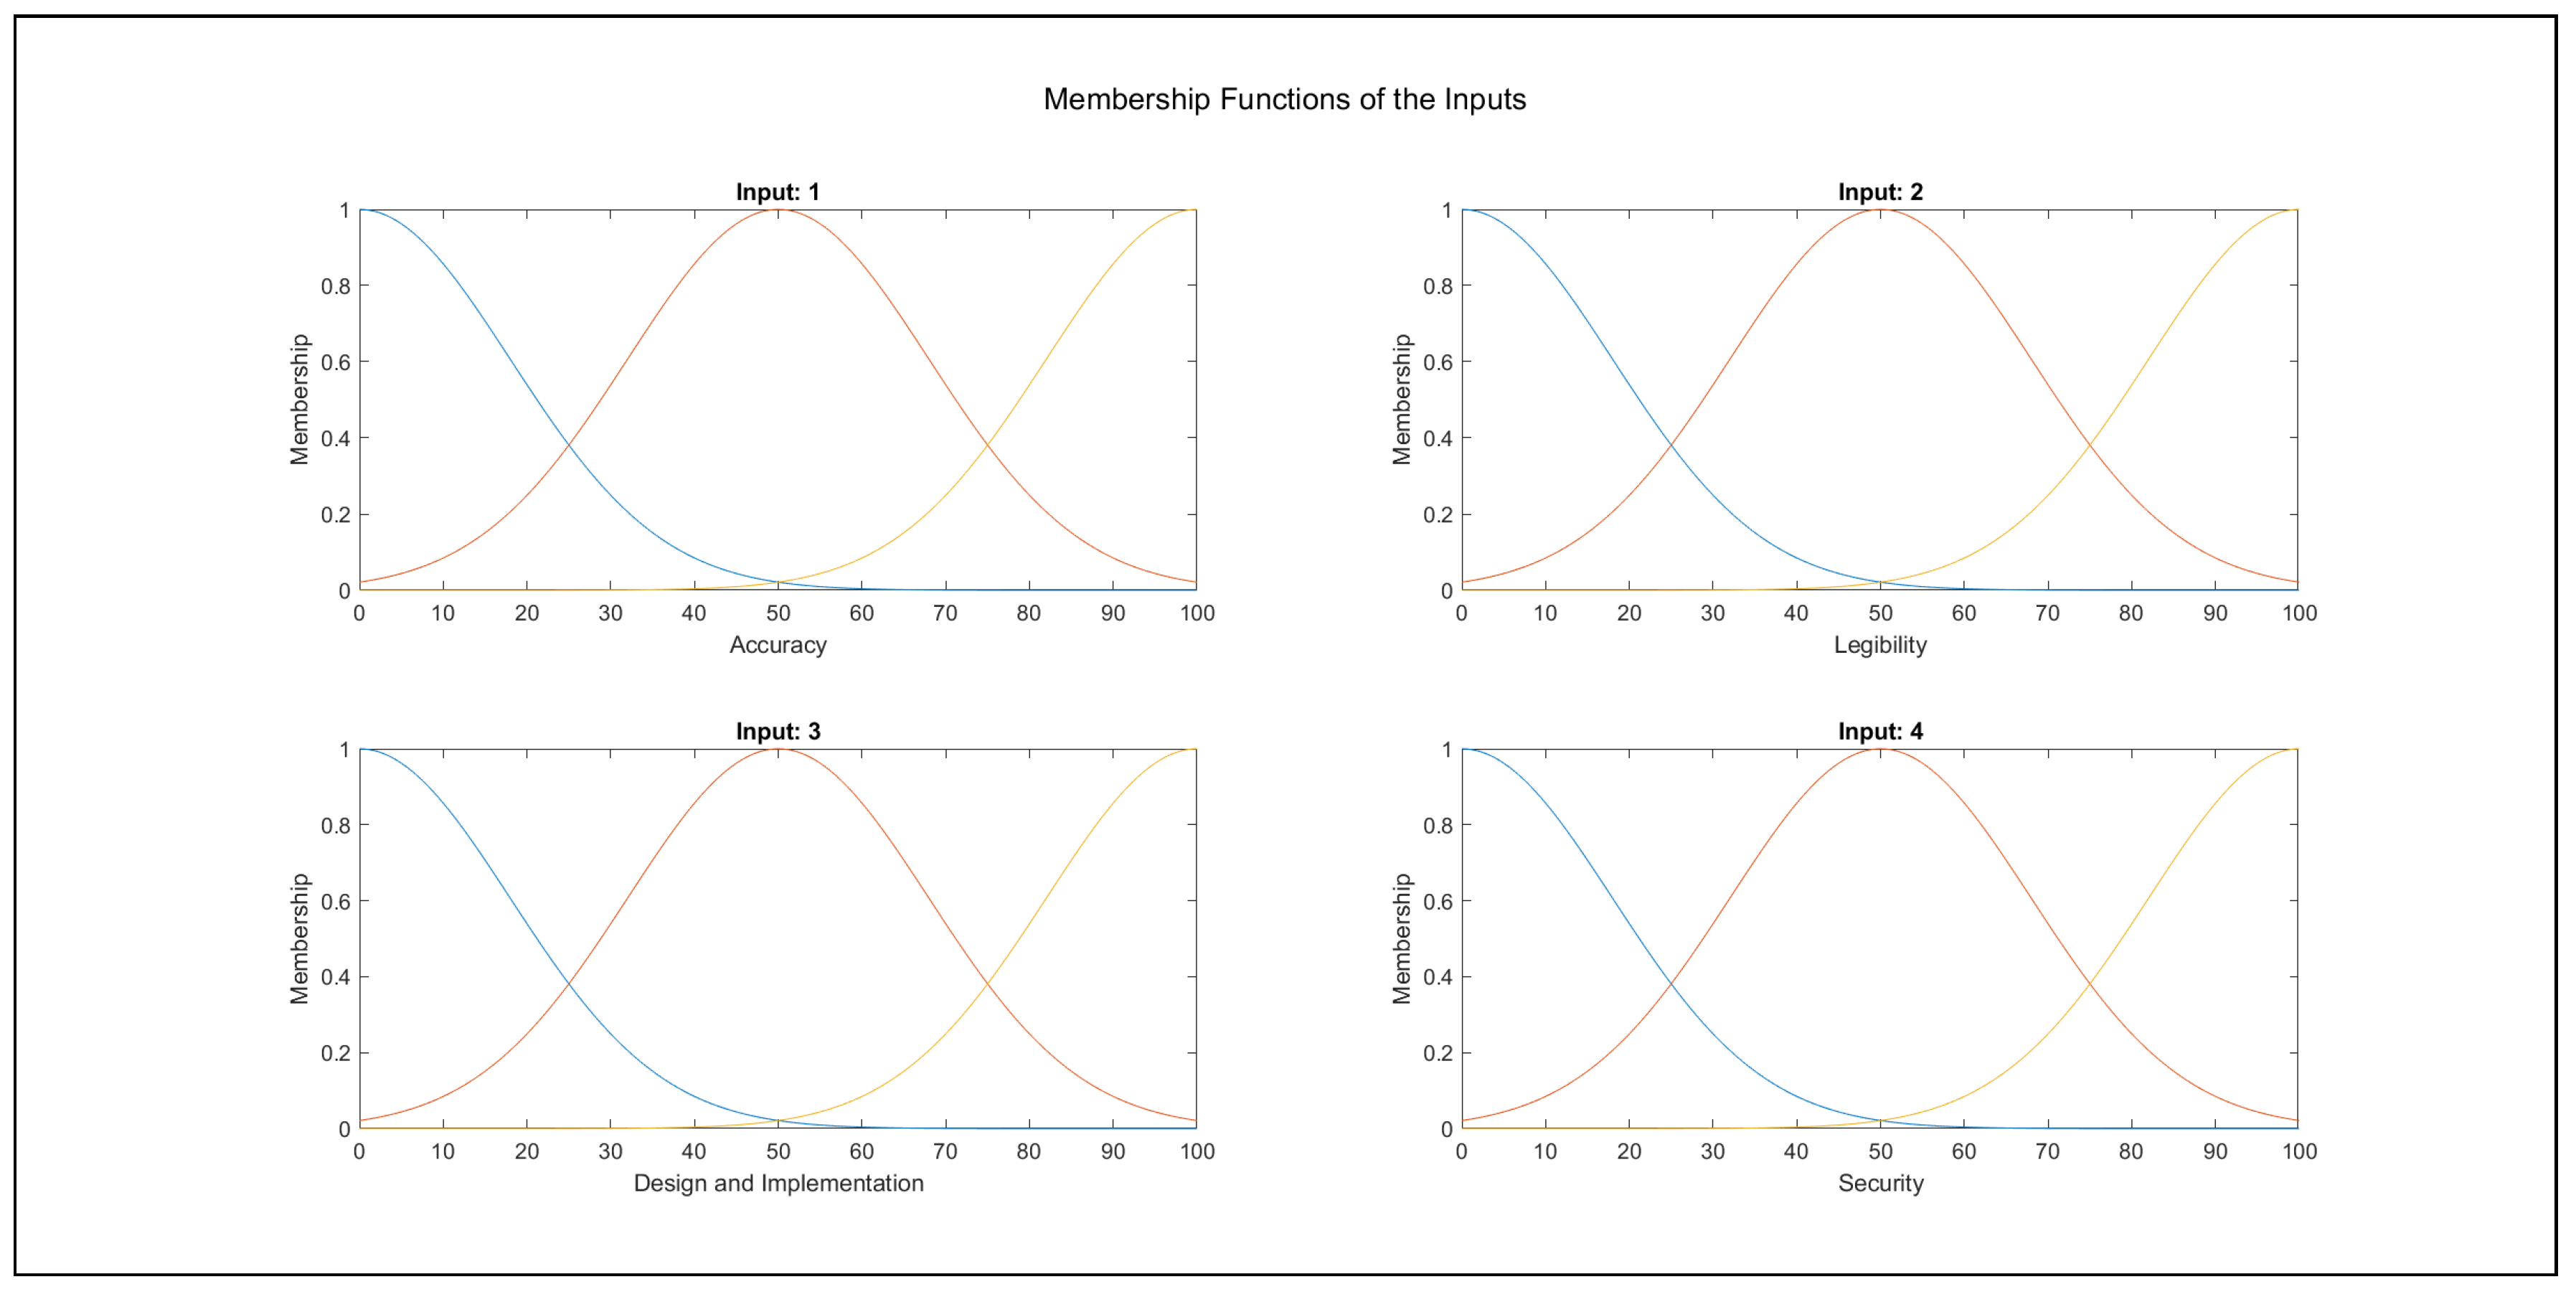
Modelling was performed in the Matlab R2021a environment, where a fuzzy inference system was created with four inputs and one output, according to the data set above. The input membership functions and their partitions are shown in Figure 4. The output membership functions were defined as five constants; i.e., zero-order membership functions were used in the output at the values {0, 25, 50, 75, 100} for the singleton fuzzy sets {very poor, poor, medium, good, very good}. The fuzzy inference system was constructed with the inference type Takagi–Sugeno–Kang [23] with no initial linguistic rules.
In the scope of machine learning, the system was adapting to minimise the root mean squared error of the input–output data pairs, while the learning was carried out with genetic algorithms [112], and the numbers of possible linguistic rules were limited to {1, 3, 5, 8, 12, 16, 20, 40, 80, 160} per run. Genetic algorithms have a non-deterministic nature; i.e., several runs of the same algorithm with the same parameters in the same problem domain may achieve different but similar results. Therefore, each run with the same parameters and with the same upper bound settings for the linguistic rules was executed five times, and the results were recorded. In addition, the whole run-suite was executed six times.
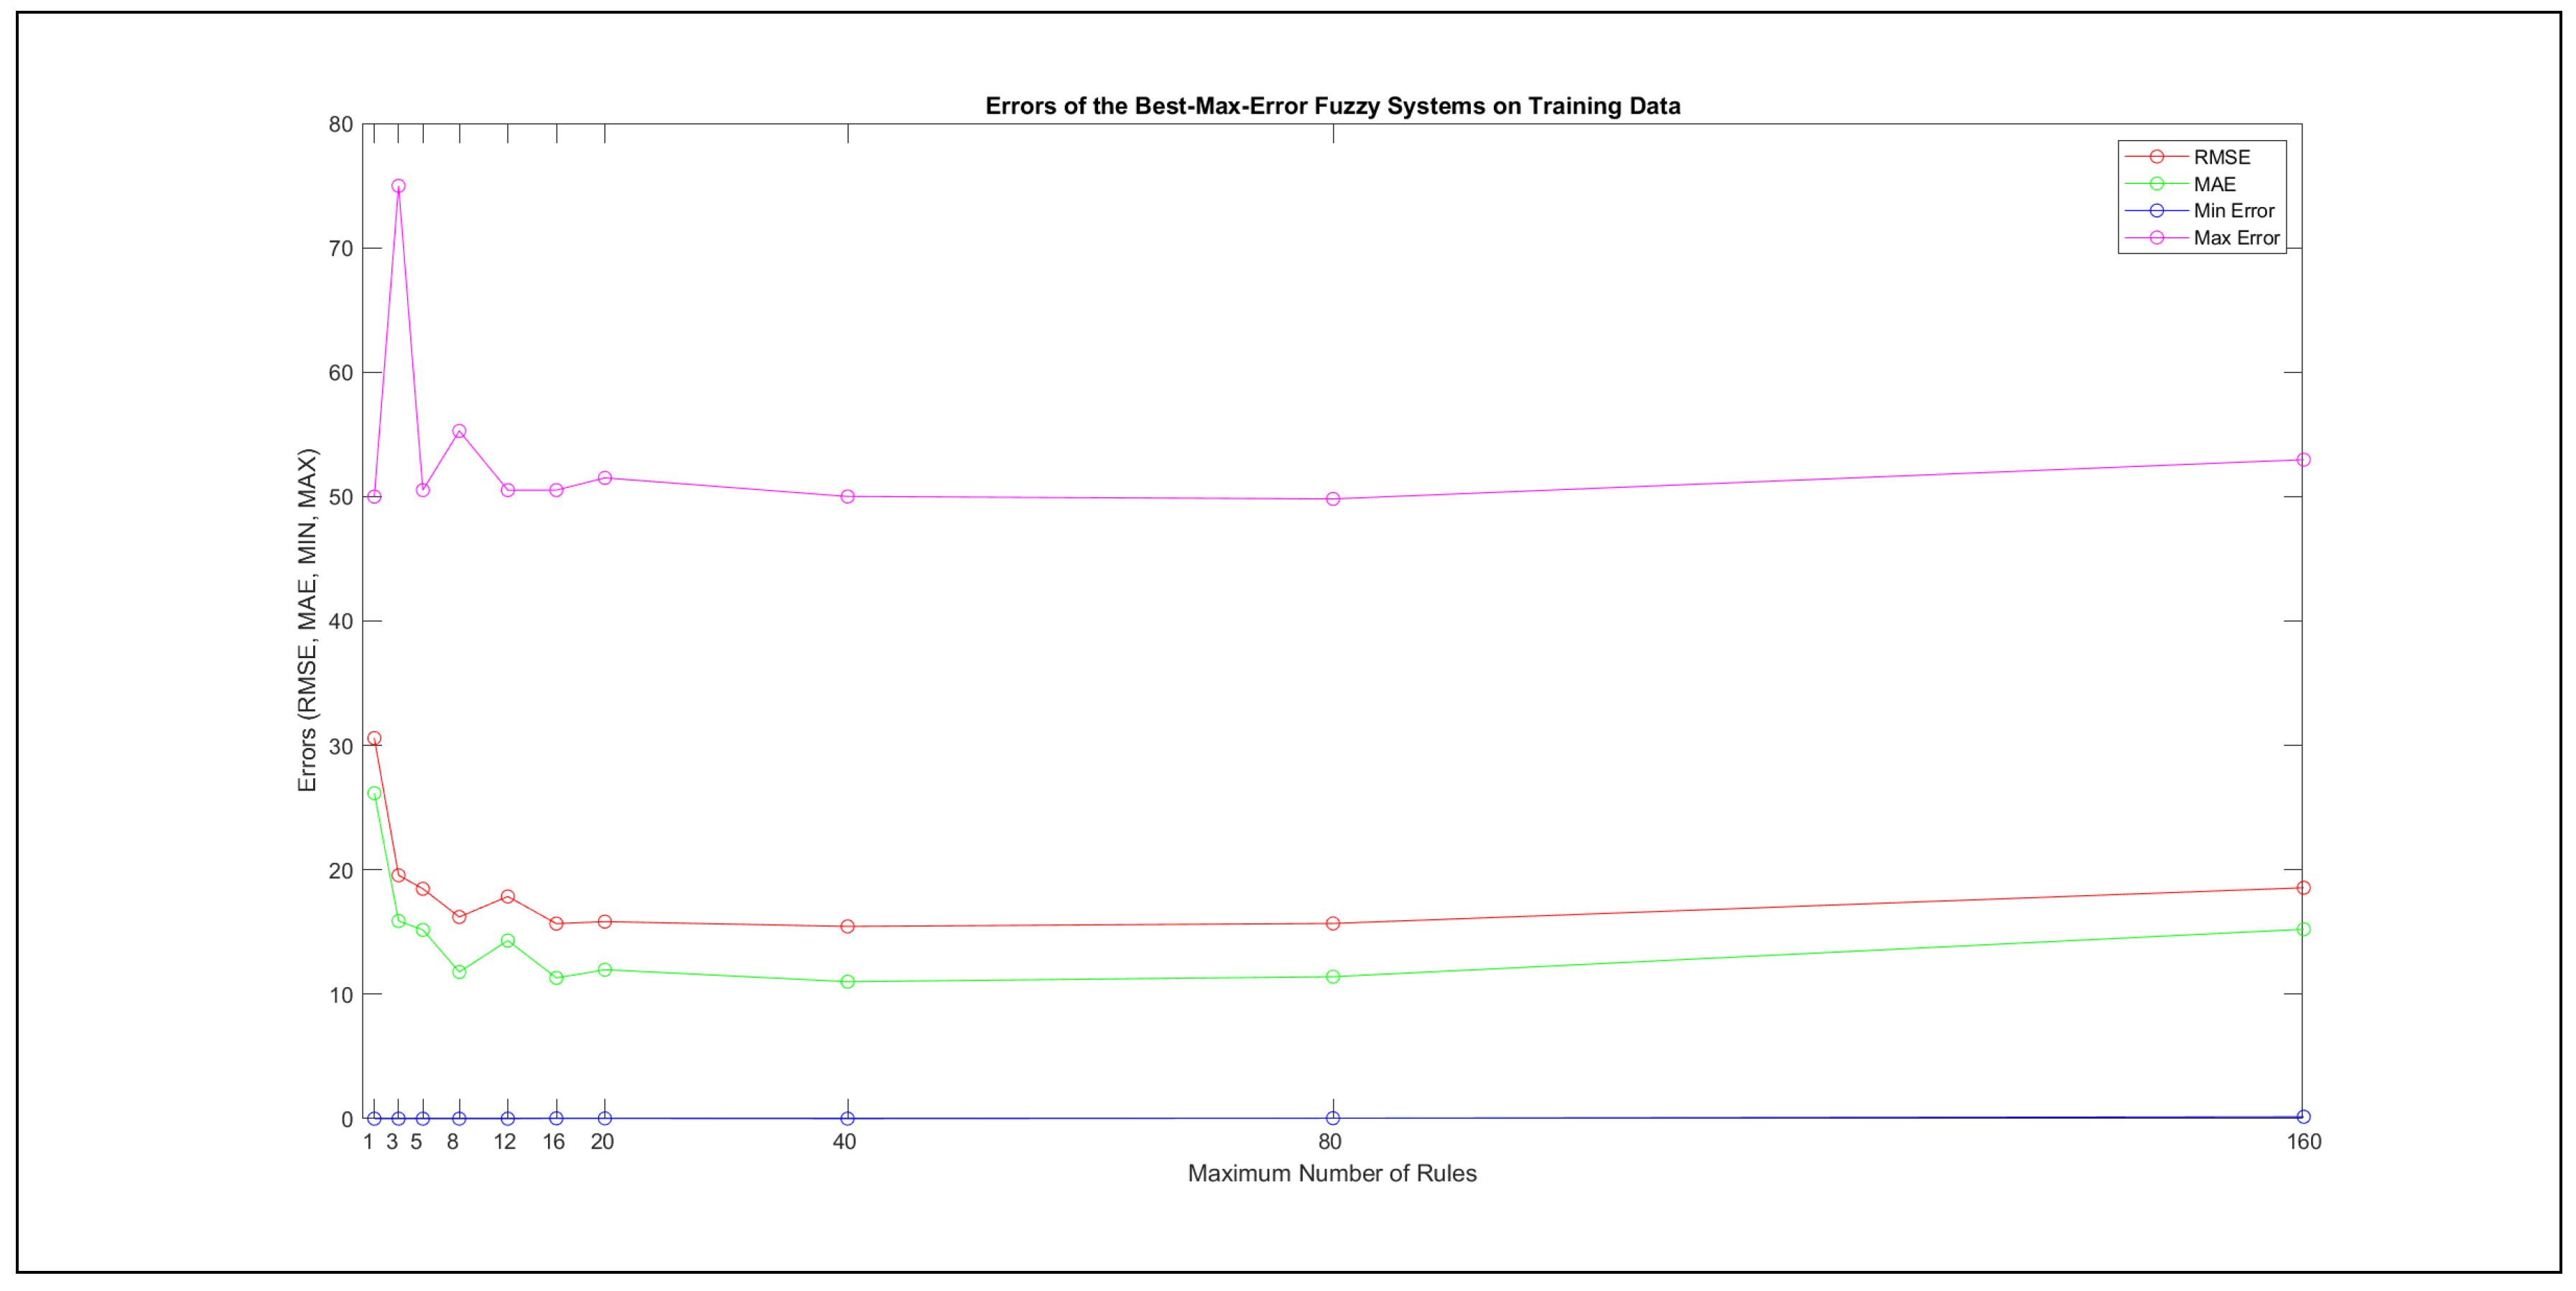
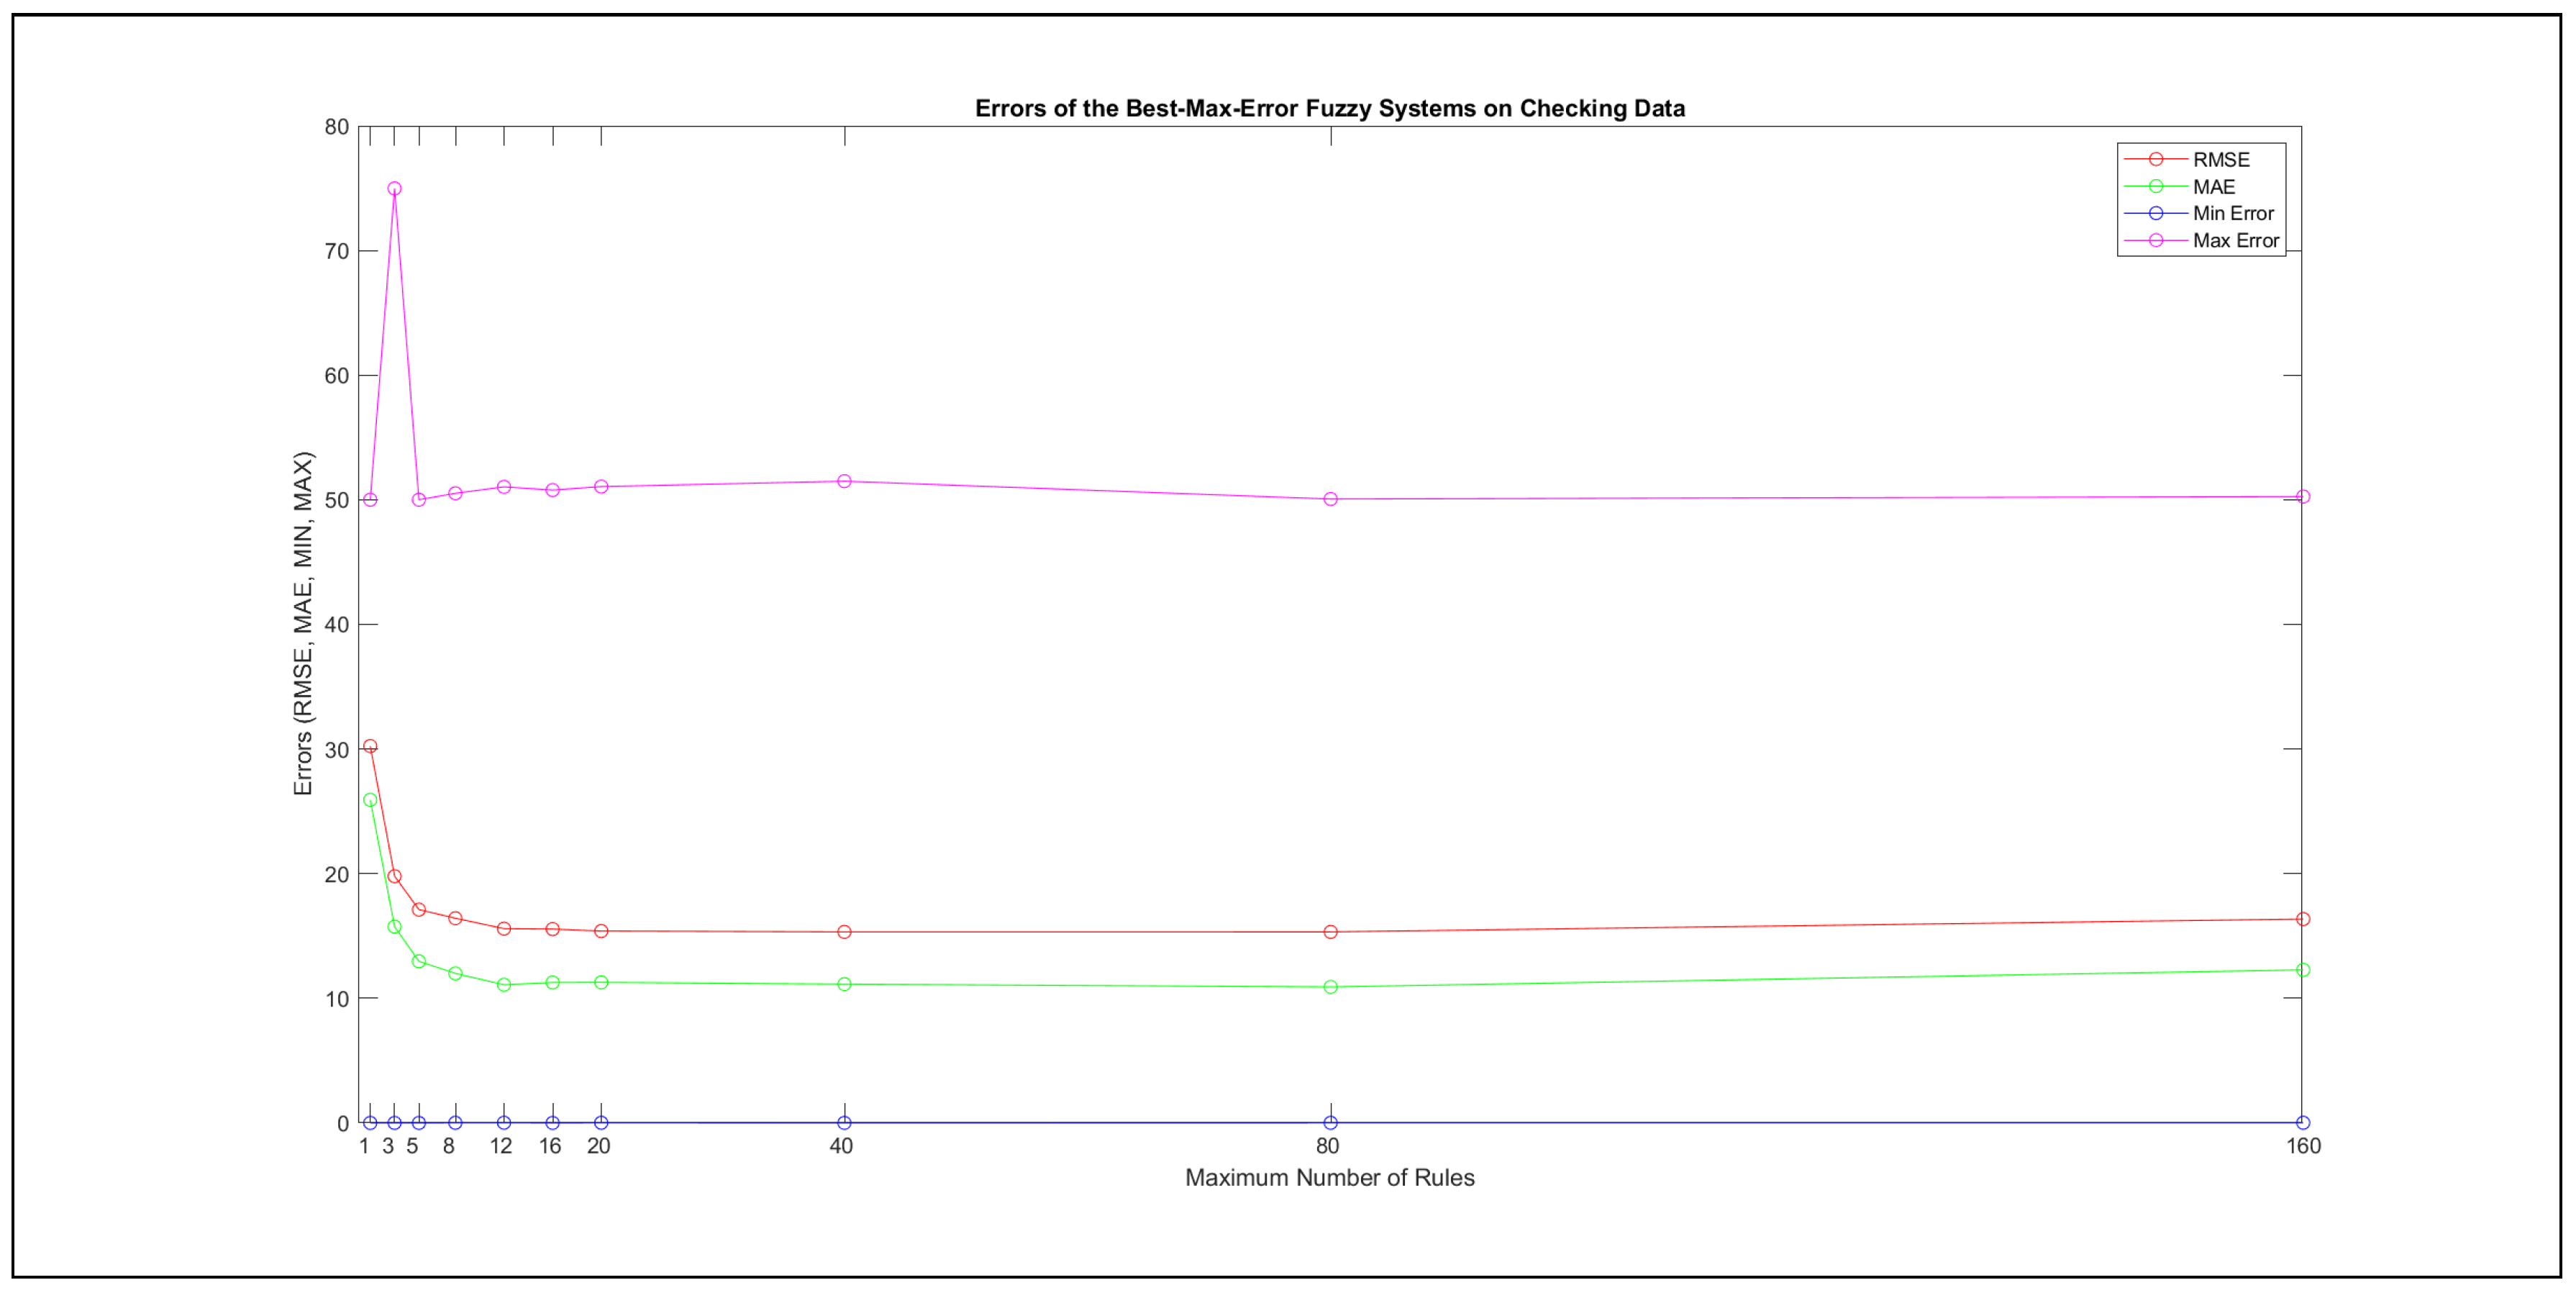
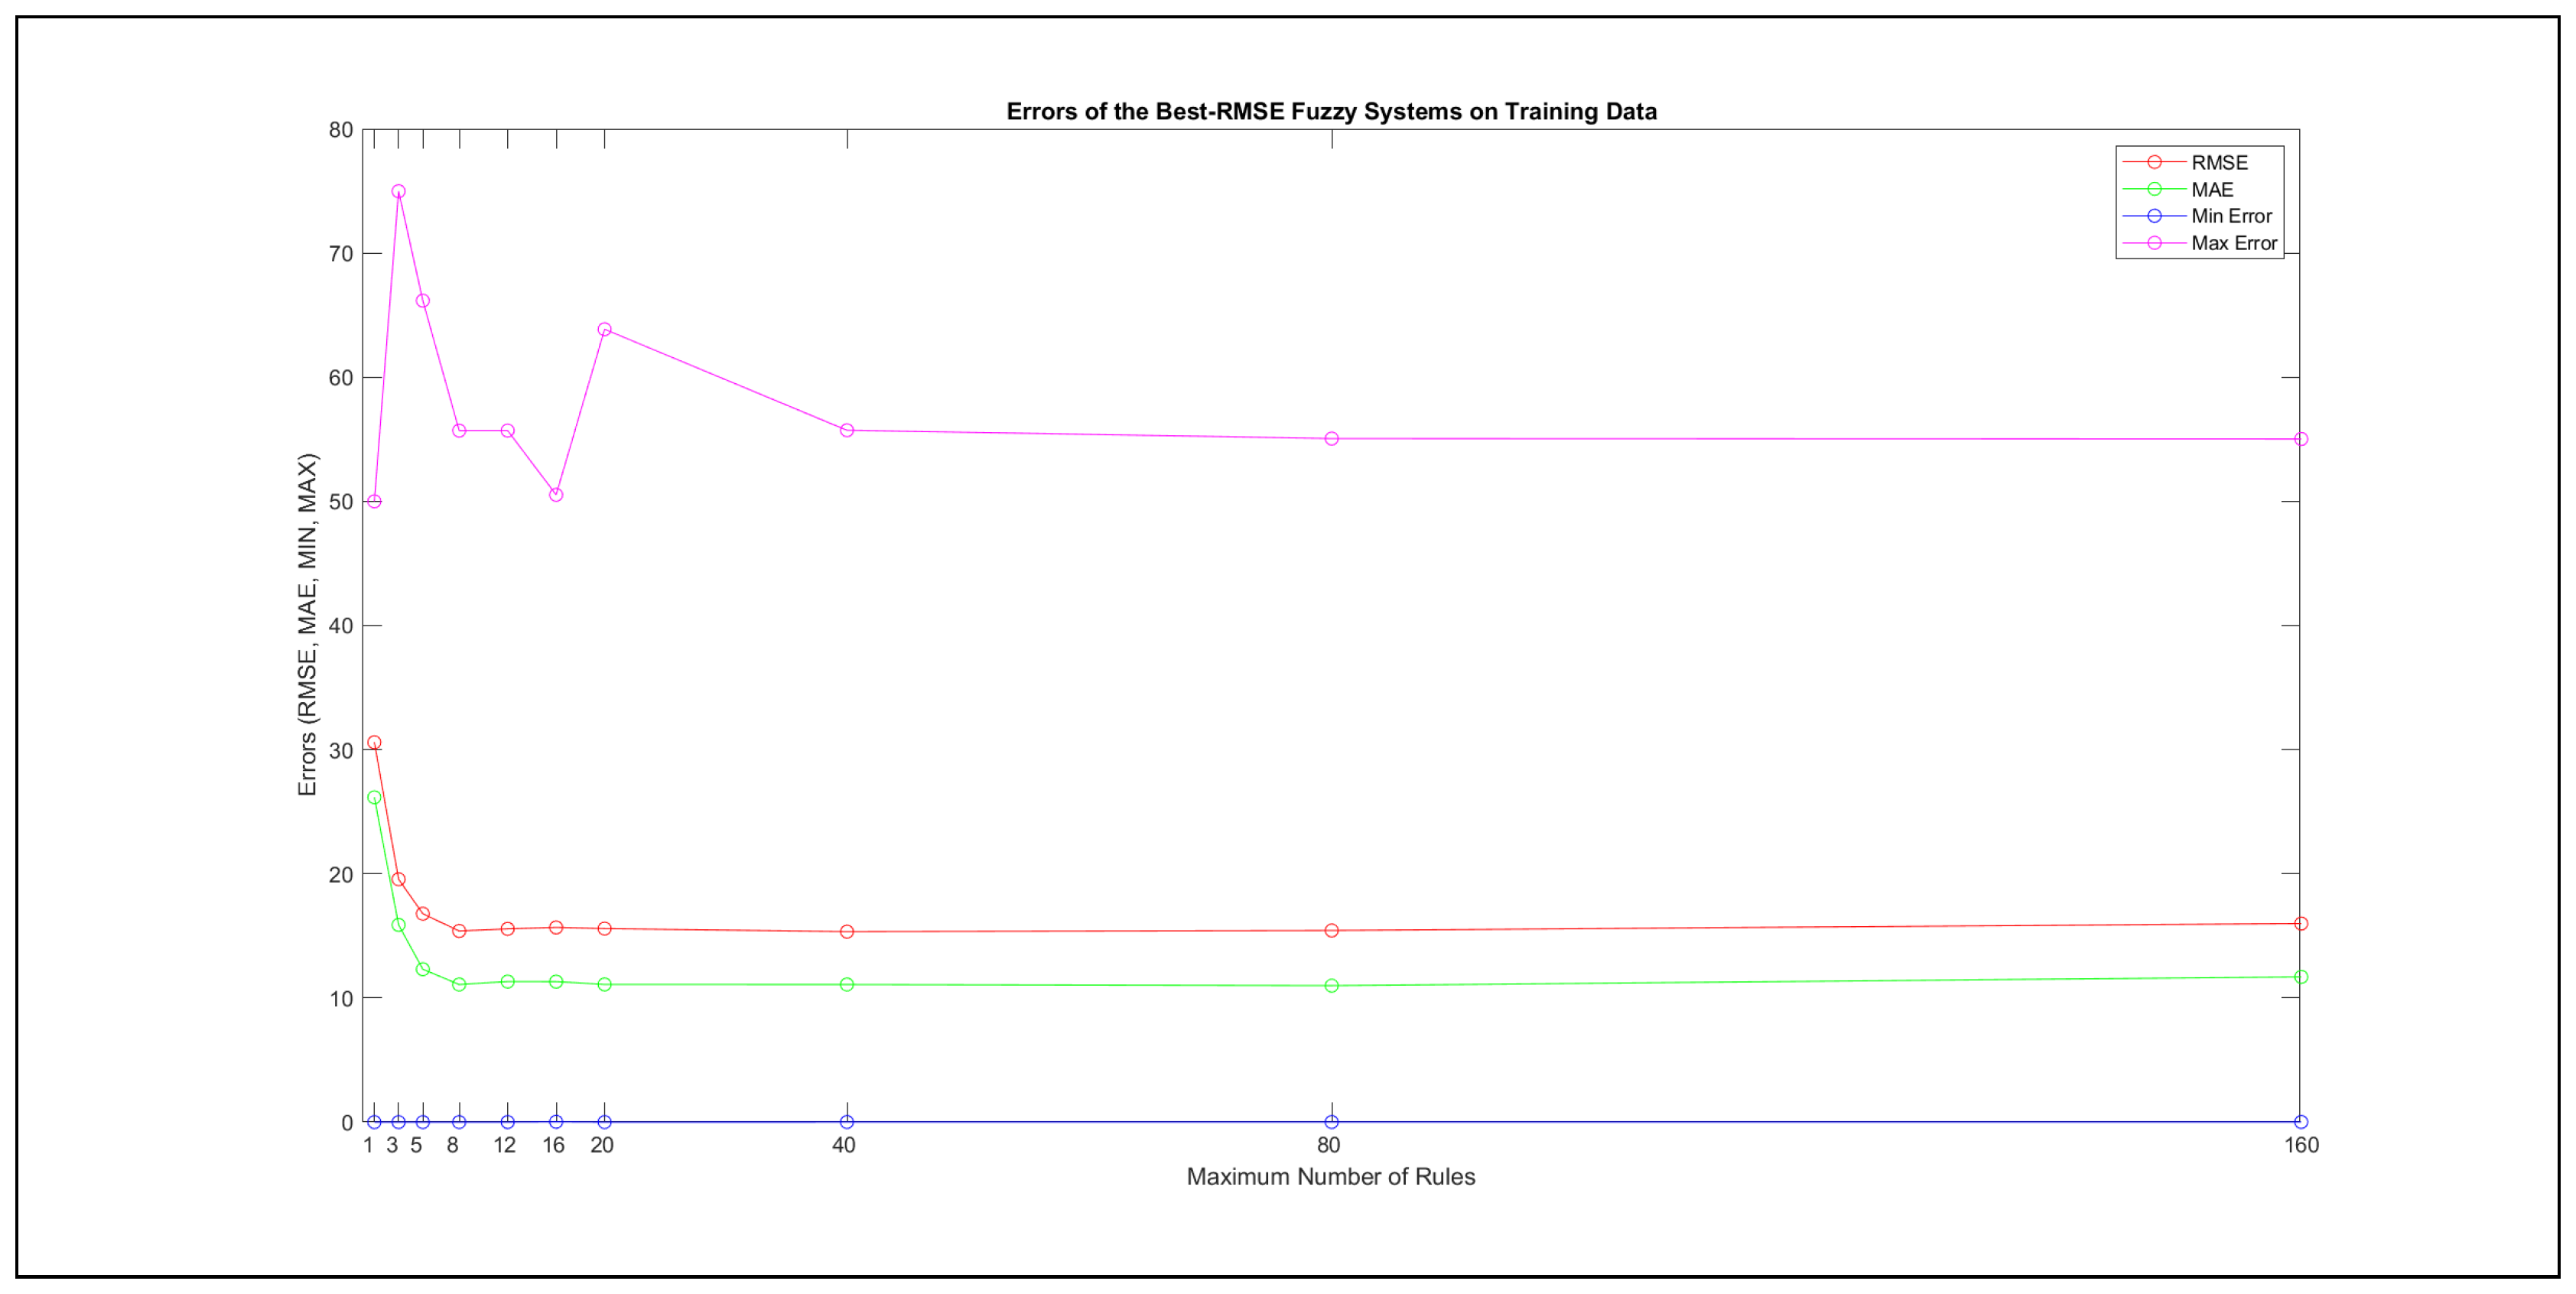
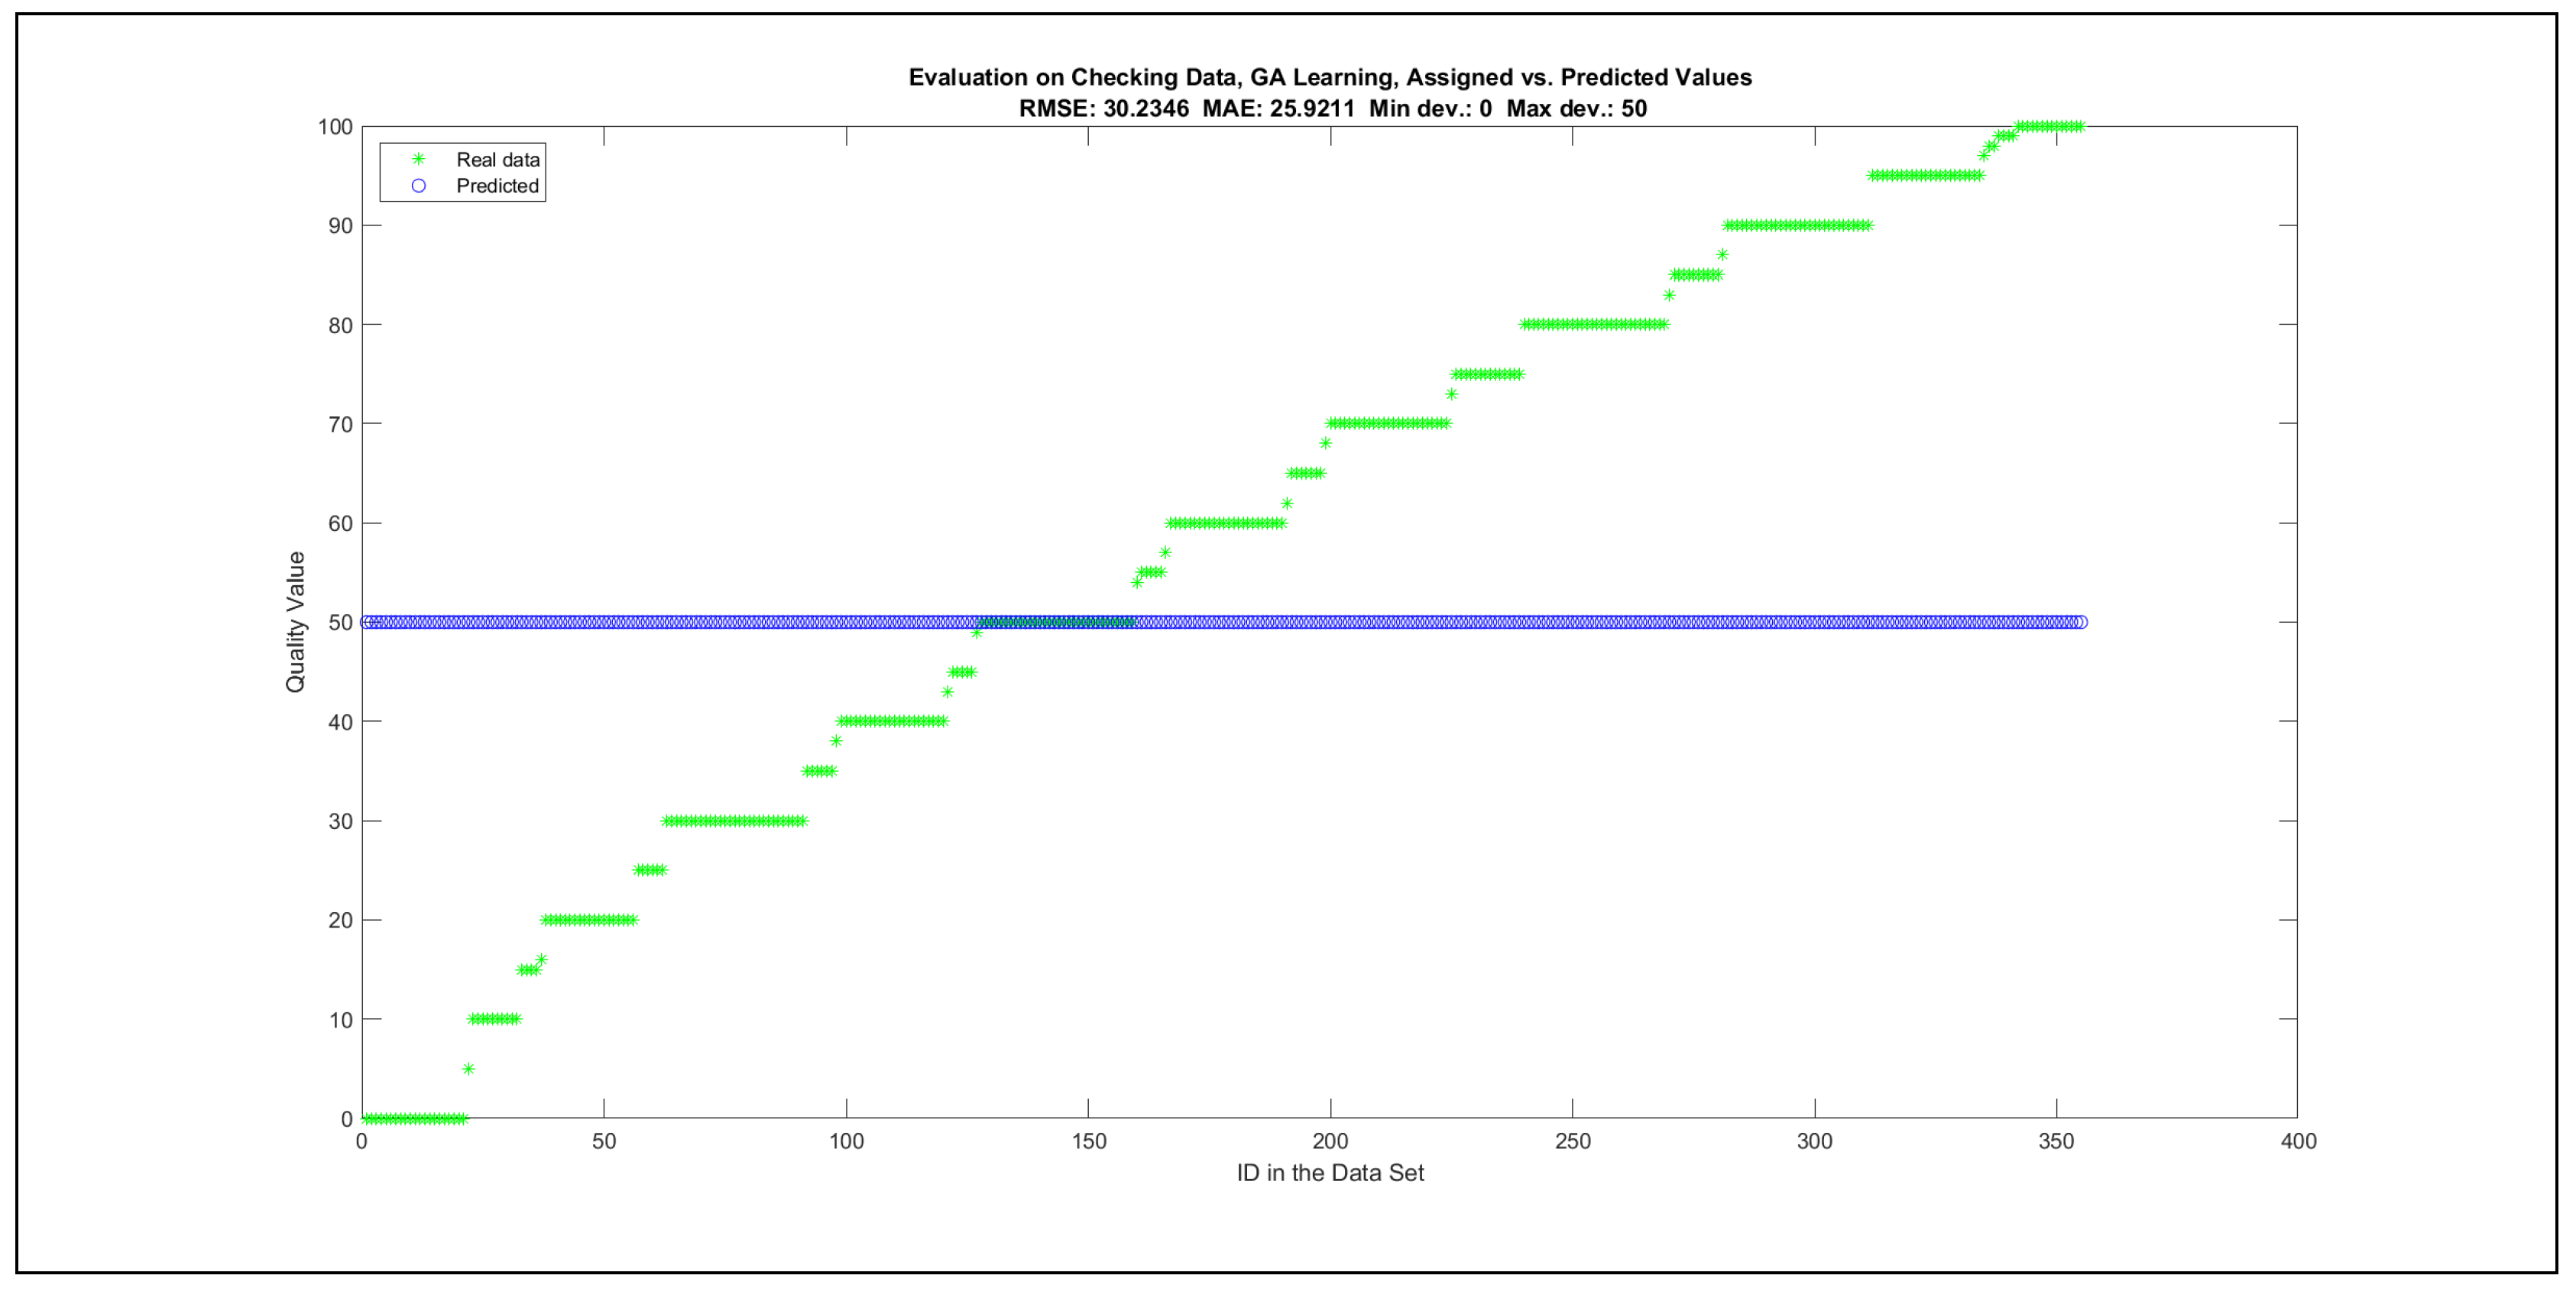
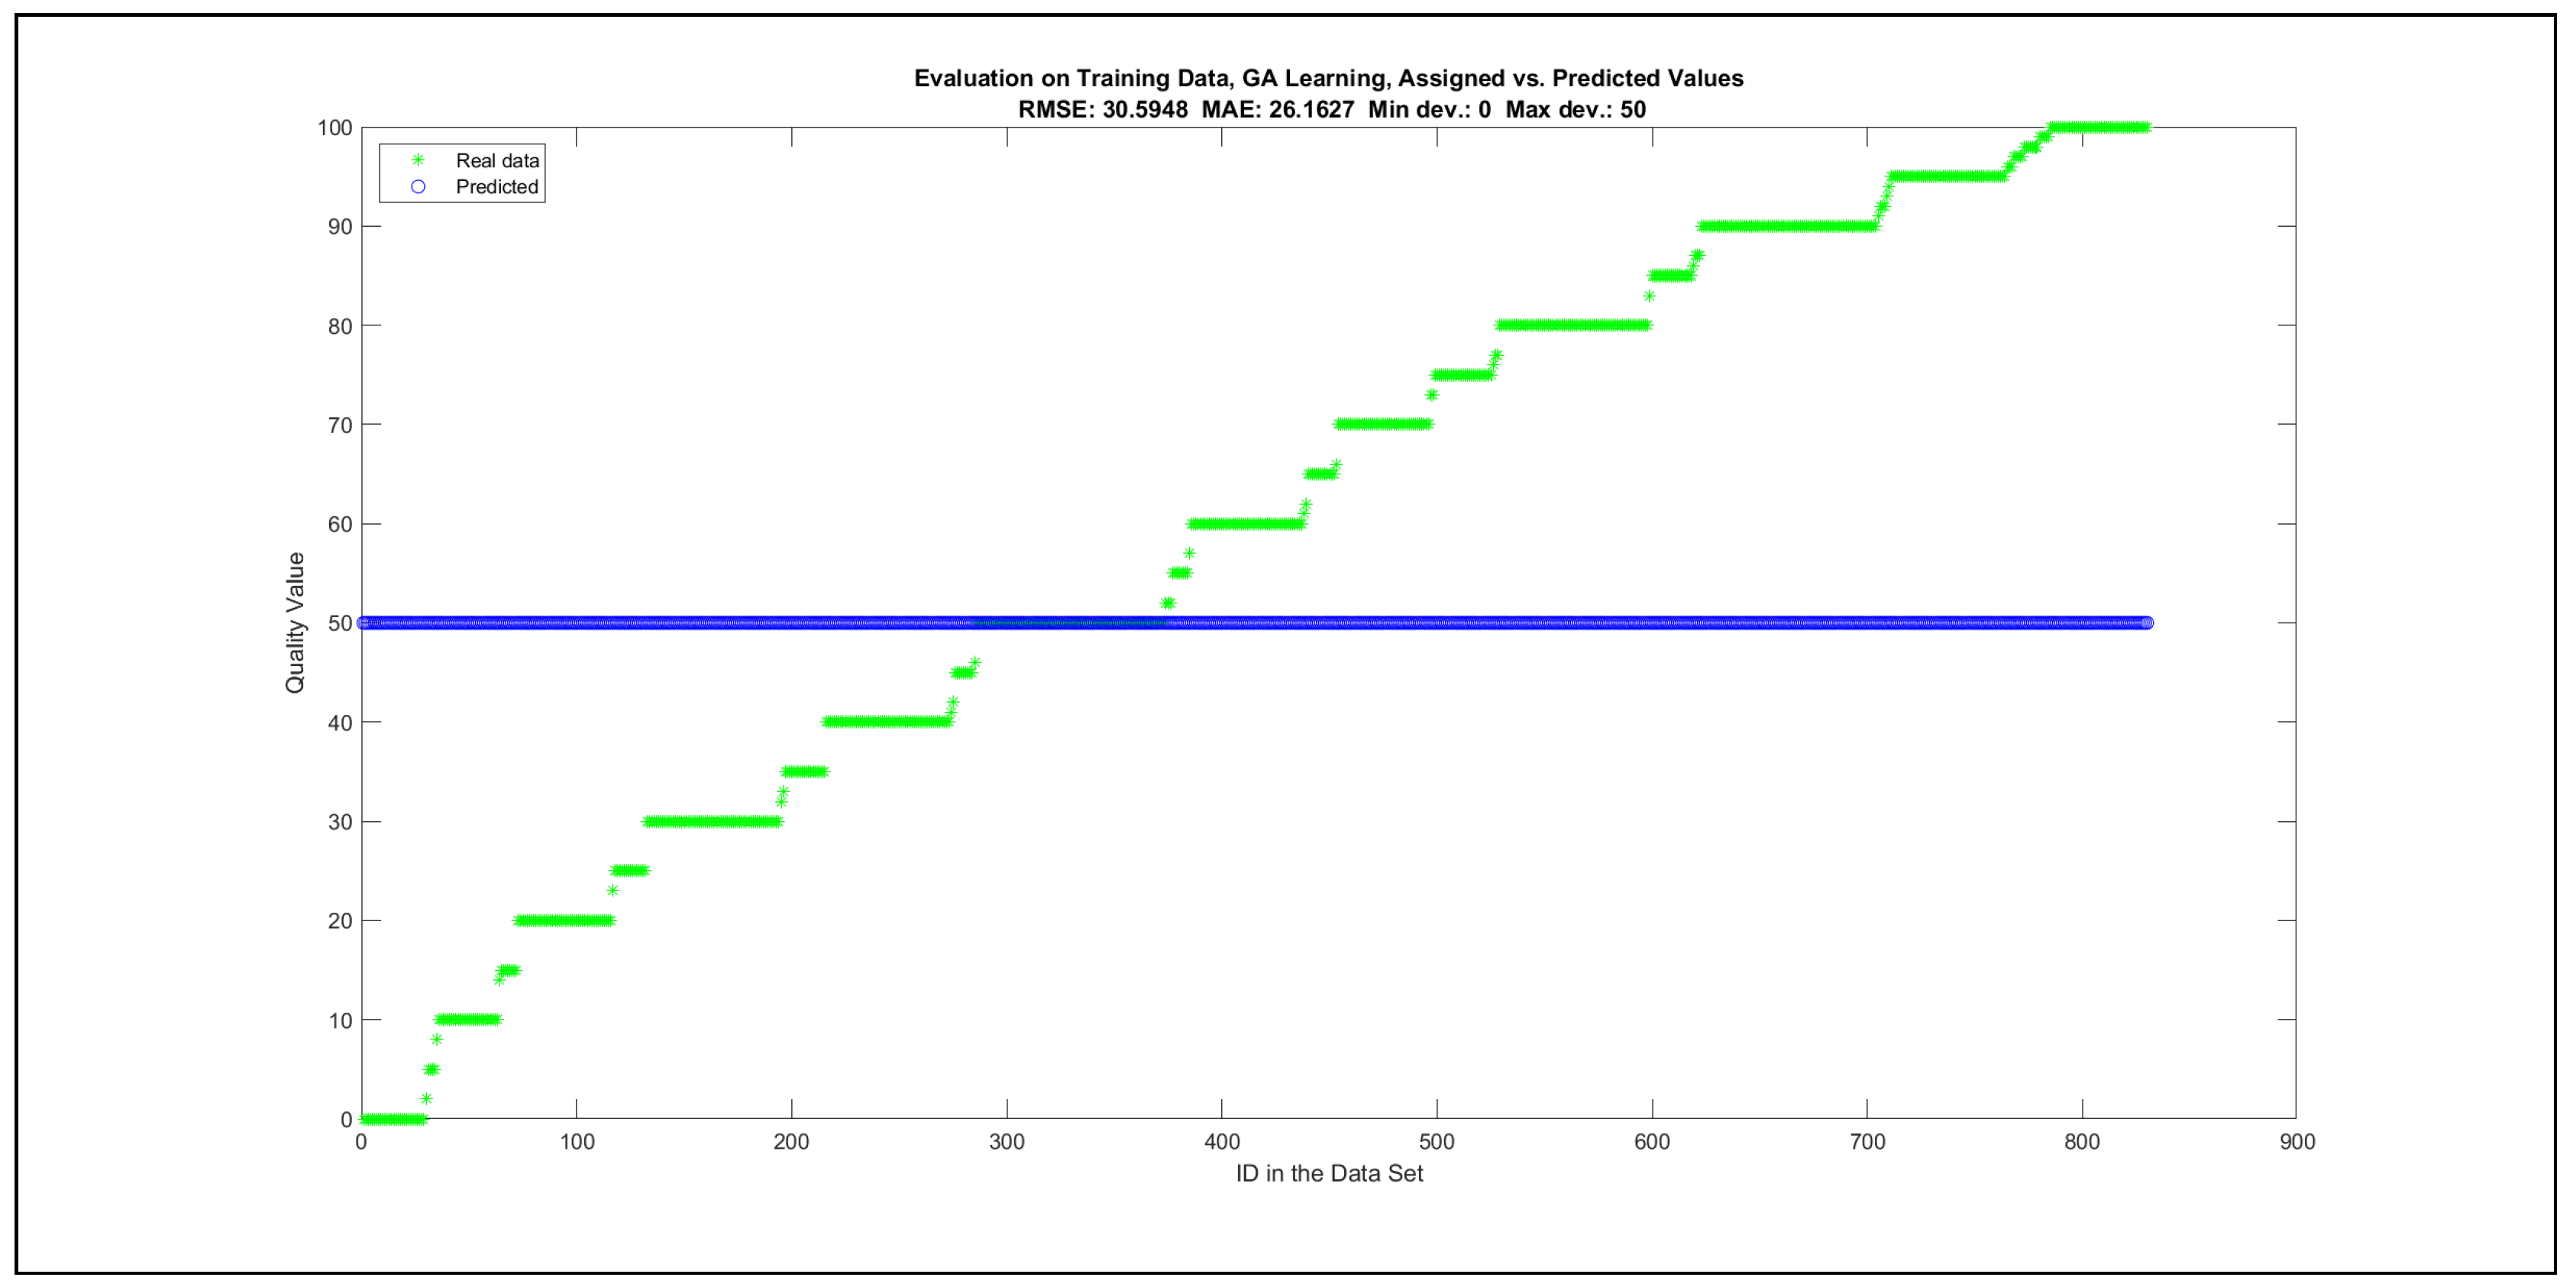
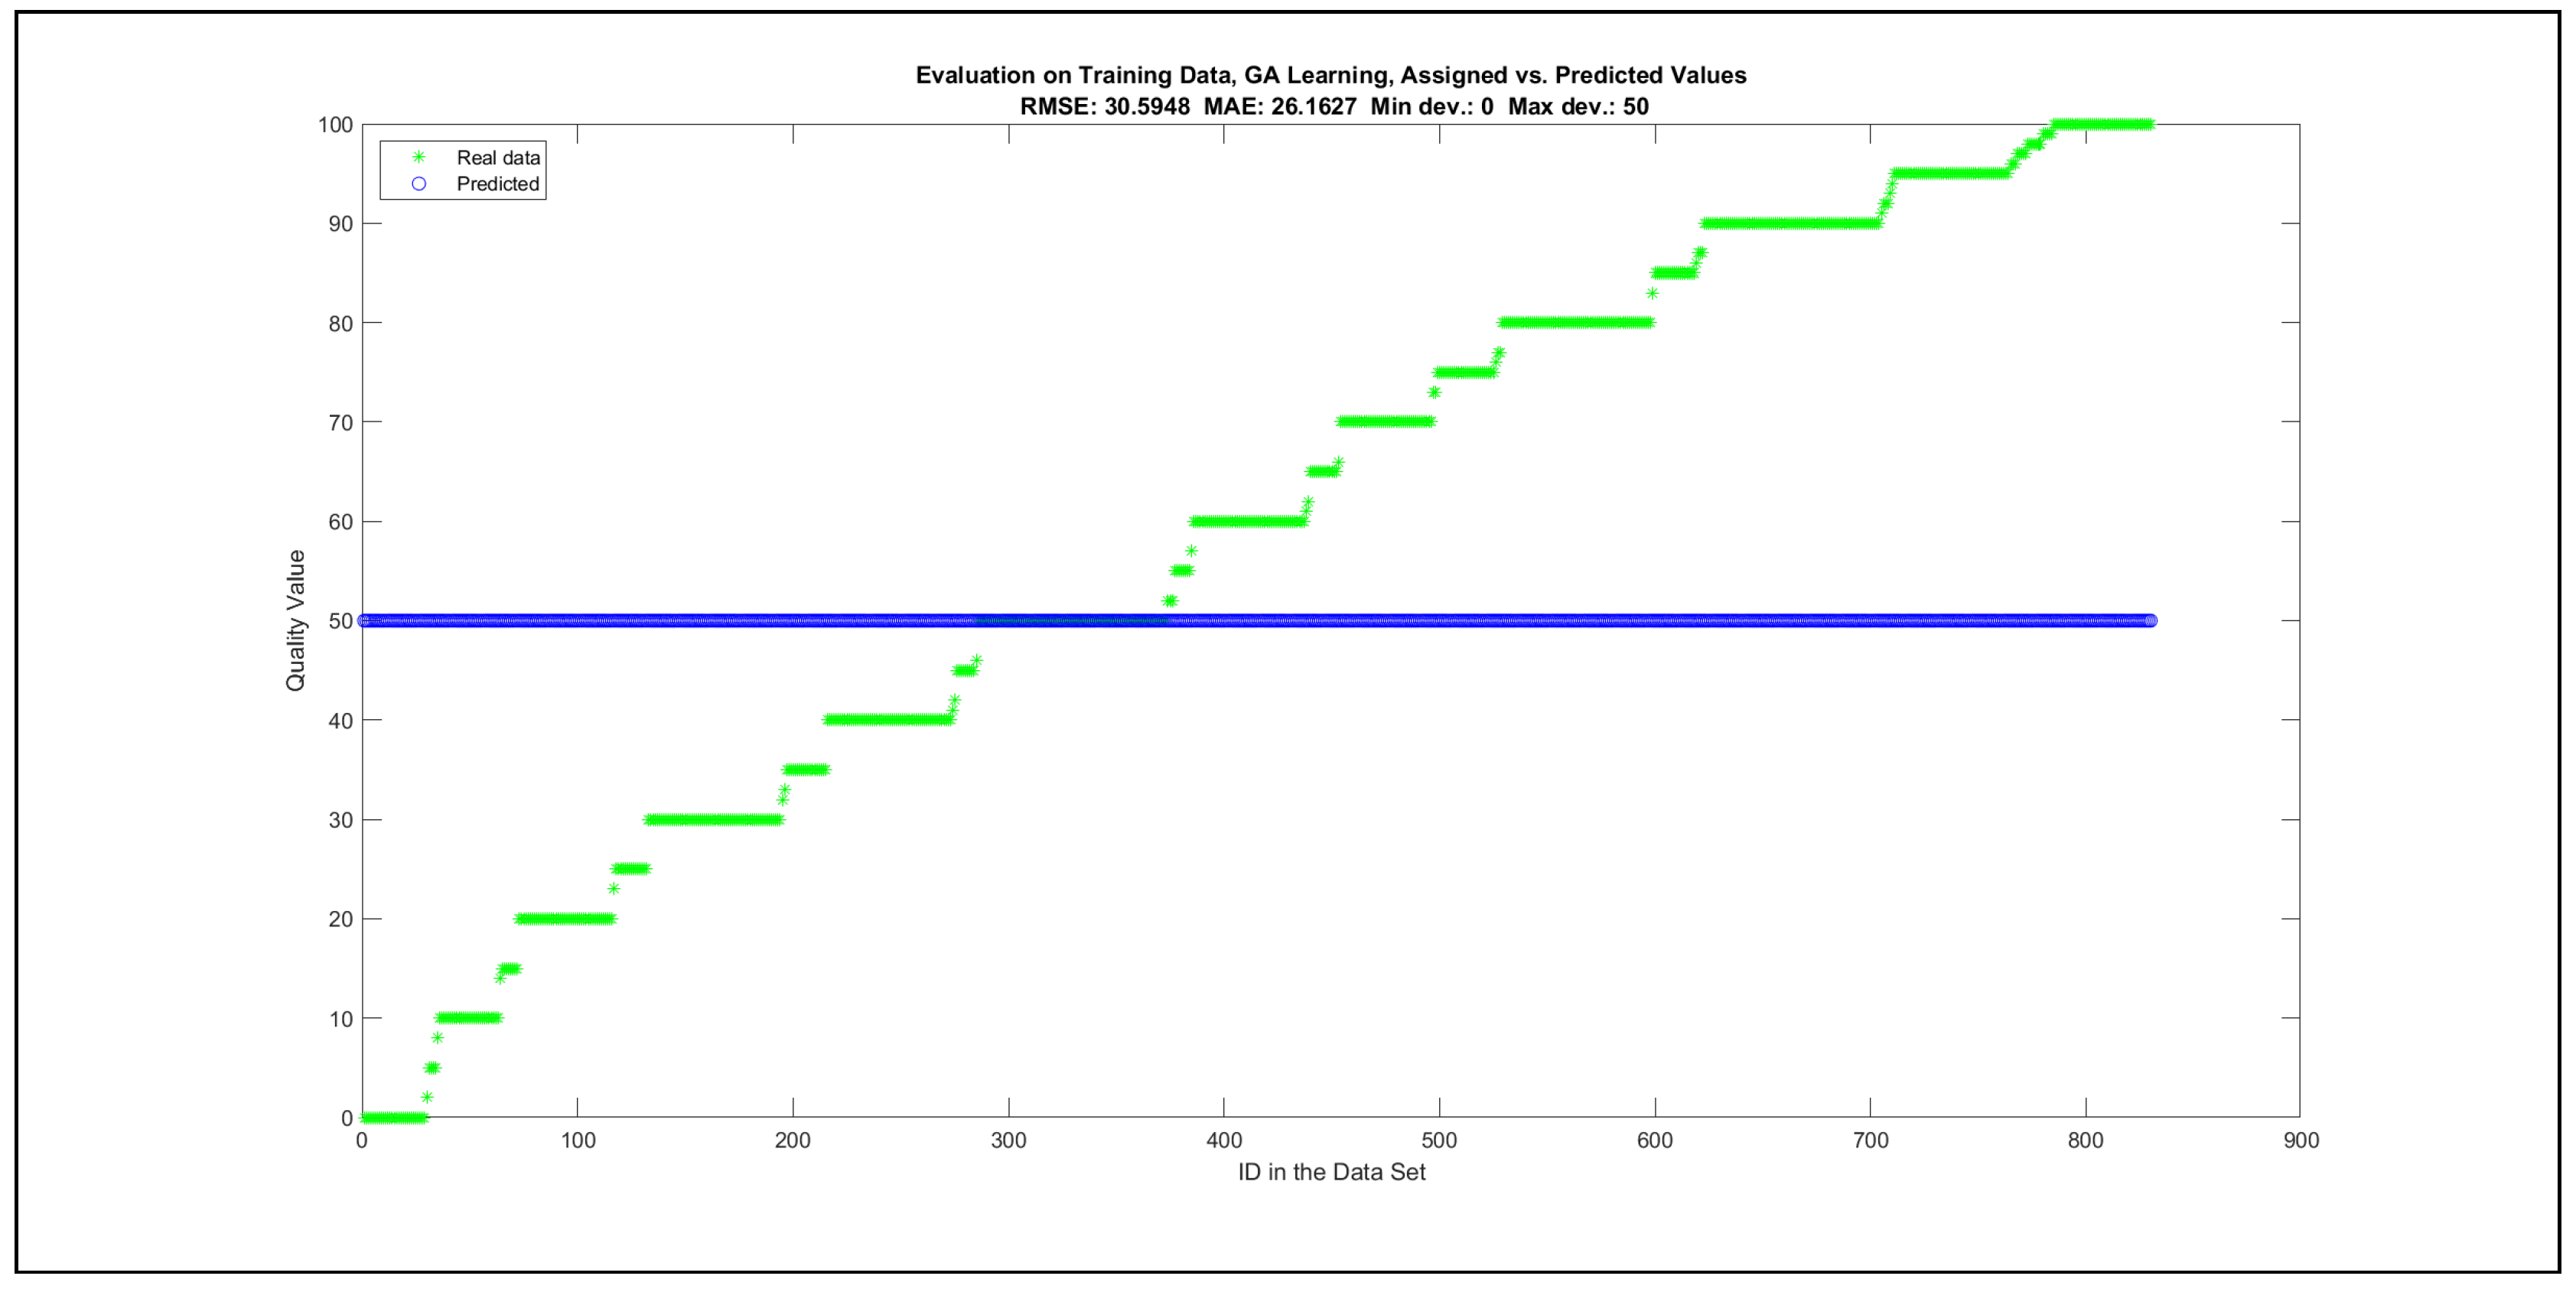
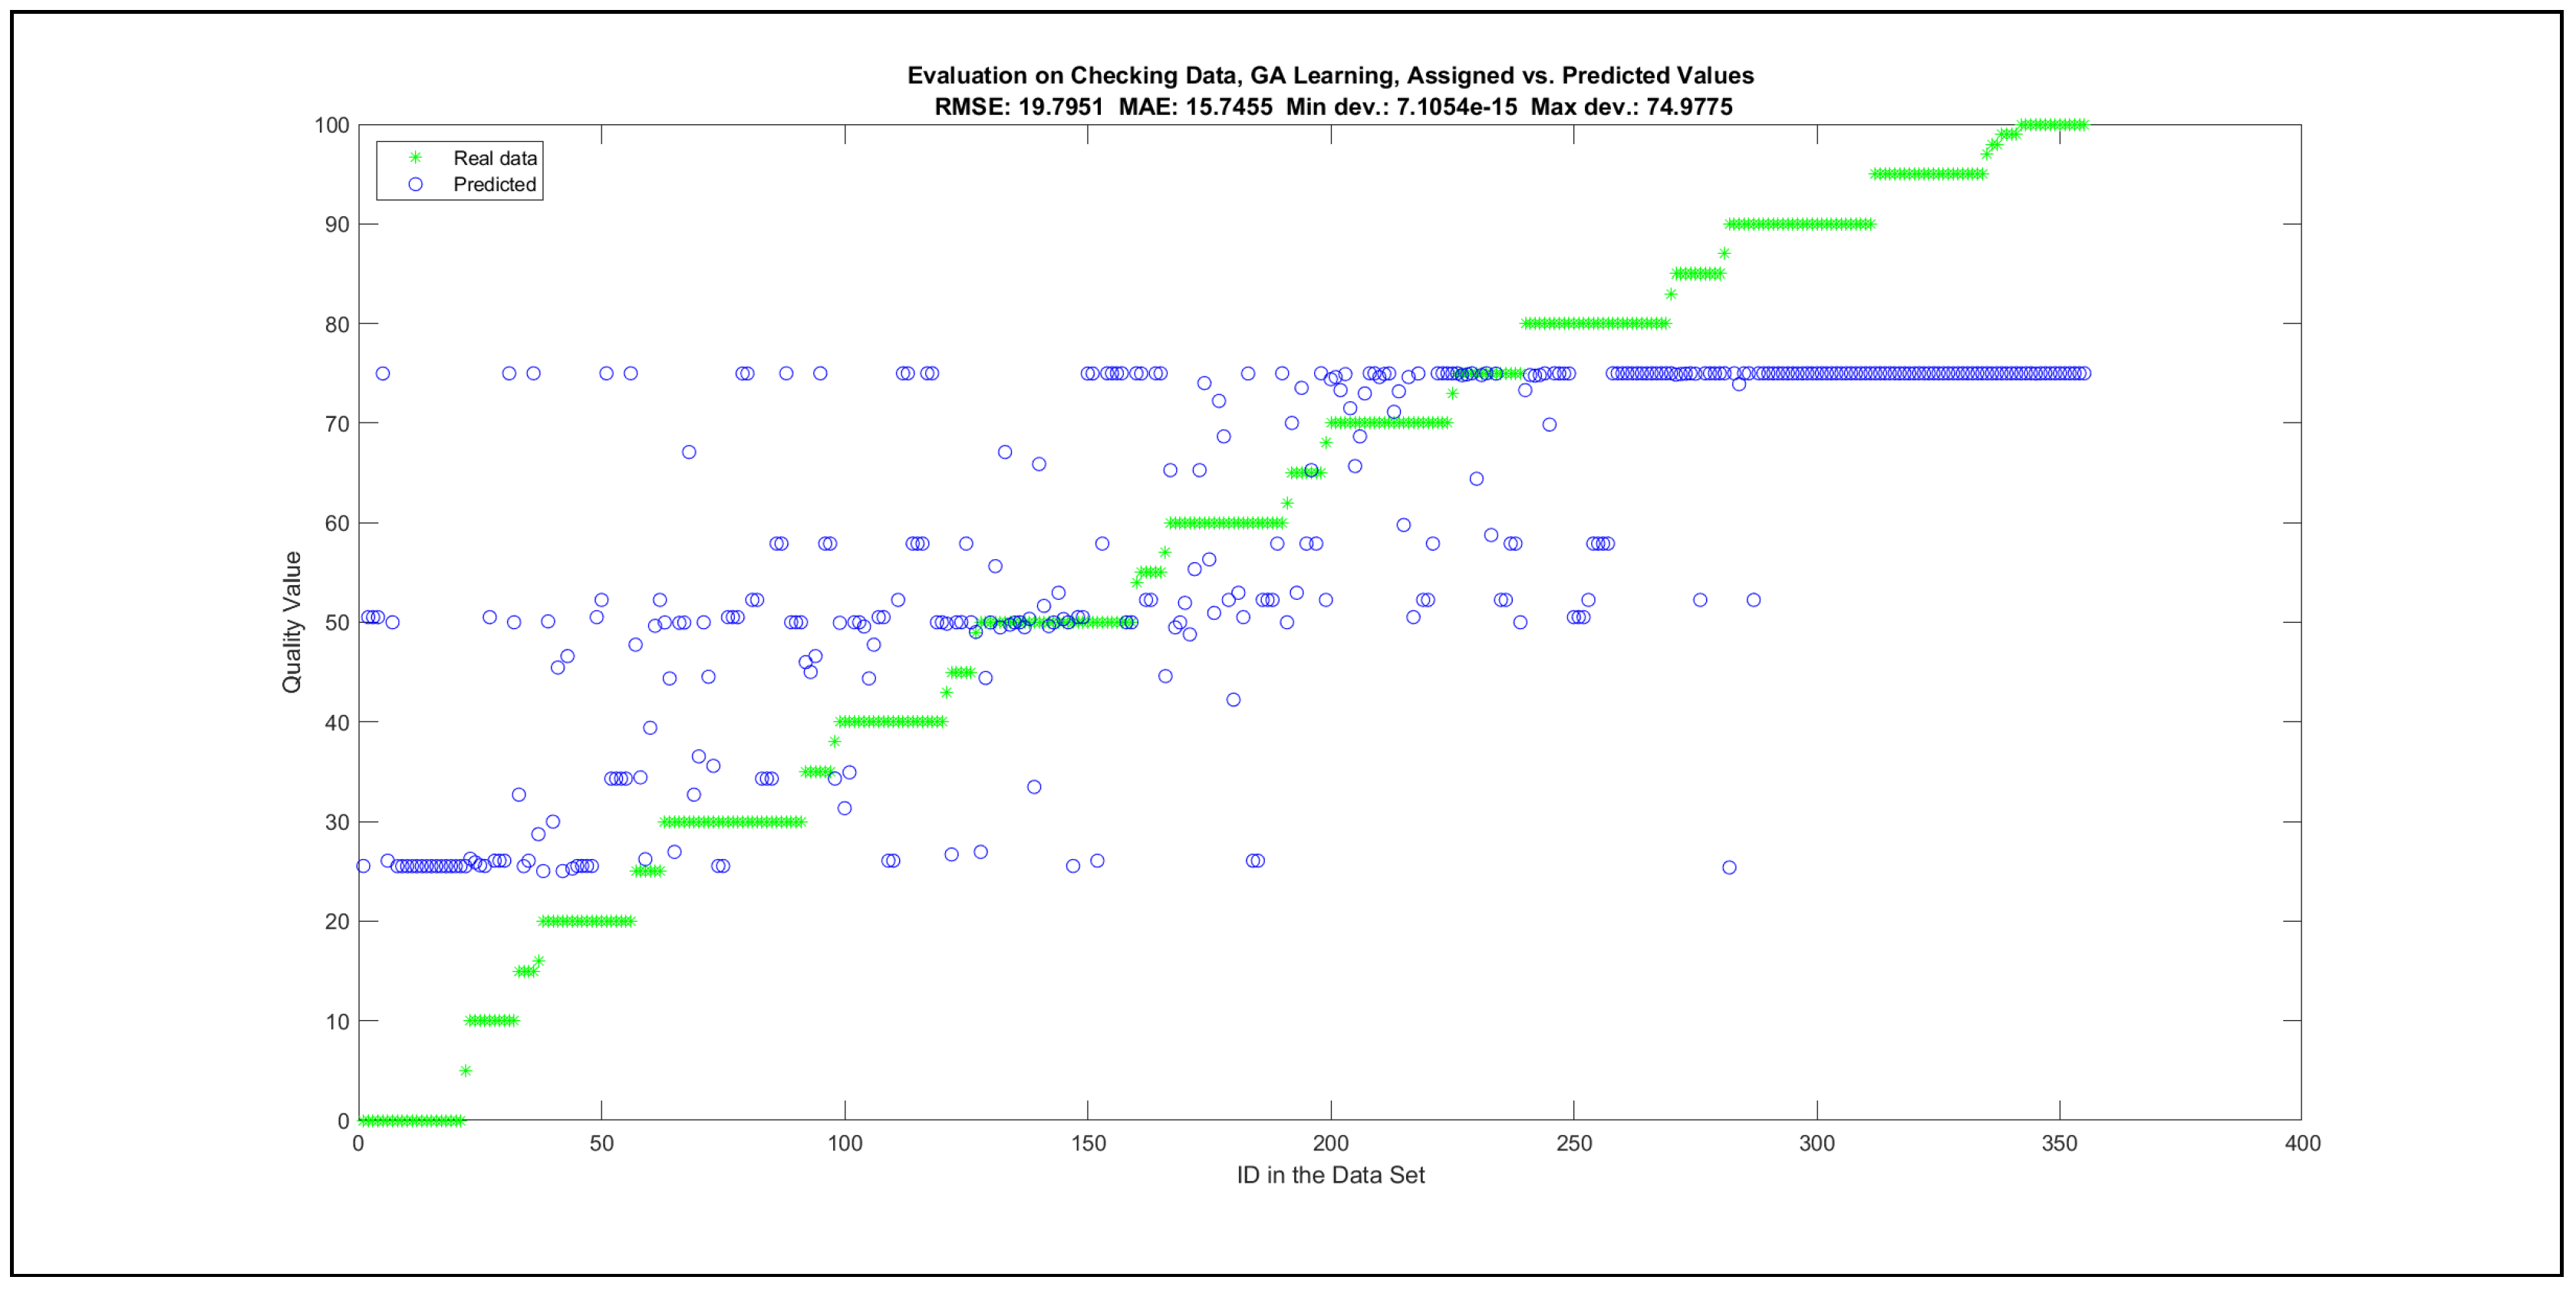
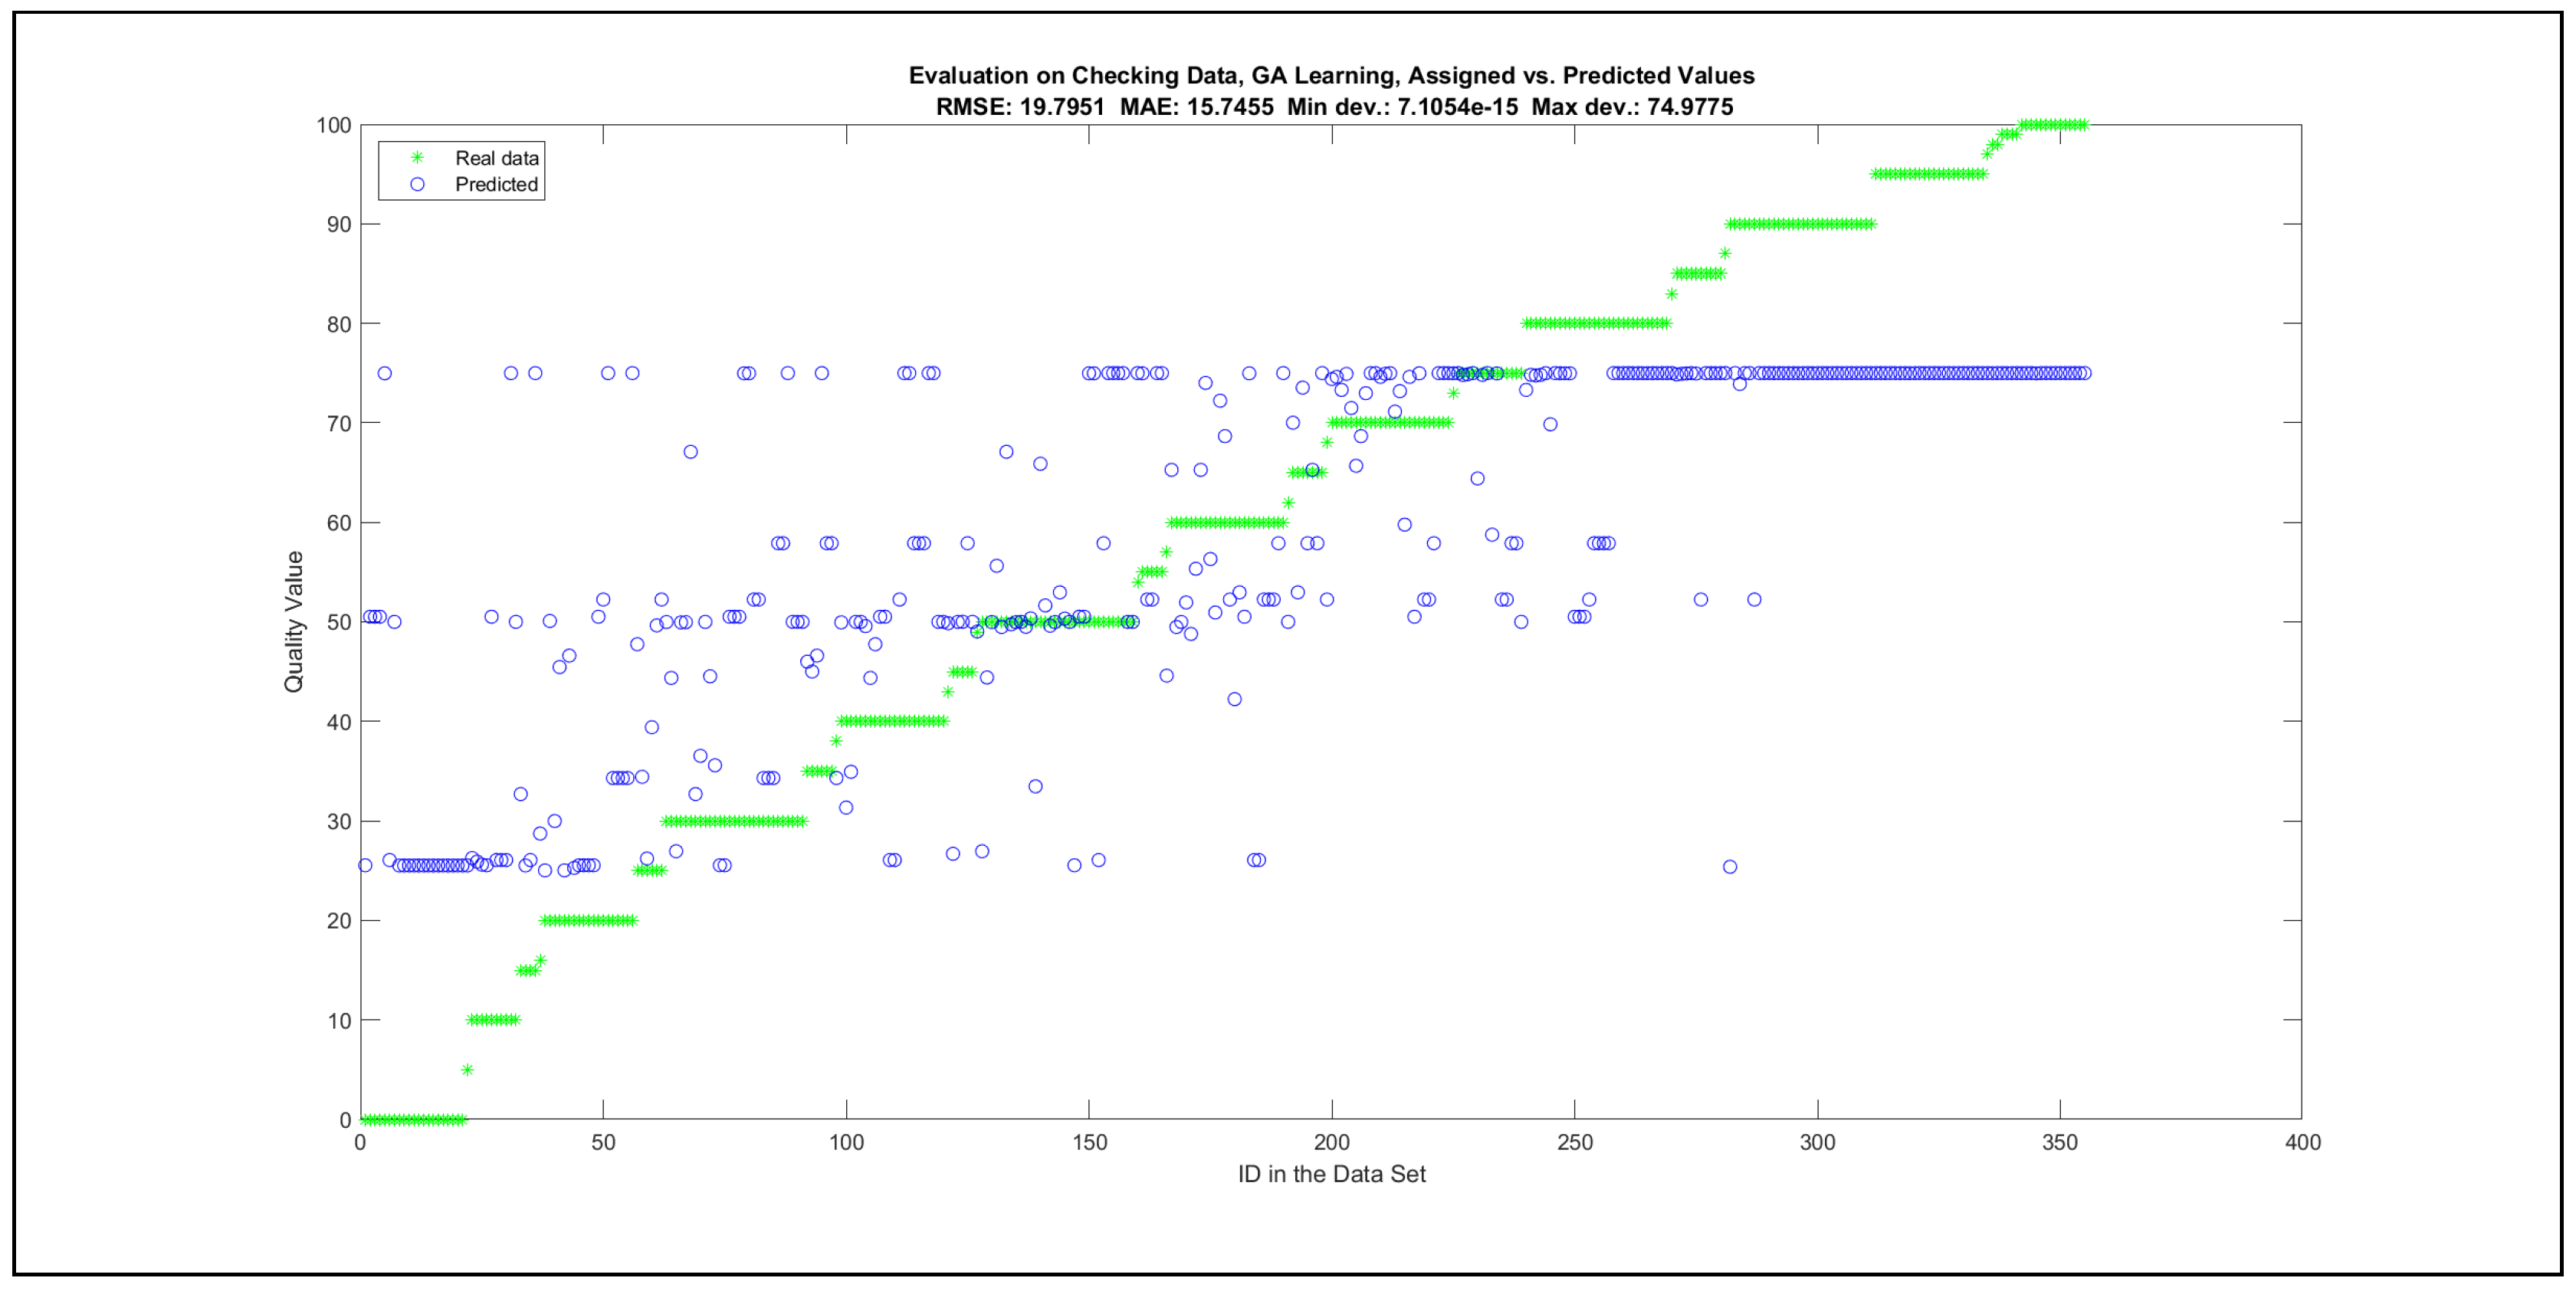
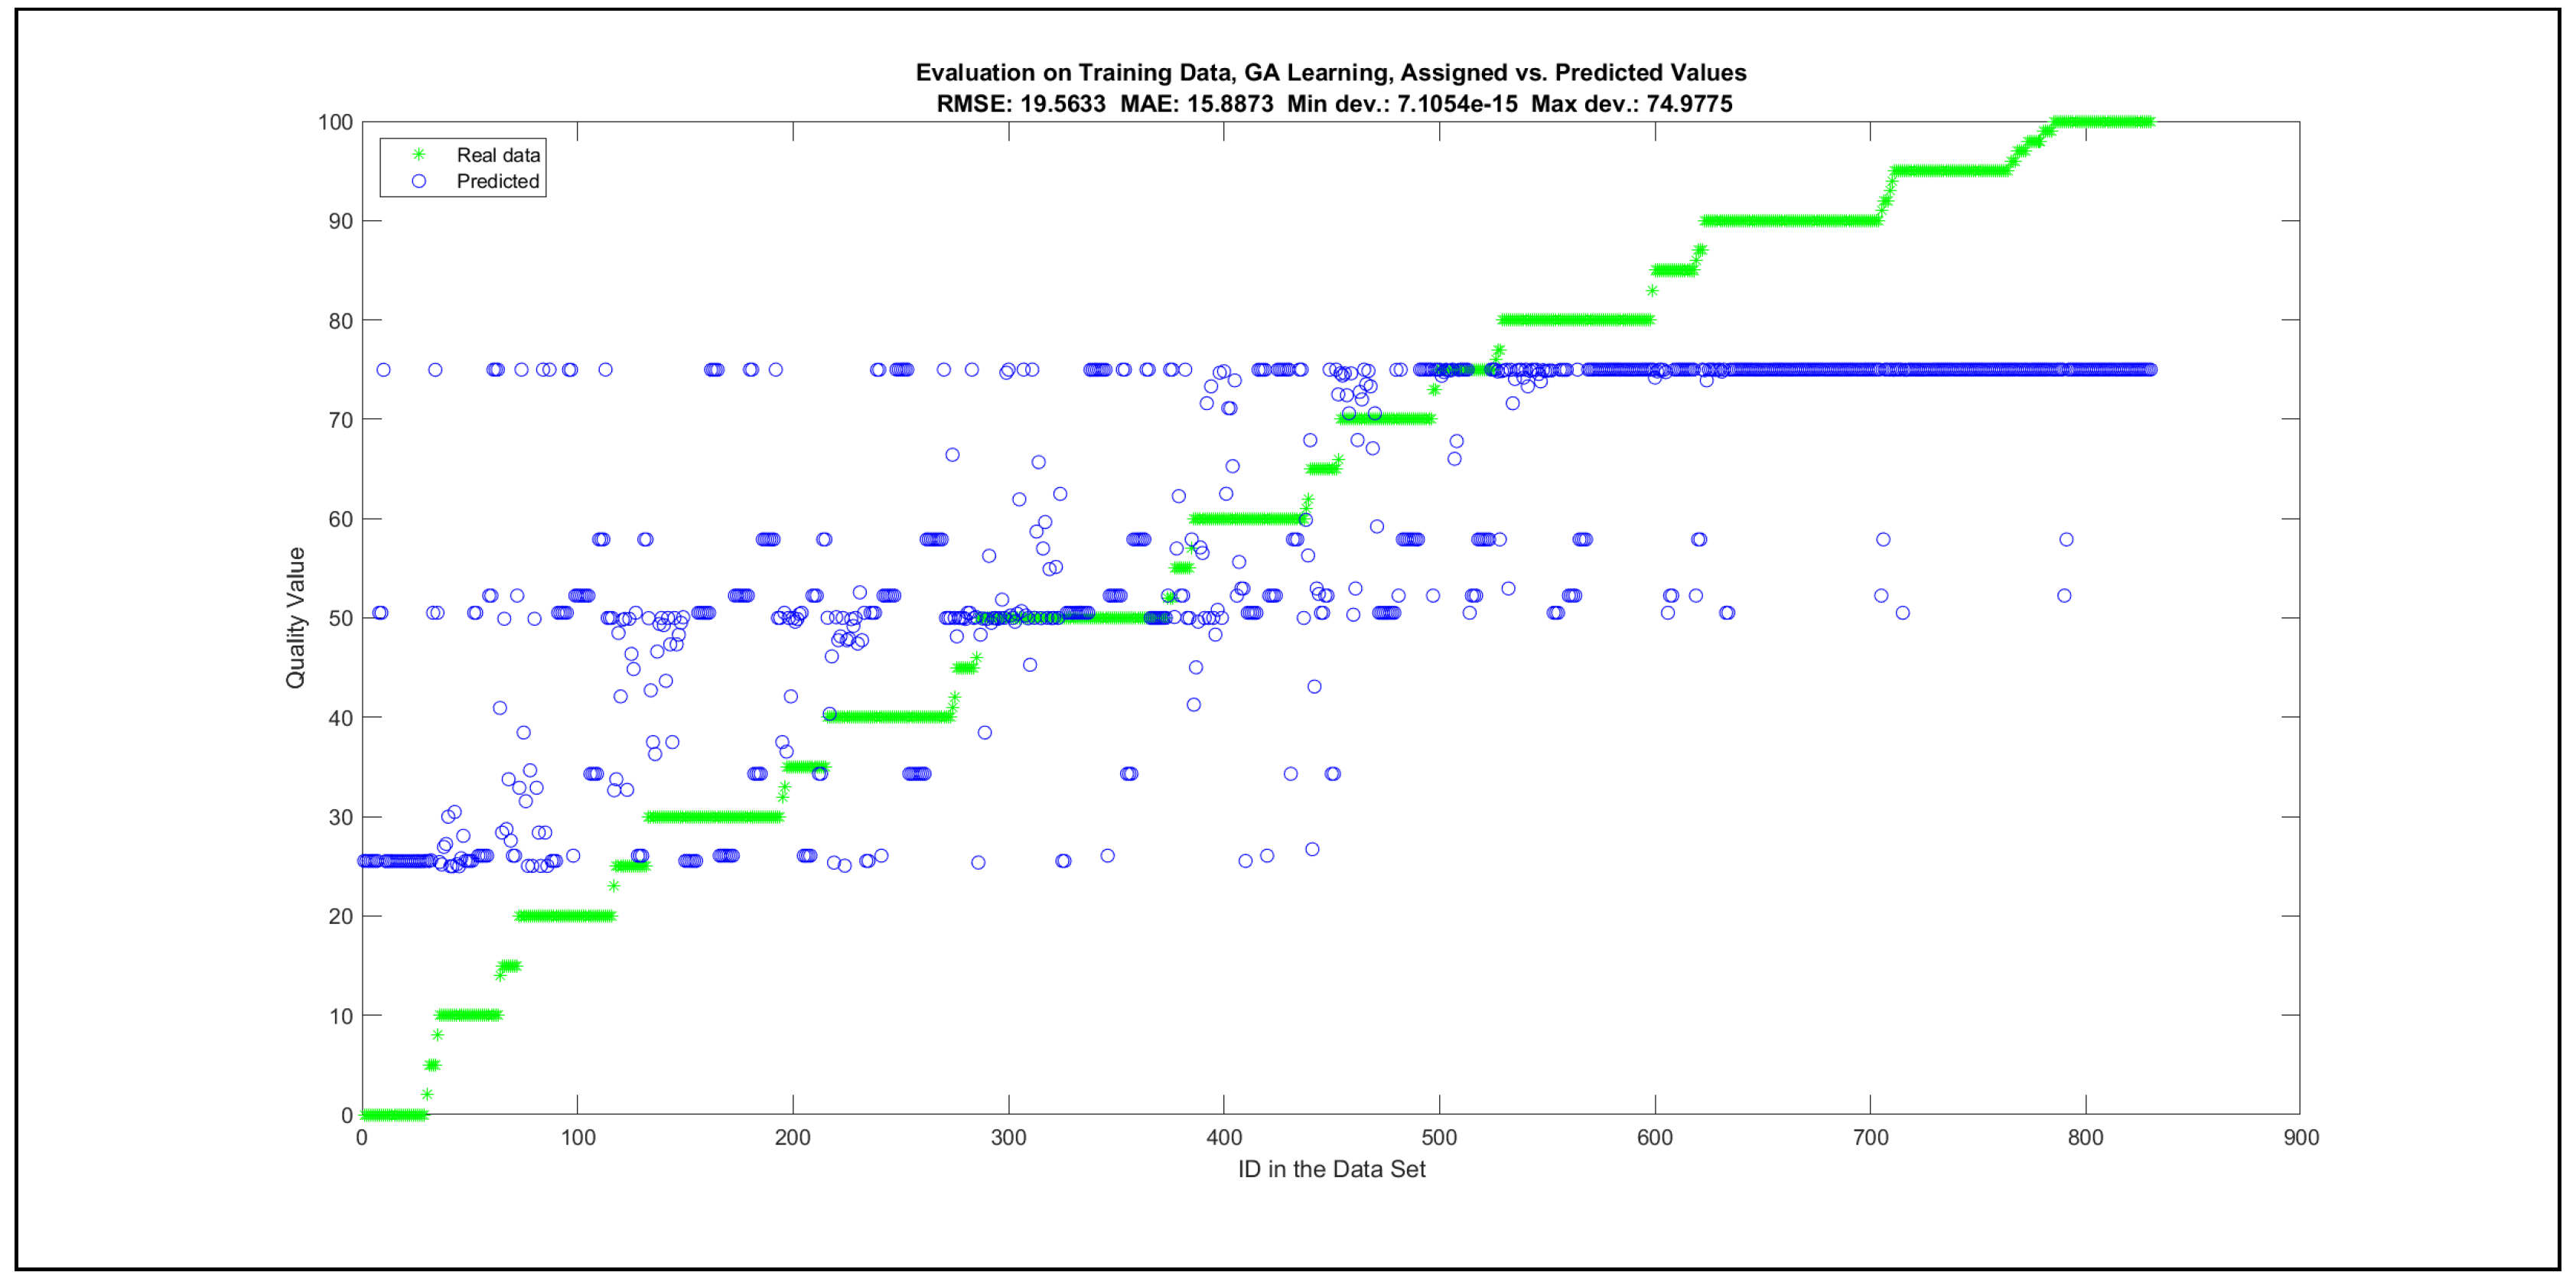
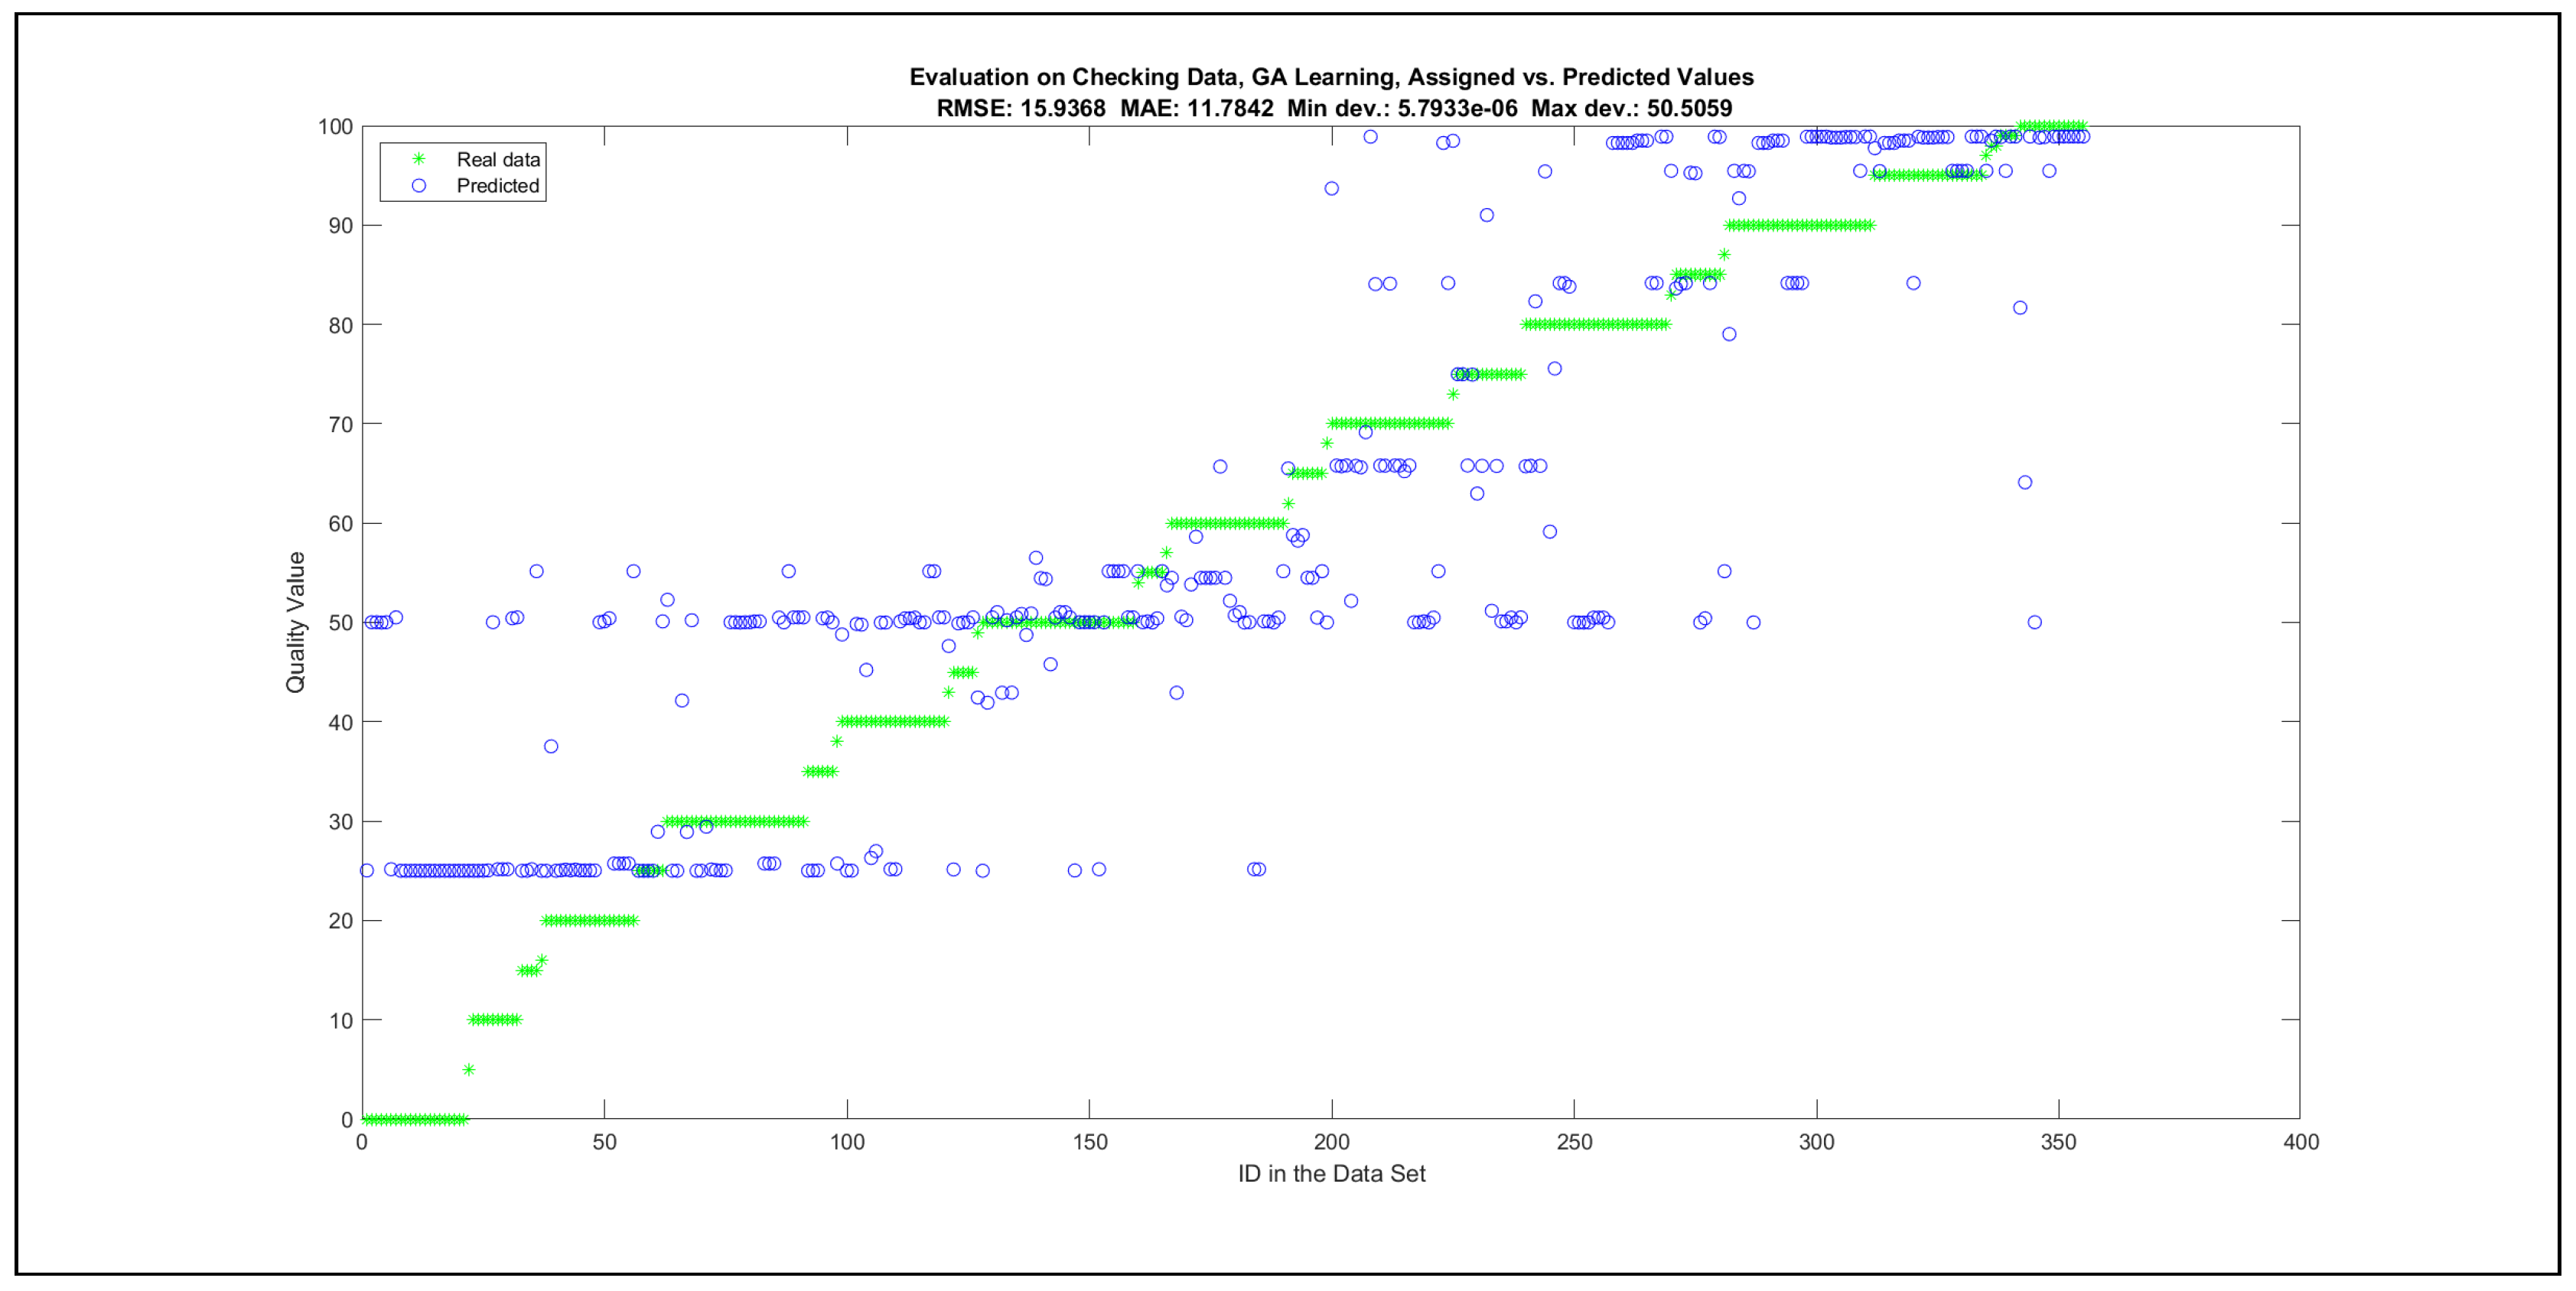
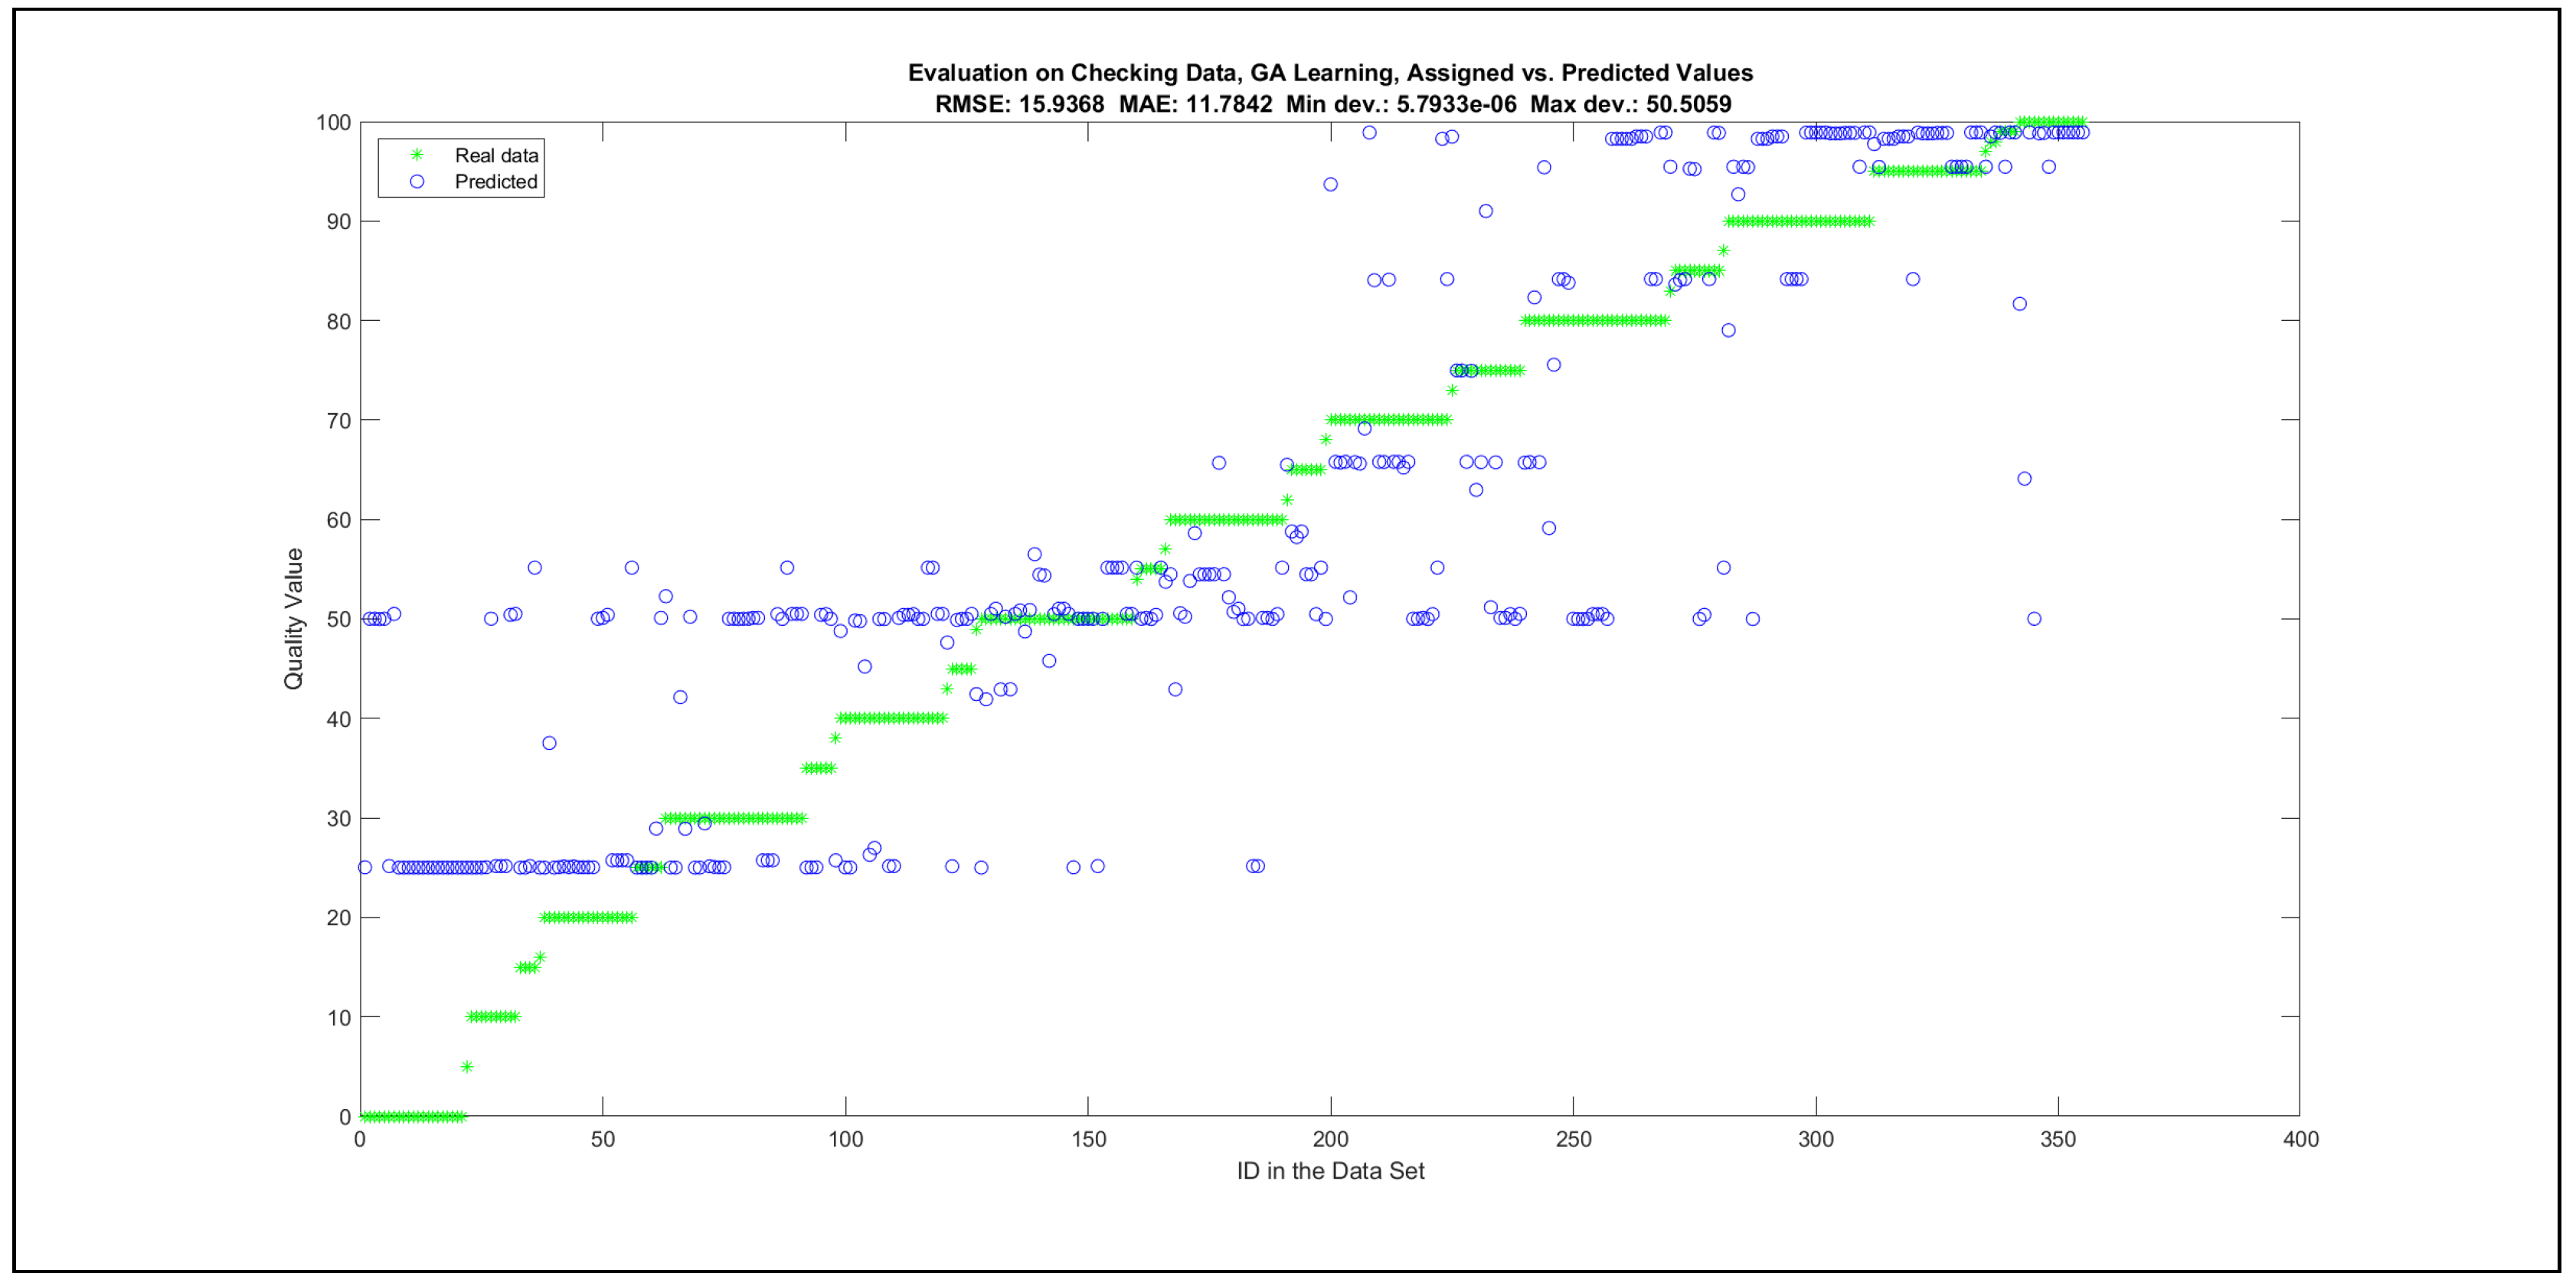
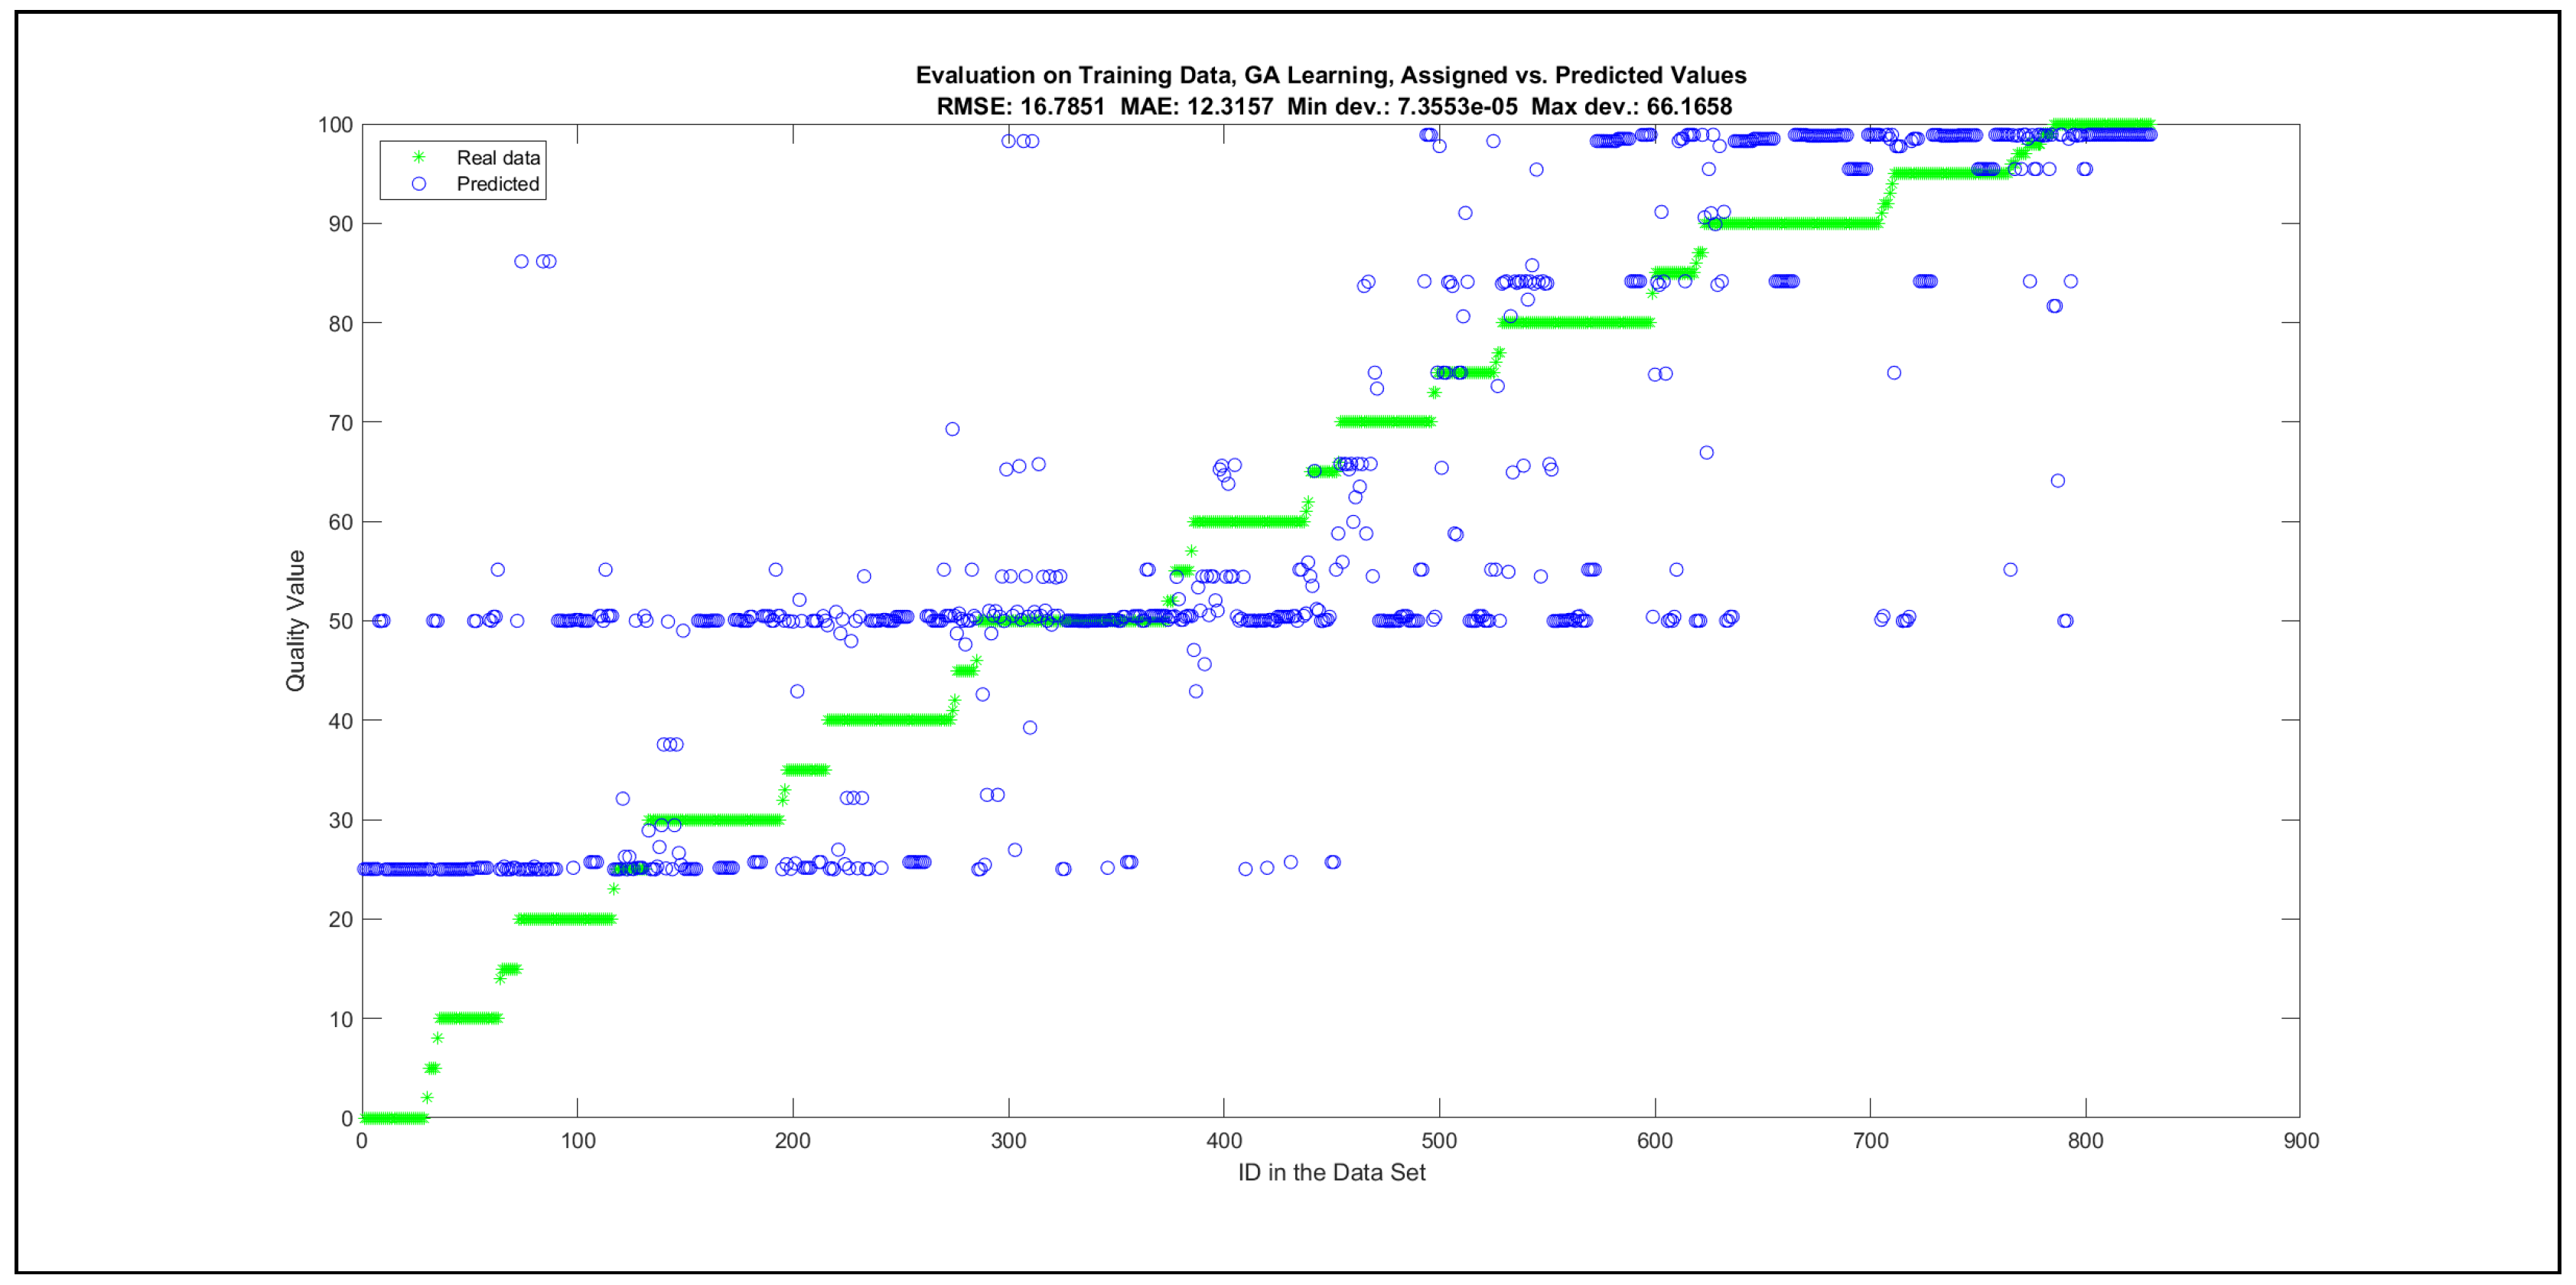
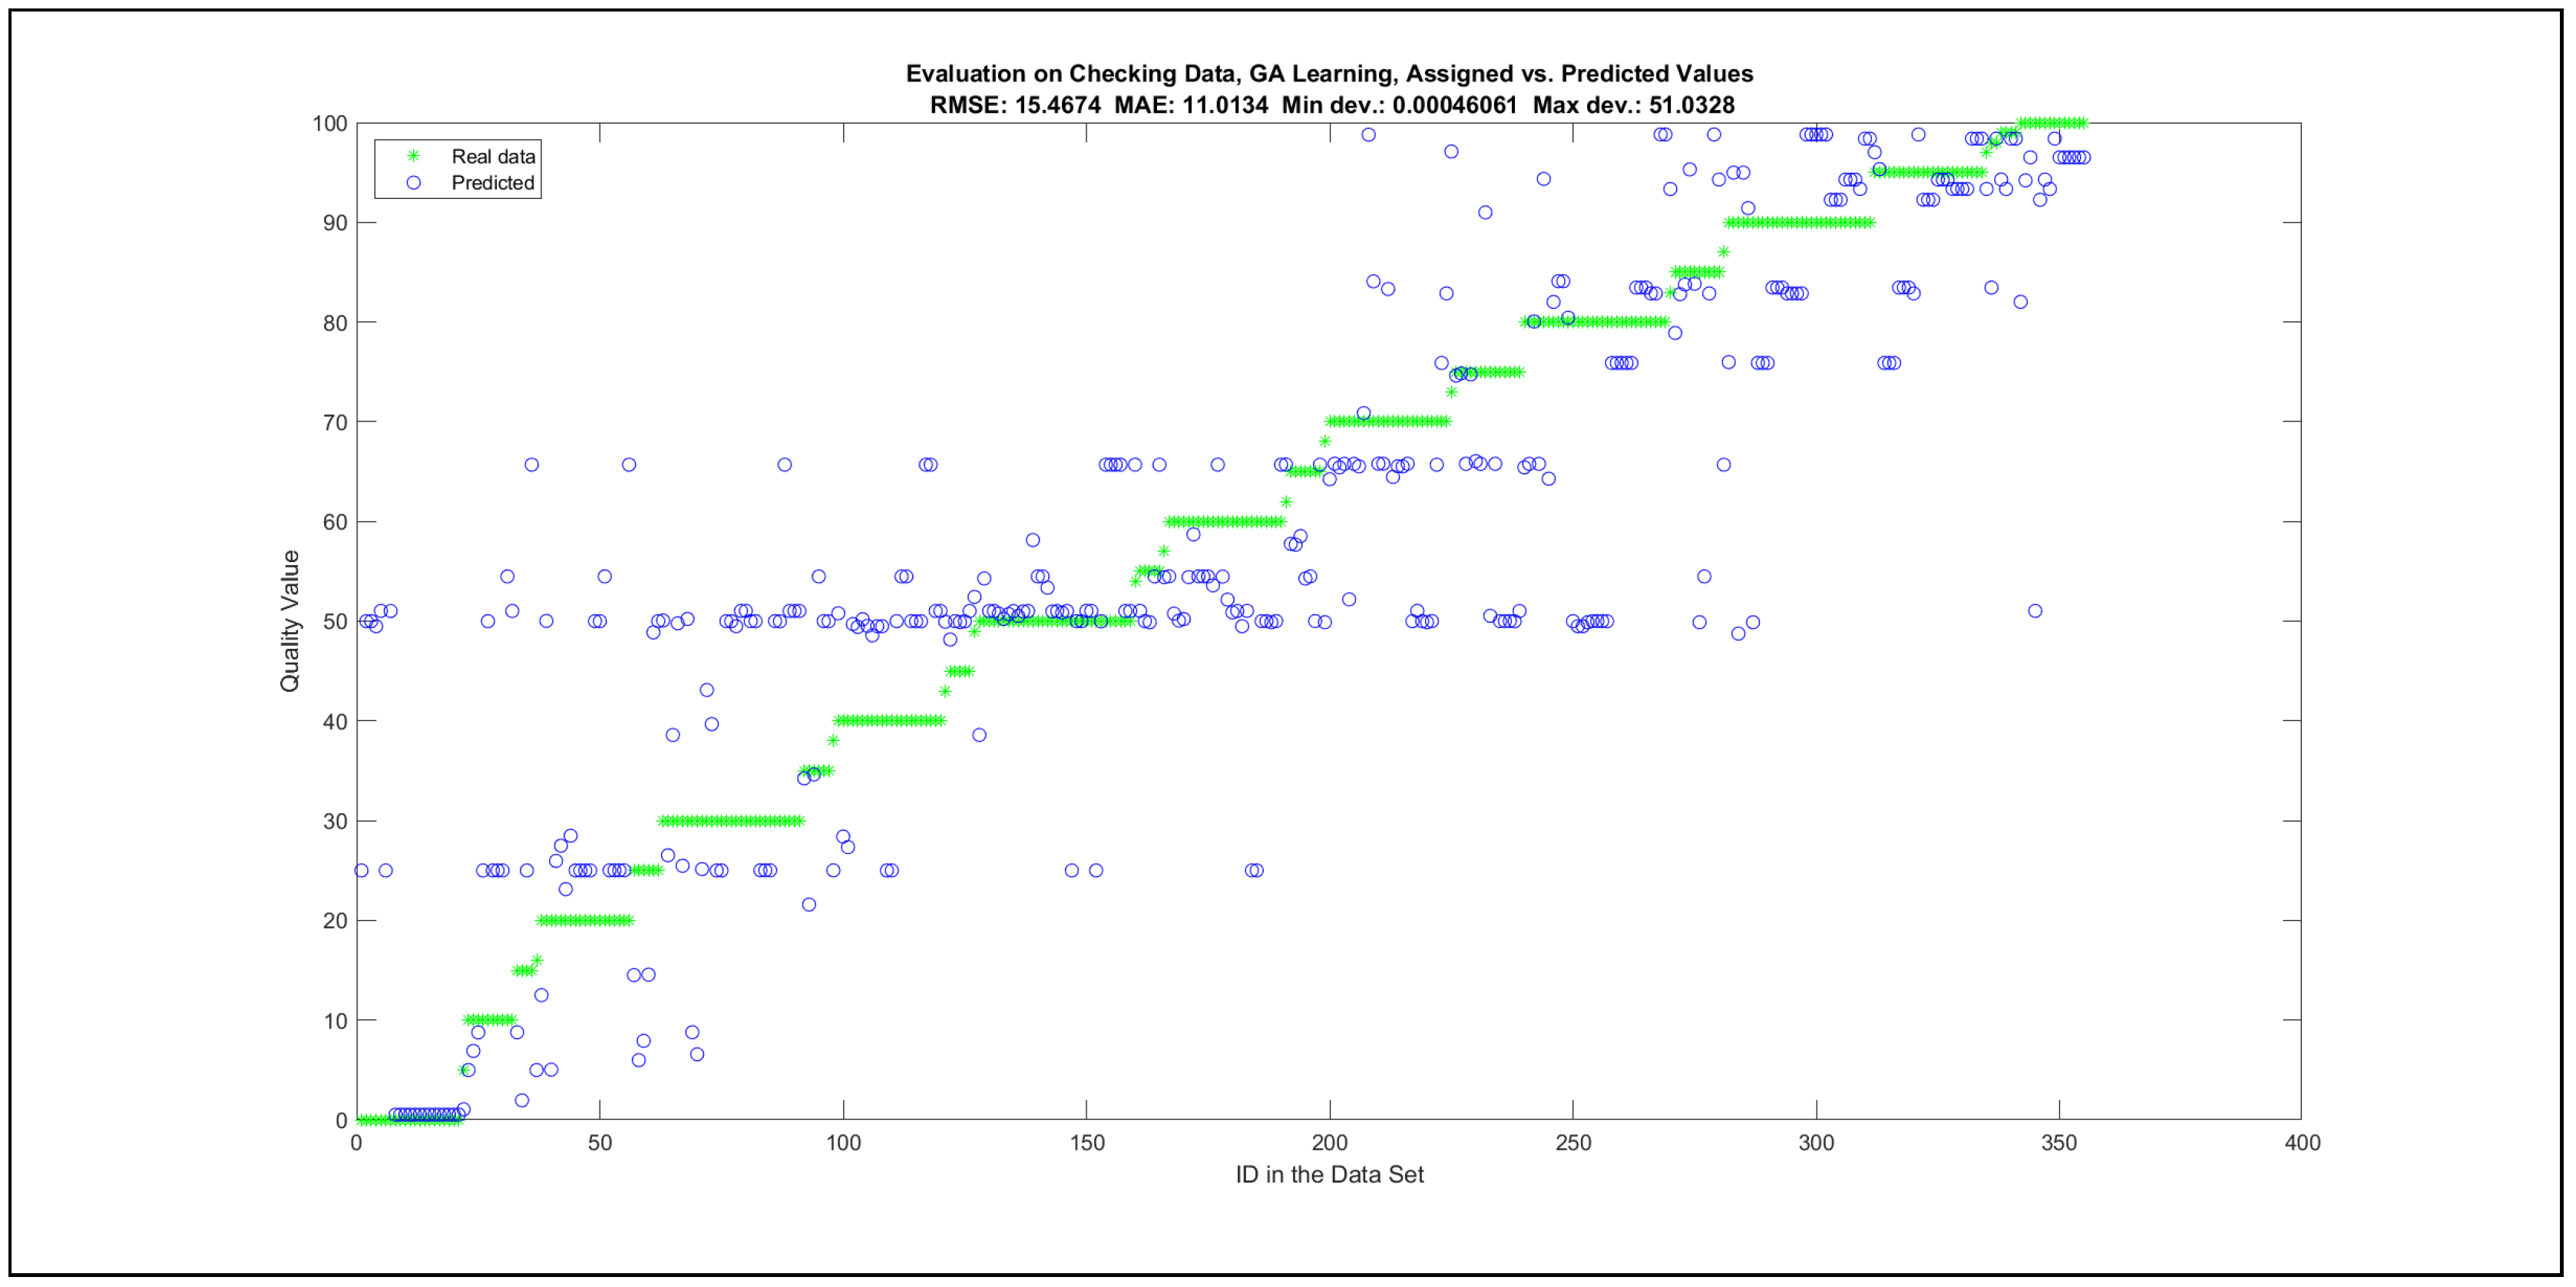
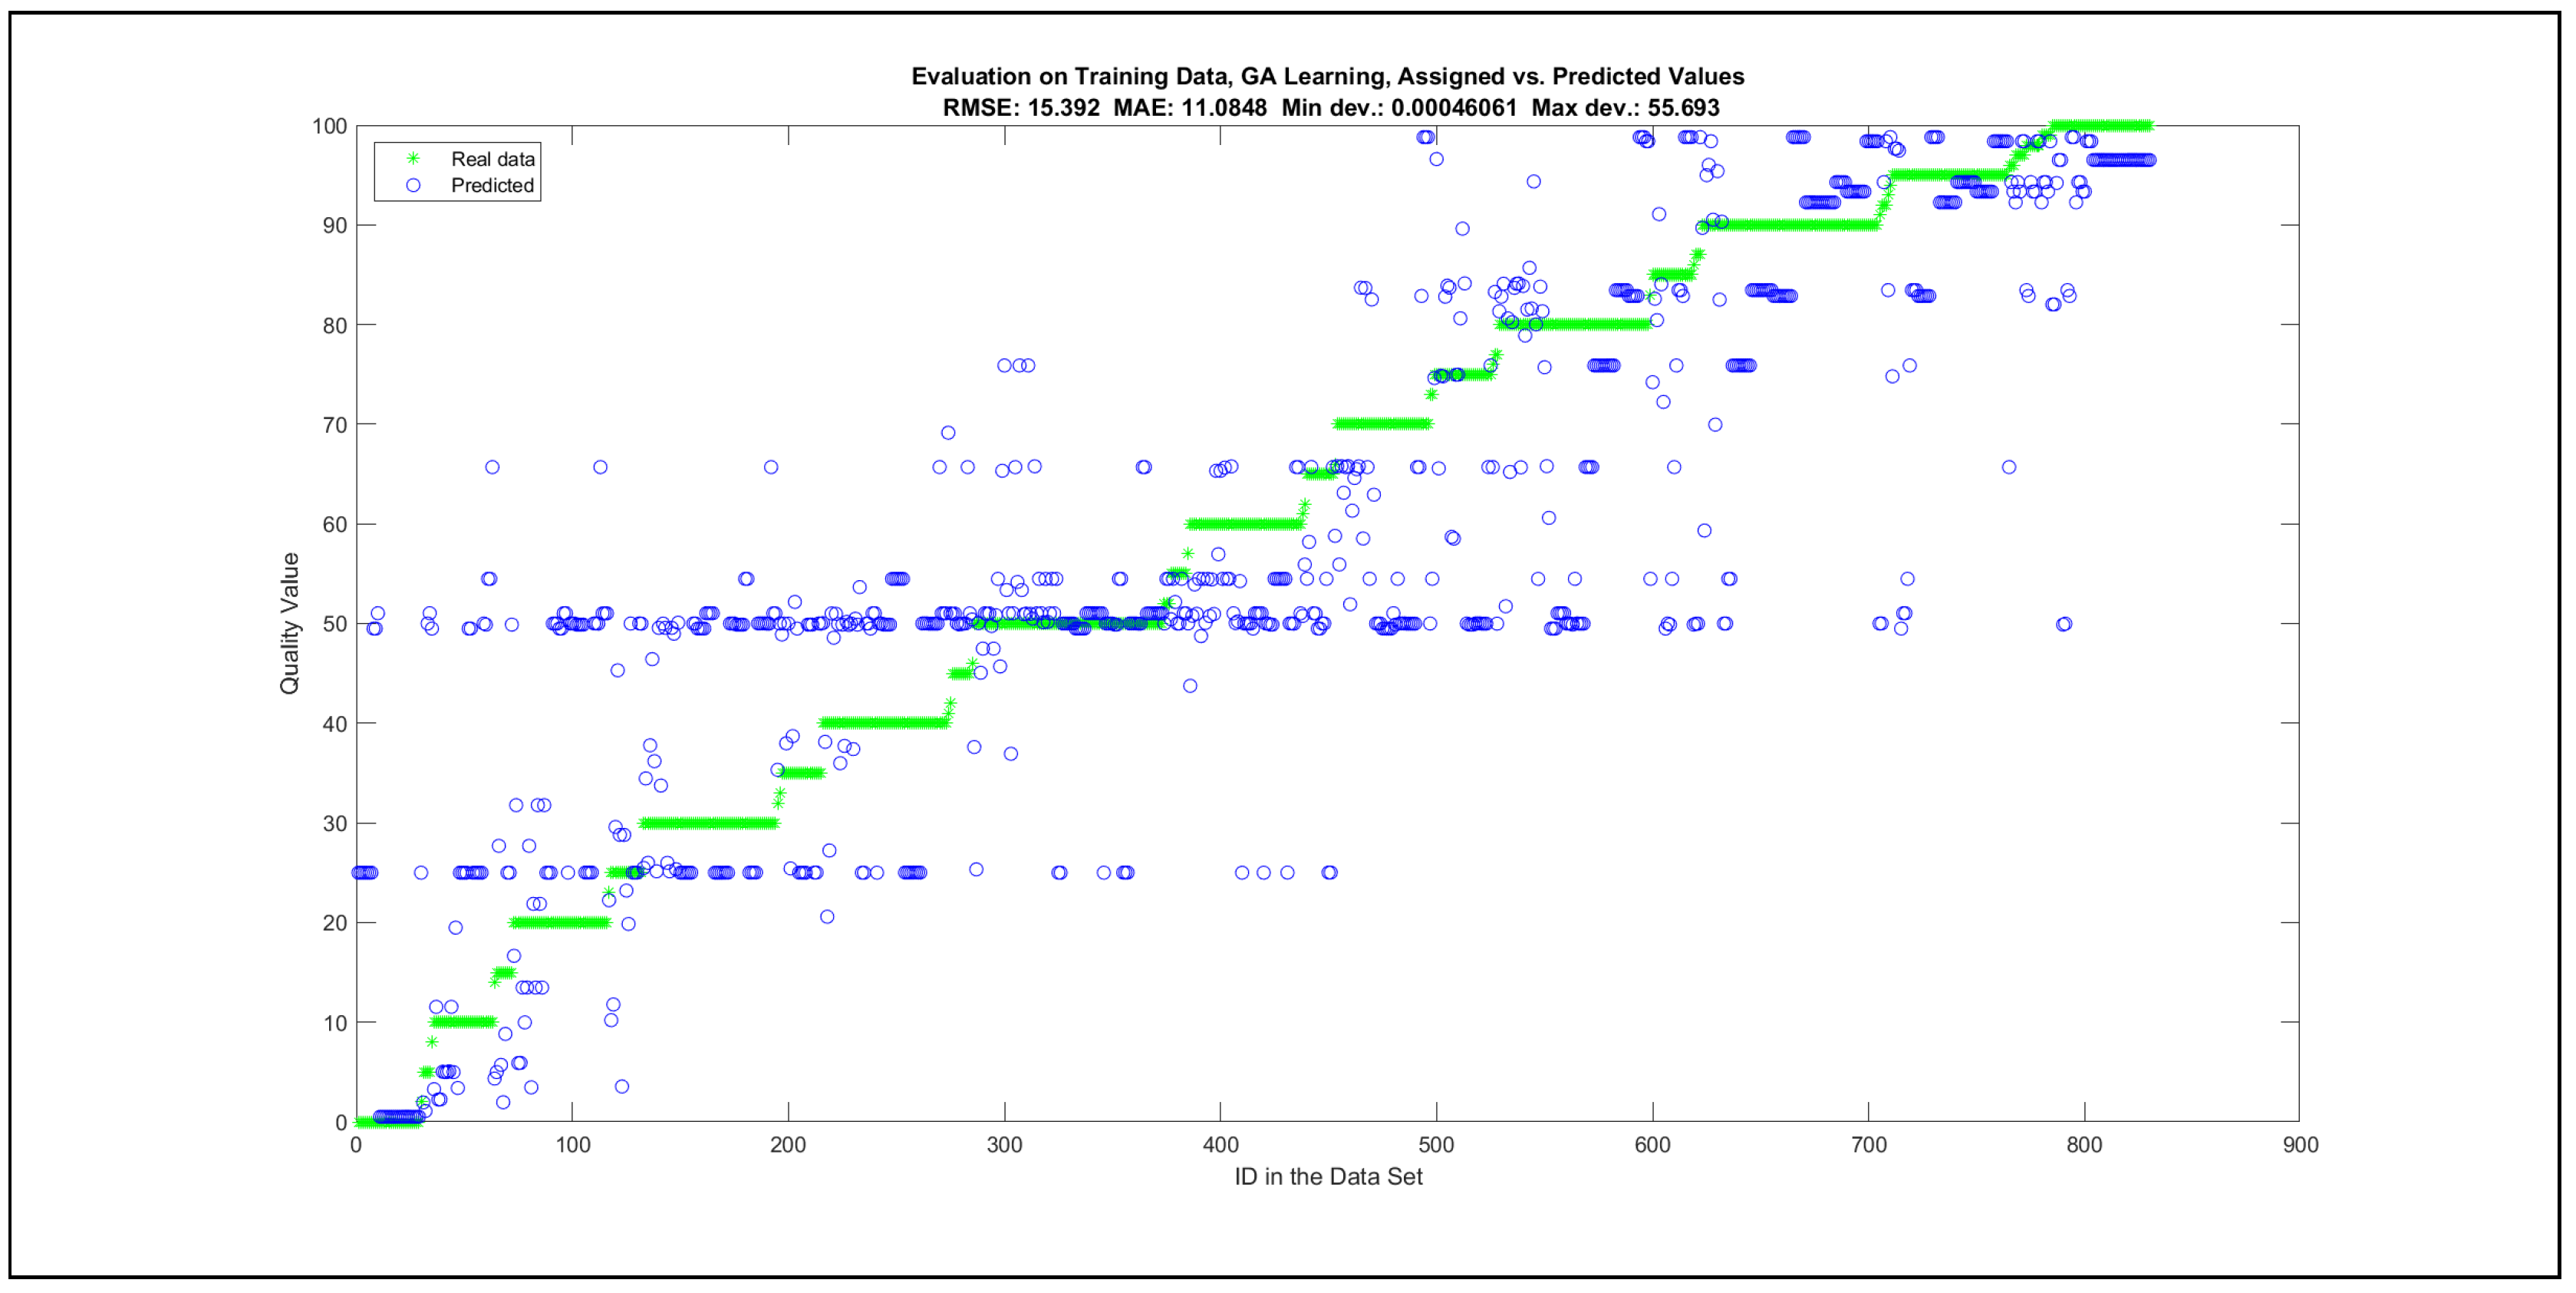
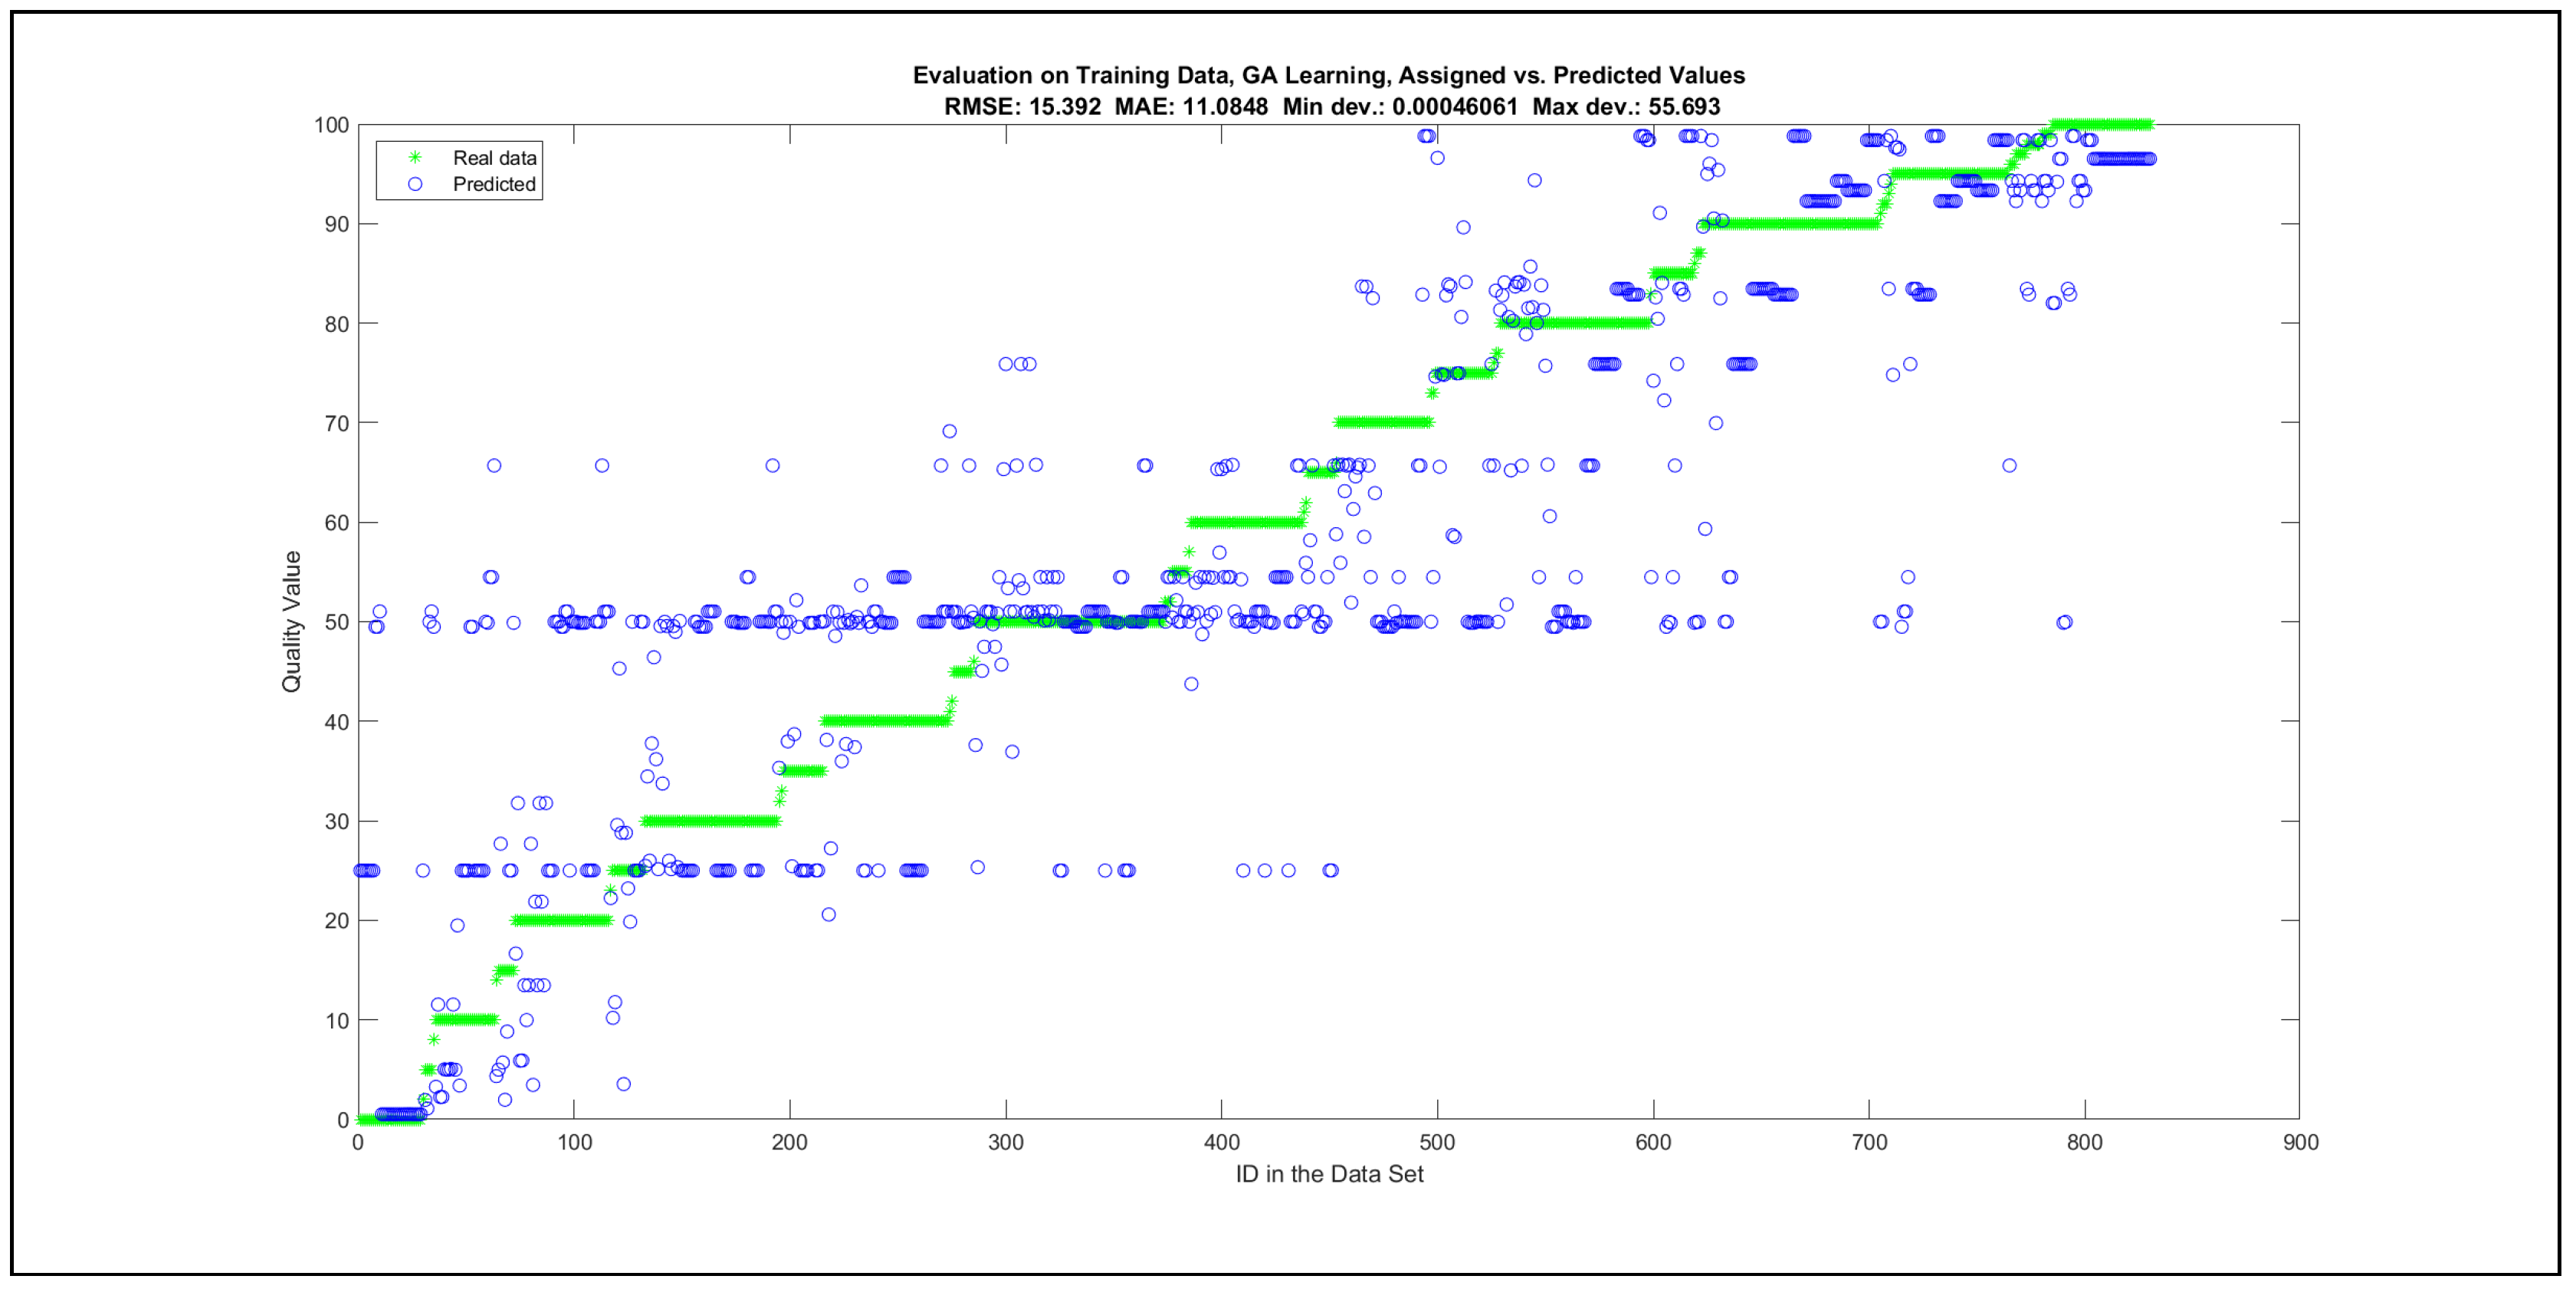
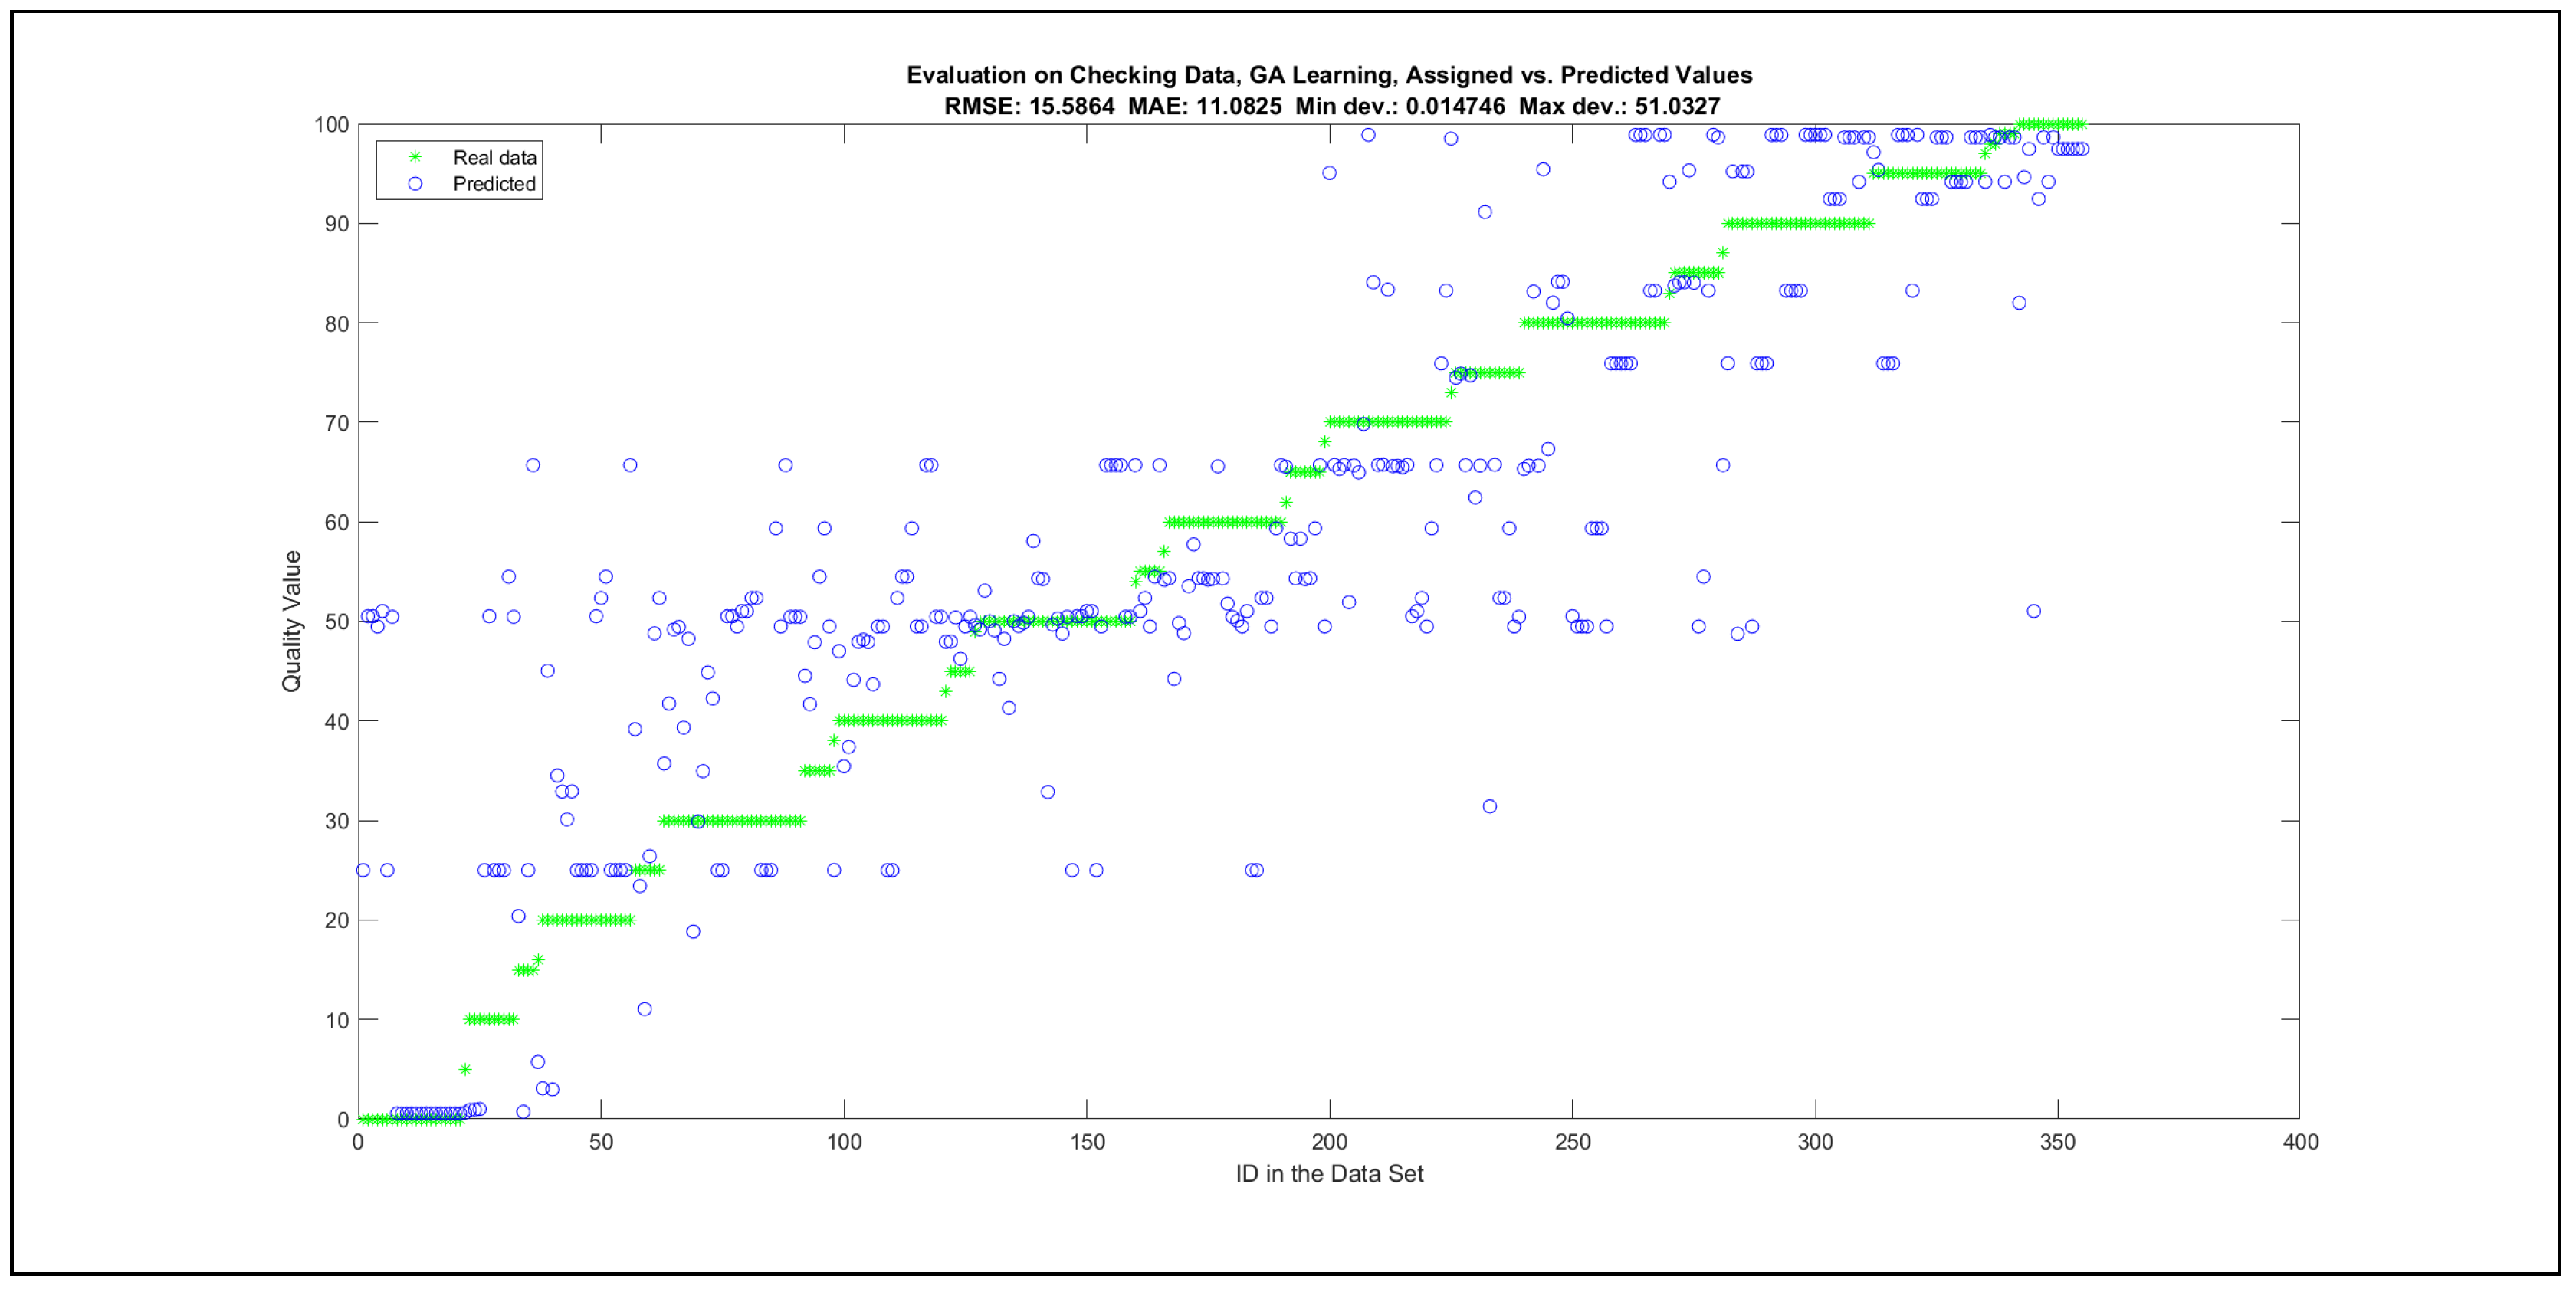
Thus, six iterations of five models were created for each rule limit in the set {1, 3, 5, 8, 12, 16, 20, 40, 80, 160}. In addition, the best results of the five models were collected for each rule limit in each of the six run suites. The predictions of the models with different numbers of maximal rules were analysed with regard to the mean absolute error (MAE), root mean squared error (RMSE), and minimal and maximal deviation from the desired target in the course of each run. The runs with the best performance, which come from run suite 2, are depicted in Figure 5, and the corresponding data are illustrated in Table 4 with regard to the training data set; moreover, the same runs are also shown in Figure 6 with regard to the checking data set, and the corresponding data are highlighted in Table 5. The RMSE indicators for the training data and the checking data are shown in Appendix B in Figure A18 and Figure A19; furthermore, the corresponding data are highlighted in Table A1 and Table A2. The machine learning process was ceased when the new generations produced by the genetic algorithm reached a saturation point with regard to the mean RMSE value of the individuals in the population.
The charts with the data predicted by the created models as outputs and the original collected outputs are shown for each rule limit in the set {1, 3, 5, 8, 12, 16, 20, 40, 80, 160} in Appendix C with the best maximum error and the best RMSE error model candidates for the checking data in Figure A20, Figure A21, Figure A24, Figure A25, Figure A28, Figure A29, Figure A32, Figure A33, Figure A36, Figure A37, Figure A40, Figure A41, Figure A44, Figure A45, Figure A48, Figure A49, Figure A52, Figure A53, Figure A56 and Figure A57, and for the corresponding training data in Figure A22, Figure A23, Figure A26, Figure A27, Figure A30, Figure A31, Figure A34, Figure A35, Figure A38, Figure A39, Figure A42, Figure A43, Figure A46, Figure A47, Figure A50, Figure A51, Figure A54, Figure A55, Figure A58 and Figure A59. The original data have been sorted to ensure that the deviations from the desired targets are easy to observe. Each extracted rule set designates a distinct model.
It is important to consider that when the maximal number of linguistic rules would have allowed 80 or 160 rules, then the number of rules learnt by the systems was usually below 80 linguistic rules.
The data shown in Figure 5 and Figure 6, as well as the data in Appendix B in Figure A18 and Figure A19, indicate that increasing the number of linguistic rules results in a better accuracy up to the approximation with 12 rules. Exceeding this value does not lead to better performance. Consequently, the extracted rule set with 12 rules became the target for further processing. The extracted rule sets of the selected run suite 2 are listed in Appendix C with their evaluation charts for the checking data set.
4.4. Modelling: Verification of the Constructed Model by a Different Machine Learning Approach
As introduced in Section 4.3, the quality model for execution tracing was prepared by machine learning through genetic algorithms, adapting a fuzzy inference system to the collected data set; i.e., the model was trained on the training data and tested on both the training and on the checking data, while the input and output membership functions were kept unchanged and the linguistic rules were identified. To test whether the model created at the end of the machine learning stage can be verified by a different machine learning approach, the authors applied ANFIS [24,25] and compared the same error indicators.
Thus, a new model was created by ANFIS [24,25]; i.e., the linguistic rules of the fuzzy inference system were specified with grid-partitioning at the start, and each linguistic rule was associated with a distinct output membership function, while the same initial input membership functions were assigned as in the case of the previous model trained by genetic algorithms. ANFIS [24,25] adjusts the parameters of the input and output membership functions. Grid partitioning, selected due to the homogeneous coverage of the whole problem domain, resulted in as many linguistic rules as the possible variations of the input partitions; i.e., four inputs with three partitions (). Consequently, 81 output membership functions were required. Thus, the efficient human interpretation of the rule set to understand the problem domain, after training the model, is not feasible, in contrast to the model created in Section 4.3.
Furthermore, ANFIS training was implemented in two different ways: with (1) backpropagation and (2) hybrid approaches. For each learning approach, a separate model was trained with one of the initial step sizes from the set {0.1, 0.5, 1, 1.5, 2, 2.5, 3, 3.5, 4, 4.5, 5}. The best-performing models with regard to the maximal errors and RMSE errors were selected in the course of 100 learning epochs. Table 6 presents the best error indicators with regard to the initial step sizes. The adaptation of the initial step sizes during the learning process can be observed in Figure A77, Figure A79, Figure A81 and Figure A83.
The change of the RMSE error for all the best four models in Table 6 as a function of learning epochs for the training and checking data are depicted in Appendix F in Figure A76, Figure A78, Figure A80 and Figure A82. In addition, the evaluation charts of the four best models in Table 6 with the ANFIS approach [24,25] are illustrated in Appendix F in Figure A72, Figure A73, Figure A74 and Figure A75.
The evaluation charts and the best error indicators in Table 6 show only minor differences in comparison to those achieved with genetic learning in Section 4.3. Thus, the results of Section 4.3 could be verified by a different machine learning approach on the same training and checking data sets.
4.5. Modelling: Adjustments and Pre-Validation
The rule set with the 12 upper-bound value of the linguistic rules became, for the above reasons, the starting point for the investigation in which direct human experience was also incorporated into the results gained by computational intelligence. A mini focus group with three software professionals—a software maintainer, a software tester, and a system administrator—whose job roles require intensive log analysis, with many years of experience in industry and in academia, investigated the established rules, their plausibility, and the evaluation charts of Figure A36 and Figure A37. In addition, the pairwise effect of the inputs on the output was also analysed as shown in Appendix D in Figure A60, Figure A61, Figure A62, Figure A63, Figure A64 and Figure A65.
The goal of the discussion in the mini focus group was to incorporate direct human experiences in the rule base through investigating the existing linguistic rules, (1) leaving the correct and plausible linguistic rules in the rule set, (2) removing or changing the incorrect ones, and (3) adding the missing ones. Furthermore, the adjustments did not attempt to improve the error indicators of RMSE, MAE, maximal error, and minimal error for the training and checking data sets as the genetic algorithm used had already approximated the optimal fit to the data sets with the extracted rules. The adjustments also involved a pre-validation by the three participants of the mini focus group.
The following problems were identified: the initial evaluation charts in Figure A36, Figure A37, Figure A38 and Figure A39 show an accumulation of the predicted values in the middle range of the output variable. Moreover, (P0) no linguistic rules existed, which would have explicitly defined the output value {good} from the possible outcome set {very good, good, medium, poor, very poor}. In addition, (P1) if all input values lie in the domain {good}, then the output value should lie in the domain {very good}; (P2) for the input variables of legibility and security, while they decrease in the {poor}–{poor} domain, they should not contribute to an increase in the output on Figure A64; (P3) for all values of the input variable security, while the input variable accuracy increases in the {good} domain, the output in Figure A64 should not fall back; (P4) while moving from the {poor} and {medium} values of the input variable design and implementation towards the domain {good} and increasing the input variable accuracy from the {medium} to the {good} domain, then the output should not decrease in Figure A61; (P5) while increasing the input variable accuracy for all values of the input variable legibility, the output in Figure A60 in the {good} domain of accuracy should not produce a decreasing effect; moreover, (P6) while increasing the input variable legibility from the {medium} domain and keeping the variable accuracy in the {poor} domain, the output in Figure A60 should not drop.
The rules R1, R2, R4, R6, R7, and R10 were taken over from the original rule set, without any change. The rules R3, R5, R9, R11, and R12 underwent changes to gain approval by the mini focus group, while the rules from R13 to R19 were added to resolve the issues from P0 to P6 listed above.
- R13.
- resolves P1—i.e., if all input values possess {good} values, then the output value should belong to the domain {very good};
- R14.
- resolves P2, as illustrated in Figure A70;
- R15.
- resolves P3 and P4, as shown in Figure A70 and Figure A67;
- R16.–17.
- resolve P5 and P6, as depicted in Figure A66;
- R18.–19.
- resolves P0—i.e., explicit linguistic rules were created for the output value {good}.
While identifying the necessary changes and applying the adjustments, the fuzzy model was tested with the combination of vectors [0, 50, 100]; i.e., each input received a value from the vector, and the output of the model was analysed. Furthermore, the response of the model was also investigated while three inputs of the model were fixed and one input underwent a continuous increase and decrease. The final set of the linguistic rules sent for validation is summarised below:
- R1.
- If (Accuracy is poor) and (Legibility is poor) and (DesignAndImplementation is poor) and (Security is poor) then (Quality is very poor);
- R2.
- If (Accuracy is medium) and (Legibility is medium) and (DesignAndImplementation is good) and (Security is poor) then (Quality is medium);
- R3.
- If (Accuracy is poor) and (Legibility is poor) and (Security is medium) then (Quality is very poor);
- R4.
- If (Accuracy is medium) and (Legibility is medium) and (DesignAndImplementation is medium) and (Security is medium) then (Quality is medium);
- R5.
- If (Accuracy is medium) and (Legibility is poor) and (DesignAndImplementation is good) and (Security is poor) then (Quality is medium);
- R6.
- If (Accuracy is poor) and (Legibility is good) and (DesignAndImplementation is good) and (Security is good) then (Quality is poor);
- R7.
- If (Legibility is poor) and (DesignAndImplementation is medium) and (Security is medium) then (Quality is poor);
- R8.
- If (Accuracy is medium) and (Legibility is poor) and (DesignAndImplementation is poor) and (Security is medium) then (Quality is very poor);
- R9.
- If (Accuracy is medium) and (Legibility is medium) and (DesignAndImplementation is good) and (Security is medium) then (Quality is medium);
- R10.
- If (Accuracy is medium) and (Legibility is medium) and (DesignAndImplementation is poor) and (Security is medium) then (Quality is poor);
- R11.
- If (Accuracy is good) and (Legibility is medium) and (DesignAndImplementation is poor) and (Security is medium) then (Quality is poor);
- R12.
- If (Accuracy is medium) and (Legibility is poor) and (Security is medium) then (Quality is medium);
- R13.
- If (Accuracy is good) and (Legibility is good) and (DesignAndImplementation is good) and (Security is good) then (Quality is very good);
- R14.
- If (Accuracy is medium) and (Legibility is poor) and (DesignAndImplementation is medium) and (Security is poor) then (Quality is very poor);
- R15.
- If (Accuracy is good) and (Legibility is medium) and (DesignAndImplementation is medium) and (Security is not good) then (Quality is medium);
- R16.
- If (Accuracy is good) and (Legibility is poor) and (DesignAndImplementation is medium) and (Security is medium) then (Quality is medium);
- R17.
- If (Accuracy is poor) and (Legibility is medium) and (DesignAndImplementation is medium) and (Security is medium) then (Quality is poor);
- R18.
- If (Accuracy is good) and (Legibility is good) and (DesignAndImplementation is medium) and (Security is medium) then (Quality is good);
- R19.
- If (Accuracy is good) and (Legibility is good) and (DesignAndImplementation is good) and (Security is medium) then (Quality is good).
4.6. Modelling: Validity
The final step of modelling was conducted within the validation stage, which was implemented (1) by sending out a second questionnaire [28] to selected international experts located in Austria, Germany, and Hungary, and (2) considering their feedbacks and tuning the created model. After tuning the model, the authors also validated the results by face validity.
4.6.1. Validation by International Experts
The online questionnaire [28] contained the input variable definitions, the input membership function, their partitions, and the brief description of the technique used for modelling; moreover, the linguistic rules adjusted by the mini focus group, as introduced in Section 4.5. Furthermore, the survey ensured the possibility of giving textual feedback. It also encompassed the description of the effects of the pairwise inputs on the output as shown in Appendix E in Figure A66, Figure A67, Figure A68, Figure A69, Figure A70 and Figure A71. An online model demonstration was offered to the experts, the possibility of which was accepted by one expert.
Based on the feedback from the experts, rule R19 was changed, as presented below:
- R19.
- If (Accuracy is good) and (Legibility is good) and (DesignAndImplementation is good) and (Security is medium) then (Quality is very good).
The experts did not propose or request any further change to the constructed model. In addition, two insights from two different experts were summarised to highlight the nature of the quality property security and its possible impacts on execution tracing quality: (1) increasing security has a negative impact on execution tracing quality, as leaving out sensitive or GDPR-related data, including login names, reduces analysability; (2) security requirements are domain-specific—security is a must for medical software, and without a certain base-level quality for this property, the whole application is inadequate. These opinions illustrate that, even with regard to one individual quality property, contrasting requirements may exist in connection with the output, and a possible optimum needs to be found. This also supports the use of fuzzy logic in the problem domain, which can adequately describe contradicting information.
Table 7 highlights the different errors of the created model after each modelling stage. The error indicators were measured on the training and checking data sets and are rounded to four decimal places in Table 7. The measurements indicate an error increase in the scope of model adjustments and tuning, which can be explained (1) by the approximated optimal fit of the linguistic rules, after the machine learning had taken place with genetic algorithms, to the collected data in the training and checking data sets; (2) by the addition of new information to the model, which was not present in the initial data sets, in the scope of the mini focus group; and (3) by the incorporation of the opinions of experts into the created model to tune it, which further increased the deviation from the collected data. This deviation and error increase between the above stages could probably have been diminished or eliminated if the sample size of the initial data set could have been increased.
4.6.2. Face Validity by the Authors
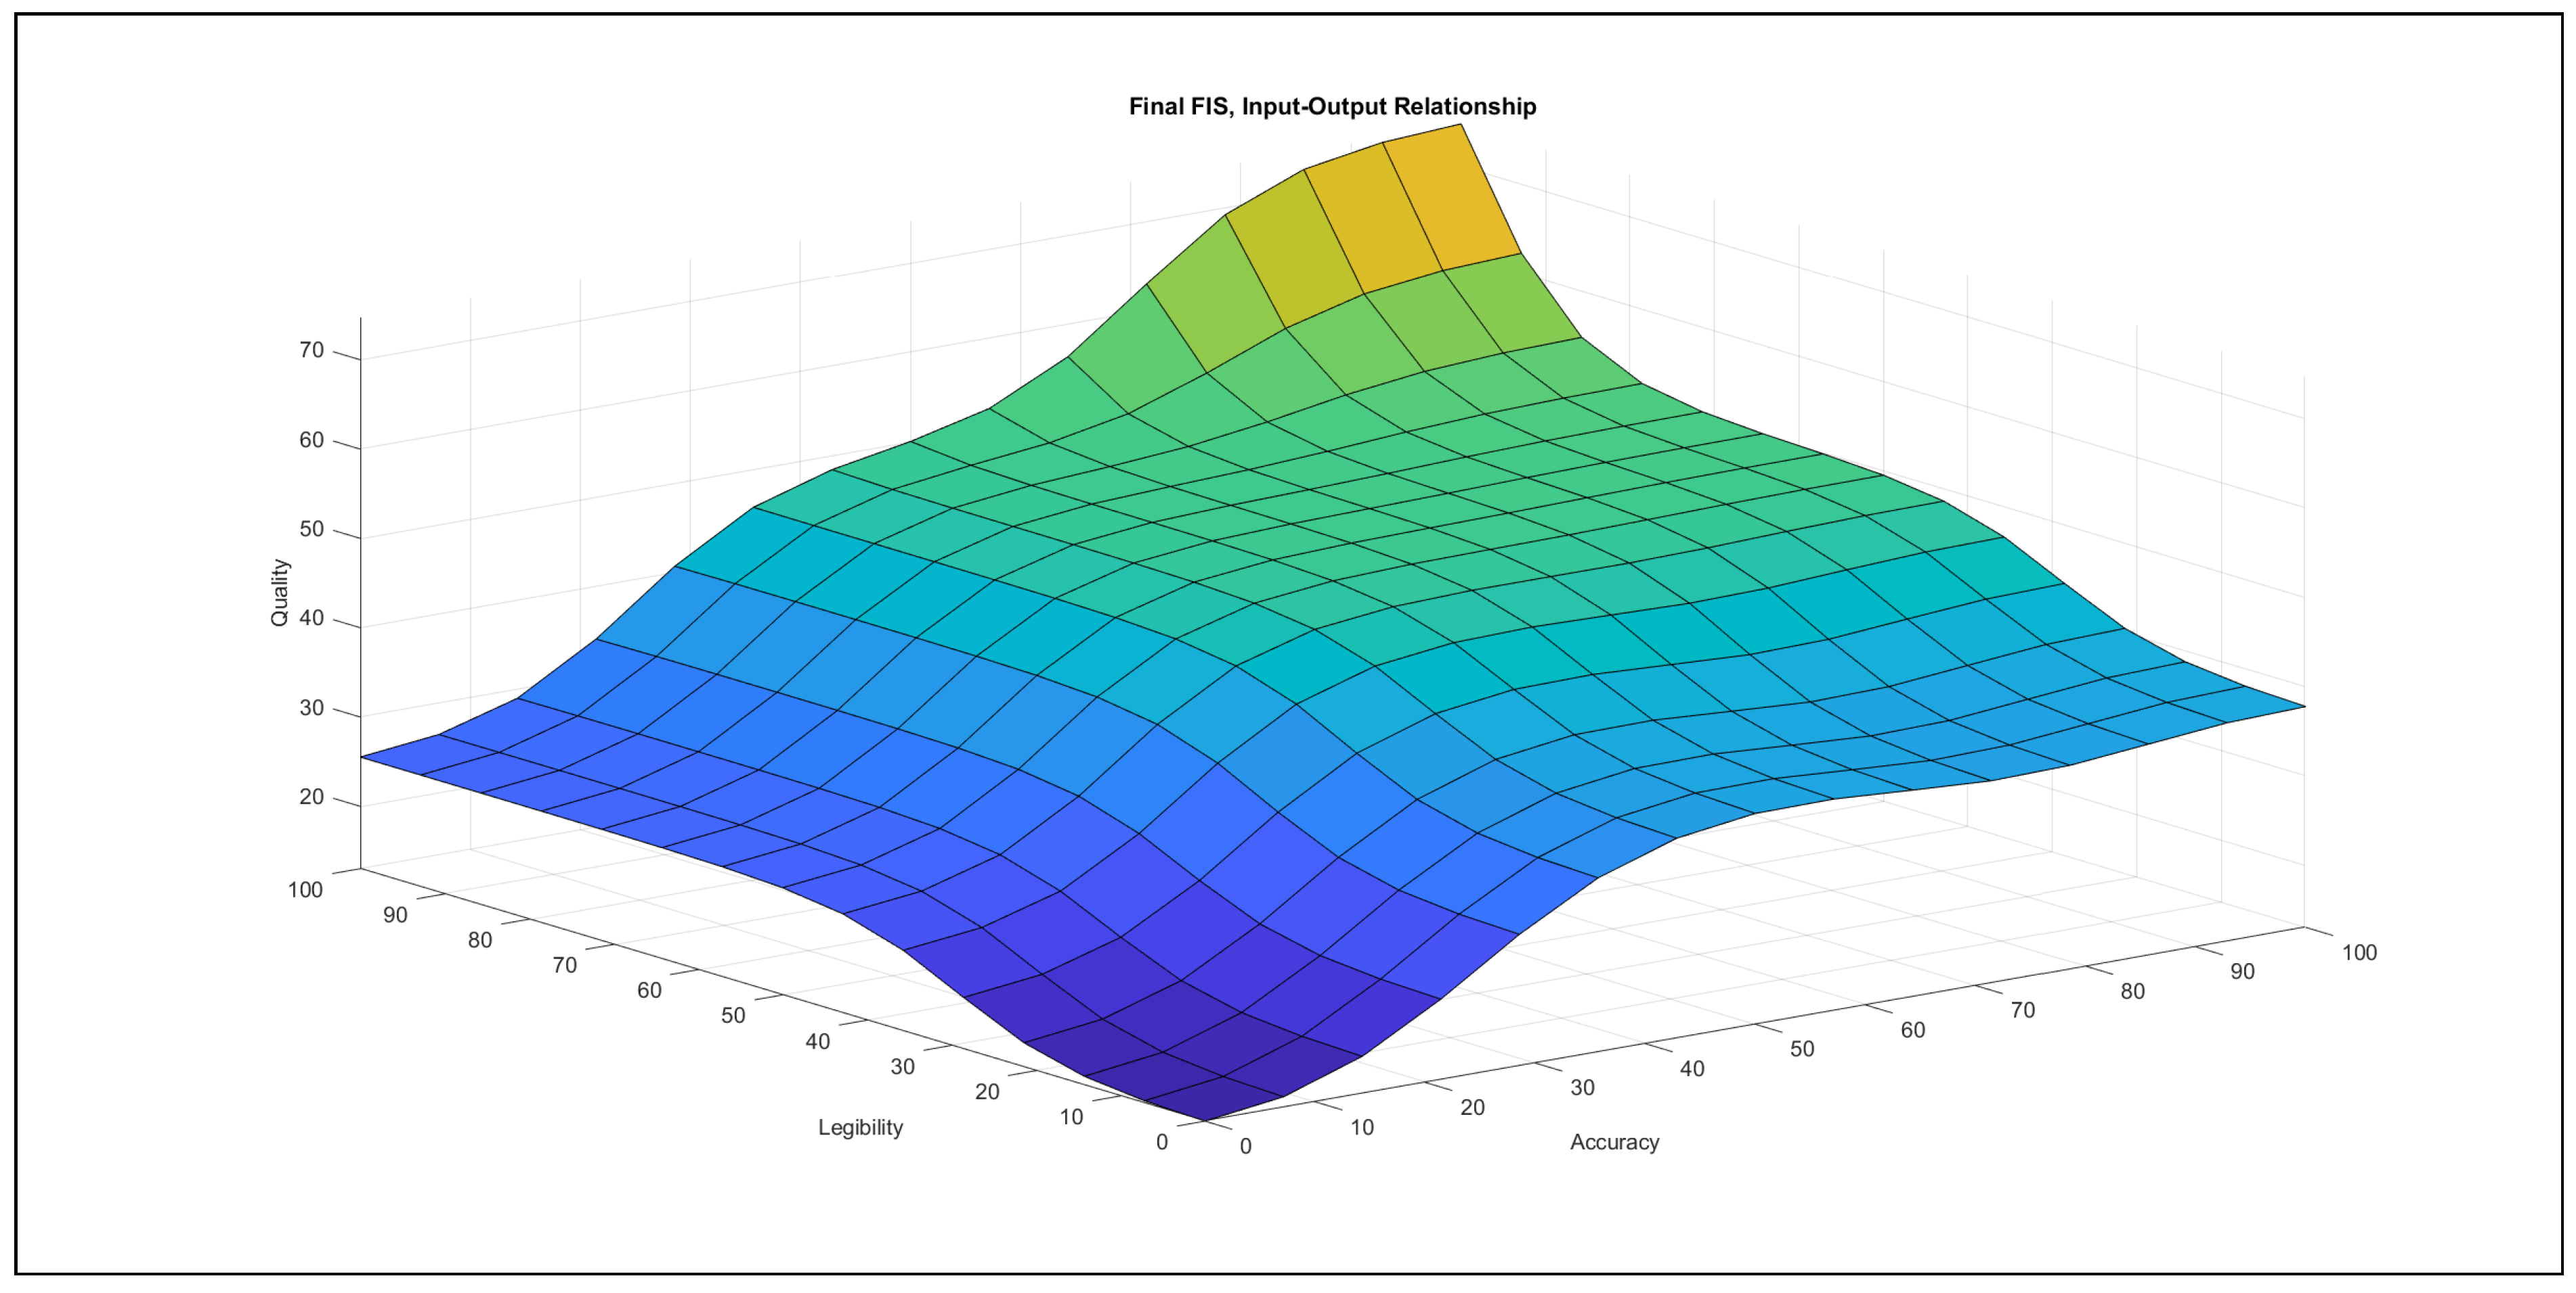
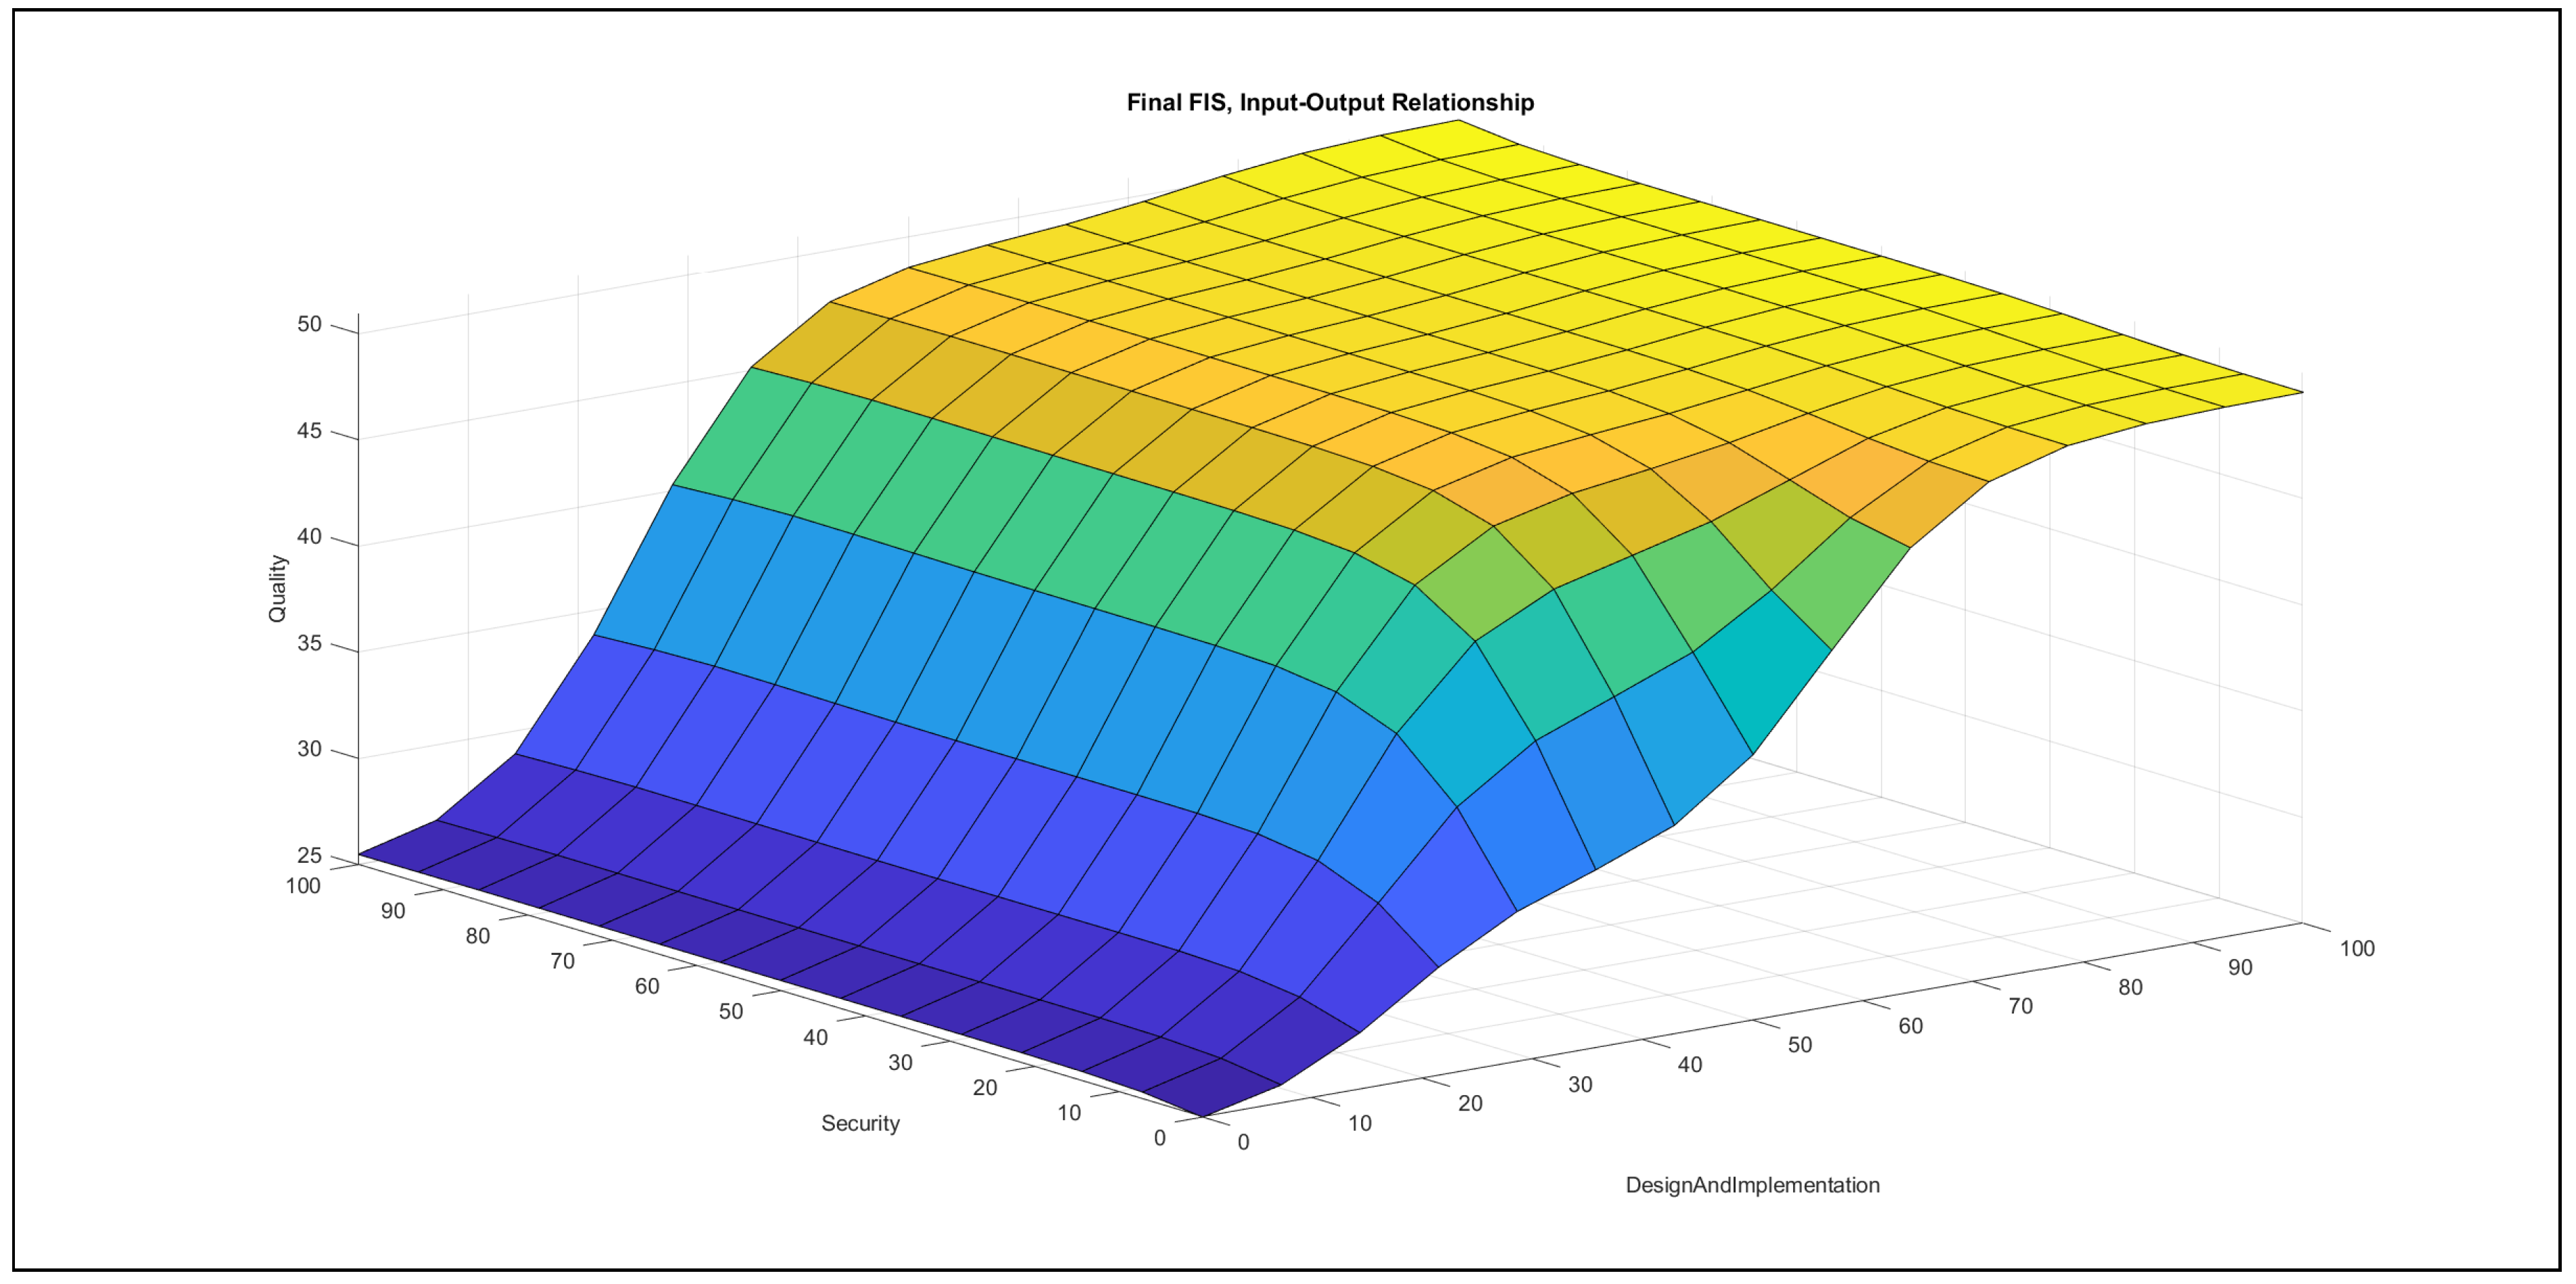
The authors investigated the outcome of the modelling stage after incorporating the feedback of the international experts. They found the formalised linguistic rules reasonable and plausible; moreover, they also examined the pairwise impacts of the inputs on the output, which is reported below the evaluation charts in Figure 7, Figure 8, Figure 9, Figure 10, Figure 11 and Figure 12.
- Accuracy–legibility in Figure 7: When accuracy lies in the {poor} domain, the increase of legibility produces a slight increase, which quickly saturates. The behaviour is similar in the {medium} range of accuracy, but the saturation occurs at a higher value, while the increase of legibility in the range of {good} accuracy values produces a strong increase in the output. In the {good} ranges of legibility, the described relationship contributes an increasing effect to the output as accuracy increases. On the other hand, in the {poor} and {medium} ranges of legibility, the increase of accuracy produces a far smaller increase in the output than in the {good} range of legibility; moreover, the increasing effect saturates at a lower value.The chart demonstrates that accuracy has greater impact on the output in the {medium}–{good} accuracy domain if legibility lies in the {good}domain.
- Accuracy–design and implementation in Figure 8: In the {poor} domain of design and implementation, the increase of accuracy can only produce a small increase with a quick saturation in the output, while this saturation occurs in the {medium} domain of design and implementation at a higher value. Furthermore, in the {good} range of design and implementation, the increase of accuracy contributes an increase to the output, with a horizontal segment in the {medium} domain of accuracy. When accuracy possesses {poor} ranges and design and implementation increases, the variable combination contributes a slight increase to the output, with a horizontal segment at a low value, while the contribution increases in the {good} domain of design and implementation. The {medium} domain of accuracy values with increasing design and implementation values contributes an increase with a saturation to the output, while the same increase in the {good} ranges of accuracy produces an increase with a horizontal segment at {medium} design and implementation values.The chart demonstrates that both variables have approximately the same effect on the output.
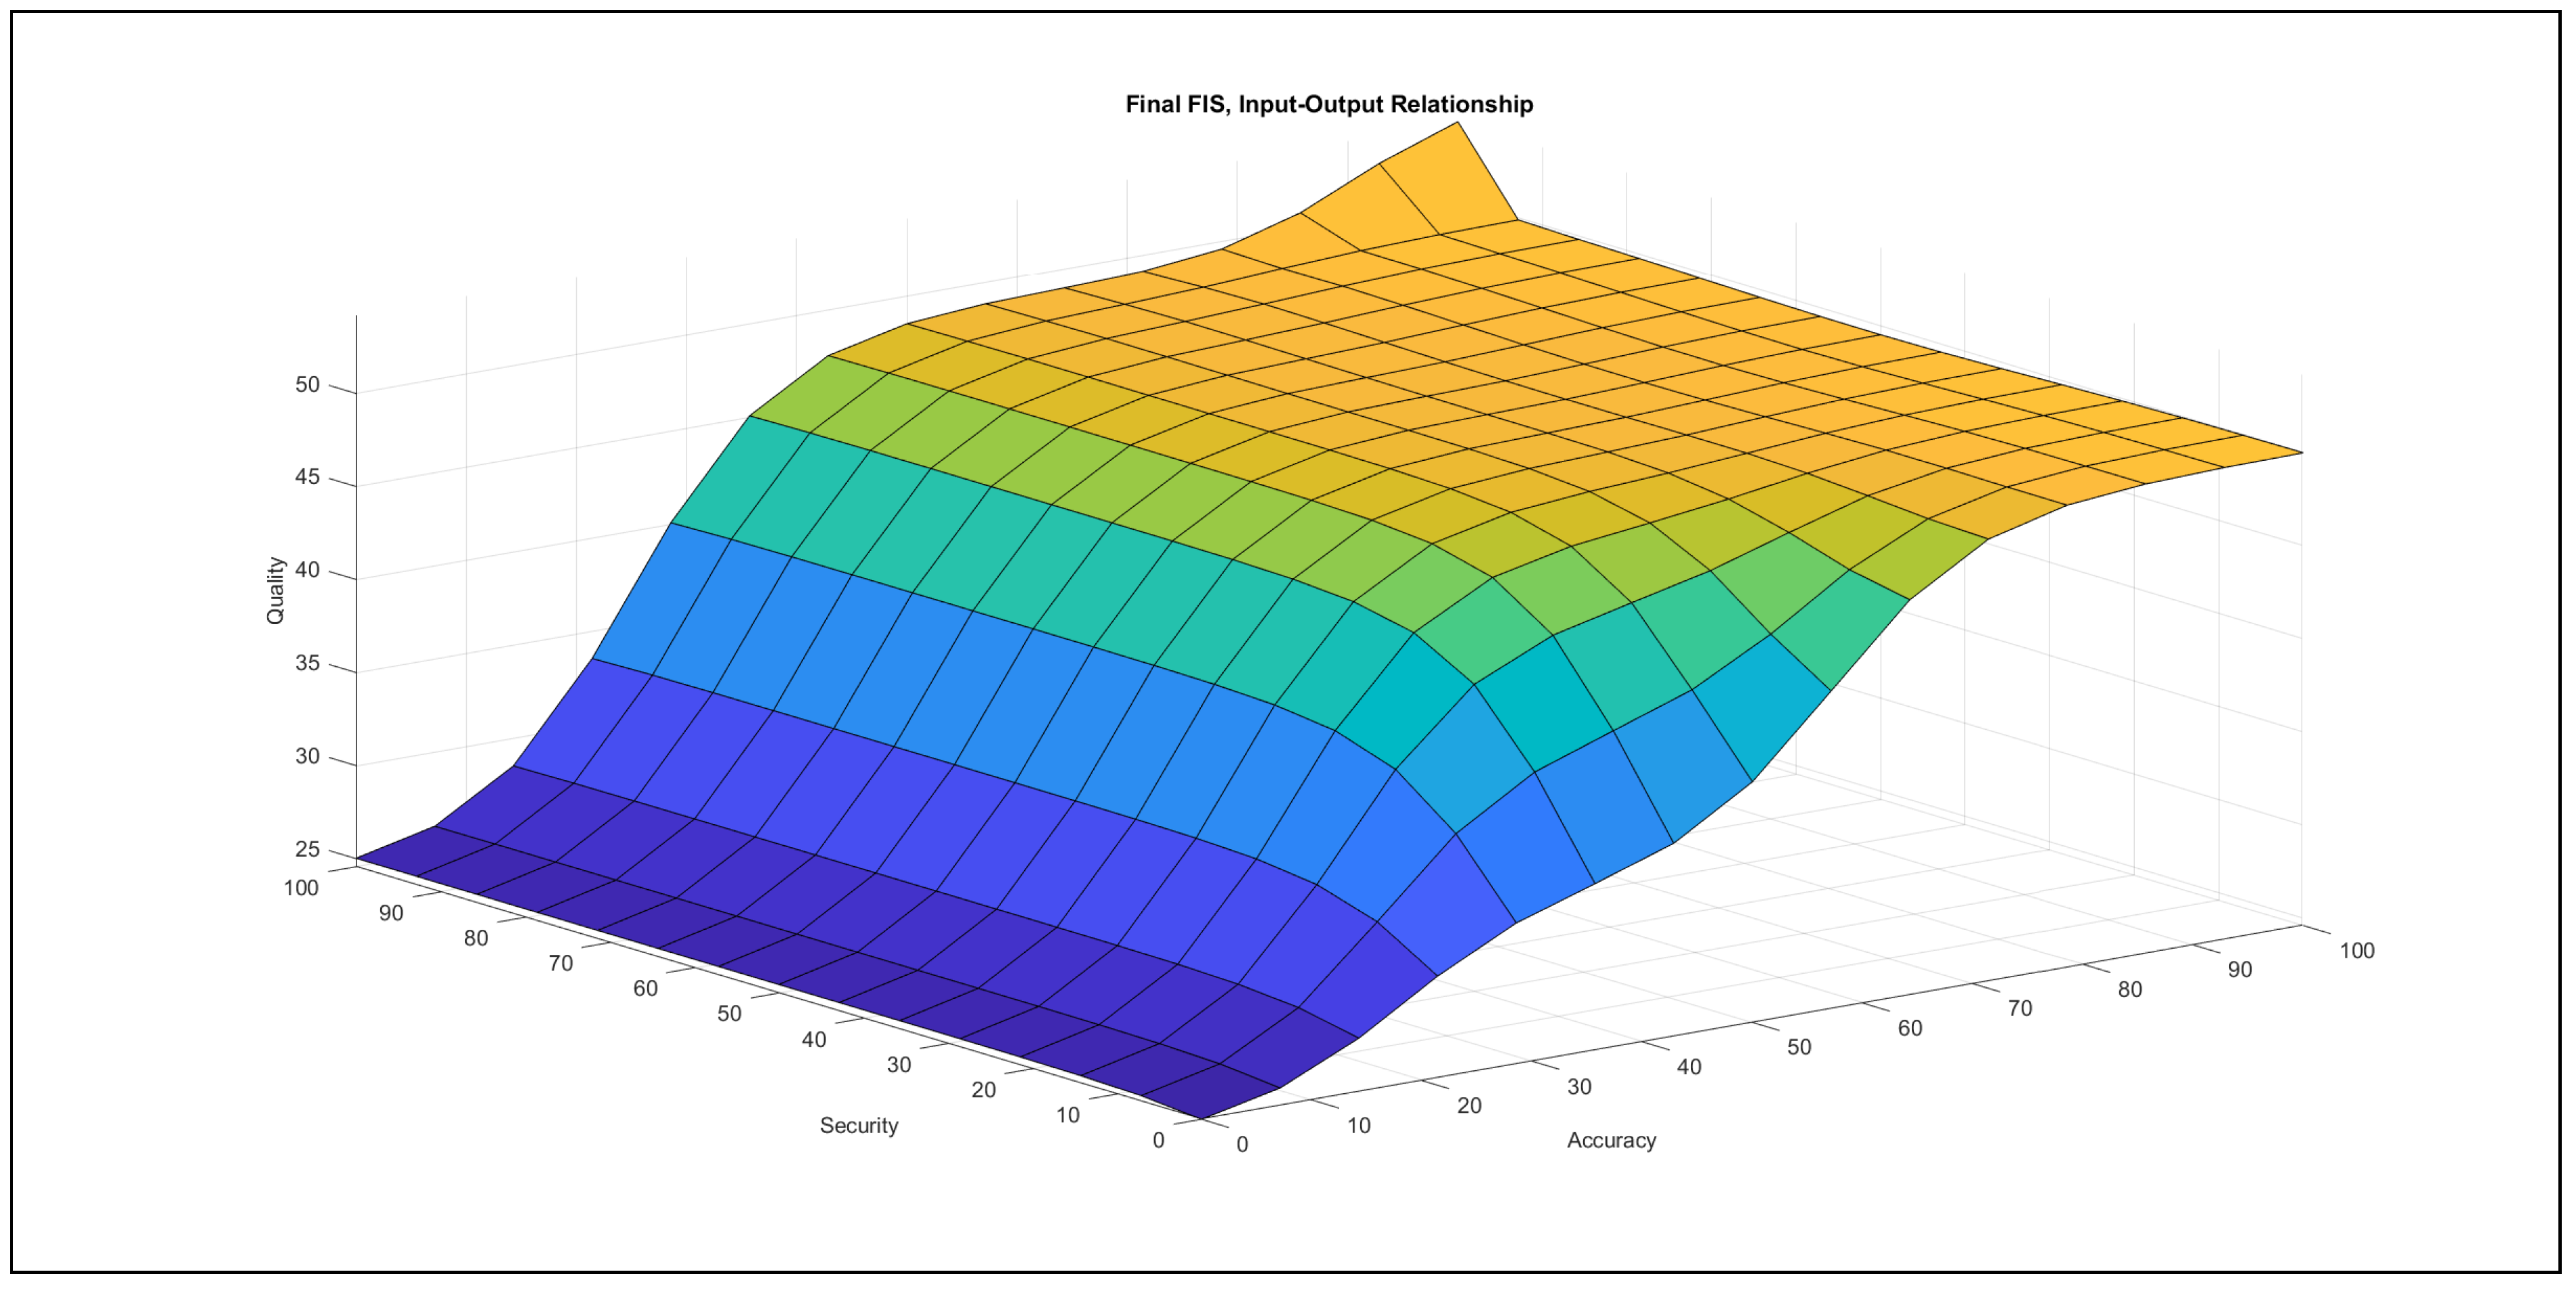
- Accuracy–security in Figure 9: In the {poor} range of accuracy, the increase of security can only contribute a small increase with a very quick saturation to the output in the relation of these two variables. In the {medium} range of accuracy, this contribution is greater, but the saturation is quick and occurs at a higher value than in the {poor} domain. At {good} values of accuracy, security only has an influence on the output in the {good} domain of security, where it contributes a slight rise. When security lies in the {poor} range, the increase of accuracy produces an increasing effect to the output with a late saturation in the {good} accuracy domain. At {medium} security values, the increase of accuracy produces the same increasing effect with a quicker saturation at the same value as in the {poor} domain of security. In the {good} security domain, the increase of accuracy produces a similar effect to the {medium} security domain, but it also contributes an increase to the output in the range of {good} accuracy values.The chart illustrates that the effect of accuracy is far stronger than the effect of security, which is similar to the case with the variables security and design and implementation.
- Legibility–design and implementation in Figure 10: In the {poor} range of legibility, the increase of design and implementation causes an increasing effect in the output with a short, nearly horizontal segment in the {medium} design and implementation domain. In the {medium} domain of legibility, an increase in design and implementation contributes an increase to the output, which achieves its maximum at a higher value and at lower design and implementation inputs than in the {poor} legibility domain. Increasing design and implementation in the {good} legibility domain contributes a strong increase to the output. In the {poor} design and implementation domain, the increase of legibility contributes a small increase to the output, with a saturation at a low value. The domain with {medium} design and implementation values produces a similar effect as that for increasing legibility, but the starting point of the contribution to the output is a higher value and the saturation occurs also at a higher value than in the {poor} domain. The increase of legibility in the {good} range of design and implementation produces a contribution to the output only in the {good} domain of legibility, which is an increase.The chart depicts that the effect of design and implementation is stronger than the effect of legibility.
- Legibility–security in Figure 11: In the {poor} range of legibility, the increase of security contributes a strong increasing effect to the output in the {poor} security domain, but this effect saturates at the beginning of the {medium} security domain. A slightly increasing contribution to the output can be observed in the {medium} legibility domain if security increases, but the initial contribution without the changes is high. In the {good} legibility domain, the increase of security only in the {good} domain has an effect on the output, which is increasing, in the relation of these two variables. In the {poor} domain of security, the increase of legibility produces a strongly increasing contribution to the output in the {poor} legibility domain. In the {medium} security domain, the increase of legibility contributes a slight increase to the output. The contribution has a high initial value. In the {good} security domain, the contribution to the output starts from a high initial value while increasing legibility, but the increase is mild, with a horizontal segment in the range of {medium} legibility values.Practically, these variables take effect only in the {poor}–{poor} domain, but then the triggered effect is strong.
- Design and implementation–security in Figure 12: In the {poor} range of design and implementation, the increase of security produces a slightly increasing effect in the output, but this effect saturates at low security values. In the {medium} domain of design and implementation, the rise of security has an effect only in the {poor} security domain, which is increasing with regard to the output. In the {good} range of design and implementation, the increase of security contributes no effect to the output in the relation of these two variables. In the {poor} domain of security, the increase of design and implementation produces an increasing effect in the output. This effect is stronger in the {medium} and {good} ranges of security if design and implementation increases, but then the contribution to the output saturates at lower design and implementation values.The chart is very similar to the chart of accuracy–security; i.e., the variable design and implementation shows a far stronger effect towards the output than the variable security. In the {good} range of design and implementation, the increase of security contributes no effect to the output in the relation of these two variables, which does not mean that the increase of security, in the relation to all inputs, contributes no effect to the output.
The above comparisons describe solely three dimensions: two inputs and one output. All input variable combinations are depicted to highlight their effects in the output. Consequently, the described effects refer to the output with regard to the presented input combinations.
All the input combinations above, depicted in the three-dimensional charts and described in the listing, have a reasonable effect on the output, which is in accordance with the experience of the authors. In conclusion, the face validity by the authors is satisfied.
5. Validation
This section is devoted to the validity of the study. In complex modelling studies, validity is a scale with different degrees that can describe the distinct validity facets of the conducted research. Internal, external, content, and construct validities are investigated and documented below. Every reasonable effort was made in the context of the study to satisfy the documented validity aspects.
Internal validity establishes that the research conducted represents the truth with regard to the phenomenon studied [113]. In the context of the conducted study, this is based on the (1) representativeness of the sample drawn from the defined study population, on the (2) human experiences incorporated in the rule base, and on the (3) internal consistency of the study. The online questionnaire [28] was tested before sending it out; moreover, the reliability indicators and Cronbach’s were computed for the collected data, and they showed high-reliability values as presented in Section 4.1. The sample size (n = 41) in the research is low; however, the median value of the ranges of the p = 90% confidence intervals are acceptable with regard to the problem domain, as discussed in Section 4.1. Nevertheless, 1185 input–output data pairs were collected to accomplish machine learning; furthermore, additional data collection was carried out in the mini focus group while investigating the performance of the created model, as described in Section 4.5. The internal consistency of the study was achieved (a) in the scope of the machine learning by training the model on the training data set, which contained 70% of the data randomly selected from the whole data set, and checking the performance of the created models on both the training and on the checking data; moreover, (b) the linguistic rules generated in the scope of machine learning underwent adjustment in the mini focus group; (c) finally, the model created was investigated by experts and tuned based on their feedback, as explained in Section 4.6. In addition, machine learning was implemented in two different manners and the errors of the two approaches were compared, as reported in Section 4.4; furthermore, the non-deterministic algorithms were executed several times, and the models with the best performance runs were selected, as described in Section 4.3 and Section 4.4.
External validity establishes the generalisability of the findings identified in the study [113]. This kind of validity was satisfied by including a broad range of software professionals in the study: software architects, software developers, software maintainers, software testers, and system administrators. On the other hand, the study population was defined with a localisation to Hungary; however, international companies with employee counts over 1000 were involved in the study, with international coding habits and guidelines extending across geographical boundaries. In addition, the model underwent final tuning based on the opinions of international experts located in Austria, Germany, and Hungary, also counting authors in the UK.
Content validity [114] in the context of this study refers to the extent to which all possible opinions of software professionals were considered. A higher sample size could have helped to better satisfy this kind of validity, but the p = 90% confidence intervals and the variance of the data presented in Section 4.1 show acceptable ranges for the context of the research. Nevertheless, the error indicators in Table 7 increase with regard to the collected data set as direct, valid human experiences are incorporated in the rule base in the scope of the mini focus group and in the course of tuning the model based on the feedback of the international experts. This increase could probably have been diminished or eliminated if the sample size could have been increased.
Construct validity represents the extent to which the findings reflect the content of the constructs in the phenomenon investigated [114]; i.e., whether the created model really reflects execution tracing quality, including the input variables and their impact on the output. On the one hand, the content of the constructs with regard to the input variables was elicited in the authors’ previous publication [1] while defining the quality properties of execution tracing. On the other hand, the experiences collected from the software professionals describe the content of the phenomenon with regard to the effect of the input variables in the output as (1) the p = 90% confidence intervals show acceptable ranges for the context of the research in Section 4.1, (2) an adjustment of the created model was performed by a mini-focus group in the scope of an adjustment and pre-validation stage, as reported in Section 4.5, and (3) international experts also validated the model, as reported in Section 4.6. In addition, the method applied for modelling can capture and describe vagueness and uncertainty; therefore, the deviations among the opinions collected from the software professionals did not cause a problem.
In summary, the internal validity, external validity, content validity, and construct validity of the conducted research are satisfactory. Nevertheless, increasing the sample size of the data collected for machine learning could improve the above validity indicators. However, the low sample size does not cause a serious impediment in the present study, as the technique used for modelling, fuzzy logic, allows the direct incorporation of human experiences accumulated in the problem domain, by which further data were incorporated in the model during the mini focus group discussion and in the course of tuning the model based on the opinions of international experts.
6. Limitations
The research was planned with great care, including the study population and sampling. However, the desired number of responses could not be achieved in the scope of sampling, which resulted in a low sample size. Nevertheless, the investigated confidence intervals of the data in Section 4.1 were satisfactory with regard to the problem domain. In addition, the low sample size was complemented by incorporating data collected at two further stages: (1) a mini focus group and (2) validation by international experts located in Austria, Germany, Hungary, and counting also authors in the UK.
The initial study population was restricted to Hungary, but the population included international companies with premises in different countries, with the same company-wide coding guidelines and coding habits; therefore, the initial restriction to a geographically localised population does not represent an impediment for the generalisability of the study, but it imposes a risk. This risk was mitigated by the stronger validation in the scope of the model tuning, in which international experts participated from different countries; i.e., the model has been validated by these international experts.
Furthermore, the constructed and validated model is a general model for describing execution tracing quality. The application domain used—i.e., (1) server application, (2) desktop application, (3) web UI, (4) mobile application, or (5) embedded application—can also have an influencing effect on the importance of the single linguistic rules identified. Thus, tuning the model with regard to the application domain can improve the performance.
7. Discussions
The application of fuzzy logic in the context of the present research shows the following main advantages: (1) uncertainty related to execution tracing quality and its inputs can be captured and described, (2) linguistic rules that describe the problem domain in an human-understandable manner are available, (3) human experience can directly be incorporated in the rule base to tune the model, and (4) adaptive methods exist to extract the linguistic rules from a data set containing the experiences of software professionals. The properties of fuzzy systems mentioned in point 2 and 3 outperform those of the neural networks (NN). NNs neither produce a rule base in a human-understandable manner nor make the direct incorporation of human experiences in the system possible. In addition, the linguistic rules can also be regarded as guidelines for software professionals on how to implement a good-quality execution tracing mechanism, as they explicitly formulate which input variable combinations result in a {good, very good} output, and they also describe the poor results in linguistic terms; however, the rules also impact each other’s output.
In the scope of a pilot study [107], the authors tested with which approach the uncertainty and vagueness in the context of execution tracing quality can be captured in the most appropriate manner. The findings of the pilot study [107] were used in the current research; therefore, an adaptive fuzzy system with overlapping, Gaussian-shaped membership functions at the inputs with the Takagi–Sugeno–Kang inference mechanism [23] was selected for modelling. In contrast to the pilot study, the present research is based (1) on the elicited quality properties of execution tracing [1], which formulate the input variables of the created quality model; (2) on the experiences of many software professionals from a well-defined study population; (3) on the linguistic rules extracted from the collected data by machine learning; (4) on the incorporation of direct human experiences into the model created by computational intelligence from software professionals with many years of experience in academia and in the industry; and (5) on the feedback from international experts, who also validated the created model.
While establishing the knowledge base of the fuzzy system in the form of linguistic rules, it is easy to introduce contradictions based on the different opinions of individual experts in the problem domain [107]. To avoid this issue, the linguistic rules have been identified in an adaptive manner by fixing the input membership functions and the output membership functions and letting the system find the optimum of the root mean squared error (RMSE) by fitting the rules to the collected data by genetic algorithms [26,27,112,115]. The same training procedure was repeated in a manner by which all possible variations of the input partitions were combined into linguistic rules with separate output membership functions. In this second case, the linguistic rules were fixed, and the adaptive process looked for the minimum of the RMSE while changing the parameters of the membership functions by an adaptive-network-based fuzzy inference system approach (ANFIS) [24,25]. Both the GA and the ANFIS approach achieved the same accuracy; i.e., they supported the outcome of each other with regard to the data. The adaptive process was implemented as supervised learning; i.e., the optimal parameters of the membership functions and the best matching rules were identified in the scope of the learning process, where input and output data pairs were provided for the system. After achieving the desired accuracy and performance, the trained system became available for carrying out the specified tasks. In the context of the present research, the output of the GA approach was used for further processing as it defined the knowledge base in the form of linguistic rules with an upper bound, which was further tuned and validated by experts.
The application domains of (1) server applications, (2) desktop applications, (3) web UIs, (4) mobile applications, and (5) embedded applications have different characteristics. These differences might influence the created model, and the formalised linguistic rules can have a different importance in each of the listed domains, which opens further tuning possibilities with regard to the specificities of these domains.
8. Conclusions and Future Work
The previous studies introduced in Section 2 focus on individual aspects of logging, such as what to log, how to log, and where to embed log statements in the source code of the applications. Overall guidelines on how to construct logging do not exist but would be desirable, as stated in [4,5,8,10,29]. In addition, measuring logging quality quantitatively, setting quality targets for it, and comparing the log quality of different projects or the same project at different points in time were not possible. For these reasons, it was necessary to create a quality model for execution tracing, which was done in the scope of the conducted research.
Uncertainty and vagueness are inherently present in the software product quality measurement and assessment process. In addition, the dispersion of the collected data in comparison to the range of the possible answers the respondents could give was high, which indicates vagueness associated with the rating process. Consequently, the application of fuzzy logic was an ideal candidate to capture and describe the phenomenon; on the other hand, more detailed guidelines can be elaborated regarding how the respondents should judge the variables in question to decrease the uncertainty.
In addition to the constructed quality model, the study identified the following findings: (1) the inputs accuracy and design and implementation have the most influence on the quality of execution tracing, and these quality properties approximately determine the quality with the minimum-relationship; i.e., the lower value determines the quality of logging. (2) Legibility is a benefit, as it helps to reduce the effort while localising errors; moreover, it reduces the psychological load on the software development and software maintenance professionals while performing the analysis. The absence of this quality property causes an unnecessary load on the staff and deteriorates analysis performance, but it does not block the analysis itself, which might be the case with the quality properties of accuracy and design and implementation if they are missing. (3) The quality property security is a feature that does not lie in the primary focus while localising errors, but this feature also needs to be satisfied to some extent to avoid leaking sensitive information and to observe legal regulations. Tracing highly sensitive information might block the deployment of the application in certain domains due to legal regulations, including the medical and financial fields. The quality property security has a reverse relationship with execution tracing quality as far as the amount of information is concerned. On the other hand, tracing sensitive information can also cause additional work to be incurred to remove it if the logs need to be passed on to other teams for further analysis.
In future work, the authors plan to link the constructed quality model to overall software product quality frameworks to consider execution tracing quality with regard to software product quality as a whole. In addition, the simplification of the mathematically complex model is also planned to ensure an easy-to-tailor approach to specific application domains.
Author Contributions
Conceptualization, T.G., F.C. and F.S.; methodology, T.G.; validation, T.G., F.C. and F.S.; formal analysis, T.G.; investigation, T.G.; resources, T.G.; data curation, T.G.; writing—original draft preparation, T.G.; writing—review and editing, F.C. and F.S.; visualization, T.G.; supervision, F.C. and F.S.; project administration, T.G.; All authors have read and agreed to the published version of the manuscript.
Funding
This research received no external funding.
Institutional Review Board Statement
The study was conducted according to the guidelines of the Declaration of Helsinki, and approved by the Institutional Review Board of the De Montfort University, ethical approval code: 1718/453, date of approval: 31 May 2018.
Informed Consent Statement
Informed consent was obtained from all subjects involved in the study.
Data Availability Statement
The collected data sets and the questionnaires used for data collection have been made available: Tamas Galli, Francisco Chiclana, Francois Siewe. Genetic Algorithm-Based Fuzzy Inference System for Describing Execution Tracing Quality-Collected Data [Data set]. Zenodo. 2021. https://0-doi-org.brum.beds.ac.uk/10.5281/zenodo.5552684 (accessed on 6 October 2021).
Acknowledgments
The authors are grateful to all the professionals who participated in the study; moreover, they also express special thanks to the management of the companies involved for making the organisation of the survey possible.
Conflicts of Interest
The authors declare no conflict of interest.
Appendix A. Data Processing and Exploratory Data Analysis
Appendix A.1. Rating the Input Variables of the Use Cases
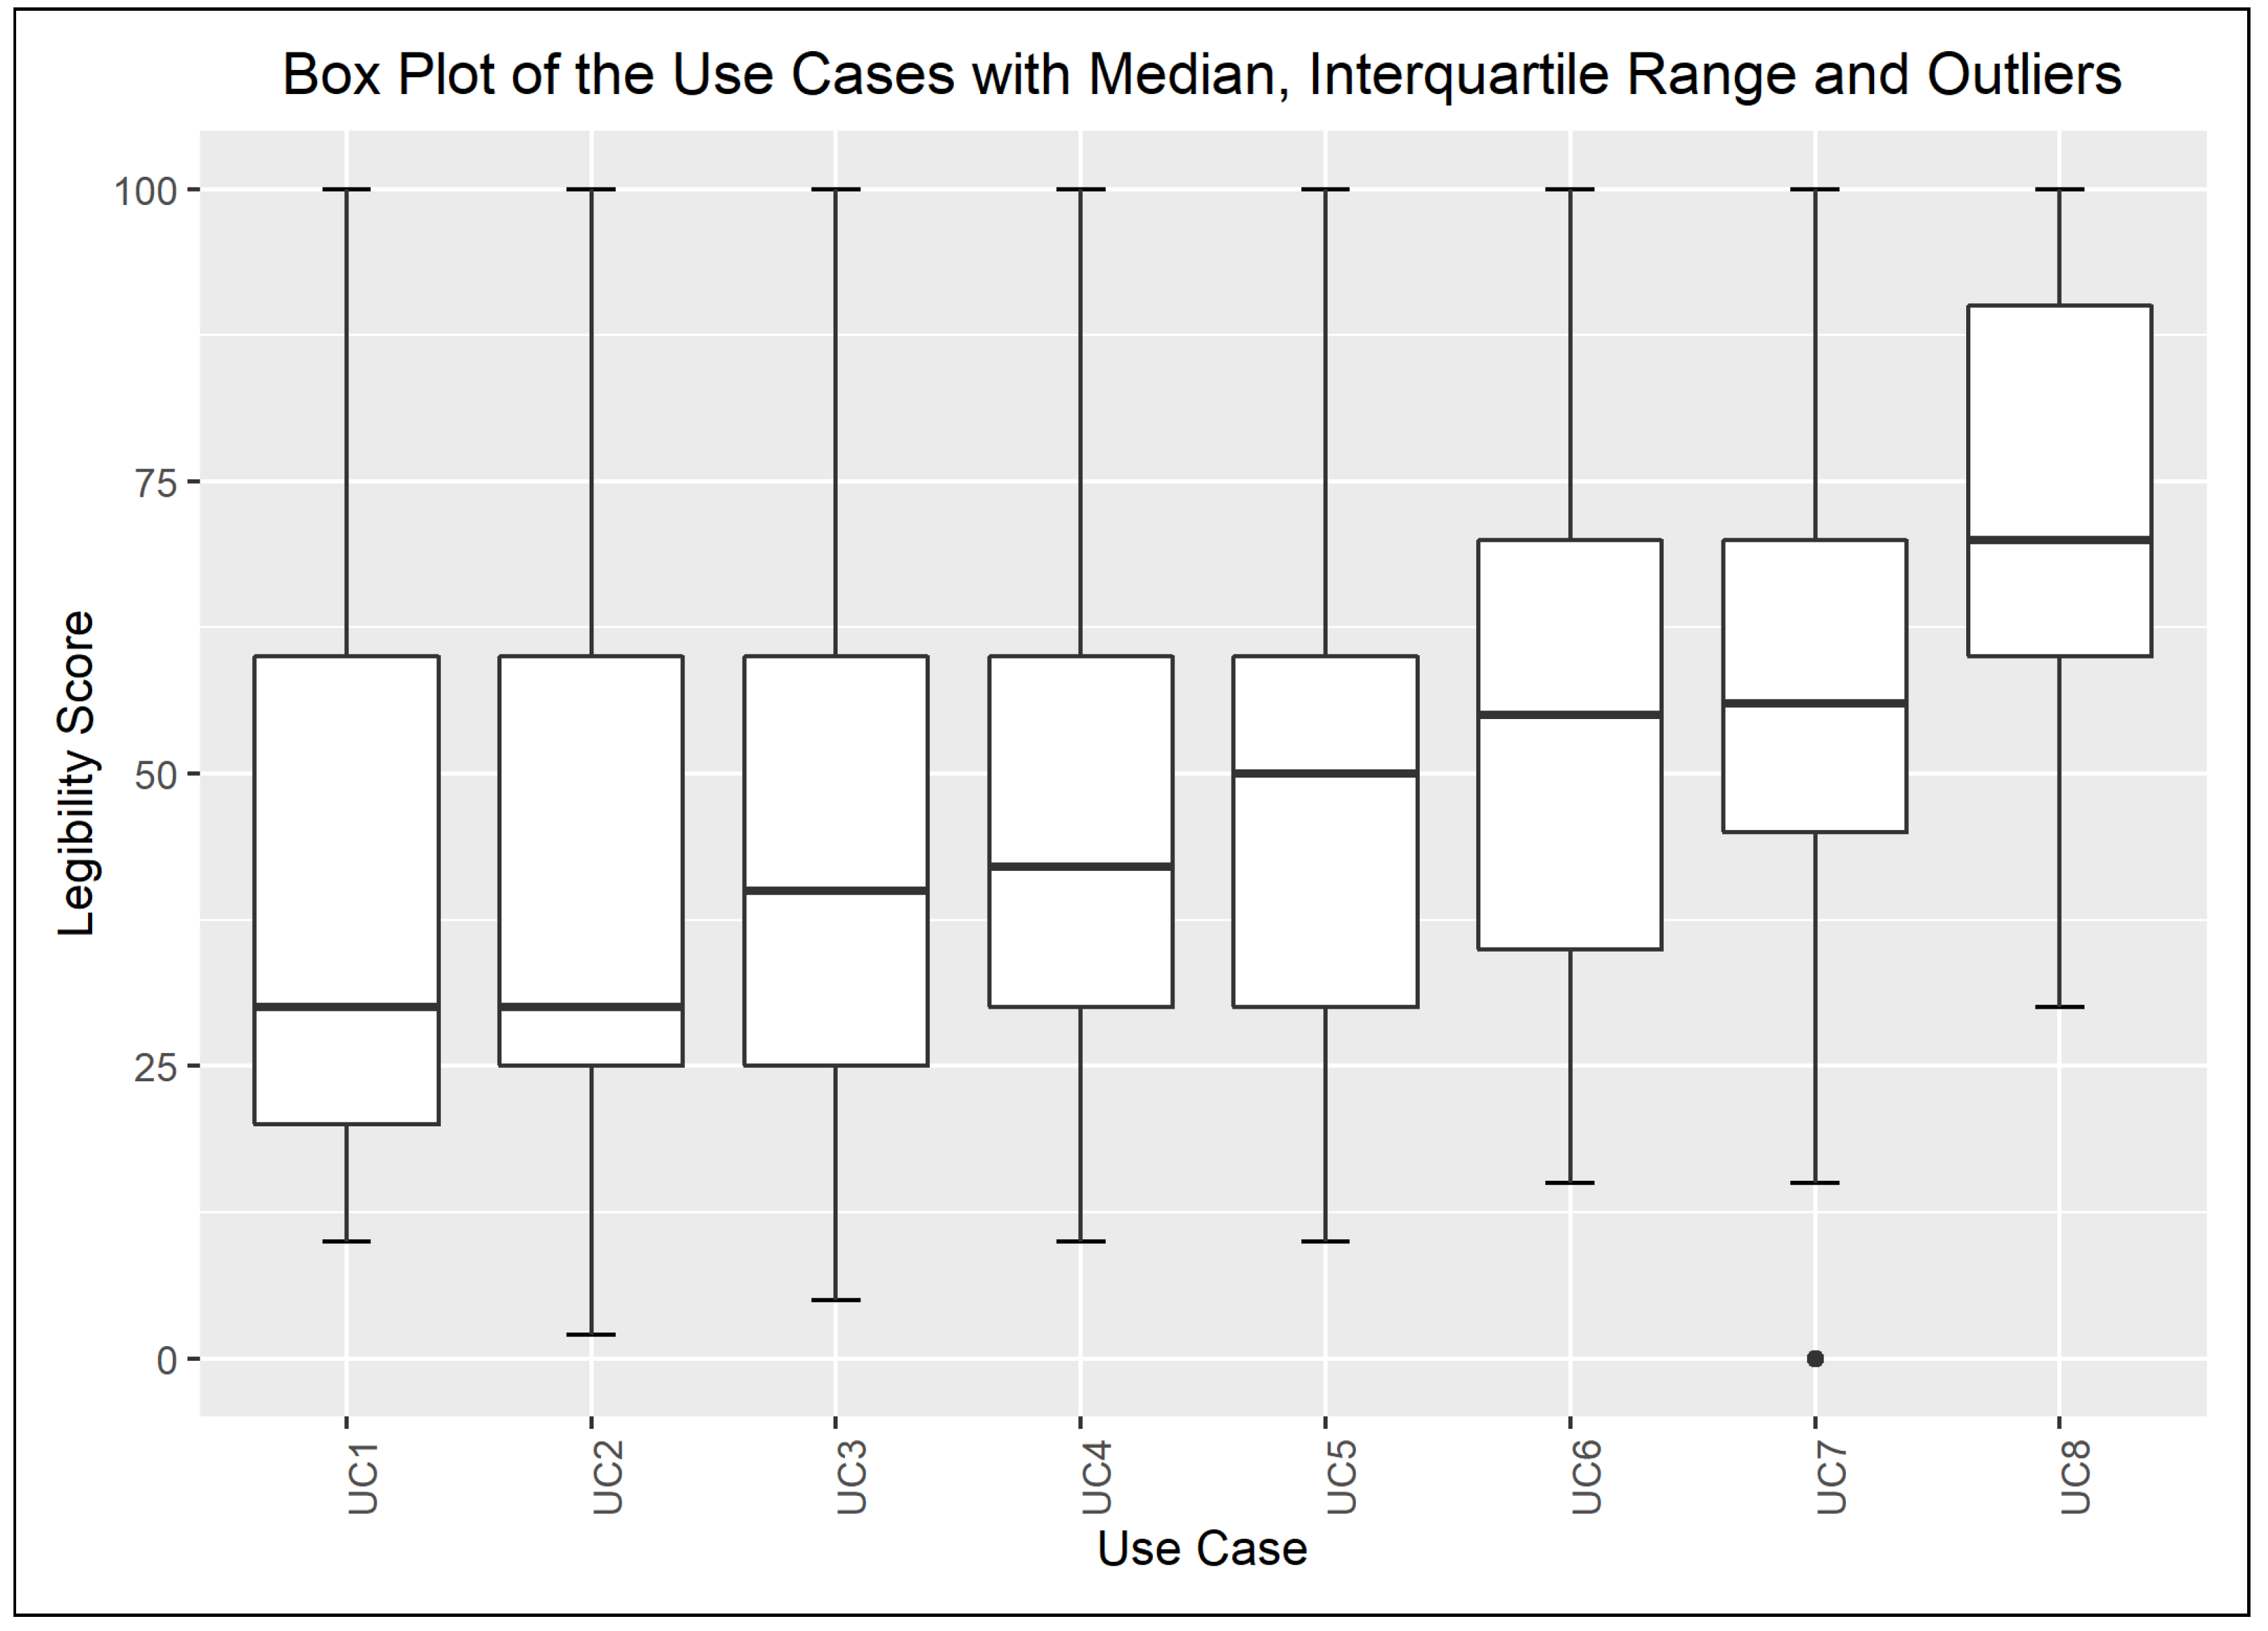
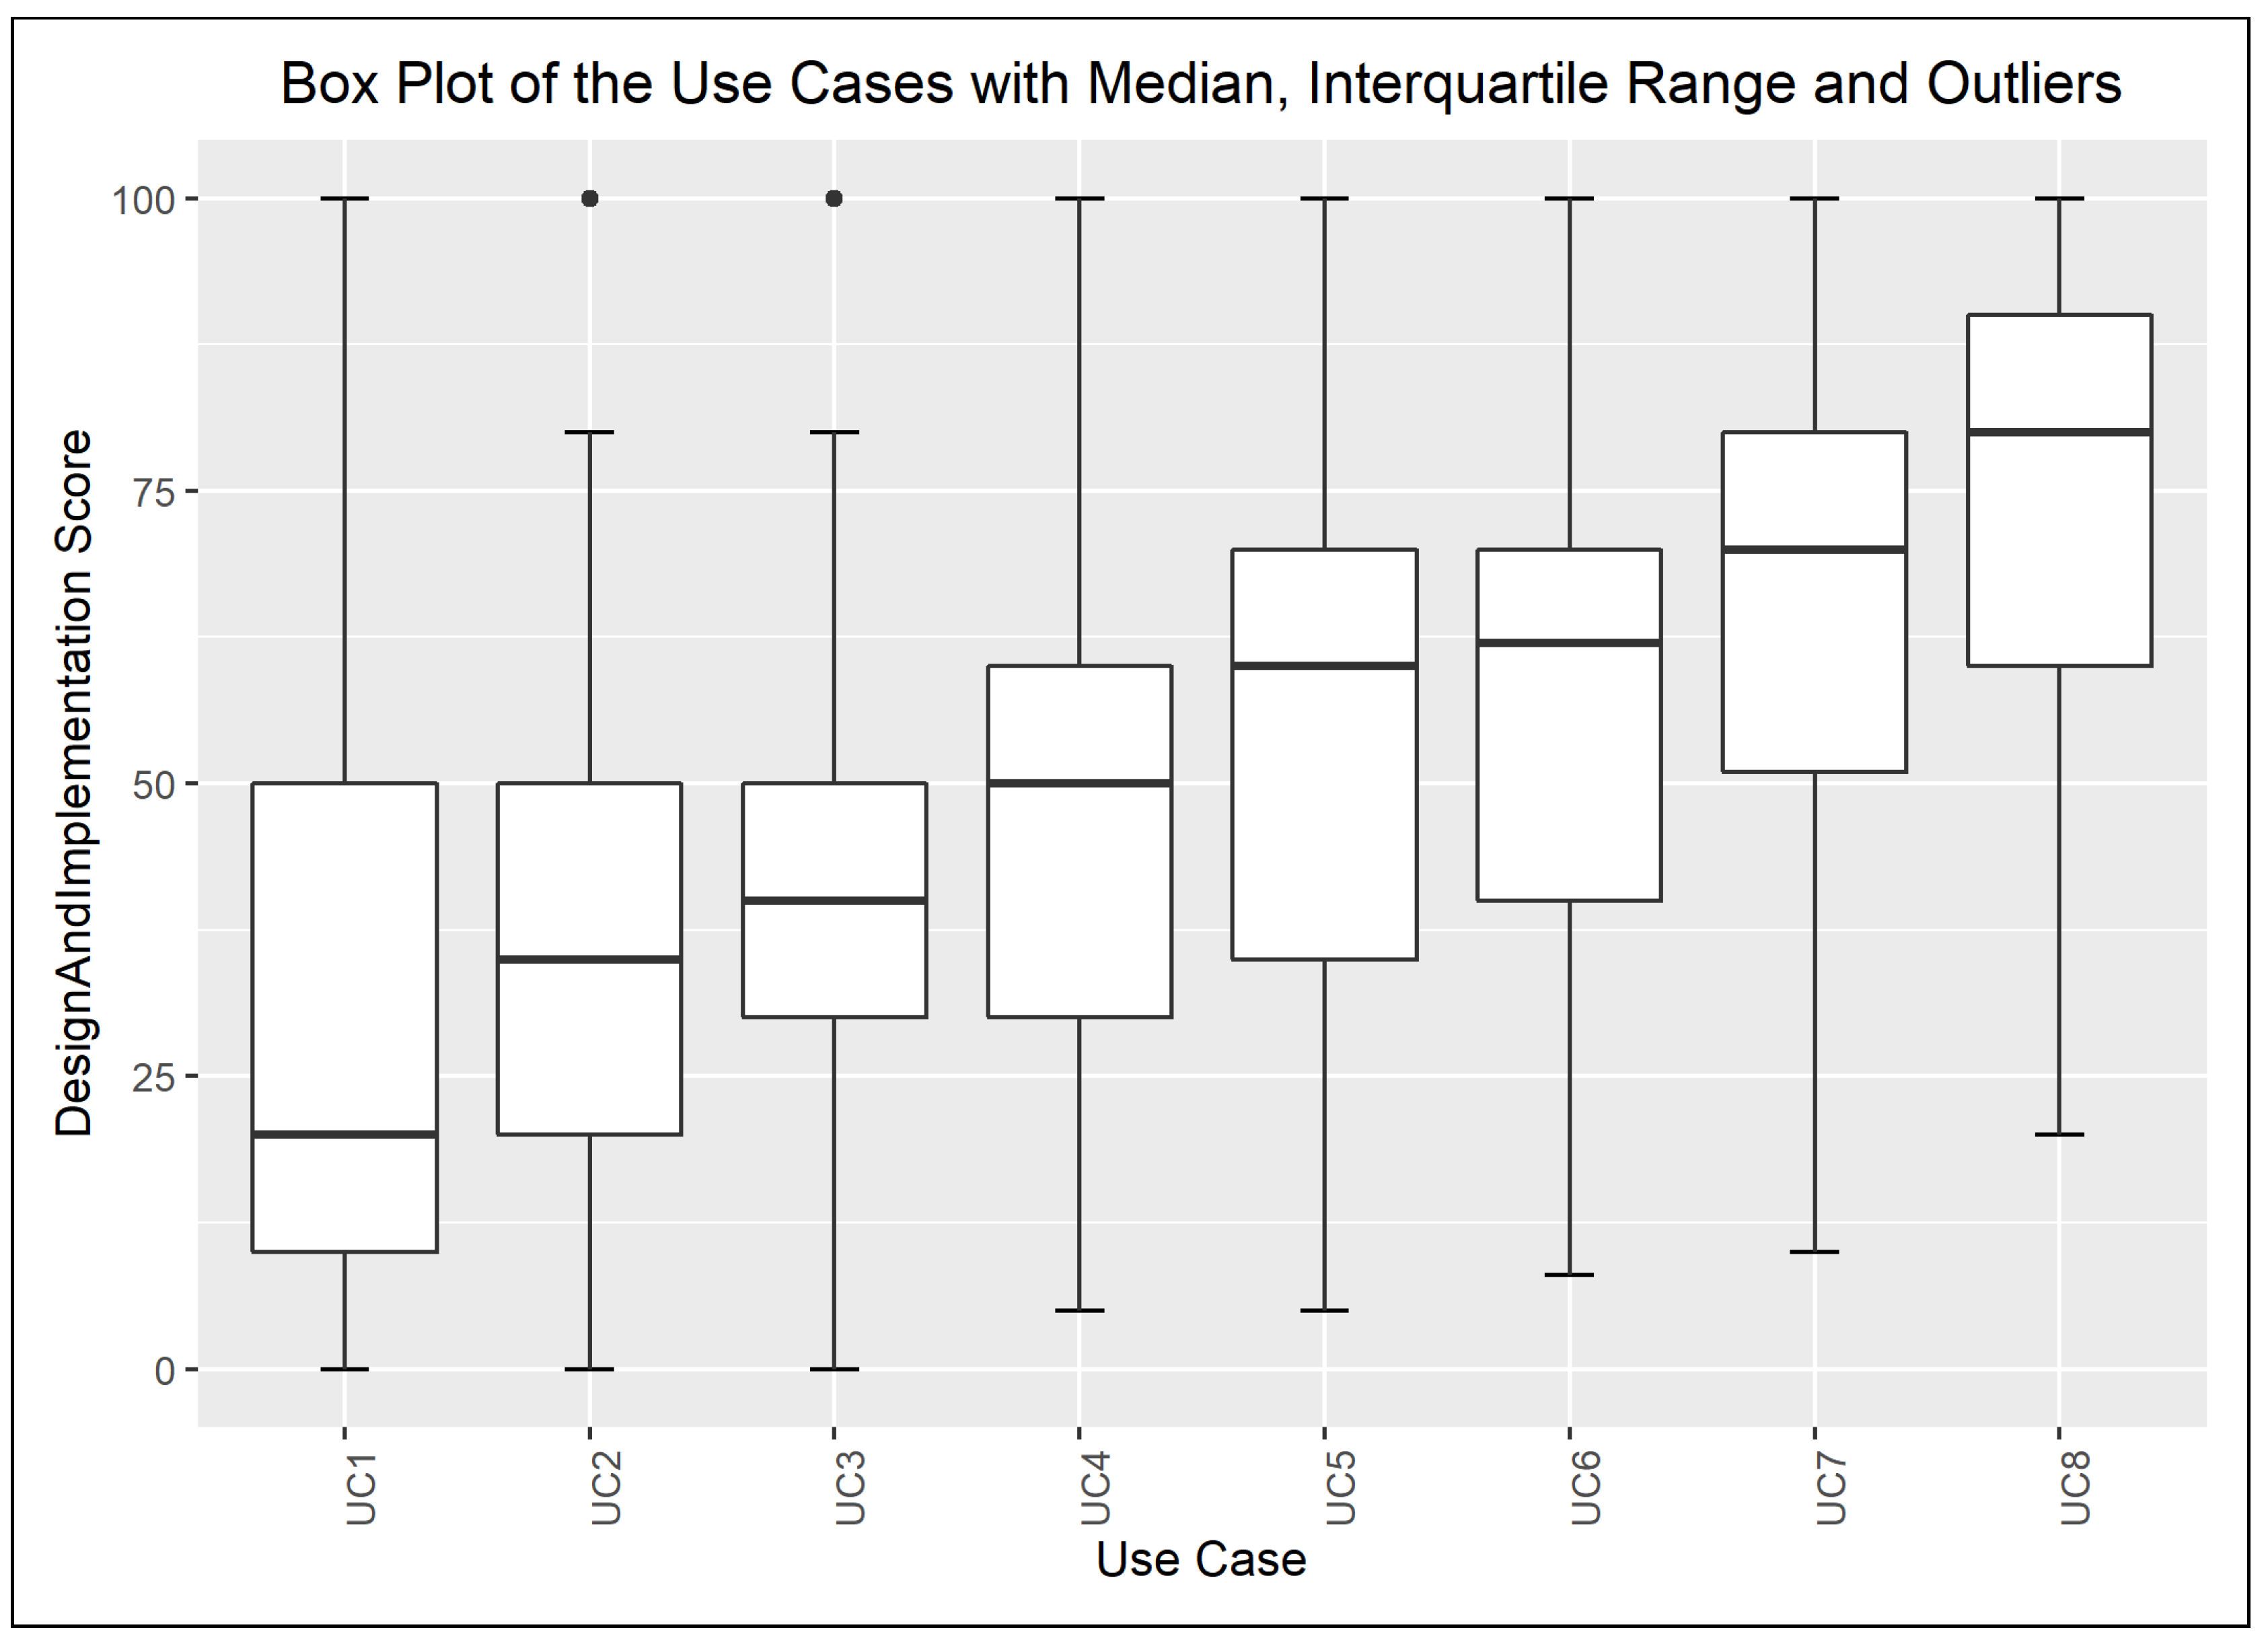
The charts below depict the responses for each input variable of the defined use cases.
Figure A1.
Distribution of the Accuracy Scores Assigned to the Use Cases.

Figure A2.
Distribution of the Legibility Scores Assigned to the Use Cases.

Figure A3.
Distribution of the Design and Implementation Scores Assigned to the Use Cases.

Figure A4.
Distribution of the Security Scores Assigned to the Use Cases.

Appendix A.2. Normality Checks of the Collected Data
The quantile–quantile plots below depict the distribution of each collected variable. The 0.95% confidence interval is also shown; moreover, the computed Sharpio–Wilk normality test values are added to the charts. The extreme input variable value combinations Q20 and Q22 contained solely identical values; therefore, they were excluded from the normality test.
Figure A5.
Distribution of Collected Variables Regarding Use Case 1.

Figure A6.
Distribution of Collected Variables Regarding Use Case 2.

Figure A7.
Distribution of Collected Variables Regarding Use Case 3.

Figure A8.
Distribution of Collected Variables Regarding Use Case 4.

Figure A9.
Distribution of Collected Variables Regarding Use Case 5.

Figure A10.
Distribution of Collected Variables Regarding Use Case 6.

Figure A11.
Distribution of Collected Variables Regarding Use Case 7.

Figure A12.
Distribution of Collected Variables Regarding Use Case 8.

Figure A13.
Distribution of Collected Variables Regarding Real Project Data.

Figure A14.
Distribution of the Assigned Variables to the Extreme Input Variable Values, Q0–Q5.

Figure A15.
Distribution of the Assigned Variables to the Extreme Input Variable Values, Q6–Q11.

Figure A16.
Distribution of the Assigned Variables to the Extreme Input Variable Values, Q12–Q17.

Figure A17.
Distribution of the Assigned Variables to the Extreme Input Variable Values, Q18–Q21.

Appendix B. Modelling
Figure A18 and Figure A19 illustrate the different error indicators with regard to the maximal number of rules set in the course of the learning process. In addition, the corresponding data are demonstrated in Table A1 and Table A2.
Figure A18.
Depiction of the Best RMSE Errors for the Training Data.


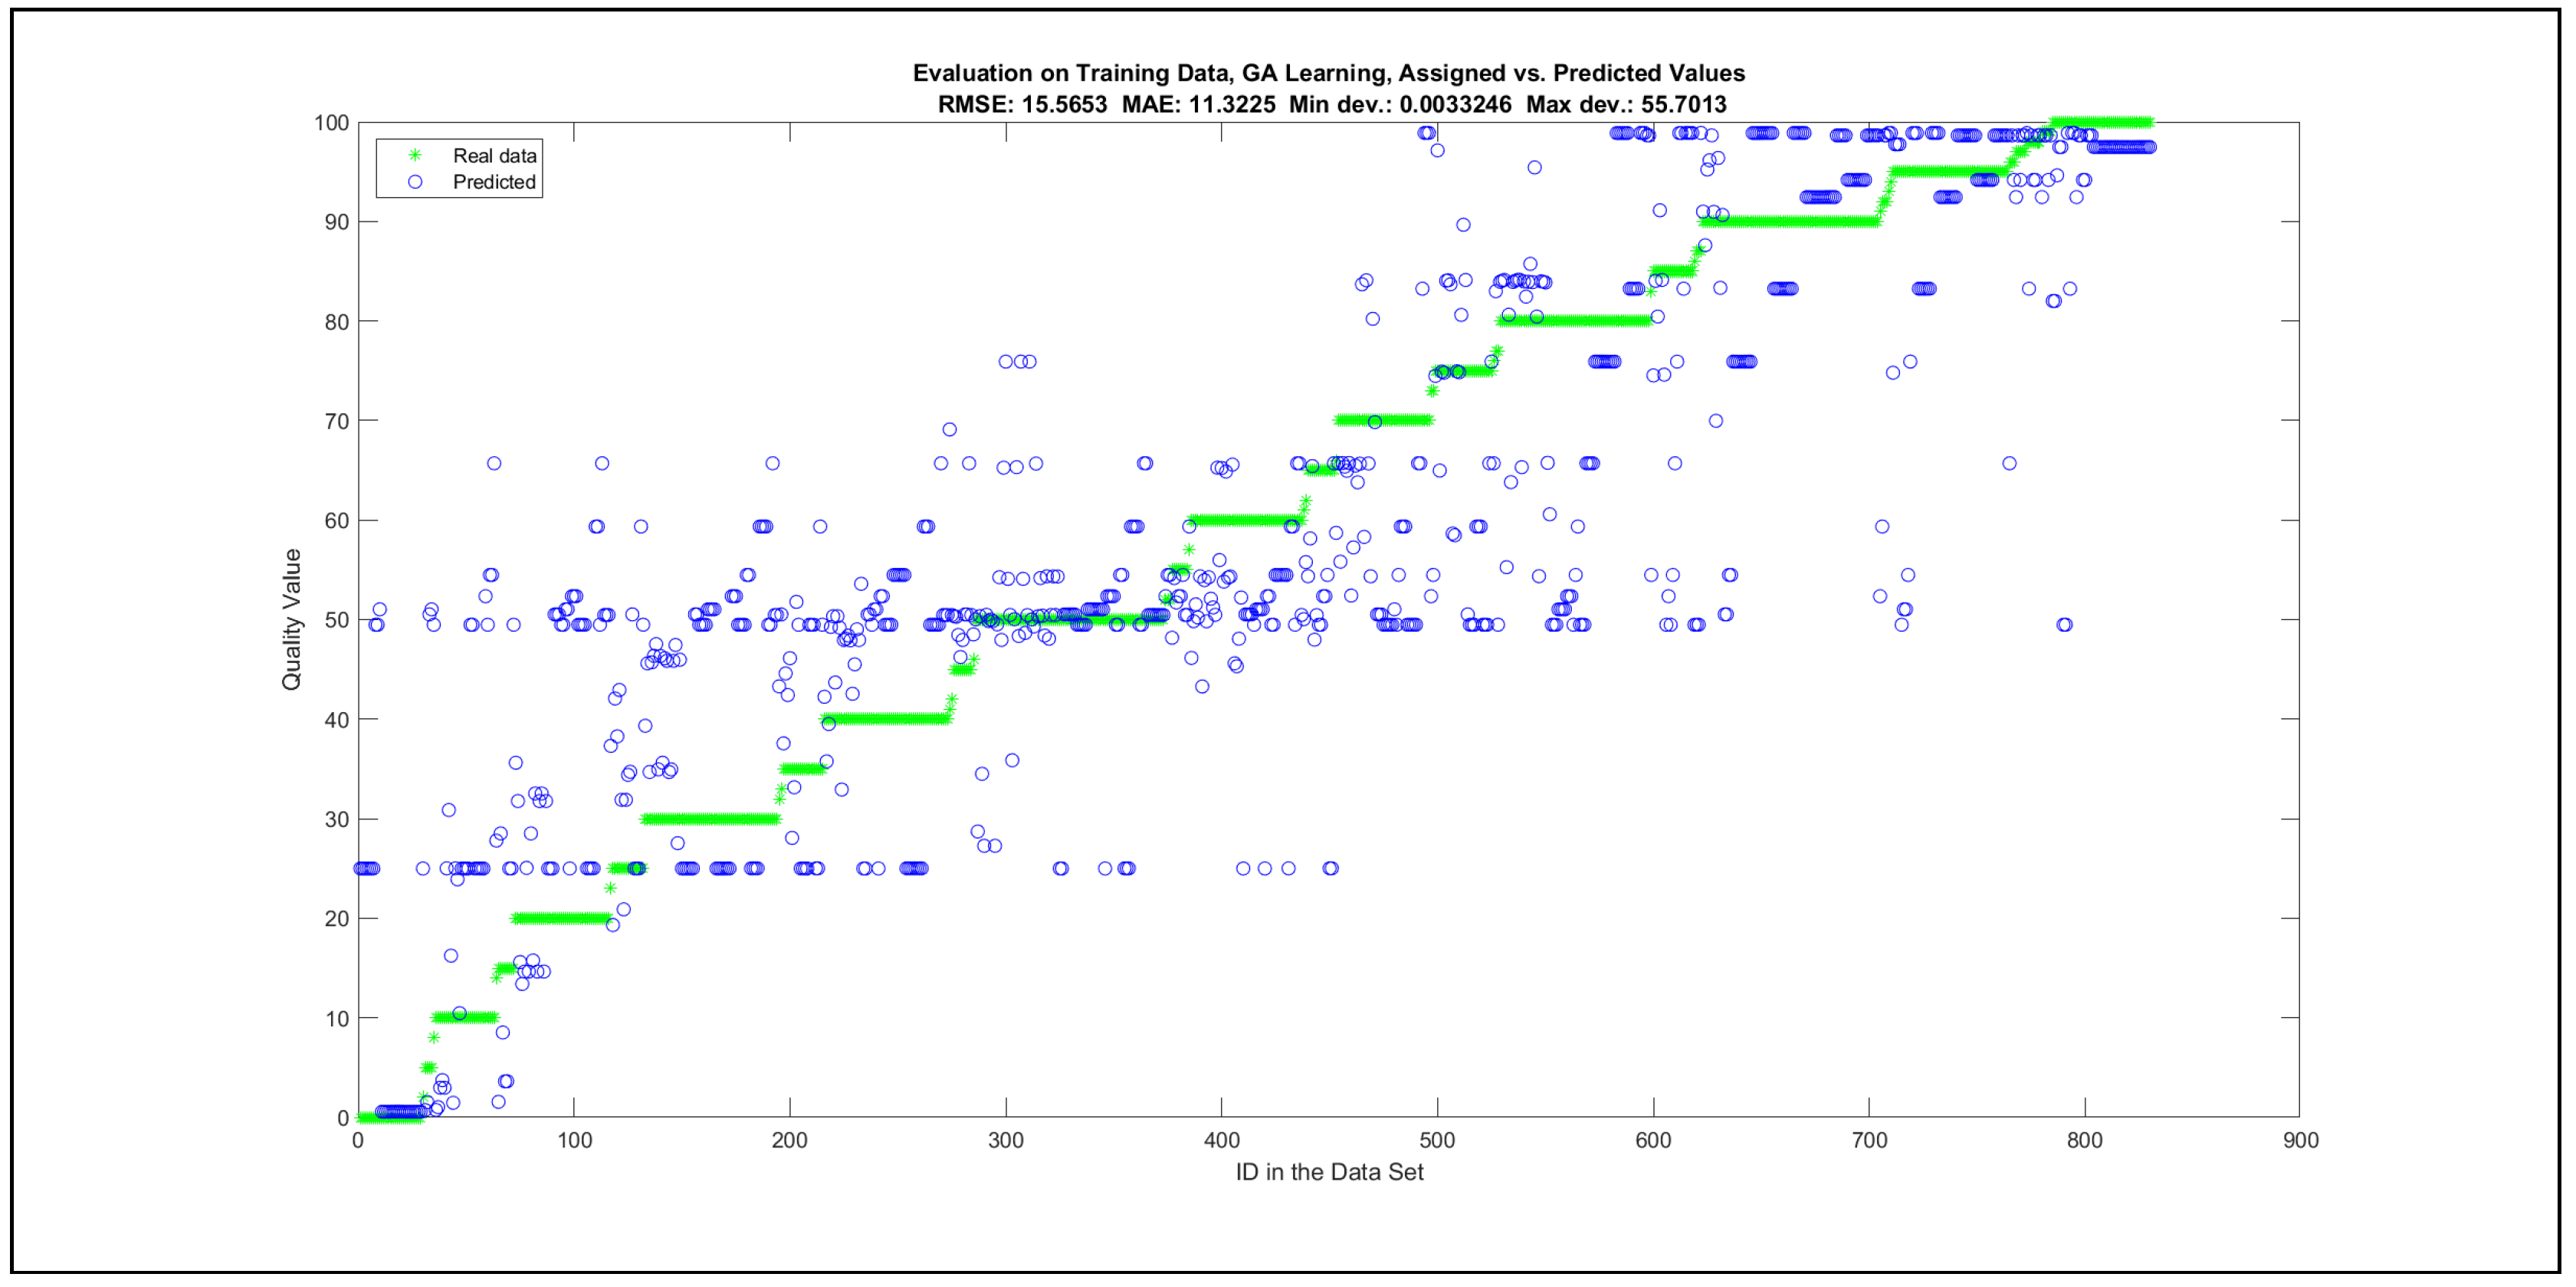
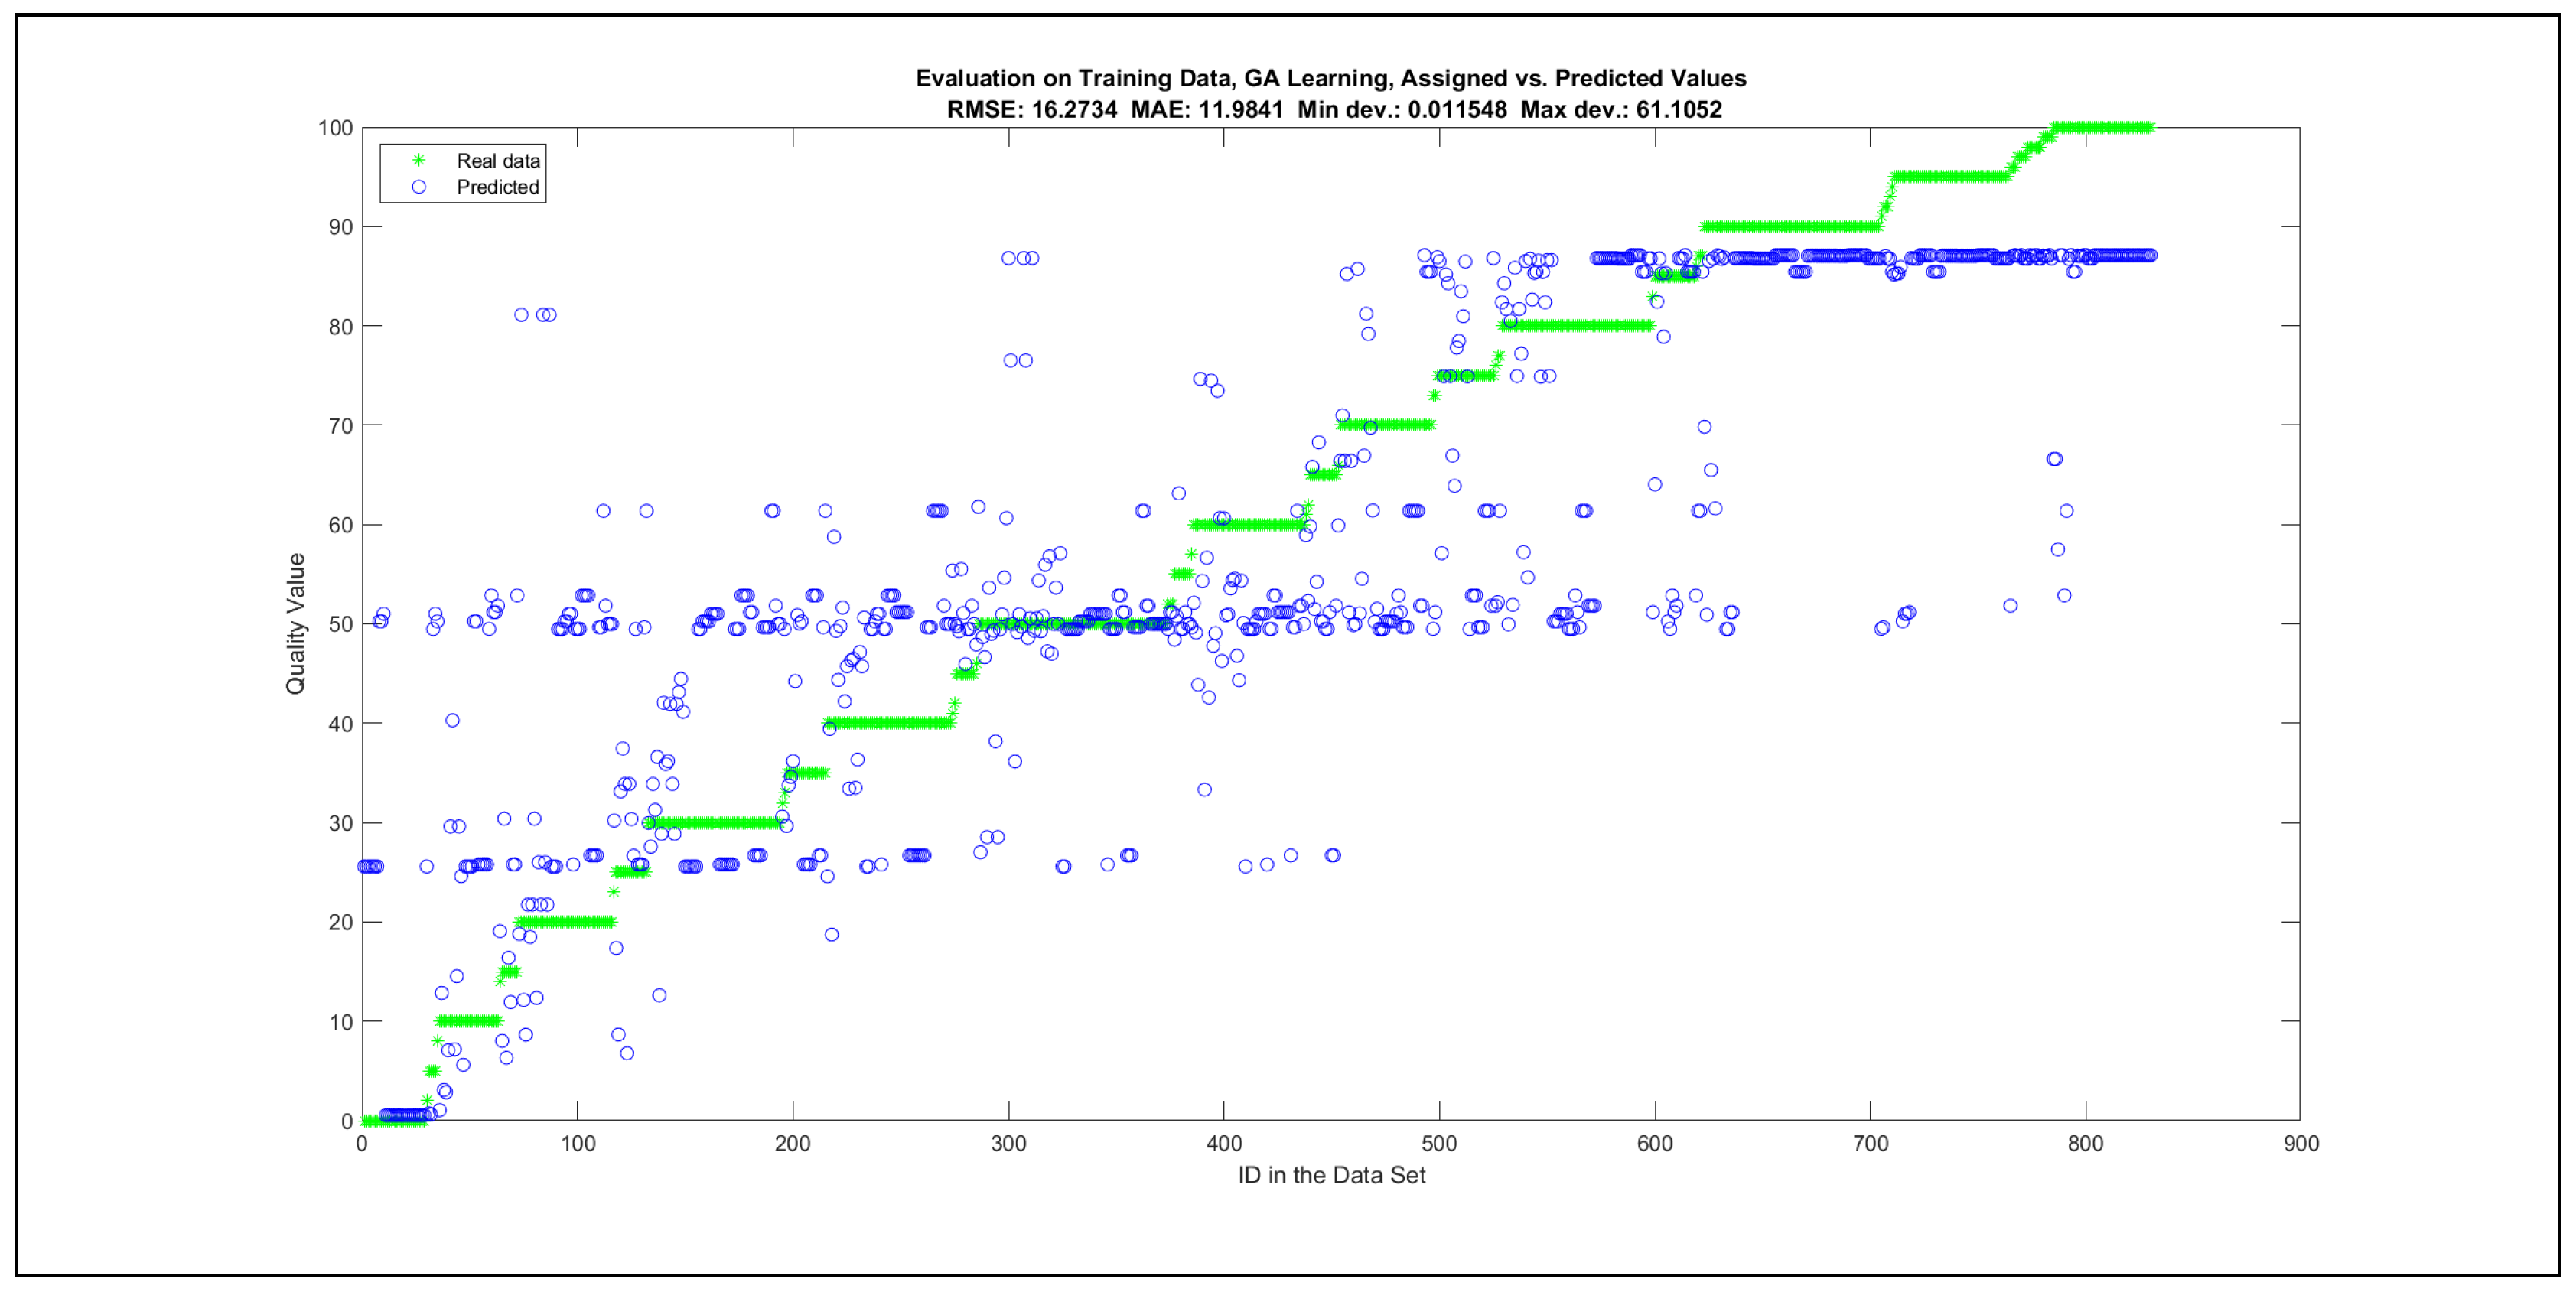
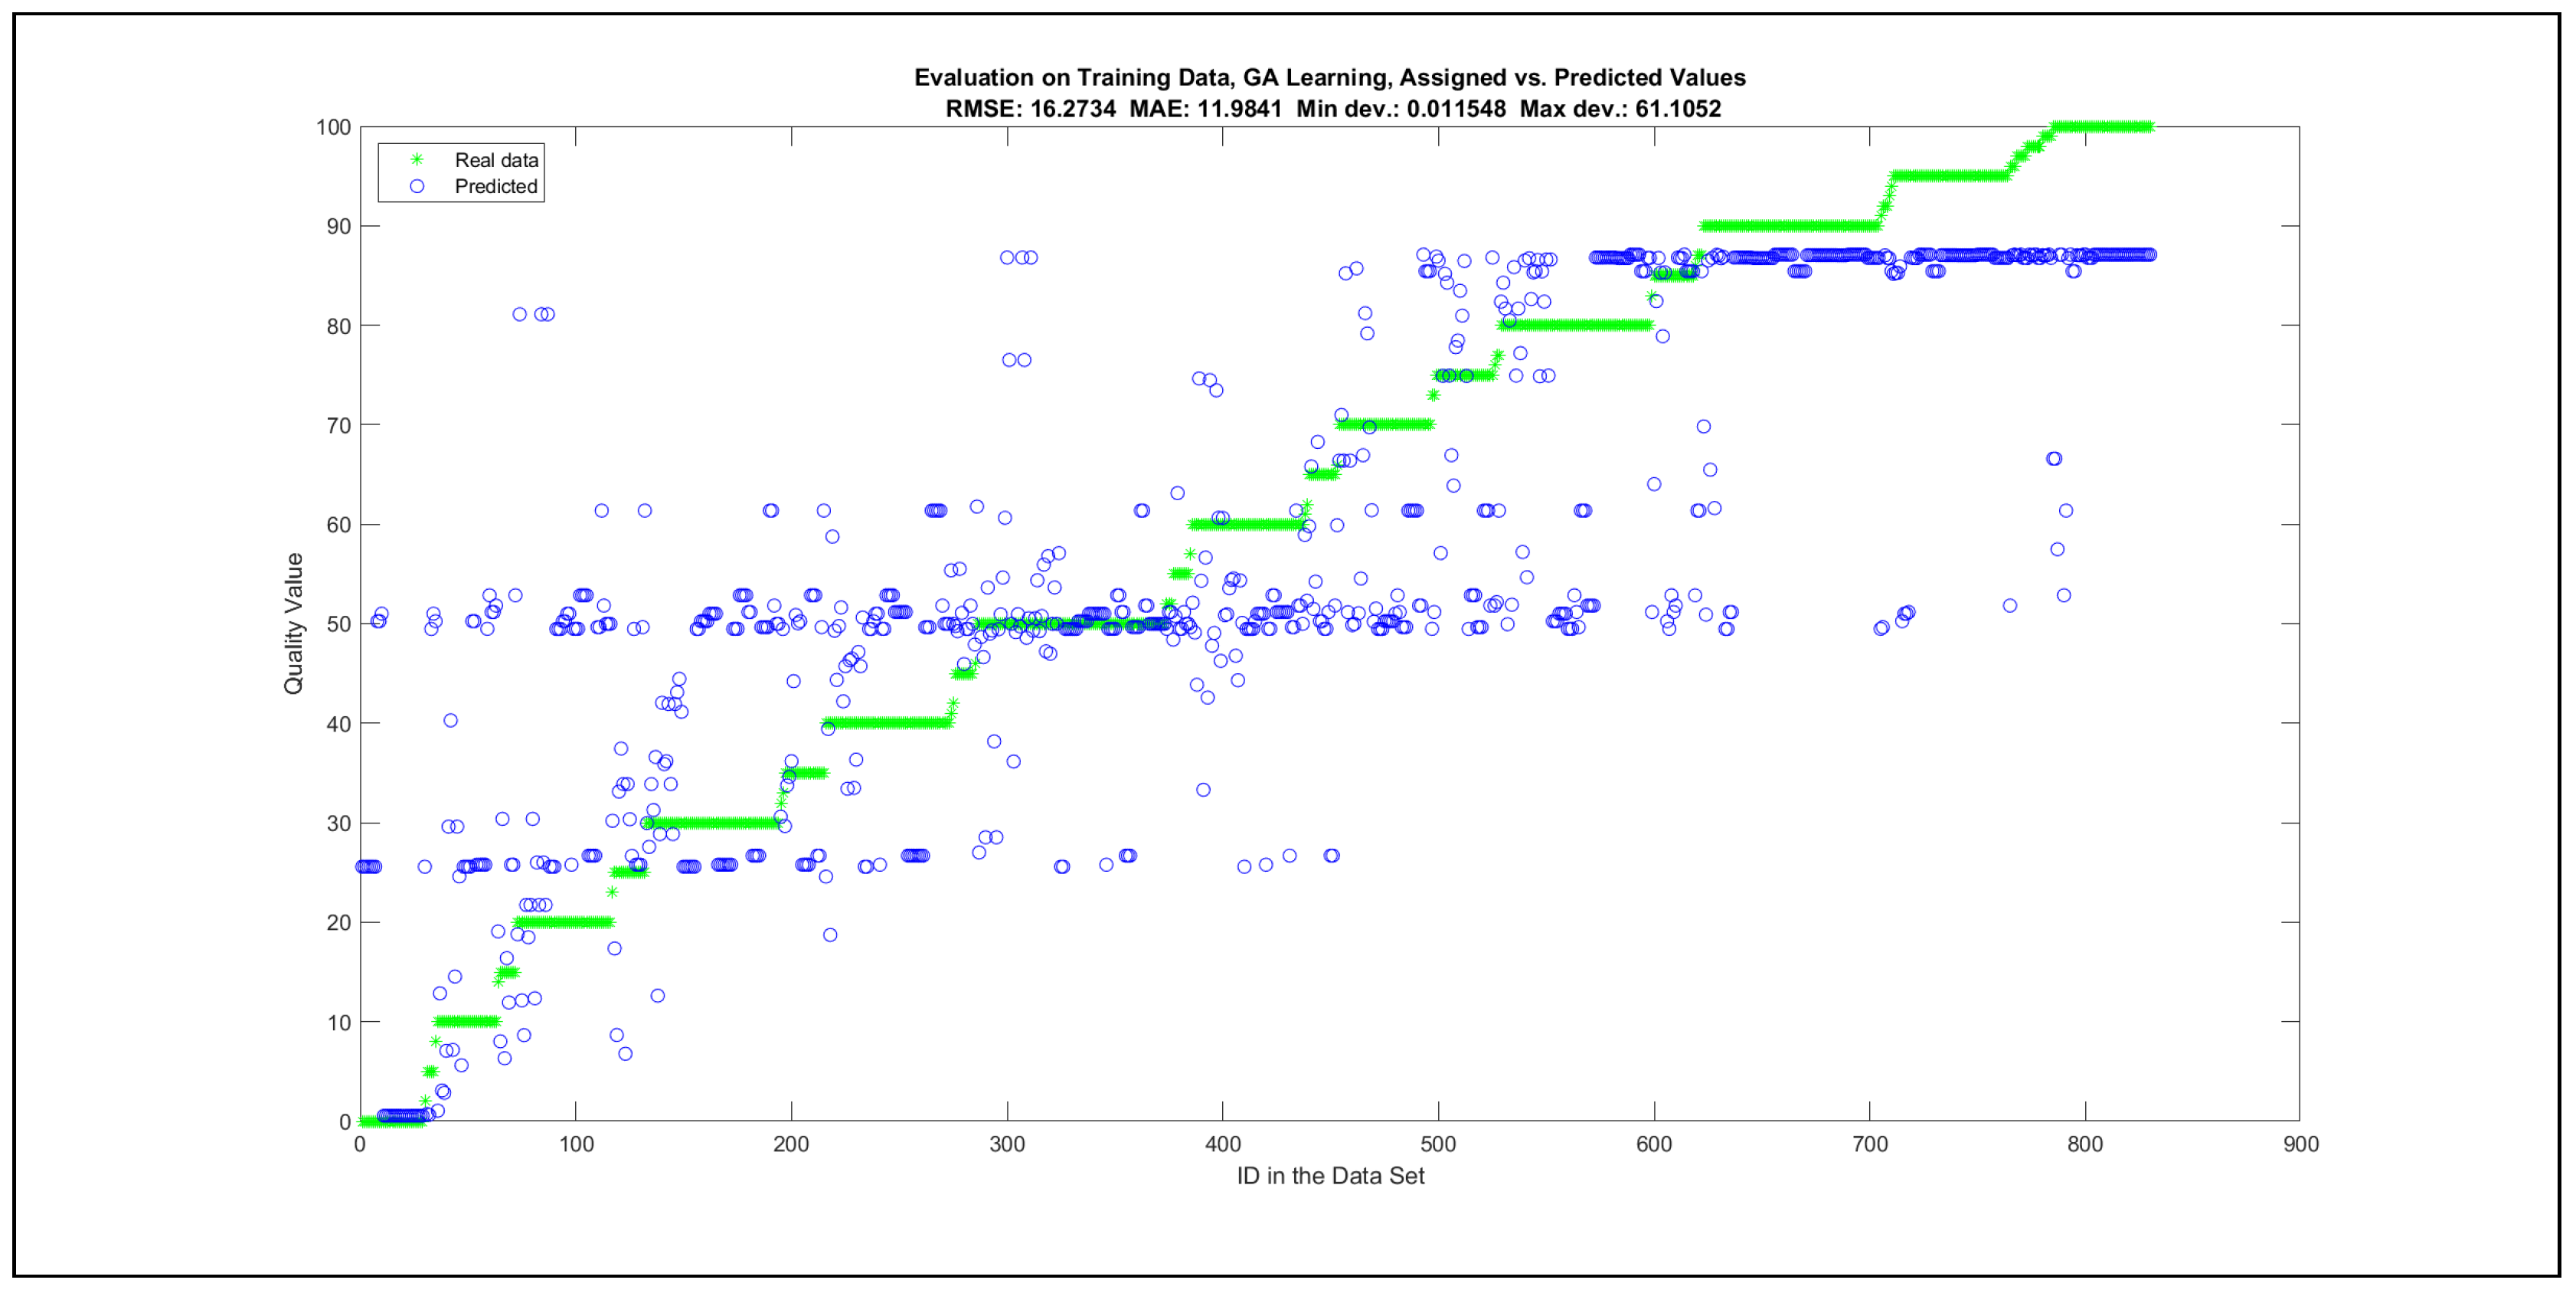
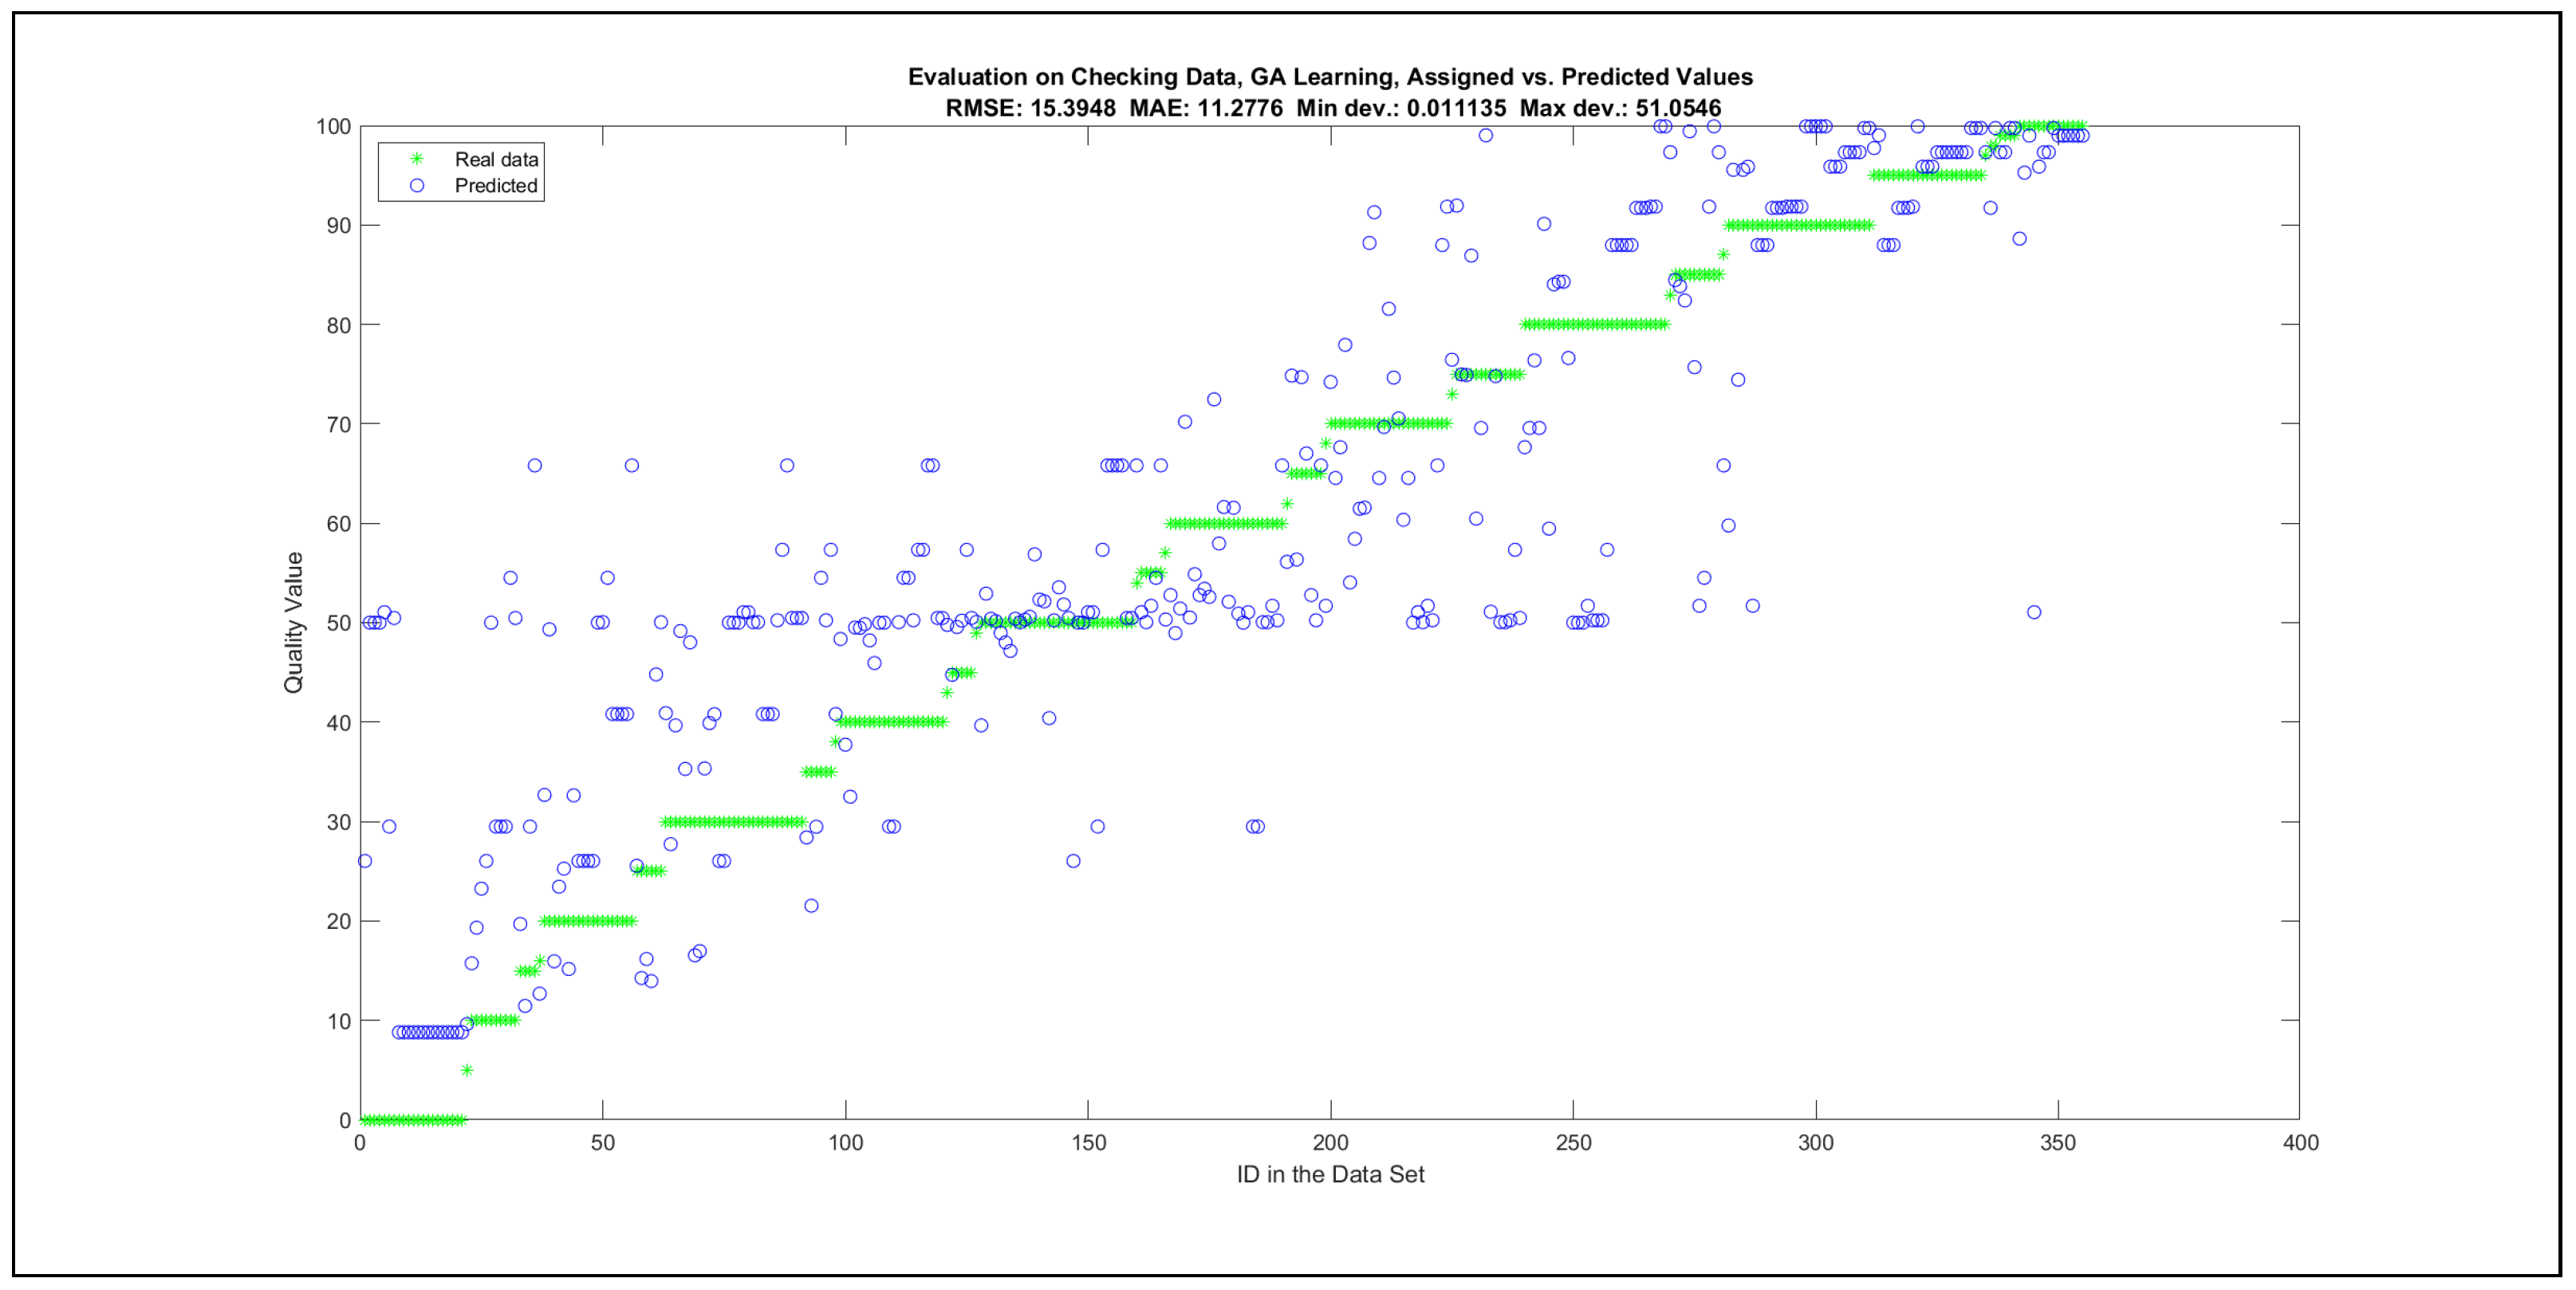
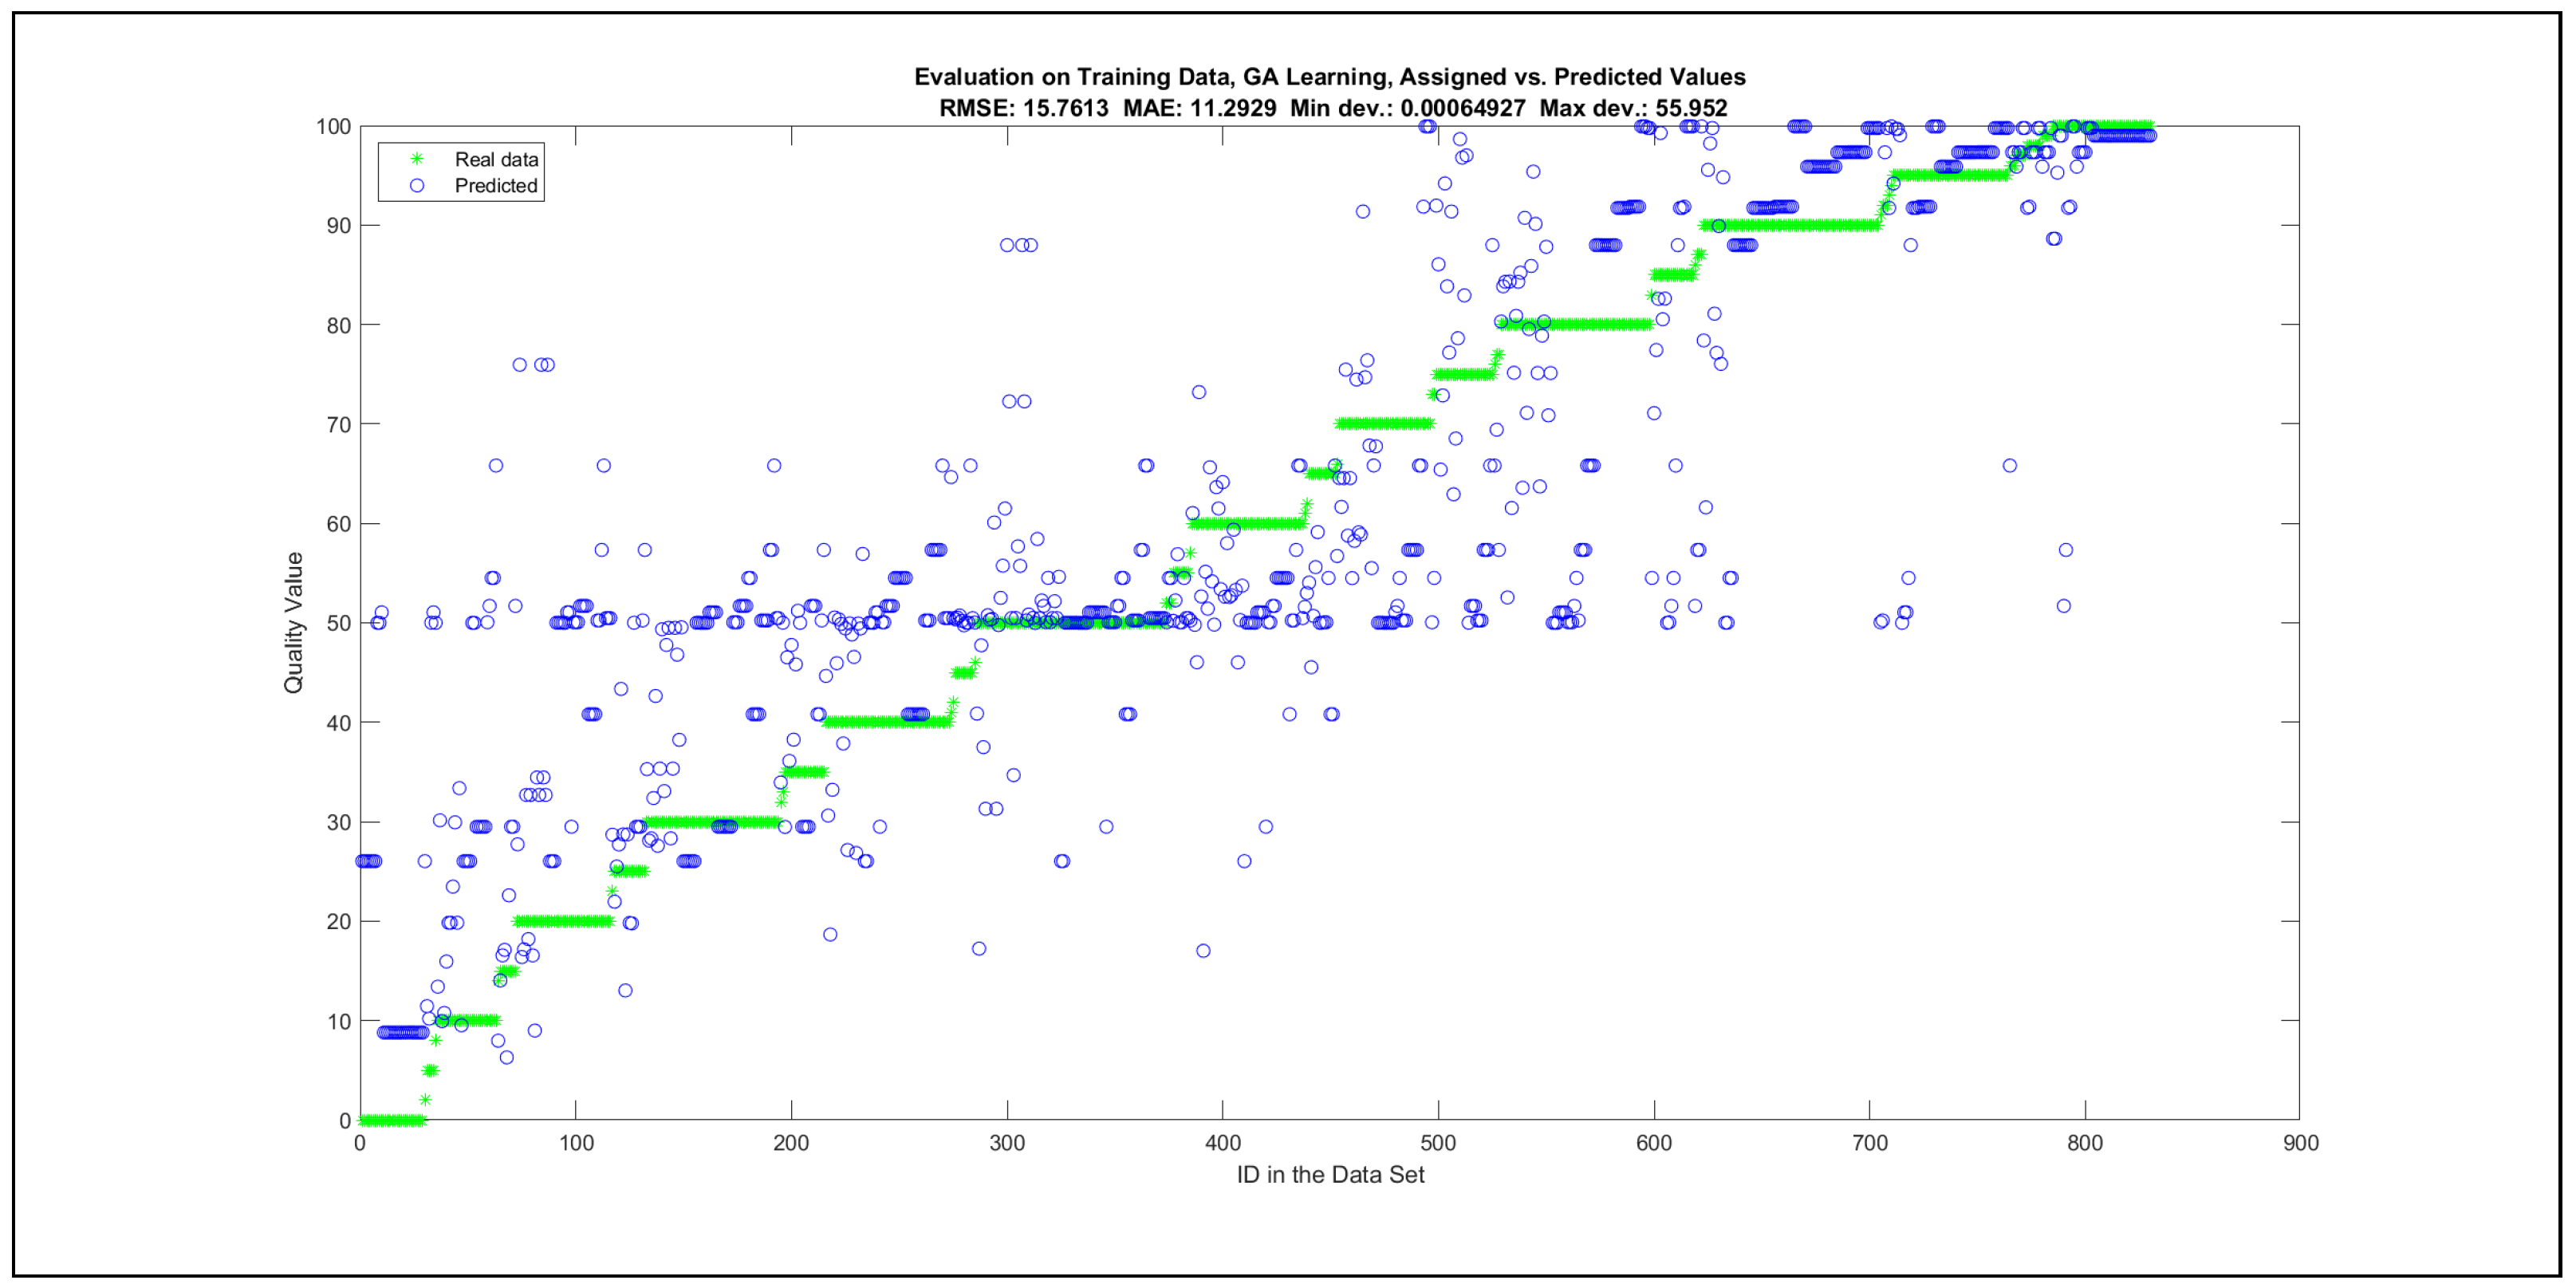
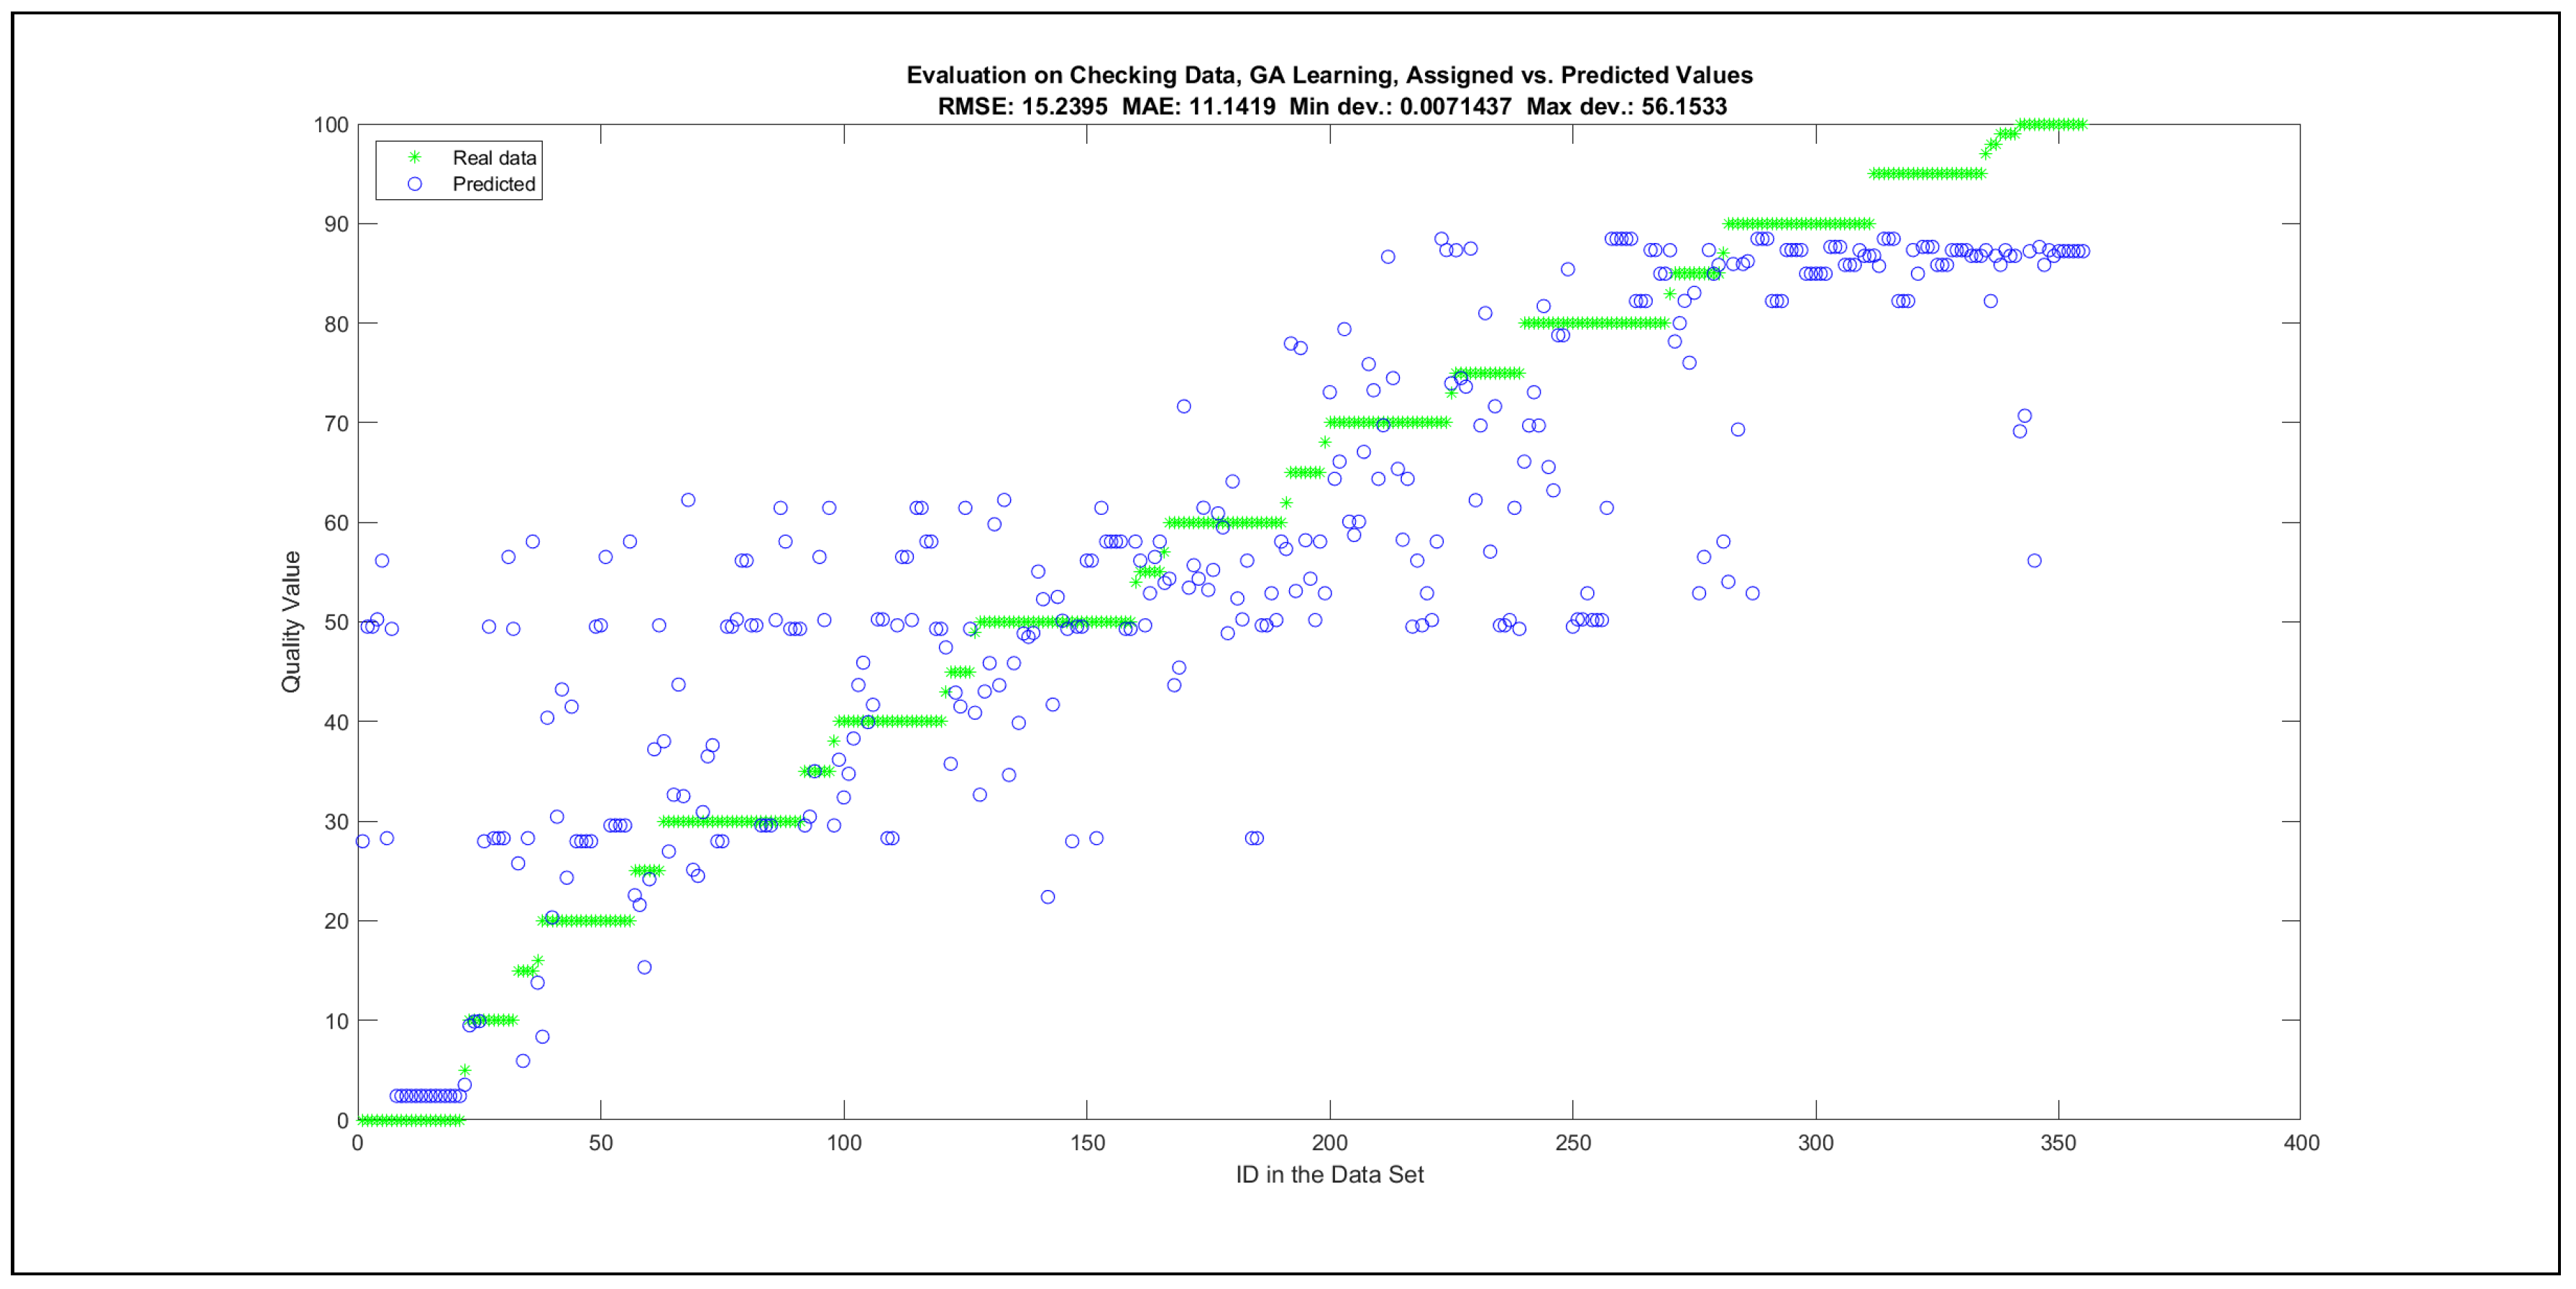
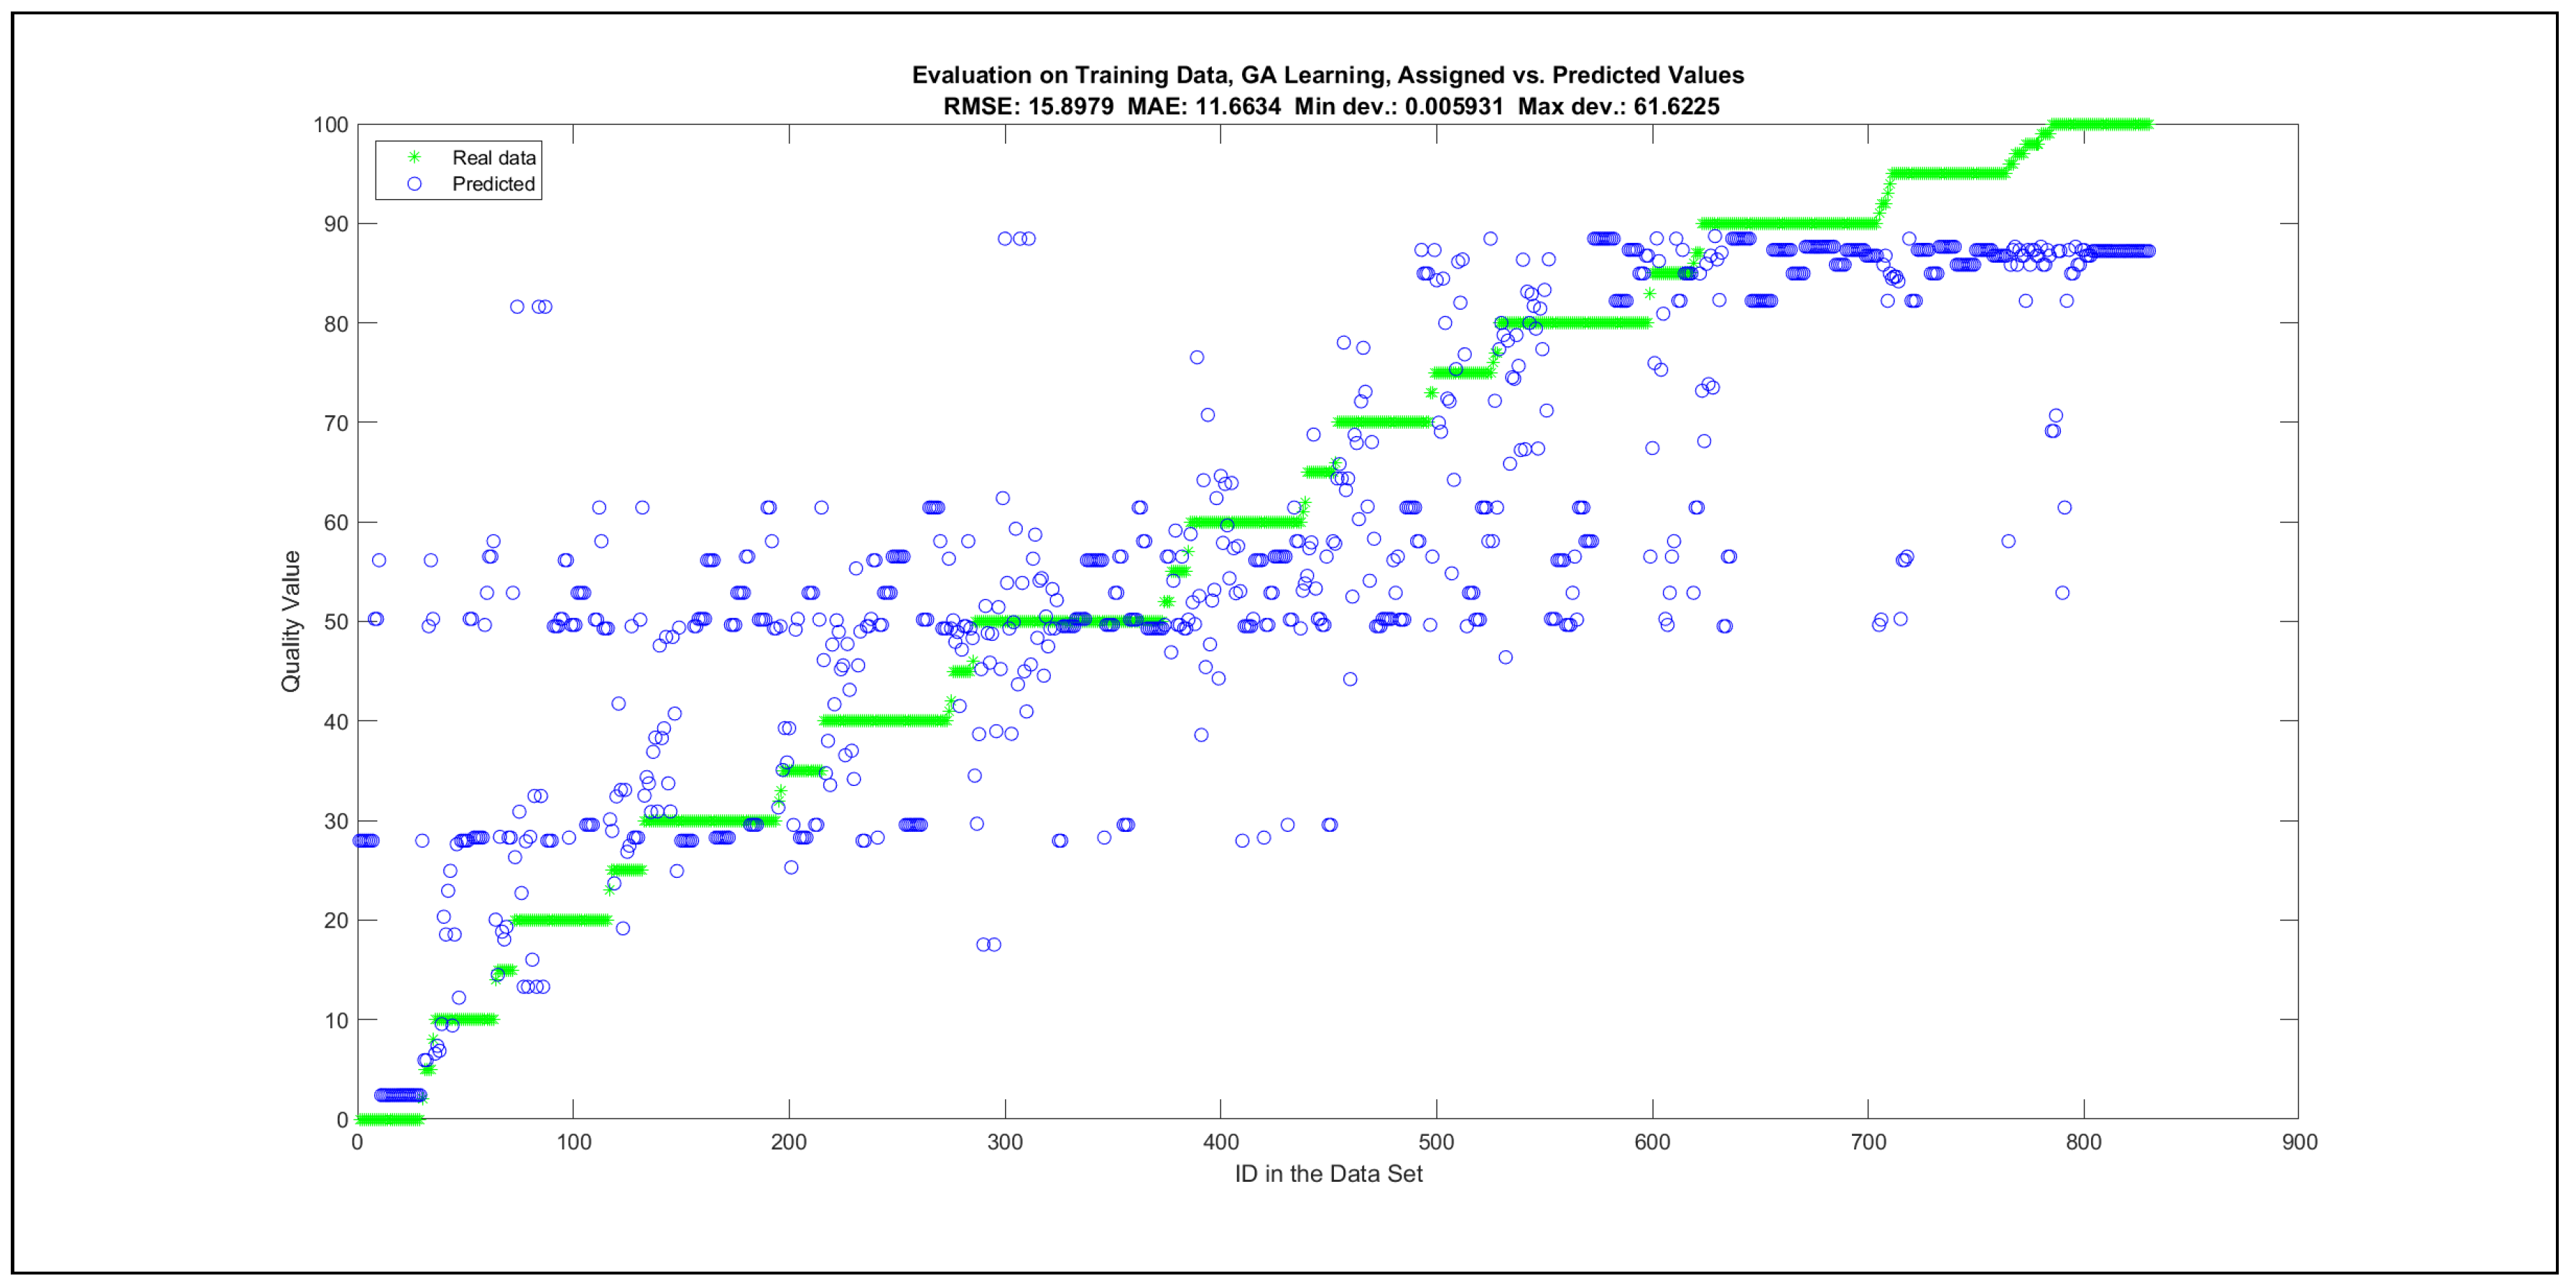
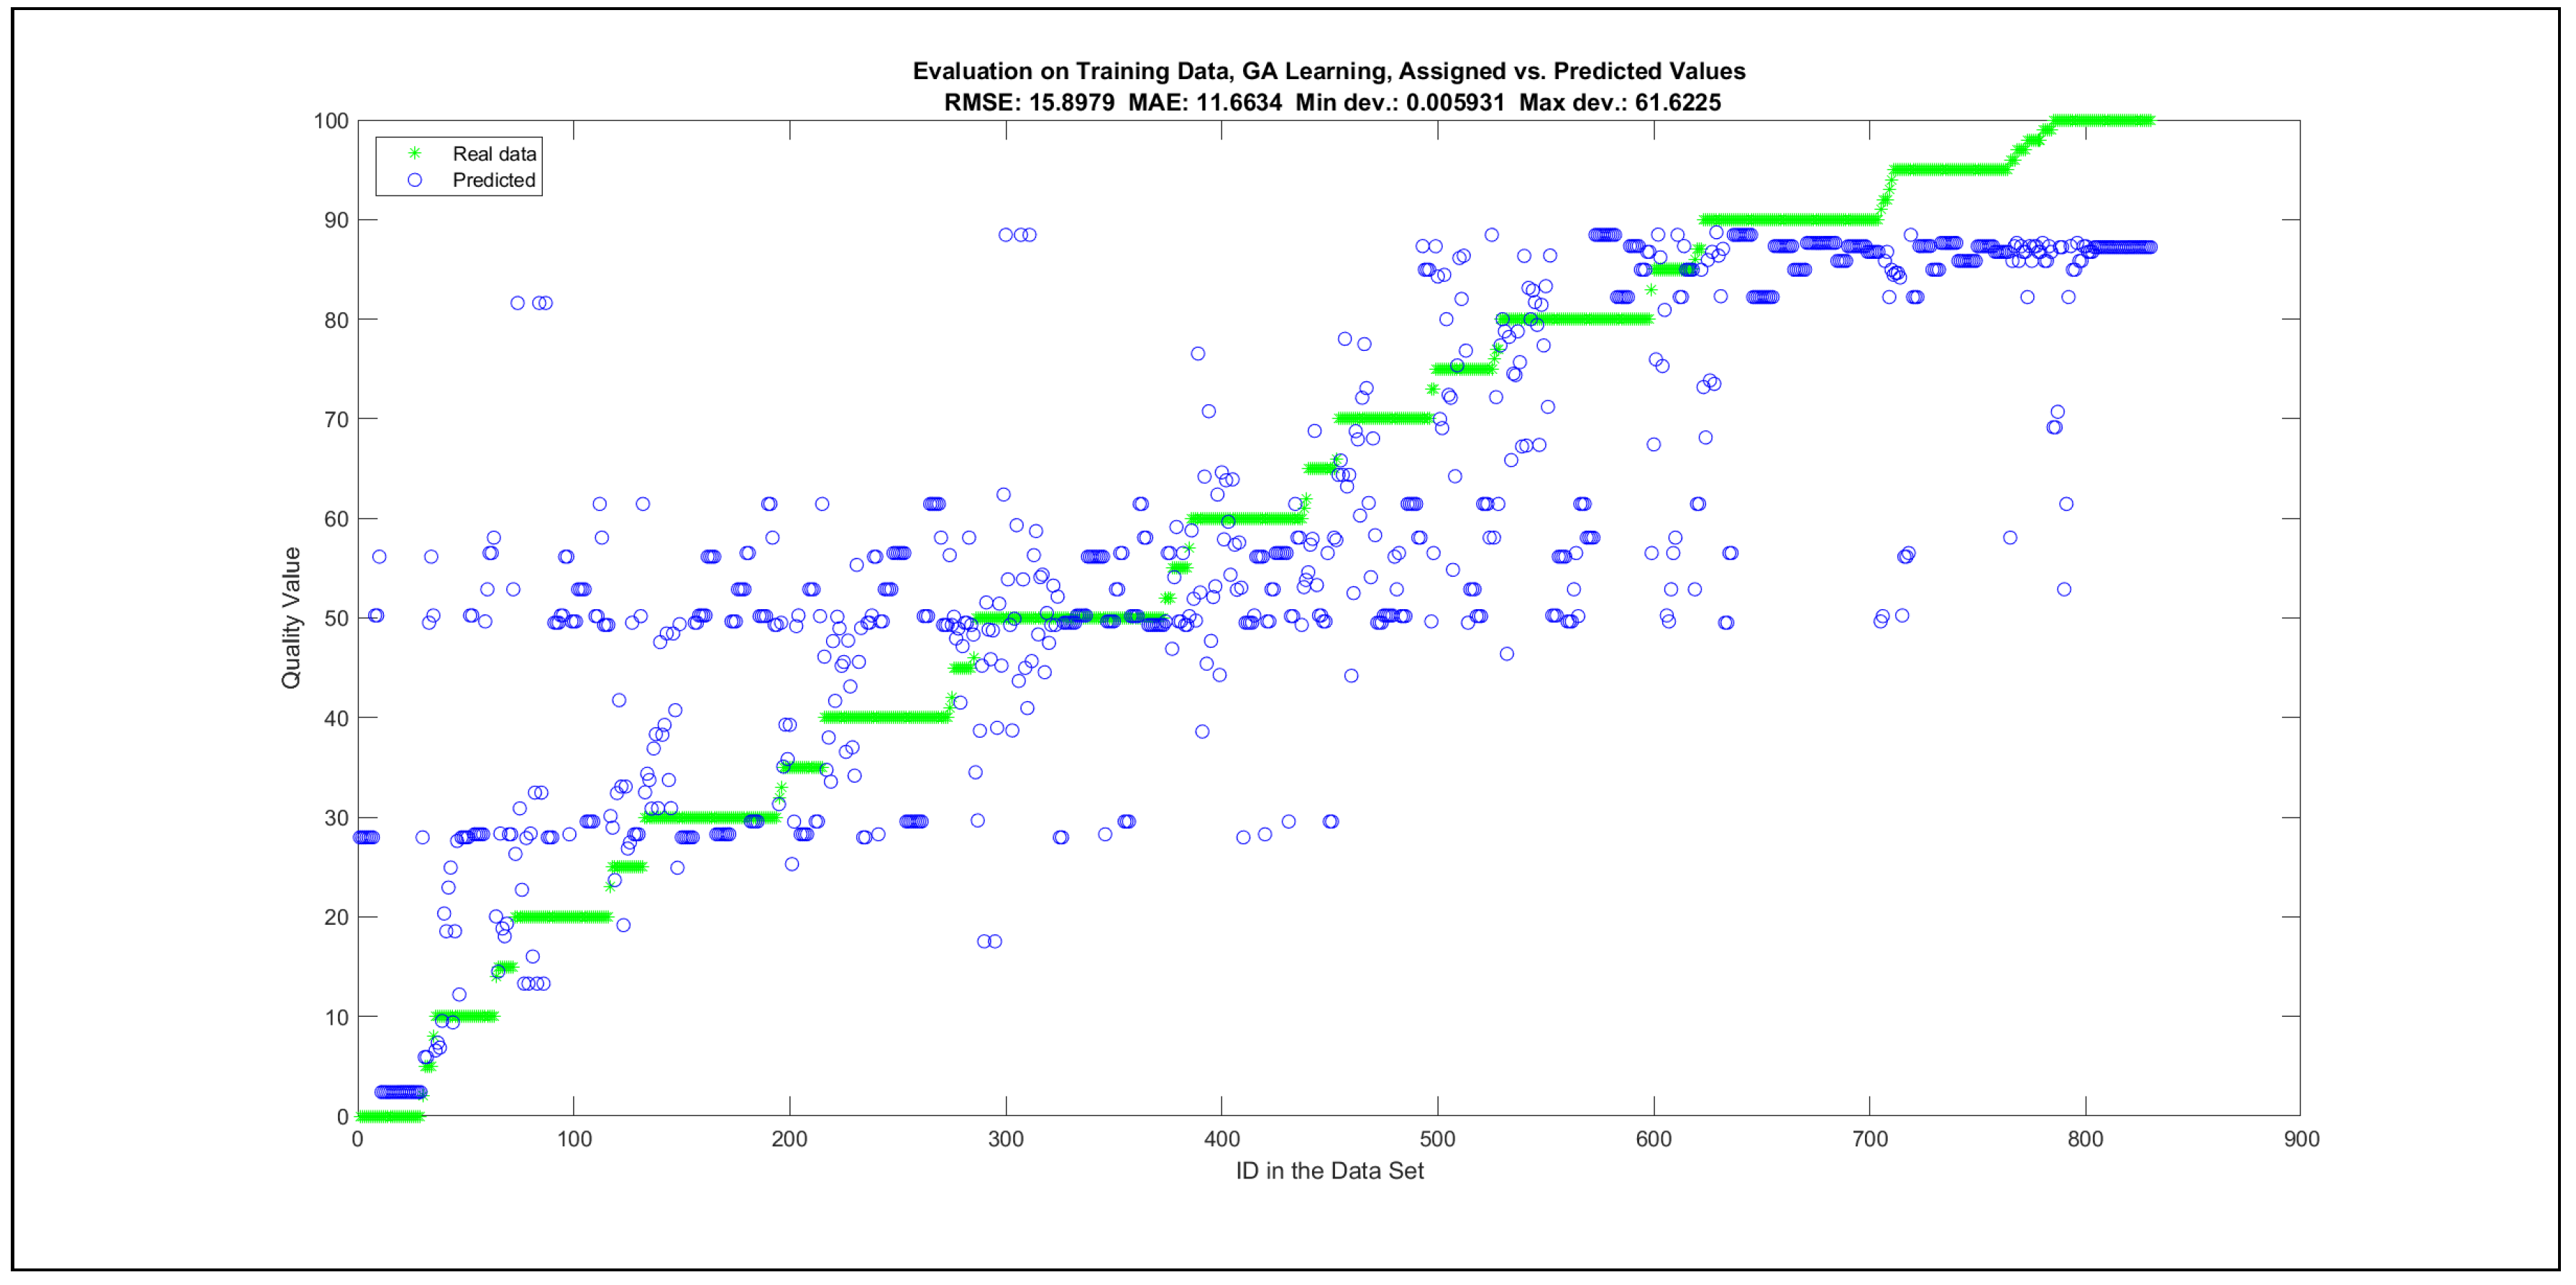
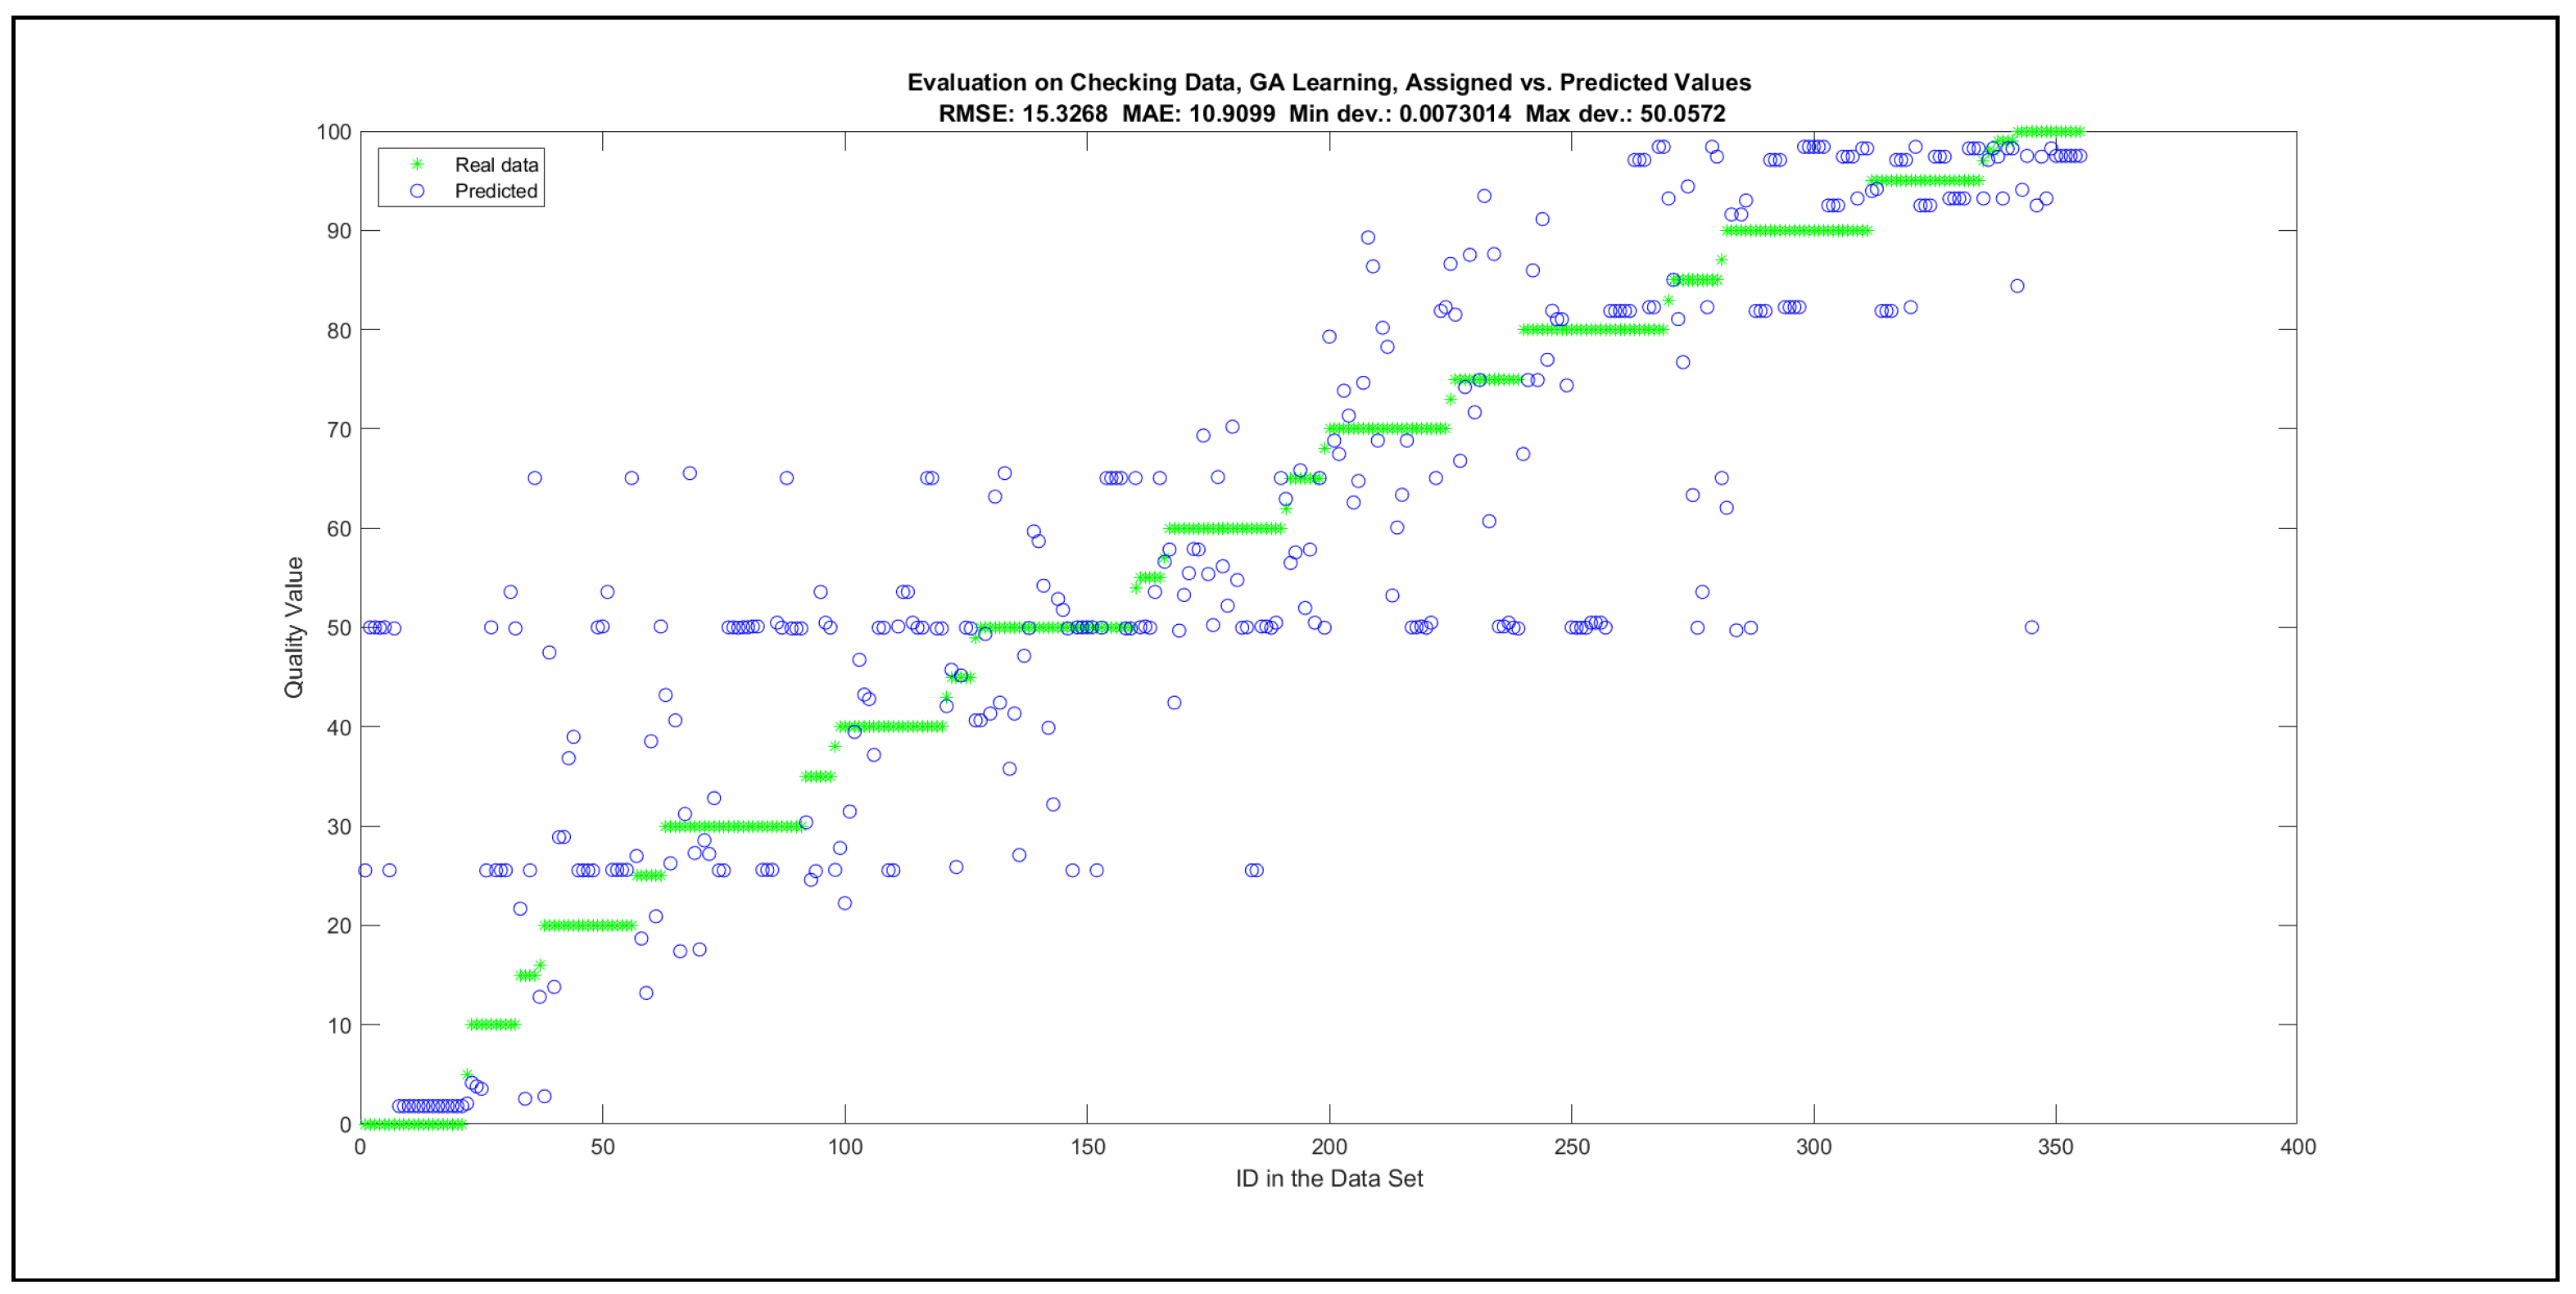
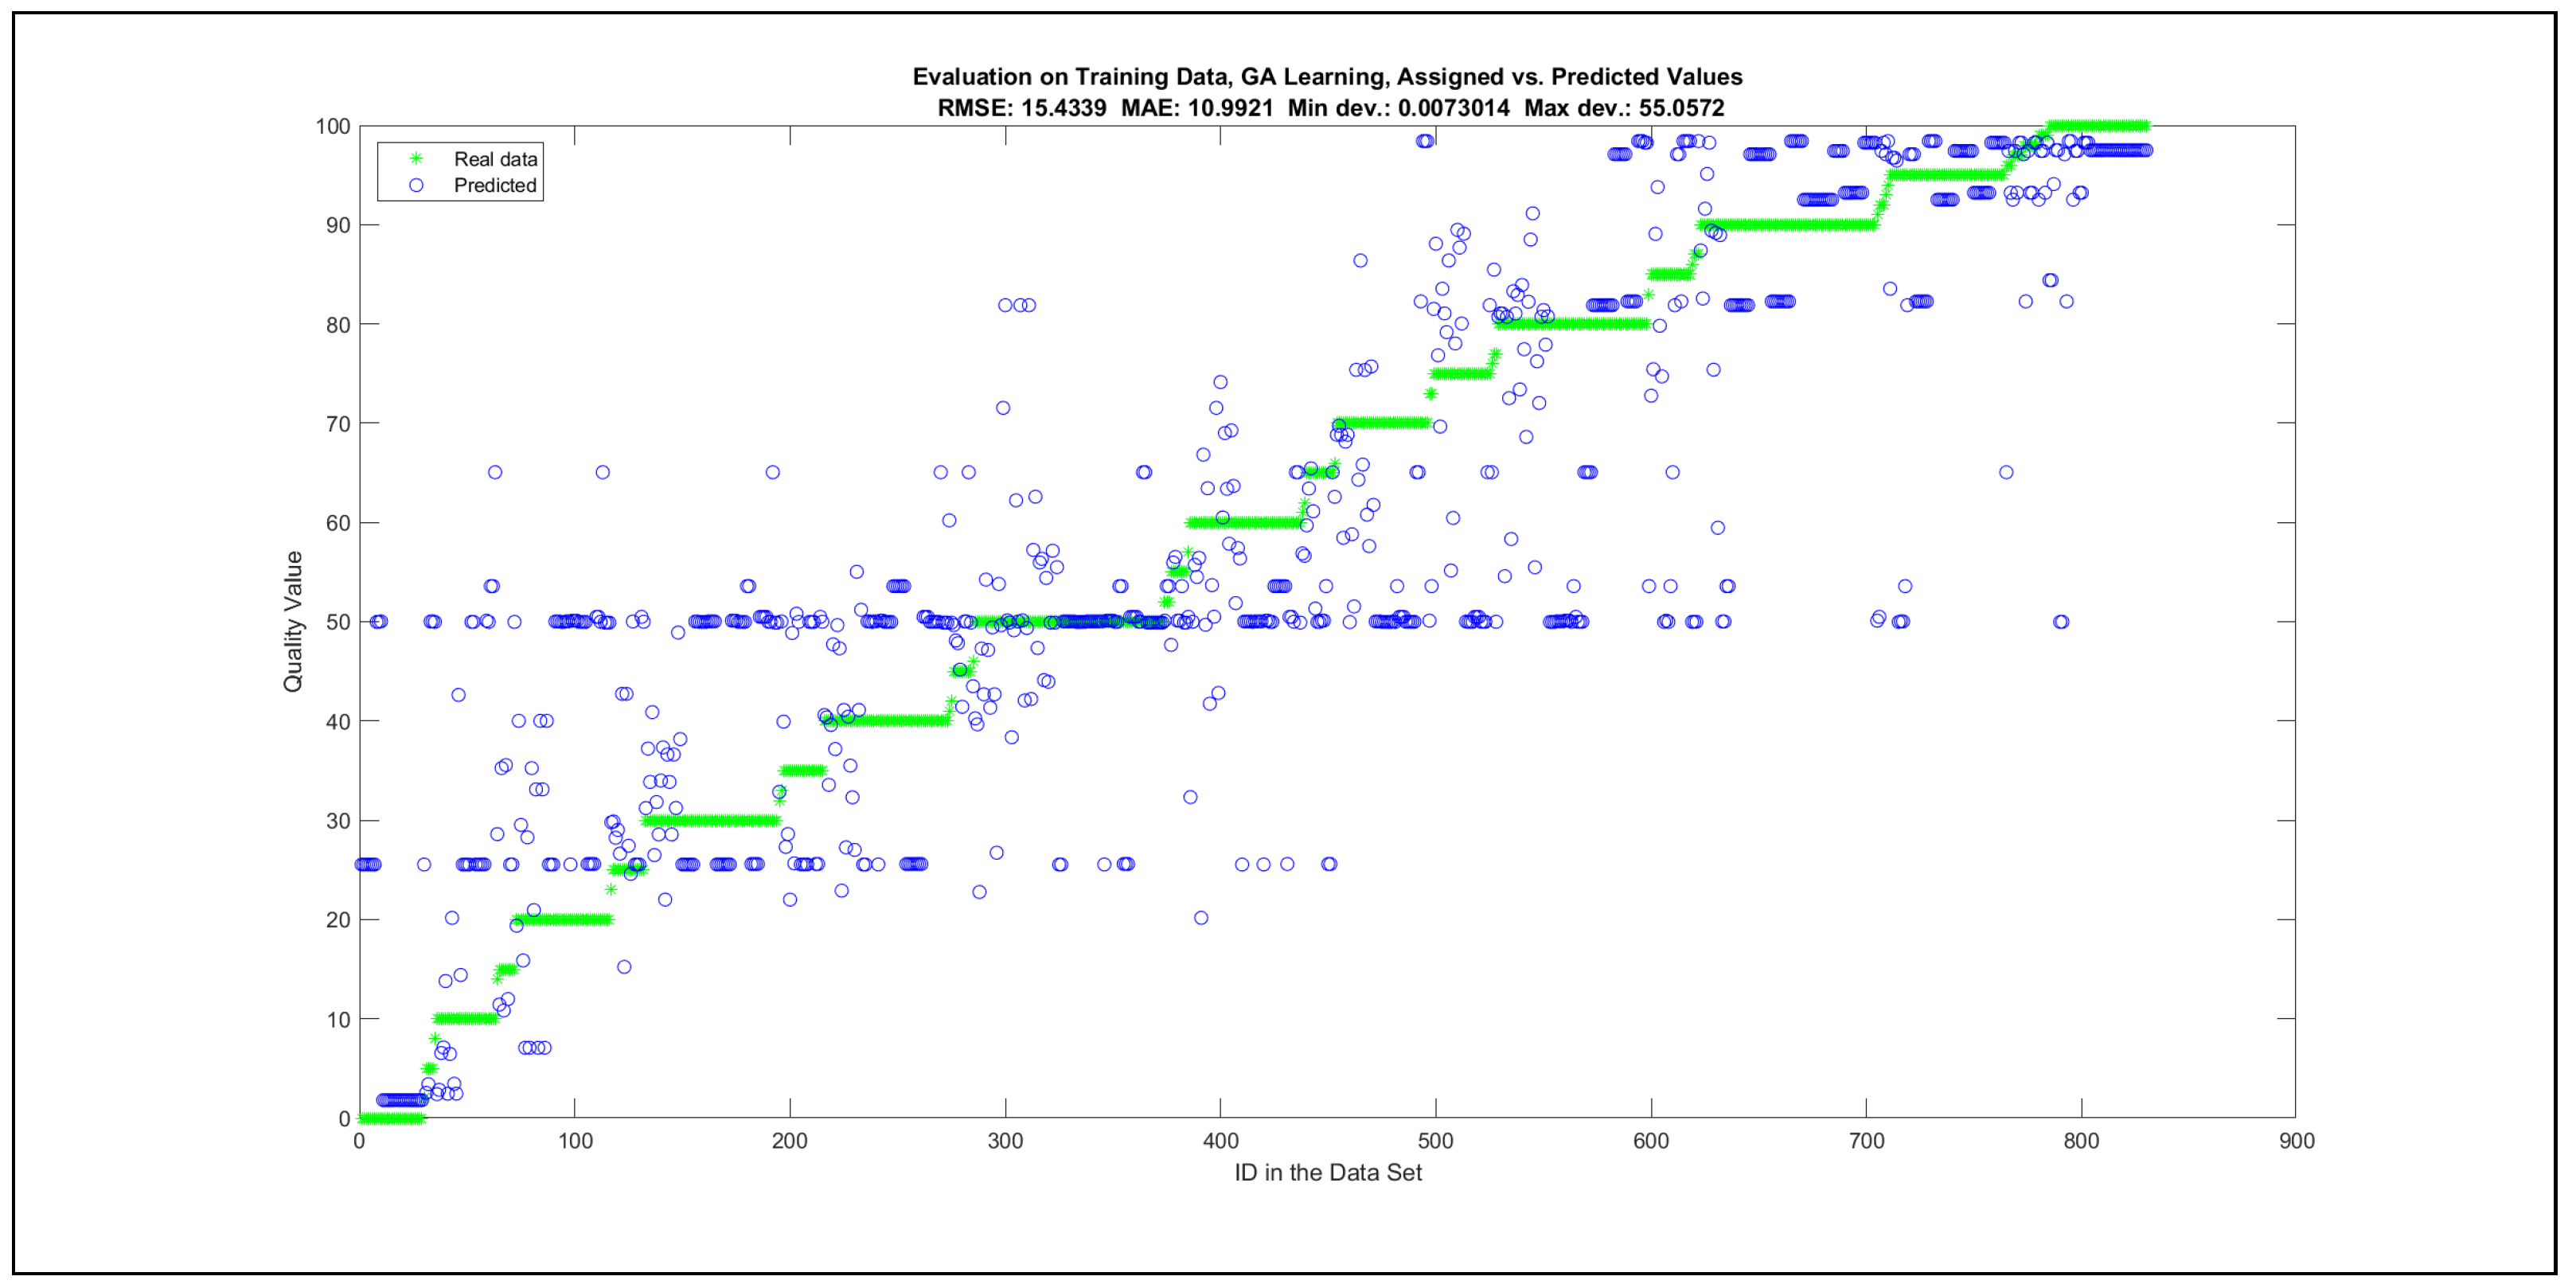
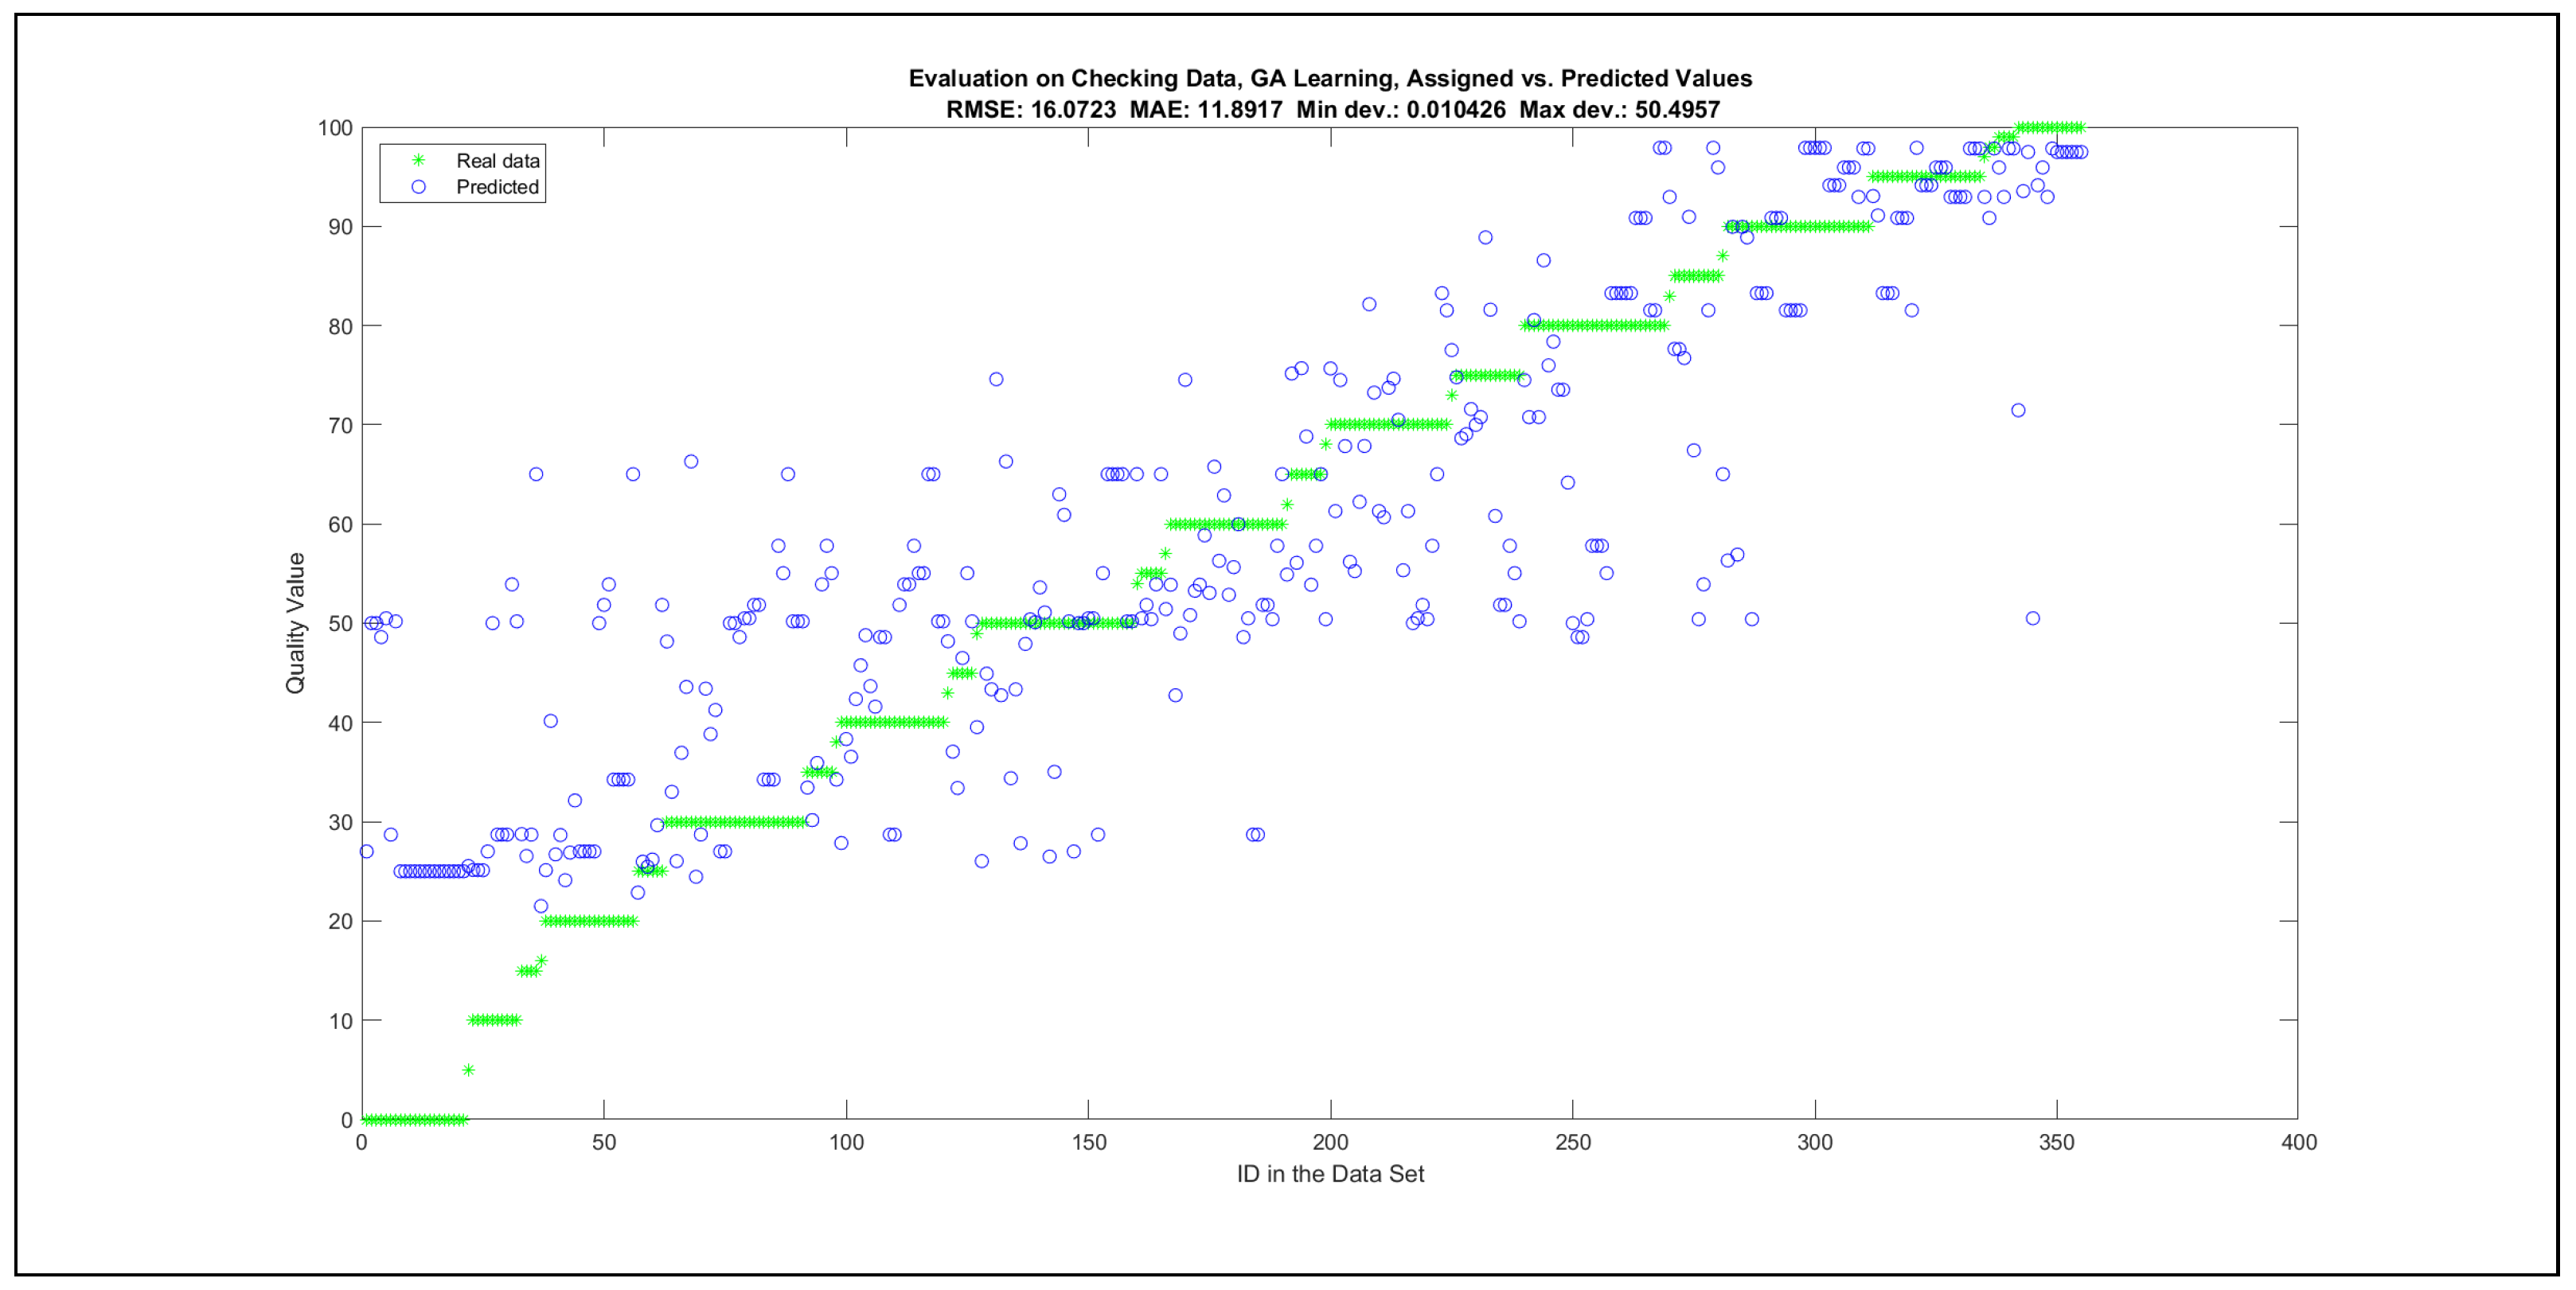
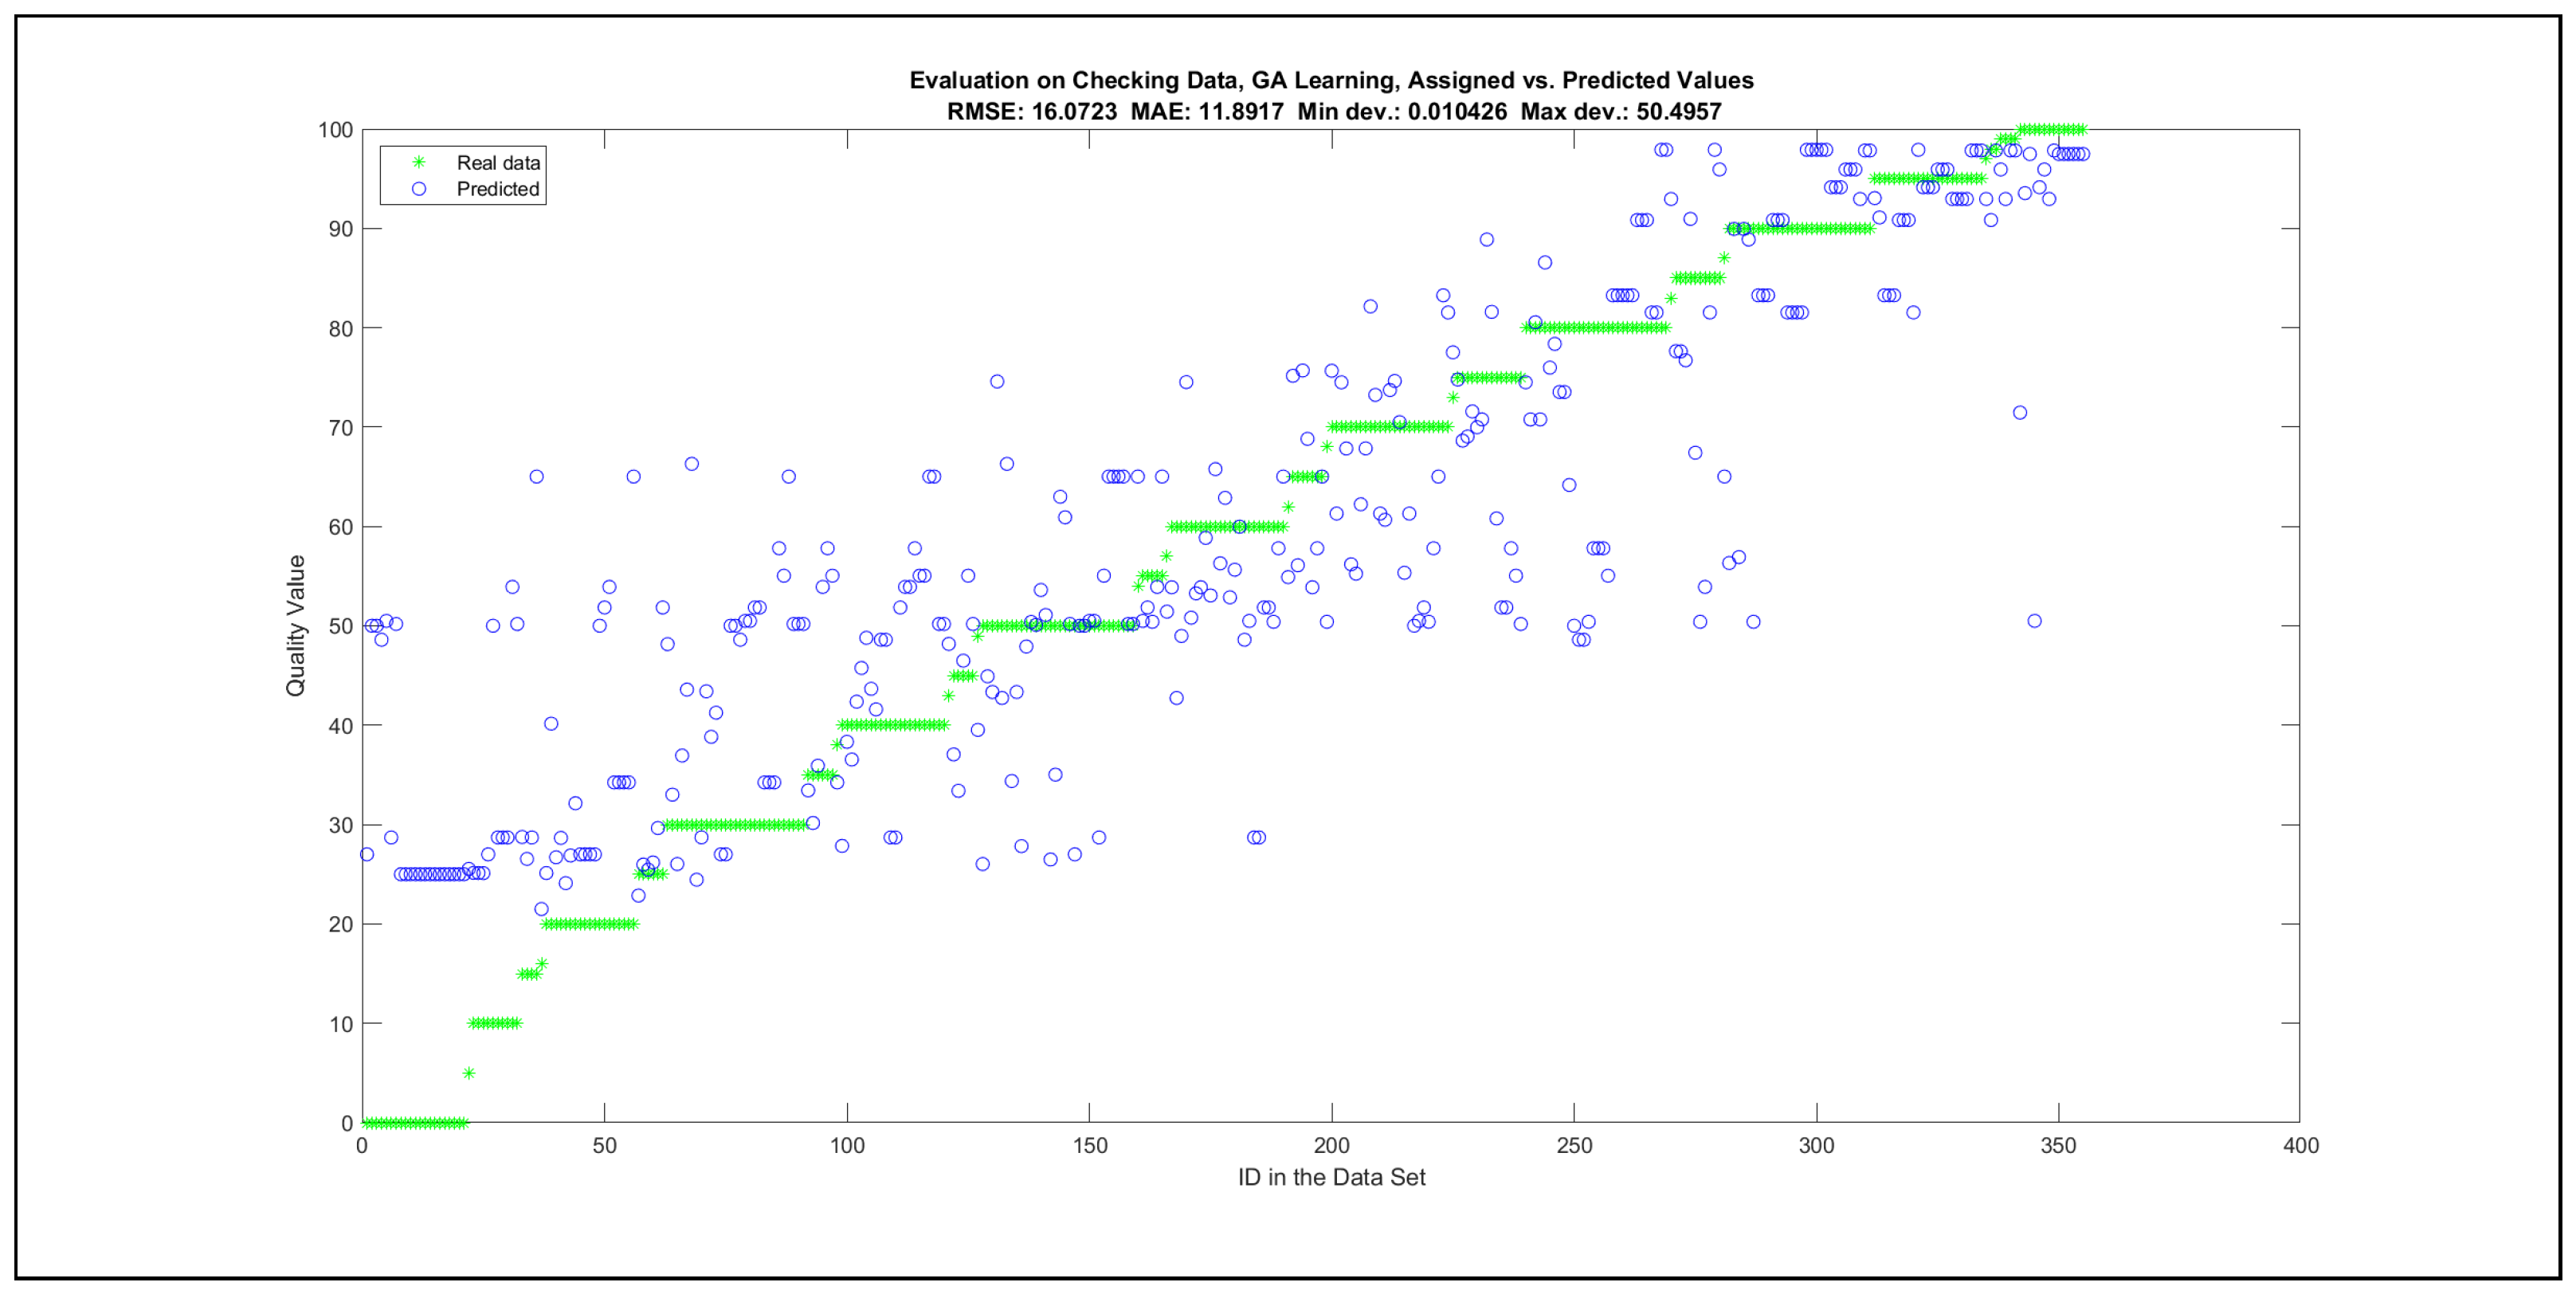
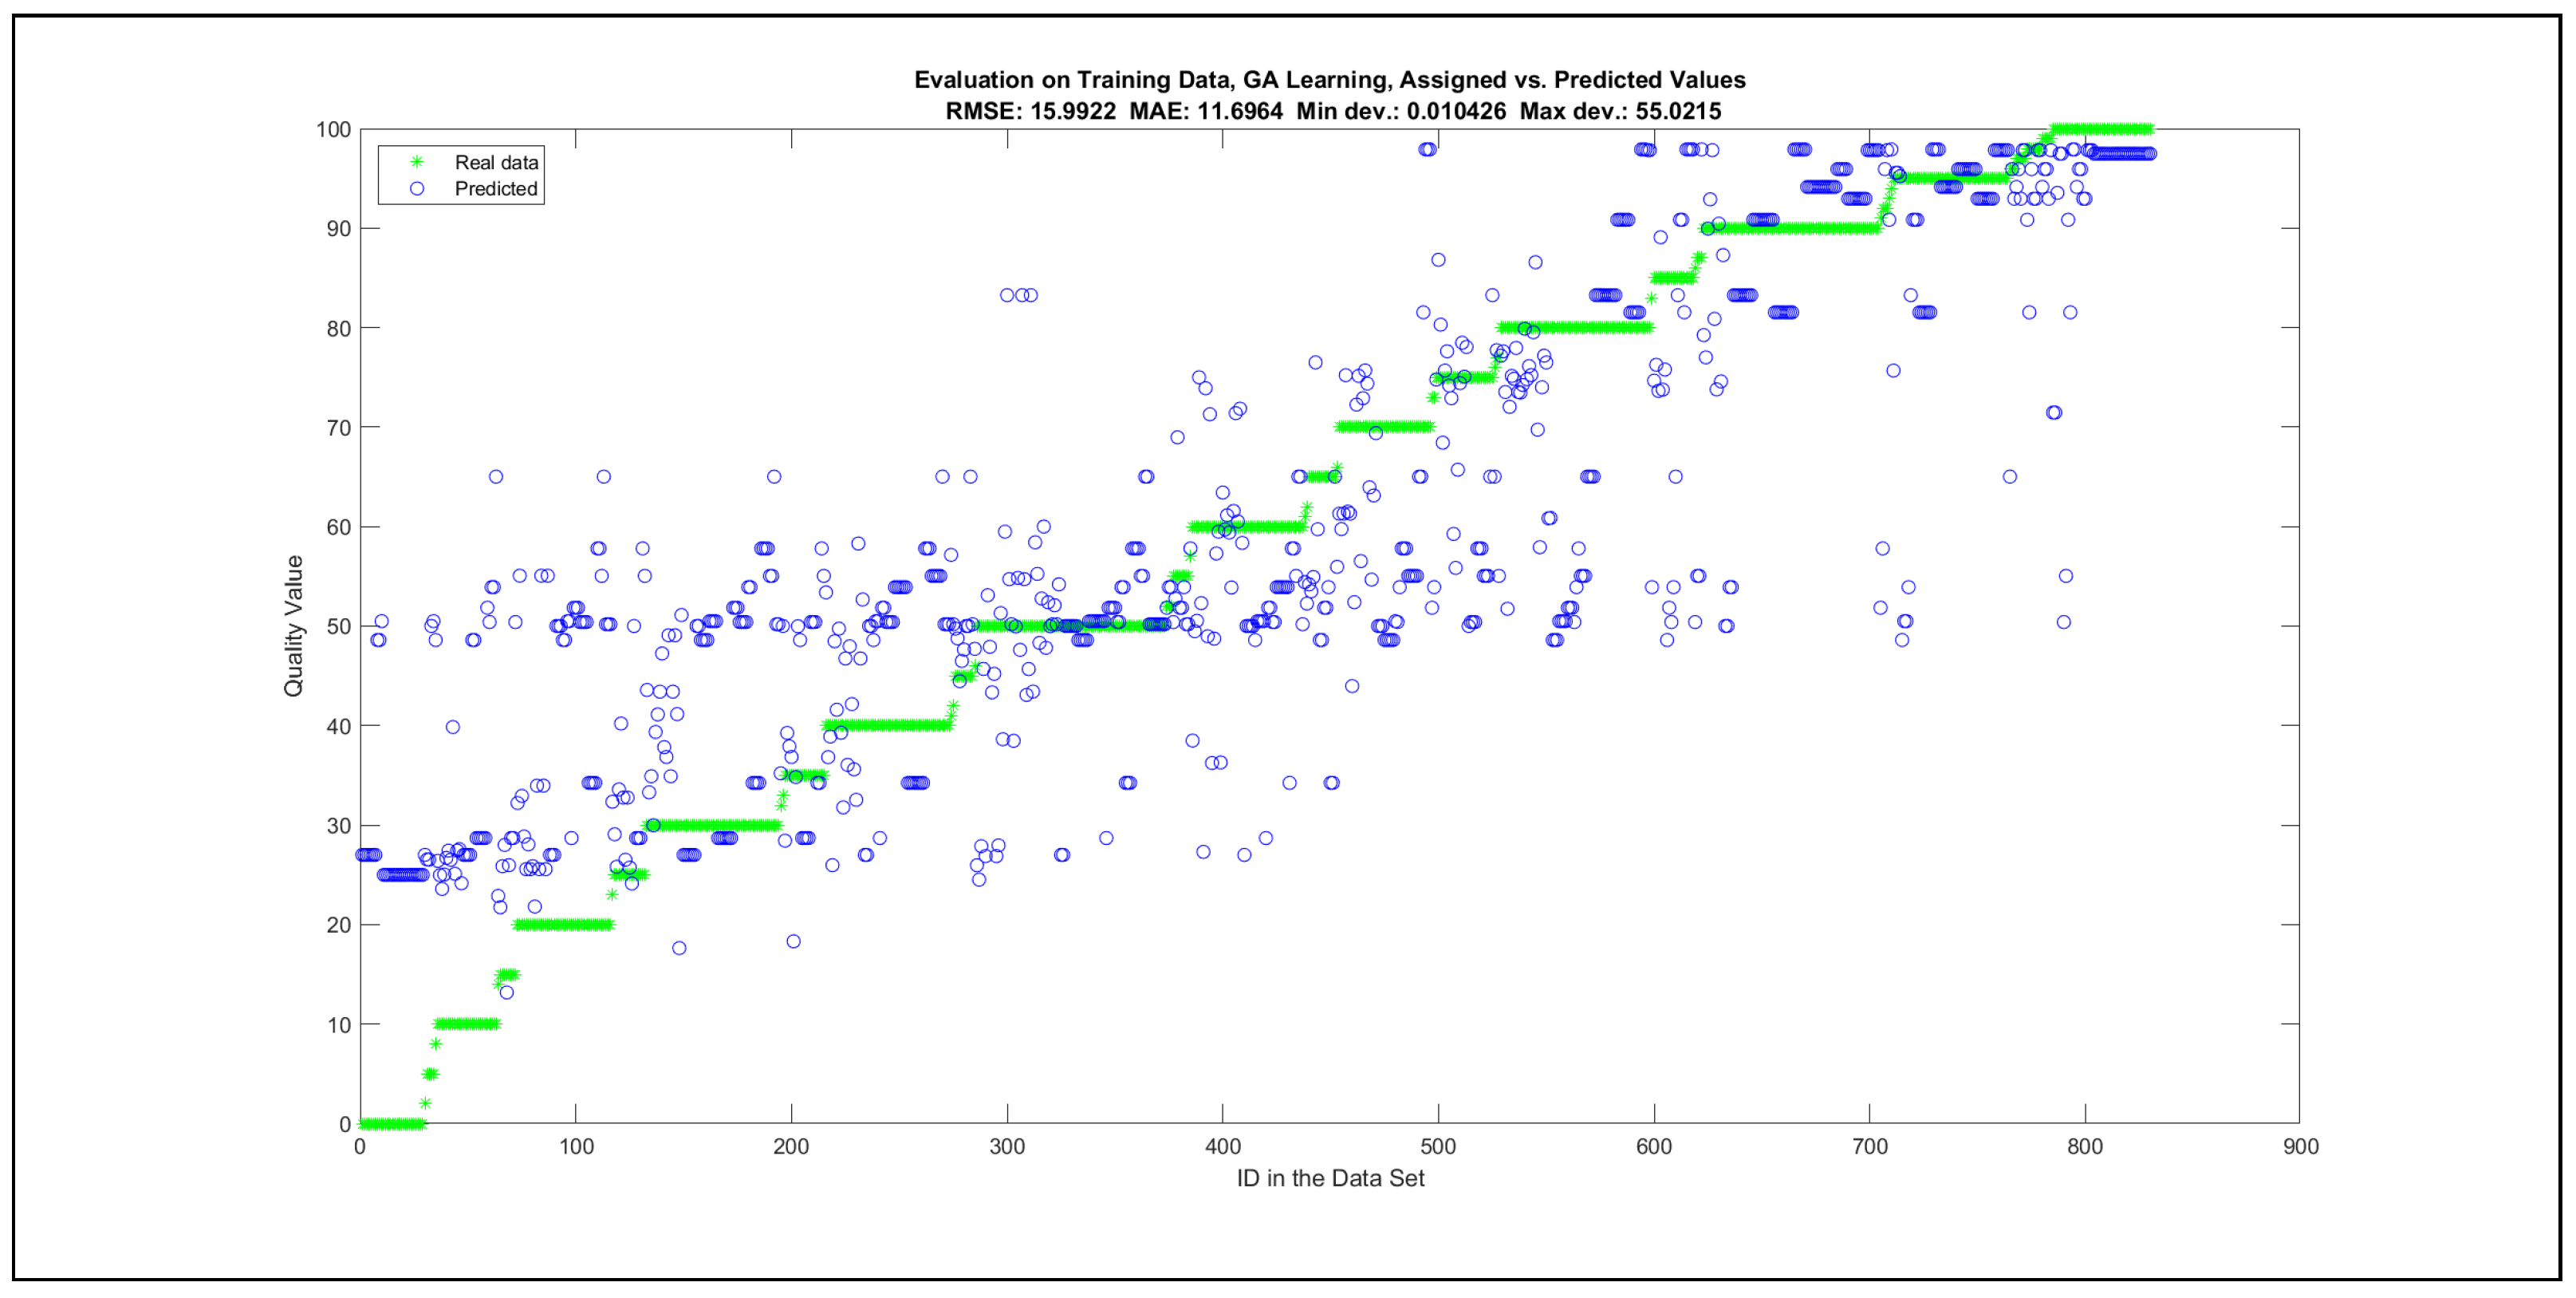
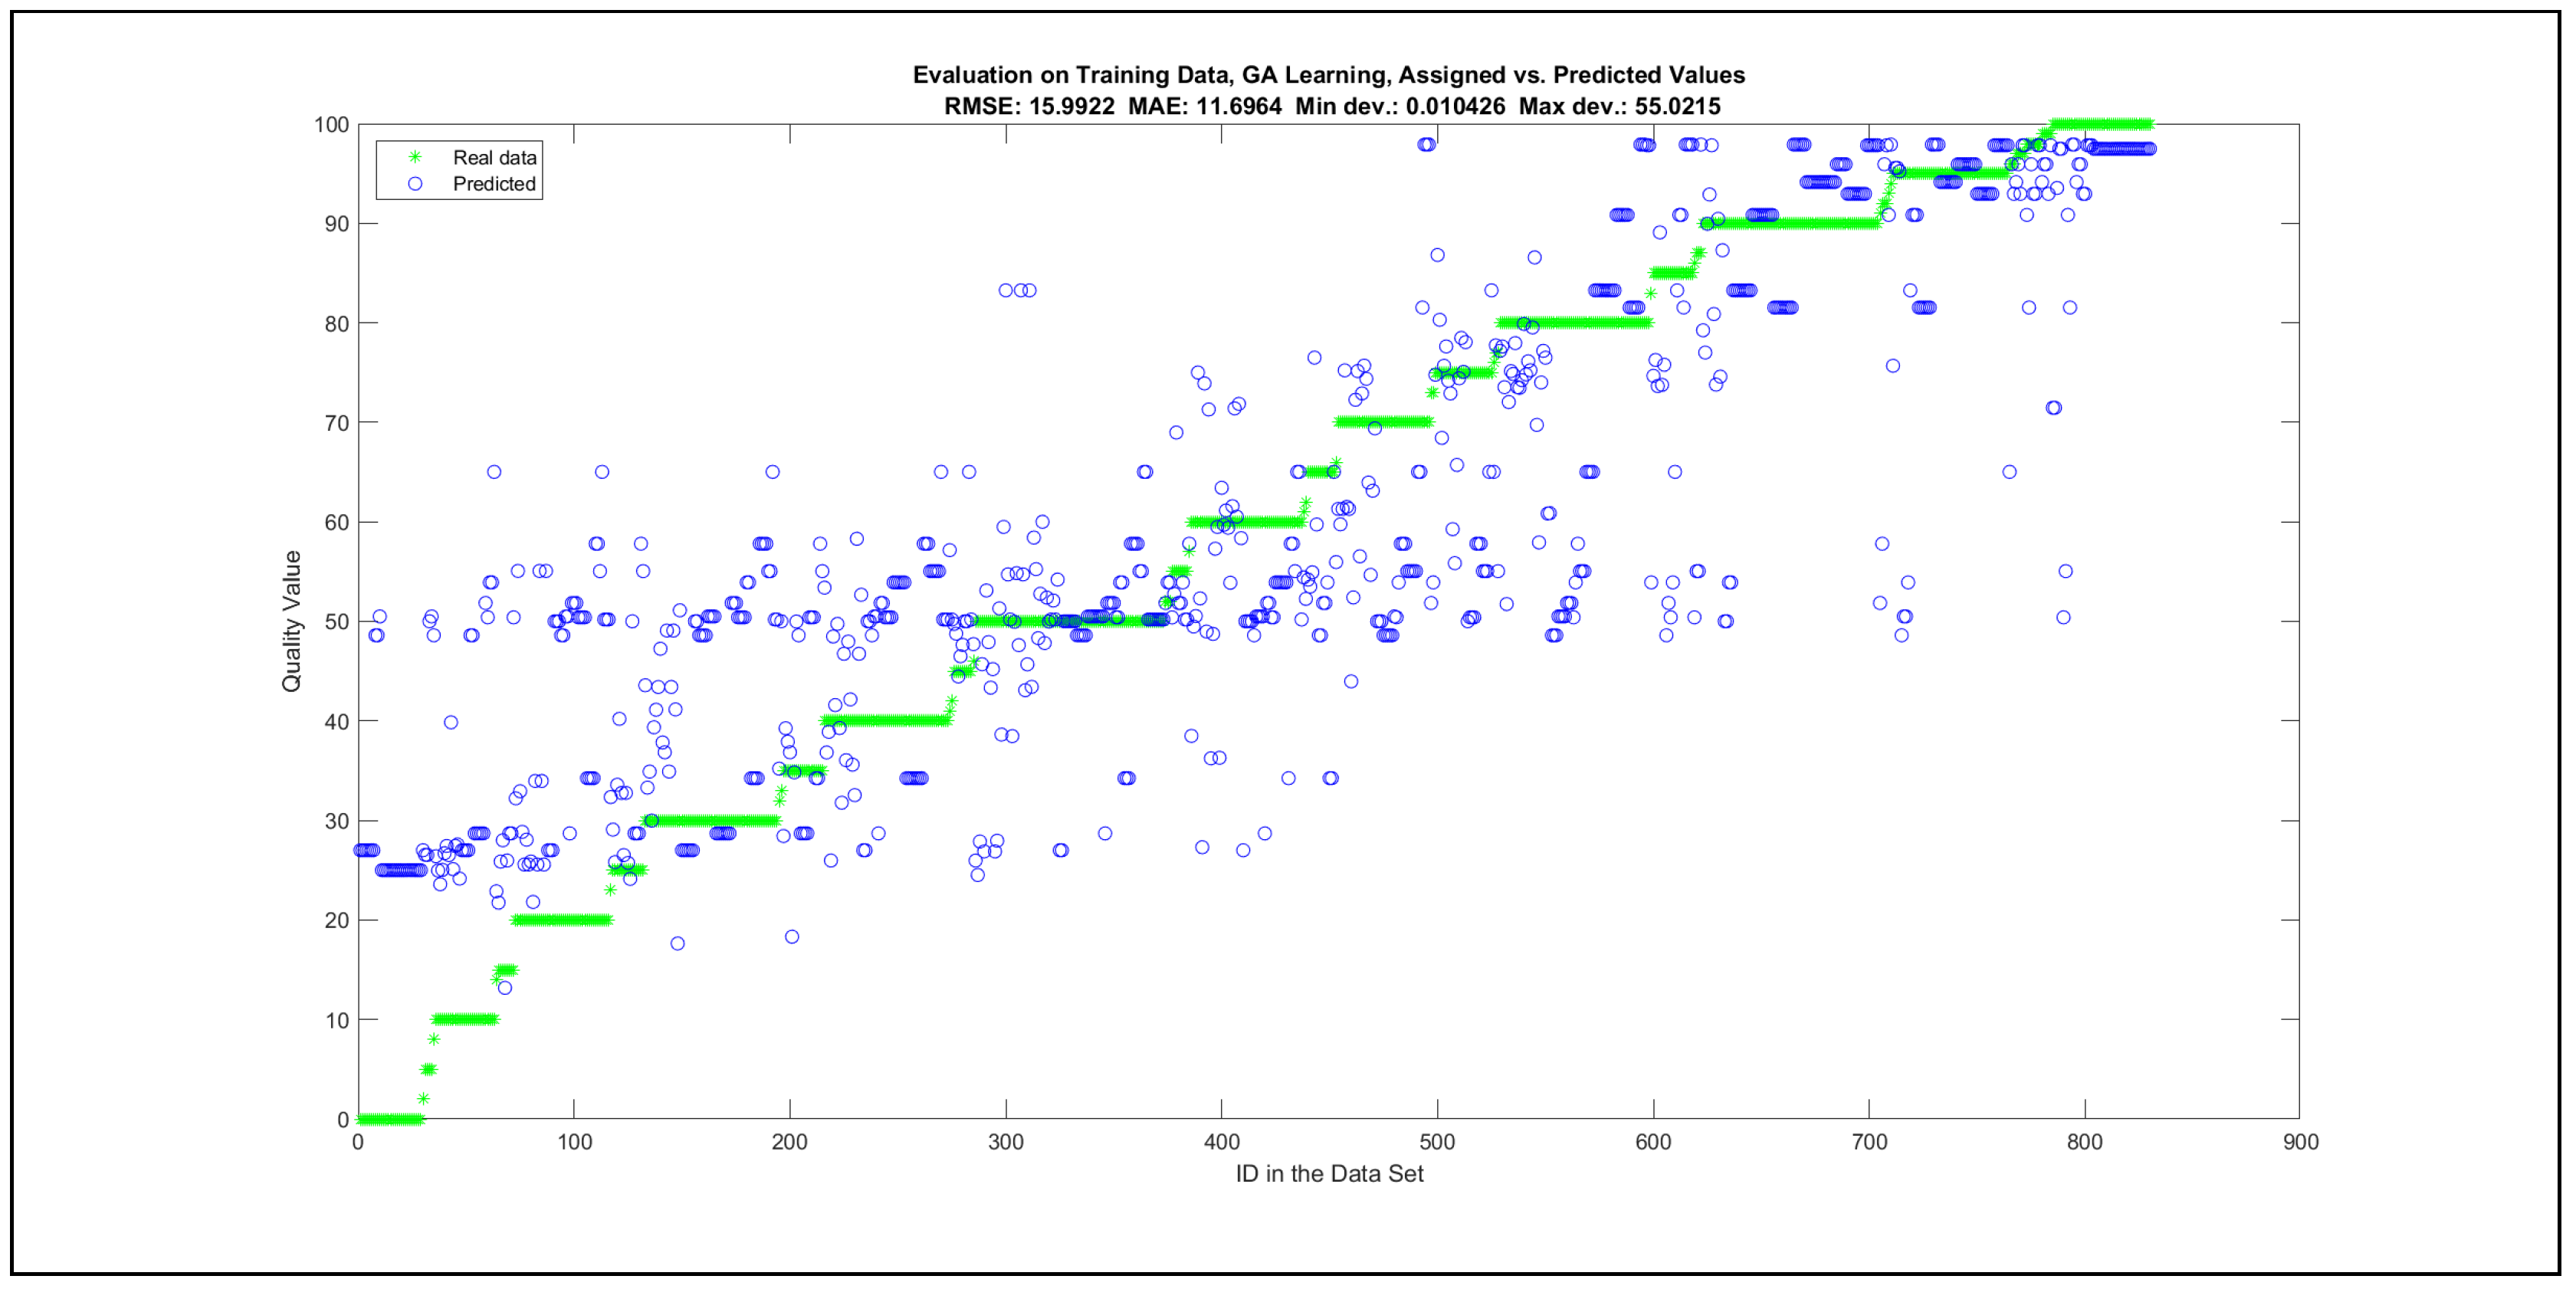
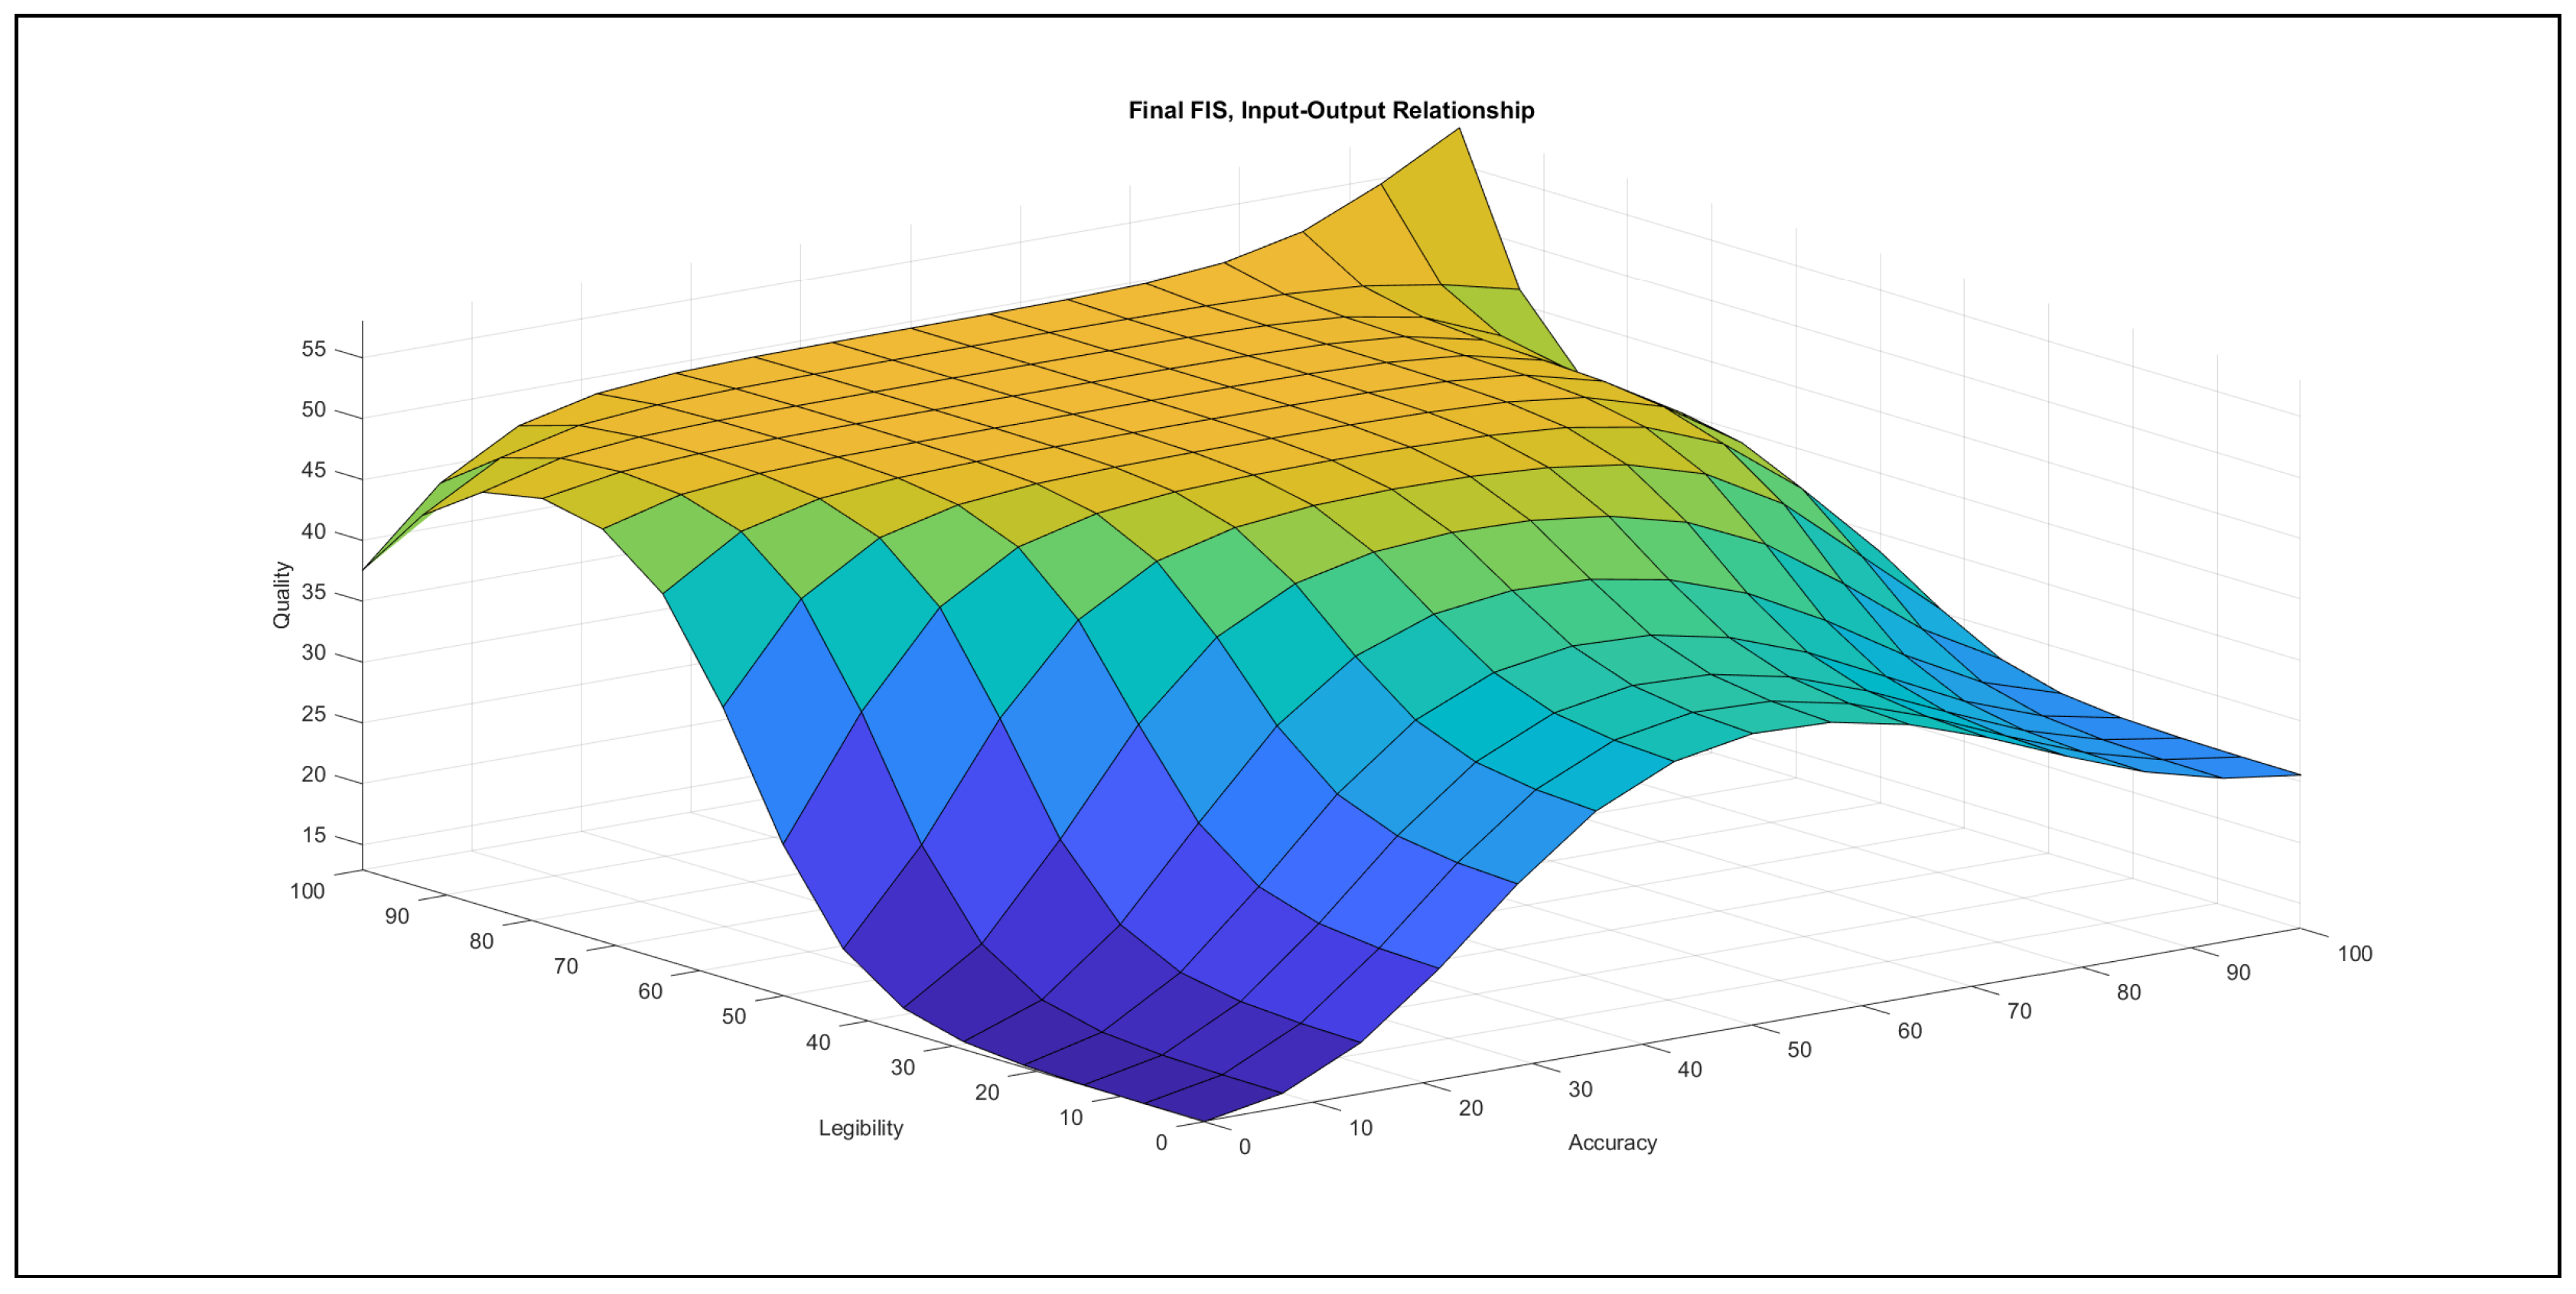
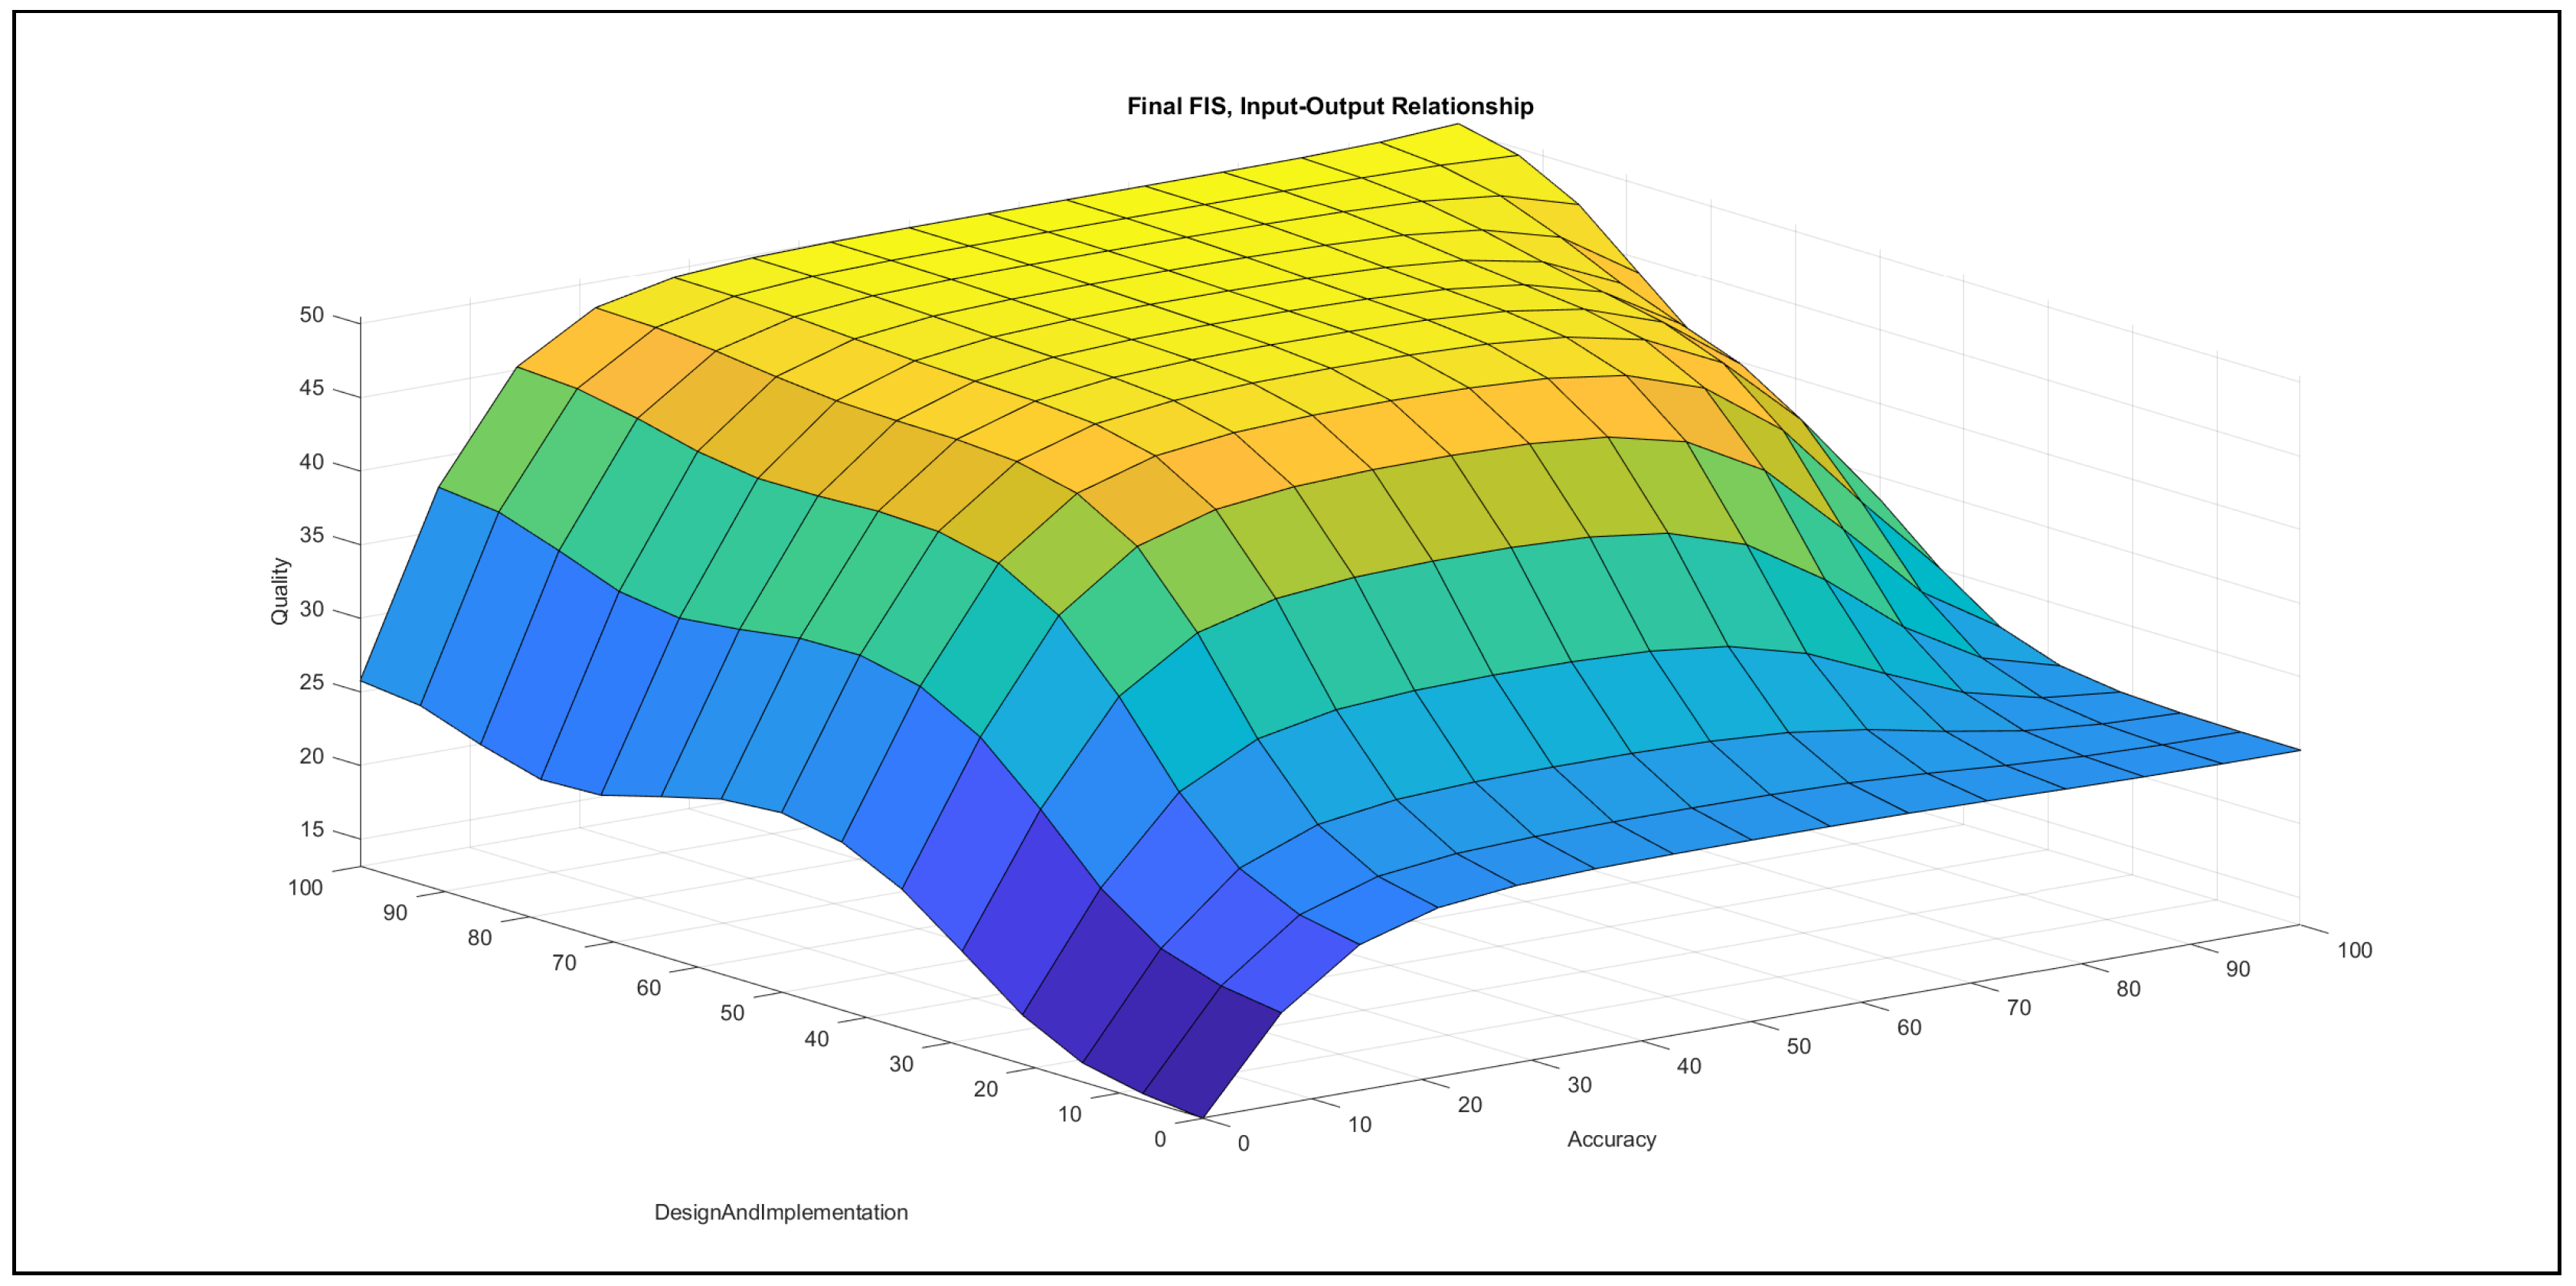
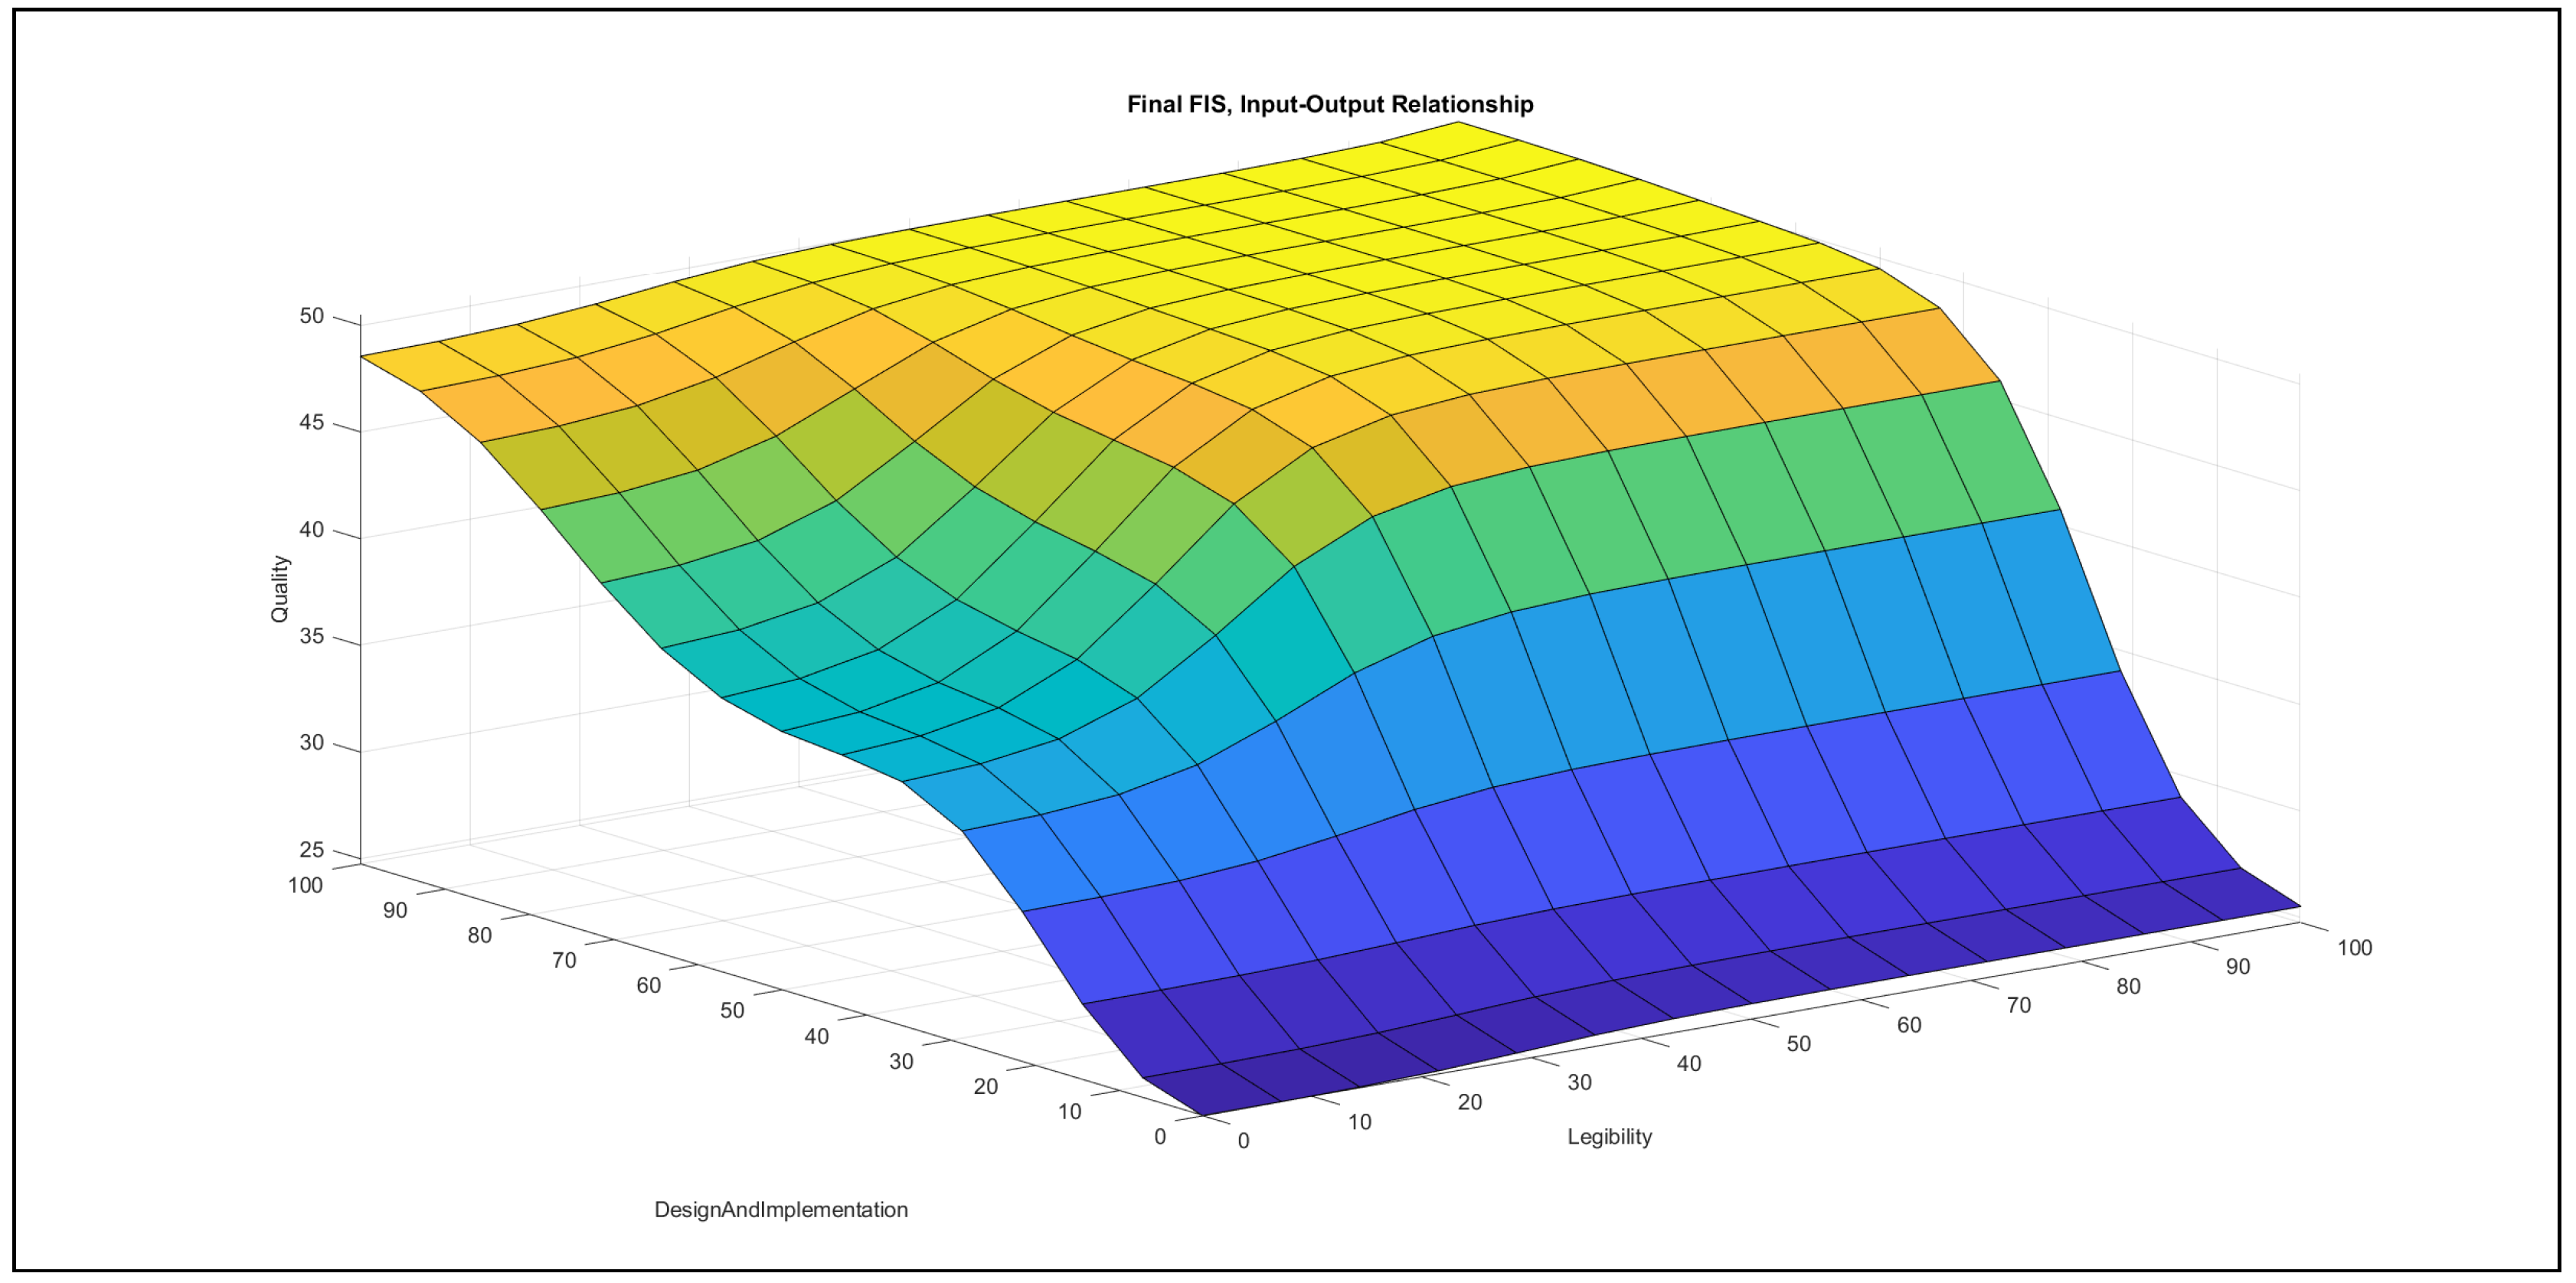
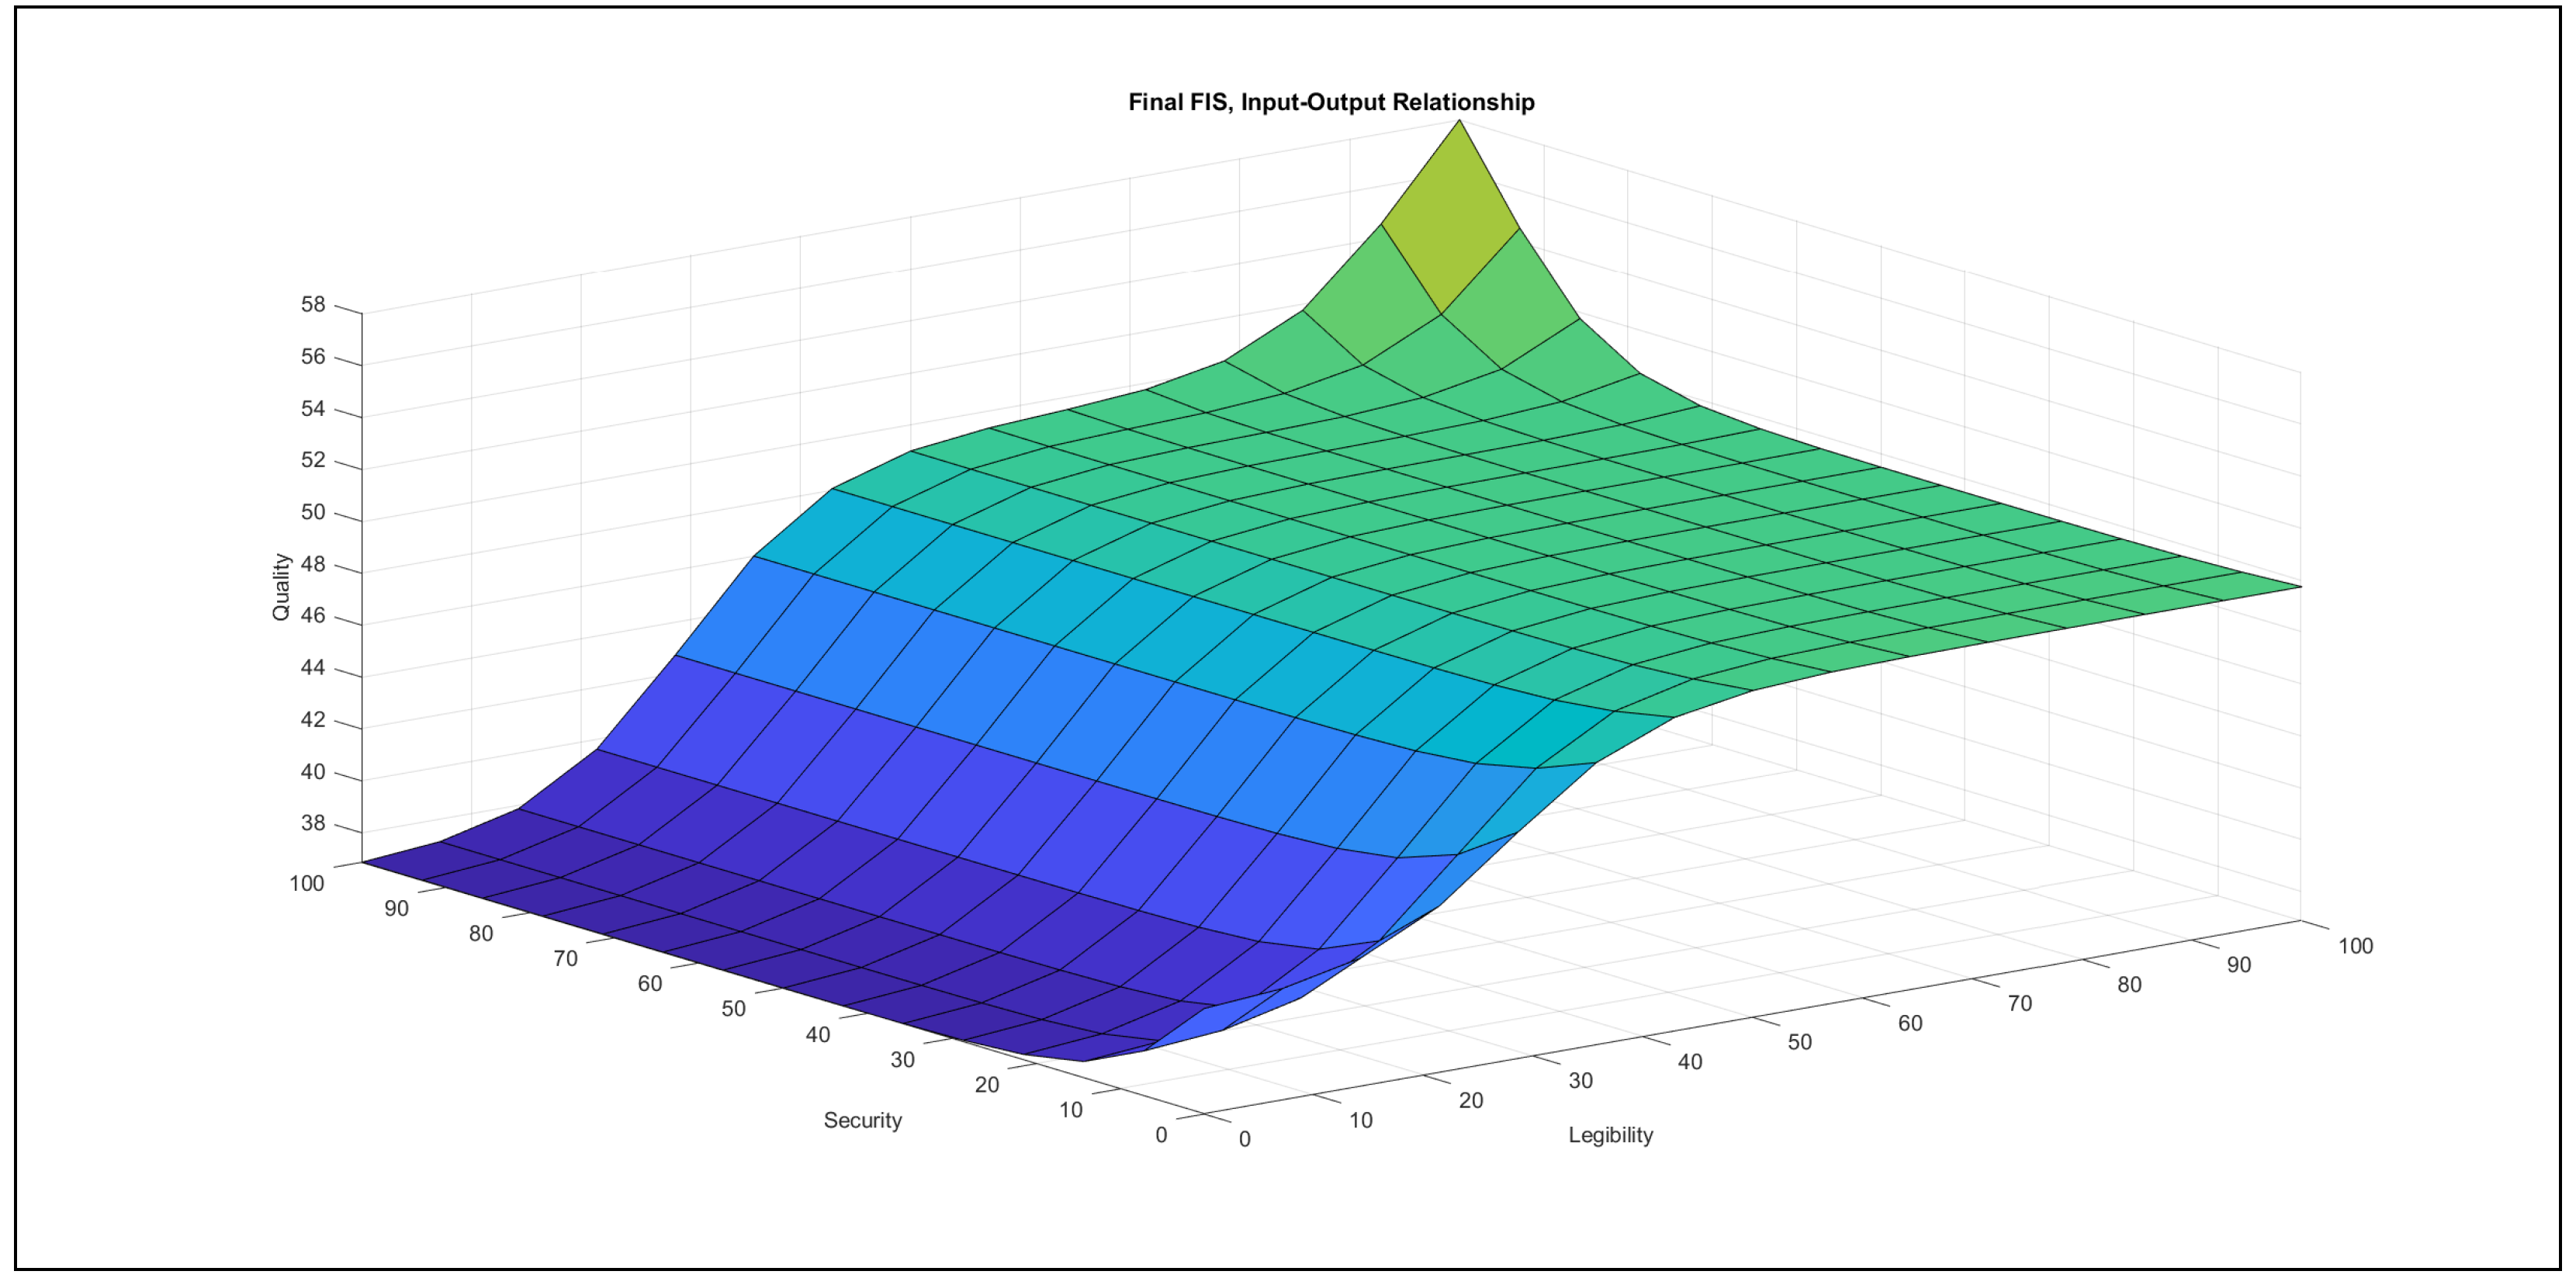
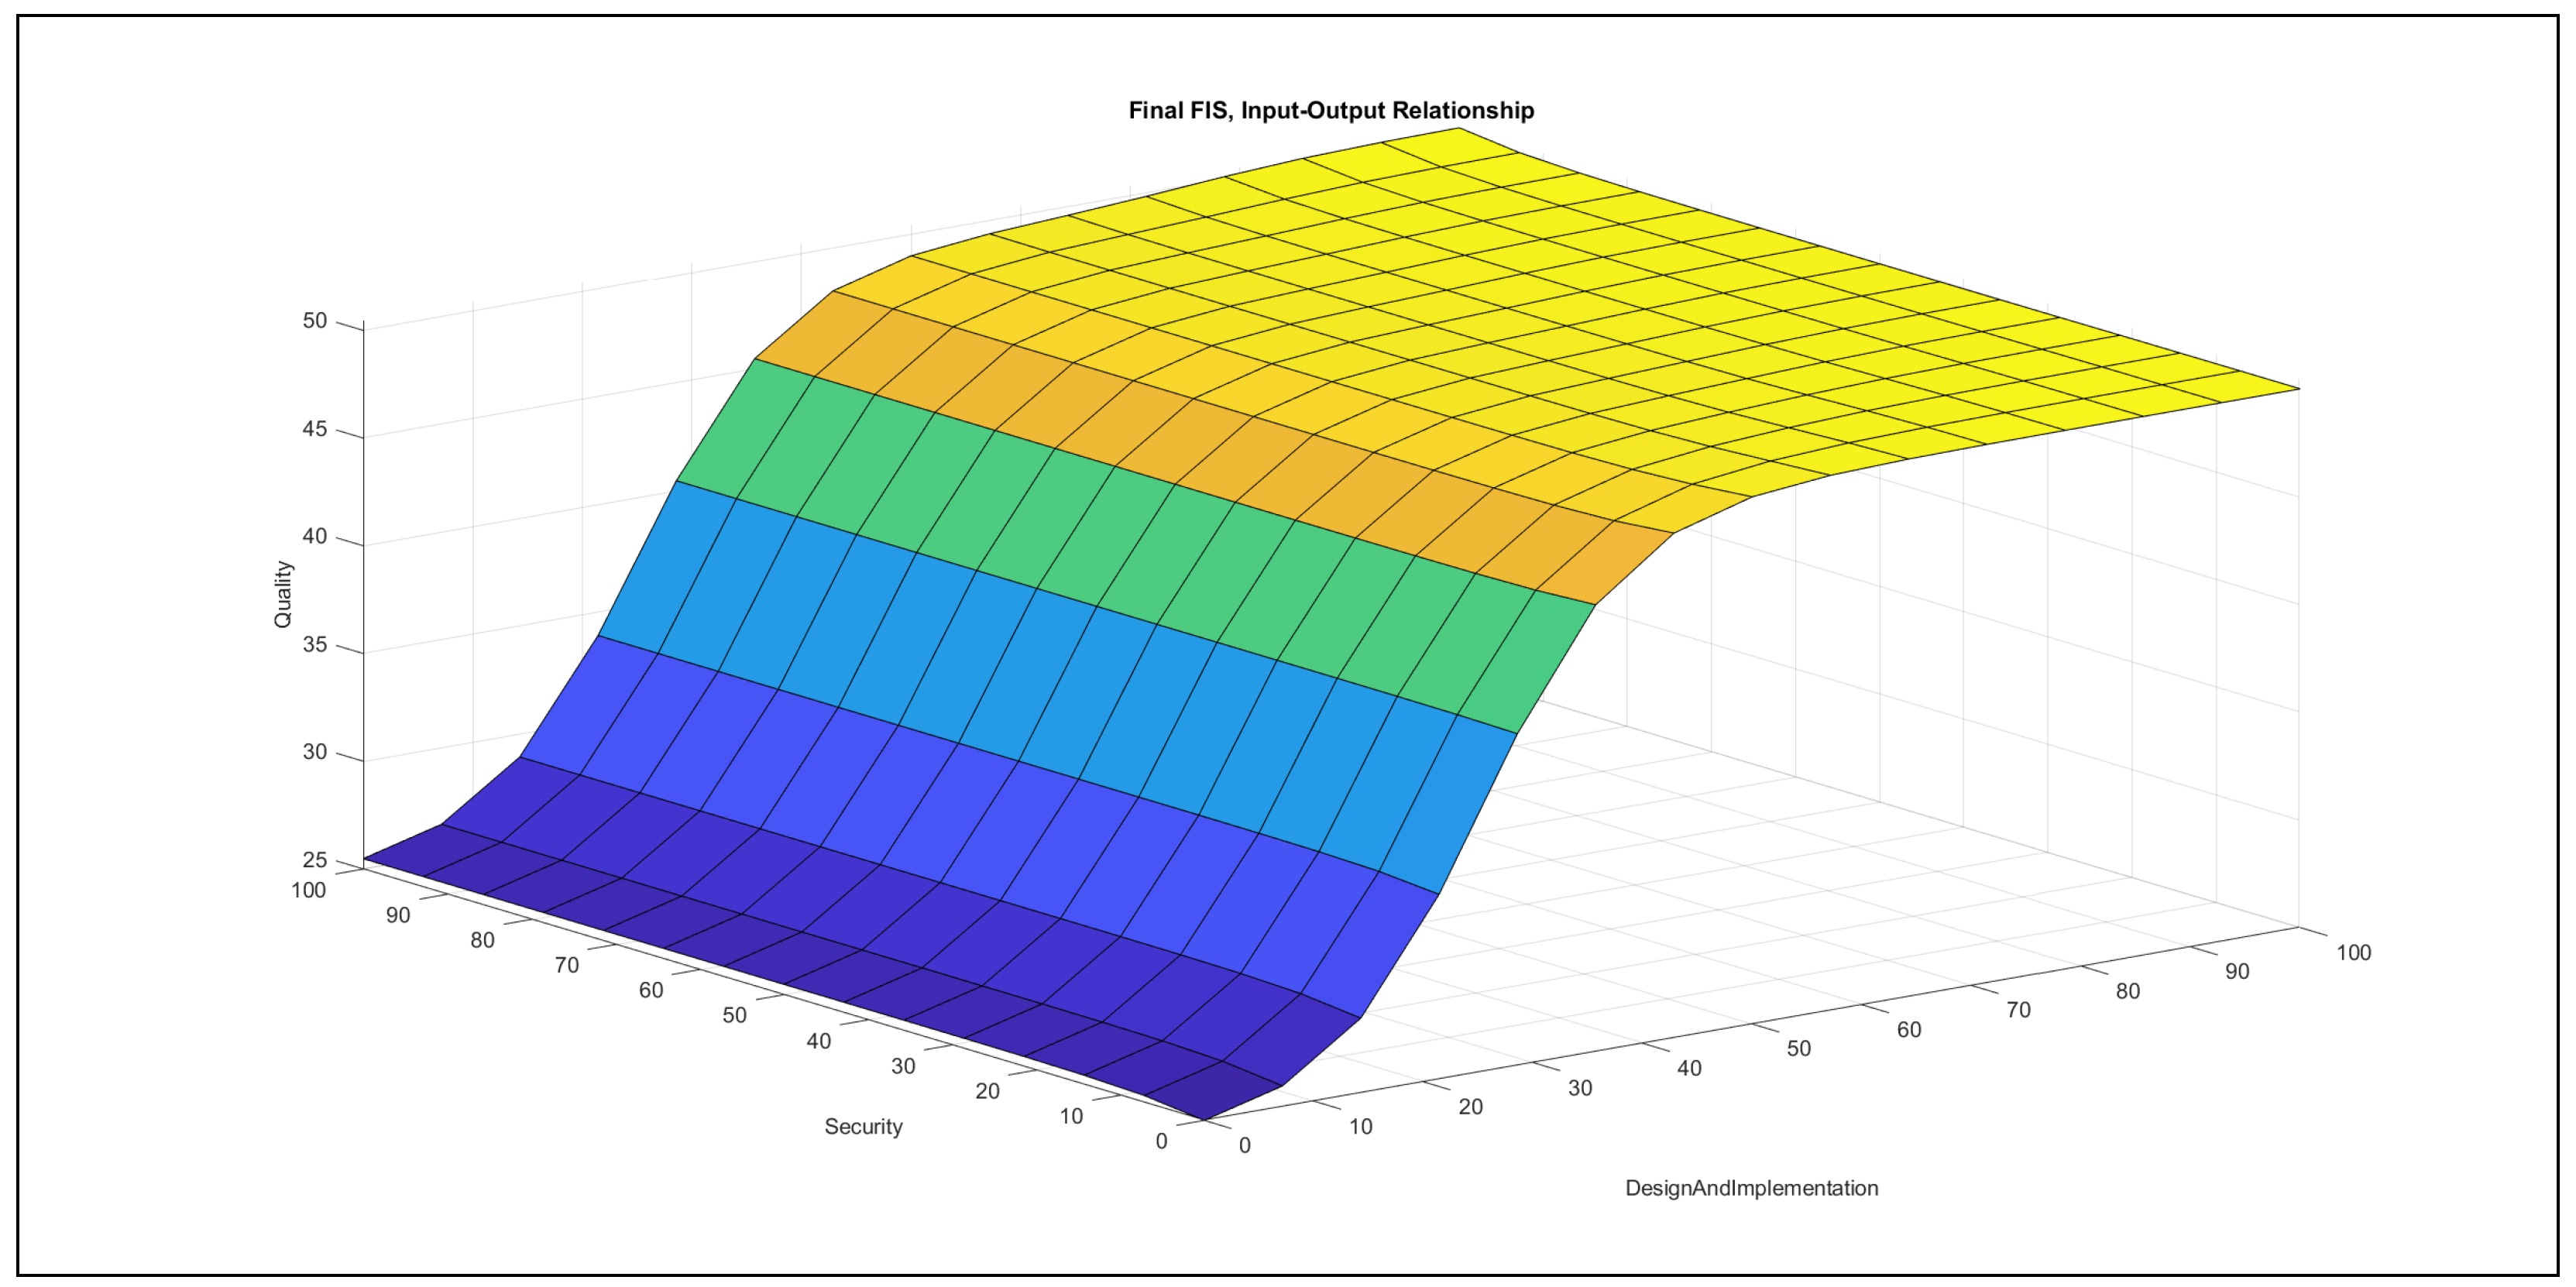
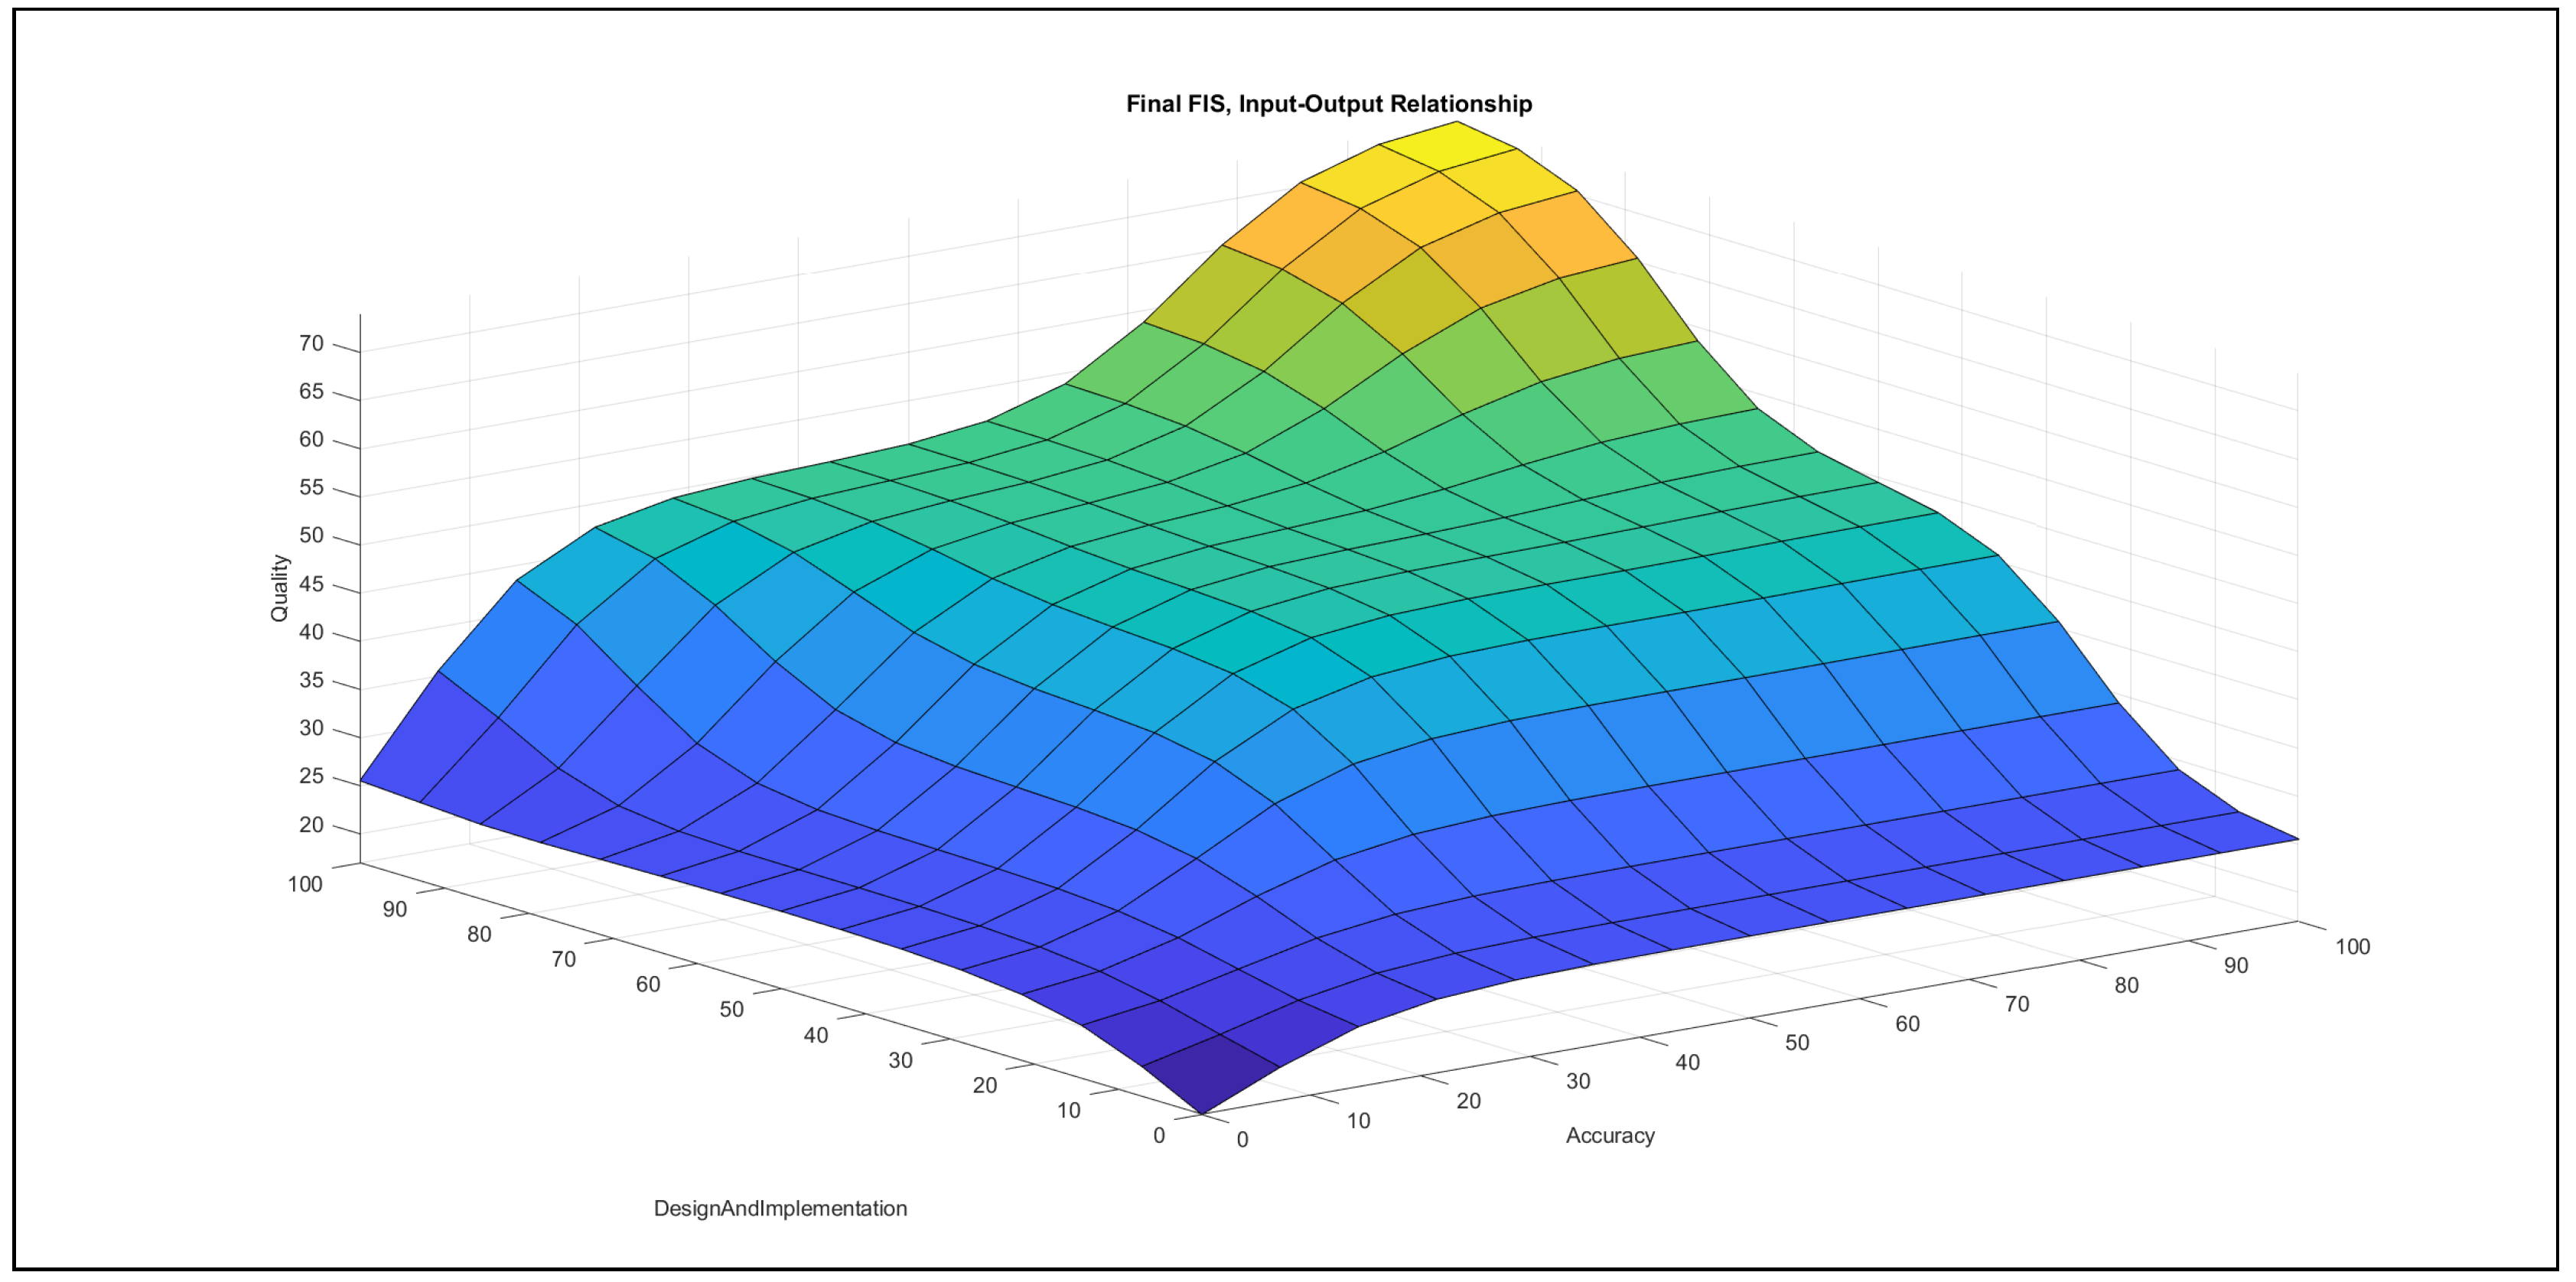
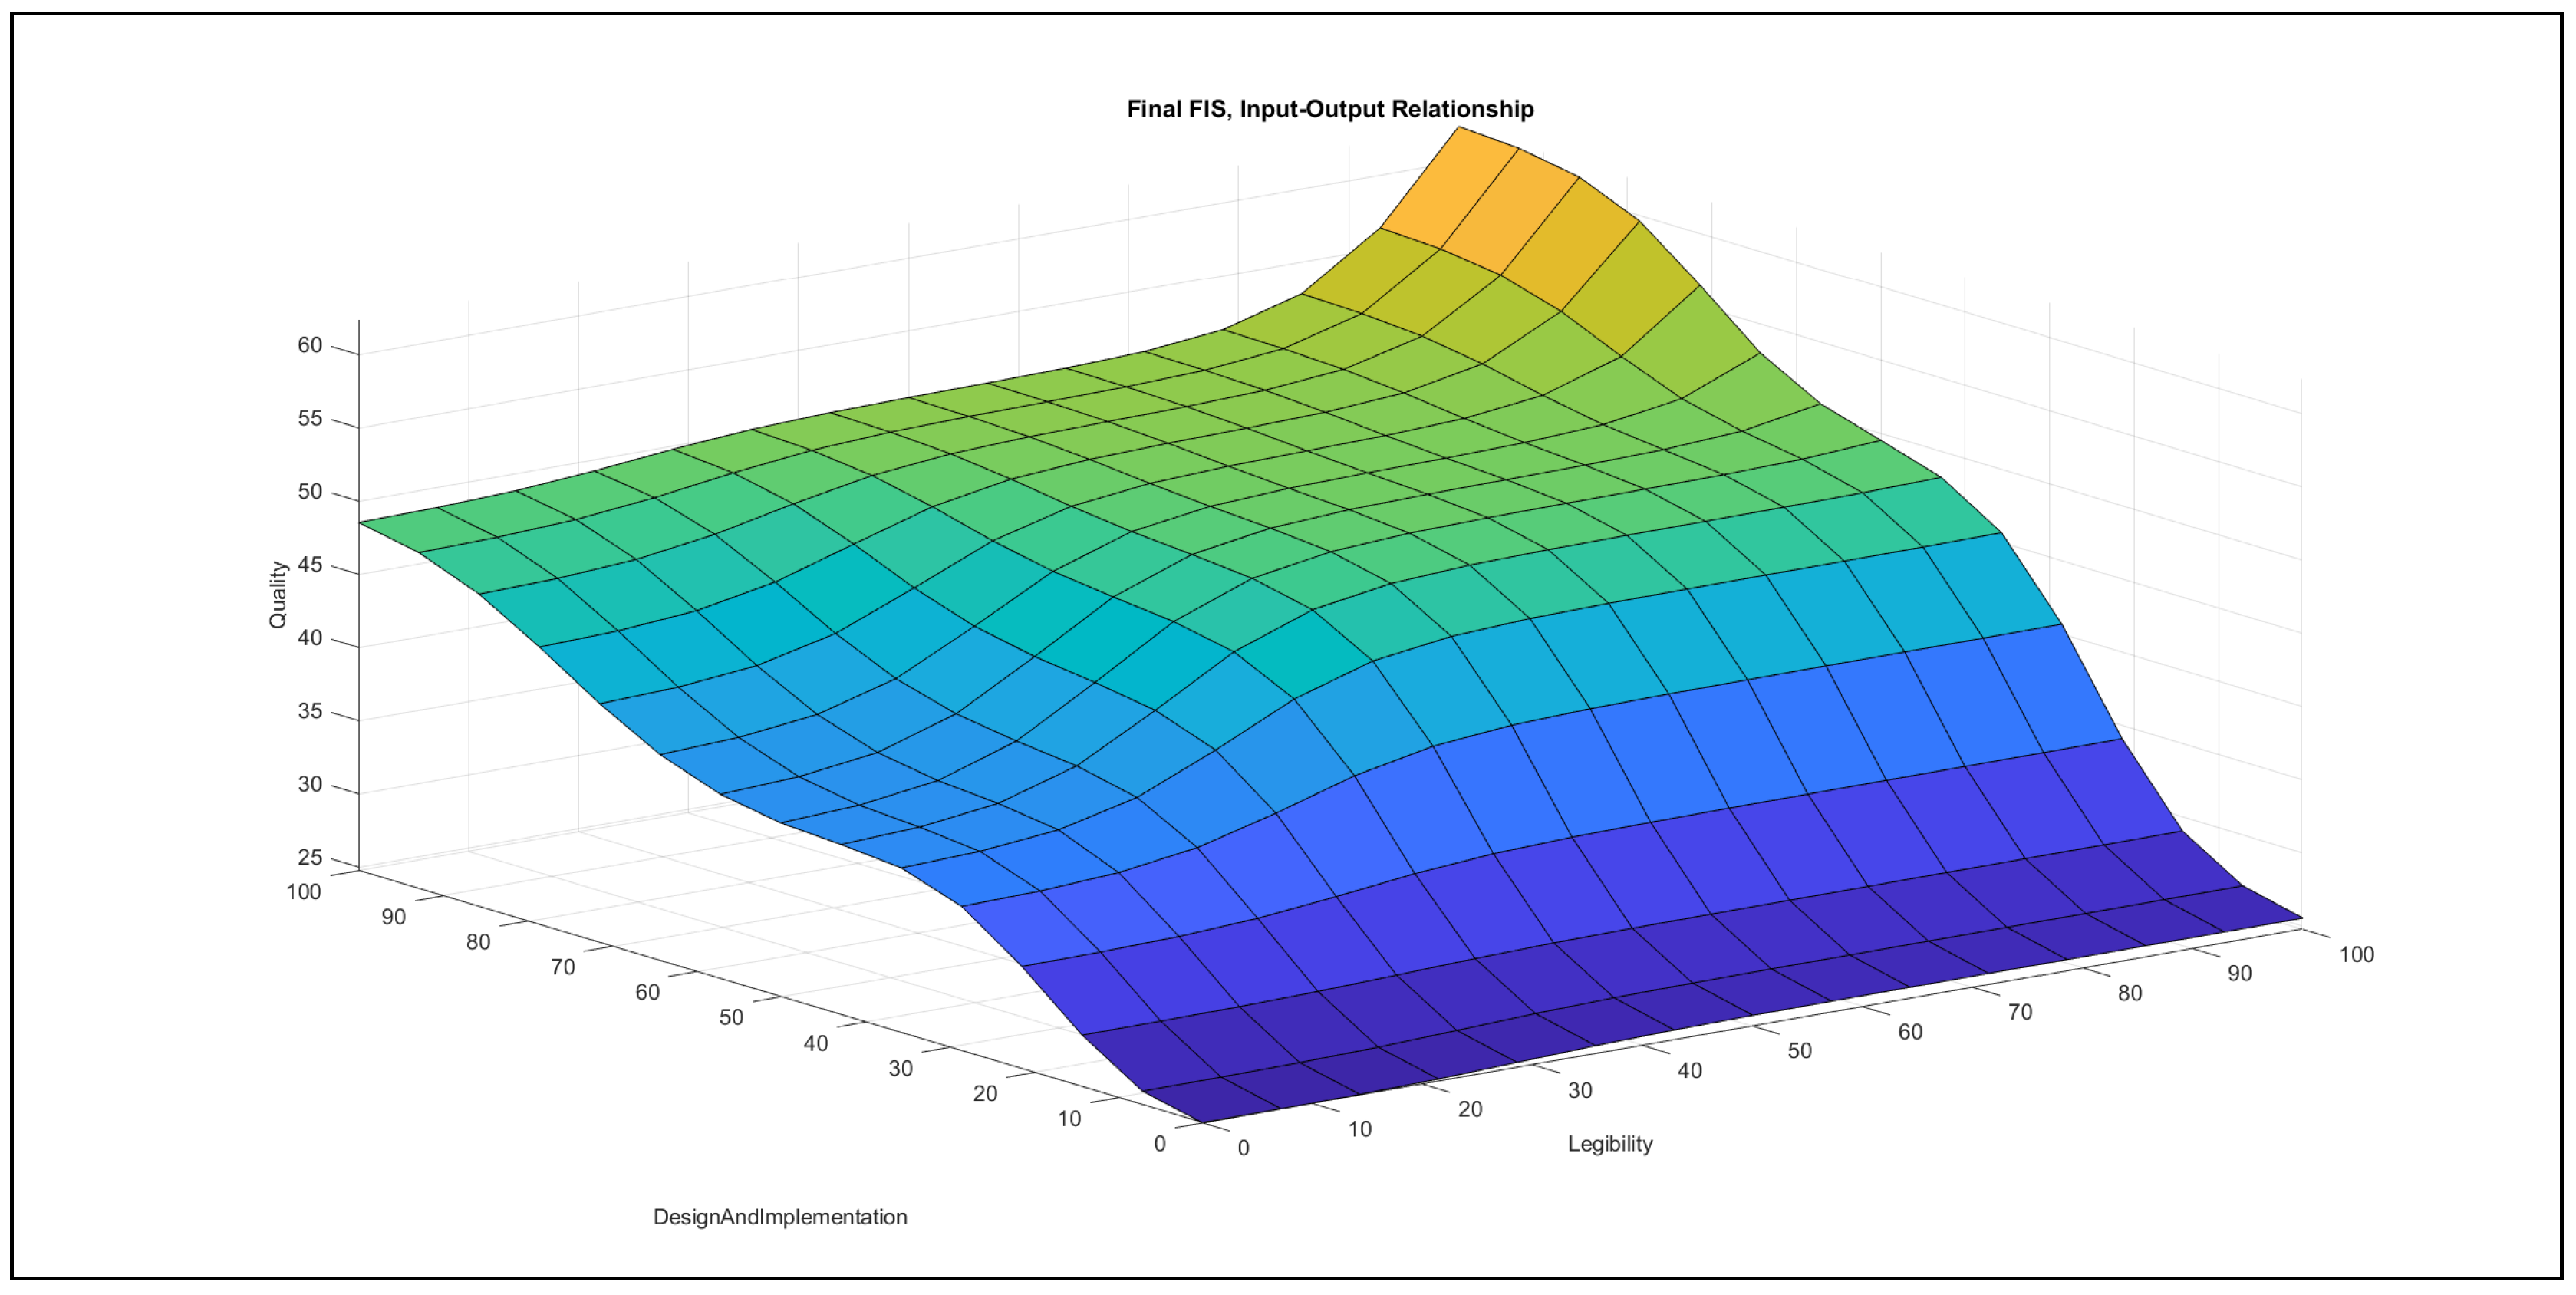
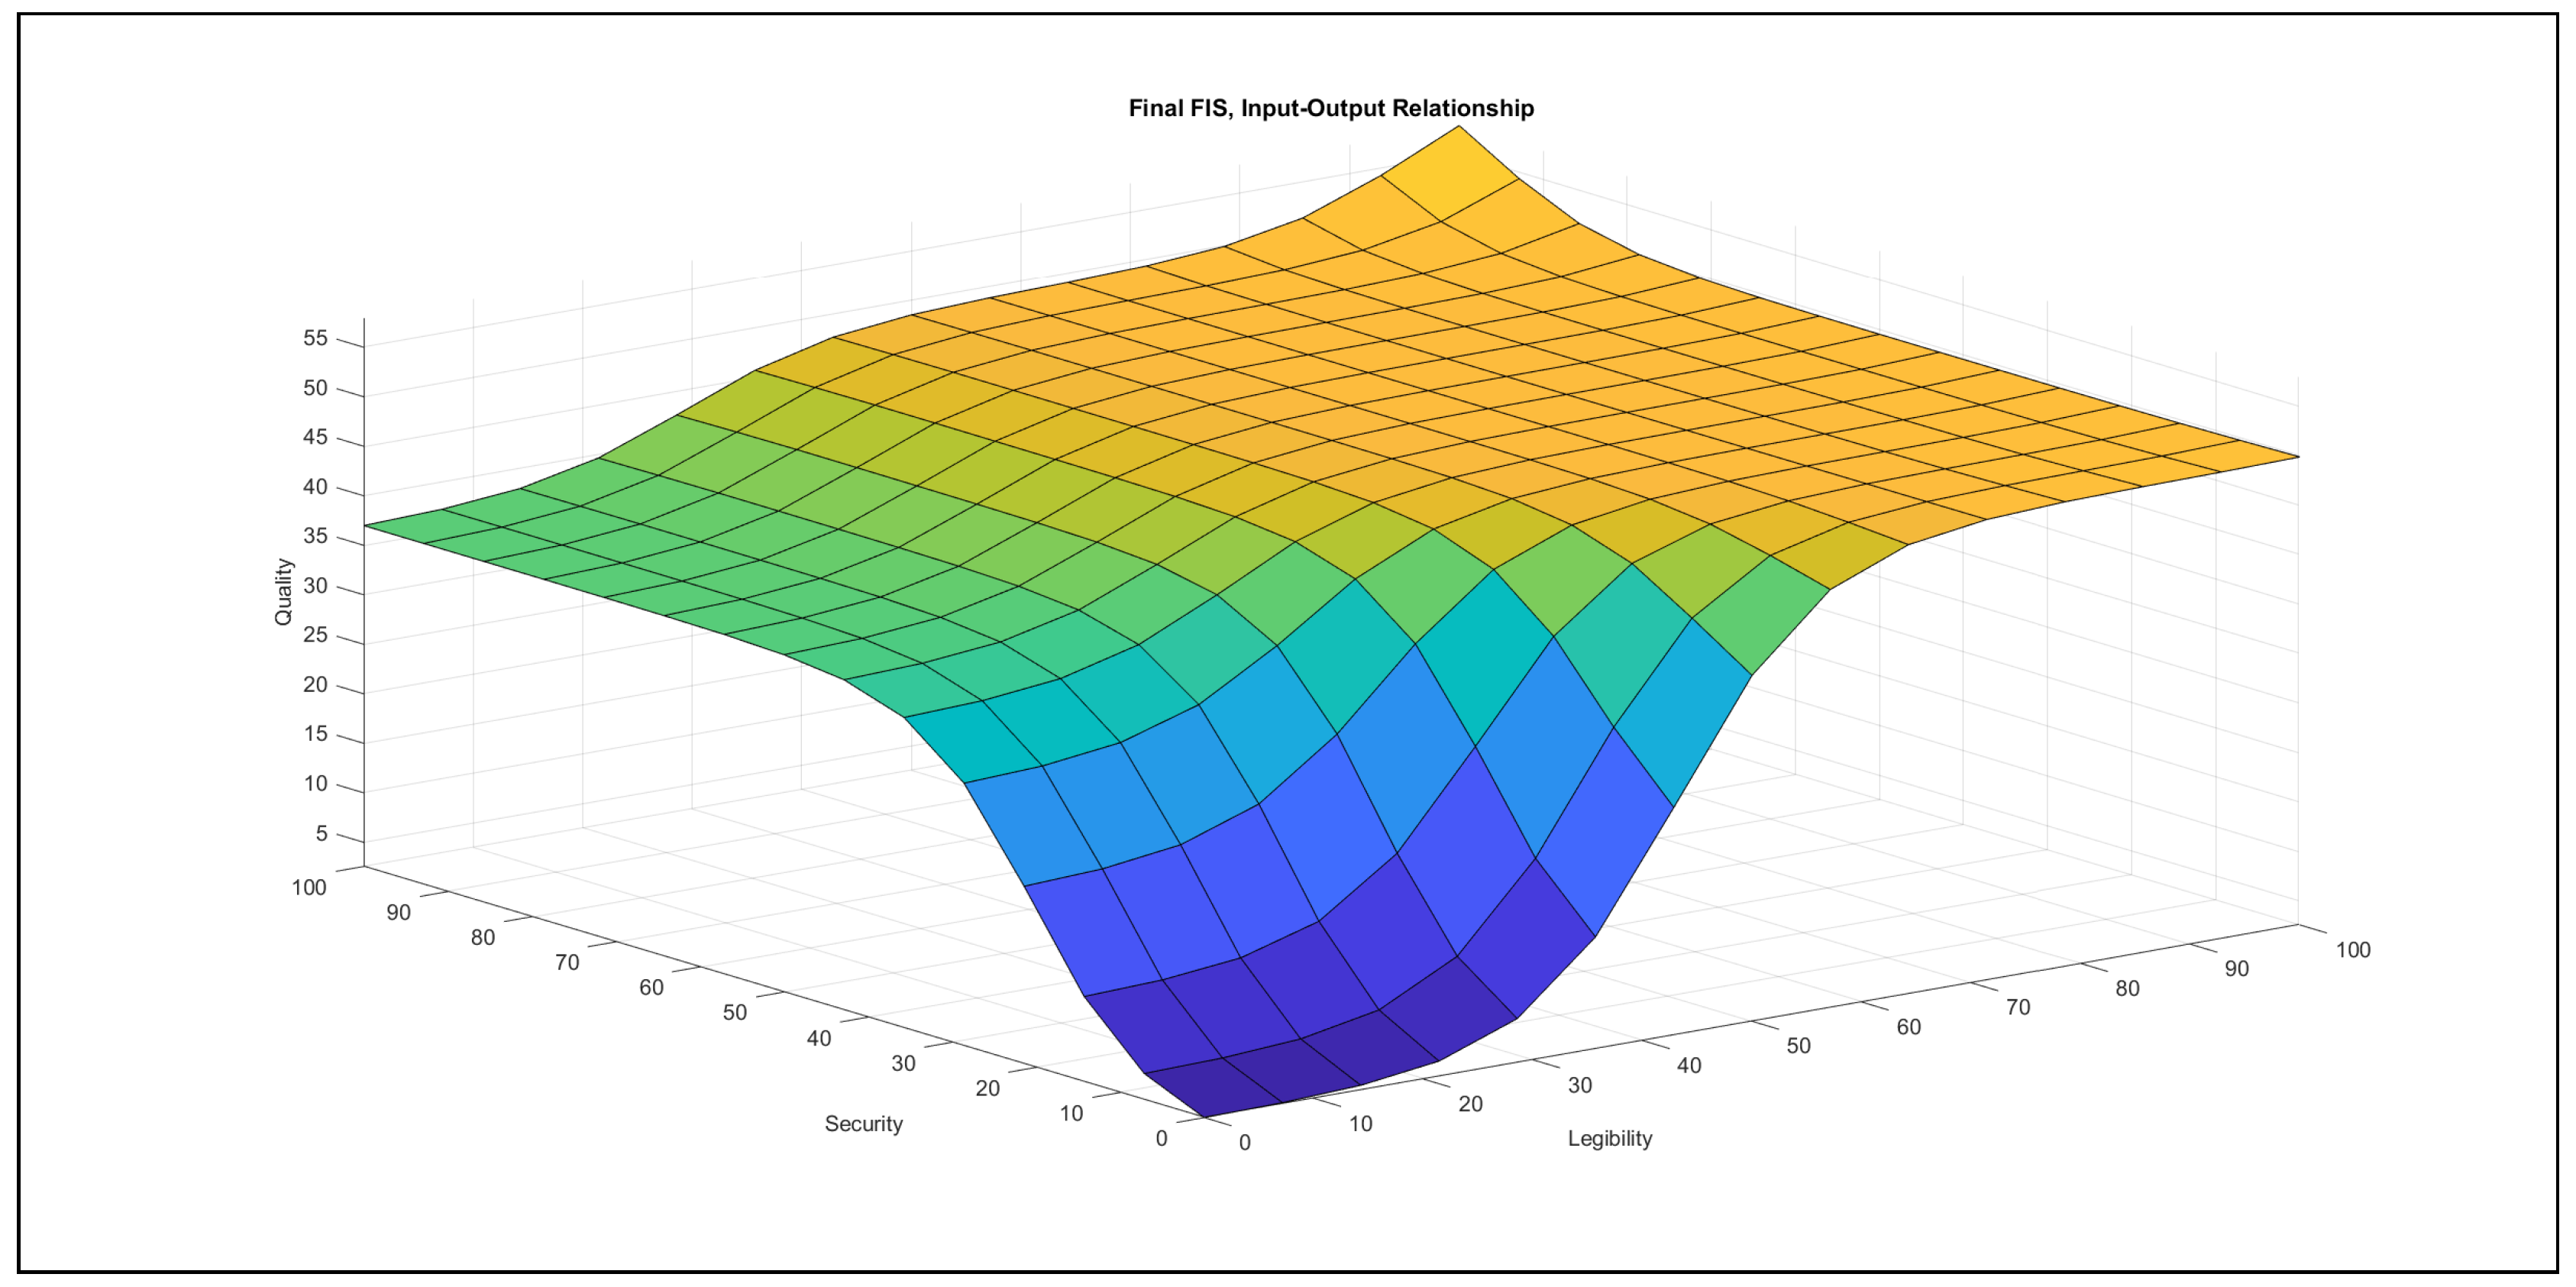
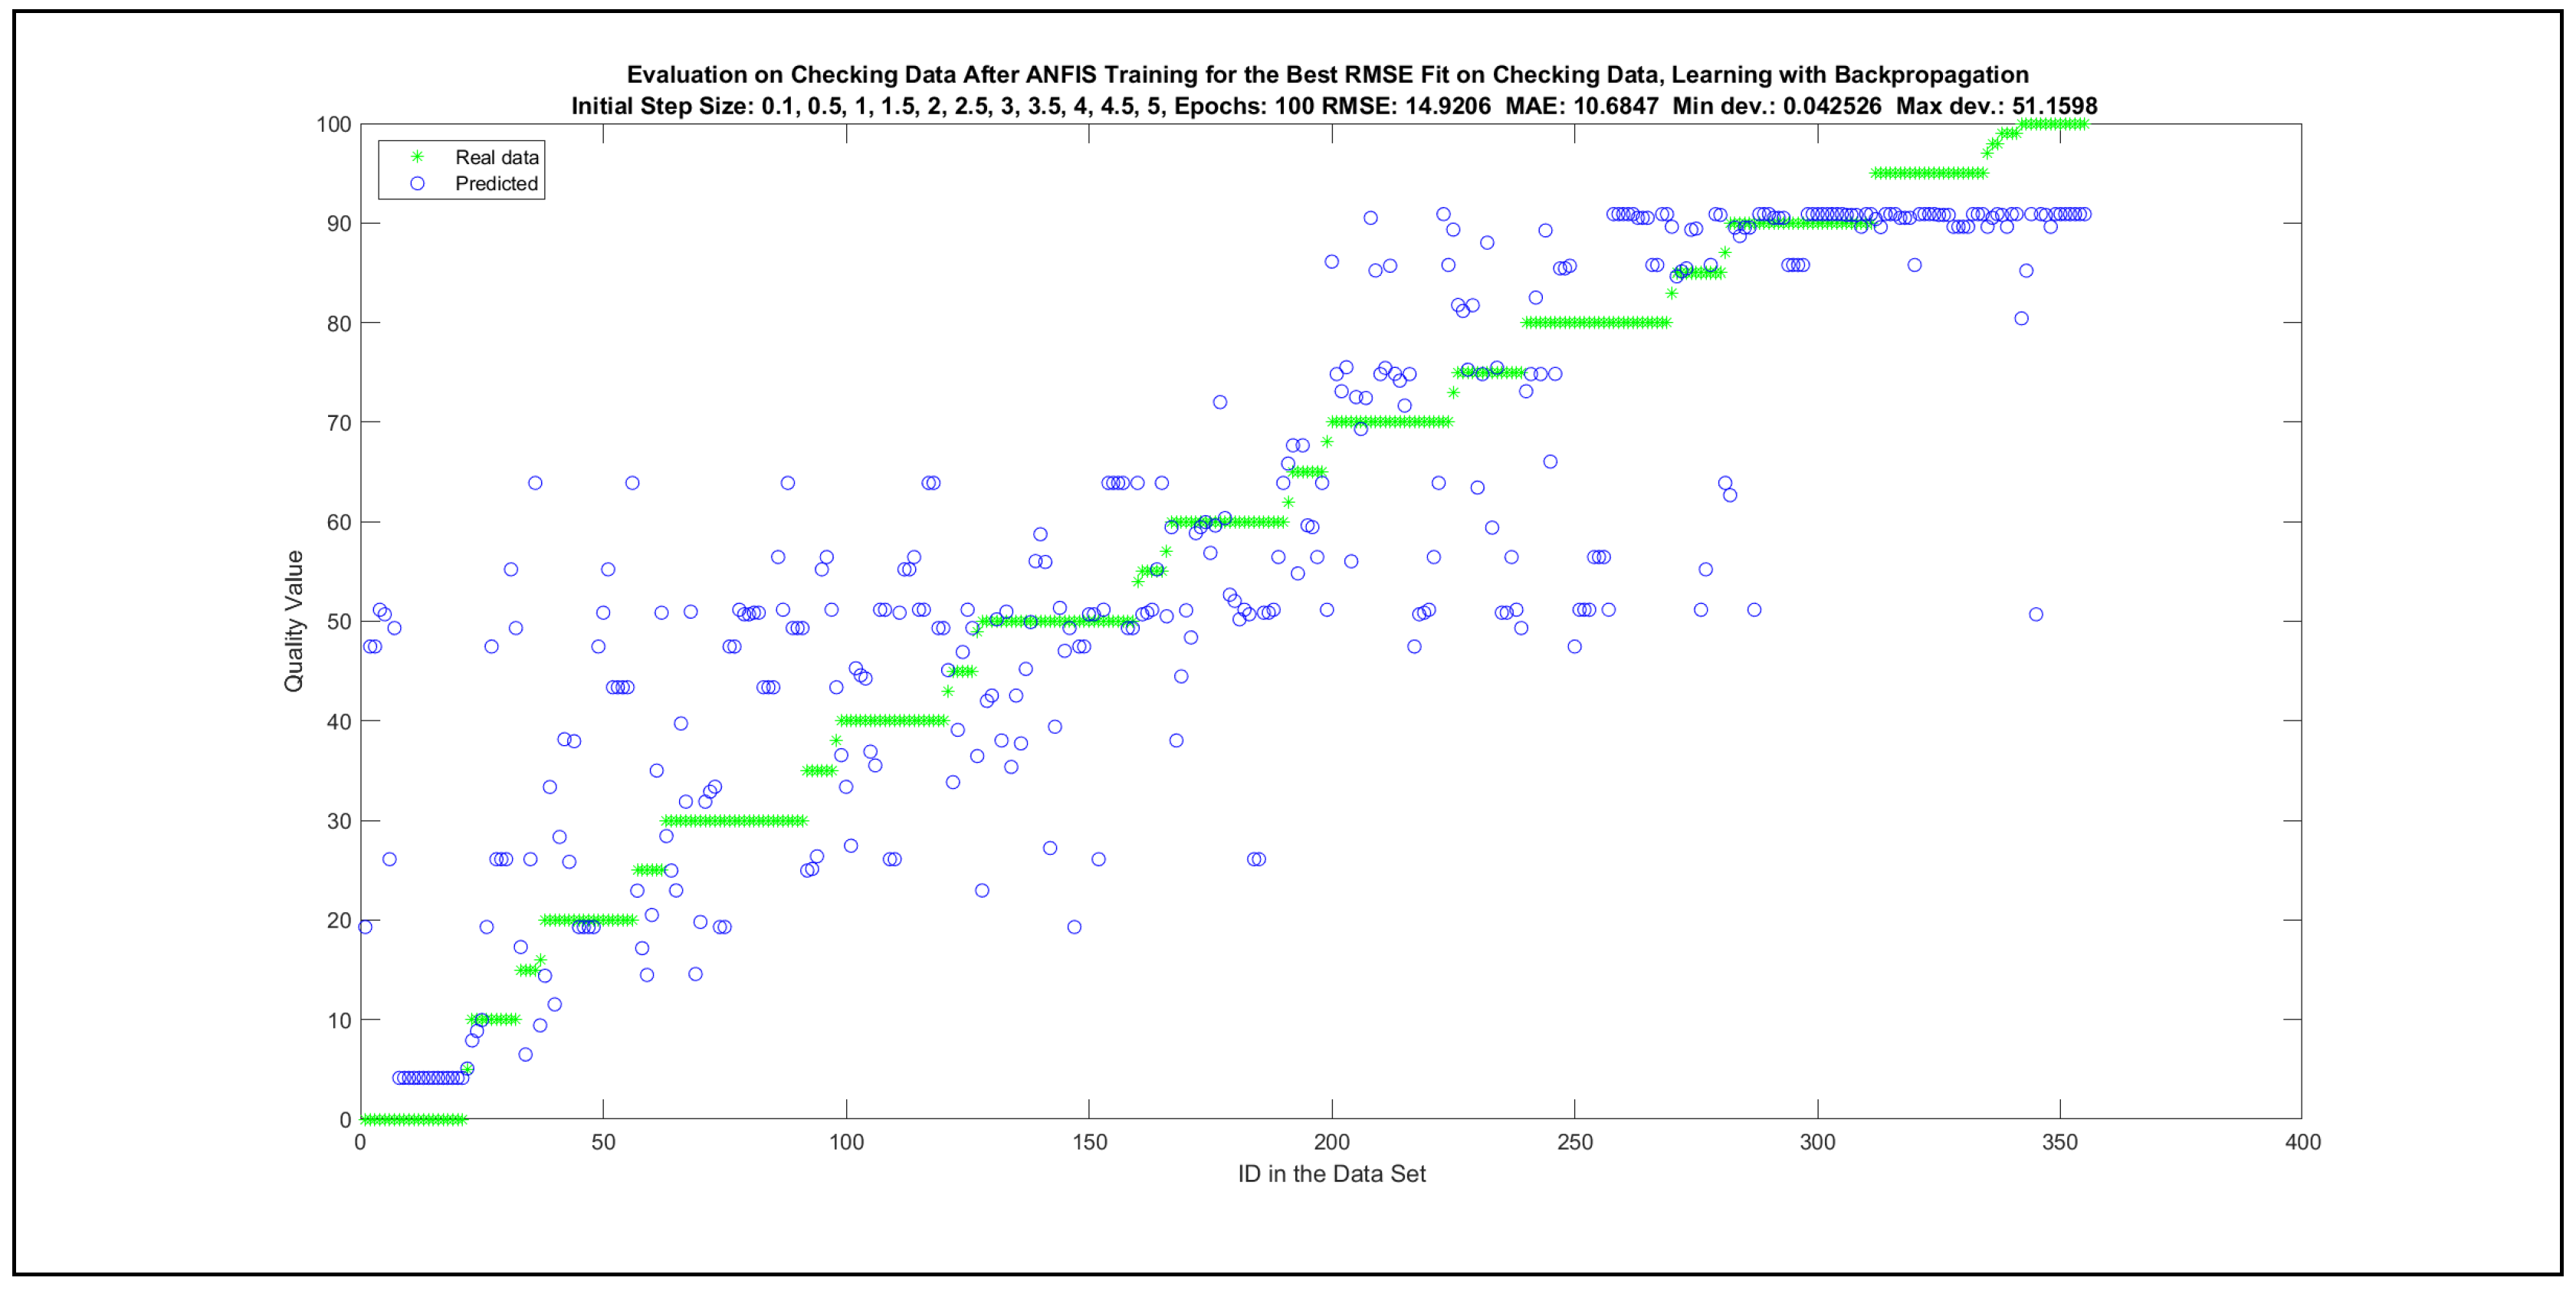
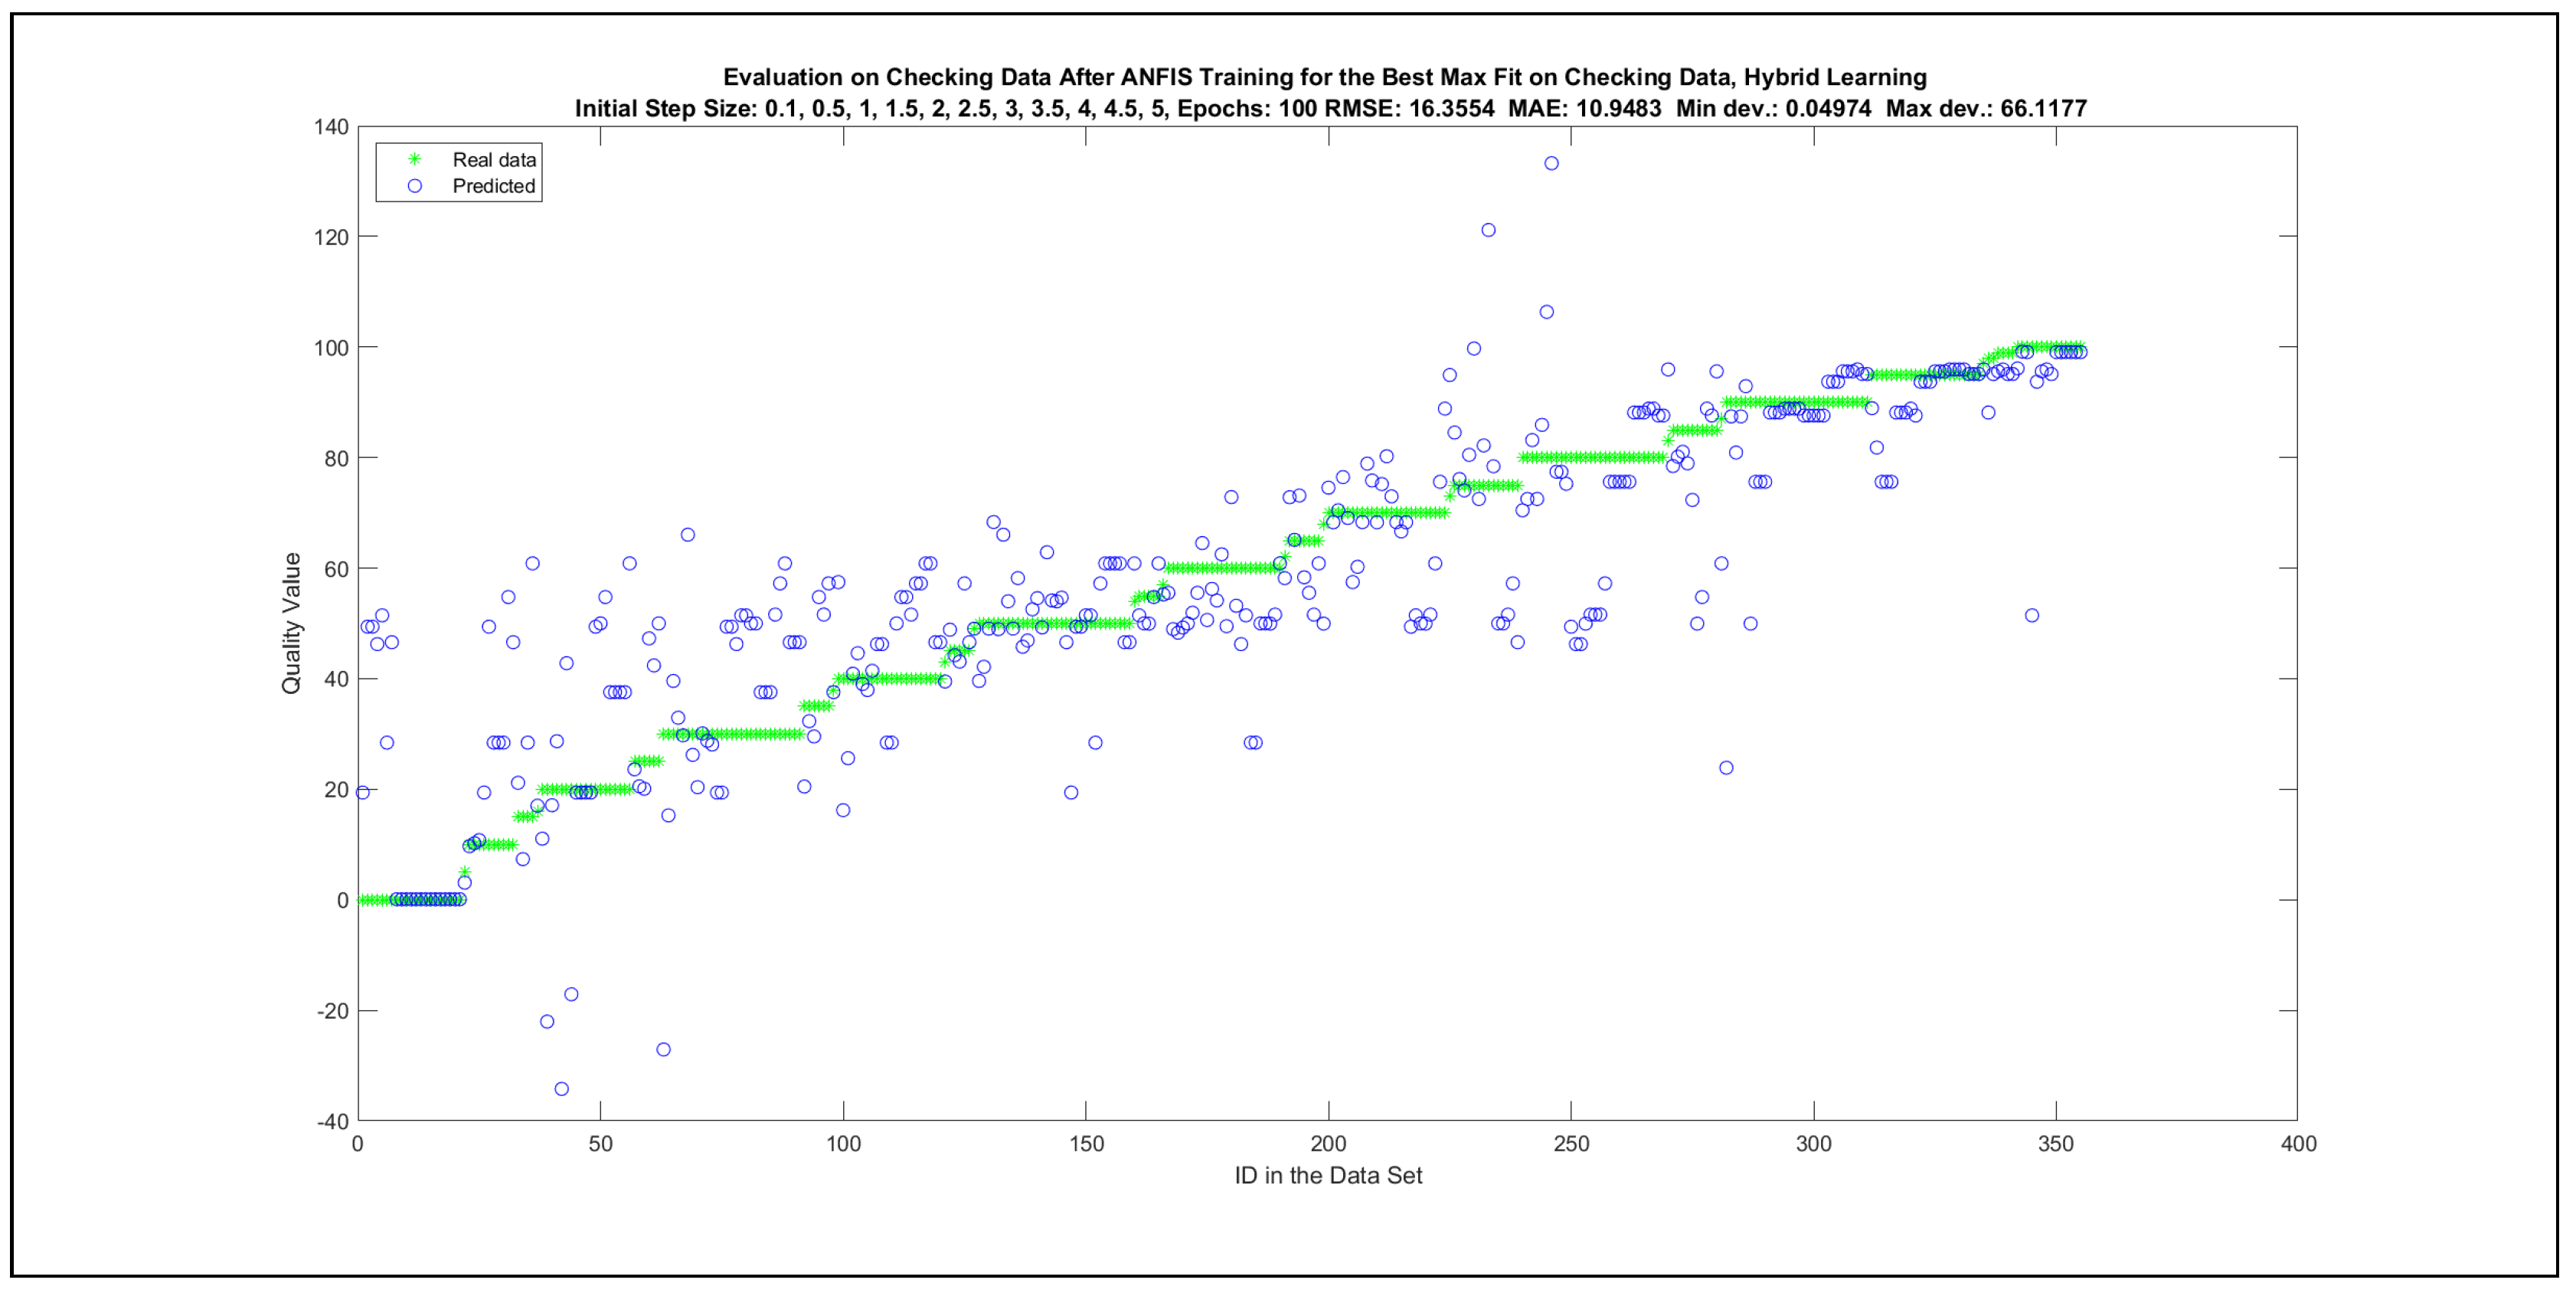
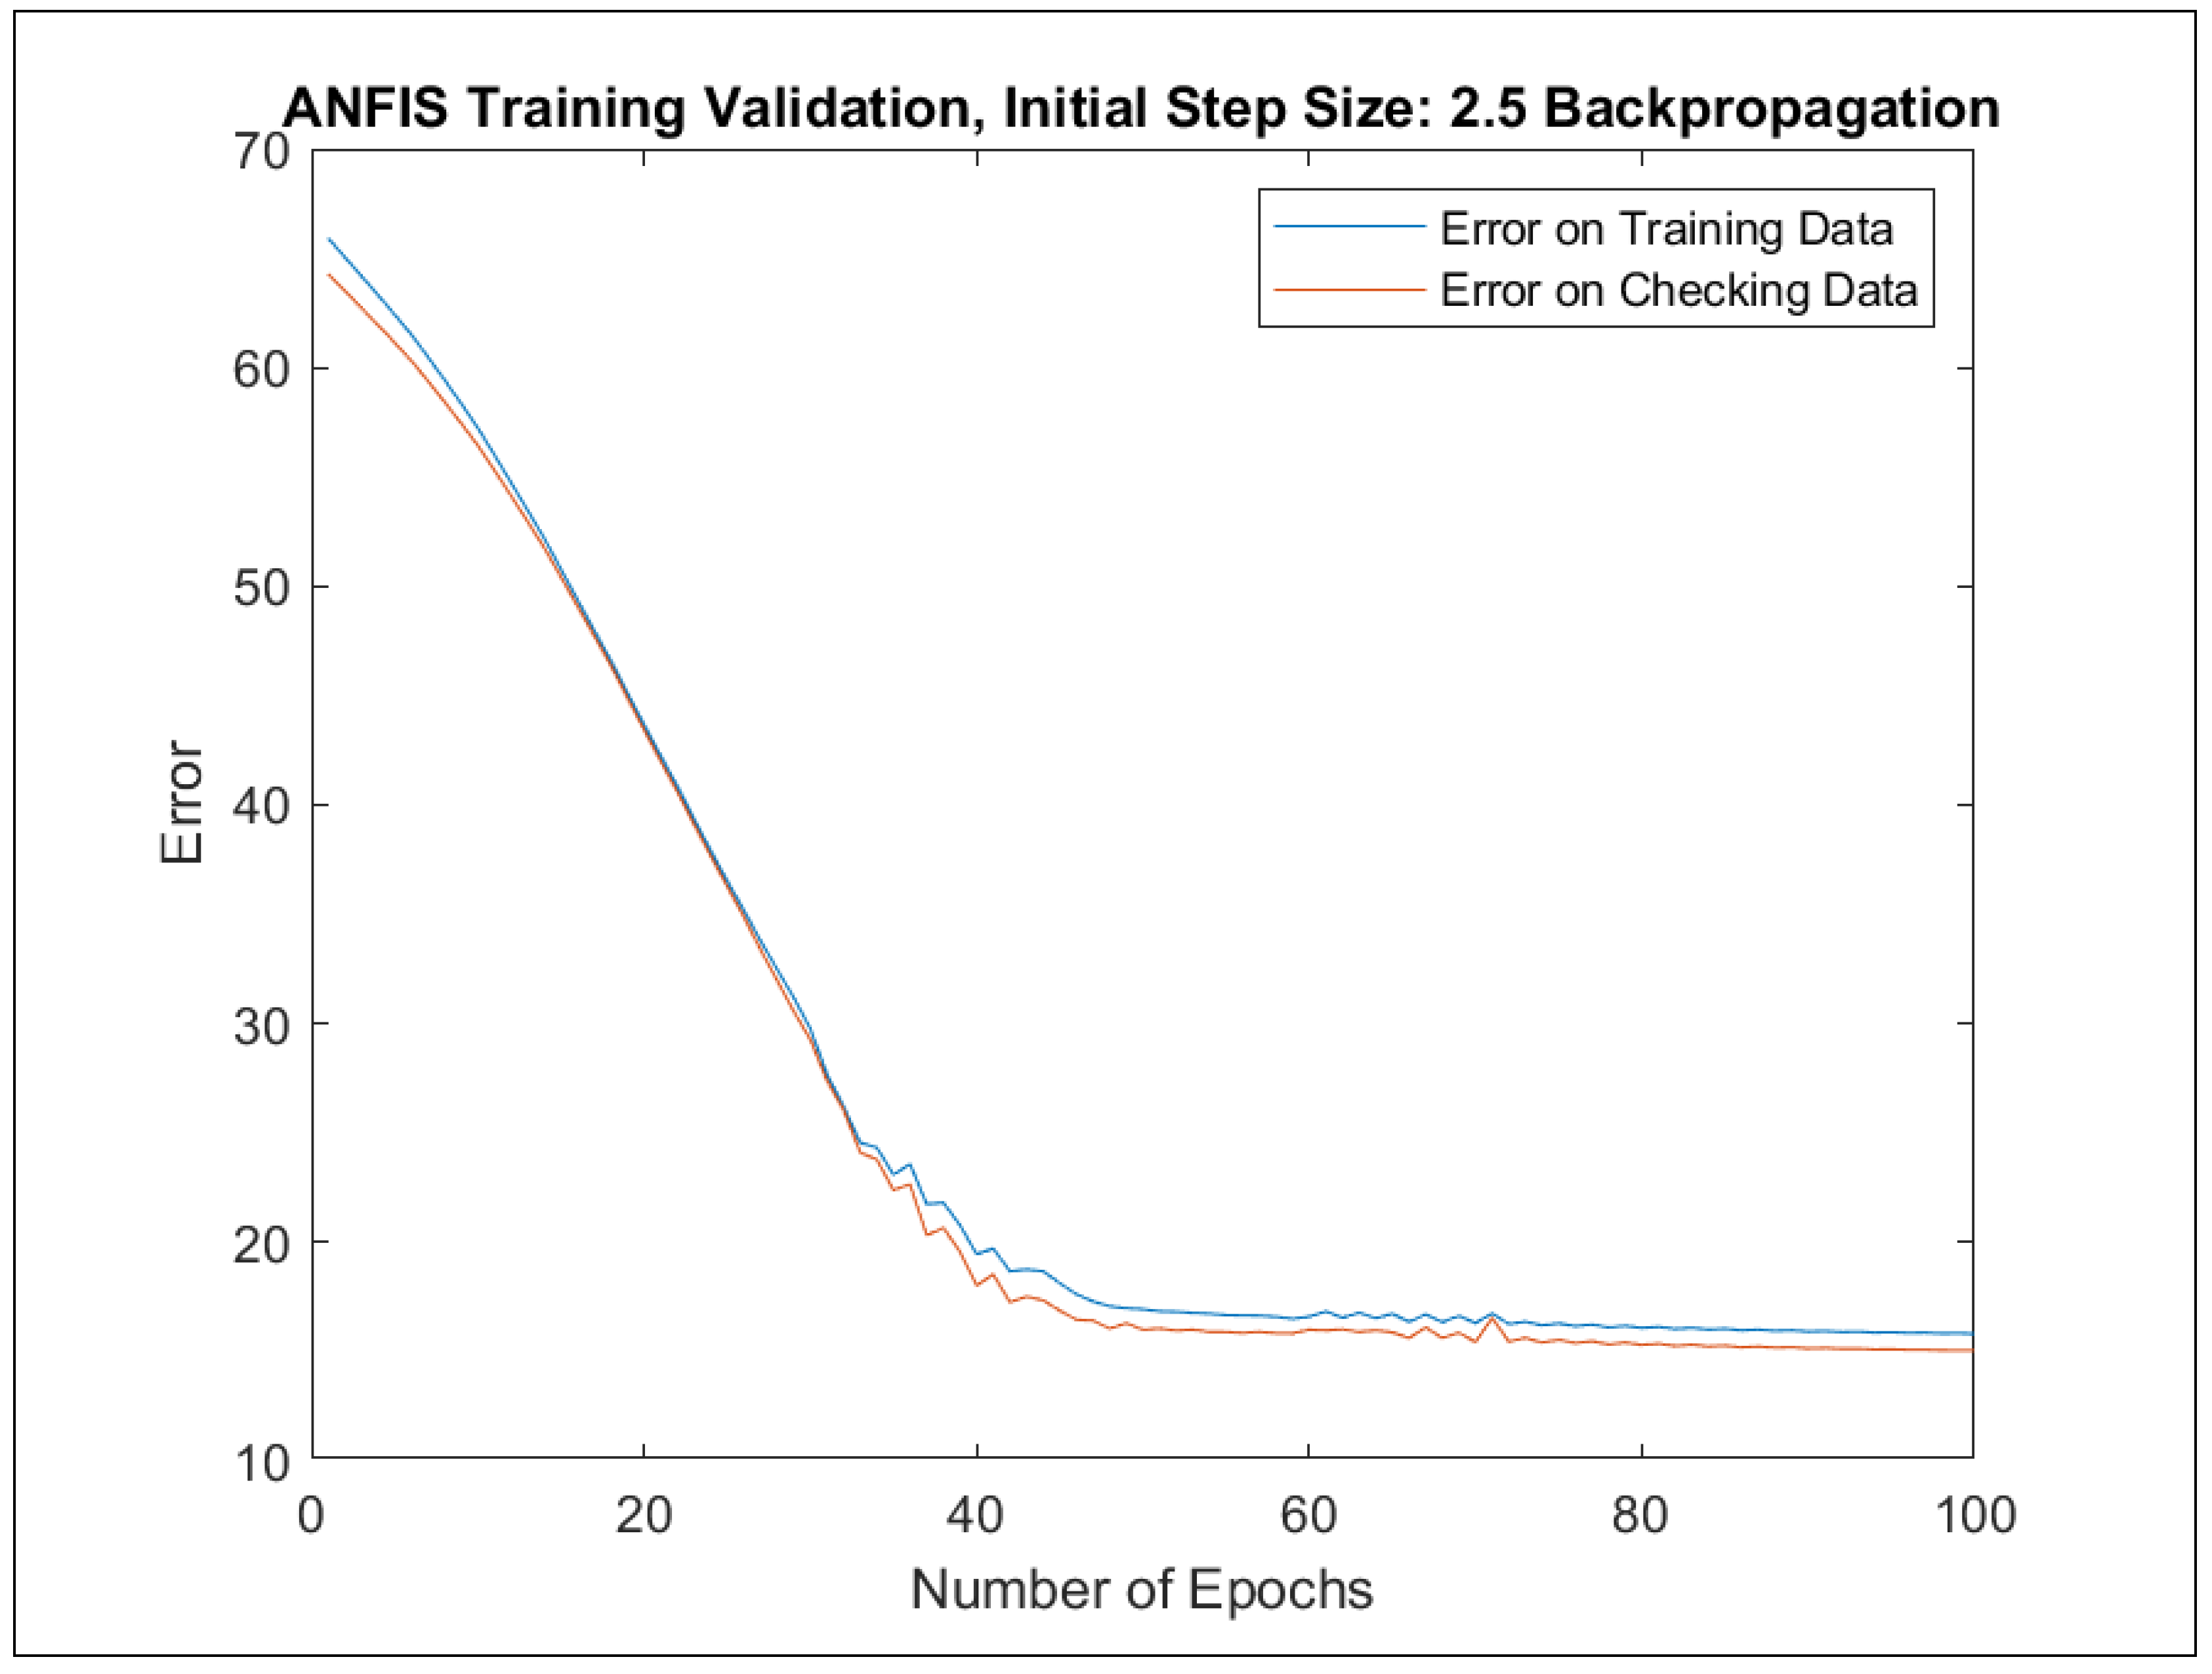
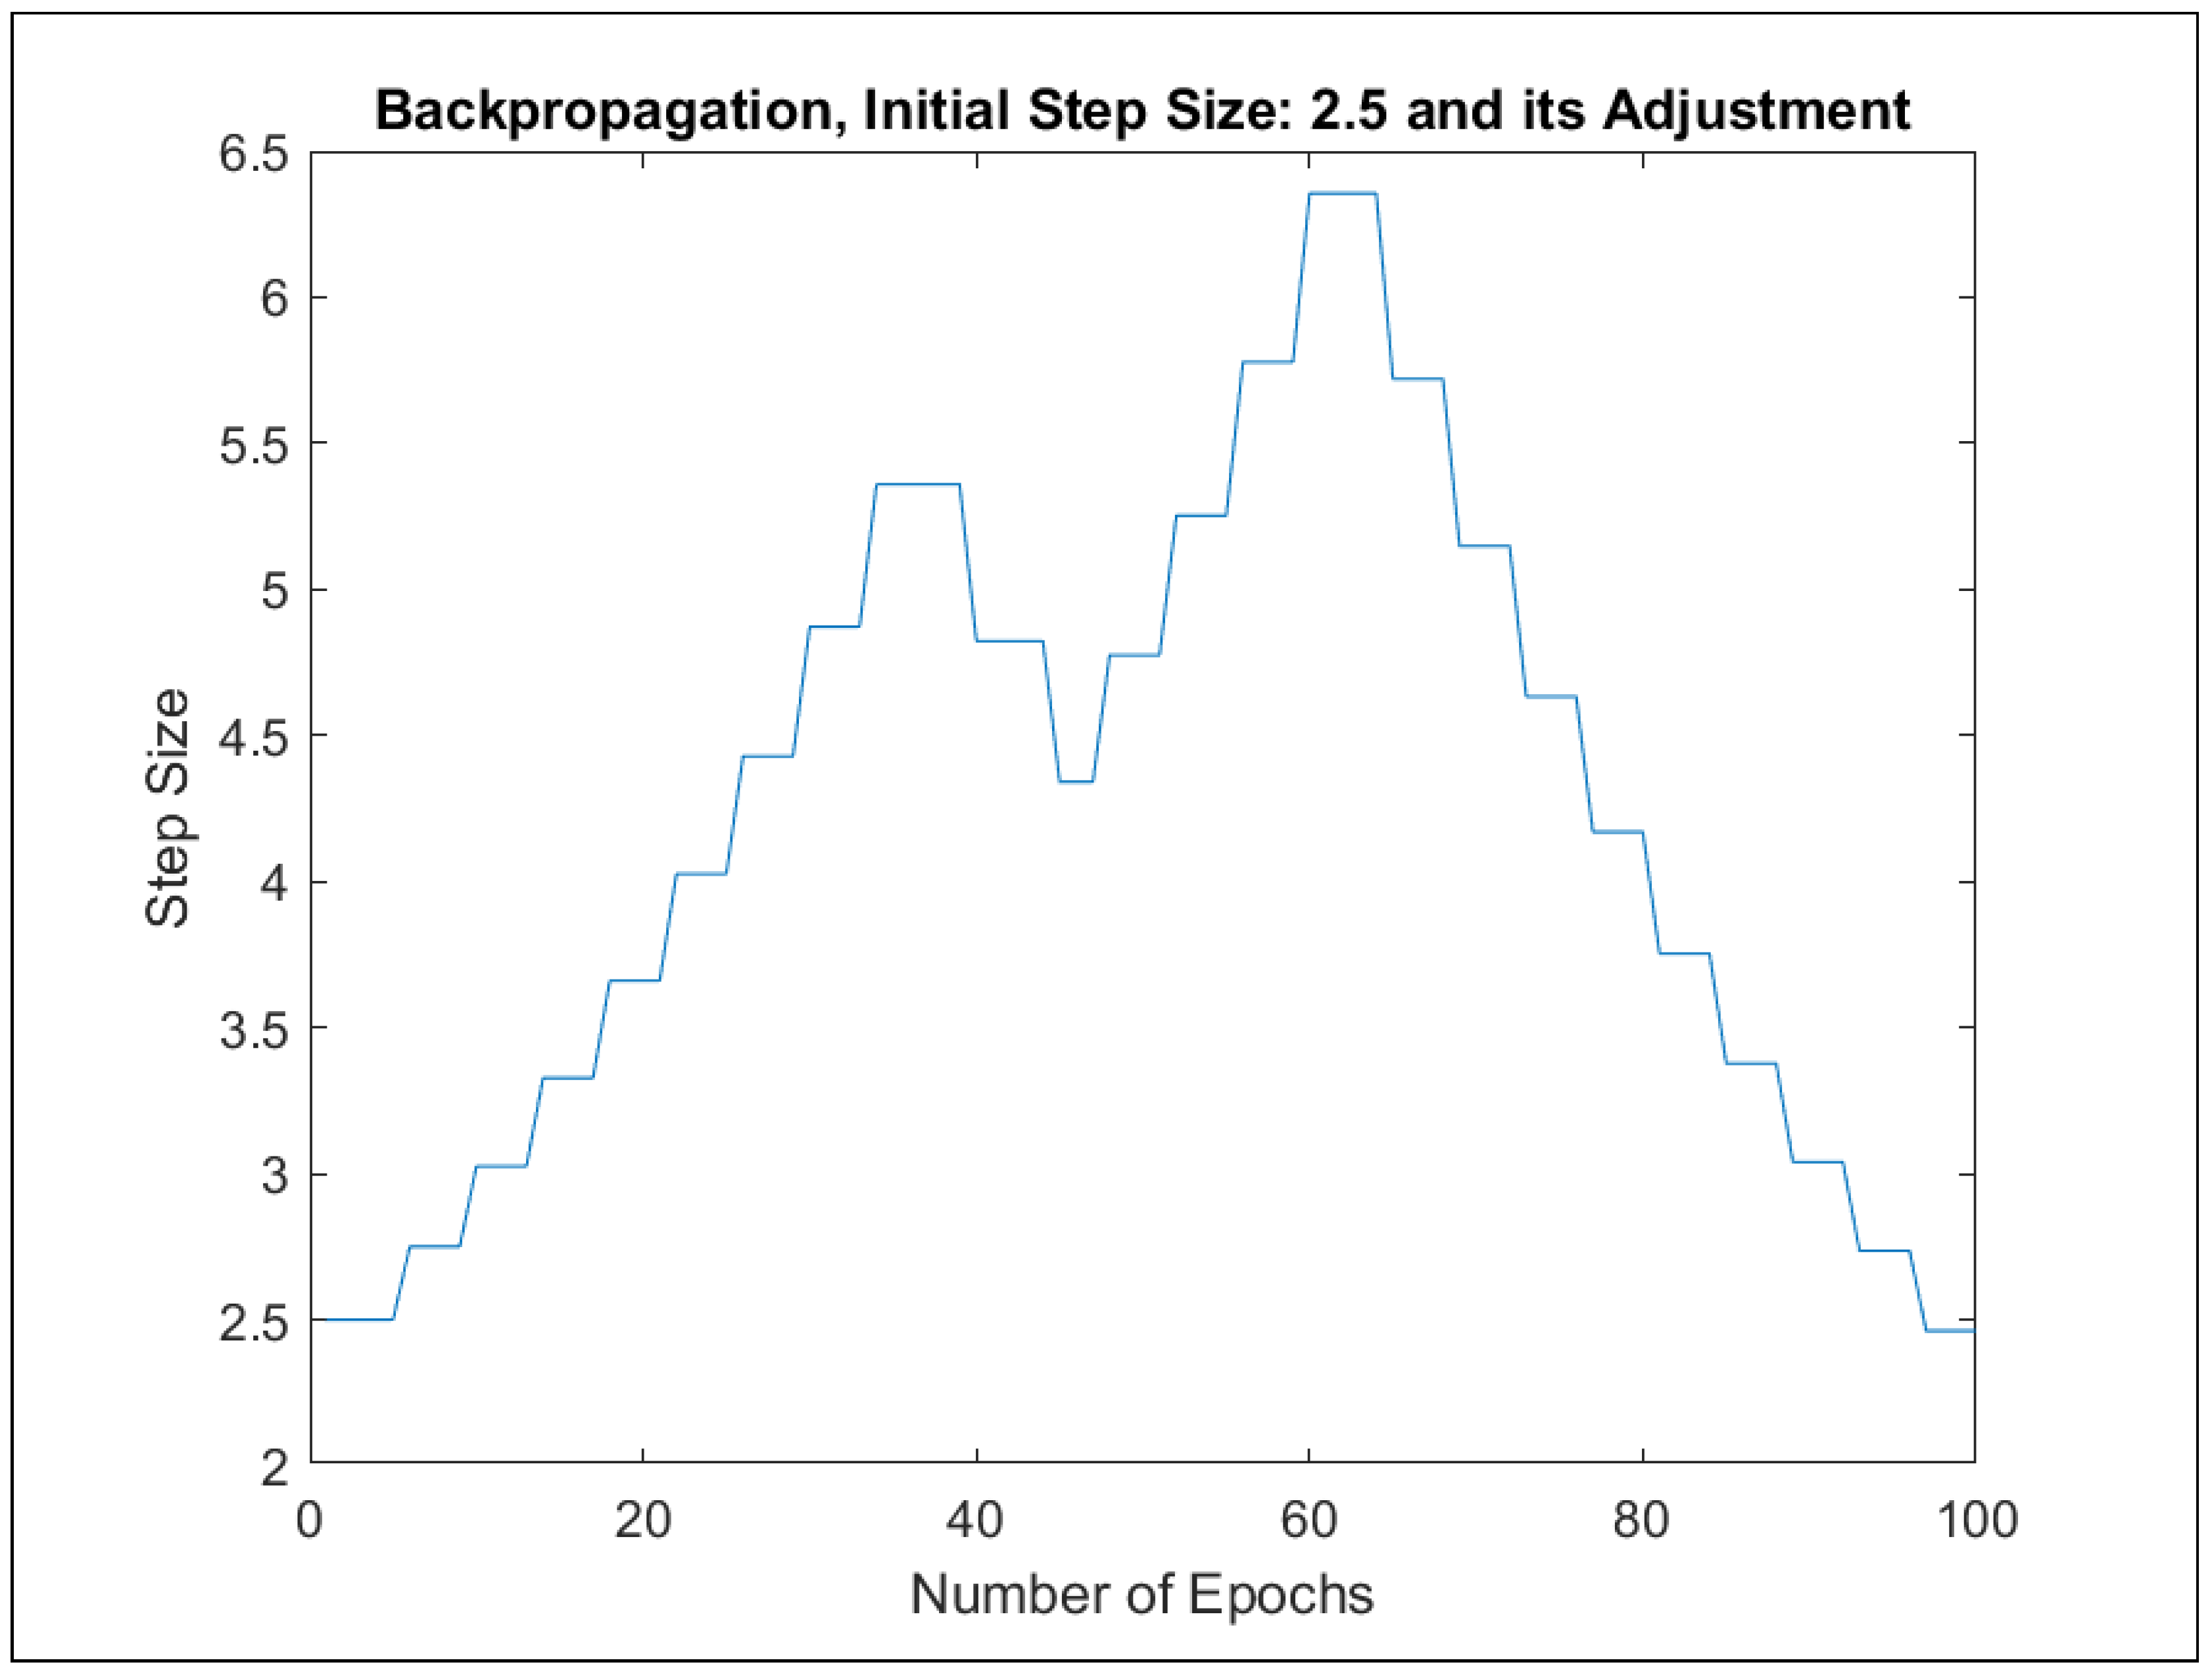
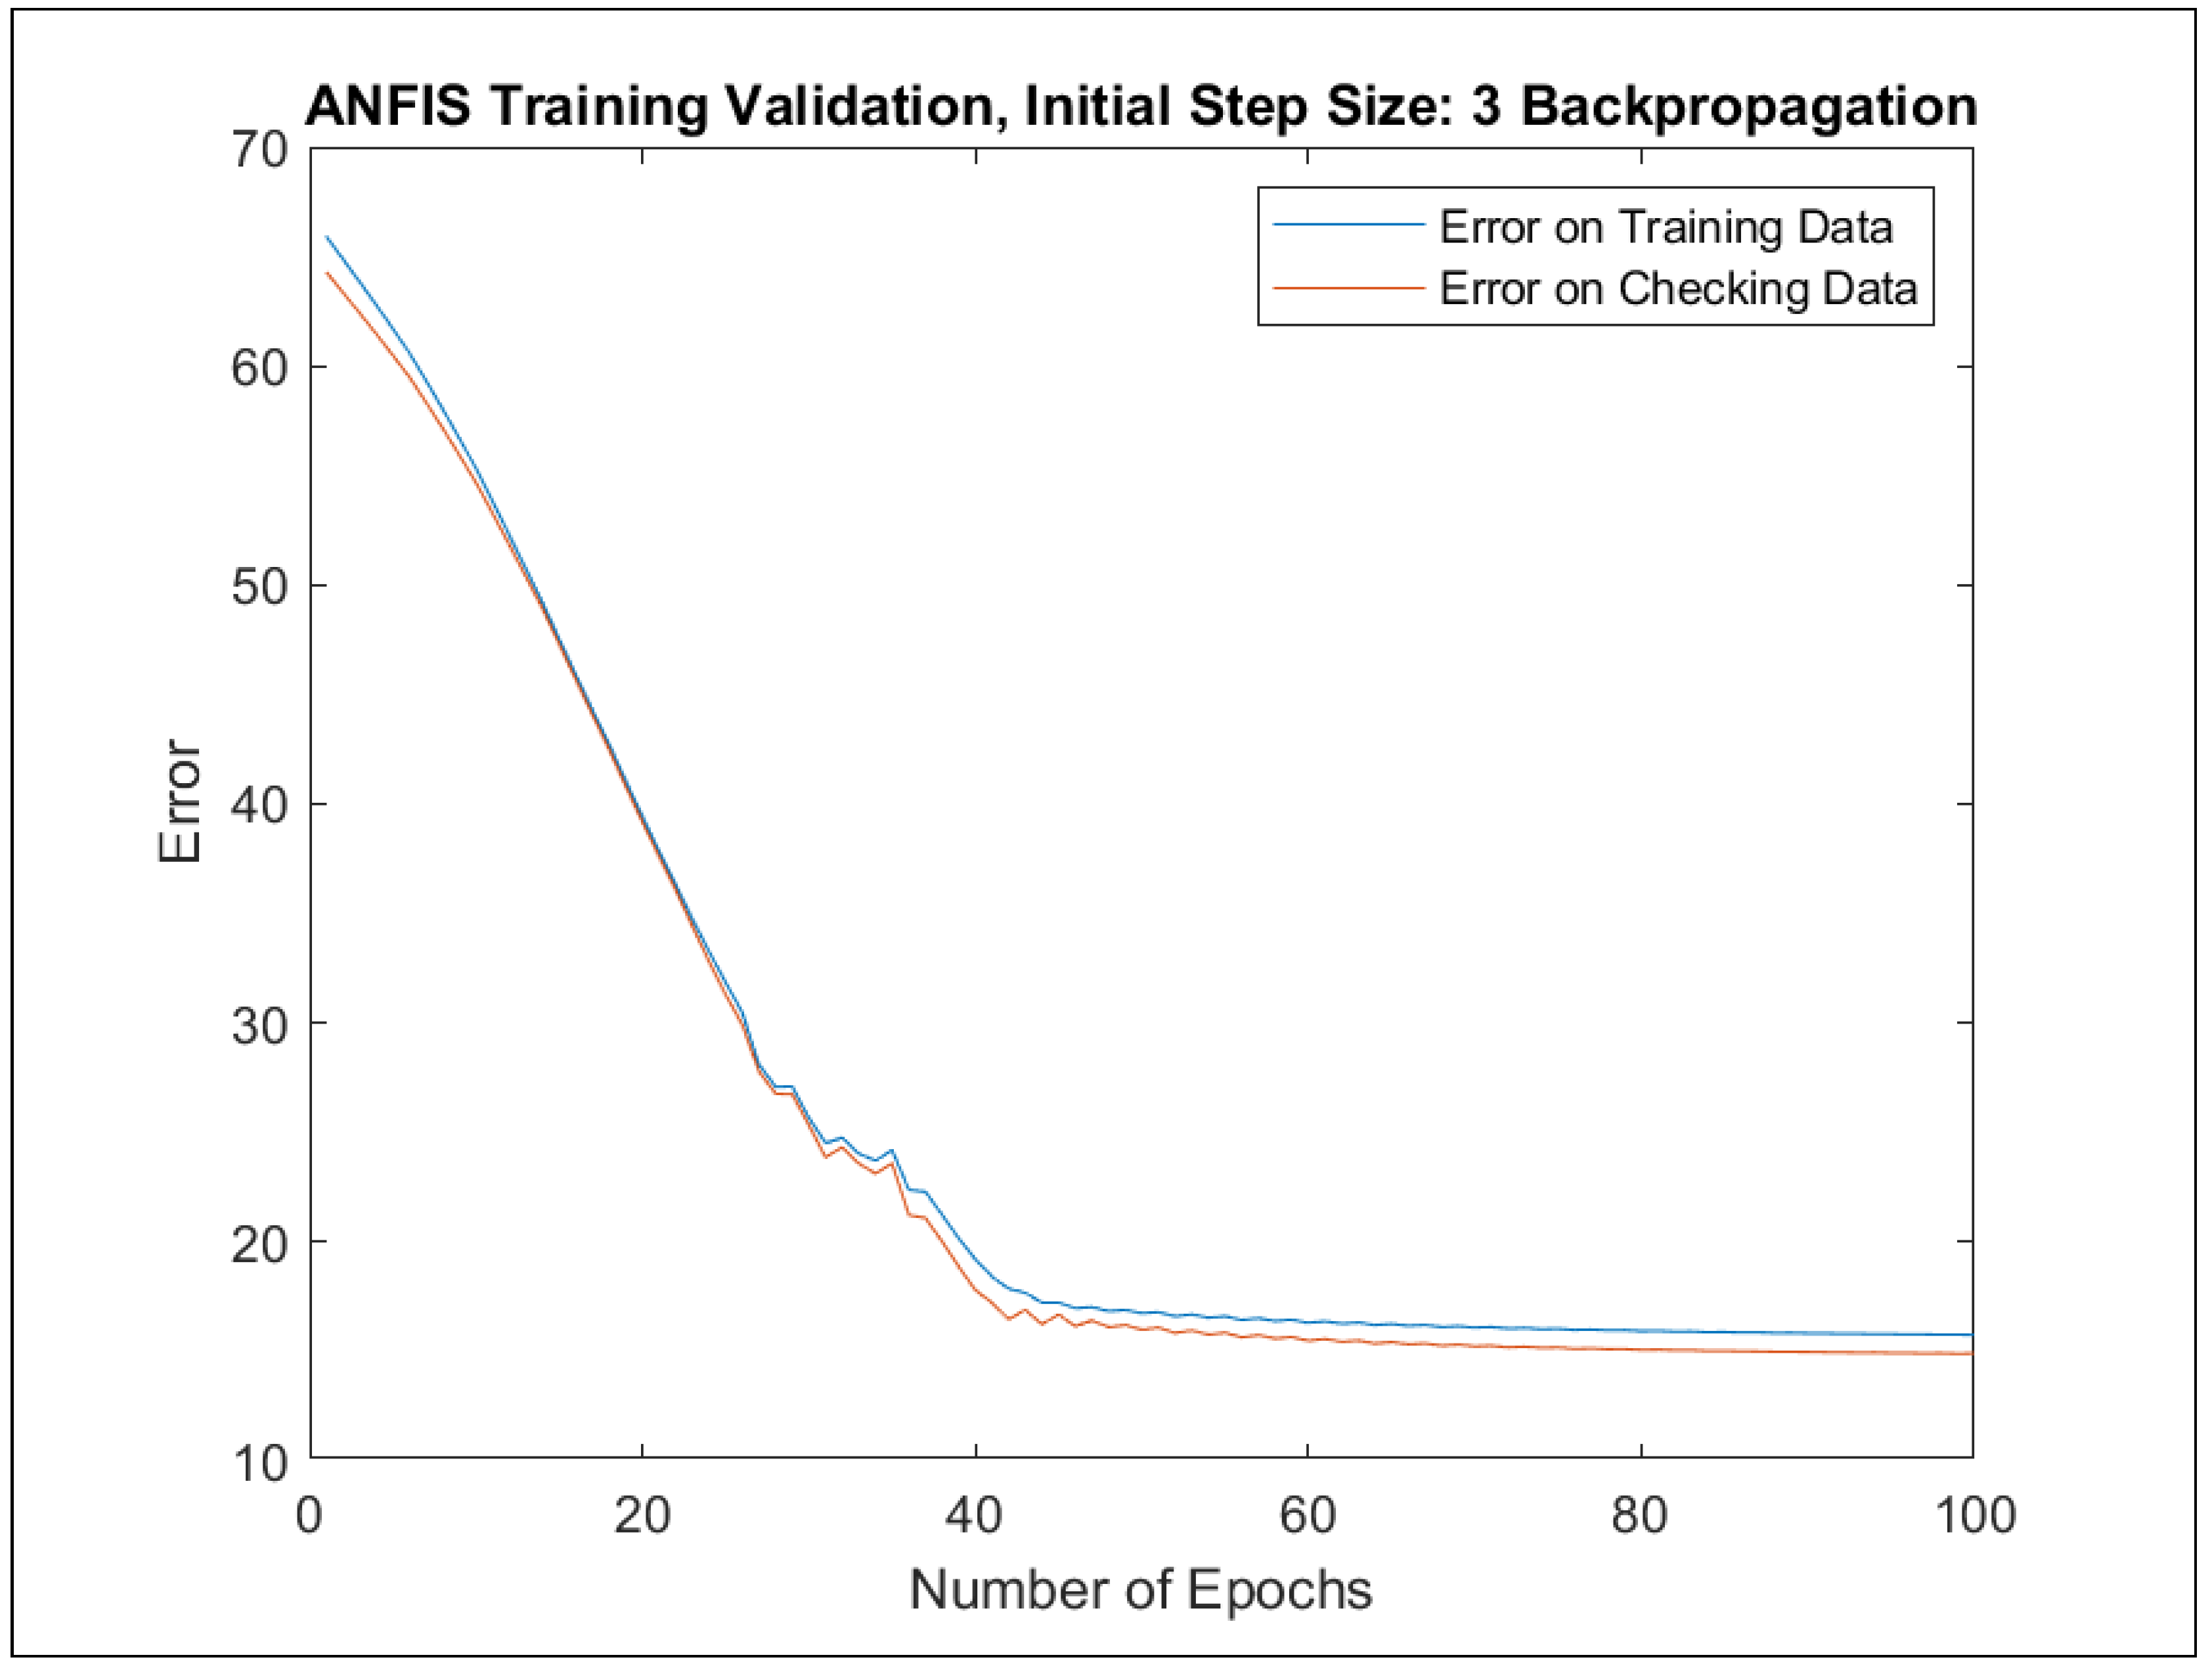
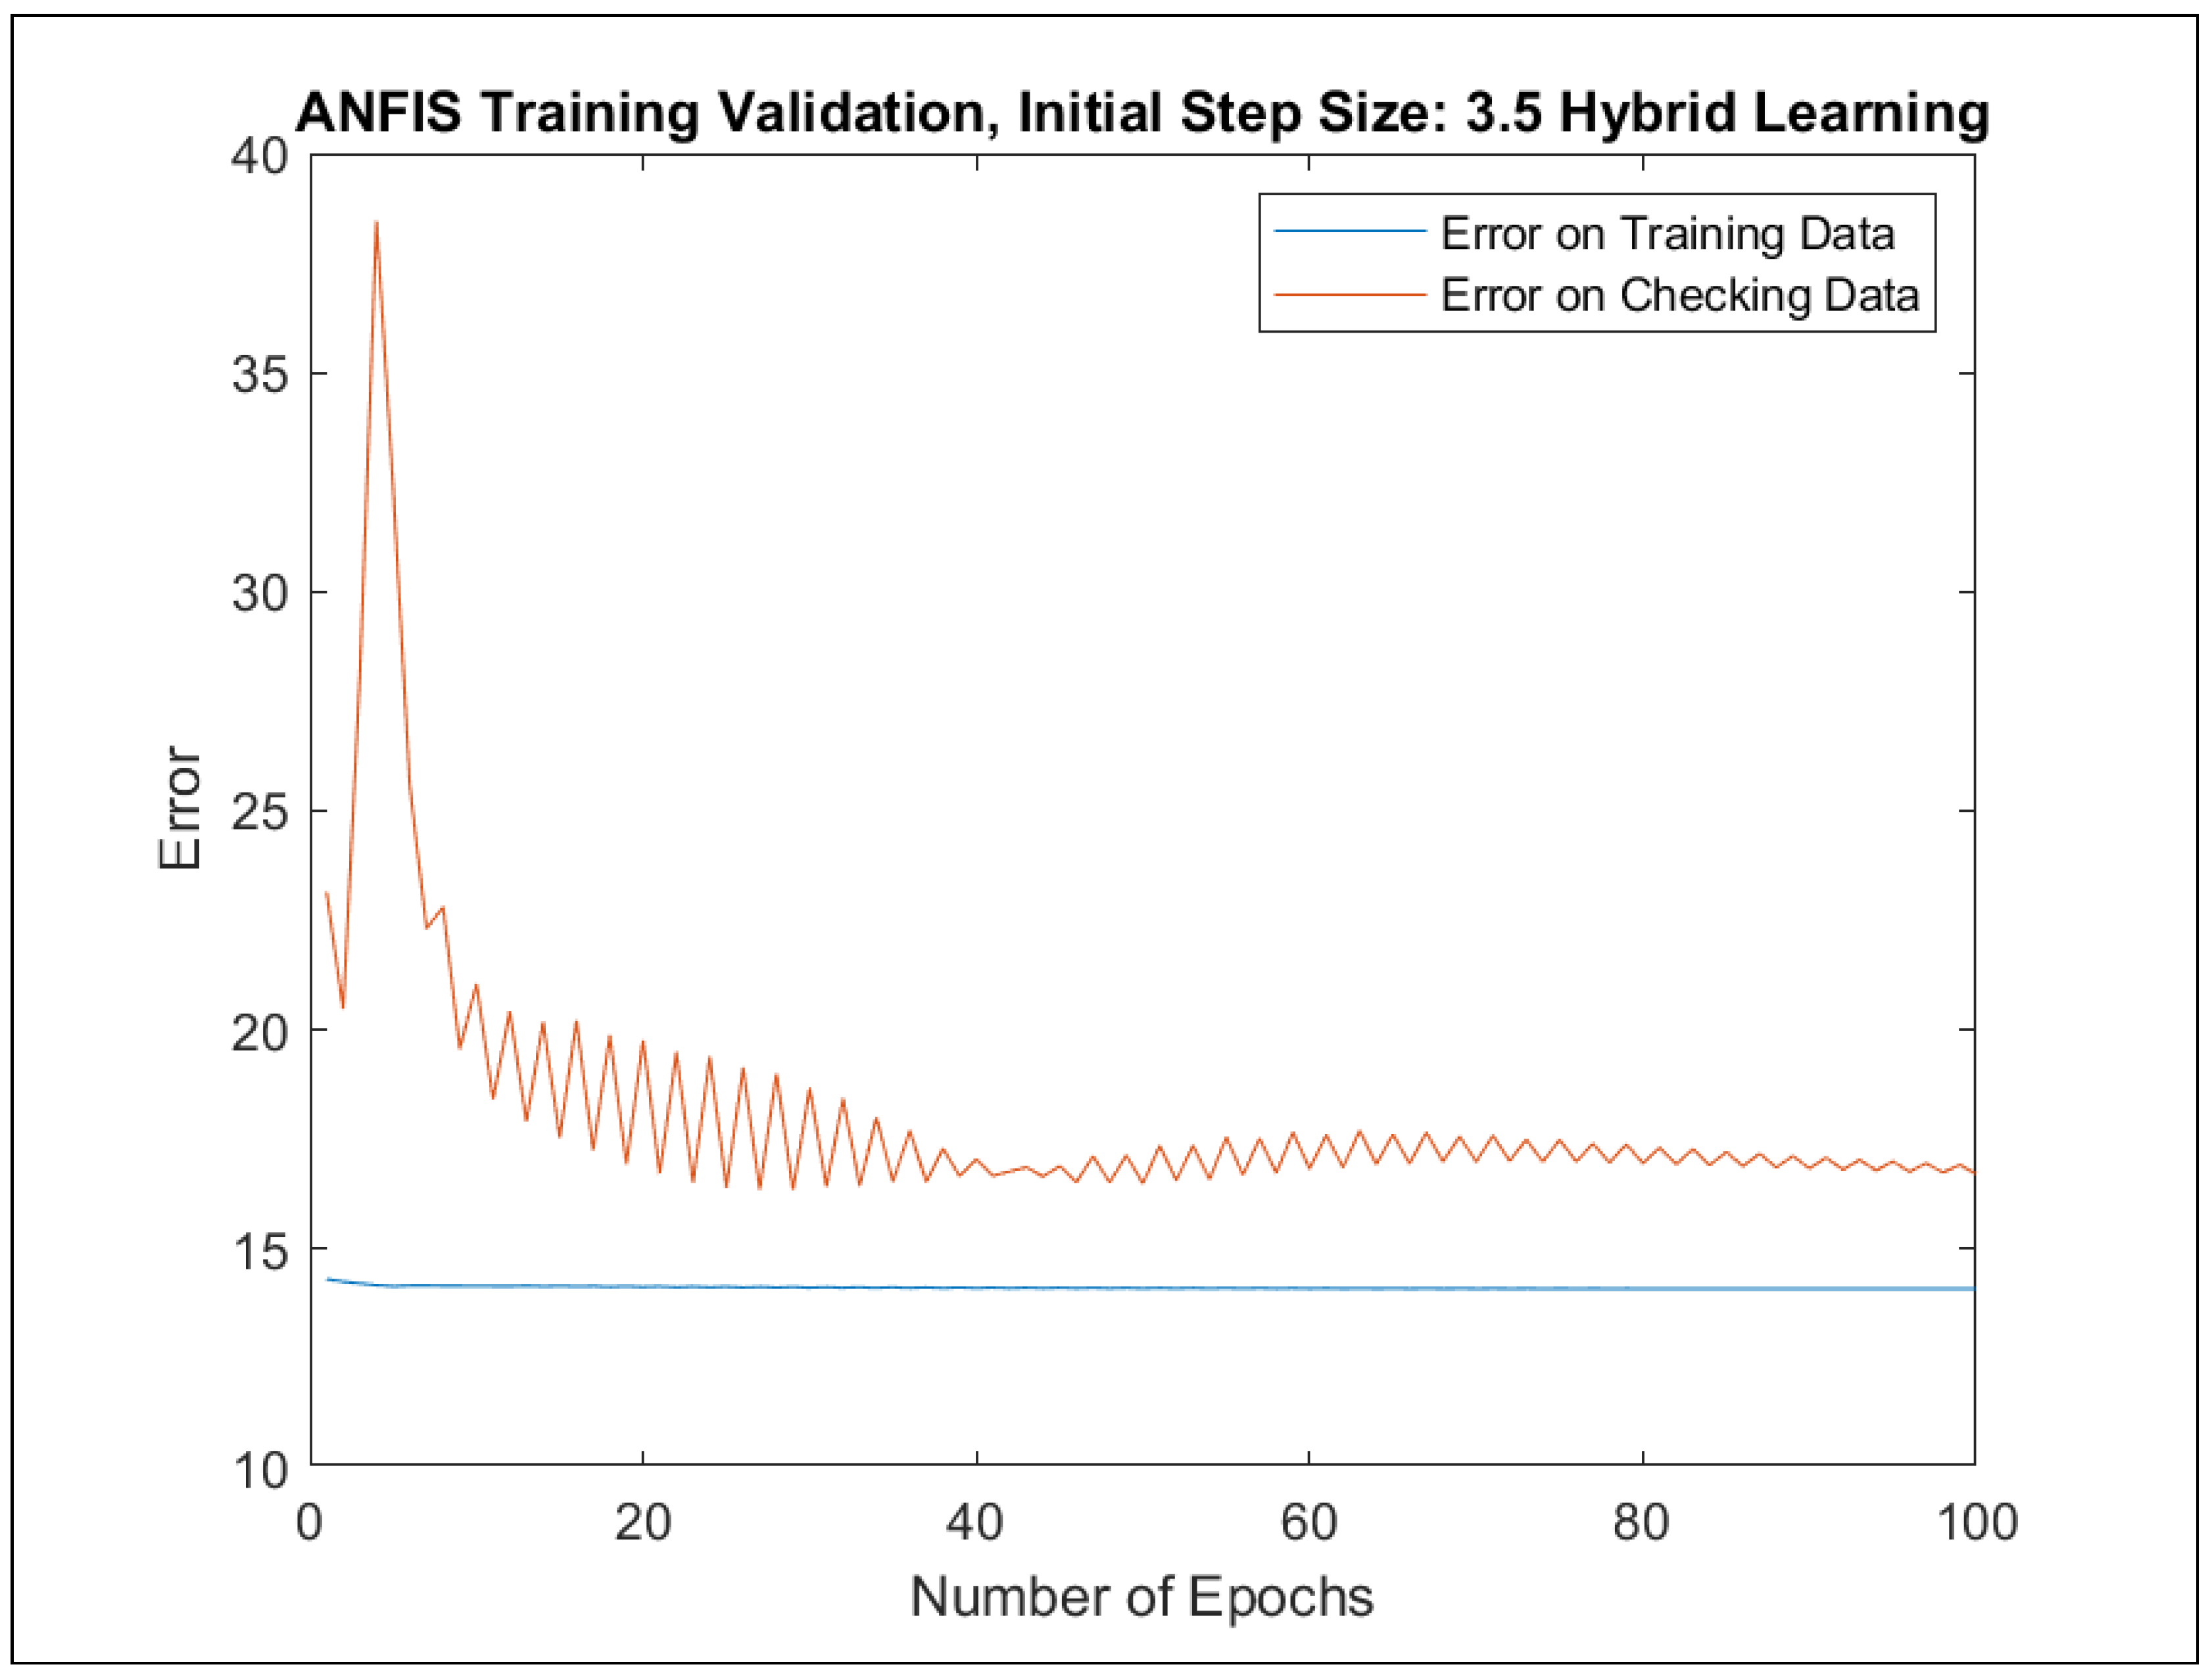
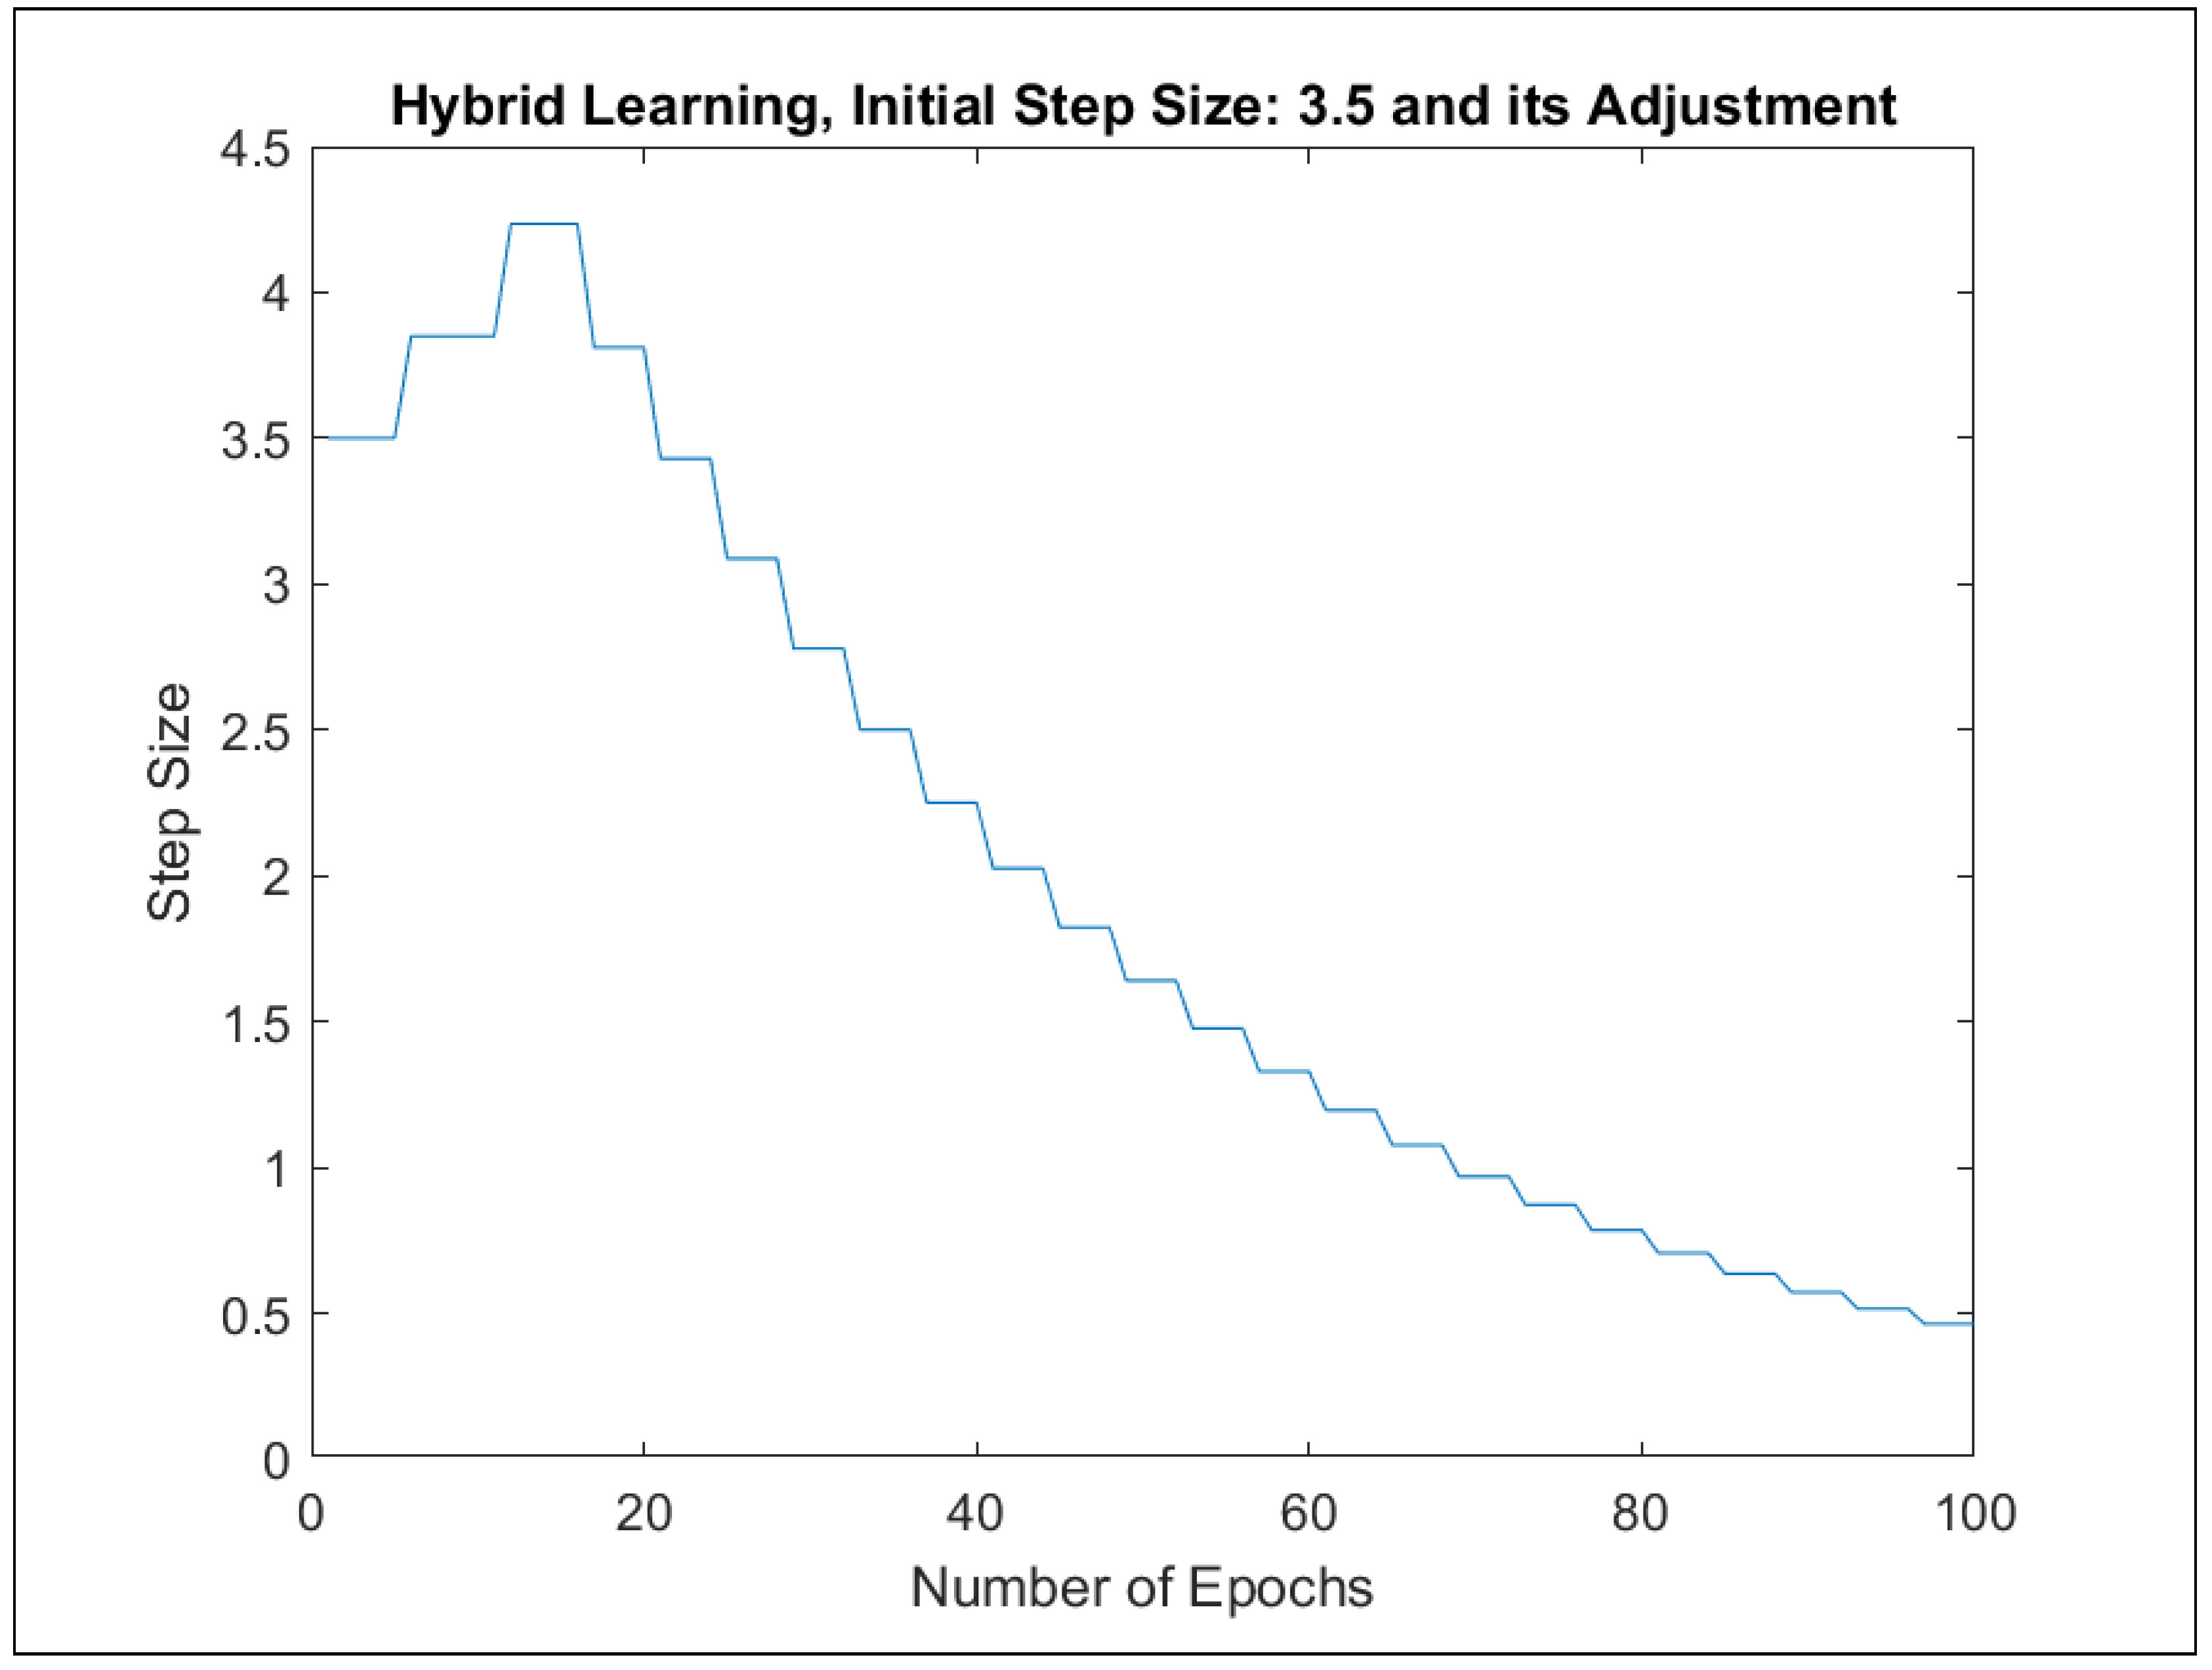
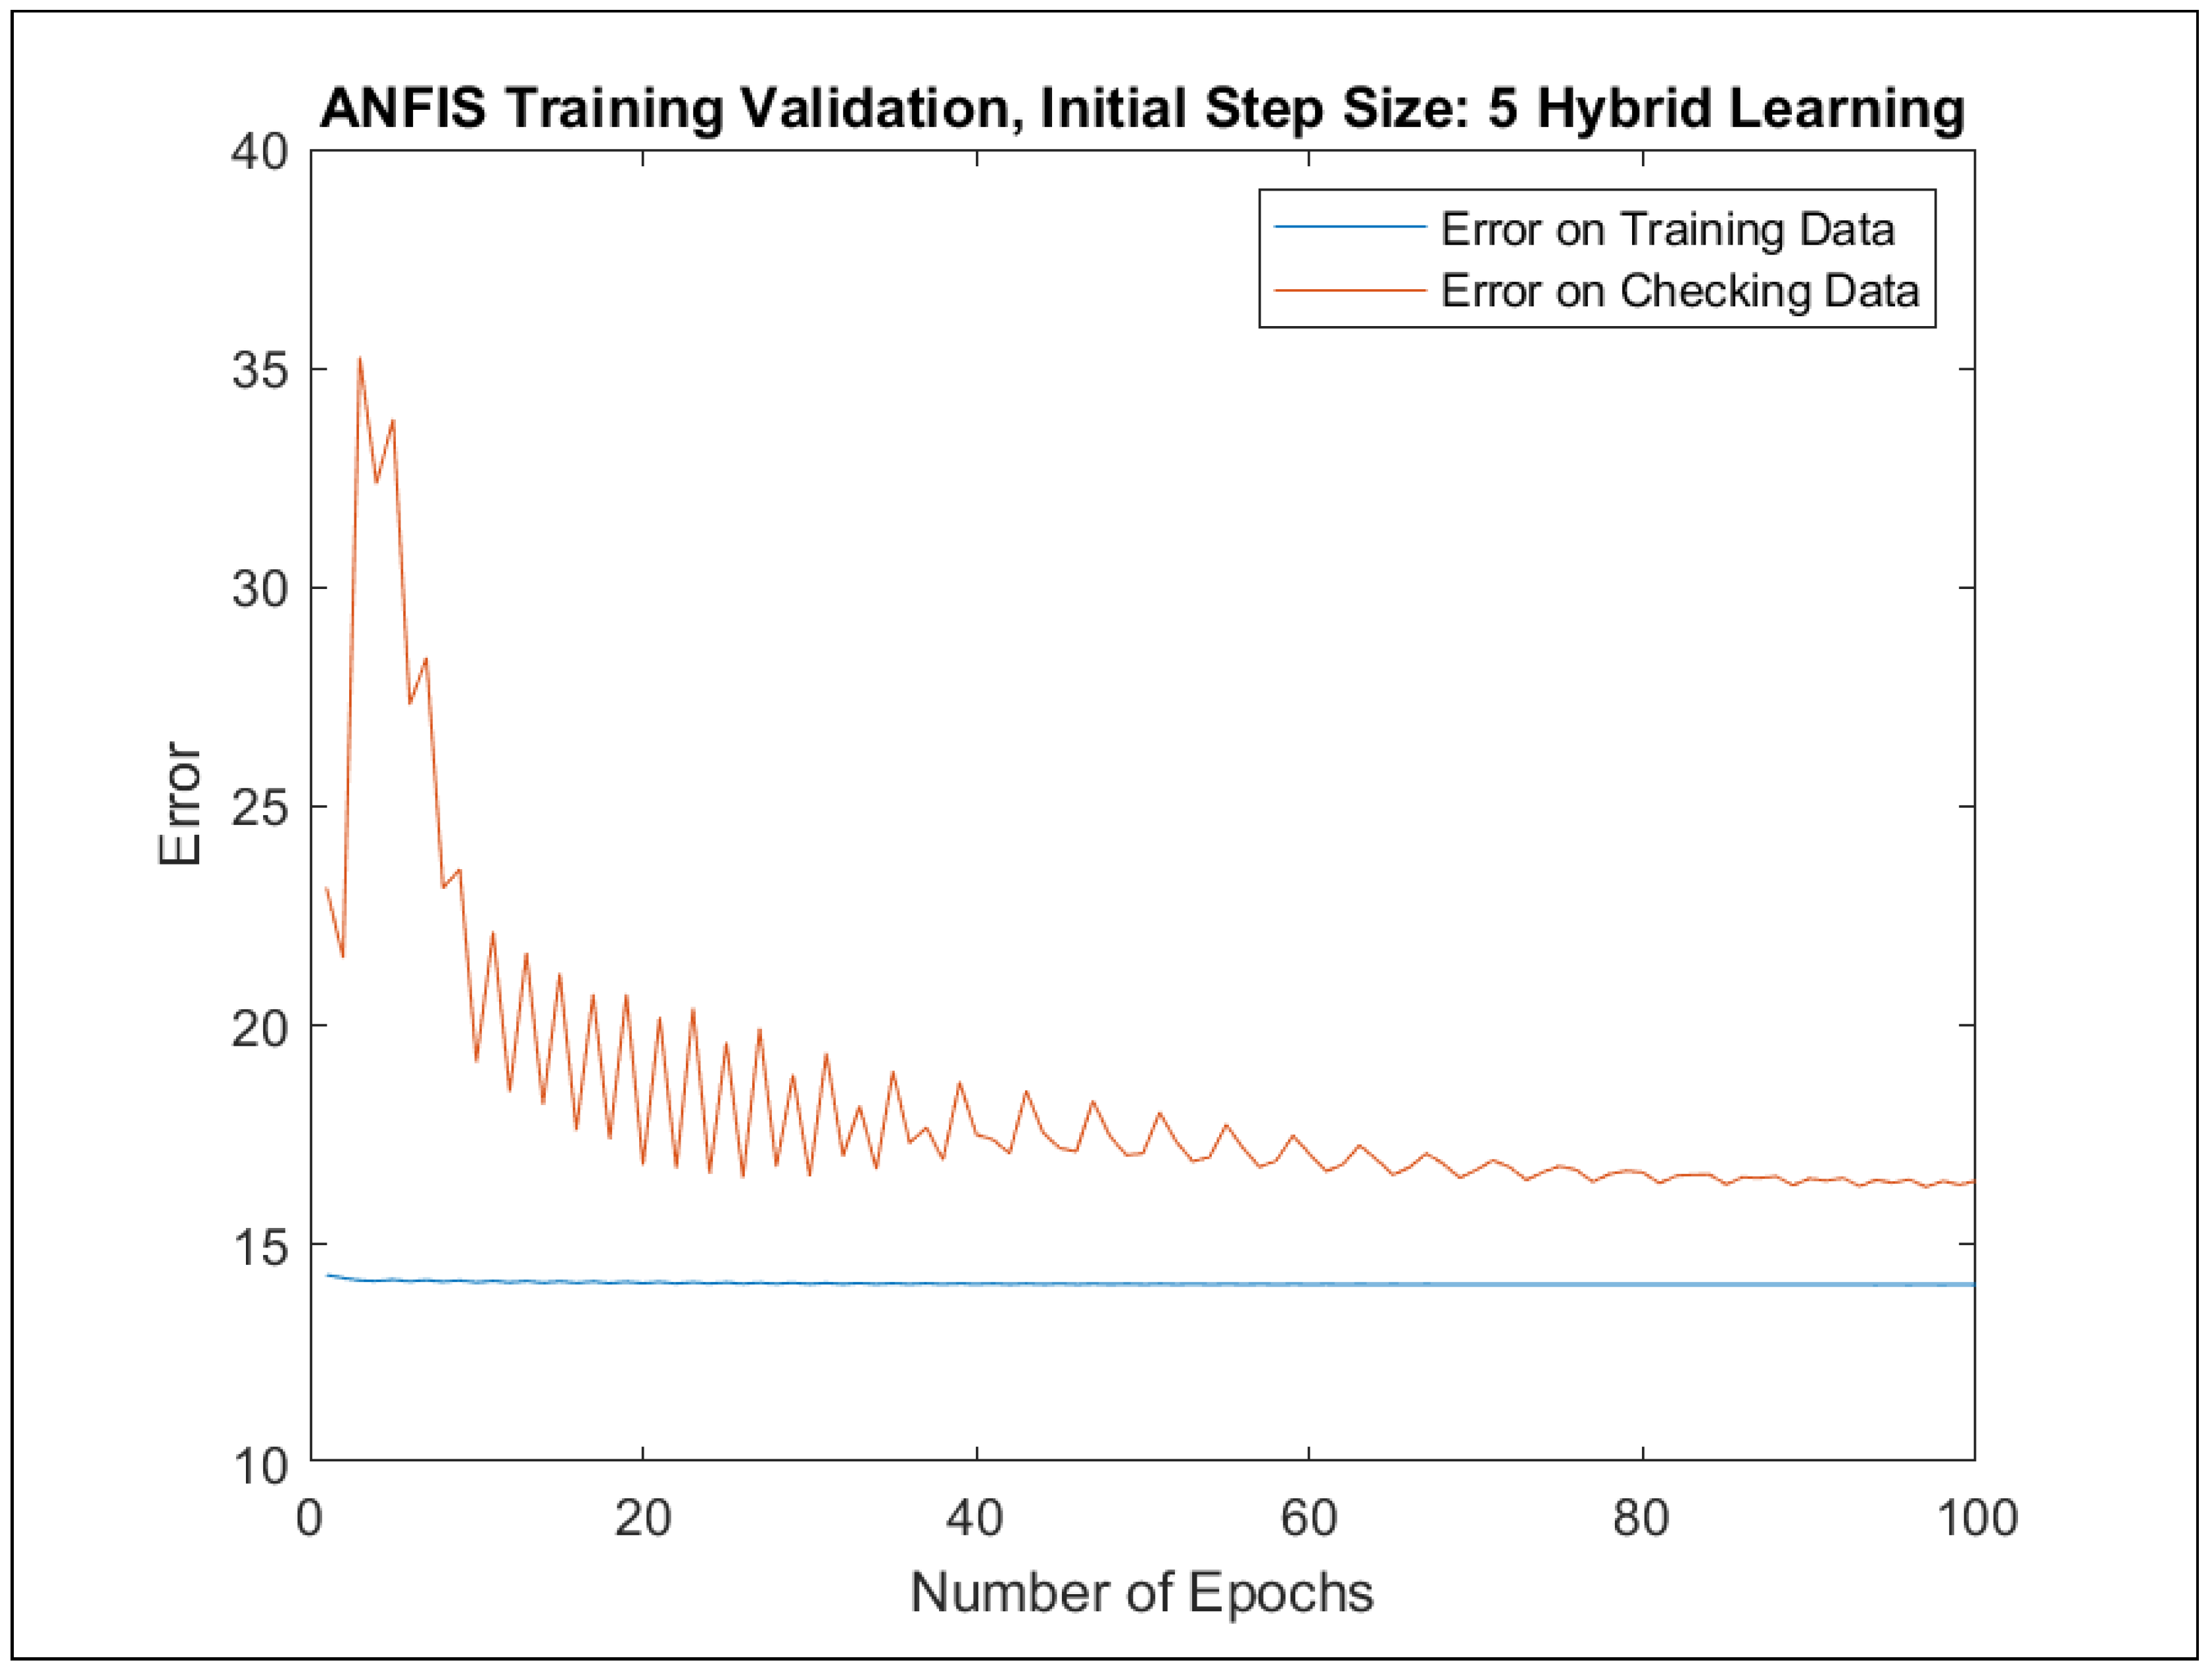
Table A1.
Best RMSE Errors for the Training Data.
| Limit: 1 Rule | Limit: 3 Rules | Limit: 5 Rules | Limit: 8 Rules | Limit: 12 Rules | Limit: 16 Rules | Limit: 20 Rules | Limit: 40 Rules | Limit: 80 Rules | Limit: 160 Rules | |
|---|---|---|---|---|---|---|---|---|---|---|
| RMSE | 30.59485 | 19.56332 | 16.78509 | 15.39203 | 15.56531 | 15.67844 | 15.58645 | 15.34062 | 15.43388 | 15.99222 |
| MAE | 26.16265 | 15.88731 | 12.31566 | 11.08484 | 11.32251 | 11.31696 | 11.08999 | 11.08607 | 10.99209 | 11.69641 |
| Min. Error | 0 | 0 | 0.00007 | 0.000461 | 0.003325 | 0.025736 | 0.000437 | 0.007998 | 0.007301 | 0.010426 |
| Max. Error | 50 | 74.97749 | 66.16576 | 55.69301 | 55.70125 | 50.522 | 63.85966 | 55.72273 | 55.05721 | 55.02147 |
Figure A19.
Depiction of the Best RMSE Errors for the Checking Data.

Table A2.
Best RMSE Errors for the Checking Data.
| Limit: 1 Rule | Limit: 3 Rules | Limit: 5 Rules | Limit: 8 Rules | Limit: 12 Rules | Limit: 16 Rules | Limit: 20 Rules | Limit: 40 Rules | Limit: 80 Rules | Limit: 160 Rules | |
|---|---|---|---|---|---|---|---|---|---|---|
| RMSE | 30.23458 | 19.79506 | 15.93676 | 15.46742 | 15.58643 | 15.39114 | 15.39485 | 15.23949 | 15.32682 | 16.07228 |
| MAE | 25.92113 | 15.74546 | 11.78425 | 11.01338 | 11.08251 | 11.37357 | 11.27761 | 11.14186 | 10.90988 | 11.8917 |
| Min. Error | 0 | 0 | 0.00001 | 0.000461 | 0.014746 | 0.011548 | 0.011135 | 0.007144 | 0.007301 | 0.010426 |
| Max. Error | 50 | 74.97749 | 50.50592 | 51.03276 | 51.03274 | 51.01228 | 51.05456 | 56.15333 | 50.05721 | 50.49569 |
Appendix C. Extracted Rule Sets and Model Performance
This section contains the extracted rule sets in the course of run suite 2 according to the upper bounds for the maximal number of the linguistic rules specified for the algorithm. Each extracted rule set represents a distinct model. In addition, the charts are also presented that show the performance of each model on the checking and the corresponding training data. The original data are sorted to ensure that the deviations from the desired targets are easy to observe.
Appendix C.1. Maximal Number of Linguistic Rules: 1
- 1.
- If (Legibility is good) and (Security is medium) then (Quality is medium)
Figure A20.
Evaluation of the Best-Performing Single-Rule Model with Regard to Maximum Error for Checking Data.
Figure A20.
Evaluation of the Best-Performing Single-Rule Model with Regard to Maximum Error for Checking Data.

Figure A21.
Evaluation of the Best-Performing Single-Rule Model with Regard to RMSE Error for Checking Data.
Figure A21.
Evaluation of the Best-Performing Single-Rule Model with Regard to RMSE Error for Checking Data.

Figure A22.
Evaluation of the Best-Performing Single-Rule Model with Regard to Maximum Error for Training Data.
Figure A22.
Evaluation of the Best-Performing Single-Rule Model with Regard to Maximum Error for Training Data.

Figure A23.
Evaluation of the Best-Performing Single-Rule Model with Regard to RMSE Error for Training Data.
Figure A23.
Evaluation of the Best-Performing Single-Rule Model with Regard to RMSE Error for Training Data.

Appendix C.2. Maximal Number of Linguistic Rules: 3
- 1.
- If (Legibility is poor) and (DesignAndImplementation is medium) then (Quality is medium)
- 2.
- If (Accuracy is good) and (Legibility is medium) and (DesignAndImplementation is good) and (Security is medium) then (Quality is good)
- 3.
- If (Accuracy is poor) and (Security is poor) then (Quality is poor)
Figure A24.
Evaluation of the Best-Performing Three-Rule Model with Regard to Maximum Error for Checking Data.
Figure A24.
Evaluation of the Best-Performing Three-Rule Model with Regard to Maximum Error for Checking Data.

Figure A25.
Evaluation of the Best-Performing Three-Rule Model with Regard to RMSE Error for Checking Data.
Figure A25.
Evaluation of the Best-Performing Three-Rule Model with Regard to RMSE Error for Checking Data.

Figure A26.
Evaluation of the Best-Performing Three-Rule Model with Regard to Maximum Error for Training Data.
Figure A26.
Evaluation of the Best-Performing Three-Rule Model with Regard to Maximum Error for Training Data.

Figure A27.
Evaluation of the Best-Performing Three-Rule Model with Regard to RMSE Error for Checking Data.
Figure A27.
Evaluation of the Best-Performing Three-Rule Model with Regard to RMSE Error for Checking Data.

Appendix C.3. Maximal Number of Linguistic Rules: 5
- 1.
- If (Legibility is poor) and (DesignAndImplementation is good) and (Security is medium) then (Quality is medium)
- 2.
- If (Accuracy is poor) and (Legibility is good) and (DesignAndImplementation is good) and (Security is good) then (Quality is poor)
- 3.
- If (Accuracy is medium) and (Legibility is good) and (DesignAndImplementation is medium) then (Quality is medium)
- 4.
- If (Accuracy is medium) and (Legibility is good) and (DesignAndImplementation is good) and (Security is good) then (Quality is very good)
- 5.
- If (Accuracy is poor) and (Legibility is medium) and (DesignAndImplementation is poor) then (Quality is poor)
Figure A28.
Evaluation of the Best-Performing Five-Rule Model with Regard to Maximum Error for Checking Data.
Figure A28.
Evaluation of the Best-Performing Five-Rule Model with Regard to Maximum Error for Checking Data.

Figure A29.
Evaluation of the Best-Performing Five-Rule Model with Regard to RMSE Error for Checking Data.
Figure A29.
Evaluation of the Best-Performing Five-Rule Model with Regard to RMSE Error for Checking Data.

Figure A30.
Evaluation of the Best-Performing Five-Rule Model with Regard to Maximum Error for Training Data.
Figure A30.
Evaluation of the Best-Performing Five-Rule Model with Regard to Maximum Error for Training Data.

Figure A31.
Evaluation of the Best-Performing Five-Rule Model with Regard to RMSE Error for Training Data.
Figure A31.
Evaluation of the Best-Performing Five-Rule Model with Regard to RMSE Error for Training Data.

Appendix C.4. Maximal Number of Linguistic Rules: 8
- 1.
- If (Accuracy is medium) and (Legibility is good) and (DesignAndImplementation is good) and (Security is poor) then (Quality is medium)
- 2.
- If (Accuracy is good) and (Legibility is good) and (DesignAndImplementation is medium) and (Security is medium) then (Quality is very good)
- 3.
- If (Accuracy is poor) and (Legibility is medium) then (Quality is poor)
- 4.
- If (Accuracy is good) and (Legibility is good) and (DesignAndImplementation is poor) then (Quality is medium)
- 5.
- If (Accuracy is medium) and (Legibility is good) and (DesignAndImplementation is medium) and (Security is poor) then (Quality is poor)
- 6.
- If (Legibility is poor) and (DesignAndImplementation is poor) and (Security is poor) then (Quality is very poor)
- 7.
- If (Accuracy is medium) and (Legibility is good) and (DesignAndImplementation is medium) and (Security is medium) then (Quality is good)
- 8.
- If (Accuracy is medium) and (Legibility is medium) and (DesignAndImplementation is medium) then (Quality is medium)
Figure A32.
Evaluation of the Best-Performing Eight-Rule Model with Regard to Maximum Error for Checking Data.
Figure A32.
Evaluation of the Best-Performing Eight-Rule Model with Regard to Maximum Error for Checking Data.

Figure A33.
Evaluation of the Best-Performing Eight-Rule Model with Regard to RMSE Error for Checking Data.
Figure A33.
Evaluation of the Best-Performing Eight-Rule Model with Regard to RMSE Error for Checking Data.

Figure A34.
Evaluation of the Best-Performing Eight-Rule Model with Regard to Maximum Error for Training Data.
Figure A34.
Evaluation of the Best-Performing Eight-Rule Model with Regard to Maximum Error for Training Data.

Figure A35.
Evaluation of the Best-Performing Eight-Rule Model with Regard to RMSE Error for Training Data.
Figure A35.
Evaluation of the Best-Performing Eight-Rule Model with Regard to RMSE Error for Training Data.

Appendix C.5. Maximal Number of Linguistic Rules: 12
- 1.
- If (Accuracy is poor) and (Legibility is poor) and (DesignAndImplementation is poor) and (Security is poor) then (Quality is very poor)
- 2.
- If (Accuracy is medium) and (Legibility is medium) and (DesignAndImplementation is good) and (Security is poor) then (Quality is medium)
- 3.
- If (Accuracy is poor) and (Legibility is poor) and (Security is medium) then (Quality is poor)
- 4.
- If (Accuracy is medium) and (Legibility is medium) and (DesignAndImplementation is medium) and (Security is medium) then (Quality is medium)
- 5.
- If (Accuracy is medium) and (Legibility is poor) and (DesignAndImplementation is good) and (Security is poor) then (Quality is very poor)
- 6.
- If (Accuracy is poor) and (Legibility is good) and (DesignAndImplementation is good) and (Security is good) then (Quality is poor)
- 7.
- If (Legibility is poor) and (DesignAndImplementation is medium) and (Security is medium) then (Quality is poor)
- 8.
- If (Accuracy is medium) and (Legibility is poor) and (DesignAndImplementation is poor) and (Security is medium) then (Quality is poor)
- 9.
- If (Accuracy is medium) and (Legibility is medium) and (DesignAndImplementation is good) and (Security is medium) then (Quality is very good)
- 10.
- If (Accuracy is medium) and (Legibility is medium) and (DesignAndImplementation is poor) and (Security is medium) then (Quality is poor)
- 11.
- If (Accuracy is good) and (Legibility is medium) and (DesignAndImplementation is poor) and (Security is medium) then (Quality is medium)
- 12.
- If (Accuracy is medium) and (Legibility is poor) and (Security is medium) then (Quality is good)
Figure A36.
Evaluation of the Best-Performing 12-Rule Model with Regard to Maximum Error for Checking Data.
Figure A36.
Evaluation of the Best-Performing 12-Rule Model with Regard to Maximum Error for Checking Data.

Figure A37.
Evaluation of the Best-Performing 12-Rule Model with Regard to RMSE Error for Checking Data.
Figure A37.
Evaluation of the Best-Performing 12-Rule Model with Regard to RMSE Error for Checking Data.

Figure A38.
Evaluation of the Best-Performing 12-Rule Model with Regard to Maximum Error for Training Data.
Figure A38.
Evaluation of the Best-Performing 12-Rule Model with Regard to Maximum Error for Training Data.

Figure A39.
Evaluation of the Best-Performing 12-Rule Model with Regard to RSME Error for Training Data.
Figure A39.
Evaluation of the Best-Performing 12-Rule Model with Regard to RSME Error for Training Data.

Appendix C.6. Maximal Number of Linguistic Rules: 16
- 1.
- If (Legibility is good) and (DesignAndImplementation is medium) and (Security is poor) then (Quality is good)
- 2.
- If (Accuracy is poor) and (Legibility is good) and (DesignAndImplementation is poor) and (Security is good) then (Quality is good)
- 3.
- If (Accuracy is medium) and (Legibility is good) and (DesignAndImplementation is poor) and (Security is poor) then (Quality is very poor)
- 4.
- If (Accuracy is poor) and (Legibility is medium) and (DesignAndImplementation is medium) and (Security is medium) then (Quality is poor)
- 5.
- If (Accuracy is medium) and (Legibility is medium) and (DesignAndImplementation is medium) and (Security is medium) then (Quality is medium)
- 6.
- If (Accuracy is good) and (Legibility is medium) and (DesignAndImplementation is good) and (Security is medium) then (Quality is very good)
- 7.
- If (Accuracy is good) and (Legibility is medium) and (DesignAndImplementation is good) and (Security is poor) then (Quality is poor)
- 8.
- If (Legibility is poor) and (DesignAndImplementation is good) and (Security is medium) then (Quality is medium)
- 9.
- If (Legibility is poor) and (DesignAndImplementation is medium) and (Security is good) then (Quality is medium)
- 10.
- If (Accuracy is good) and (Legibility is good) and (DesignAndImplementation is poor) and (Security is medium) then (Quality is good)
- 11.
- If (Accuracy is good) and (Legibility is medium) and (Security is medium) then (Quality is good)
- 12.
- If (Accuracy is poor) and (DesignAndImplementation is poor) and (Security is poor) then (Quality is very poor)
- 13.
- If (Accuracy is medium) and (Legibility is good) and (DesignAndImplementation is poor) and (Security is medium) then (Quality is very poor)
- 14.
- If (Accuracy is poor) and (Legibility is poor) and (Security is good) then (Quality is very poor)
- 15.
- If (Accuracy is poor) and (Legibility is poor) and (DesignAndImplementation is good) and (Security is medium) then (Quality is medium)
- 16.
- If (Accuracy is good) and (Legibility is medium) and (DesignAndImplementation is poor) then (Quality is poor)
Figure A40.
Evaluation of the Best-Performing 16-Rule Model with Regard to Maximum Error for Checking Data.
Figure A40.
Evaluation of the Best-Performing 16-Rule Model with Regard to Maximum Error for Checking Data.

Figure A41.
Evaluation of the Best-Performing 16-Rule Model with Regard to RMSE Error for Checking Data.
Figure A41.
Evaluation of the Best-Performing 16-Rule Model with Regard to RMSE Error for Checking Data.

Figure A42.
Evaluation of the Best-Performing 16-Rule Model with Regard to Maximum Error for Training Data.
Figure A42.
Evaluation of the Best-Performing 16-Rule Model with Regard to Maximum Error for Training Data.

Figure A43.
Evaluation of the Best-Performing 16-Rule Model with Regard to RMSE Error for Training Data.
Figure A43.
Evaluation of the Best-Performing 16-Rule Model with Regard to RMSE Error for Training Data.

Appendix C.7. Maximal Number of Linguistic Rules: 20
- 1.
- If (Accuracy is good) and (DesignAndImplementation is poor) and (Security is medium) then (Quality is medium)
- 2.
- If (Legibility is poor) and (DesignAndImplementation is good) then (Quality is medium)
- 3.
- If (Accuracy is medium) and (Legibility is good) and (DesignAndImplementation is medium) and (Security is good) then (Quality is good)
- 4.
- If (Accuracy is poor) and (Legibility is poor) and (DesignAndImplementation is good) and (Security is poor) then (Quality is good)
- 5.
- If (Accuracy is medium) and (Legibility is medium) and (DesignAndImplementation is medium) and (Security is medium) then (Quality is medium)
- 6.
- If (Accuracy is medium) and (Legibility is medium) and (DesignAndImplementation is good) then (Quality is good)
- 7.
- If (Accuracy is good) and (Legibility is medium) and (DesignAndImplementation is poor) and (Security is medium) then (Quality is poor)
- 8.
- If (DesignAndImplementation is poor) and (Security is poor) then (Quality is poor)
- 9.
- If (Accuracy is medium) and (DesignAndImplementation is poor) and (Security is medium) then (Quality is medium)
- 10.
- If (Accuracy is poor) and (Legibility is poor) and (Security is poor) then (Quality is very poor)
- 11.
- If (Accuracy is poor) and (DesignAndImplementation is good) and (Security is medium) then (Quality is very poor)
- 12.
- If (Accuracy is poor) and (Legibility is medium) and (DesignAndImplementation is poor) then (Quality is good)
- 13.
- If (Accuracy is good) and (Legibility is medium) and (DesignAndImplementation is medium) and (Security is poor) then (Quality is good)
- 14.
- If (Accuracy is poor) and (Legibility is medium) and (DesignAndImplementation is good) and (Security is good) then (Quality is medium)
- 15.
- If (Accuracy is poor) and (DesignAndImplementation is poor) then (Quality is very poor)
- 16.
- If (Accuracy is poor) and (Legibility is poor) and (DesignAndImplementation is good) and (Security is medium) then (Quality is good)
- 17.
- If (Accuracy is good) and (Legibility is good) and (DesignAndImplementation is good) and (Security is medium) then (Quality is very good)
- 18.
- If (Accuracy is medium) and (Legibility is poor) and (DesignAndImplementation is good) and (Security is poor) then (Quality is poor)
- 19.
- If (Accuracy is good) and (Legibility is good) and (DesignAndImplementation is good) and (Security is poor) then (Quality is medium)
Figure A44.
Evaluation of the Best-Performing Model with Regard to Maximum Error for Checking Data, with Upper Bound of 20 Rules.
Figure A44.
Evaluation of the Best-Performing Model with Regard to Maximum Error for Checking Data, with Upper Bound of 20 Rules.

Figure A45.
Evaluation of the Best-Performing Model with Regard to RMSE Error for Checking Data, with Upper Bound of 20 Rules.
Figure A45.
Evaluation of the Best-Performing Model with Regard to RMSE Error for Checking Data, with Upper Bound of 20 Rules.

Figure A46.
Evaluation of the Best-Performing Model with Regard to Maximum Error for Training Data, with Upper Bound of 20 Rules.
Figure A46.
Evaluation of the Best-Performing Model with Regard to Maximum Error for Training Data, with Upper Bound of 20 Rules.

Figure A47.
Evaluation of the Best-Performing Model with Regard to RMSE Error for Training Data, with Upper Bound of 20 Rules.
Figure A47.
Evaluation of the Best-Performing Model with Regard to RMSE Error for Training Data, with Upper Bound of 20 Rules.

Appendix C.8. Maximal Number of Linguistic Rules: 40
- 1.
- If (Accuracy is poor) and (Security is poor) then (Quality is very poor)
- 2.
- If (Legibility is good) and (DesignAndImplementation is medium) and (Security is medium) then (Quality is good)
- 3.
- If (Accuracy is good) and (DesignAndImplementation is medium) and (Security is poor) then (Quality is poor)
- 4.
- If (Legibility is poor) and (DesignAndImplementation is good) and (Security is poor) then (Quality is very poor)
- 5.
- If (Accuracy is poor) and (Legibility is poor) and (DesignAndImplementation is medium) and (Security is poor) then (Quality is good)
- 6.
- If (Accuracy is medium) and (Legibility is poor) and (DesignAndImplementation is medium) and (Security is good) then (Quality is good)
- 7.
- If (Accuracy is poor) and (Legibility is medium) and (DesignAndImplementation is good) and (Security is poor) then (Quality is poor)
- 8.
- If (Accuracy is poor) and (Legibility is good) and (DesignAndImplementation is poor) and (Security is medium) then (Quality is good)
- 9.
- If (Accuracy is good) and (Legibility is poor) and (DesignAndImplementation is medium) and (Security is medium) then (Quality is very good)
- 10.
- If (Accuracy is poor) and (Legibility is poor) and (DesignAndImplementation is good) and (Security is poor) then (Quality is very good)
- 11.
- If (Accuracy is medium) and (DesignAndImplementation is medium) and (Security is good) then (Quality is medium)
- 12.
- If (Accuracy is poor) and (Legibility is good) and (DesignAndImplementation is medium) then (Quality is medium)
- 13.
- If (Accuracy is poor) and (Legibility is poor) and (DesignAndImplementation is medium) and (Security is medium) then (Quality is poor)
- 14.
- If (Accuracy is medium) and (Legibility is medium) and (DesignAndImplementation is poor) then (Quality is medium)
- 15.
- If (Accuracy is good) and (Legibility is good) and (DesignAndImplementation is poor) and (Security is poor) then (Quality is good)
- 16.
- If (Accuracy is good) and (Legibility is medium) and (DesignAndImplementation is poor) and (Security is poor) then (Quality is good)
- 17.
- If (Accuracy is poor) and (Legibility is good) and (DesignAndImplementation is good) and (Security is good) then (Quality is poor)
- 18.
- If (Accuracy is medium) and (Legibility is good) and (DesignAndImplementation is poor) and (Security is medium) then (Quality is medium)
- 19.
- If (Accuracy is poor) and (Legibility is medium) and (DesignAndImplementation is medium) and (Security is medium) then (Quality is good)
- 20.
- If (Accuracy is medium) and (Legibility is good) and (Security is good) then (Quality is very good)
- 21.
- If (Accuracy is medium) and (Legibility is poor) then (Quality is medium)
- 22.
- If (Legibility is poor) and (DesignAndImplementation is poor) and (Security is good) then (Quality is poor)
- 23.
- If (Accuracy is good) and (Legibility is good) and (DesignAndImplementation is poor) and (Security is medium) then (Quality is very poor)
- 24.
- If (Accuracy is medium) and (Legibility is poor) and (DesignAndImplementation is medium) and (Security is poor) then (Quality is very good)
- 25.
- If (Accuracy is medium) and (Legibility is good) then (Quality is good)
- 26.
- If (Accuracy is medium) and (DesignAndImplementation is medium) and (Security is poor) then (Quality is poor)
- 27.
- If (Accuracy is poor) and (Legibility is good) and (Security is good) then (Quality is very poor)
- 28.
- If (Accuracy is poor) and (Legibility is medium) and (DesignAndImplementation is poor) then (Quality is poor)
- 29.
- If (Legibility is poor) and (Security is poor) then (Quality is very poor)
- 30.
- If (Accuracy is good) and (DesignAndImplementation is poor) and (Security is poor) then (Quality is medium)
- 31.
- If (Accuracy is medium) and (Legibility is good) and (DesignAndImplementation is poor) and (Security is good) then (Quality is good)
- 32.
- If (Accuracy is poor) and (Legibility is poor) and (Security is good) then (Quality is poor)
- 33.
- If (Accuracy is poor) and (Legibility is medium) and (DesignAndImplementation is poor) and (Security is poor) then (Quality is poor)
- 34.
- If (Accuracy is good) and (Legibility is medium) and (DesignAndImplementation is poor) and (Security is medium) then (Quality is medium)
- 35.
- If (DesignAndImplementation is poor) and (Security is medium) then (Quality is very poor)
- 36.
- If (Accuracy is good) and (DesignAndImplementation is poor) and (Security is medium) then (Quality is poor)
Figure A48.
Evaluation of the Best-Performing Model with Regard to Maximum Error for Checking Data, with Upper Bound of 40 Rules.
Figure A48.
Evaluation of the Best-Performing Model with Regard to Maximum Error for Checking Data, with Upper Bound of 40 Rules.

Figure A49.
Evaluation of the Best-Performing Model with Regard to RMSE Error for Checking Data, with Upper Bound of 40 Rules.
Figure A49.
Evaluation of the Best-Performing Model with Regard to RMSE Error for Checking Data, with Upper Bound of 40 Rules.

Figure A50.
Evaluation of the Best-Performing Model with Regard to Maximum Error for Training Data, with Upper Bound of 40 Rules.
Figure A50.
Evaluation of the Best-Performing Model with Regard to Maximum Error for Training Data, with Upper Bound of 40 Rules.

Figure A51.
Evaluation of the Best-Performing Model with Regard to RMSE Error for Training Data, with Upper Bound of 40 Rules.
Figure A51.
Evaluation of the Best-Performing Model with Regard to RMSE Error for Training Data, with Upper Bound of 40 Rules.

Appendix C.9. Maximal Number of Linguistic Rules: 80
- 1.
- If (Accuracy is good) and (Legibility is poor) and (DesignAndImplementation is good) and (Security is poor) then (Quality is very poor)
- 2.
- If (Accuracy is medium) and (DesignAndImplementation is poor) and (Security is medium) then (Quality is very poor)
- 3.
- If (Accuracy is poor) and (Legibility is poor) and (DesignAndImplementation is poor) and (Security is poor) then (Quality is very poor)
- 4.
- If (Accuracy is poor) and (Legibility is medium) and (DesignAndImplementation is poor) and (Security is poor) then (Quality is very poor)
- 5.
- If (Accuracy is poor) and (Legibility is poor) and (DesignAndImplementation is good) then (Quality is poor)
- 6.
- If (Accuracy is poor) and (Legibility is poor) and (DesignAndImplementation is medium) and (Security is good) then (Quality is very poor)
- 7.
- If (Accuracy is medium) and (Legibility is poor) and (DesignAndImplementation is poor) and (Security is medium) then (Quality is very poor)
- 8.
- If (Accuracy is medium) and (Legibility is poor) and (DesignAndImplementation is medium) and (Security is poor) then (Quality is poor)
- 9.
- If (Accuracy is poor) and (Legibility is medium) and (DesignAndImplementation is poor) and (Security is medium) then (Quality is very good)
- 10.
- If (Accuracy is poor) and (Legibility is good) and (DesignAndImplementation is medium) and (Security is poor) then (Quality is poor)
- 11.
- If (Accuracy is poor) and (Legibility is good) and (DesignAndImplementation is poor) and (Security is medium) then (Quality is poor)
- 12.
- If (Accuracy is poor) and (Legibility is poor) and (DesignAndImplementation is medium) and (Security is medium) then (Quality is medium)
- 13.
- If (Accuracy is poor) and (Legibility is good) and (DesignAndImplementation is medium) and (Security is medium) then (Quality is very poor)
- 14.
- If (Accuracy is poor) and (DesignAndImplementation is poor) and (Security is poor) then (Quality is very poor)
- 15.
- If (Accuracy is medium) and (Legibility is poor) and (DesignAndImplementation is poor) and (Security is poor) then (Quality is poor)
- 16.
- If (Accuracy is medium) and (Legibility is good) and (DesignAndImplementation is poor) and (Security is poor) then (Quality is very poor)
- 17.
- If (Accuracy is medium) and (Legibility is medium) and (DesignAndImplementation is poor) and (Security is medium) then (Quality is very poor)
- 18.
- If (Accuracy is poor) and (Legibility is poor) and (DesignAndImplementation is poor) and (Security is medium) then (Quality is good)
- 19.
- If (Legibility is poor) and (DesignAndImplementation is poor) and (Security is medium) then (Quality is very poor)
- 20.
- If (Accuracy is medium) and (Legibility is medium) and (DesignAndImplementation is good) and (Security is medium) then (Quality is medium)
- 21.
- If (Accuracy is poor) and (Legibility is poor) and (DesignAndImplementation is medium) and (Security is poor) then (Quality is good)
- 22.
- If (Accuracy is good) and (Legibility is medium) and (DesignAndImplementation is good) and (Security is poor) then (Quality is medium)
- 23.
- If (Accuracy is poor) and (Legibility is medium) and (DesignAndImplementation is medium) and (Security is poor) then (Quality is poor)
- 24.
- If (Accuracy is poor) and (DesignAndImplementation is good) and (Security is medium) then (Quality is medium)
- 25.
- If (Accuracy is medium) and (Legibility is good) and (DesignAndImplementation is medium) and (Security is medium) then (Quality is very good)
- 26.
- If (Accuracy is poor) and (Legibility is poor) and (DesignAndImplementation is good) and (Security is poor) then (Quality is good)
- 27.
- If (Accuracy is medium) and (Legibility is medium) and (DesignAndImplementation is good) and (Security is poor) then (Quality is very poor)
- 28.
- If (Accuracy is poor) and (Legibility is good) and (Security is good) then (Quality is poor)
- 29.
- If (Accuracy is medium) and (Legibility is medium) and (DesignAndImplementation is medium) then (Quality is medium)
- 30.
- If (Legibility is medium) and (DesignAndImplementation is good) and (Security is medium) then (Quality is very good)
- 31.
- If (Accuracy is good) and (Legibility is good) and (DesignAndImplementation is poor) and (Security is good) then (Quality is medium)
- 32.
- If (Accuracy is good) and (Legibility is poor) then (Quality is medium)
- 33.
- If (Accuracy is medium) and (Legibility is medium) and (DesignAndImplementation is poor) and (Security is poor) then (Quality is poor)
- 34.
- If (Accuracy is medium) and (Legibility is poor) and (DesignAndImplementation is medium) and (Security is medium) then (Quality is poor)
- 35.
- If (Accuracy is poor) and (Legibility is poor) and (DesignAndImplementation is good) and (Security is medium) then (Quality is very poor)
- 36.
- If (Accuracy is poor) and (Legibility is poor) and (DesignAndImplementation is poor) and (Security is good) then (Quality is very poor)
- 37.
- If (Accuracy is good) and (Legibility is medium) and (DesignAndImplementation is medium) and (Security is medium) then (Quality is good)
- 38.
- If (Accuracy is poor) and (Legibility is good) and (DesignAndImplementation is good) and (Security is poor) then (Quality is medium)
Figure A52.
Evaluation of the Best-Performing Model with Regard to Maximum Error for Checking Data, with Upper Bound of 80 Rules.
Figure A52.
Evaluation of the Best-Performing Model with Regard to Maximum Error for Checking Data, with Upper Bound of 80 Rules.

Figure A53.
Evaluation of the Best-Performing Model with Regard to RMSE Error for Checking Data, with Upper Bound of 80 Rules.
Figure A53.
Evaluation of the Best-Performing Model with Regard to RMSE Error for Checking Data, with Upper Bound of 80 Rules.

Figure A54.
Evaluation of the Best-Performing Model with Regard to Maximum Error for Training Data, with Upper Bound of 80 Rules.
Figure A54.
Evaluation of the Best-Performing Model with Regard to Maximum Error for Training Data, with Upper Bound of 80 Rules.

Figure A55.
Evaluation of the Best-Performing Model with Regard to RMSE Error for Training Data, with Upper Bound of 80 Rules.
Figure A55.
Evaluation of the Best-Performing Model with Regard to RMSE Error for Training Data, with Upper Bound of 80 Rules.

Appendix C.10. Maximal Number of Linguistic Rules: 160
- 1.
- If (Accuracy is poor) and (Legibility is medium) and (DesignAndImplementation is good) and (Security is poor) then (Quality is poor)
- 2.
- If (Accuracy is medium) and (Legibility is poor) and (DesignAndImplementation is poor) and (Security is medium) then (Quality is very poor)
- 3.
- If (Accuracy is poor) and (Legibility is poor) and (DesignAndImplementation is poor) and (Security is medium) then (Quality is poor)
- 4.
- If (Accuracy is medium) and (Legibility is medium) and (DesignAndImplementation is poor) and (Security is good) then (Quality is medium)
- 5.
- If (Accuracy is poor) and (Legibility is good) and (DesignAndImplementation is medium) and (Security is medium) then (Quality is very poor)
- 6.
- If (Accuracy is poor) and (Legibility is poor) and (DesignAndImplementation is medium) and (Security is poor) then (Quality is poor)
- 7.
- If (Accuracy is medium) and (Legibility is poor) and (DesignAndImplementation is medium) and (Security is poor) then (Quality is poor)
- 8.
- If (Accuracy is good) and (Legibility is poor) and (DesignAndImplementation is poor) and (Security is medium) then (Quality is poor)
- 9.
- If (Accuracy is poor) and (Legibility is medium) and (DesignAndImplementation is poor) and (Security is poor) then (Quality is very poor)
- 10.
- If (Accuracy is poor) and (Legibility is poor) and (DesignAndImplementation is poor) and (Security is poor) then (Quality is very poor)
- 11.
- If (Accuracy is poor) and (Legibility is medium) and (DesignAndImplementation is medium) and (Security is medium) then (Quality is medium)
- 12.
- If (Accuracy is medium) and (Legibility is poor) and (DesignAndImplementation is good) and (Security is poor) then (Quality is very poor)
- 13.
- If (Accuracy is medium) and (Legibility is medium) and (DesignAndImplementation is medium) and (Security is poor) then (Quality is poor)
- 14.
- If (Accuracy is poor) and (Legibility is poor) and (DesignAndImplementation is medium) and (Security is medium) then (Quality is medium)
- 15.
- If (Accuracy is poor) and (Legibility is medium) and (DesignAndImplementation is poor) and (Security is medium) then (Quality is very poor)
- 16.
- If (Accuracy is poor) and (Legibility is good) and (DesignAndImplementation is good) and (Security is medium) then (Quality is poor)
- 17.
- If (Accuracy is medium) and (Legibility is medium) and (DesignAndImplementation is poor) and (Security is medium) then (Quality is very poor)
- 18.
- If (Accuracy is poor) and (Legibility is poor) and (DesignAndImplementation is good) and (Security is medium) then (Quality is poor)
- 19.
- If (Accuracy is medium) and (Legibility is good) and (DesignAndImplementation is medium) and (Security is medium) then (Quality is very good)
- 20.
- If (Accuracy is poor) and (Legibility is medium) and (DesignAndImplementation is medium) and (Security is poor) then (Quality is very poor)
- 21.
- If (Accuracy is medium) and (Legibility is poor) and (DesignAndImplementation is poor) and (Security is poor) then (Quality is very poor)
- 22.
- If (Accuracy is good) and (Legibility is poor) and (DesignAndImplementation is poor) and (Security is poor) then (Quality is very poor)
- 23.
- If (Accuracy is medium) and (Legibility is medium) and (DesignAndImplementation is medium) and (Security is medium) then (Quality is medium)
- 24.
- If (Accuracy is good) and (Legibility is medium) and (DesignAndImplementation is medium) and (Security is poor) then (Quality is good)
- 25.
- If (Accuracy is medium) and (Legibility is medium) and (DesignAndImplementation is poor) and (Security is poor) then (Quality is poor)
- 26.
- If (Accuracy is good) and (Legibility is medium) and (DesignAndImplementation is poor) and (Security is poor) then (Quality is very poor)
- 27.
- If (Accuracy is poor) and (Legibility is poor) and (DesignAndImplementation is good) and (Security is poor) then (Quality is very poor)
- 28.
- If (Accuracy is poor) and (Legibility is poor) and (DesignAndImplementation is poor) and (Security is good) then (Quality is very poor)
- 29.
- If (Accuracy is medium) and (Legibility is poor) and (DesignAndImplementation is medium) and (Security is medium) then (Quality is poor)
- 30.
- If (Accuracy is medium) and (Legibility is poor) and (DesignAndImplementation is poor) and (Security is good) then (Quality is poor)
- 31.
- If (Accuracy is medium) and (DesignAndImplementation is medium) and (Security is poor) then (Quality is poor)
- 32.
- If (Accuracy is medium) and (Legibility is poor) and (DesignAndImplementation is medium) and (Security is good) then (Quality is medium)
- 33.
- If (Accuracy is good) and (Legibility is poor) and (DesignAndImplementation is good) and (Security is medium) then (Quality is medium)
- 34.
- If (Accuracy is poor) and (Legibility is medium) and (DesignAndImplementation is poor) and (Security is good) then (Quality is poor)
Figure A56.
Evaluation of the Best-Performing Model with Regard to Maximum Error for Checking Data, with Upper Bound of 160 Rules.
Figure A56.
Evaluation of the Best-Performing Model with Regard to Maximum Error for Checking Data, with Upper Bound of 160 Rules.

Figure A57.
Evaluation of the Best-Performing Model with Regard to RMSE Error for Checking Data, with Upper Bound of 160 Rules.
Figure A57.
Evaluation of the Best-Performing Model with Regard to RMSE Error for Checking Data, with Upper Bound of 160 Rules.

Figure A58.
Evaluation of the Best-Performing Model with Regard to Maximum Error for Training Data, with Upper Bound of 160 Rules.
Figure A58.
Evaluation of the Best-Performing Model with Regard to Maximum Error for Training Data, with Upper Bound of 160 Rules.

Figure A59.
Evaluation of the Best-Performing Model with Regard to RMSE Error for Training Data, with Upper Bound of 160 Rules.
Figure A59.
Evaluation of the Best-Performing Model with Regard to RMSE Error for Training Data, with Upper Bound of 160 Rules.

Appendix D. Evaluation Charts I
The evaluation charts show the pairwise effect of the input variables on the output before the adjustments of the mini focus group, as reported in Section 4.5.
Figure A60.
Effect of the Inputs Accuracy and Legibility on Execution Tracing Quality.

Figure A61.
Effect of the Inputs Accuracy and Design and Implementation on Execution Tracing Quality.
Figure A61.
Effect of the Inputs Accuracy and Design and Implementation on Execution Tracing Quality.

Figure A62.
Effect of the Inputs Accuracy and Security on Execution Tracing Quality.

Figure A63.
Effect of the Inputs Legibility and Design and Implementation on Execution Tracing Quality.
Figure A63.
Effect of the Inputs Legibility and Design and Implementation on Execution Tracing Quality.

Figure A64.
Effect of the Inputs Legibility and Security on Execution Tracing Quality.

Figure A65.
Effect of the Inputs Design and Implementation and Security on Execution Tracing Quality.
Figure A65.
Effect of the Inputs Design and Implementation and Security on Execution Tracing Quality.

Appendix E. Evaluation Charts II
The evaluation charts show the pairwise effect of the input variables on the output after carrying out the adjustments in the mini focus group, as reported in Section 4.5.
Figure A66.
Effect of the Inputs Accuracy and Legibility on Execution Tracing Quality After Adjustment.
Figure A66.
Effect of the Inputs Accuracy and Legibility on Execution Tracing Quality After Adjustment.

Figure A67.
Effect of the Inputs Accuracy and Design and Implementation on Execution Tracing Quality After Adjustment.
Figure A67.
Effect of the Inputs Accuracy and Design and Implementation on Execution Tracing Quality After Adjustment.

Figure A68.
Effect of the Inputs Accuracy and Security on Execution Tracing Quality After Adjustment.
Figure A68.
Effect of the Inputs Accuracy and Security on Execution Tracing Quality After Adjustment.

Figure A69.
Effect of the Inputs Legibility and Design and Implementation on Execution Tracing Quality After Adjustment.
Figure A69.
Effect of the Inputs Legibility and Design and Implementation on Execution Tracing Quality After Adjustment.

Figure A70.
Effect of the Inputs Legibility and Security on Execution Tracing Quality After Adjustment.
Figure A70.
Effect of the Inputs Legibility and Security on Execution Tracing Quality After Adjustment.

Figure A71.
Effect of the Inputs Design and Implementation and Security on Execution Tracing Quality After Adjustment.
Figure A71.
Effect of the Inputs Design and Implementation and Security on Execution Tracing Quality After Adjustment.

Appendix F. The ANFIS Approach
This section presents the training results of the ANFIS approach performed to verify the results of the genetic learning illustrated in Section 4.3. In the scope of both the (1) backpropagation and (2) hybrid approaches, a separate model was trained with one of the initial step sizes from the set {0.1, 0.5, 1, 1.5, 2, 2.5, 3, 3.5, 4, 4.5, 5}. The best-performing models with regard to the maximal errors and RMSE errors were selected in the course of 100 learning epochs and are demonstrated below in Figure A72, Figure A73, Figure A74 and Figure A75.
Appendix F.1. Evaluation of the Checking Data
Figure A72.
Best Maximal-Error Model Trained by ANFIS with Backpropagation, with Initial Step Size 2.5.
Figure A72.
Best Maximal-Error Model Trained by ANFIS with Backpropagation, with Initial Step Size 2.5.

Figure A73.
Best RMSE-Error Model Trained by ANFIS with Backpropagation, with Initial Step Size 3.

Figure A74.
Best Maximal-Error Model Trained by ANFIS with Hybrid Approach, with Initial Step Size 3.5.
Figure A74.
Best Maximal-Error Model Trained by ANFIS with Hybrid Approach, with Initial Step Size 3.5.

Figure A75.
Best RMSE-Error Model Trained by ANFIS with Hybrid Approach, with Initial Step Size 5.

Appendix F.2. The Change of the RMSE Indicator as a Function of the Training Epochs
The changes of the RMSE error indicator are depicted in Figure A76, Figure A78, Figure A80 and Figure A82 to highlight the convergence of the error on the training and checking data. In addition, the adaptation of the initial step sizes during the learning process is depicted in Figure A77, Figure A79, Figure A81 and Figure A83.
Figure A76.
Best Maximal-Error Model Trained by ANFIS with Backpropagation, with Initial Step Size 2.5.
Figure A76.
Best Maximal-Error Model Trained by ANFIS with Backpropagation, with Initial Step Size 2.5.

Figure A77.
Best Maximal-Error Model, Adaptation of the Initial Step Size 2.5.

Figure A78.
Best RMSE-Error Model Trained by ANFIS with Backpropagation, with Initial Step Size 3.

Figure A79.
Best RMSE-Error Model, Adaptation of the Initial Step Size 3.

Figure A80.
Best Maximal-Error Model Trained by ANFIS with Hybrid Approach, with Initial Step Size 3.5.
Figure A80.
Best Maximal-Error Model Trained by ANFIS with Hybrid Approach, with Initial Step Size 3.5.

Figure A81.
Best Maximal-Error Model, Adaptation of the Initial Step Size 3.5.

Figure A82.
Best RMSE-Error Model Trained by ANFIS with Hybrid Approach, with Initial Step Size 5.

Figure A83.
Best RMSE-Error Model, Adaptation of the Initial Step Size5.

References
- Galli, T.; Chiclana, F.; Siewe, F. Quality Properties of Execution Tracing, an Empirical Study. Appl. Syst. Innov. 2021, 4, 20. [Google Scholar] [CrossRef]
- Galli, T.; Chiclana, F.; Siewe, F. Software Product Quality Models, Developments, Trends and Evaluation. SN Comput. Sci. 2020, 1, 154. [Google Scholar] [CrossRef]
- Galli, T.; Chiclana, F.; Siewe, F. On the Use of Quality Models to Address Distinct Quality Views. Appl. Syst. Innov. 2021, 4, 41. [Google Scholar] [CrossRef]
- Chen, B.; Jiang, Z.M. Extracting and Studying the Logging-Code-Issue-Introducing Changes in Java-Based Large-Scale Open Source Software Systems. Empir. Softw. Eng. 2019, 24, 2285–2322. [Google Scholar] [CrossRef]
- Chen, B.; Jiang, Z.M.J. Characterizing and Detecting Anti-Patterns in the Logging Code. In Proceedings of the 39th International Conference on Software Engineering, ICSE ’17, Buenos Aires, Argentina, 20–28 May 2017; IEEE Press: Piscataway, NJ, USA, 2017; pp. 71–81. [Google Scholar] [CrossRef]
- Ding, R.; Zhou, H.; Lou, J.G.; Zhang, H.; Lin, Q.; Fu, Q.; Zhang, D.; Xie, T. Log2: A Cost-Aware Logging Mechanism for Performance Diagnosis. In Proceedings of the USENIX Annual Technical Conference (USENIX ATC 15), Santa Clara, CA, USA, 8–10 July 2015; USENIX Association: Santa Clara, CA, USA, 2015; pp. 139–150. [Google Scholar]
- Fu, Q.; Zhu, J.; Hu, W.; Lou, J.G.; Ding, R.; Lin, Q.; Zhang, D.; Xie, T. Where Do Developers Log? An Empirical Study on Logging Practices in Industry. In Companion, Proceedings of the 36th International Conference on Software Engineering, Hyderabad, India, 31 May 2014–7 June 2014; Association for Computing Machinery: New York, NY, USA, 2014; ICSE Companion 2014; pp. 24–33. [Google Scholar] [CrossRef]
- Li, H.; Chen, T.H.P.; Shang, W.; Hassan, A.E. Studying Software Logging Using Topic Models. Empir. Softw. Eng. 2018, 23, 2655–2694. [Google Scholar] [CrossRef]
- Li, H.; Shang, W.; Adams, B.; Sayagh, M.; Hassan, A.E. A Qualitative Study of the Benefits and Costs of Logging from Developers’ Perspectives. IEEE Trans. Softw. Eng. 2020. [Google Scholar] [CrossRef]
- Hassani, M.; Shang, W.; Shihab, E.; Tsantalis, N. Studying and Detecting Log-Related Issues. Empir. Softw. Eng. 2018, 23, 3248–3280. [Google Scholar] [CrossRef] [Green Version]
- Yao, K.; de Pádua, G.B.; Shang, W.; Sporea, C.; Toma, A.; Sajedi, S. Log4Perf: Suggesting and updating logging locations for web-based systems’ performance monitoring. Empir. Softw. Eng. 2020, 25, 488–531. [Google Scholar] [CrossRef]
- Yuan, D.; Zheng, J.; Park, S.; Zhou, Y.; Savage, S. Improving Software Diagnosability via Log Enhancement. In Proceedings of the Sixteenth International Conference on Architectural Support for Programming Languages and Operating Systems, Newport Beach, CA, USA, 5–11 March 2011; ASPLOS XVI. Association for Computing Machinery: New York, NY, USA, 2011; pp. 3–14. [Google Scholar] [CrossRef] [Green Version]
- Yuan, D.; Park, S.; Huang, P.; Liu, Y.; Lee, M.M.; Tang, X.; Zhou, Y.; Savage, S. Be Conservative: Enhancing Failure Diagnosis with Proactive Logging. In Proceedings of the 10th USENIX Symposium on Operating Systems Design and Implementation (OSDI 12), Hollywood, CA, USA, 8–10 October 2012; USENIX Association: Hollywood, CA, USA, 2012; pp. 293–306. [Google Scholar]
- Zhao, X.; Rodrigues, K.; Luo, Y.; Stumm, M.; Yuan, D.; Zhou, Y. Log20: Fully Automated Optimal Placement of Log Printing Statements under Specified Overhead Threshold. In Proceedings of the 26th Symposium on Operating Systems Principles, SOSP ’17, Shanghai, China, 28 October 2017; Association for Computing Machinery: New York, NY, USA, 2017; pp. 565–581. [Google Scholar] [CrossRef] [Green Version]
- Zhu, J.; He, P.; Fu, Q.; Zhang, H.; Lyu, M.R.; Zhang, D. Learning to Log: Helping Developers Make Informed Logging Decisions. In Proceedings of the 37th International Conference on Software Engineering, ICSE ’15, Florence, Italy, 16–24 May 2015; IEEE Press: Piscataway, NJ, USA, 2015; Volume 1, pp. 415–425. [Google Scholar]
- Zadeh, L. Fuzzy Sets. Inf. Control. 1965, 38, 338–353. [Google Scholar] [CrossRef] [Green Version]
- Zadeh, L.A. Is There a Need for Fuzzy Logic? In Technical Report, Proceedings of the Annual Meeting of the North American Fuzzy Information Processing Society, New York, NY, USA, 19–22 May 2008; Elsevier: Amsterdam, The Netherlands, 2008. [Google Scholar]
- Galli, T. Fuzzy Logic Based Software Product Quality Model for Execution Tracing. MPhil. Thesis, Centre for Computational Intelligence, De Montfort University, Leicester, UK, 2013. [Google Scholar]
- Yang, J.B.; Xu, D.L. On the evidential reasoning algorithm for multiple attribute decision analysis under uncertainty. IEEE Trans. Syst. Man Cybern. Part Syst. Humans 2002, 32, 289–304. [Google Scholar] [CrossRef] [Green Version]
- Walkinshaw, N. Using Evidential Reasoning to Make Qualified Predictions of Software Quality. In Proceedings of the 9th International Conference on Predictive Models in Software Engineering, PROMISE ’13, Baltimore, MD, USA, 9 October 2013; Association for Computing Machinery: New York, NY, USA, 2013. [Google Scholar] [CrossRef] [Green Version]
- Zadeh, L.A. The Concept of a Linguistic Variable and its Application to Approximate Reasoning-II. Inf. Sci. 1975, 8, 301–357. [Google Scholar] [CrossRef]
- Zadeh, L.A. Fuzzy logic = computing with words. IEEE Trans. Fuzzy Syst. 1996, 4, 103–111. [Google Scholar] [CrossRef] [Green Version]
- Ross, T. Fuzzy Logic with Engineering Applications; Wiley: Hoboken, NJ, USA, 2010. [Google Scholar]
- Jang, J.S.R. ANFIS: Adaptive-Network-Based Fuzzy Inference System. IEEE Trans. Syst. Man Cybern. 1993, 23, 665–685. [Google Scholar] [CrossRef]
- Jang, J.S.R.; Sun, C.T.; Mizutani, E. Neuro-Fuzzy and Soft Computing; Prentice Hall: Hoboken, NJ, USA, 1997. [Google Scholar]
- MathWorks. Tune Fuzzy Rules and Membership Function Parameters. Available online: https://de.mathworks.com/help/fuzzy/tune-fuzzy-rules-and-membership-function-parameters.html (accessed on 4 June 2021).
- MatWorks. TuneFIS Options. 2019. Available online: https://de.mathworks.com/help/fuzzy/tunefisoptions.html (accessed on 25 May 2021).
- Galli, T.; Chiclana, F.; Siewe, F. Genetic Algorithm Based Fuzzy Inference System for Describing Execution Tracing Quality Collected Data [Data set]. Zenodo 2021. [Google Scholar] [CrossRef]
- Li, Z.; Chen, T.H.P.; Yang, J.; Shang, W. Dlfinder: Characterizing and Detecting Duplicate Logging Code Smells. In Proceedings of the 41st International Conference on Software Engineering, ICSE ’19, Montreal, QC, Canada, 25–31 May 2019; IEEE Press: Piscataway, NJ, USA, 2019; pp. 152–163. [Google Scholar] [CrossRef]
- Apache Software Foundation. Apache Commons Logging, Best Practices. 2014. Available online: http://commons.apache.org/proper/commons-logging/guide.html#JCL_Best_Practices (accessed on 4 September 2021).
- Zeng, Y.; Chen, J.; Shang, W.; Chen, T.H. Studying the characteristics of logging practices in mobile apps: A case study on F-Droid. Empir. Softw. Eng. 2019, 24, 3394–3434. [Google Scholar] [CrossRef]
- Yuan, D.; Park, S.; Zhou, Y. Characterizing Logging Practices in Open-Source Software. In Proceedings of the 34th International Conference on Software Engineering, ICSE ’12, Zurich, Switzerland, 2–9 June 2012; IEEE Press: Piscataway, NJ, USA, 2012; pp. 102–112. [Google Scholar]
- Chen, B.; (Jack) Jiang, Z.M. Characterizing Logging Practices in Java-Based Open Source Software Projects—A Replication Study in Apache Software Foundation. Empir. Softw. Eng. 2017, 22, 330–374. [Google Scholar] [CrossRef]
- Kabinna, S.; Bezemer, C.; Shang, W.; Hassan, A.E. Logging Library Migrations: A Case Study for the Apache Software Foundation Projects. In Proceedings of the 2016 IEEE/ACM 13th Working Conference on Mining Software Repositories (MSR), Austin, TX, USA, 14–22 May 2016; pp. 154–164. [Google Scholar]
- Zhang, L.; Li, L.; Gao, H. 2-D Software Quality Model and Case Study in Software Flexibility Research. In Proceedings of the 2008 International Conference on Computational Intelligence for Modelling Control and Automation, CIMCA ’08, Vienna, Austria, 10–12 December 2008; IEEE Computer Society: Washington, DC, USA, 2008; pp. 1147–1152. [Google Scholar] [CrossRef]
- Khaddaj, S.; Horgan, G. A Proposed Adaptable Quality Model for Software Quality Assurance. J. Comput. Sci. 2005, 1, 482–487. [Google Scholar] [CrossRef] [Green Version]
- Horgan, G.; Khaddaj, S. Use of an adaptable quality model approach in a production support environment. J. Syst. Softw. 2009, 82, 730–738. [Google Scholar] [CrossRef]
- Boehm, B.W.; Brown, J.R.; Lipow, M. Quantitative Evaluation of Software Quality. In Proceedings of the 2nd International Conference on Software Engineering, San Francisco, CA, USA, 13–15 October 1976; pp. 592–605. [Google Scholar]
- Chulani, S.; Boehm, B. Modeling Software Defect Introduction and Removal—COQUALMO (Constructive QUALity Model); Technical Report, USC-CSE Technical Report; CiteSeer: Los Angeles, CA, USA, 1999. [Google Scholar]
- Madachy, R.; Boehm, B. Assessing Quality Processes with ODC COQUALMO. In Making Globally Distributed Software Development a Success Story; Springer: Berlin/Heidelberg, Germany, 2008; Volune 5007, pp. 198–209. [Google Scholar] [CrossRef]
- Dromey, R. A Model for Software Product Quality. IEEE Trans. Softw. Eng. 1995, 21, 146–162. [Google Scholar] [CrossRef] [Green Version]
- Kothapalli, C.; Ganesh, S.G.; Singh, H.K.; Radhika, D.V.; Rajaram, T.; Ravikanth, K.; Gupta, S.; Rao, K. Continual monitoring of Code Quality. In Proceedings of the 4th India Software Engineering Conference 2011, ISEC’11, Thiruvananthapuram, Kerala, India, 24–27 February 2011; pp. 175–184. [Google Scholar] [CrossRef]
- Plösch, R.; Gruber, H.; Hentschel, A.; Körner, C.; Pomberger, G.; Schiffer, S.; Saft, M.; Storck, S. The EMISQ method and its tool support-expert-based evaluation of internal software quality. Innov. Syst. Softw. Eng. 2008, 4, 3–15. [Google Scholar] [CrossRef]
- Plösch, R.; Gruber, H.; Körner, C.; Saft, M. A Method for Continuous Code Quality Management Using Static Analysis. In Proceedings of the Seventh International Conference on the Quality of Information and Communications Technology, Porto, Portugal, 29 September–2 October 2010; pp. 370–375. [Google Scholar] [CrossRef]
- Grady, R.B.; Caswell, D.L. Software Metrics: Establishing a Company-wide Program; Prentice-Hall, Inc.: Upper Saddle River, NJ, USA, 1987. [Google Scholar]
- Grady, R.B. Practical Software Metrics for Project Management and Process Improvement; Prentice Hall: Upper Saddle River, NJ, USA, 1992. [Google Scholar]
- Eeles, P. Capturing Architectural Requirements. 2005. Available online: https://www.ibm.com/developerworks/rational/library/4706-pdf.pdf (accessed on 19 April 2018).
- Georgiadou, E. GEQUAMO—A Generic, Multilayered, Customisable, Software Quality Model. Softw. Qual. J. 2003, 11, 313–323. [Google Scholar] [CrossRef]
- van Solingen, R.; Berghout, E. The Goal/Question/Metric Method a Practical Guide for Quality Improvement of Software Development; McGraw Hill Publishing: New York, NY, USA, 1999. [Google Scholar]
- IEEE Computer Society. IEEE Stdandard 1061–1998: IEEE Standard for a Software Quality Metrics Methodology; IEEE: Piscataway, NJ, USA, 1998; ISBN 978-0-7381-1510-8. [Google Scholar]
- Ouhbi, S.; Idri, A.; Fernández-Alemán, J.L.; Toval, A.; Benjelloun, H. Applying ISO/IEC 25010 on mobile personal health records. In Proceedings of the International Joint Conference on Biomedical Engineering Systems and Technologies, BIOSTEC 2015, Lisbon, Portugal, 12–15 January 2015; Volume 5, pp. 405–412. [Google Scholar] [CrossRef] [Green Version]
- Idri, A.; Bachiri, M.; Fernández-Alemán, J.L. A Framework for Evaluating the Software Product Quality of Pregnancy Monitoring Mobile Personal Health Records. J. Med. Syst. 2016, 40, 1–17. [Google Scholar] [CrossRef]
- Forouzani, S.; Chiam, Y.K.; Forouzani, S. Method for Assessing Software Quality Using Source Code Analysis; ACM International Conference Proceeding Series; Association for Computing Machinery: New York, NY, USA, 2016; pp. 166–170. [Google Scholar] [CrossRef]
- Domínguez-Mayo, F.J.; Escalona, M.J.; Mejías, M.; Ross, M.; Staples, G. Quality evaluation for Model-Driven Web Engineering methodologies. Inf. Softw. Technol. 2012, 54, 1265–1282. [Google Scholar] [CrossRef]
- Idri, A.; Bachiri, M.; Fernandez-Aleman, J.L.; Toval, A. Experiment Design of Free Pregnancy Monitoring Mobile Personal Health Records Quality Evaluation; IEEE: Munich, Germany, 2016; pp. 1–6. [Google Scholar] [CrossRef]
- International Organization for Standardization. ISO/IEC 25010:2011, Systems and Software Engineering—Systems and Software Quality Requirements and Evaluation (SQuaRE)—System and Software Quality Models; International Organization for Standardization: Geneva, Switzerland, 2011. [Google Scholar]
- Shen, P.; Ding, X.; Ren, W.; Yang, C. Research on Software Quality Assurance Based on Software Quality Standards and Technology Management. In Proceedings of the 19th IEEE/ACIS International Conference on Software Engineering, Artificial Intelligence, Networking and Parallel/Distributed Computing (SNPD), Busan, Korea, 27–29 June 2018; pp. 385–390. [Google Scholar] [CrossRef]
- Liu, X.; Zhang, Y.; Yu, X.; Liu, Z. A Software Quality Quantifying Method Based on Preference and Benchmark Data. In Proceedings of the 19th IEEE/ACIS International Conference on Software Engineering, Artificial Intelligence, Networking and Parallel/Distributed Computing (SNPD), Busan, Korea, 27–29 June 2018; pp. 375–379. [Google Scholar] [CrossRef]
- Kanellopoulos, Y.; Tjortjis, C.; Heitlager, I.; Visser, J. Interpretation of source code clusters in terms of the ISO/IEC-9126 maintainability characteristics. In Proceedings of the European Conference on Software Maintenance and Reengineering, CSMR, Athens, Greece, 4 April 2008; pp. 63–72. [Google Scholar] [CrossRef]
- Vetro, A.; Zazworka, N.; Seaman, C.; Shull, F. Using the ISO/IEC 9126 product quality model to classify defects: A controlled experiment. In Proceedings of the 16th International Conference on Evaluation Assessment in Software Engineering (EASE 2012), Ciudad Real, Spain, 14–15 May 2012; pp. 187–196. [Google Scholar] [CrossRef] [Green Version]
- Parthasarathy, S.; Sharma, S. Impact of customization over software quality in ERP projects: An empirical study. Softw. Qual. J. 2017, 25, 581–598. [Google Scholar] [CrossRef]
- Li, Y.; Man, Z. A Fuzzy Comprehensive Quality Evaluation for the Digitizing Software of Ethnic Antiquarian Resources. Int. Conf. Comput. Sci. Softw. Eng. 2008, 5, 1271–1274. [Google Scholar] [CrossRef]
- Hu, W.; Loeffler, T.; Wegener, J. Quality model based on ISO/IEC 9126 for internal quality of MATLAB/Simulink/Stateflow models. In Proceedings of the IEEE International Conference on Industrial Technology, Athens, Greece, 19–21 March 2012; pp. 325–330. [Google Scholar] [CrossRef]
- International Organization for Standardization. ISO/IEC 9126-1:2001, Software Engineering—Product Quality—Part 1: Quality Model; International Organization for Standardization: Geneva, Switzerland, 2001. [Google Scholar]
- Liang, S.K.; Lien, C.T. Selecting the Optimal ERP Software by Combining the ISO 9126 Standard and Fuzzy AHP Approach. Contemp. Manag. Res. 2006, 3, 23. [Google Scholar] [CrossRef] [Green Version]
- Correia, J.; Visser, J. Certification of Technical Quality of Software Products. In Proceedings of the International Workshop on Foundations and Techniques for Open Source Software Certification, Milan, Italy, 10 September 2008; pp. 35–51. [Google Scholar]
- Andreou, A.S.; Tziakouris, M. A quality framework for developing and evaluating original software components. Inf. Softw. Technol. 2007, 49, 122–141. [Google Scholar] [CrossRef]
- Kim, C.; Lee, K. Software Quality Model for Consumer Electronics Product. In Proceedings of the 9th International Conference on Quality Software, Jeju, Korea, 24–25 August 2009; pp. 390–395. [Google Scholar]
- Benedicenti, L.; Wang, V.W.; Paranjape, R. A quality assessment model for Java code. Can. Conf. Electr. Comput. Eng. 2002, 2, 687–690. [Google Scholar]
- McCall, J.A.; Richards, P.K.; Walters, G.F. Factors in Software Quality, Concept and Definitions of Software Quality. 1977. Available online: http://www.dtic.mil/dtic/tr/fulltext/u2/a049014.pdf (accessed on 6 March 2018).
- Franke, D.; Weise, C. Providing a software quality framework for testing of mobile applications. In Proceedings of the 4th IEEE International Conference on Software Testing, Verification, and Validation, (ICST 2011), Berlin, Germany, 21–25 March 2011; pp. 431–434. [Google Scholar] [CrossRef]
- Gleirscher, M.; Golubitskiy, D.; Irlbeck, M.; Wagner, S. Introduction of static quality analysis in small- and medium-sized software enterprises: Experiences from technology transfer. Softw. Qual. J. 2014, 22, 499–542. [Google Scholar] [CrossRef] [Green Version]
- Wagner, S.; Lochmann, K.; Heinemann, L.; Kläs, M.; Trendowicz, A.; Plösch, R.; Seidl, A.; Goeb, A.; Streit, J. The Quamoco Product Quality Modelling and Assessment Approach. In Proceedings of the 34th International Conference on Software Engineering, ICSE ’12, Zurich, Switzerland, 2–9 June 2012; IEEE Press: Piscataway, NJ, USA, 2012; pp. 1133–1142. [Google Scholar]
- Wagner, S.; Lochmann, K.; Winter, S.; Deissenboeck, F.; Juergens, E.; Herrmannsdoerfer, M.; Heinemann, L.; Kläs, M.; Trendowicz, A.; Heidrich, J.; et al. The Quamoco Quality Meta-Model. October 2012. Available online: https://mediatum.ub.tum.de/attfile/1110600/hd2/incoming/2012-Jul/517198.pdf (accessed on 18 November 2017).
- Wagner, S.; Goeb, A.; Heinemann, L.; Kläs, M.; Lampasona, C.; Lochmann, K.; Mayr, A.; Plösch, R.; Seidl, A.; Streit, J.; et al. Operationalised product quality models and assessment: The Quamoco approach. Inf. Softw. Technol. 2015, 62, 101–123. [Google Scholar] [CrossRef] [Green Version]
- Hyatt, L.E.; Rosenberg, L.H. A Software Quality Model and Metrics for Identifying Project Risks and Assessing Software Quality. In Proceedings of the Product Assurance Symposium and Software Product Assurance Workshop, EAS SP-377, European Space Agency, Noordwijk, The Netherlands, 19–21 March 1996. [Google Scholar]
- Martin, R.A.; Shafer, L.H. Providing a Framework for effective software quality assessment—A first step in automating assessments. In Proceedings of the first Annual Software Engineering and Economics Conference, McLean, VA, USA, 2–3 April 1996. [Google Scholar]
- Côté, M.A.; Suryn, W.; Martin, R.A.; Laporte, C.Y. Evolving a Corporate Software Quality Assessment Exercise: A Migration Path to ISO/IEC 9126. Softw. Qual. Prof. 2004, 6, 4–17. [Google Scholar]
- Letouzey, J.L.; Coq, T. The SQALE Analysis Model: An Analysis Model Compliant with the Representation Condition for Assessing the Quality of Software Source Code. In Proceedings of the 2010 Second International Conference on Advances in System Testing and Validation Lifecycle, Nice, France, 22–27 August 2010; pp. 43–48. [Google Scholar]
- Letouzey, J.L. Managing Large Application Portfolio with Technical Debt Related Measures. In Proceedings of the Joint Conference of the International Workshop on Software Measurement and the International Conference on Software Process and Product Measurement (IWSM-MENSURA), Berlin, Germany, 5–7 October 2016; p. 181. [Google Scholar] [CrossRef]
- Letouzey, J.L. The SQALE method for evaluating Technical Debt. In Proceedings of the Third International Workshop on Managing Technical Debt (MTD), Zurich, Switzerland, 5 June 2012; pp. 31–36. [Google Scholar] [CrossRef]
- Letouzey, J.; Coq, T. The SQALE Models for Assessing the Quality of Real Time Source Code. 2010. Available online: https://pdfs.semanticscholar.org/4dd3/a72d79eb2f62fe04410106dc9fcc27835ce5.pdf?ga=2.24224186.1861301954.1500303973-1157276278.1497961025 (accessed on 17 July 2017).
- Letouzey, J.L.; Ilkiewicz, M. Managing Technical Debt with the SQALE Method. IEEE Softw. 2012, 29, 44–51. [Google Scholar] [CrossRef]
- Letouzey, J.L.; Coq, T. The SQALE Quality and Analysis Models for Assessing the Quality of Ada Source Code. 2009. Available online: http://www.adalog.fr/publicat/sqale.pdf (accessed on 17 July 2017).
- Hegeman, J.H. On the Quality of Quality Models. Master’s Thesis, University Twente, Enschede, The Netherlands, 2011. Available online: https://essay.utwente.nl/61040/1/MScJHegeman.pdf (accessed on 16 November 2018).
- Letouzey, J.L. The SQALE Method for Managing Technical Debt, Definition Document V1.1. 2016. Available online: http://www.sqale.org/wp-content/uploads//08/SQALE-Method-EN-V1-1.pdf (accessed on 2 August 2017).
- Mordal-Manet, K.; Balmas, F.; Denier, S.; Ducasse, S.; Wertz, H.; Laval, J.; Bellingard, F.; Vaillergues, P. The Squale Model—A Practice-based Industrial Quality Model. 2009. Available online: https://hal.inria.fr/inria-00637364 (accessed on 6 March 2018).
- Laval, J.; Bergel, A.; Ducasse, S. Assessing the Quality of Your Software with MoQam. 2008. Available online: https://hal.inria.fr/inria-00498482 (accessed on 6 March 2018).
- Balmas, F.; Bellingard, F.; Denier, S.; Ducasse, S.; Franchet, B.; Laval, J.; Mordal-Manet, K.; Vaillergues, P. Practices in the Squale Quality Model (Squale Deliverable 1.3). October 2010. Available online: http://www.squale.org/quality-models-site/research-deliverables/WP1.3Practices-in-the-Squale-Quality-Modelv2.pdf (accessed on 16 November 2017).
- INRIA RMoD, Paris 8, Qualixo. Technical Model for Remediation (Workpackage 2.2). 2010. Available online: http://www.squale.org/quality-models-site/research-deliverables/WP2.2Technical-Model-for-Remediationv1.pdf (accessed on 16 November 2017).
- Kitchenham, B.; Linkman, S.; Pasquini, A.; Nanni, V. The SQUID approach to defining a quality model. Softw. Qual. J. 1997, 6, 211–233. [Google Scholar] [CrossRef]
- Ulan, M.; Hönel, S.; Martins, R.M.; Ericsson, M.; Löwe, W.; Wingkvist, A.; Kerren, A. Quality Models Inside Out: Interactive Visualization of Software Metrics by Means of Joint Probabilities. In Proceedings of the IEEE Working Conference on Software Visualization (VISSOFT), Madrid, Spain, 24–25 September 2018; pp. 65–75. [Google Scholar] [CrossRef]
- Lai, Y.C.; Kao, C.C.; Jhan, J.D.; Kuo, F.H.; Chang, C.W.; Shih, T.C. Quality of Service Measurement and Prediction through AI Technology. In Proceedings of the IEEE Eurasia Conference on IOT, Communication and Engineering (ECICE), Yunlin, Taiwan, 23–25 October 2020; pp. 254–257. [Google Scholar] [CrossRef]
- Pandit, M.B.R.; Varma, N. A Deep Introduction to AI Based Software Defect Prediction (SDP) and its Current Challenges. In Proceedings of the 2019 IEEE Region 10 Conference (TENCON), Kerala, India, 17–20 October 2019; pp. 284–290. [Google Scholar] [CrossRef]
- Pradhan, S.; Nanniyur, V.; Vissapragada, P.K. On the Defect Prediction for Large Scale Software Systems – From Defect Density to Machine Learning. In Proceedings of the IEEE 20th International Conference on Software Quality, Reliability and Security (QRS), Vilnius, Lithuania, 27–31 July 2020; pp. 374–381. [Google Scholar] [CrossRef]
- Madera, M.; Tomoń, R. A case study on machine learning model for code review expert system in software engineering. In Proceedings of the Federated Conference on Computer Science and Information Systems (FedCSIS), Prague, Czech Republic, 3–6 September 2017; pp. 1357–1363. [Google Scholar] [CrossRef] [Green Version]
- Khan, B.; Iqbal, D.; Badshah, S. Cross-Project Software Fault Prediction Using Data Leveraging Technique to Improve Software Quality. In Proceedings of the Evaluation and Assessment in Software Engineering, EASE ’20, Trondheim, Norway, 15–17 April 2020; Association for Computing Machinery: New York, NY, USA, 2020; pp. 434–438. [Google Scholar] [CrossRef]
- Blas, M.J. An analysis model to evaluate web applications quality using a discrete-event simulation approach. In Proceedings of the 2017 Winter Simulation Conference (WSC), Las Vegas, NV, USA, 3–6 December 2017; pp. 4648–4649. [Google Scholar] [CrossRef]
- Xing, F.; Guo, P.; Lyu, M.R. A novel method for early software quality prediction based on support vector machine. In Proceedings of the 16th IEEE International Symposium on Software Reliability Engineering (ISSRE’05), Chicago, IL, USA, 8–11 November 2005; p. 10. [Google Scholar]
- Lafi, M.; Hawashin, B.; AlZu’bi, S. Maintenance Requests Labeling Using Machine Learning Classification. In Proceedings of the Seventh International Conference on Software Defined Systems (SDS), Paris, France, 20–23 April 2020; pp. 245–249. [Google Scholar] [CrossRef]
- Ubayashi, N.; Kamei, Y.; Sato, R. When and Why Do Software Developers Face Uncertainty? In Proceedings of the IEEE 19th International Conference on Software Quality, Reliability and Security (QRS), Sofia, Bulgaria, 26 July 2019; pp. 288–299. [Google Scholar] [CrossRef]
- Singh, P.K.; Sangwan, O.P.; Singh, A.P.; Pratap, A. A framework for assessing the software reusability using fuzzy logic approach for aspect oriented software. Int. J. Inf. Technol. Comput. Sci. 2015, 7, 12–20. [Google Scholar] [CrossRef] [Green Version]
- Aggarwal, K.K.; Singh, Y.; Chandra, P.; Puri, M. Measurement of Software Maintainability Using a Fuzzy Model. J. Comput. Sci. 2005, 541. [Google Scholar] [CrossRef] [Green Version]
- Canfora, G.; Cerulo, L.; Troiano, L. Can Fuzzy Mathematics enrich the Assessment of Software Maintainability? In Proceedings of the ICEISSAM Software Audit and Metrics, Porto, Portugal, 13–14 April 2004. [Google Scholar]
- Mittal, H.; Bhatia, P. Software Maintainability Assessment Based on Fuzzy Logic Technique. ACM SIGSOFT Software Eng. Notes 2009, 34, 1–5. [Google Scholar] [CrossRef]
- Nerurkar, N.W.; Kumar, A.; Shrivastava, P. Assessment of Reusability in Aspect-Oriented Systems using Fuzzy Logic. ACM SIGSOFT Software Eng. Notes 2010, 35, 1–5. [Google Scholar] [CrossRef]
- Galli, T.; Chiclana, F.; Carter, J.; Janicke, H. Modelling Execution Tracing Quality by Type-1 Fuzzy Logic. Acta Polytech. Hung. 2013, 8, 49–67. [Google Scholar] [CrossRef]
- Malhotra, R.; Lata, K. A systematic literature review on empirical studies towards prediction of software maintainability. Soft Comput. 2020, 24, 16655–16677. [Google Scholar] [CrossRef]
- Malhotra, N.H. Marketingkutatas (Translated title: Marketing Research); Akademia Kiado: Budapest, Hungary, 2009. [Google Scholar]
- Freedaman, D.; Pisani, R.; Purves, R. Statisztika (Translated Title: Statistics); Typotex: Budapest, Hungary, 2005. [Google Scholar]
- Gibbons, J.D.; Chakraborti, S. Non-Parametric Statistical Inference Statistics Textbooks and Monographs; Marcel Dekker: New York, NY, USA, 2003. [Google Scholar]
- Eiben, A.E.; Smith, J.E. Introduction to Evolutionary Computing; Springer: Berlin/Heidelberg, Germany, 2010. [Google Scholar]
- Patino, C.M.; Ferreira, J.C. Internal and external validity: Can you apply research study results to your patients? J. Bras. Pneumol. 2018, 44, 183. [Google Scholar] [CrossRef] [Green Version]
- Salkind, N.J. Exploring Research; Pearson, Prentice-Hall: Hoboken, NJ, USA, 2009. [Google Scholar]
- Park, Y.J.; Cho, H.S.; Cha, D.H. Genetic algorithm-based optimization of fuzzy logic controller using characteristic parameters. IEEE Int. Conf. Evol. 1995, 2, 831–836. [Google Scholar] [CrossRef]
Figure 1.
Process of the Conducted Research.

Figure 2.
Quality Scores Assigned to the Use Cases, with Q1, Q3, and Median Values.

Figure 3.
Quality Scores Assigned to the Extreme Input Values, with Q1, Q3, and Median Values.

Figure 4.
Membership Functions of the Inputs.

Figure 5.
Depiction of the Best Maximal Errors for the Training Data.

Figure 6.
Depiction of the Best Maximal Errors for the Checking Data.

Figure 7.
Effect of the Inputs Accuracy and Legibility on Execution Tracing Quality after Tuning the Rules.
Figure 7.
Effect of the Inputs Accuracy and Legibility on Execution Tracing Quality after Tuning the Rules.

Figure 8.
Effect of the Inputs Accuracy and Design and Implementation on Execution Tracing Quality after Tuning the Rules.
Figure 8.
Effect of the Inputs Accuracy and Design and Implementation on Execution Tracing Quality after Tuning the Rules.

Figure 9.
Effect of the Inputs Accuracy and Security on Execution Tracing Quality after Tuning the Rules.
Figure 9.
Effect of the Inputs Accuracy and Security on Execution Tracing Quality after Tuning the Rules.

Figure 10.
Effect of the Inputs Legibility and Design and Implementation on Execution Tracing Quality after Tuning the Rules.
Figure 10.
Effect of the Inputs Legibility and Design and Implementation on Execution Tracing Quality after Tuning the Rules.

Figure 11.
Effect of the Inputs Legibility and Security on Execution Tracing Quality after Tuning the Rules.
Figure 11.
Effect of the Inputs Legibility and Security on Execution Tracing Quality after Tuning the Rules.

Figure 12.
Effect of the Inputs Design and Implementation and Security on Execution Tracing Quality after Tuning the Rules.
Figure 12.
Effect of the Inputs Design and Implementation and Security on Execution Tracing Quality after Tuning the Rules.

Table 1.
Main Focus of Publications Related to Logging.
| Where to Insert Log Statements in the Source Code | What to Log | How to Log | Tool Support | Publication |
|---|---|---|---|---|
| x | [9] | |||
| x | [7] | |||
| x | x | [15] | ||
| x | x | [11] | ||
| x | [8] | |||
| x | x | x | x | [13] |
| x | x | x | x | [14] |
| x | x | [6] | ||
| x | x | [10] | ||
| x | x | [12] | ||
| x | [5] |
Table 2.
Software Product Quality Model Families Defined, Tailored, or Referenced in the Last 20 Years [2].
Table 2.
Software Product Quality Model Families Defined, Tailored, or Referenced in the Last 20 Years [2].
| No. | Software Product Quality Model Families, Names in Alphabetic Order |
|---|---|
| 1 | 2D Model [35] |
| 2 | ADEQUATE [36,37] |
| 3 | Boehm et al. [38] |
| 4 | COQUALMO [39,40] |
| 5 | Dromey [41] |
| 6 | EMISQ [42,43,44] |
| 7 | FURPS [45,46,47] |
| 8 | GEQUAMO [48] |
| 9 | GQM [49] |
| 10 | IEEE Metrics Framework Reaffirmed in 2009 [50] |
| 11 | ISO25010 [51,52,53,54,55,56,57,58] |
| 12 | ISO9126 [59,60,61,62,63,64,65,66,67] |
| 13 | Kim and Lee [68] |
| 14 | McCall et al. [69,70] |
| 15 | Metrics Framework for Mobile Apps [71] |
| 16 | Quamoco [72,73,74,75] |
| 17 | SATC [76] |
| 18 | SQAE [77] |
| 19 | SQAE and ISO9126 combination [78] |
| 20 | SQALE [79,80,81,82,83,84,85,86] |
| 21 | SQUALE [87,88,89,90] |
| 22 | SQUID [91] |
| 23 | Ulan et al. [92] |
Table 3.
Reliability Indicators of the Online Questionnaire [28].
Table 3.
Reliability Indicators of the Online Questionnaire [28].
| Use Cases | Real Projects | Extreme Input Values | |
|---|---|---|---|
| 0.98 | 0.92 | 0.83 | |
| 0.98 | 0.94 | 0.87 |
Table 4.
Best maximal errors for the training data.
| Limit: 1 Rule | Limit: 3 Rules | Limit: 5 Rules | Limit: 8 Rules | Limit: 12 Rules | Limit: 16 Rules | Limit: 20 Rules | Limit: 40 Rules | Limit: 80 Rules | Limit: 160 Rules | |
|---|---|---|---|---|---|---|---|---|---|---|
| RMSE | 30.59485 | 19.56332 | 18.47743 | 16.21253 | 17.859 | 15.67844 | 15.83771 | 15.45328 | 15.69313 | 18.56351 |
| MAE | 26.16265 | 15.88731 | 15.17334 | 11.79144 | 14.31864 | 11.31696 | 11.97357 | 11.01256 | 11.41314 | 15.22481 |
| Min. Error | 0 | 0 | 0.00002 | 0.000731 | 0 | 0.025736 | 0.022271 | 0.004223 | 0.039392 | 0.153897 |
| Max. Error | 50 | 74.97749 | 50.51683 | 55.28113 | 50.51682 | 50.522 | 51.50747 | 50.01046 | 49.81493 | 52.96985 |
Table 5.
Best maximal errors for the checking data.
| Limit: 1 Rule | Limit: 3 Rules | Limit: 5 Rules | Limit: 8 Rules | Limit: 12 Rules | Limit: 16 Rules | Limit: 20 Rules | Limit: 40 Rules | Limit: 80 Rules | Limit: 160 Rules | |
|---|---|---|---|---|---|---|---|---|---|---|
| RMSE | 30.23458 | 19.79506 | 17.11367 | 16.42312 | 15.58643 | 15.5542 | 15.39485 | 15.32827 | 15.32682 | 16.35666 |
| MAE | 25.92113 | 15.74546 | 12.96622 | 11.99584 | 11.08251 | 11.26821 | 11.27761 | 11.13463 | 10.90988 | 12.2782 |
| Min. Error | 0 | 0 | 0.00001 | 0.010229 | 0.014746 | 0.000246 | 0.011135 | 0.000583 | 0.007301 | 0.01093 |
| Max. Error | 50 | 74.97749 | 50.00047 | 50.5166 | 51.03274 | 50.77524 | 51.05456 | 51.48755 | 50.05721 | 50.25765 |
Table 6.
Error Indicators of the Best-Performing Models Trained by the ANFIS Approach.
| Training: Backpropagation | Training: Hybrid | |||
|---|---|---|---|---|
| Best Max. Error | Best RMSE Error | Best Max. Error | Best RMSE Error | |
| RMSE | 15.04308982 | 14.92059348 | 16.35542215 | 16.31984729 |
| MAE | 10.91966752 | 10.68467212 | 10.9482579 | 10.66809624 |
| Min. Error | 0.046226241 | 0.042525692 | 0.049740427 | 0.012379938 |
| Max. Error | 50.61656014 | 51.15983193 | 66.11773115 | 96.19663932 |
| Initial Step Size | 2.5 | 3 | 3.5 | 5 |
Table 7.
Error Indicators of the Created Model After the Different Modelling Stages.
| Base 12-Rule Model | Model After Adjustments | Model After Validation | ||||
|---|---|---|---|---|---|---|
| Error Type | Checking Data | Training Data | Checking Data | Training Data | Checking Data | Training Data |
| RMSE | 15.5864 | 15.5653 | 19.5772 | 19.9272 | 23.5540 | 23.3813 |
| MAE | 11.0825 | 11.3225 | 14.1003 | 14.0510 | 16.3166 | 16.1725 |
| Min. Error | 0.0147 | 0.0033 | 0.0055 | 0.0015 | 0.0055 | 0.0015 |
| Max. Error | 51.0327 | 55.7013 | 73.9973 | 76.0869 | 97.4981 | 97.4981 |
Publisher’s Note: MDPI stays neutral with regard to jurisdictional claims in published maps and institutional affiliations. |
© 2021 by the authors. Licensee MDPI, Basel, Switzerland. This article is an open access article distributed under the terms and conditions of the Creative Commons Attribution (CC BY) license (https://creativecommons.org/licenses/by/4.0/).
Share and Cite
MDPI and ACS Style
Galli, T.; Chiclana, F.; Siewe, F. Genetic Algorithm-Based Fuzzy Inference System for Describing Execution Tracing Quality. Mathematics 2021, 9, 2822. https://0-doi-org.brum.beds.ac.uk/10.3390/math9212822
AMA Style
Galli T, Chiclana F, Siewe F. Genetic Algorithm-Based Fuzzy Inference System for Describing Execution Tracing Quality. Mathematics. 2021; 9(21):2822. https://0-doi-org.brum.beds.ac.uk/10.3390/math9212822
Chicago/Turabian StyleGalli, Tamas, Francisco Chiclana, and Francois Siewe. 2021. "Genetic Algorithm-Based Fuzzy Inference System for Describing Execution Tracing Quality" Mathematics 9, no. 21: 2822. https://0-doi-org.brum.beds.ac.uk/10.3390/math9212822
Note that from the first issue of 2016, this journal uses article numbers instead of page numbers. See further details here.