
An Exploratory Approach to the Adoption Process of Bitcoin by Business Executives


1
Department of Financial Economics and Operations Management, University of Seville, 41001 Seville, Spain
2
Department of Business Economics, Rey Juan Carlos University, 28032 Madrid, Spain
3
Faculty of Legal and Business Sciences, Francisco de Vitoria University, 28223 Madrid, Spain
*
Author to whom correspondence should be addressed.
Mathematics 2021, 9(4), 355; https://0-doi-org.brum.beds.ac.uk/10.3390/math9040355
Submission received: 30 December 2020
/
Revised: 1 February 2021
/
Accepted: 8 February 2021
/
Published: 10 February 2021
(This article belongs to the Section Mathematics and Computer Science)
Abstract
:The purpose of this research study is to analyze the exploratory study of the adoption of Bitcoin cryptocurrency based on blockchain technology and its use as a means of payment in companies. This research is exploratory in nature. As such, an adoption model was investigated using the technology acceptance model (TAM) which was extended with new variables. The sample was made up of business executives from companies and commercial establishments (n = 248). Partial least squares structural equation modeling (PLS-SEM) was chosen as the analysis and evaluation technique for the model. The authors demonstrated that privacy has an important influence on perceived utility, and that trust has a very significant influence on privacy and perceived ease of use, thus indirectly affecting the intention to use cryptocurrencies.
1. Introduction
Blockchain is a new digital technology which could change the way industries and organizations around the world are organized and structured [1]. Blockchain has prompted many companies and organizations, as well as political powers, to rethink the marketing strategies and tactics for their products and services [2,3]. Blockchain technology came about with the creation of the cryptocurrency known as Bitcoin. Bitcoin is a cryptocurrency based on a peer-to-peer payment system [4]. Although, in recent years, some publications have addressed Bitcoin and blockchain as one in the same technology, the fact is that Bitcoin is merely one application of the emerging digital technology known as blockchain [3,5,6,7].
Blockchain is a technology that links neurons, or blocks, by means of coded blockchains saved in permanent records [8,9]. These permanent records are tamper-proof [10,11]. In other words, the data in blockchains are stored in a disperse peer-to-peer network using what could be called the consensus rule among users to validate each of the transactions by the different elements in the network [11]. Therefore, one of the main benefits of a blockchain system is that certain costs, such as financial services, can be eliminated as there is no longer a central authority required when performing and validating the transactions. Therefore, the blockchain algorithm allows information to be registered on multiple servers or computers at the same time. This is contrary to how information is stored today on the standard Internet system [12]. Consequently, blockchain makes it possible to increase the privacy and security of transactions, as well as their veracity, and avoid fraudulent actions; however, would these characteristics enough for business executives to use in their companies Bitcoin [6]?
This is the main reason why certain industries, especially the financial sector, have had to rethink their organizational structures [13,14]. Some of the features that make blockchain a strong emerging technology are related to its security, reliability, transparency, and capacity to track every transaction made with it [15].
Bitcoin was proposed as a cryptocurrency in 2008 because of the above features in a paper by the disappeared Satoshi Nakamoto [16], whose whereabouts are still unknown. The proposal was accepted and, in early 2009, Bitcoin software, or Bitcoin core, was created. It was basically generated in blocks, each of which is now referred to as a block of a blockchain, thus leading to the emergence of blockchain technology [16].
From this simple beginning, several studies suggested that Bitcoin could have a major impact on the technology used by society, restructuring it once again as a cryptocurrency [17,18]. Bitcoin works with blockchain technology and could, therefore, change how wealth is made around the world. It could have a significant social impact which research must take into account when validating its acceptability.
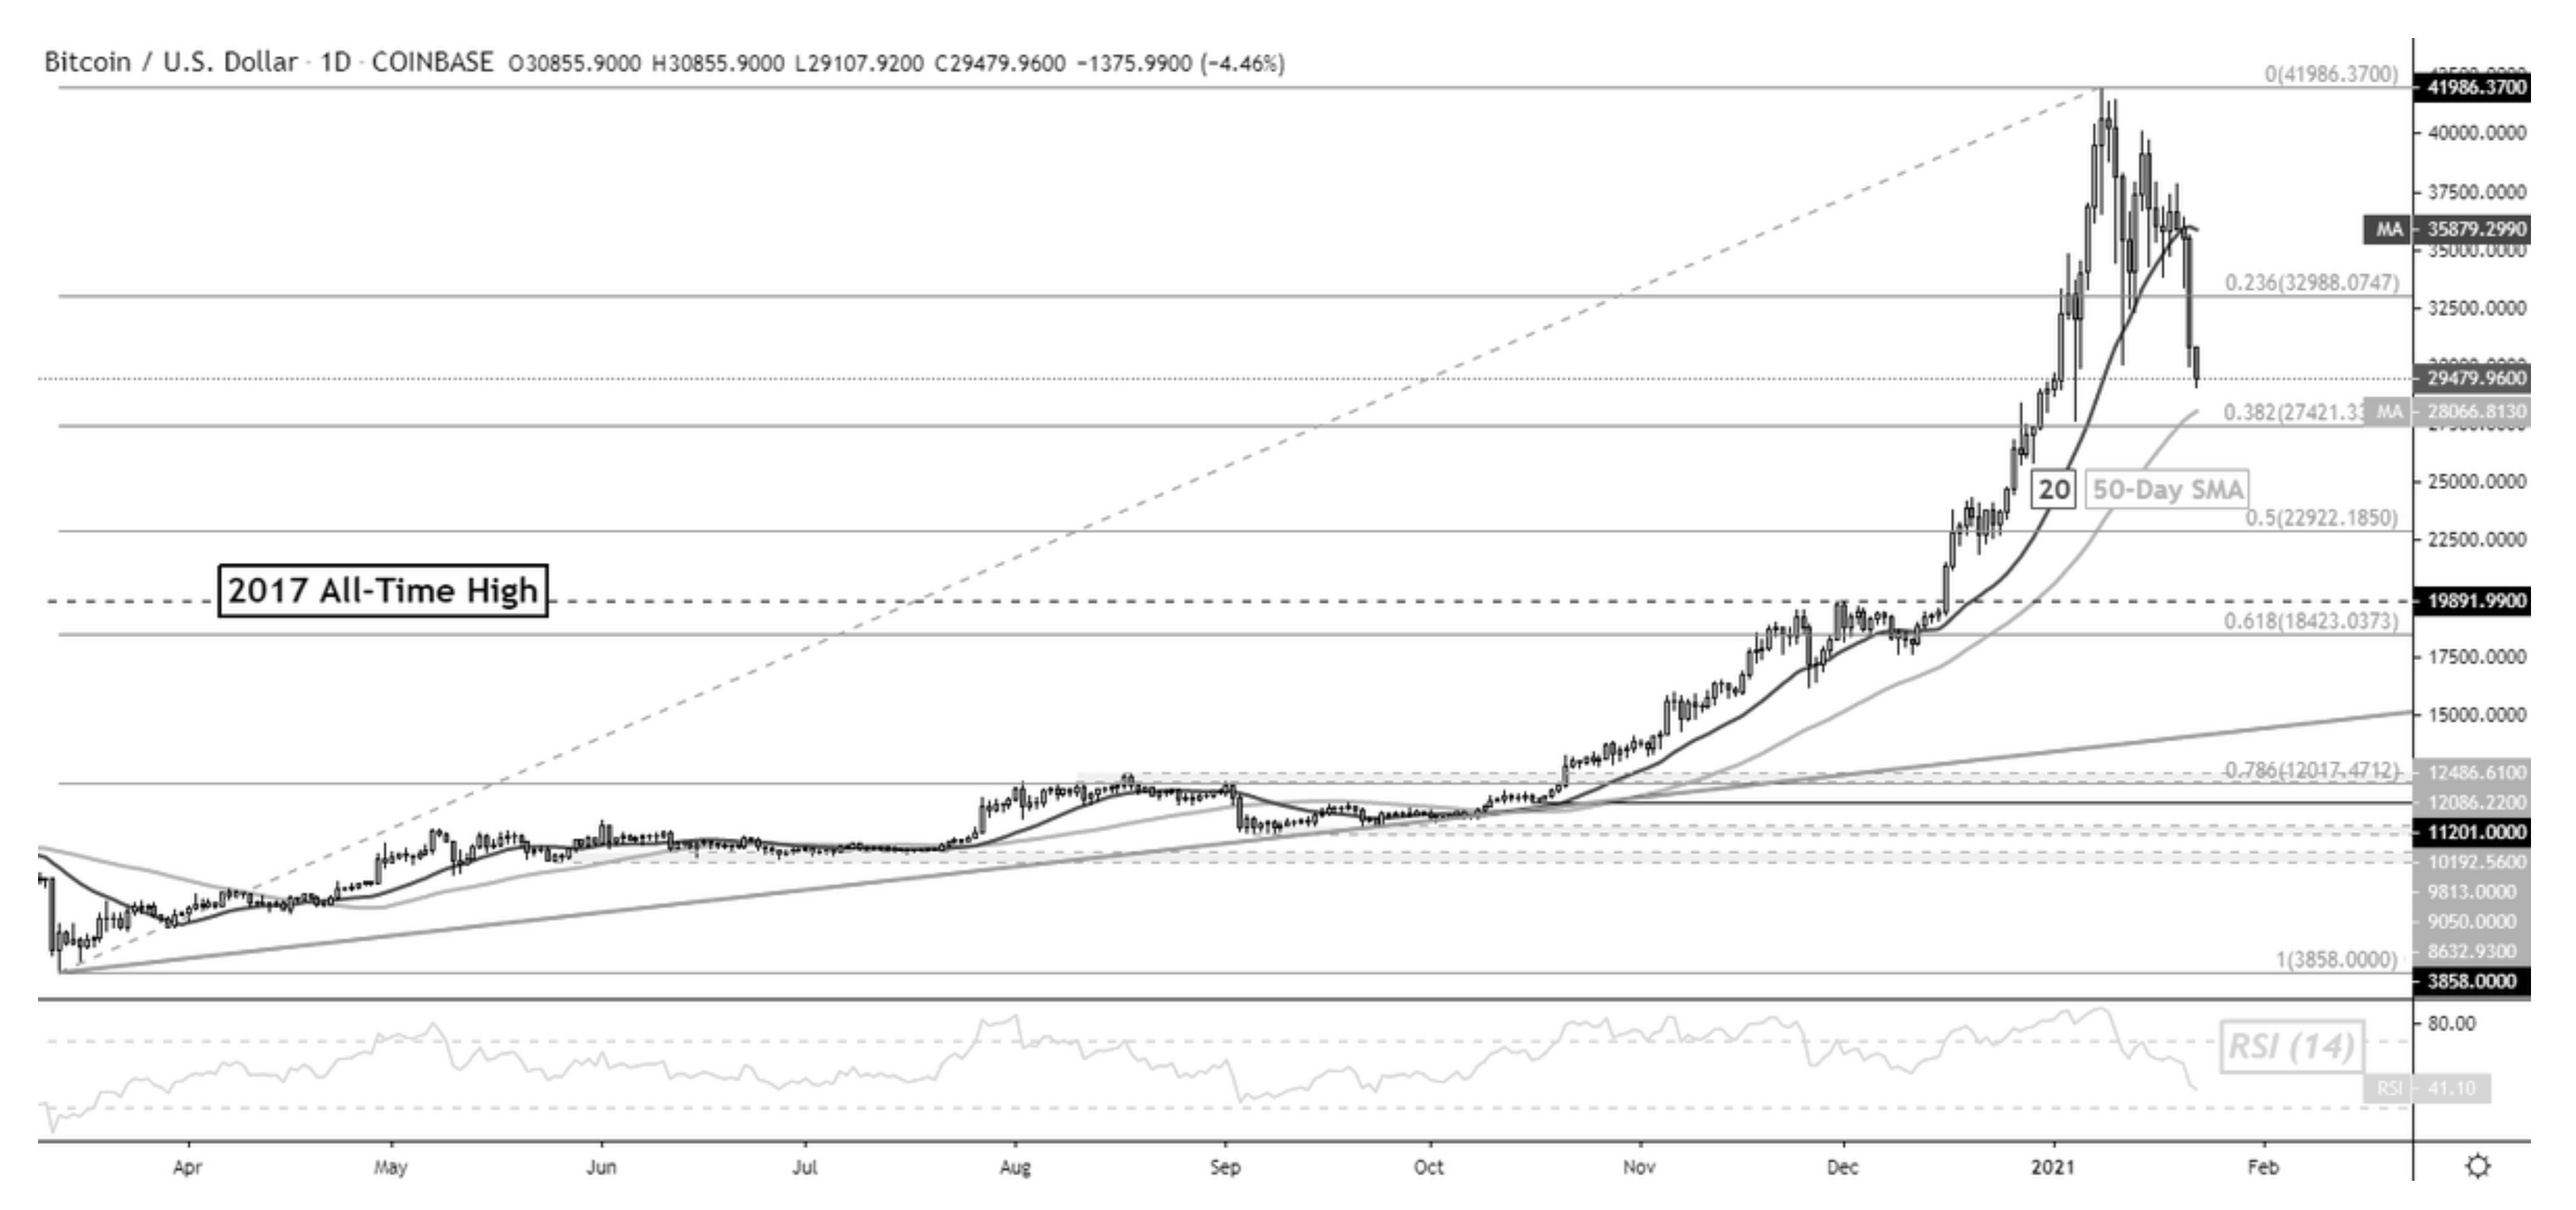
In this regard, it should be noted that Bitcoin has broken the barriers to reach a value over 40,000 USD. Although it is already under this value in January 2021, this cryptocurrency is still an attractive investment for investors. Figure 1 shows the Bitcoin value since April 2020 (X-axis) and the average value in dollars (Y-axis) as well as its evolution over time.
Even so, Bitcoins are still a safe bet as an exchange currency in e-commerce and business, not only because of their electronic nature and potential privacy, but because blockchain technology is the basis of their production and use [3,9].
The acceptance of Bitcoin cryptocurrency by Spanish business executives has, therefore, become an interesting area of study. It is important because Bitcoin can change how companies organize their marketing and business development strategies. Businesses could soon be facing a great change due to the use of Bitcoin and the related blockchain technology. The users who must decide whether to trust this new tendency are the managers of companies.
Therefore, this study fills a research gap for information about the acceptance of Bitcoin in company business by business executives. To study this phenomenon, previous related research was found in the literature [18,20] and, finally, a widely used theoretical adoption model, TAM (technology acceptance model) [21], was used. Four external variables previously used for payment methods and e-banking technologies were added to this model. These variables were perceived security, privacy, risks, and trust.
Therefore, under this context, in order to understand the adoption of Bitcoin by business executives, the present research study stablishes the following objectives:
- To explore the adoption of Bitcoin from a business perspective.
- To understand the role of perceived security, privacy, risks, and trust in the adoption process of Bitcoin.
- To set a reasoned discussion on future research focused on the adoption of Bitcoin in the business ecosystem.
- To understand the adoption process of Bitcoin in companies from the perspective of business executive decision-making.
This paper is divided into five sections. Section 1 presents the theoretical background, reviewing the main theoretical contributions found in the scientific literature about blockchain, cryptocurrencies, and electronic payment methods. Next, the conceptual framework and hypothesis development are presented, followed by the questionnaire design and data collection section, in which the methodology used in this research is described. Subsequently, the results are analyzed, culminating with a discussion of the results and, lastly, the conclusions are presented.
2. Theoretical Background
In recent years, numerous studies analyzed Bitcoin and its influence on different sectors [18,22,23]. It is important to note that these studies were mainly interested in the economic impacts of a possible standardization of cryptocurrency, or on trading it for profit, even when its endurance over time is uncertain [19]. Furthermore, various studies investigated the acceptance of cryptocurrency and why users decided to use it or trade with it [20,24].
Technology acceptance has been widely studied over the years and, in the case of the acceptance of blockchain technology and cryptocurrencies such as Bitcoin, research has been carried out that aimed to understand the adoption type or the adoption process in different industries, sectors, and companies, or directly by individual users [20,23]. Table 1 lists some papers that discussed the adoption of Bitcoin technology as a cryptocurrency.
The research by Li and Wang [24] aimed to give an economic value to the technologies which cryptocurrencies use, paying particular attention to Bitcoin, deeming it to be one of the most sensitive currencies to economic changes due to its high volatility.
In turn, Cheah et al. [27] also studied a cross-market model in their research to find Bitcoin prices from the track record of economic changes experienced over the years, concluding that a negative factor for Bitcoin investment is user confidence due to the high prices.
Glaser et al. [28] also carried out research on Bitcoin as a cryptocurrency in order to find a sensible price to use in predictive modeling of the Bitcoin market and large-scale trading.
Lastly, the research by Hayes [22], identified the factors that determine the validity of information on cryptocurrencies, including Bitcoin. In this study, a cross-sectional model is proposed to find the financial patterns that give Bitcoin prices, as well as differences in the marginal production costs.
3. Conceptual Framework and Hypotheses Development
Various perspectives and models have been used to study technology adoption. One of the most widespread models in technology adoption for payment methods and e-banking is TAM (technology acceptance model) [21], which numerous researchers have applied to related technologies such as cloud computing [29] (Palos-Sanchez et al., 2017) and mobile banking [30,31].
Subsequently, TAM has evolved into other models, such as TAM2 [32] and extended TAM. In this research, the original TAM model [21] had additional factors added to it which resulted in an extended TAM model. This was also done in previous studies on blockchain and cryptocurrencies [23,33,34].
The TAM model establishes causal relationships among the variables of perceived usefulness (PU), perceived ease of use (PEOU), attitude toward using (ATU), and intention to use (IU), including the influence of attitude to using (ATU) and behavioral intention to use (BIU) via perceived usefulness (PU) and perceived ease of use (PEOU) [35,36,37]. However, several studies proposed extending the original TAM model (Davis, 1989) [21] by adding external variables in order to explore the effects of external factors on attitude toward using and behavioral intention to use technology [38,39].
This has been found to be useful in research when studying the acceptance of different technologies in different contexts and has proven to be a reliable tool [40,41].
TAM is probably one of the most widely cited models in the field of technology acceptance [42] and has received substantial empirical support over the years [43].
In this research, the trust variable, defined as the confidence that users have in Bitcoin technology, was used to complete the model [21,44]. ATU reflects favorable or unfavorable feelings toward the use of a given technology [45]. In turn, the PU variable is defined as the degree to which individuals believe that using a particular system improves performance [21]. PEOU, meanwhile, refers to the degree to which an individual believes that the use of a particular system is effortless [46]. The privacy variable refers to the users’ privacy when using Bitcoin technology [20]. Risk is defined as the perceived risks taken when using Bitcoin technology [18]. Lastly, perceived security refers to the security problems which users believe they could have when using this technology [47,48].
In the research by Folkinshteyn and Lennon [20], variables that affect the acceptance of Bitcoin technology were added, using the trust variable to measure the influence of privacy on this cryptocurrency, which gives the importance of their analysis. Diniz et al. [18], likewise, proposed a technology adoption model for bank managers in Brazil, in order to find the degree to which Bitcoin had been adopted. The research emphasized the importance of trust in the cryptocurrency, as well as the privacy felt when using it. On the basis of this literature, the following hypothesis was proposed:
Hypothesis (H1).
Trust influences privacy in the Bitcoin adoption process by Spanish executives.
Diniz et al. [18], researched the influence of trust on perceived usefulness, demonstrating the influence that this variable has on Bitcoin adoption. Folkinshteyn and Lennon [20] also used these variables to create a Bitcoin adoption model [49]. The following hypothesis was proposed on the basis of this research:
Hypothesis (H2).
Trust influences perceived usefulness (PU) in the Bitcoin adoption process by Spanish executives.
Diniz et al. [18] also measured the influence of the trust variable on perceived usefulness and on perceived ease of use of Bitcoin technology. Dauda and Lee [50] and Folkinshteyn and Lennon [20] also studied the relationship and influence of trust on perceived ease of use in their research. After taking these studies into account and reviewing the literature, the following hypothesis was proposed:
Hypothesis (H3).
Trust influences perceived ease of use (PEOU) in the Bitcoin adoption process by Spanish executives.
The research by Dauda and Lee [50] showed how the adoption of cryptocurrencies can influence consumer behavior. The influence of perceived risk and the aversion to risk that electronic commerce users and consumers have when accepting Bitcoin technology were investigated. Trust was directly linked to risk for the use of Bitcoin [51]. These two variables are thought to be linked, due to aversion to risk and trust when using this cryptocurrency. Folkinshteyn and Lennon [20] also emphasized the importance of risk and trust in a study of Bitcoin technology adoption. From this literature review, the following hypothesis was formulated:
Hypothesis (H4).
Risk influences trust in the Bitcoin adoption process by Spanish executives.
The research by Urquhart [52], studied the acceptance of the Bitcoin economy, analyzing price-related information and showing that the risks are directly linked to the perceived usefulness of Bitcoin as a cryptocurrency. Likewise, Junadi and Fenrianto [48] once again proposed a technology adoption and use model, the unified theory of acceptance and use of technology (UTAUT), to measure the influence of risks on perceived usefulness in the process of adoption and use of Bitcoins, placing special emphasis on virtual payment methods. On the basis of this research, the following hypothesis was proposed:
Hypothesis (H5).
Risk influences perceived usefulness (PU) in the Bitcoin adoption process by Spanish executives.
Thong et al. [53] and Folkinshteyn and Lennon [20] constructed technology acceptance models in their research and made the link between risks and perceived ease of use (PEOU) for Bitcoin users [54]. From the research such as that mentioned above, the following hypothesis was formulated:
Hypothesis (H6).
Risk influences perceived ease of use (PEOU) in the Bitcoin adoption process by Spanish executives.
Folkinshteyn and Lennon [20], showed the influence of the privacy afforded to consumers who use Bitcoin and its influence on perceived ease of use and, therefore, acceptance of Bitcoin. In addition, Lee [55] noted that this is one of the main reasons why Bitcoin and the technology related to it could be used around the world [56]. From the literature, the following hypothesis was proposed:
Hypothesis (H7).
Privacy influences perceived ease of use (PEOU) in the Bitcoin adoption process by Spanish executives.
Lee [55] and Folkinshteyn and Lennon [20] measured the influence of the privacy variable on the perceived usefulness of Bitcoin, taking into account that privacy determines the effect of users’ concerns about their data and the perceived ease of use of cryptocurrency. Perceived usefulness reflects whether users perceive Bitcoin as useful regardless of whether they understand its main functionalities [18].
Hypothesis (H8).
Privacy influences perceived usefulness (PU) in the Bitcoin adoption process by Spanish executives.
Folkinshteyn and Lennon [20] and Urquhart [52] discussed the influence of PEOU on PU, given that the TAM directly links the perceived usefulness of a technology to the perceived ease of use of that technology, which could influence its acceptance and use. On the basis of the research indicated, the following hypothesis was proposed:
Hypothesis (H9).
Perceived ease of use (PEOU) influences perceived usefulness (PU) in the Bitcoin adoption process by Spanish executives.
Folkinshteyn and Lennon [20] and Diniz et al. [18] analyzed the influence of PEOU on ATU for the adoption of Bitcoin technology, taking into account that perceived usefulness could predetermine the attitude toward using this technology among consumers or managers with decision-making power. After analyzing the literature presented, the following hypothesis was proposed:
Hypothesis (H10).
Perceived ease of use (PEOU) influences attitude toward usage (ATU) in the Bitcoin adoption process by Spanish executives.
Folkinshteyn and Lennon [20] and Diniz et al. [18] indicated in their research that the attitude toward using Bitcoin could influence the use of the cryptocurrency and, therefore, factors such as privacy, trust, or understanding why it is useful could influence the attitude toward using and the use of Bitcoin. From the research indicated, the following hypothesis was proposed:
Hypothesis (H11).
Attitude toward using (ATU) influences intention to use in the Bitcoin adoption process by Spanish executives.
Blundell-Wignall [57] and Bradbury [58] studied trust and perceived security of Bitcoin users. In a Bitcoin acceptance model, Junadi and Fenrianto [48] used the perceived security construct to analyze obstacles that Bitcoin users encounter for acceptance, which determine their attitude toward use, giving rise to the following hypothesis:
Hypothesis (H12).
Perceived security influences attitude toward using (ATU) in the Bitcoin adoption process by Spanish executives.
As stated before, Junadi and Fenrianto [48] created a model to find Bitcoin and cryptocurrency use relationships with perceived security and the way consumers use Bitcoin. Using the research stated, the following hypothesis was proposed:
Hypothesis (H13).
Perceived security influences behavioral intention to use in the Bitcoin adoption process by Spanish executives.
Presthus and O’Malley [23], Folkinshteyn and Lennon [20], and Junadi and Fenrianto [48] studied the link between the perceived usefulness of Bitcoin as a cryptocurrency and the way it is used by consumers in different sectors. It was found that the use of Bitcoin as a cryptocurrency depends on the perceived usefulness that users have before using it, among other factors. Using the consulted literature, the following hypothesis was formulated:
Hypothesis (H14).
Perceived usefulness (PU) influences behavioral intention to use (BIU) in the Bitcoin adoption process by Spanish executives.
As indicated above, the papers by Blundell-Wignall [57], Junadi and Fenrianto [48], Lee [55], and Folkinshteyn and Lennon [20] all showed the importance of analyzing the perceived usefulness of Bitcoin, as well as analyzing the target audience for the technology. The influence of the attitude toward using Bitcoin as an emerging technology was studied along with other constructs. From the literature presented, the following hypothesis was proposed:
Hypothesis (H15).
Perceived usefulness (PU) influences attitude toward usage (ATU) in the Bitcoin adoption process by Spanish executives.
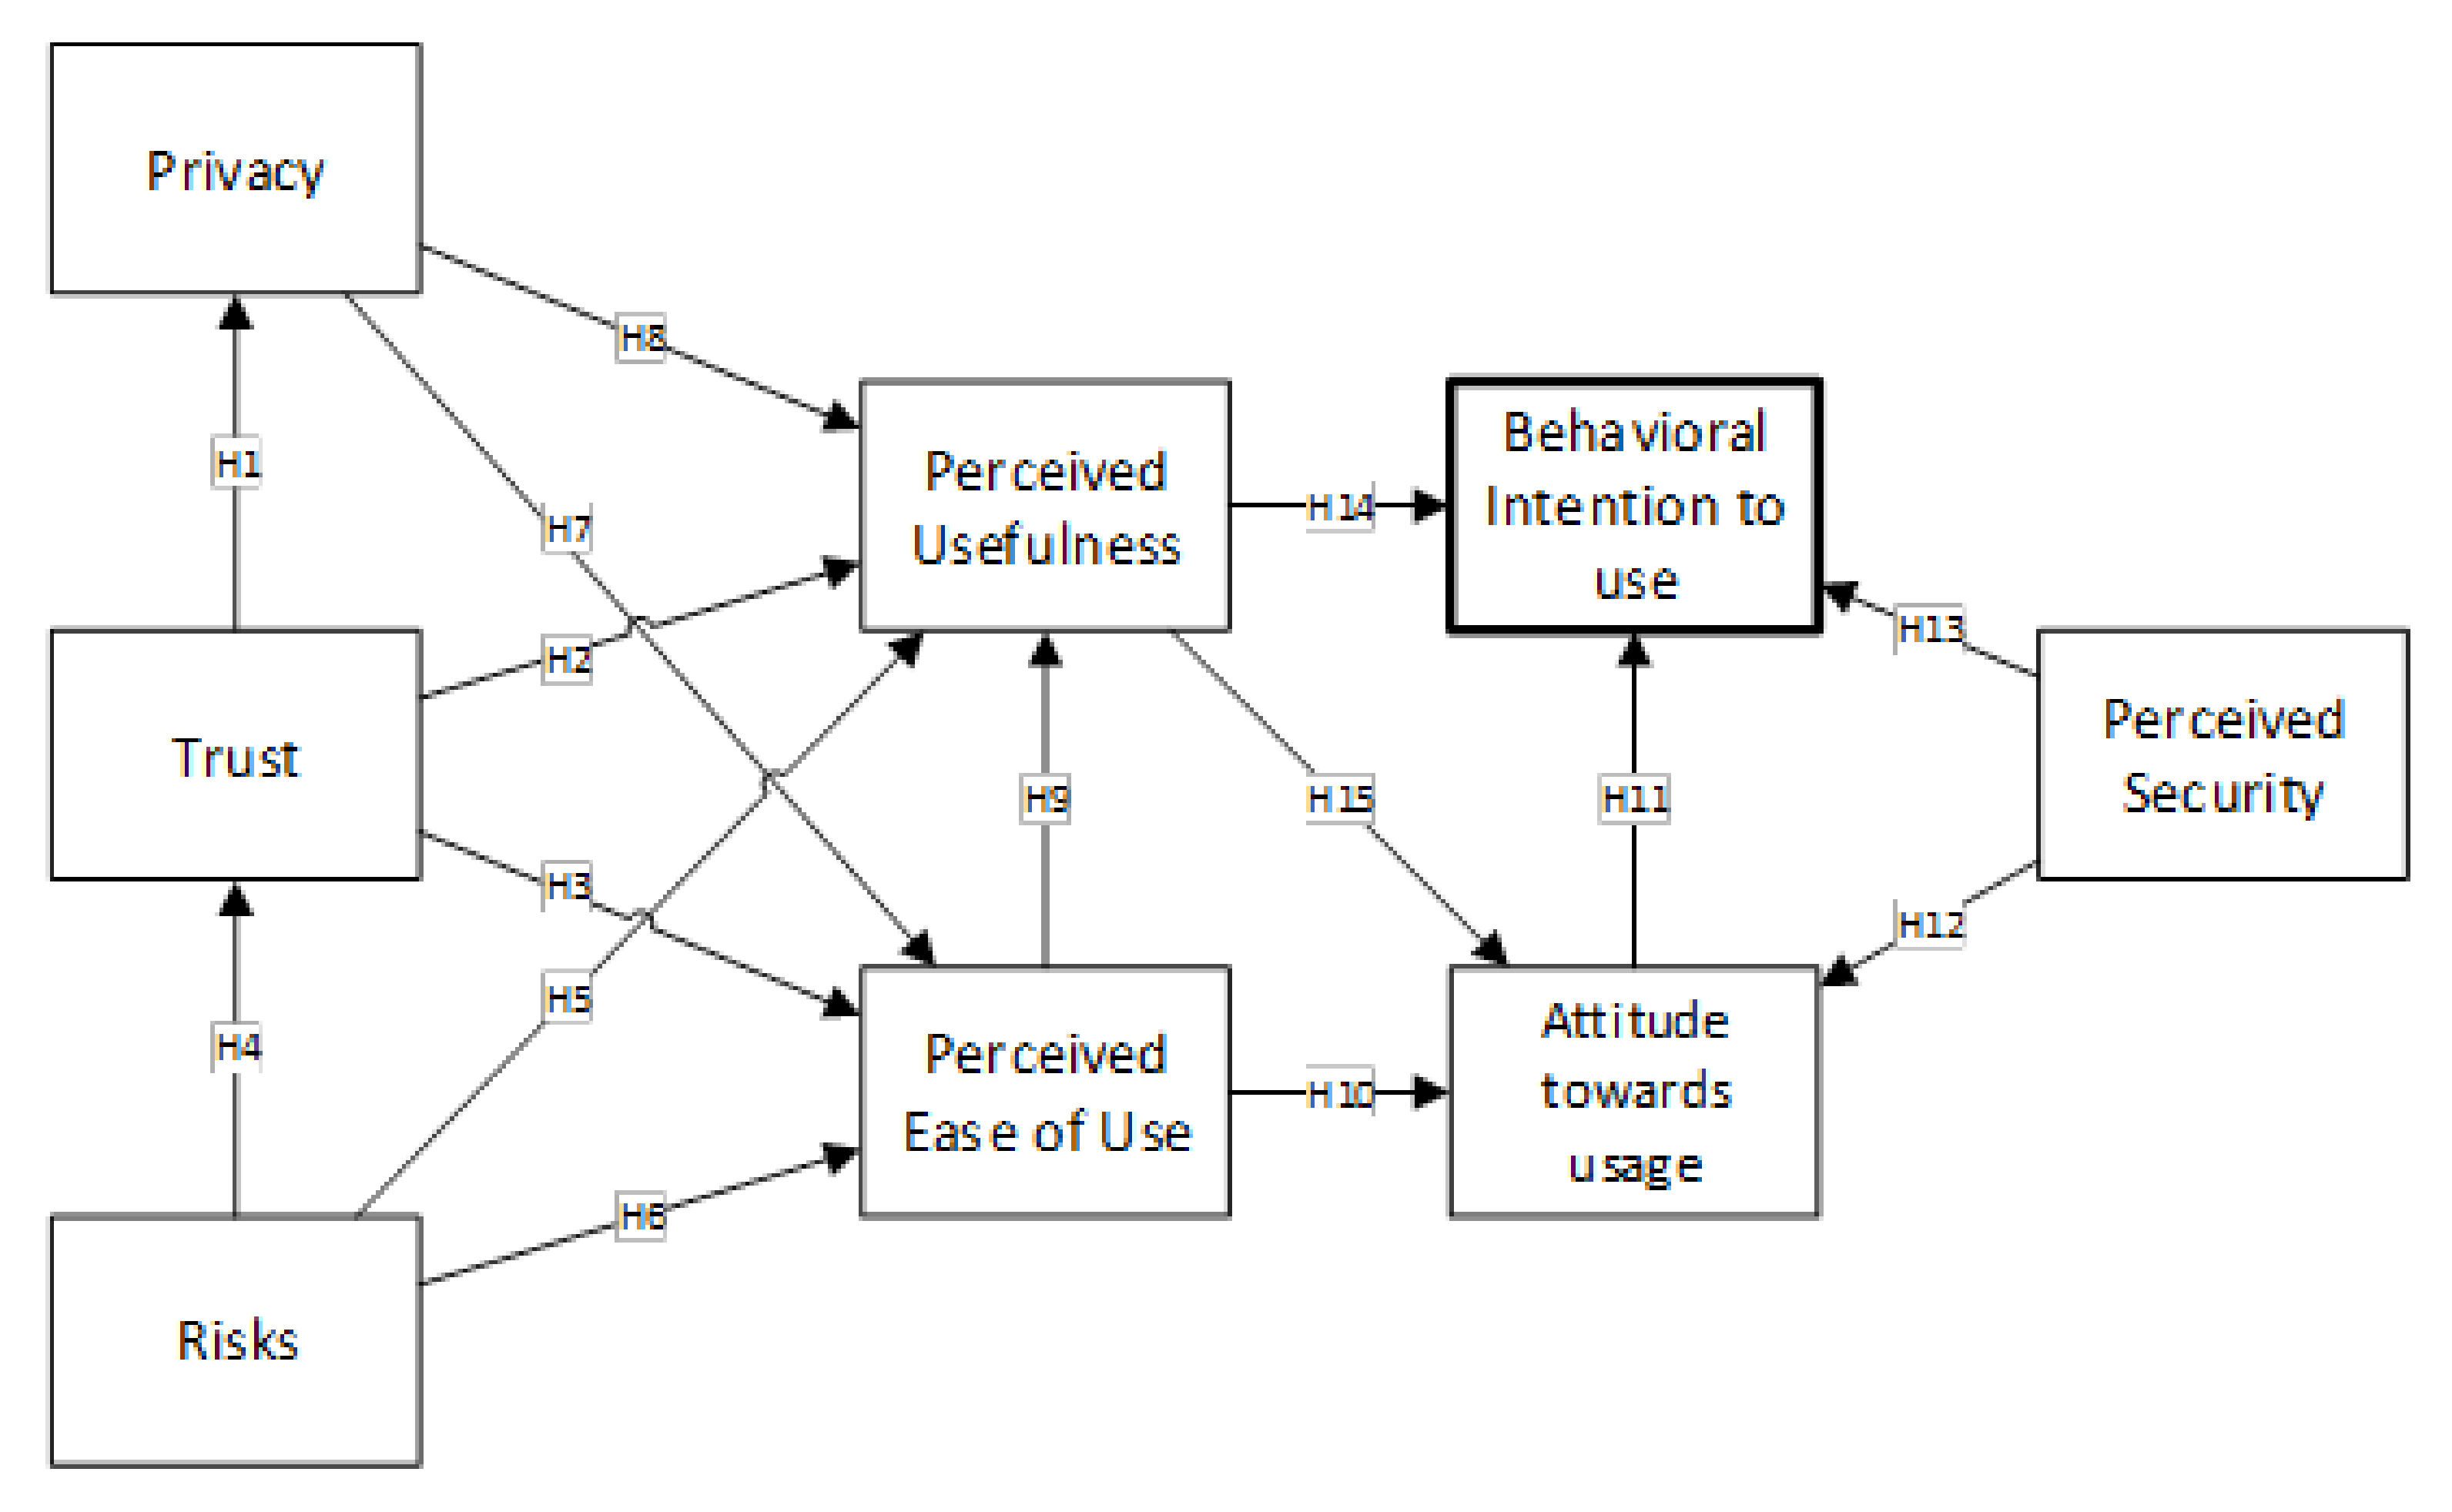
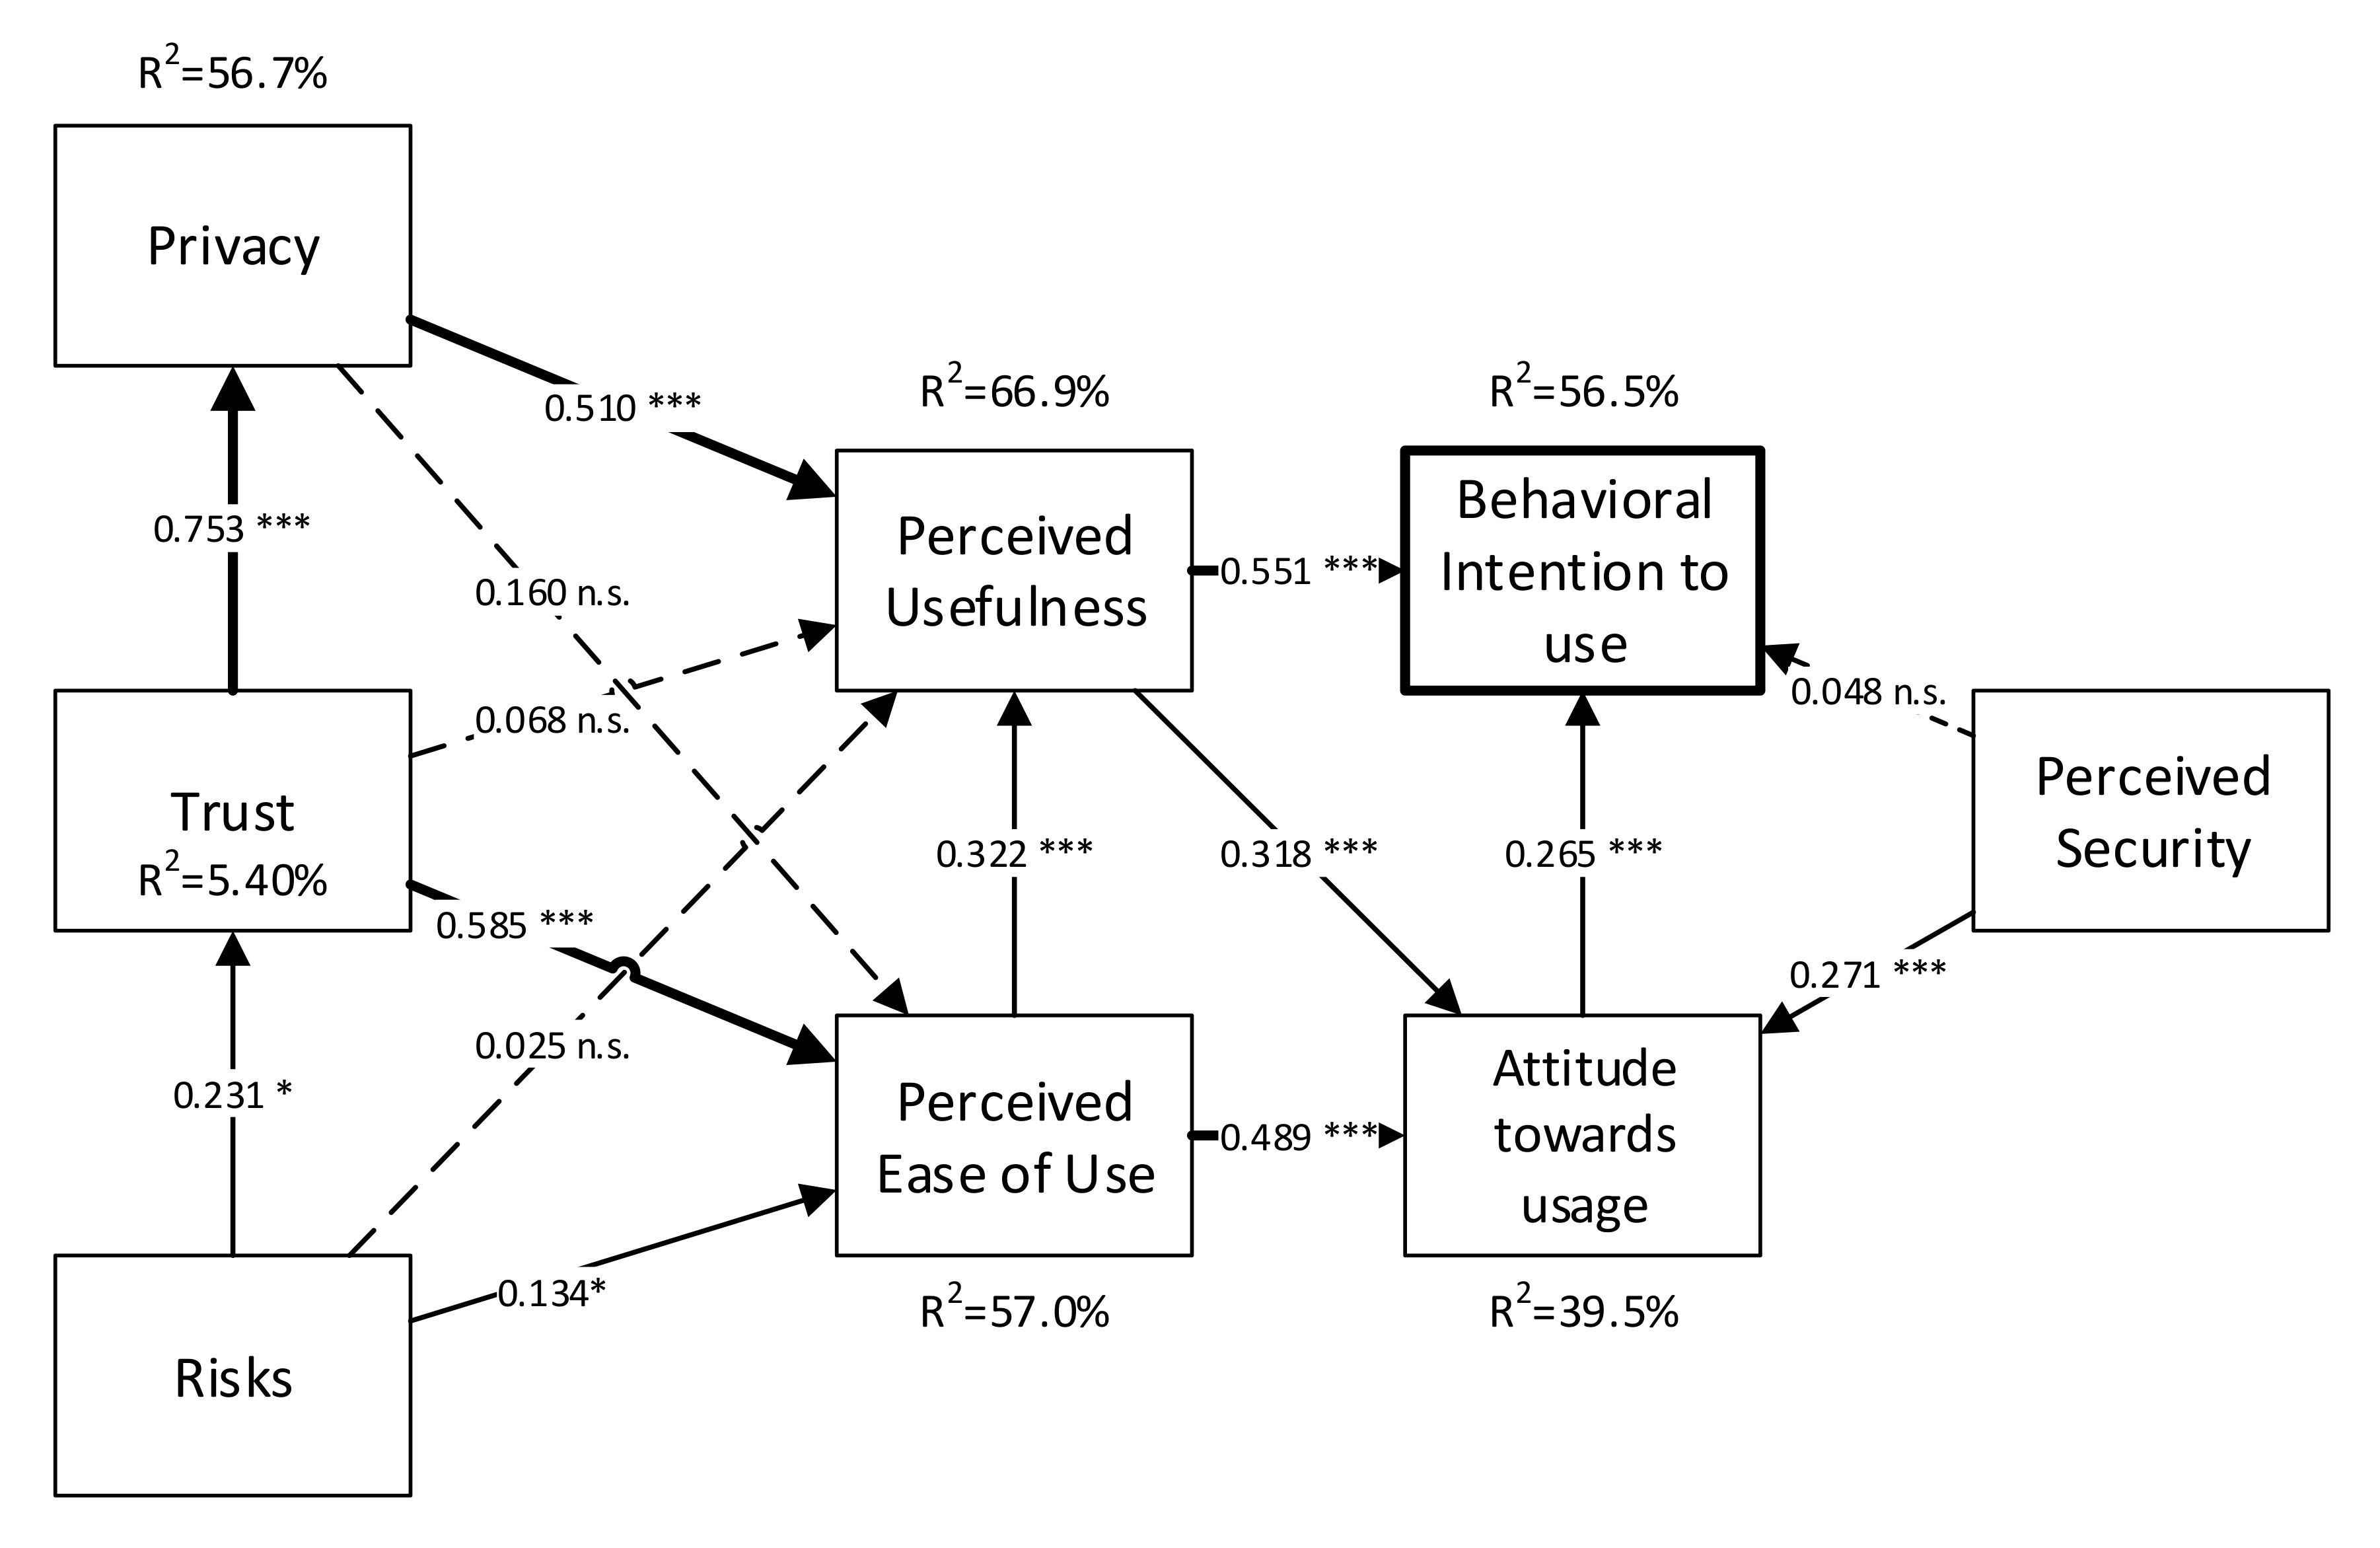
The proposed research model is shown in Figure 2 below. The main dependent variable is outlined in bold to identify the main construct that might help us understand how Spanish executives make use of Bitcoin cryptocurrency in their companies.
4. Methodology
4.1. Questionnaire Design
The research technique chosen to gather the data was the questionnaire, which is a quantitative technique. It enabled us to understand the perceptions and attitudes of professionals to blockchain technology and, more specifically, Bitcoin. The questionnaire contained 23 questions about attitudes and behaviors, along with five classification questions, namely, gender, age, job, residence, and education level. The questionnaire was structured in three categories. The sections dealt with questions about the TAM model [35] and how it relates to blockchain technology and cryptocurrencies [23,33,34], questions about the respondents’ behavior, and their perceptions and attitudes toward the adoption and use of Bitcoin (see Appendix A).
Another section contained 11 questions broken down into PU (3), PEOU (4), ATU (2), and BIU (2). The scales for the TAM model variables were measured using adapted items [35]. The elimination of some items from the model was due to the fact that the values obtained did not have a sufficient level of validity and were, therefore, discarded. The second section consisted of a block of questions about some details of cryptocurrencies and blockchain technology. These questions were grouped into risks (2), trust (4), privacy (4), and perceived security (2). The behavioral items for the use of blockchain technology and cryptocurrencies as a payment method were adapted from studies on privacy [59,60,61], perceived security [48], and risks [20,23,60,61].
There were a total of 29 items in the research questionnaire. Every item, except the demographic profile, was assessed using a five-point Likert scale ranging from “strongly disagree” (1) to “strongly agree” (5).
4.2. Data Collection
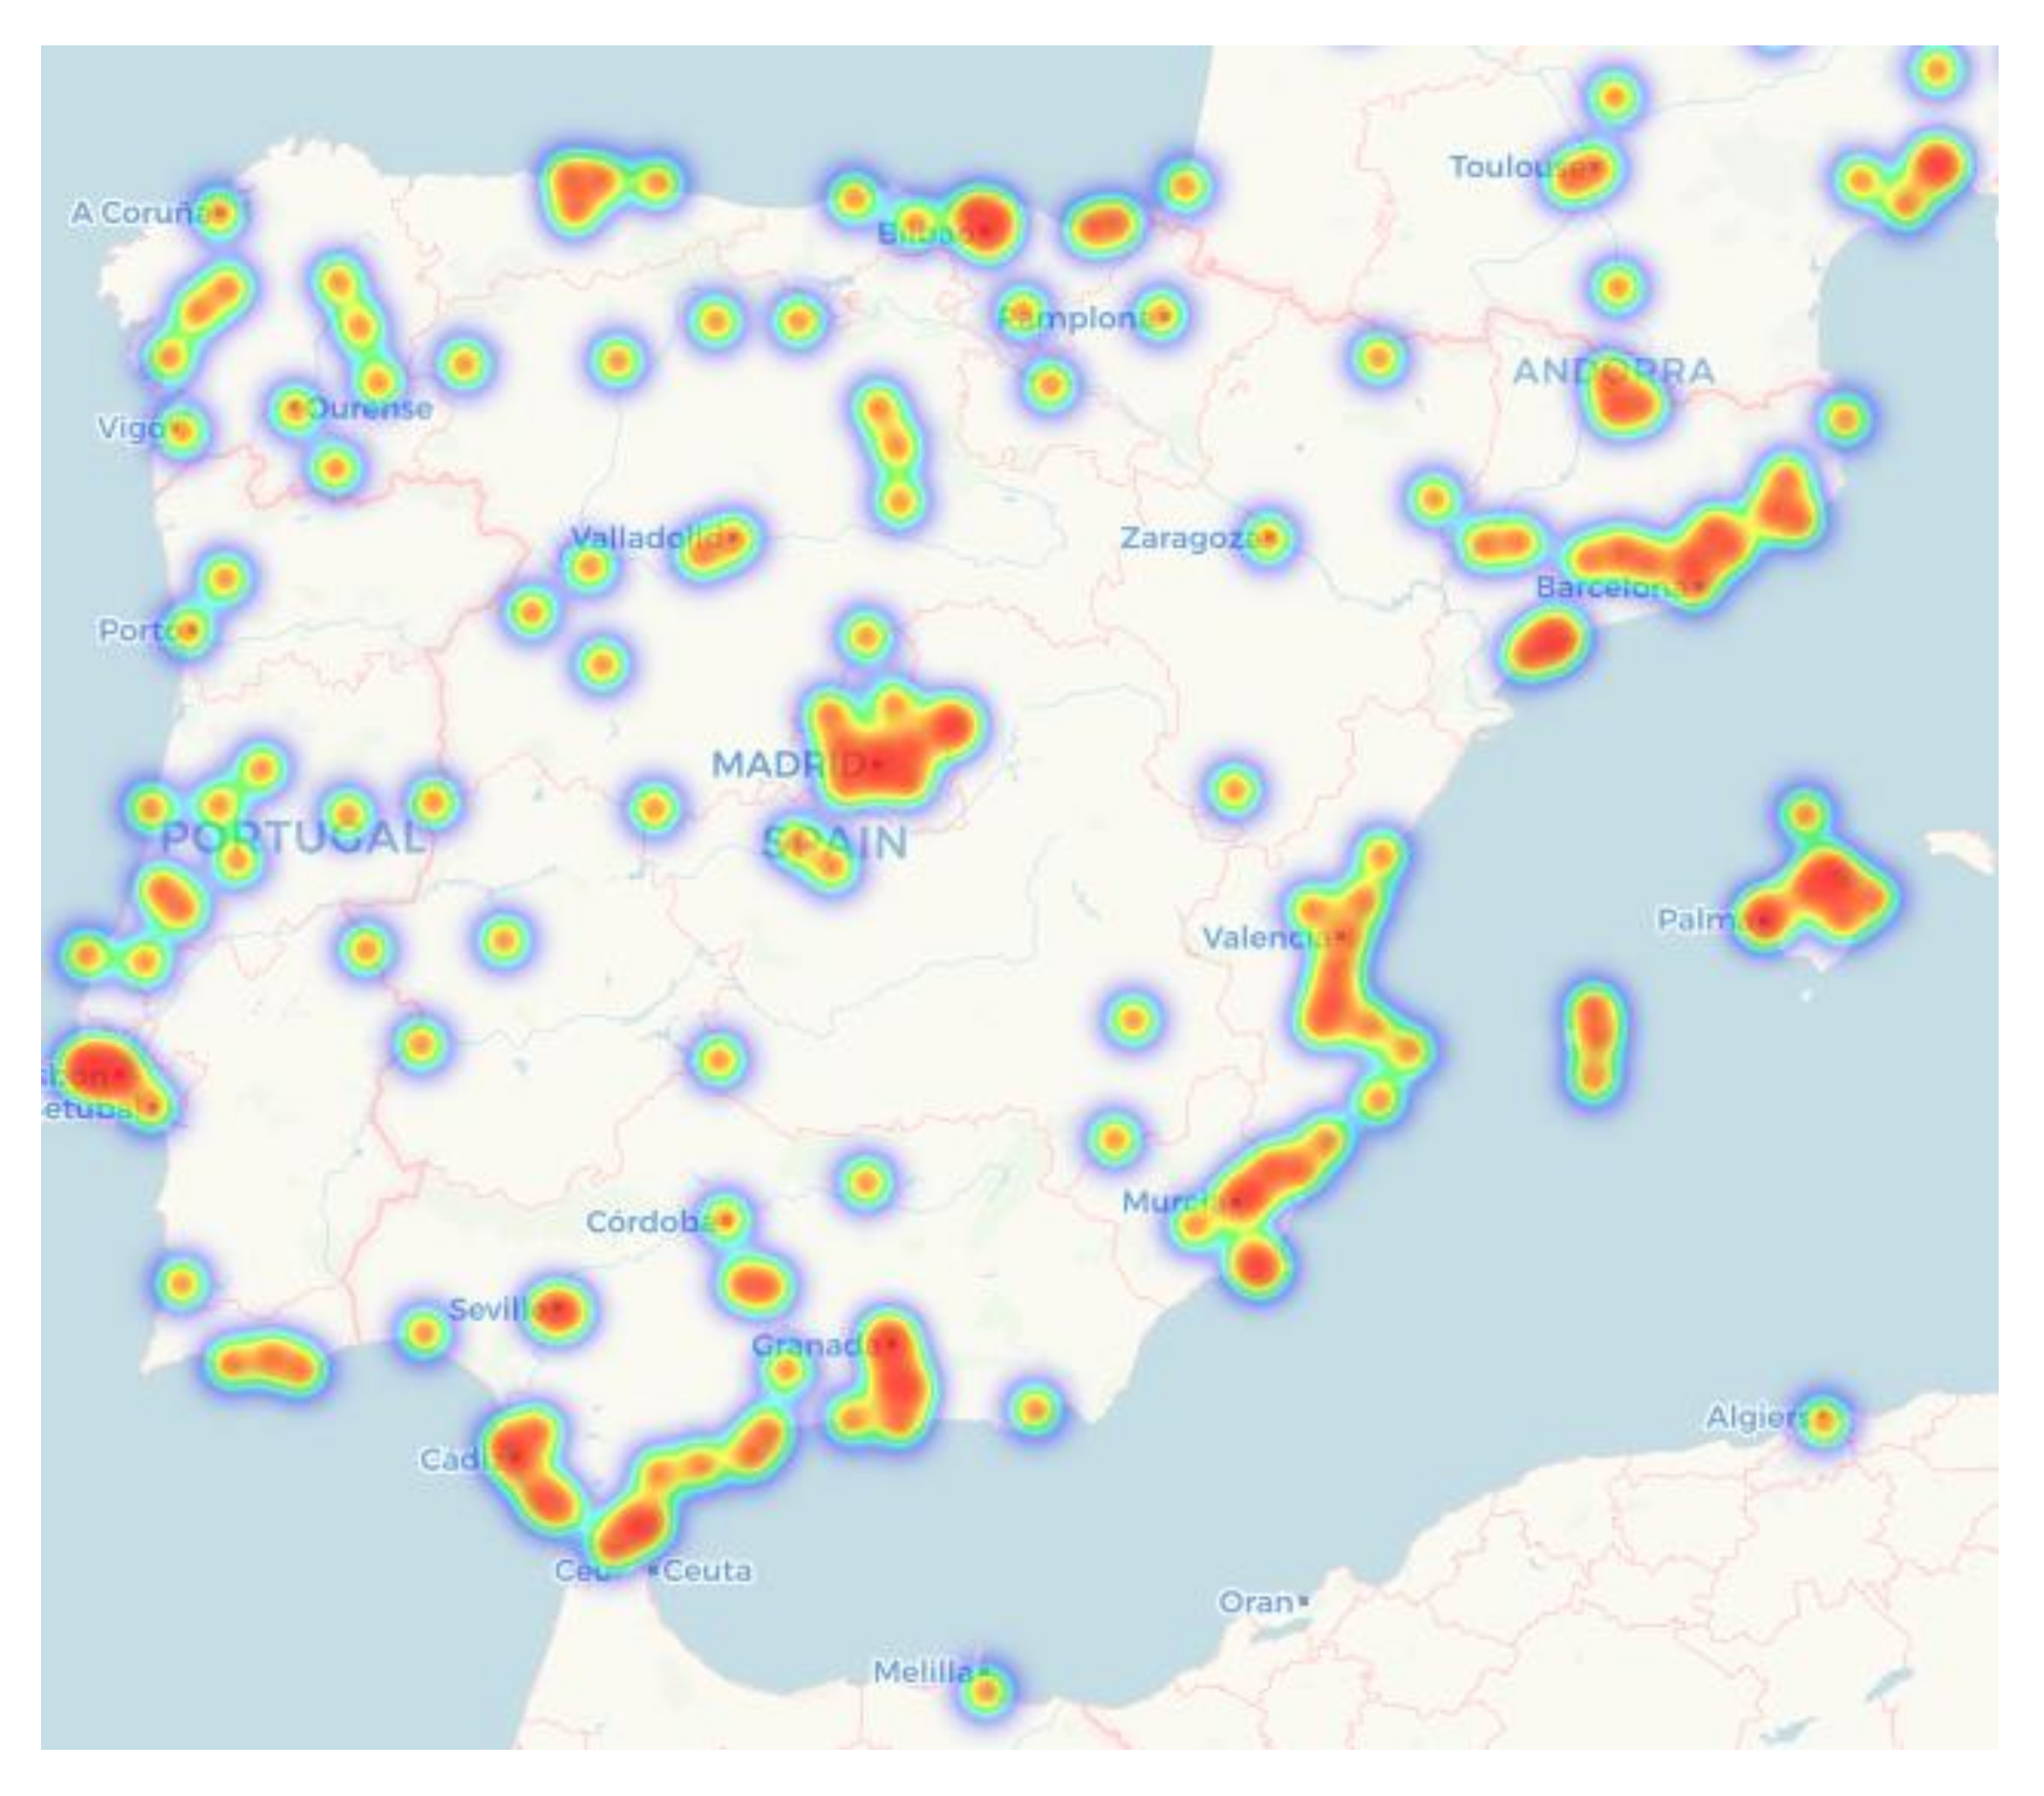
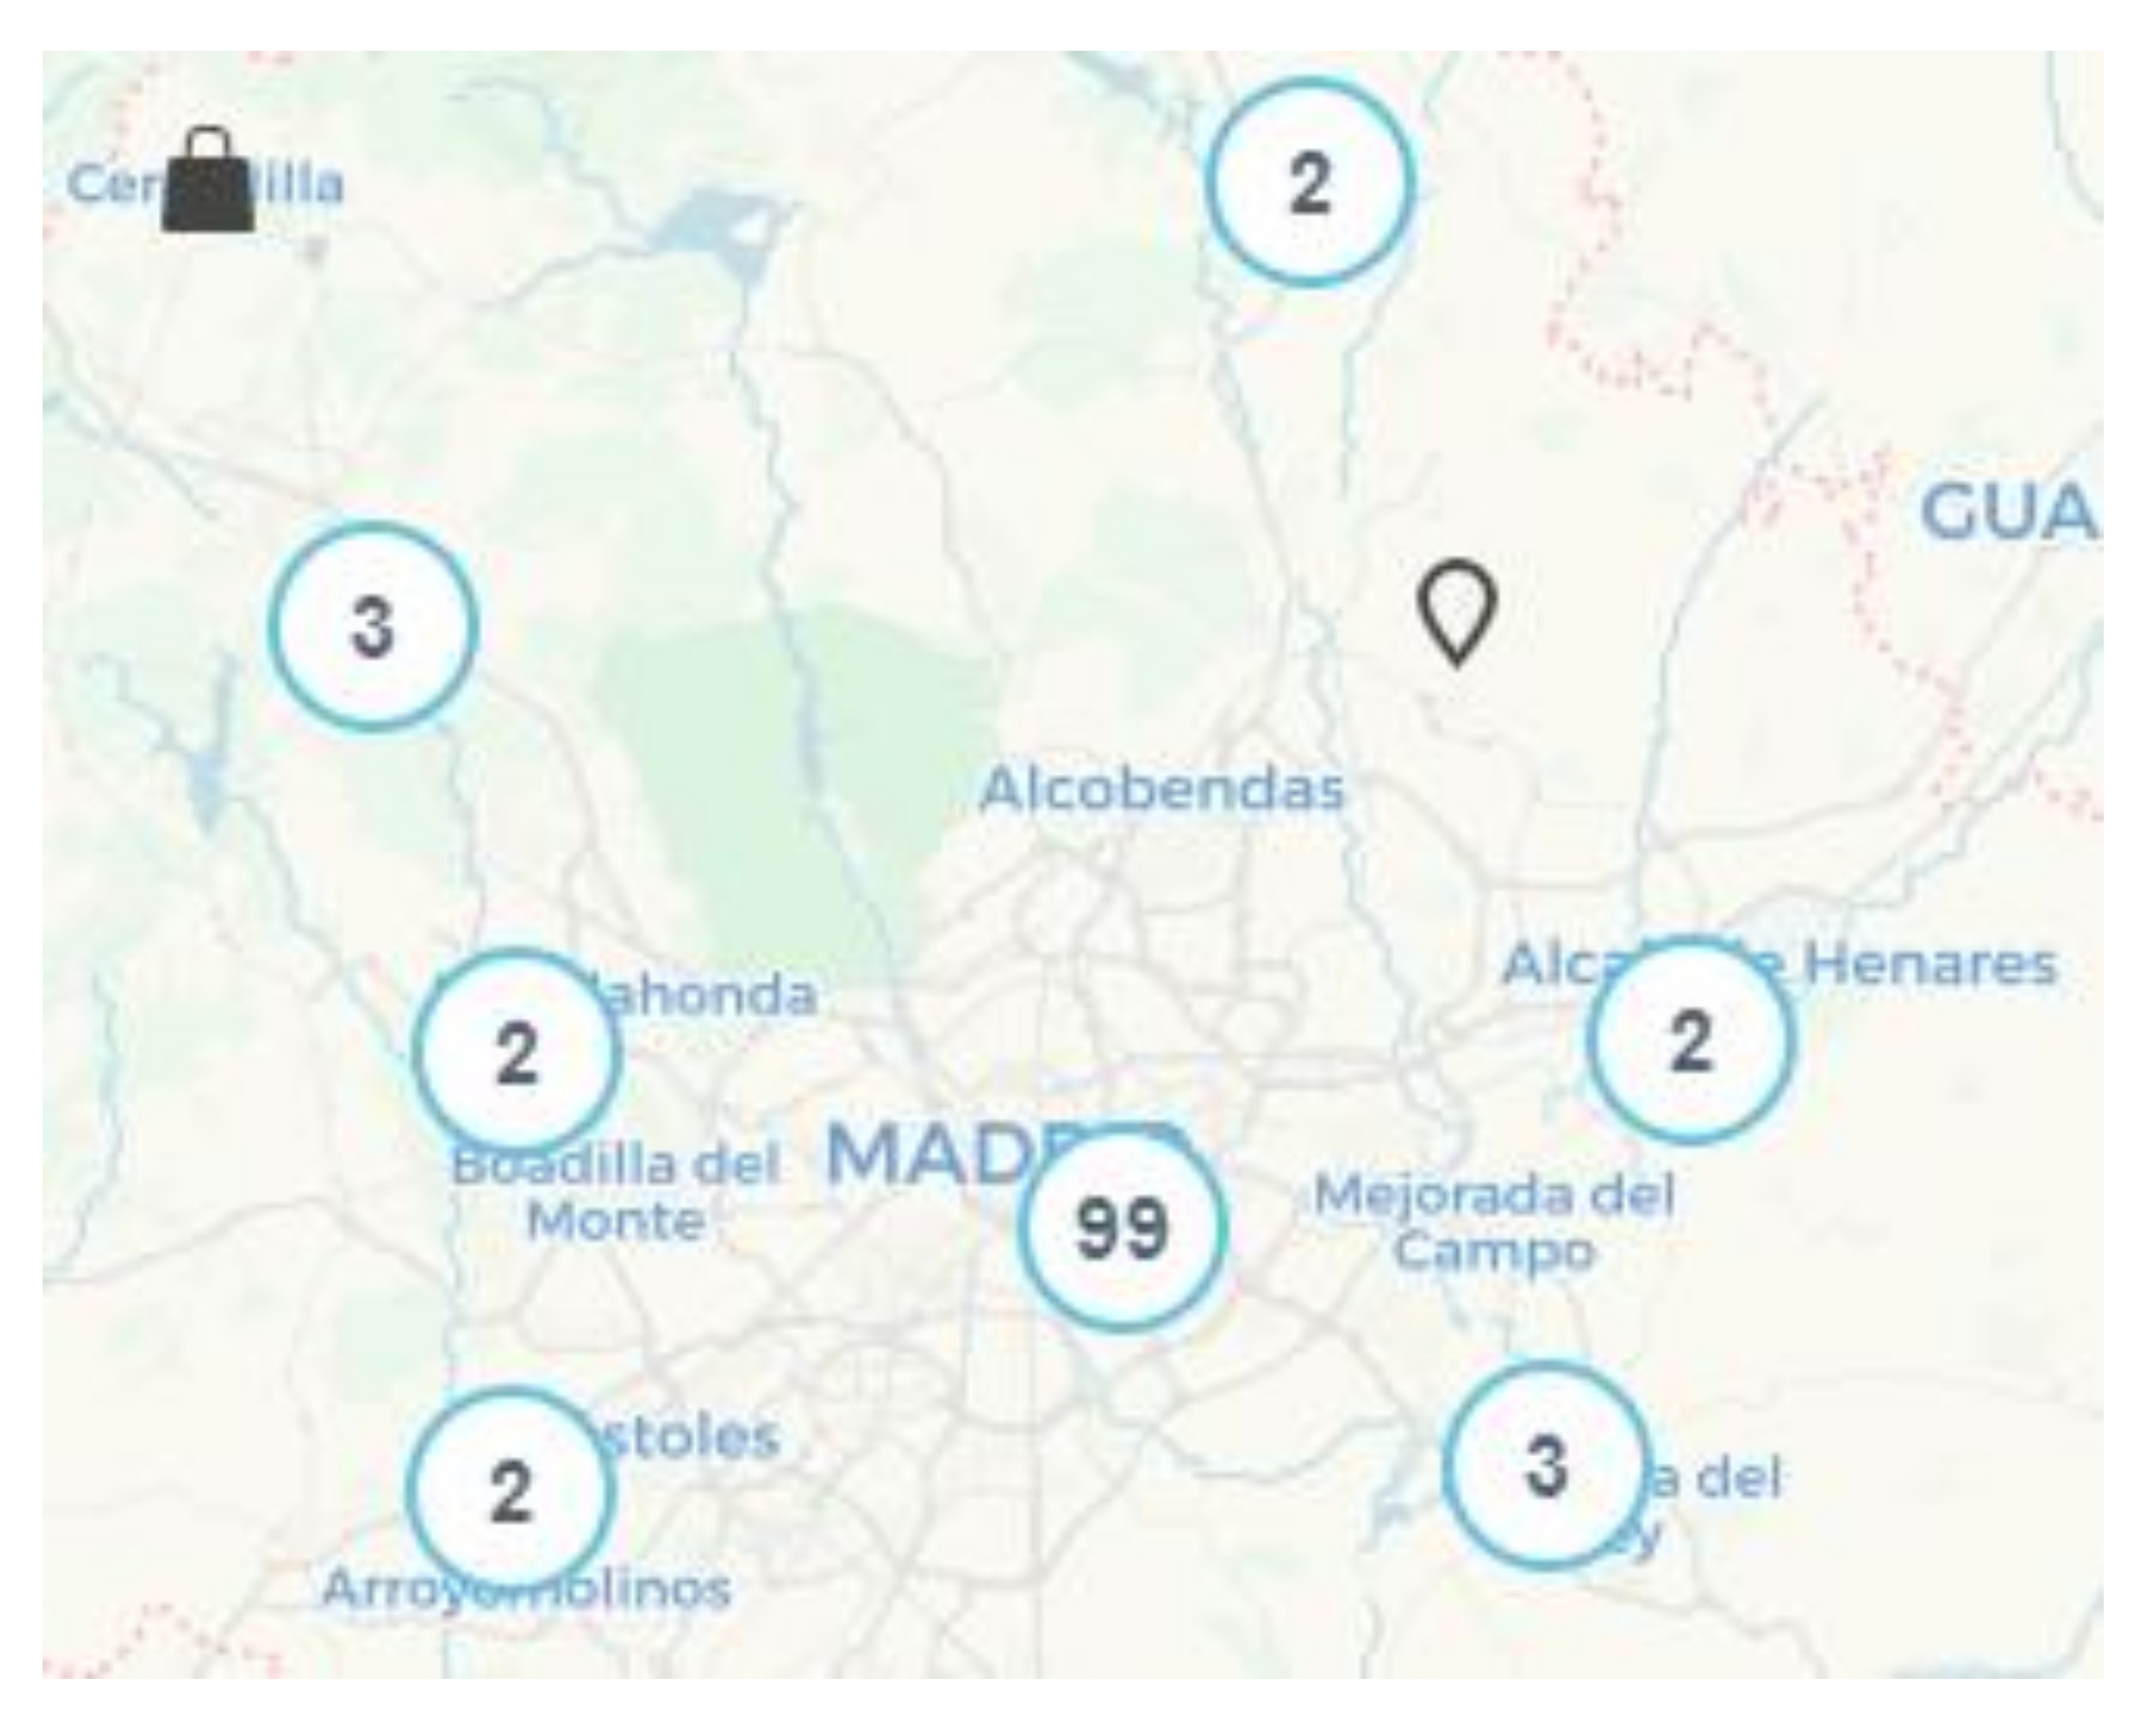
The target population was estimated from the data published by Coinmap.org [62] about the number of establishments and businesses that allow Bitcoin transactions. The central region of the Iberian Peninsula can be seen in Figure 3, and Madrid stands out for the businesses that have used transactions with Bitcoin cryptocurrency. Having selected the scope of the study, the population was estimated. This estimate was made from the geographic scope and the number of companies that allow their clients to pay for products or services with Bitcoin. This study covered the region of Madrid, which includes the Spanish capital city and the surrounding towns and cities. Coinmap.org [62] gave information about the geographic location (see Figure 4) of the establishments. The questionnaires were collected from February to April 2018, using a non-probabilistic convenience sampling technique.
Although some of the businesses and retailers could not be found, other companies were detected during the field survey because they advertised their acceptance of Bitcoin payment. Finally, the population was n = 264, from which a sample of (n = 248) validated questionnaires was obtained (See Figure 4).
The demographic characteristics of the sample are shown in Table 2. A total of 248 questionnaires were collected at different shopping centers and office buildings in the region of Madrid, all of which were valid. Google Forms was used to create the online survey, which was filled out directly at the point of sale or in the company’s offices (see Table 2).
SPSS 24 statistical software was used to calculate the frequency and statistics tables for the sample.
Structural equation models (SEMs) with variance were used to analyze the data and test hypotheses, as this allowed us to statistically analyze a series of interrelated dependency relationships between variables. Calculations were made using analysis theory and indicator variables, which were measured with directly observable variables [63]. Of the different SEM techniques available, the partial least squares (PLS) regression technique was chosen for this study. PLS trajectory modeling is a complete SEM method for factorial and composite models, which measures the constructions, estimates the structural models, and performs fit tests on the models [64].
The PLS-SEM method is a statistical analysis technique based on the structural equation model and was chosen for its use since it is especially recommended for exploratory research, because latent constructions can be measured with indicators [65]. PLS-SEM was chosen because one of the main objectives of the present study was to test whether our model (see Figure 1) was predictive or not [66,67,68]. Furthermore, PLS is more appropriate if the aim of the study is to predict and investigate relatively new phenomena [67]. SmartPLS 3 software was used to carry out the calculations and analysis in this study [69].
The application of PLS is often suggested when there are a limited number of observations [70]. This approach was applicable in our case, due to the small sample size (n = 248). To establish the minimum sample size for PLS modeling, Hair and others [71] recommended the use of Cohen tables [72]. The effect sizes reflect the statistical power of the research model. The effect size (f2) evaluates the degree to which an exogenous latent variable contributes to the R2 value of an endogenous latent variable. F2 values of 0.02, 0.15, and 0.35 indicate a small, medium, and large effect size [73]. Cohen’s tables [74] showed that a medium effect size (f2 = 0.15) with a power of 95.18% required a minimum of 107 questionnaires. Therefore, this research has adequate statistical power.
Another reason for choosing the PLS-SEM was that the topic under study is comparatively new and the methodology has not yet been consolidated. Furthermore, an exploratory method was adopted [68] for which this data analysis method is highly suggested.
5. Results
5.1. Measurement Test Model
The measurement model or internal model was tested by measuring the individual reliability of each item, the internal consistency or reliability of each scale or construct, the convergent validity, and the discriminant validity.
As can be seen in the last column of the table in Appendix A, the individual reliability of the load (λ) of the item was calculated (see loading factor). The minimum acceptance level was λ ≥ 0.707 [75], and items PU4 and PU5 were disregarded because they did not reach this minimum value.
The measurement model test included internal reliability, convergent validity, and discriminant validity. Internal reliability was found using the value of Cronbach’s alpha, where a value of 0.70 indicates acceptable internal reliability [76]. Loaded indicators and composite reliabilities were used to analyze causality [77].
As all the Cronbach’s alpha values were higher than 0.7; thus, all the constructs were confirmed to show internal reliability [68,78,79]. Fornell and Larker [80] suggested using the average variance extracted (AVE) to assess convergent validity. They recommended a value of average variance extracted or AVE ≥ 0.50 as acceptable.
Table 3 shows the constructs, element loads, Cronbach’s alpha, and AVE. Cronbach’s alpha values ranged from 0.915 to 0.816, which are higher than the recommended level of 0.70, thus rendering them indicators of strong internal reliability. The composite reliability values were between 0.959 and 0.847 and the AVE ranged from 0.679 to 0.844, which are higher than the recommended levels. Therefore, the conditions for convergent validity were met.
The discriminant validity was calculated using the square root of the AVE (see Table 4). The square root of the AVE of a construct must be greater than the correlation with another construct for discriminant validity to be deemed satisfactory [80]. Several items were discarded during the cross-loading test because they loaded more heavily on other constructs than on their own (see Appendix A).
5.2. Structural Test Model
In the next phase, the proposed model was meticulously analyzed. The structural model was formulated so as to find the supported relationships between the constructs in this study model. In this model, the hypotheses and the relationships between the different constructs were tested to find out whether the relationships created in the original model were supported [67,73,81,82]. The variance is explained by the amount of variance shown by the reflective indicators given by the constructs [83,84]. This is found by calculating the values of R2 or the basic measurement of the quantity of variance for the construct that is described by the proposed model. The bootstrap approach was applied to check the hypotheses. The specified results (path coefficient (β and t statistics)) are synthesized in Table 5 and Figure 4.
The standardized root-mean-square residual (SRMR) value [85,86] determines the value of the observed correlation matrix and the implicit correlation matrix for the model, so that the approximate fit indexes of the model can be found [64,87]. The SRMR value indicates the average value of any deviation; a smaller SRMR denotes a finer adjustment. In this study, SRMR = 0.078, which falls within the requirement for a suitable adjustment, i.e., SRMR < 0.08 [85].
The values of R2 (see Table 6 and Figure 4) in the literature suggest that [88] 0.67 = “substantial”, 0.33 = “moderate”, and 0.19 = “weak” variability. The value calculated for the main variable of the model, i.e., behavioral intention to use (BIU), was R2 = 56.5%. This shows that the model is moderately applicable for Bitcoin adoption.
Using a blindfolding procedure, part of the data for a certain construct were omitted during parameter estimation, and then an attempt was made to estimate what had been omitted using the other parameters [88]. Thus, the model’s predictive relevance was studied using the Stone–Geisser (Q2) test [89,90], revealing that the model has predictive capacity.
As shown in Table 6, all endogenous constructions met Q2 > 0. Furthermore, Stone–Geisser’s Q2 values of 0.02, 0.15, and 0.35 suggest poor, middle, and severe predictive relevance [91] and, consequently, the constructs had a low predictive relevance, since the Q2 values were higher than 0.02 (trust). The other constructs had values of 0.35, except for ATU (Q2 = 0.299). Thus, the proposed research model had high predictive power for the explanation of BIU for the Bitcoin cryptocurrency using blockchain technology.
5.3. Mediaton Effect
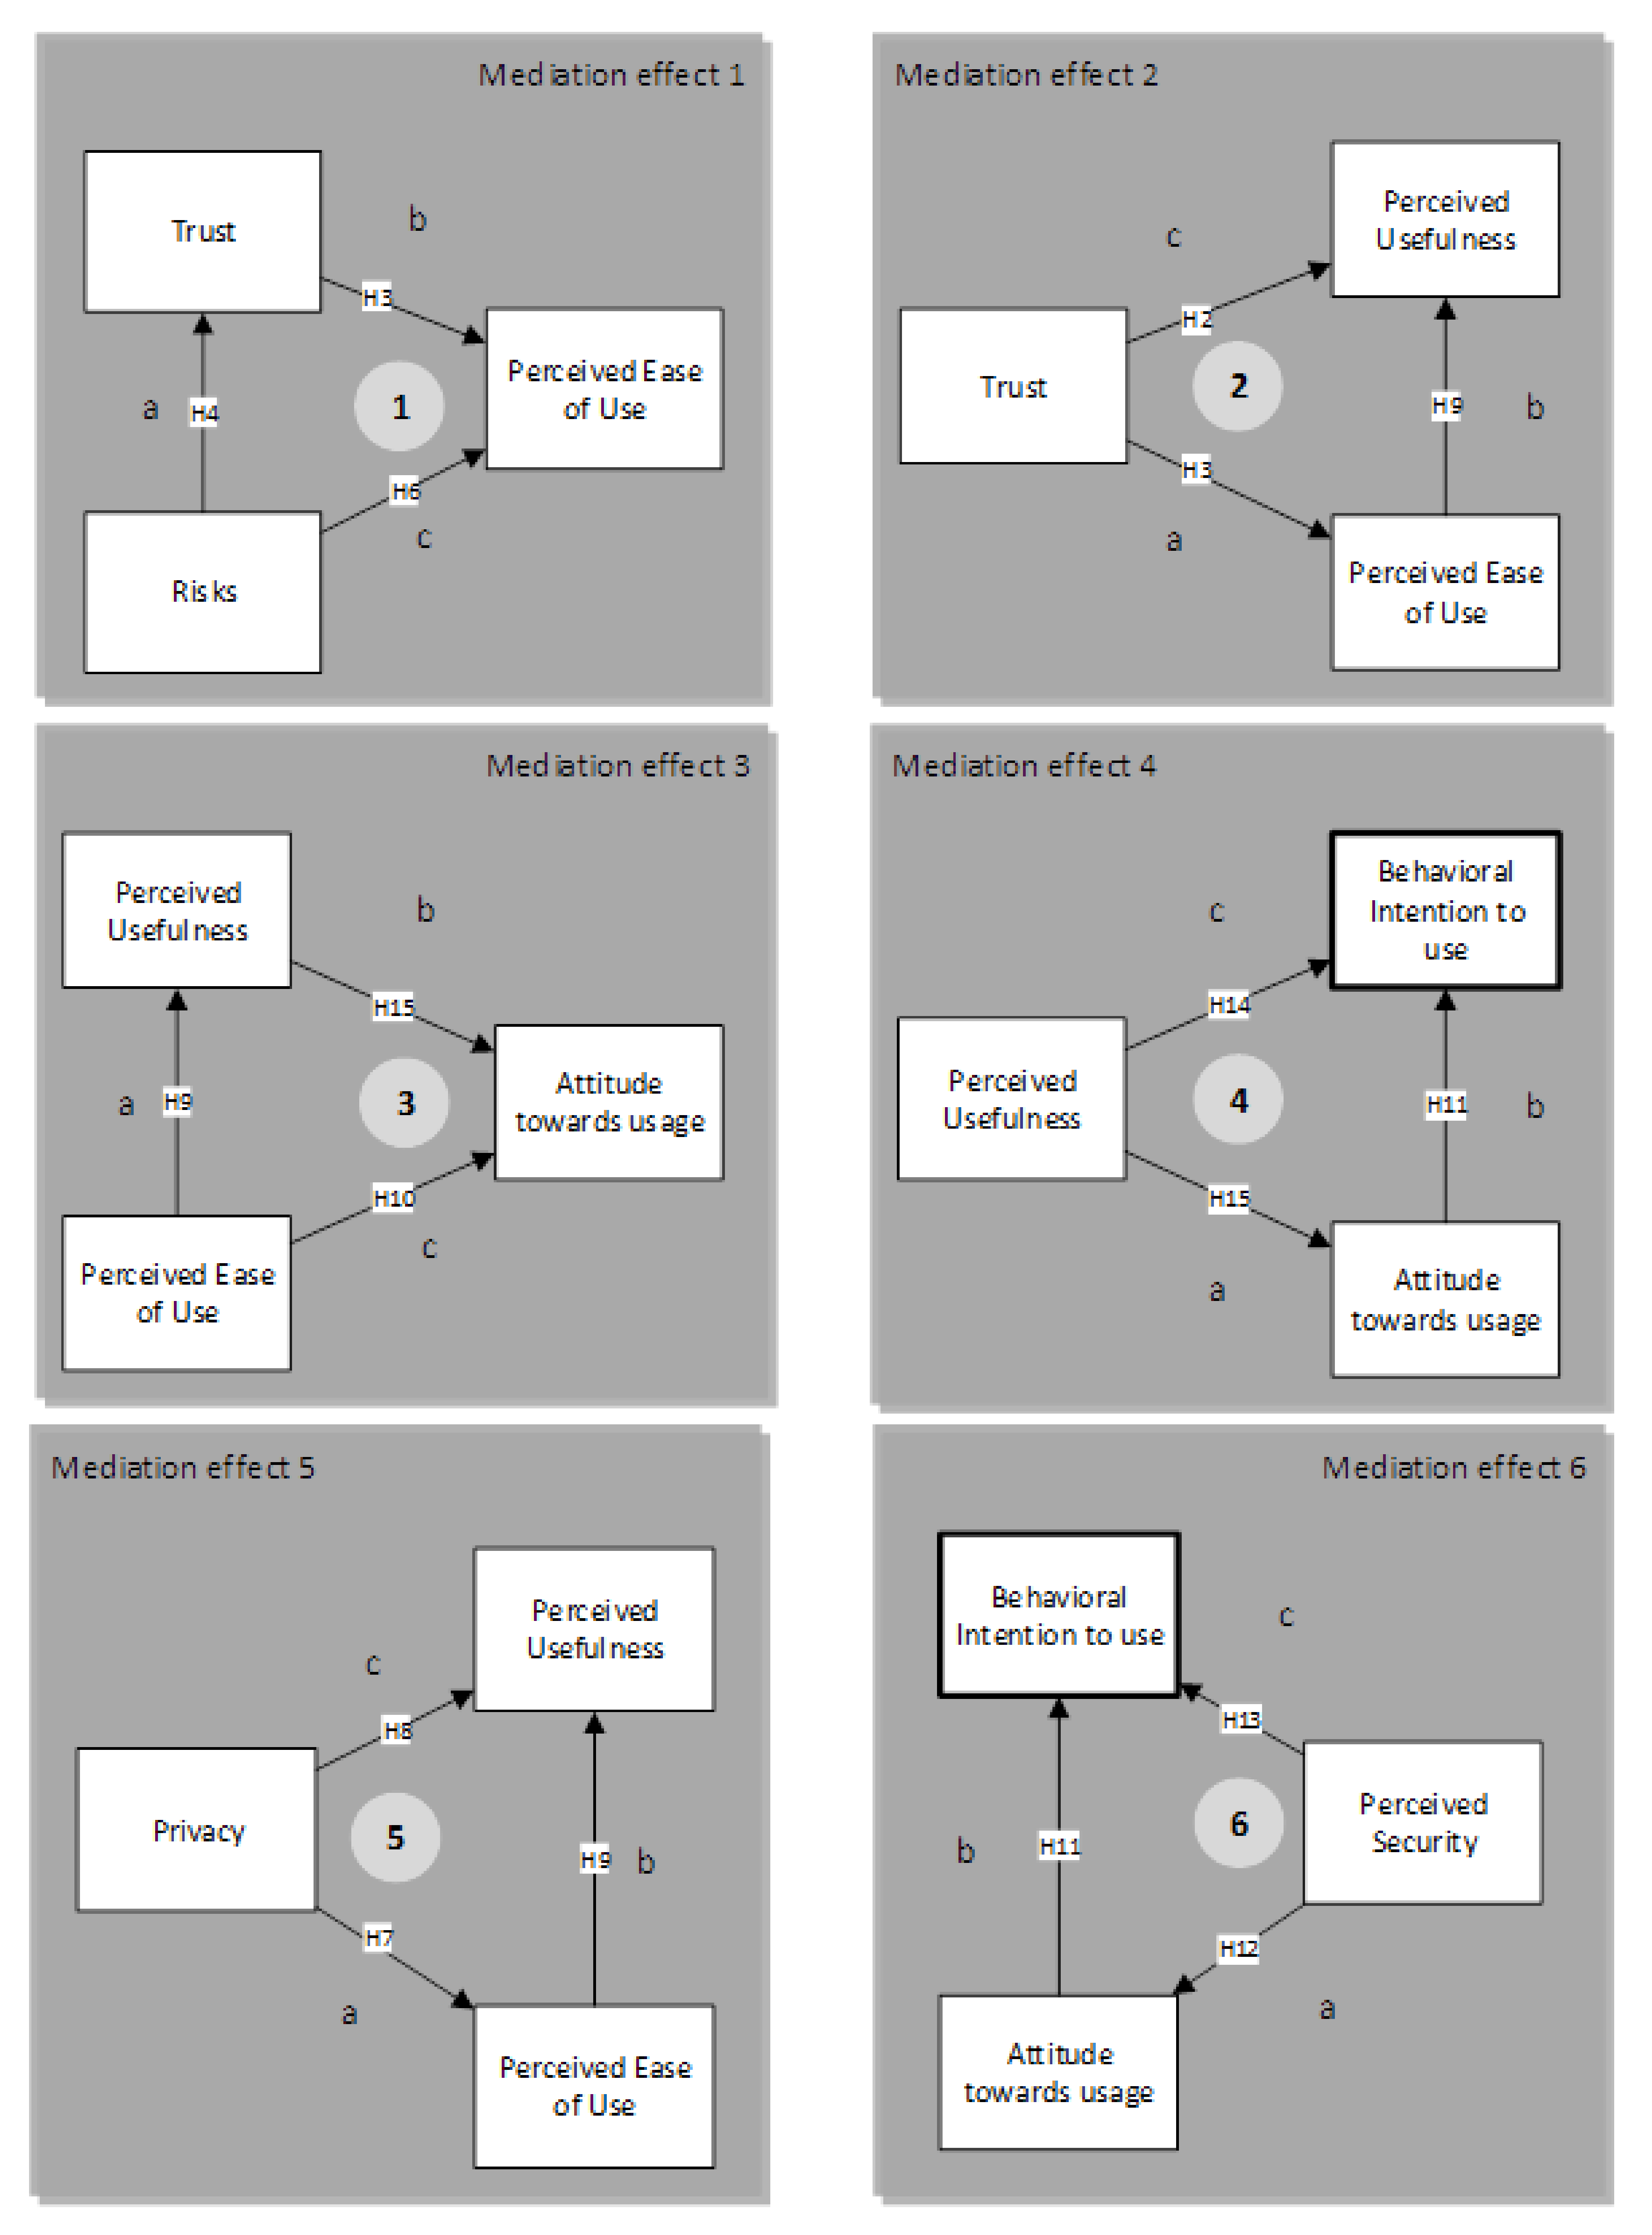
Six simple mediation effects were found in the model (see Figure 4). Each of these effects was analyzed, and the results can be seen in detail in Table 7. Several methods exist for testing the indirect effects; however, bias-corrected bootstrap testing using percentile calculations was chosen as the most reliable test because power is of the utmost importance [92].
The process can be seen with the mediating effect 1 in Figure 4. It shows that the causal effect of the risk variable can be divided into an indirect effect on perceived ease of use M (a × b) and a direct effect on trust (path c’), which is risk × perceived ease of use (PEOU) with trust mediation. The confidence intervals (CI) can be seen in Table 7, where a value of 0 means that the mediation is not considered significant. The result was significant, and the total effect of risk on perceived ease of use = c, where c = c’ + path loading or β risk × β PEOU. Risk was significant (β = 0.134, t = 2.054) with a confidence level of 95%.
The first step was to test the mediating hypothesis (distributed in six mediations) to define the level of importance of the indirect effects (ai × bi). For mediations 2 and 6, c’ (trust × perceived usefulness; perceived security × behavioral intention to use) produced nonsignificant values and were considered complete or total mediations. For the remaining mediations (1, 3, 4, and 5), c’ was found to be significant and partial [93]. The partial mediations were found to be the complementary type, where a × b and c’ are in the identical direction (positive in this study), and the competitive type, where a × b and c’ have distinct directions (one positive and one negative, or vice versa). As final result, all the effects of mediation, a × b and c’, were positive [93] (Roldan and Cepeda, 2017). Therefore, the effects are complementary.
The indirect effect (a × b) is significant if its interval does not contain the value zero. In this study, the effect was fulfilled in all mediations, except for the effect of mediation 5. Table 7 shows the most relevant values obtained for the sub-model of the structural model in which the mediation hypotheses are found (see Figure 5). The result obtained for mediation 1 is explained in detail, while the rest of the results are summarized in Table 7.
The table indicates that, for mediation 1, risk × perceived ease of use, (c’= 0.134 *) is compatible. The values obtained show that also supported are the influence of risk × trust (a = 0.231 *) and trust × perceived ease of use (b = 0.585 ***). This means that, for the area of risks, the perceived ease of use decreased when trust was included (a × b = 0.136). In addition, significant paths were found for a and b, which means that the significant increase in the direct state (c’) due to regression coefficients (a and b) suggested a probable indirect effect of perceived ease of use in the partial relation between both constructs with trust as the mediating variable.
Nevertheless, the most important condition for the implicit effect is to find the importance of a × b = path for risk × trust with respect to the path of trust × perceived ease of use [94]. Taking this into account, we obtained results for this indirect effect (a × b = 0.136; see Table 7) with SmartPLS.
This indirect effect was significant, since the confidence interval (CI) did not contain 0, which confirms the effect of mediation 1. All results were obtained on the condition that both the direct effect c’ and the indirect effects, a × b and c’, follow the identical positive direction [93].
In accordance with Hair et al. [71], decision-making cannot be based on the importance of just one of the indicators. Consequently, criteria must be established after taking into account the part that mediation has on the total effect of the independent variable on the dependent variable (VAF = variation accounted for). The levels used in this study were as follows: VAF > 80%, complete mediation; 20% ≤ VAF ≤ 80%, partial mediation; VAF < 20%, no mediation [71].
The value obtained for the effect of mediation 1 was VAF = 0.503. This shows that there was partial mediation of 50.31% [71]. The results for the remaining effects are presented in the last column of Table 7, where it can be observed that there were partial effects in mediations 1 and 3, which can be seen in the relationships of perceived ease of use × perceived usefulness, perceived usefulness × attitude toward use, and perceived ease of use × attitude toward use. The perceived usefulness variable mediated attitude toward use by 27.14% (see Figure 6).
6. Discussion
The adoption of Bitcoin cryptocurrency using blockchain technology as a means of payment in companies and shopping centers was studied in this paper. The key factors for the constructs in the model were proposed and then tested. In order to do this, a TAM (technology acceptance model) adoption model was extended with new variables to find the influence of risks, trust, privacy, and perceived security.
The results for the first three hypotheses with trust found that hypothesis H1 had the highest t-value of all the studied hypotheses (β = 0.753, t = 20.467). The hypotheses for the external variables of the original TAM model were all supported with the same degree of confidence (99.9%). Therefore, trust did not show a significant influence on perceived usefulness (β = 0.068; t = 0.758), meaning that H2 was not supported. However, trust positively influenced perceived ease of use (β = 0.585, t = 6.748), thus supporting H3. Therefore, trust influenced the perception of privacy and ease of use with a high level of significance. These are characteristics which business executives and entrepreneurs in the commerce sector want. This shows that the expansion of cryptocurrency will be conditioned by the trust generated by the applications that manage Bitcoin transactions. The perception of privacy will increase only when users truly trust Bitcoin.
The other external variable, risk, was found to have significant influence (95%) on trust (β = 0.231; t = 2.319), which means that H4 was supported. Risk did not positively influence PU (β = 0.025; t = 0.368); thus, H5 was not supported. Risk did, however, positively influence perceived usefulness (β = 0.134; t = 2.054). These two results allowed hypotheses H4 and H6 to be supported with a confidence level of 95%. This shows that the risks are not extremely important, given the statistical values. There does not seem to be any perception of risk in terms of the usefulness of the cryptocurrency, but the risks involved due to the confidence that cryptocurrency can generate in the market are taken into account. The risks due to the ease of use of the applications that manage cryptocurrency transactions are also considered by managers and businessmen.
The privacy variable showed different behavior in H7 and H8. On the one hand, H7 was not supported because the relationship between privacy and PEOU did not reach the minimum necessary statistical significance (β = 0.160; t = 1.620). On the other hand, H8 was supported, given that privacy did indeed influence PU (β = 0.510; t = 6.455) with a confidence level of 99.9%, reaching the third-level path coefficient in the model, after H1 (trust × privacy) (β = 0.753; t = 20.467) and H3 (trust × PEOU) (β = 0.585; t = 6.748).
Regarding the TAM model hypothesis, Table 5 shows that PEOU was positively associated with PU (β = 0.322, t = 3.180) and with ATU (β = 0.489, t = 6.332); therefore, H9 and H10 were compatible with the proposed model.
The results of the single linear regression from ATU to Bitcoin and BIU confirmed that the attitude toward using was positively associated with behavioral intention to use for Bitcoin (β = 0.265; t = 3.204). This means that H11 was supported.
The TAM model constructs that influenced behavioral intention to use, such as perceived usefulness (PU) (β = 0.551; t = 7.001), all had a significant influence on the intention to use. Therefore, H14 was supported for the proposed model with a confidence level of 99.9%.
Likewise, another of the relationships in the TAM model, “perceived usefulness positively influences attitude toward using”, H15, was confirmed and was compatible with the proposed model (β = 0.318; t = 3.174) with a high level of confidence (99.9%).
The values obtained also indicated that our research model can explain 67.3% of the variance in the behavioral intention to use variable for Bitcoin (R2 for behavioral intention to use (BIU) = 56.5%). This explanatory capacity indicated that the model is sufficiently capable of explaining acceptance by executives and entrepreneurs in the commerce sector in Spain. Therefore, the result of the extension of TAM in our research is now able to explain the acceptance of Bitcoin and the evolution of cryptography in Spain.
It may follow a similar path to other information systems in Spain, such as the implementation and use of Enterprise Resource Planning (ERPs) in companies [95,96,97,98,99,100,101,102,103,104], applications for electronic commerce [105], file scanning systems [106], bank management using the Internet [107], consumer electronics applications [108], or e-learning platforms [109,110,111,112]. The acceptance of all these information systems has been explained with extended TAM. The model also has a predictive capacity (Q2 > 0 for the endogenous constructs), indicating that the factors in this model may be crucial in the evolution of Bitcoin and similar future cryptocurrencies in Spain.
Another external variable for the proposed TAM model was perceived security. This construct was related to ATU (β = 0.271; t = 2.961) and H12 was, thus, supported with 99.9% significance. In addition, it was also related to behavioral intention to use, but the relationship between the two was not supported (β = 0.048; t = 0.711). This result is important because it shows that perceived security influenced attitude toward use but did not directly influence behavioral intention to use. Therefore, in the future, it will be important when designing communication campaigns that improve the attitude of business executives and entrepreneurs to the economic security of Bitcoin cryptocurrency transactions.
7. Conclusions
This manuscript studied the effect of this new form of digital money on the intention to use it by the managers of the companies and shops in the study. Knowledge about the factors that condition Bitcoin use is important for the expansion of cryptocurrencies. The most important thing is to get companies to accept Bitcoin as a means of payment because this will condition its expansion. The conclusions obtained in this study will help developers and designers build decentralized systems and applications for peer-to-peer transactions and implement sustainable business models using this cryptocurrency. It will also help with the implementation of communication campaigns for Bitcoin because it found the factors that condition Bitcoin acceptance by company executives in Spain.
The use of cryptocurrencies and blockchain technology is still limited. The data found show that, in one of the most prosperous regions of Spain and of Europe, where gross domestic product (GDP) rates are high, acceptance of cryptocurrency as a payment method is still low. This research indicates that trust and privacy are crucial when it comes to explaining acceptance of the cryptocurrency by companies. On the one hand, PU is affected by privacy and PEOU is affected by trust and by risks to a lesser degree. This result will be very important in future communication campaigns, as it indicates that, while privacy is the main variable that improves PU, trust for the ease of use of Bitcoin transactions applications is equally important. However, trust exerted a notable influence on privacy and business executives and entrepreneurs identified privacy as an important factor for cryptocurrency use.
Trust was also found to be a moderating variable in the risks × perceived ease of use relationship, which means that trust affects the perception of the risks of using Bitcoin from the exclusive point of view of ease of use of cryptocurrency transactions.
The risks of the use of cryptocurrency represent, to a lesser degree than the aforementioned factors, a positive factor that improves trust, thus influencing PEOU and, indirectly, ATU and PU. Given that the moderate predictive power of the final model has been shown, the lack of regulations for cryptocurrency use seems to be a clear driving factor. In other words, users feel it is worth taking the risk when compared to being controlled by countries and governments. This conclusion is a far stretch from the basic ethical standards for citizens; however, perhaps strong fiscal pressure, a lack of awareness about the usefulness of paying taxes, corruption by the authorities, or other factors could explain these findings.
One of the most interesting conclusions is the high trust given to Bitcoin. This means that the use of cryptocurrencies will change a lot in coming years because governments will have to regulate their use. However, this is no easy challenge, considering the cryptographic foundations of blockchain technology. Perceived security helps improve the attitude that companies have toward blockchain technology and this proven fact will promote a positive view of Bitcoin use in other sectors of Spanish society, so that they will not just be seen as tools for speculation.
One of the findings showed that companies prefer to be paid with Bitcoin rather than with other payment methods that involve intermediaries. This could mean that cryptocurrencies might make credit cards and bank documents disappear as payment methods. Thus, one of the most important conclusions of this study is the need for companies, especially businesses and shops, to be prepared to receive payment in Bitcoin, and for financial institutions to also be ready to offer their customers services which include cryptocurrency [20,49,58] (Blundell-Wignall, 2014; Junadi and Fenrianto, 2015; Folkinshteyn and Lennon, 2016).
This study was limited because it took into account companies with significant income. Furthermore, business executives and entrepreneurs from the commerce sector were surveyed; hence, the study was strongly influenced by this sector. Future studies could cover different economic sectors, which are not as economically developed.
Author Contributions
Conceptualization, P.P.-S. and J.R.S.; methodology, P.P.-S.; software, P.P.-S.; validation, J.R.S., and P.P.-S.; formal analysis, P.P.-S. and J.R.S.; resources, R.A.; writing—original draft preparation, P.P.-S. and J.R.S.; writing—review and editing, P.P.-S. and J.R.S.; visualization, P.P.-S. and J.R.S. All authors have read and agreed to the published version of the manuscript.
Funding
This research received no external funding.
Institutional Review Board Statement
Not applicable.
Informed Consent Statement
Not applicable.
Conflicts of Interest
The authors declare no conflict of interest.
Appendix A

Table A1.
Survey questions and factor loading.
| Construct Name | Item Code | Survey Questions | Factor Loading |
|---|---|---|---|
| Attitude [21,113,114,115] | ATU1 | I like the idea of using Bitcoin | 0.882 |
| ATU2 | I think using Bitcoin is highly advisable | 0.911 | |
| Behavioral intention to use [21,113] | BIU1 | I use Bitcoin because it benefits the organization where I work | 0.958 |
| BIU2 | I will recommend using Bitcoin to by clients, friends, and acquaintances | 0.962 | |
| Perceived ease of use [21,31,113] | PEOU1 | My interaction with Bitcoin is clear and understandable | 0.832 |
| PEOU2 | Interacting with Bitcoin does not require a lot of mental effort | 0.778 | |
| PEOU3 | I find buying or selling Bitcoin easy | 0.816 | |
| PEOU4 | I can buy Bitcoins with euros or other currencies and vice versa, just like any currency | 0.720 | |
| Perceived usefulness [21,31,113] | PU1 | I think it is very useful that it does not belong to a single country | 0.870 |
| PU2 | Using Bitcoin is faster | 0.852 | |
| PU3 | The fact that Bitcoin can be used worldwide in the same way is useful | 0.892 | |
| PU4 | Paying with Bitcoin is tax-free | * | |
| PU5 | Using Bitcoin is cheaper | * | |
| Privacy [59,60,61] | P1 | Transactions take place directly from person to person, and I think it is good that there are no intermediaries | 0.844 |
| P2 | It is not necessary to reveal your identity when doing business and you preserve your privacy | 0.812 | |
| P3 | Decentralization and the fact that no country controls it guarantee that my investment is private | 0.862 | |
| P4 | The money belongs entirely to you, meaning it cannot be seized by anyone, nor can accounts be frozen | 0.777 | |
| Trust [48] | T1 | I feel safe using Bitcoin | 0.895 |
| T2 | The decentralization of Bitcoin makes it a safe currency | 0.911 | |
| T3 | Forgery and duplication are impossible thanks to a sophisticated cryptographic system | 0.785 | |
| T4 | Transactions are irreversible | 0.812 | |
| Risks | R1 | The regulation of Bitcoin is certain | 0.850 |
| R2 | It is feasible as the currency of the future | 0.863 | |
| Perceived Security | PS1 | Money is safe in transactions with the Bitcoin cryptogram | 0.925 |
| PS2 | The digital format capacity is sufficient for high volume transfers | 0.913 |
* Items that did not pass the discriminant validity test.
References
- Gil-Cordero, E.; Cabrera-Sánchez, J.P.; Arrás-Cortés, M.J. Cryptocurrencies as a Financial Tool: Acceptance Factors. Mathematics 2020, 8, 1974. [Google Scholar] [CrossRef]
- Liébana-Cabanillas, F.; Sánchez-Fernández, J.; Munoz-Leiva, F. Antecedents of the adoption of the new mobile payment systems: The moderating effect of age. Comp. Human Behav. 2014, 35, 464–478. [Google Scholar] [CrossRef]
- Yaya, O.S.; Ogbonna, E.A.; Mudida, R. Market Efficiency and Volatility Persistence of Cryptocurrency during Pre-and Post-Crash Periods of Bitcoin: Evidence based on Fractional Integration. Int. J. Finance Econ. 2019. [Google Scholar] [CrossRef]
- Urquhart, A.M. What Causes the Attention of Bitcoin? SSRN Electr. J. 2018. [Google Scholar] [CrossRef] [Green Version]
- Trautman, L.J. Virtual Currencies; Bitcoin & What Now after Liberty Reserve, Silk Road, and Mt. Gox? Richmond J. Law Technol. 2014, 20, 1–108. [Google Scholar]
- Gangwal, S.; Longin, F. Extreme movements in Bitcoin prices: A study based on extreme value theory. Work. Paper Ser. 2018, 8, 1–17. [Google Scholar]
- Corbet, S.; Lucey, B.; Yarovaya, L. Datestamping the Bitcoin and Ethereum bubbles. Finance Res. Lett. 2018, 26, 81–88. [Google Scholar] [CrossRef] [Green Version]
- Burchert, C.; Decker, C.; Wattenhofer, R. Scalable funding of Bitcoin micropayment channel networks. Royal Soc. Open Sci. 2018, 5, 180089. [Google Scholar] [CrossRef] [Green Version]
- Eyal, I.; Sirer, E.G. Majority is not enough: Bitcoin mining is vulnerable. Commun. ACM 2018, 61, 95–102. [Google Scholar] [CrossRef]
- Simser, J. Bitcoin and modern alchemy: In code we trust. J. Financ. Crime 2015, 22, 156–169. [Google Scholar] [CrossRef]
- Saberi, S.; Kouhizadeh, M.; Sarkis, J.; Shen, L. Blockchain technology and its relationships to sustainable supply chain management. Int. J. Product. Res. 2018, 1–19. [Google Scholar] [CrossRef] [Green Version]
- Saura, J.R.; Palos-Sanchez, P.; Velicia-Martin, F. What Drives Volunteers to Accept a Digital Platform That Supports NGO Projects? Front. Psychol. 2020, 11, 429. [Google Scholar] [CrossRef] [PubMed]
- Albuquerque, J.P.; Diniz, E.H.; Cernev, A.K. Mobile payments: A scoping study of the literature and issues for future research. Inform. Dev. 2014. [Google Scholar] [CrossRef] [Green Version]
- Kamble, S.; Gunasekaran, A.; Arha, H. Understanding the Blockchain technology adoption in supply chains-Indian context. Int. J. Prod. Res. 2018, 1–25. [Google Scholar] [CrossRef]
- Chen, Y. Blockchain tokens and the potential democratization of entrepreneurship and innovation. Bus. Horiz. 2018. [Google Scholar] [CrossRef]
- Satoshi, N. Bitcoin: A Peer-To-Peer Electronic Cash System. 2008. Available online: https://bitcoin.org/bitcoin.pdf (accessed on 25 January 2021).
- Roca, J.C.; Chiu, C.-M.; Martínez, F.J. Understanding e-learning continuance intention: An extension of the Technology Acceptance Model. Int. J. Human-Comp. Stud. 2006, 64, 683–696. [Google Scholar] [CrossRef] [Green Version]
- Diniz, E.H.; Cernev, A.K.; Nascimento, E. Mobile social money: An exploratory study of the views of managers of community banks. Rev. Administr. 2016, 51, 299–309. [Google Scholar] [CrossRef] [Green Version]
- DailyFX. Bitcoin Price (BTC/USD): BTC Live Chart, News & Analysis. 2021. Available online: https://www.dailyfx.com/bitcoin (accessed on 22 January 2021).
- Folkinshteyn, D.; Lennon, M. Braving Bitcoin: A technology acceptance model (TAM) analysis. J. Inform. Technol. Case Applicat. Res. 2016, 18, 220–249. [Google Scholar] [CrossRef]
- Davis, F.D. Perceived usefulness, perceived ease of use, and user acceptance of information technology. MIS Quart. 1989, 13, 319–340. [Google Scholar] [CrossRef] [Green Version]
- Hayes, A. Cryptocurrency Value Formation: An Empirical Analysis Leading to a Cost of Production Model for Valuing Bitcoin. SSRN Electr. J. 2015. [Google Scholar] [CrossRef] [Green Version]
- Presthus, W.; O’Malley, N.O. Motivations and Barriers for End-User Adoption of Bitcoin as Digital Currency. Proc. Comp. Sci. 2017, 121, 89–97. [Google Scholar] [CrossRef]
- Li, X.; Wang, C.A. The technology and economic determinants of cryptocurrency exchange rates: The case of Bitcoin. Decis. Support. Syst. 2017, 95, 49–60. [Google Scholar] [CrossRef]
- Francisco, K.; Swanson, D. The Supply Chain Has No Clothes: Technology Adoption of Blockchain for Supply Chain Transparency. Logistics 2018, 2, 2. [Google Scholar] [CrossRef] [Green Version]
- Jonker, N. What Drives Bitcoin Adoption by Retailers. SSRN Electr. J. 2018. [Google Scholar] [CrossRef]
- Cheah, E.; Mishra, T.; Parhi, M.; Zhang, Z. Long Memory Interdependency and Inefficiency in Bitcoin Markets. Econ. Lett. 2018, 167, 18–25. [Google Scholar] [CrossRef]
- Glaser, F.; Zimmermann, K.; Haferkorn, M.; Weber, M.; Siering, M. Bitcoin asset or currency? Revealing users hidden intentions. In Proceedings of the European Conference on Information Systems, Tel Aviv, Israel, 9–11 June 2014. [Google Scholar]
- Palos-Sanchez, P.R.; Arenas-Marquez, F.J.; Aguayo-Camacho, M. Cloud Computing (SaaS) Adoption as a Strategic Technology: Results of an Empirical Study. Mobile Inform. Syst. 2017, 1–20. [Google Scholar] [CrossRef] [Green Version]
- Sharma, S.K. Integrating cognitive antecedents into TAM to explain mobile banking behavioral intention: A SEM-neural network modeling. Inform. Syst. Front. 2017, 1–13. [Google Scholar] [CrossRef]
- Gumussoy, C.A.; Kaya, A.; Ozlu, E. Determinants of mobile banking use: An extended TAM with perceived risk, mobility access, compatibility, perceived self-efficacy and subjective Norms. In Industrial Engineering in the Industry 4.0 Era; Springer: Cham, Switzerland, 2018; pp. 225–238. [Google Scholar]
- Venkatesh, V.; Davis, F.D. A theoretical extension of the technology acceptance model: Four longitudinal field studies. Manag. Sci. 2000, 46, 186–204. [Google Scholar] [CrossRef] [Green Version]
- Baur, A.W.; Bühler, J.; Bick, M.; Bonorden, C.S. Cryptocurrencies as a Disruption? Empirical Findings on User Adoption and Future Potential of Bitcoin and Co. In Proceedings of the Conference on e-Business, e-Services and e-Society, Delft, The Netherlands, 13–15 October 2015; Springer: Cham, Switzerland, 2015; pp. 63–80. [Google Scholar]
- Abramova, S.; Böhme, R. Perceived Benefit and Risk as Multidimensional Determinants of Bitcoin Use: A Quantitative Exploratory Study. In Proceedings of the International Conference on Information Systems, Dublin, Ireland, 11–14 December 2016; pp. 1–20. [Google Scholar] [CrossRef]
- Davis, F.D. A Technology Acceptance Model for Empirically Testing New End-User Information Systems: Theory and Results; Massachusetts Institute of Technology: Cambridge, MA, USA, 1986. [Google Scholar]
- Venkatesh, V.; Morris, M.G.; Davis, G.B.; Davis, F.D. User acceptance of information technology: Towarda unified view. MIS Quart. 2003, 27, 425–478. [Google Scholar] [CrossRef] [Green Version]
- Venkatesh, V.; Ramesh, V. Web and wireless site usability: Understanding differences and modeling use. MIS Quart. 2006, 30, 181–206. [Google Scholar] [CrossRef]
- Fathema, N.; Shannon, D.; Ross, M. Expanding the Technology Acceptance Model (TAM) to examine faculty use of Learning Management Systems (LMS). J. Online Learn. Teach. 2015, 11, 210–233. [Google Scholar]
- Fathema, N.; Ross, M.; Witte, M. Student acceptance of university web portals: A quantitative study. Int. J. Web Portals 2014, 6, 42–58. [Google Scholar] [CrossRef] [Green Version]
- Marangunić, N.; Granić, A. Technology acceptance model: A literature review from 1986 to 2013. Univ. Access Inform. Soc. 2014, 14, 81–95. [Google Scholar] [CrossRef]
- Turner, M.; Kitchenham, B.; Brereton, P.; Charters, S.; Budgen, D. Does the technology acceptance model predict actual use? A systematic literature review. Inform. Softw. Technol. 2010, 52, 463–479. [Google Scholar] [CrossRef]
- Wu, P.F. User Acceptance of Emergency Alert Technology: A Case Study. In Proceedings of the 6th International ISCRAM Conference, Gothenburg, Sweden, 10–13 May 2009. [Google Scholar]
- Taherdoost, H. A review of technology acceptance and adoption models and theories. Proc. Manuf. 2018, 22, 960–967. [Google Scholar] [CrossRef]
- Palos-Sanchez, P.; Saura, J.R.; Martin-Velicia, F. A study of the effects of Programmatic Advertising on users’ Concerns about Privacy overtime. J. Bus. Res. 2019, 96, 61–72. [Google Scholar] [CrossRef]
- Venkatesh, V.; Morris, M.G. Why don’t men ever stop to ask for directions? Gender, social influence, and their role in technology acceptance and usage behavior. MIS Quart. 2000, 24, 115–139. [Google Scholar] [CrossRef]
- Venkatesh, V.; Thong, J.Y.; Xu, X. Consumer acceptance and use of information technology: Extending the unified theory of acceptance and use of technology. MIS Quart. 2012, 36, 157–178. [Google Scholar] [CrossRef] [Green Version]
- Davis, F.D.; Bagozzi, R.P.; Warshaw, P.R. User acceptance of computer technology: A comparison of two theoretical models. Manag. Sci. 1989, 35, 982–1003. [Google Scholar] [CrossRef] [Green Version]
- Junadi, S.; Fenrianto, J. A Model of Factors Influencing Consumers Intention to Use E-payment System in Indonesia. Proc. Comp. Sci. 2015, 59, 214–220. [Google Scholar] [CrossRef] [Green Version]
- Pavlou, P.A. Consumer acceptance of electronic commerce: Integrating trust and risk with the technology acceptance model. Int. J. Electron. Comm. 2003, 7, 101–134. [Google Scholar]
- Dauda, S.Y.; Lee, J. Technology adoption: A conjoint analysis of consumers? preference on future online banking services. Inform. Syst. 2015, 53, 1–15. [Google Scholar] [CrossRef]
- Moore, T.; Christin, N. Beware the middleman: Empirical analysis of bitcoin-exchange risk. In Proceedings of the International Conference on Financial Cryptography and Data Security 2013, Okinawa, Japan, 1–5 April 2013. [Google Scholar]
- Urquhart, A. Price clustering in Bitcoin. Econ. Lett. 2017, 159, 145–148. [Google Scholar] [CrossRef]
- Thong, J.Y.; Venkatesh, V.; Xu, X.; Hong, S.-J.; Tam, K.Y. Consumer acceptance of personal information and communication technology services. MIS Quart. 2011, 58, 613–625. [Google Scholar] [CrossRef]
- Vijayasarathy, L.R. Predicting consumer intentions to use on-line shopping: The case for an augmented technology acceptance model. Inform. Manag. 2004, 41, 747–762. [Google Scholar] [CrossRef]
- Lee, L. New Kids on the Blockchain: How Bitcoin’s technology could reinvent the stock market. Hastings Bus. Law J. 2015, 12, 81–132. [Google Scholar] [CrossRef] [Green Version]
- Kaplanov, N. Nerdy money: Bitcoin, the private digital currency, and the case against its regulation. Loy Consum. L Rev. 2012, 25, 111. [Google Scholar] [CrossRef] [Green Version]
- Blundell-Wignall, A. The Bitcoin question: Currency versus trust-less transfer technology. OECD Work. Papers Finance Insur. Private Pens. 2014, 1. [Google Scholar] [CrossRef]
- Bradbury, D. The problem with Bitcoin. Comp. Fraud Secur. 2013, 2013, 5–8. [Google Scholar] [CrossRef]
- Malhotra, N.K.; Kim, S.S.; Agarwal, J. Internet users’ information privacy concerns (IUIPC): The construct, the scale, and a causal model. Inform. Syst. Res. 2004, 15, 336–355. [Google Scholar] [CrossRef] [Green Version]
- Saura, J.R. Using Data Sciences in Digital Marketing: Framework, Methods, and Performance Metrics. J. Innovat. Knowl. 2020, 1. [Google Scholar] [CrossRef]
- Reyes-Menendez, A.; Saura, J.R.; Stephen, B.T. Exploring Key Indicators of Social Identity in the #MeToo Era: Using Discourse Analysis in UGC. Int. J. Inform. Manag. 2020, 54, 102129. [Google Scholar] [CrossRef]
- Coinmap.org. Available online: http://coinmap.org/#/map/40.29838133/-2.97454834/9 (accessed on 23 October 2017).
- Sarstedt, M.; Joseph, F.; Hair, C.M.; Ringle, K.O.T.; Gudergan, S.P. Estimation Issues with PLS and CBSEM: Where the Bias Lies! J. Bus. Res. 2016, 69, 3998–4010. [Google Scholar] [CrossRef] [Green Version]
- Henseler, J.; Hubona, G.; Ray, P.A. PLS path modeling in new technology research: Updated guidelines. Ind. Manag. Data Syst. 2016, 116, 2–20. [Google Scholar] [CrossRef]
- Son, J.Y.; Benbasat, I. Organizational buyers’ adoption and use of B2B electronic marketplaces: Efficiency-and legitimacy-oriented perspectives. J. Manag. Inform. Syst. 2007, 24, 55–99. [Google Scholar] [CrossRef] [Green Version]
- Fornell, C.; Cha, J. Partial Least Squares. Adv. Methods Mark. Res. 1994, 407, 52–78. [Google Scholar]
- Chin, W.W.; Newsted, P.R. Structural equation modeling analysis with small samples using partial least squares. Stat. Strat. Small Sample Res. 1999, 1, 307–341. [Google Scholar]
- Hair, J.F.; Ringle, C.M.; Sarstedt, M. PLS-SEM: Indeed a silver bullet. J. Mark. Theory Pract. 2011, 19, 139–152. [Google Scholar] [CrossRef]
- Ringle, C.M.; Wende, S.B.M. SmartPLS 3; SmartPLS GmbH: Boenningstedt, Germany, 2015. [Google Scholar]
- Reinartz, W.; Haenlein, M.; Henseler, J. An Empirical Comparison of the Efficacy of Covariance-Based and Variance-Based SEM. Int. J. Res. Mark. 2009, 26, 332–344. [Google Scholar] [CrossRef] [Green Version]
- Hair, F.J., Jr.; Sarstedt, M.; Hopkins, L.G.; Kuppelwieser, V. Partial least squares structural equation modeling (PLS-SEM): An emerging tool in business research. Eur. Bus. Rev. 2014, 26, 106–121. [Google Scholar] [CrossRef]
- Muller, K.; Cohen, J. Statistical Power Analysis for the Behavioral Sciences. Technometrics 1989, 31, 499. [Google Scholar] [CrossRef]
- Hair, J.F.; Sarstedt, M.; Ringle, C.M.; Mena, J.A. An assessment of the use of partial least squares structural equation modeling in marketing research. J. Acad. Mark. Sci. 2012, 40, 414–433. [Google Scholar] [CrossRef]
- Cohen, J. A power primer. Psychol. Bull. 1992, 112, 155–519. [Google Scholar] [CrossRef]
- Carmines, G.E.; Zeller, R.A. Reliability and Validity Assessment; Sage Publications: Newbury Park, CA, USA, 2008. [Google Scholar]
- Hair, J.F.; Black, W.C.; Babin, B.J.; Anderson, R.E.; Tatham, R.L. Multivariate Data Analysis; Pearson Prentice Hall: Upper Saddle River, NJ, USA, 2006; Volume 6. [Google Scholar]
- Werts, C.E.; Linn, R.L.; Jöreskog, K.G. Intraclass reliability estimates: Testing structural assumptions. Educ. Psychol. Meas. 1974, 34, 25–33. [Google Scholar] [CrossRef]
- Bagozzi, R.P.; Yi, Y. On the evaluation of structural equation models. J. Acad. Mark. Sci. 1988, 16, 74–94. [Google Scholar] [CrossRef]
- Nunnally, J. Psychometric Methods; McGraw-Hill: New York, NY, USA, 1978. [Google Scholar]
- Fornell, C.; Larcker, D.F. Evaluating structural equation models with unobservable variables and measurement error. J. Mark. Res. 1981, 39–50. [Google Scholar] [CrossRef]
- Henseler, J.; Ringle, C.M.; Sinkovics, R.R. The use of partial least squares path modeling in international marketing. In Advances in International Marketing; Sinkovics, R.R., Ghauri, P.N., Eds.; Emerald Group Publishing Limited: Bradford, UK, 2009; pp. 277–319. [Google Scholar] [CrossRef] [Green Version]
- Henseler, J. Why generalized structured component analysis is not universally preferable to structural equation modeling. J. Acad. Mark. Sci. 2012, 40, 402–413. [Google Scholar] [CrossRef] [Green Version]
- Chin, W. How to write up and report PLS analyses. In Handbook of Partial Least Squares: Concepts, Methods and Applications; Springer: Berlin, Germany, 2010. [Google Scholar]
- Barclay, D.; Higgins, C.; Thompson, R. The Partial Least Squares (PLS) A roach to Causal Modelling: Personal Computer Adoption and Use as an Illustration. Technol. Stud. 1995, 2, 285–309. [Google Scholar]
- Hu, L.T.; Bentler, P.M. Fit indices in covariance structure modeling: Sensitivity to underparameterized model misspecification. Psychol. Methods 1998, 3, 424. [Google Scholar] [CrossRef]
- Hu, L.T.; Bentler, P.M. Cutoff criteria for fit indexes in covariance structure analysis: Conventional criteria versus new alternatives. Struct. Eq. Model. Multidiscipl. J. 1999, 6, 1–55. [Google Scholar] [CrossRef]
- Henseler, J. Bridging Design and Behavioral Research With Variance-Based Structural Equation Modeling. J. Advertis. 2017, 46, 178–192. [Google Scholar] [CrossRef]
- Chin, W.W. The partial least squares approach to structural equation modeling. Modern Methods Bus. Res. 1998, 295, 295–336. [Google Scholar]
- Stone, M. Cross-validatory choice and assessment of statistical predictions. J. Royal Stat. Soc. 1974. [Google Scholar] [CrossRef]
- Geisser, S. A Predictive Approach to the Random Effects Model. Biometrika 1974, 61, 101–107. [Google Scholar] [CrossRef]
- Cohen, J. Statistical Power Analysis for the Behavioral Sciences, 2nd ed.; Erlbaum Associates: Hillsdale, NJ, USA, 1988. [Google Scholar]
- Hayes, A.F.; Scharkow, M. The Relative Trustworthiness of Inferential Tests of the Indirect Effect in Statistical Mediation Analysis. Psychol. Sci. 2013, 24, 1918–1927. [Google Scholar] [CrossRef] [PubMed]
- Carrión, G.C.; Nitzl, C.; Roldán, J.L. Mediation Analyses in Partial Least Squares Structural Equation Modeling: Guidelines and Empirical Examples. Part. Least Sq. Path Model. 2017, 173–195. [Google Scholar] [CrossRef]
- Hernández-Perlines, F.; Moreno-García, J.; Yañez-Araque, B. The Mediating Role of Competitive Strategy in International Entrepreneurial Orientation. J. Bus. Res. 2016, 69, 5383–5389. [Google Scholar] [CrossRef]
- Lang, A.; Bradley, J.; Lee, S. The Motivation Activation Measure (MAM): How Well Does MAM Predict Individual Differences in Physiological Indicators of Appetitive and Aversive Activation? Comm. Methods Meas. 2007, 1, 113–136. [Google Scholar] [CrossRef]
- Bueno, S.; Salmeron, J.L. TAM-Based Success Modeling in ERP. Interact. Comp. 2008, 20, 515–523. [Google Scholar] [CrossRef]
- Calisir, F.; Gumussoy, C.A.; Bayram, A. Predicting the Behavioral Intention to Use Enterprise Resource Planning Systems. Manag. Res. News 2009, 32, 597–613. [Google Scholar] [CrossRef]
- Kwahk, K.Y.; Lee, J. The Role of Readiness for Change in ERP Implementation: Theoretical Bases and Empirical Validation. Inform. Manag. 2008, 45, 474–481. [Google Scholar] [CrossRef]
- Lee, S.; Park, G.; Yoon, B.; Park, J. Open Innovation in SMEs—An Intermediated Network Model. Res. Policy 2010, 39, 290–300. [Google Scholar] [CrossRef]
- Shivers-Blackwell, S.; Atira, L.; Charles, C. Ready, Set, Go: Examining Student Readiness to Use ERP Technology. J. Manag. Dev. 2006, 25, 795–805. [Google Scholar] [CrossRef]
- Sternad, S.; Bobek, S. Impacts of TAM-Based External Factors on ERP Acceptance. Proc. Technol. 2013, 9, 33–42. [Google Scholar] [CrossRef] [Green Version]
- Sun, D.-L.; Chen, Z.; Ma, N.; Zhang, X.; Fu, X.; Zhang, D. Decision-Making and Prepotent Response Inhibition Functions in Excessive Internet Users. CNS Spectrums 2009, 14, 75–81. [Google Scholar] [CrossRef]
- Uzoka, F.-M.; Alice, E.; Shemi, P.; Seleka, G. Behavioral Influences on E-Commerce Adoption in a Developing Country Context. Electr. J. Inform. Syst. Dev. Countries 2007, 31, 1–15. [Google Scholar] [CrossRef]
- Youngberg, E.; Olsen, D.; Hauser, K. Determinants of Professionally Autonomous End User Acceptance in an Enterprise Resource Planning System Environment. Int. J. Inform. Manag. 2009, 29, 138–144. [Google Scholar] [CrossRef]
- Agrebi, S.; Jallais, J. Explain the Intention to Use Smartphones for Mobile Shopping. J. Retail. Cons. Serv. 2015, 22, 16–23. [Google Scholar] [CrossRef]
- Saura, J.R.; Rodriguez Herráez, B.; Reyes-Menendez, A. Comparing a traditional approach for financial Brand Communication Analysis with a Big Data Analytics technique. IEEE Access 2019, 7. [Google Scholar] [CrossRef]
- Yoon, S.H.L.; Steege, M.B. Development of a Quantitative Model of the Impact of Customers’ Personality and Perceptions on Internet Banking Use. Comp. Human Behav. 2013, 29, 1133–1141. [Google Scholar] [CrossRef]
- Palos-Sánchez, P.; Saura, J.R.; Álvarez-García, J. Innovation and creativity in the mobile applications industry: A case study of mobile health applications (e-Health Apps). In Cultural and Creative Industries; Springer: Cham, Switzerland, 2019; pp. 121–135. [Google Scholar]
- Rocío Sánchez, A.; Hueros, A.M.D. Plataformas Virtuales de Aprendizaje: Análisis Desde Su Adaptación a Estilos de Aprendizaje. Rev. Venez. Gerenc. 2019. [Google Scholar] [CrossRef]
- Ronnie, C.; Vogel, D. Predicting User Acceptance of Collaborative Technologies: An Extension of the Technology Acceptance Model for e-Learning. Comp. Educ. 2013, 63, 160–175. [Google Scholar] [CrossRef]
- Young, L.D.; Mark; Lehto, R. User Acceptance of YouTube for Procedural Learning: An Extension of the Technology Acceptance Model. Comp. Educ. 2013, 61, 193–208. [Google Scholar] [CrossRef]
- Shengcai, L.; Hu, Y.; Zhu, X.; Stan, L.Z. Person Re-Identification by Local Maximal Occurrence Representation and Metric Learning. In Proceedings of the IEEE Conference on Computer Vision and Pattern Recognition (CVPR), Boston, MA, USA, 7–12 June 2015. [Google Scholar] [CrossRef] [Green Version]
- Davis, F.D. User acceptance of information technology: System characteristics, user perceptions and behavioral impacts. Int. J. Man-Mach. Stud. 1993, 38, 475–487. [Google Scholar] [CrossRef] [Green Version]
- Agarwal, R.; Prasad, J. Are individual differences germane to the acceptance of new information technologies? Decis. Sci. 1999, 30, 361–391. [Google Scholar] [CrossRef]
- Heijden, H. Factors influencing the usage of websites: The case of a generic portal in The Netherlands. Inform. Manag. 2003, 40, 541–549. [Google Scholar] [CrossRef] [Green Version]
Figure 1.
Bitcoin price value from April 2020 to February 2021. Source: Adapted from DailyFX [19].
Figure 1.
Bitcoin price value from April 2020 to February 2021. Source: Adapted from DailyFX [19].

Figure 2.
Proposed model.

Figure 3.
Spanish map of businesses which accept Bitcoin. Source: Coinmap.org.

Figure 4.
Madrid region map of businesses which accept Bitcoin. Source: Coinmap.org.

Figure 5.
Mediation hypotheses. * p < 0.05; *** p < 0.001; N.S.—not supported.

Figure 6.
Mediation hypotheses.

Table 1.
Research on acceptance of Bitcoin as a cryptocurrency.
| Authors | Research |
|---|---|
| Francisco and Swanson [25] | Proposed a technology acceptance model to measure the influence of cryptocurrencies, analyzing the case of Bitcoin and its acceptance in the retail sector. |
| Francisco and Swanson [25] | In this research, the authors developed the unified theory of acceptance and use of technology (UTAUT) model to measure the influence of the variables on the technology acceptance of Bitcoin and transparency in the cryptocurrency sector. |
| Jonker [26] | In this paper, an adoption model was developed to find the Bitcoin acceptance process in retail and its potential long-term influence on this industry. |
| Presthus and O’Malley [23] | In their research, they presented a model for measuring user acceptance of Bitcoin as a digital currency, establishing the reasons and obstacles that led users to stop using Bitcoin as a payment method. |
| Folkinshteyn and Lennon [20] | Discussed the technology acceptance of Bitcoin as a cryptocurrency in their research, mentioning the technology on which it is based, blockchain. |
Table 2.
Demographic Information (n = 248).
| Classification | Variable | Frequency | % |
|---|---|---|---|
| Gender | Male | 88 | 35% |
| Female | 160 | 65% | |
| Age | 18–30 years old | 64 | 26% |
| 31–45 years old | 78 | 31% | |
| 46–55 years old | 58 | 23% | |
| 56–65 years old | 41 | 17% | |
| >65 years old | 7 | 3% | |
| Job | Salaried worker | 15 | 6% |
| Middle manager | 148 | 59.7% | |
| Senior manager | 61 | 24.6% | |
| Self-employed | 22 | 8.9% | |
| Retired | 2 | 0.8% | |
| Residence | City with more than 100,000 inhabitants | 138 | 56% |
| Town with between 20,000 and 100,000 inhabitants | 75 | 30% | |
| Town with between 5000 and 20,000 inhabitants | 35 | 14% | |
| Education | Primary school | 2 | 0.8% |
| Secondary school | 10 | 4% | |
| Job training | 8 | 3% | |
| University | 228 | 92.2% |
Table 3.
Measurement model. Cronbach’s alpha, rho_A, composite reliability, and average variance extracted (AVE).
Table 3.
Measurement model. Cronbach’s alpha, rho_A, composite reliability, and average variance extracted (AVE).
| ATU | PS | PEOU | PU | PR | R | T | BIU | |
|---|---|---|---|---|---|---|---|---|
| Attitude toward using (ATU) | 0.897 | |||||||
| Perceived security (PS) | 0.423 | 0.919 | ||||||
| Perceived ease of use (PEOU) | 0.573 | 0.311 | 0.788 | |||||
| Perceived usefulness (PU) | 0.566 | 0.250 | 0.698 | 0.872 | ||||
| Privacy (PR) | 0.655 | 0.292 | 0.626 | 0.767 | 0.824 | |||
| Risks (R) | 0.212 | 0.462 | 0.300 | 0.235 | 0.192 | 0.857 | ||
| Trust (T) | 0.639 | 0.315 | 0.736 | 0.694 | 0.753 | 0.231 | 0.852 | |
| Behavioral intention to use (BIU) | 0.597 | 0.297 | 0.786 | 0.713 | 0.646 | 0.162 | 0.797 | 0.960 |
Table 4.
Discriminant validity.
| Construct | Cronbach’s Alpha | rho_A | Composite Reliability | AVE |
|---|---|---|---|---|
| Attitude toward using (ATU) | 0.757 | 0.761 | 0.891 | 0.804 |
| Perceived security (PS) | 0.816 | 0.819 | 0.916 | 0.844 |
| Perceived ease of use (PEOU) | 0.796 | 0.805 | 0.867 | 0.621 |
| Perceived usefulness (PU) | 0.842 | 0.843 | 0.905 | 0.760 |
| Privacy (PR) | 0.842 | 0.844 | 0.894 | 0.679 |
| Risks (R) | 0.708 | 0.737 | 0.847 | 0.734 |
| Trust (T) | 0.873 | 0.885 | 0.914 | 0.726 |
| Behavioral intention to use (BIU) | 0.915 | 0.917 | 0.959 | 0.922 |
Table 5.
Hypothesis results: path coefficients and statistical significance.
| Hypothesis | β (Path Coefficient) | t Statistic | p-Value | Support |
|---|---|---|---|---|
| H1: Trust → Privacy | 0.753 | 20.467 | 0.000 | Yes *** |
| H2: Trust → PU | 0.068 | 0.758 | 0.449 | N.S. |
| H3: Trust → PEOU | 0.585 | 6.748 | 0.000 | Yes *** |
| H4: Risks → Trust | 0.231 | 2.319 | 0.020 | Yes * |
| H5: Risks → PU | 0.025 | 0.368 | 0.713 | N.S. |
| H6: Risks → PEOU | 0.134 | 2.054 | 0.040 | Yes * |
| H7: Privacy → PEOU | 0.160 | 1.620 | 0.105 | N.S. |
| H8: Privacy → PU | 0.510 | 6.455 | 0.000 | Yes *** |
| H9: PEOU → PU | 0.322 | 3.180 | 0.001 | Yes *** |
| H10: PEOU → ATU | 0.489 | 6.332 | 0.000 | Yes *** |
| H11: ATU → BIU | 0.265 | 3.204 | 0.001 | Yes *** |
| H12: Perceived Security → ATU | 0.271 | 2.961 | 0.003 | Yes *** |
| H13: Perceived Security → BIU | 0.048 | 0.711 | 0.477 | N.S. |
| H14: PU → BIU | 0.551 | 7.001 | 0.000 | Yes *** |
| H15: PU → ATU | 0.318 | 3.174 | 0.002 | Yes *** |
Notes: For n = 5000 subsamples, based on Student’s t-distribution (499) of a queue: * p < 0.05 (t(0.05; 499) = 1.64791345); *** p < 0.001 (t(0.001;499) = 3.106644601); N.S.—not supported.
Table 6.
Results of R2 and Q2.
| Construct | Q2 | R2 (%) |
|---|---|---|
| Attitude toward using (ATU) | 0.299 | 39.5 |
| Perceived ease of use (PEOU) | 0.320 | 57.0 |
| Perceived usefulness (PU) | 0.459 | 66.9 |
| Privacy (PR) | 0.351 | 56.7 |
| Trust (T) | 0.028 | 5.40 |
| Behavioral intention to use (BIU) | 0.466 | 56.5 |
Table 7.
Mediating effects. CI—confidence interval; VAF—variance accounted for.
| Mediation Effect 1 | Path Coefficient (β) | CI (2.5%) Lower | CI (97.5%) Upper | Mediating Effects (VAF) |
|---|---|---|---|---|
| a: Risks→ Trust | 0.231 | 0.036 | 0.412 | 50.31% |
| b: Trust → Perceived Ease of Use | 0.585 | 0.415 | 0.754 | |
| c: Risks → Perceived Ease of Use | 0.134 | 0.003 | 0.255 | * Partial |
| a × b: Indirect effects | 0.136 | 0.022 | 0.255 | |
| Mediation Effect 2 | ||||
| a: Trust → Perceived Ease of Use | 0.585 | 0.425 | 0.759 | 72.28% |
| b: Perceived Ease of Use → Perceived Usefulness | 0.321 | 0.125 | 0.515 | |
| c: Trust → Perceived Usefulness | 0.072 | −0.103 | 0.243 | Not supported |
| a × b: Indirect effects | 0.188 | 0.0729 | 0.322 | Not supported |
| Mediation Effect 3 | ||||
| a: Perceived Ease of Use → Perceived Usefulness | 0.321 | 0.125 | 0.515 | 27.14% |
| b: Perceived Usefulness → Attitude toward usage | 0.318 | 0.107 | 0.496 | |
| c: Perceived Ease of Use → Attitude toward usage | 0.274 | 0.072 | 0.497 | *** |
| a × b: Indirect effects | 0.102 | 0.013 | 0.255 | Partial |
| Mediation Effect 4 | ||||
| a: Perceived Usefulness → Attitude toward usage | 0.318 | 0.107 | 0.496 | 13.09% → |
| b: Attitude toward usage → Behavioral Intention to use | 0.261 | 0.102 | 0.434 | Not supported |
| c: Perceived Usefulness → Behavioral Intention to use | 0.551 | 0.384 | 0.700 | *** |
| a × b: Indirect effects | 0.083 | 0.011 | 0.215 | Not supported |
| Mediation Effect 5 | ||||
| a: Privacy → Perceived Ease of Use | 0.160 | −0.038 | 0.340 | 9.18% → |
| b: Perceived Ease of Use → Perceived Usefulness | 0.321 | 0.125 | 0.515 | Not supported |
| c: Privacy → Perceived Usefulness | 0.508 | 0.348 | 0.650 | *** |
| a * b: Indirect effects | 0.051 | −0.005 | 0.175 | Not supported |
| Mediation Effect 6 | ||||
| a: Perceived Security → Attitude toward usage | 0.254 | 0.086 | 0.426 | 59.56% |
| b: Attitude toward usage → Behavioral Intention to use | 0.261 | 0.102 | 0.434 | |
| c: Perceived Security → Behavioral Intention to use | 0.045 | −0.085 | 0.177 | Not supported |
| a * b: Indirect effects | 0.066 | 0.009 | 0.185 | Not supported |
Publisher’s Note: MDPI stays neutral with regard to jurisdictional claims in published maps and institutional affiliations. |
© 2021 by the authors. Licensee MDPI, Basel, Switzerland. This article is an open access article distributed under the terms and conditions of the Creative Commons Attribution (CC BY) license (http://creativecommons.org/licenses/by/4.0/).
Share and Cite
MDPI and ACS Style
Palos-Sanchez, P.; Saura, J.R.; Ayestaran, R. An Exploratory Approach to the Adoption Process of Bitcoin by Business Executives. Mathematics 2021, 9, 355. https://0-doi-org.brum.beds.ac.uk/10.3390/math9040355
AMA Style
Palos-Sanchez P, Saura JR, Ayestaran R. An Exploratory Approach to the Adoption Process of Bitcoin by Business Executives. Mathematics. 2021; 9(4):355. https://0-doi-org.brum.beds.ac.uk/10.3390/math9040355
Chicago/Turabian StylePalos-Sanchez, Pedro, Jose Ramon Saura, and Raquel Ayestaran. 2021. "An Exploratory Approach to the Adoption Process of Bitcoin by Business Executives" Mathematics 9, no. 4: 355. https://0-doi-org.brum.beds.ac.uk/10.3390/math9040355
Note that from the first issue of 2016, this journal uses article numbers instead of page numbers. See further details here.