
Feature Selection for Colon Cancer Detection Using K-Means Clustering and Modified Harmony Search Algorithm


College of IT Convergence, Gachon University, Seongnam 13120, Korea
*
Author to whom correspondence should be addressed.
Mathematics 2021, 9(5), 570; https://0-doi-org.brum.beds.ac.uk/10.3390/math9050570
Submission received: 3 February 2021
/
Revised: 2 March 2021
/
Accepted: 3 March 2021
/
Published: 7 March 2021
Abstract
:This paper proposes a feature selection method that is effective in distinguishing colorectal cancer patients from normal individuals using K-means clustering and the modified harmony search algorithm. As the genetic cause of colorectal cancer originates from mutations in genes, it is important to classify the presence or absence of colorectal cancer through gene information. The proposed methodology consists of four steps. First, the original data are Z-normalized by data preprocessing. Candidate genes are then selected using the Fisher score. Next, one representative gene is selected from each cluster after candidate genes are clustered using K-means clustering. Finally, feature selection is carried out using the modified harmony search algorithm. The gene combination created by feature selection is then applied to the classification model and verified using 5-fold cross-validation. The proposed model obtained a classification accuracy of up to 94.36%. Furthermore, on comparing the proposed method with other methods, we prove that the proposed method performs well in classifying colorectal cancer. Moreover, we believe that the proposed model can be applied not only to colorectal cancer but also to other gene-related diseases.
1. Introduction
Colorectal cancer (CRC) is the third most common cause of cancer mortality and accounts for 11% of all cancer diagnoses worldwide [1,2]. Gender-wise, CRC is the third most common cancer among men and the second most among women [3]. Furthermore, as the incidence rate of young people with CRC is gradually increasing, the average age of people with CRC is also decreasing. The average age for CRC diagnosis in the United States was 72 years between 2001 and 2002, which decreased to 66 years between 2015 and 2016 [4]. Therefore, the importance of early diagnosis of CRC is being increasingly felt.
The major causes of CRC are smoking, obesity, and poor lifestyle and eating habits, all of which are acquired factors. It has been statistically shown that the risk for CRC is higher in developed countries [5]. Excessive consumption of animal fat and meat, especially red meat, acts as a risk factor for CRC. Nevertheless, cancer incidence due to various acquired or environmental factors can be substantially reduced by changing lifestyle patterns.
Meanwhile, genetic factors account for 10–30% of all CRC cases. However, the incidence of CRC due to genetic factors is significantly higher than that due to acquired factors. Representative examples include familiar adenomatous polyposis (FAP) and hereditary non-polyposis colorectal cancer (HNPCC). FAP causes several or thousands of adenomas to develop on the wall of the colon, and almost 100% of them develop into cancer in adulthood. Considering 95% of patients develop cancer before 45 years of age, prevention through early diagnosis is necessary. HNPCC develops at an early age and is more common than FAP, and the risk of CRC in immediate family members increases by 2–3 times [6]. Therefore, it is important to identify through testing the genes involved in the development of CRC.
Cancer is caused by genetic mutations in normal cells. Genes, the unit of function in human DNA, encode proteins, and these proteins then determine cell functions [7]. Gene expression refers to the process of producing a protein, the final product of DNA. Genetic information is transcribed into mRNA and translated by the amino acid sequence of the protein. Translated genetic information catalyzes biological reactions or forms of specific structures and is expressed in cells and individuals. During this process, when a gene becomes abnormal, it creates the wrong protein and mutations take place. CRC due to genetic reasons is caused when one such process occurs. Mutant genes that cause disease can be identified through special genetic tests. These state-of-the-art tests enable early diagnosis, treatment, and active prevention, but they are expensive and suffer from the disadvantage that the patient has to wait for approximately a month for the test results. In addition, it is not easy to identify the mutant gene using these tests as the probability of having a gene that causes CRC is 3–5%, considering the total number of genes that make up the human body [8]. It is difficult to choose a small number of genes compared to the high cost of genetic testing and the total number of genes. Our proposed method can overcome the aforementioned difficulties and help diagnose genetic CRC.
We propose the following feature selection method. First, candidate genes are selected for distribution between normal and abnormal classes using the Fisher score [9]. Based on the data selected as a subset, K-means clustering is performed and representative genes for each cluster are found [10]. Subsequently, using the harmony search (HS) algorithm, representative genes are searched for the optimal combination, which leads to high classification accuracy by using only a few genes [11].
2. Related Work
DNA information is an important factor in predicting genetic diseases. However, diagnosis can be difficult in unpredictable situations due to the large amount of data or genetic mutations. In recent years, with the progress made in the field of artificial intelligence, research on predicting diseases using only biological data has been actively conducted. Several studies have predicted CRC using the information on CRC genes published by the Princeton University Gene Expression Project.
In the above study, data were analyzed with random ensembles, and a support vector machine (SVM) was used as a classifier to predict CRC based on cancer gene information [12]. They created a random ensemble application using a new C++ class and the NEURObjects library [13].
There is also a study on feature selection using K-means clustering [14], wherein classification performance was compared using known methods, such as mRMR, Clustering+mRNR, SVM-RFE, Clustering+SVM-RFE, HSIC-LASSO, and Clustering+HSIC-LASSO.
3. Materials and Methods
For the 6500 human genes provided in [15], the expression levels of 40 tumors and 22 normal colon tissues were used. In this study, we used the information of 2000 genes with the highest minimum intensity among all samples. We attempted to classify CRC using the information on 2000 CRC genes from 62 people provided by the Princeton University Gene Expression Project. All data used in the experiment is either 3′ UTR or gene. 3′ UTR strictly controls gene expression in normal cells [16].
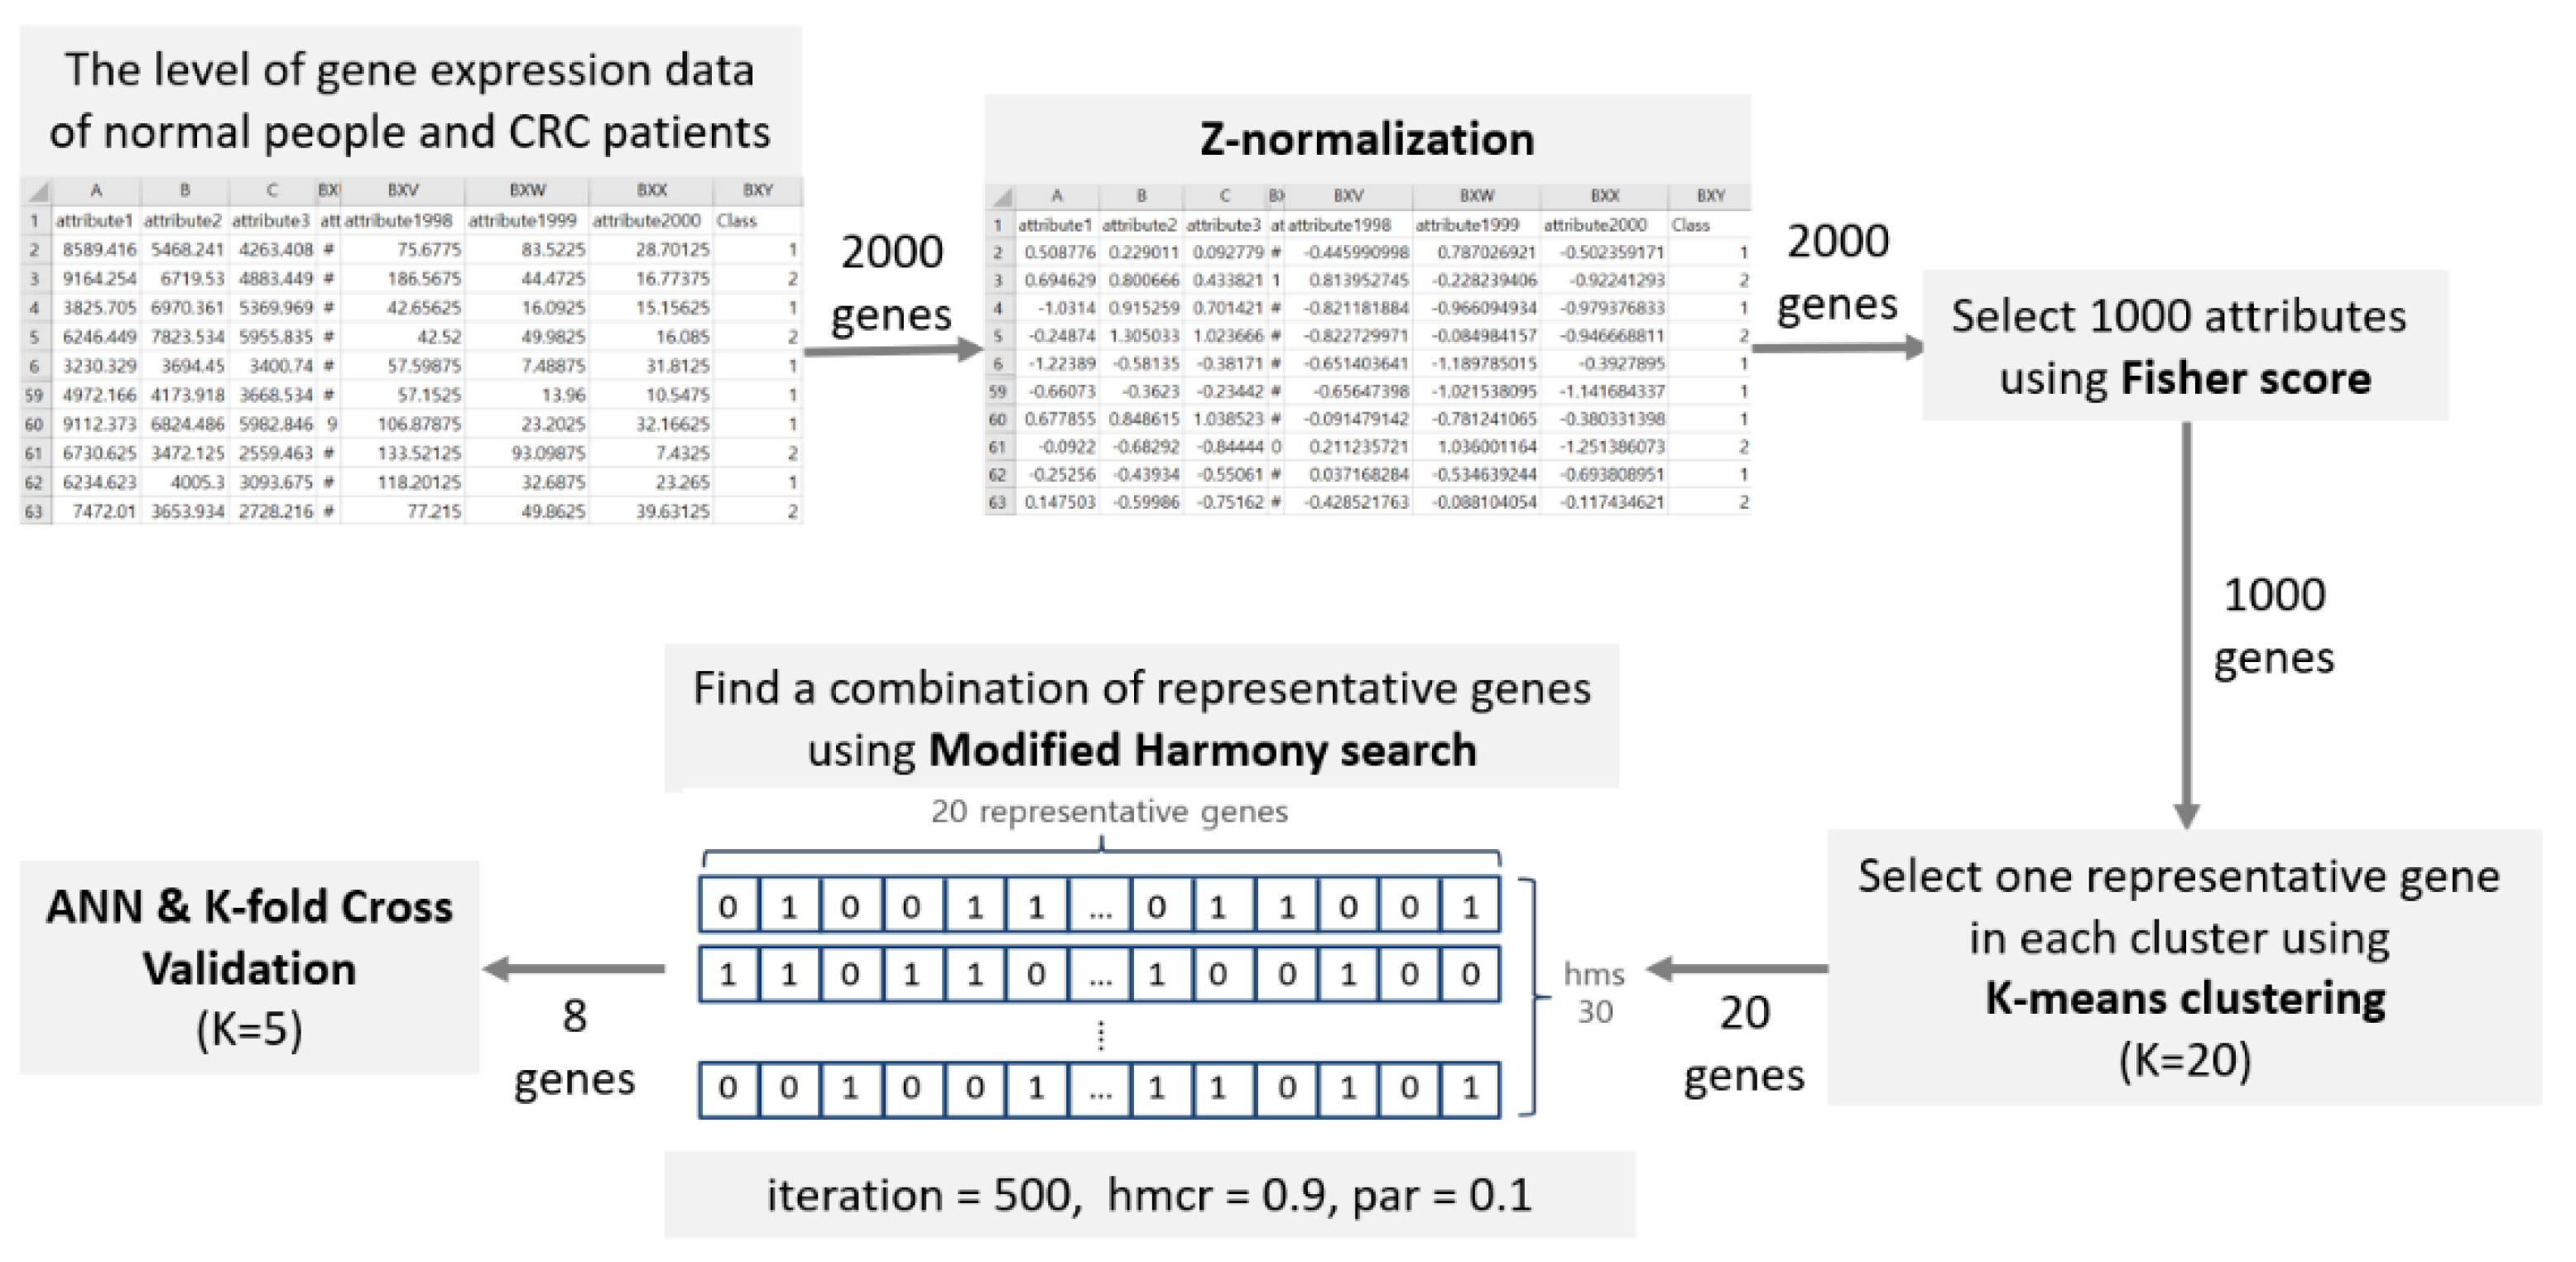
Figure 1 represents the step-by-step process proposed in this paper. The parameters and their corresponding values used in the experiment are described in the process of each step.
First, the data are normalized using Z-normalization [17]. Candidate genes are selected using the Fisher score with normalized data. Next, candidate genes selected using K-means clustering are classified, after which representative genes to be used for CRC prediction are selected within each cluster. Finally, the selected representative genes are searched for multiple gene combinations using the HS method. The combination obtained is then verified using a 5-fold validation method.
• Z-normalization
Normalization plays a role in reflecting all data values with the same degree of importance. The formula for Z-normalization is the same as in (1), where is the original normalized value, is the mean of the data, and is the standard deviation of the data. As for the normalized value, the mean of the genetic information values has a significant influence on the normalization. If the extracted value matches the mean of the genetic information, it is normalized to zero. If the extracted value is less than the mean, it is normalized to a negative number, and if the extracted value is greater than the mean, it is normalized to a positive number. The normalized negative and positive numbers are determined by the standard deviation of the genetic information value. If the range of the data values is large, that is, if the standard deviation is large, the normalized value approaches 0.
We normalized by substituting the original genetic information value into (1). Table 1 shows the values applied with Z-normalization of Attribute 1—one of each genetic information values for each patient. The number of patients included in the actual experiment was 62, but Table 1 only shows, as an example, the value of Attribute 1 for 12 patients. The average of Attribute 1 gene information of 62 people was 7015.78671. The average of Attribute 1 is subtracted from the patient’s genetic information value and divided by the standard deviation of the gene information, 3092.970584. As a result of this, a normalized number is obtained, as listed in Table 1, which applies to all data.
• Fisher Score
The combination to consider for selecting a small number of genes that distinguish colorectal cancer with 2000 genetic information values is near infinite. The main purpose of this process is to select candidate genes that are easy to classify using the Fisher score. Incidentally, this process reduces the number of combinations and serves as the basis for the selection of representative genes. It also reduces redundancy for genes with similar characteristics and reduces the time complexity for experiments. The Fisher score is one of Newton’s methods and is used for maximum likelihood estimation in statistics [18]. The score calculated using the Fisher score is represented by (2). and indicate the average gene information value of gene for a normal person and a person with a cancer gene, respectively, and and indicate the standard deviation of the gene for a normal person and a person with a cancer gene, respectively.
Here, the data refer to the gene information values of normal people and patients with CRC gene information. As the original data are already labeled for classification, the level of expression of gene i for classification can be evaluated. As the Fisher score increases, the difference between the distribution of the th class and the th class also increases. Therefore, we selected the top 1000 genes in the order of the highest Fisher score as candidate genes to be used in the next feature selection step.
• K-means Clustering
We used K-means clustering, an unsupervised learning method, to find representative genes from 1000 candidate genes selected using the Fisher score. In K-means clustering, clusters are created based on the nearest centroid, that is, the mean, in a group. Here, K-means clustering is carried out using the average of the data. When n data of (x1, x2, ..., xn) are divided into k clusters, the process can be expressed as
From each cluster’s data, the sum of the distances to the mean of the cluster is squared, and each value must be obtained when C becomes the minimum. Uk means that the vector belongs to the kth cluster and is placed in the center of the kth cluster. Therefore, the first Uk is an arbitrary initial value and is the center of the cluster. After fixing the Uk value, the rnk value that minimizes C is found. When xn belongs to the kth cluster, the value of rnk is 1; otherwise, it is 0. When the value of rnk is obtained, the newly obtained value of rnk is fixed and Uk is determined again. This process is repeated for a predetermined number of times or until the result of repetitive learning becomes meaningless.
In this study, the number of clusters was set to 20. The cluster consists of samples divided for the classification of CRC. Using all 1000 genes for feature selections, 20 representative genes were selected to account for diversity. In each cluster, the gene whose information data were closest to the median value was designated as the representative gene of the cluster. We used the cosine distance to calculate the distance between the data and the median. The cosine distance between and can be calculated using (4). The weights for each value is and We compute the cosine distance using a scipy.spatial.distance library.
• Modified Harmony Search (MHS)
The HS algorithm is an evolutionary computation algorithm inspired by the process involved in musicians’ improvising a harmony. Harmony Search is being applied to research using biodata. Hickmann et al. conducted a weekly prediction of seasonal influenza based on Wikipedia access and CDC influenza-like illness (ILI) reports [19]. They formed 50% and 95% confidence intervals for the 2013–2014 ILI observations. In the HSWOA method that combines HS and WOA (Whale Optimization Algorithm), a study was conducted to show the accuracy of hybridization reactions through DNA sequence [20]. Comparative analysis was conducted with NACST/.Seq [21], DEPT [22], H-MO-TLBO [23], and MO-ABC [24], and the average fitness of HSWOA was higher than that of the four algorithms. Additionally, there is a COA-HS algorithm that combines Harmony Search with cancer gene selection [25]. Their algorithm seeks to overcome the dimensional curse problem and is aimed at selecting meaningful genes. There is also a study proposing a metaheuristic harmony search algorithm that effectively predicts the structure of RNA as well as DNA [26]. Harmony Search is also applied to studies to reduce hand tremors for Parkinson’s disease rehabilitation and the intensity of magnetic fields transmitted to the brain [27]. In this study, the existing HS process was modified and used as a feature selection method. The existing HS algorithm involves a total of four steps.
Step 1. Initializing parameters and harmony memory
The first step is to initialize the variables and harmony so as to implement the harmony memory. To use this algorithm, we need to know the meaning of the parameters. As HS is an evolutionary algorithm, it can be compared to a genetic algorithm. The genes, which are basic elements of the chromosome in the genetic algorithm, are the same as the musical tones, which are the basic elements of a harmony vector. Harmony memory size (HMS) refers to the number of harmonies in one harmony memory. Harmony vectors are randomly initialized at the start of the HS method implementation, and previous harmony values are used when an iteration is performed later.
Step 2. Creating a new harmony
This is the stage where one can adjust the ratio for combination and create a new harmony and obtain a wide range of combinations. A group of harmonies as many as HMS is created within one harmony memory. One harmony vector is randomly selected within the same location of each harmony memory. The selected harmony vector becomes a new harmony vector at the corresponding position. New values at a location corresponding to each variable in the harmony are gathered to create a new harmony. Harmony memory considering rate (HMCR) is a probability value for creating a new harmony mentioned in the above process. 1-HMCR is the probability of randomly initializing a harmony vector when creating the first harmony, after which a new harmony is created and added to the harmony memory. The pitch adjusting rate (PAR) is the probability of providing a variation to the harmony vector. This is to obtain a diverse set of combinations.
Step 3. Updating harmony memory
In this step, the newly generated harmony vector is evaluated. The importance of the harmony is tested based on the objective function value (fitness value) of the harmony. If the new harmony vector generated in Step 2 has better function value than the worst fit one in the harmony memory, the new vector is included in the harmony memory and the lowest one is removed.
Step 4. Repeating Steps 2 and 3.
Steps 2 and 3 are repeated as many times as the specified iteration. With each iteration, the harmony with the lowest fitness is removed, and thus, various combinations are generated with the harmony of high fitness.
However, we propose a new method of feature selection by modifying the existing HS. The related pseudocode is shown in Algorithm 1.
| Algorithm 1. Pseudocode of Modified Harmony Search Algorithm |
| 1. Set the parameters BDR, HMS, HMCR, PAR 2. Set itr: =0 {iteration initialization} 3. Initialize Harmony with 0 and 1 (binary value) 4. BDR = HMS*0.2 //set the upper and lower area boundary 5. For (i = 1: i ≤ HMS) then 6. generate initial Harmony 7. End for 8. Repeat 9. For ( = 1: N) then //Harmony search in upper area 10. = Randomly select from to 11. end for 12. generate new Harmony ( 13. If (Rand(0,1) < HMCR) then //Harmony search in lower area 14. For ( = 1: N) then 15. Randomly select from to 16. If (Rand(0,1) < PAR) then 17. 18. end if 19. end for 20. generate new Harmony () 21. else 22. generate new Harmony randomly 23. end if 24. if (fit() < fit()) 25. update harmony memory 26. end if 27. set itr+=1 28. until (itr < maxit) 29. Get the best harmony |
Step 1. Initializing variable and harmony
To create a combination with 20 representative genes, the harmony vector is first initialized to 0 and 1. Zero means that the representative gene information value in the index is not used as a feature for classification, and 1 means that it is used as a feature for classification. HMCR is 0.9, PAR is 0.1, and the number of iterations (itr) is 500. HMS is set to 30.
Step 2. Creating new harmony and dividing harmony memory
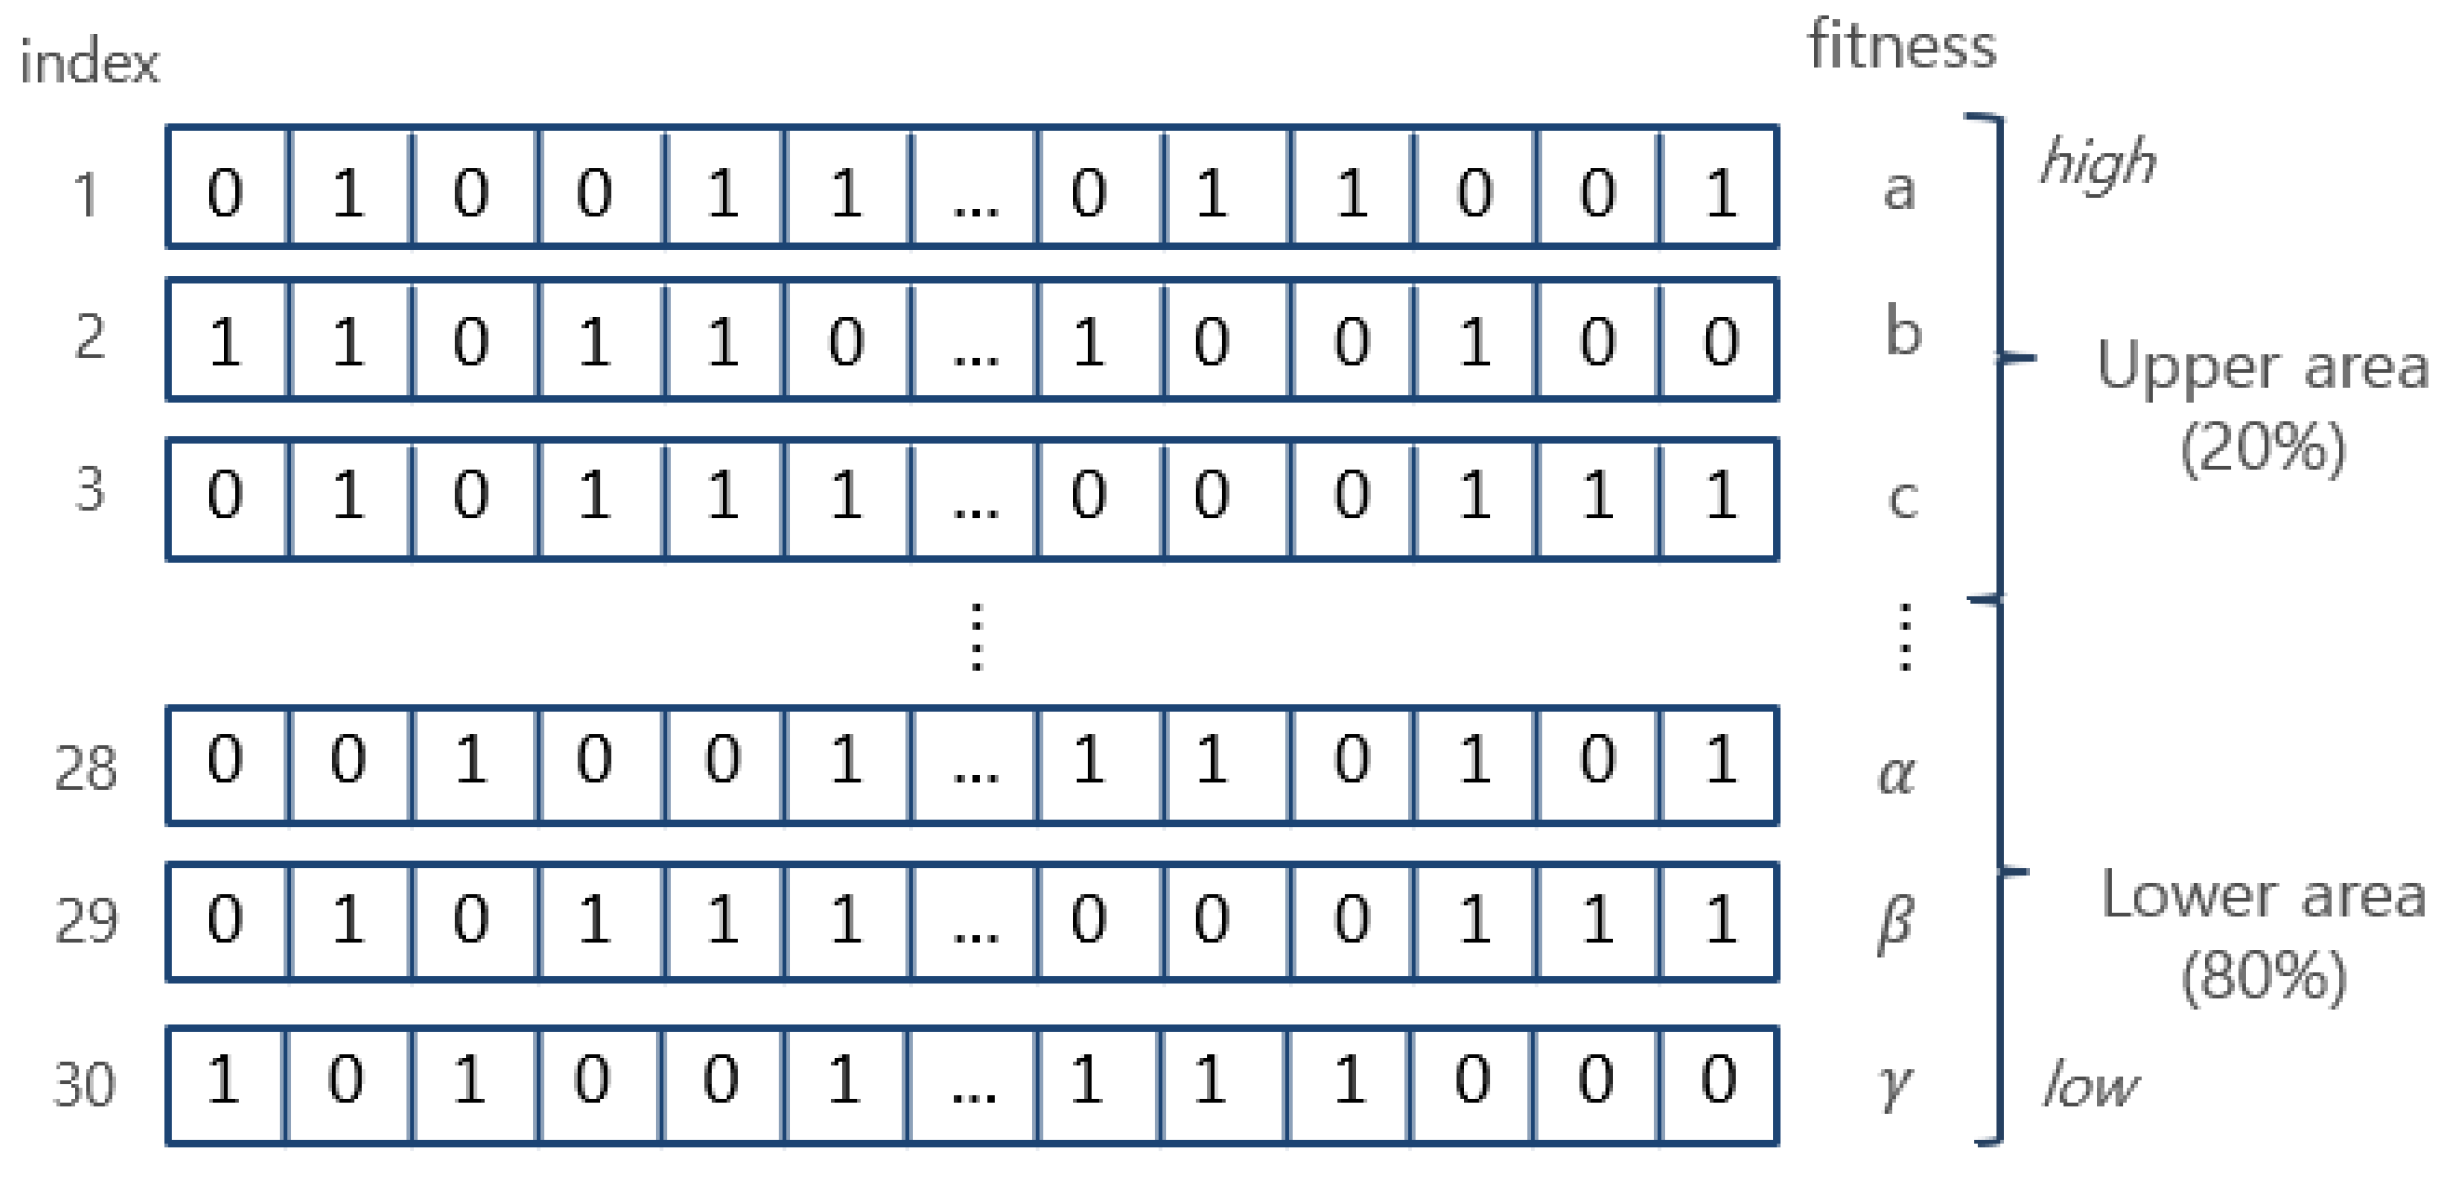
This step is a modified part of the existing HS for this study. The process of creating a new harmony memory is the same as the existing HS algorithm, but the experiment was conducted by dividing the harmony memory into two areas, as shown in Figure 2.
The upper area is composed of harmonies having the fitness of the top 20% within one harmony memory. HMCR and PAR are not used for this area. Therefore, new harmony is not added by initialization. Rather than creating the diversity of combinations, when the combination is recombined within the harmony of the upper area, a combination of higher fit could be found, after which new harmonies are created. In the second area, which is the lower area in harmony memory, new harmonies are created using the existing HS algorithm, that is, by using HMCR and PAR.
Step 3. Updating harmony memory
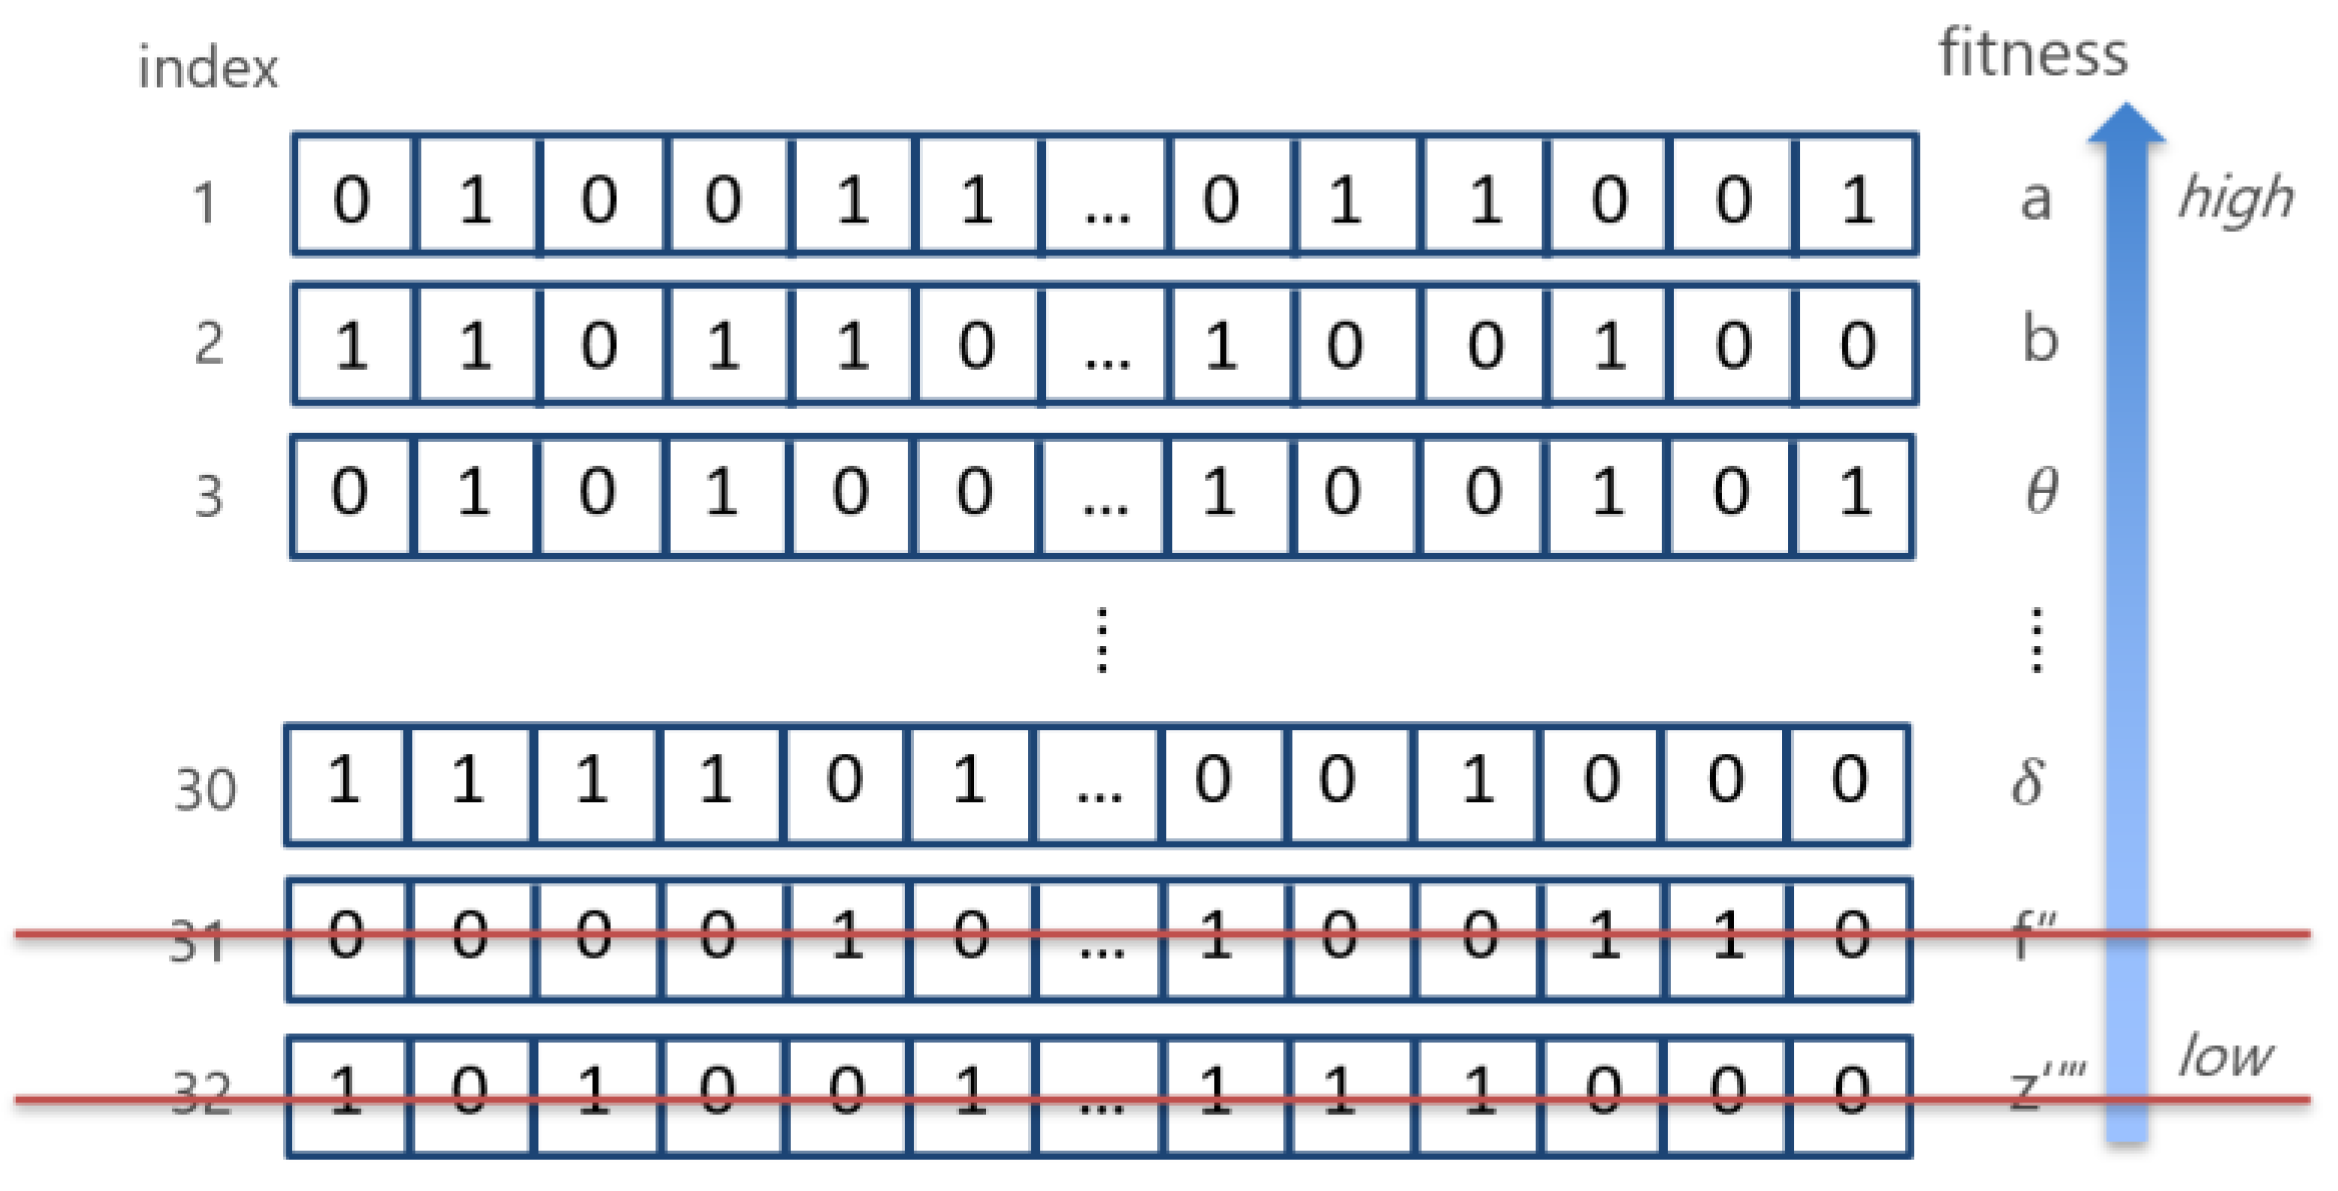
Goodness-of-fit is the classification accuracy obtained by applying the classification model used in the paper with the combination selected from the harmony. The fit is calculated according to each harmony value and is arranged in the order of the harmony with high fitness. As two new harmonies are created in Step 2, the two old harmonies with the lowest fit that are aligned as shown in Figure 3 are removed to match the size of the HMS that was initially specified.
Step 4. Repeating Steps 2 and 3
There is no newly modified process at this stage. Repeat Steps 2 and 3 as many as the iteration. As the number of repetitions increases, the upper region finds harmonies with a higher degree of fitness within the combination with higher suitability, whereas the lower region maintains the advantages of the existing HS, that is, finding combinations according to diversity. As the number of iterations increases, the highest classification accuracy of two areas within one harmony memory is stored in a text file, and the accuracy changes as the iterations’ progress is confirmed.
• Classification and Validation
We used an artificial neural network (ANN) as a classifier [28]. An ANN is a network created by abstracting neurons in the brain. Figure 4 shows the structure of the ANN used in our study. The input and the hidden layers are composed of five nodes. The output layer consists of one node, and the sigmoid function is used as the activation function.
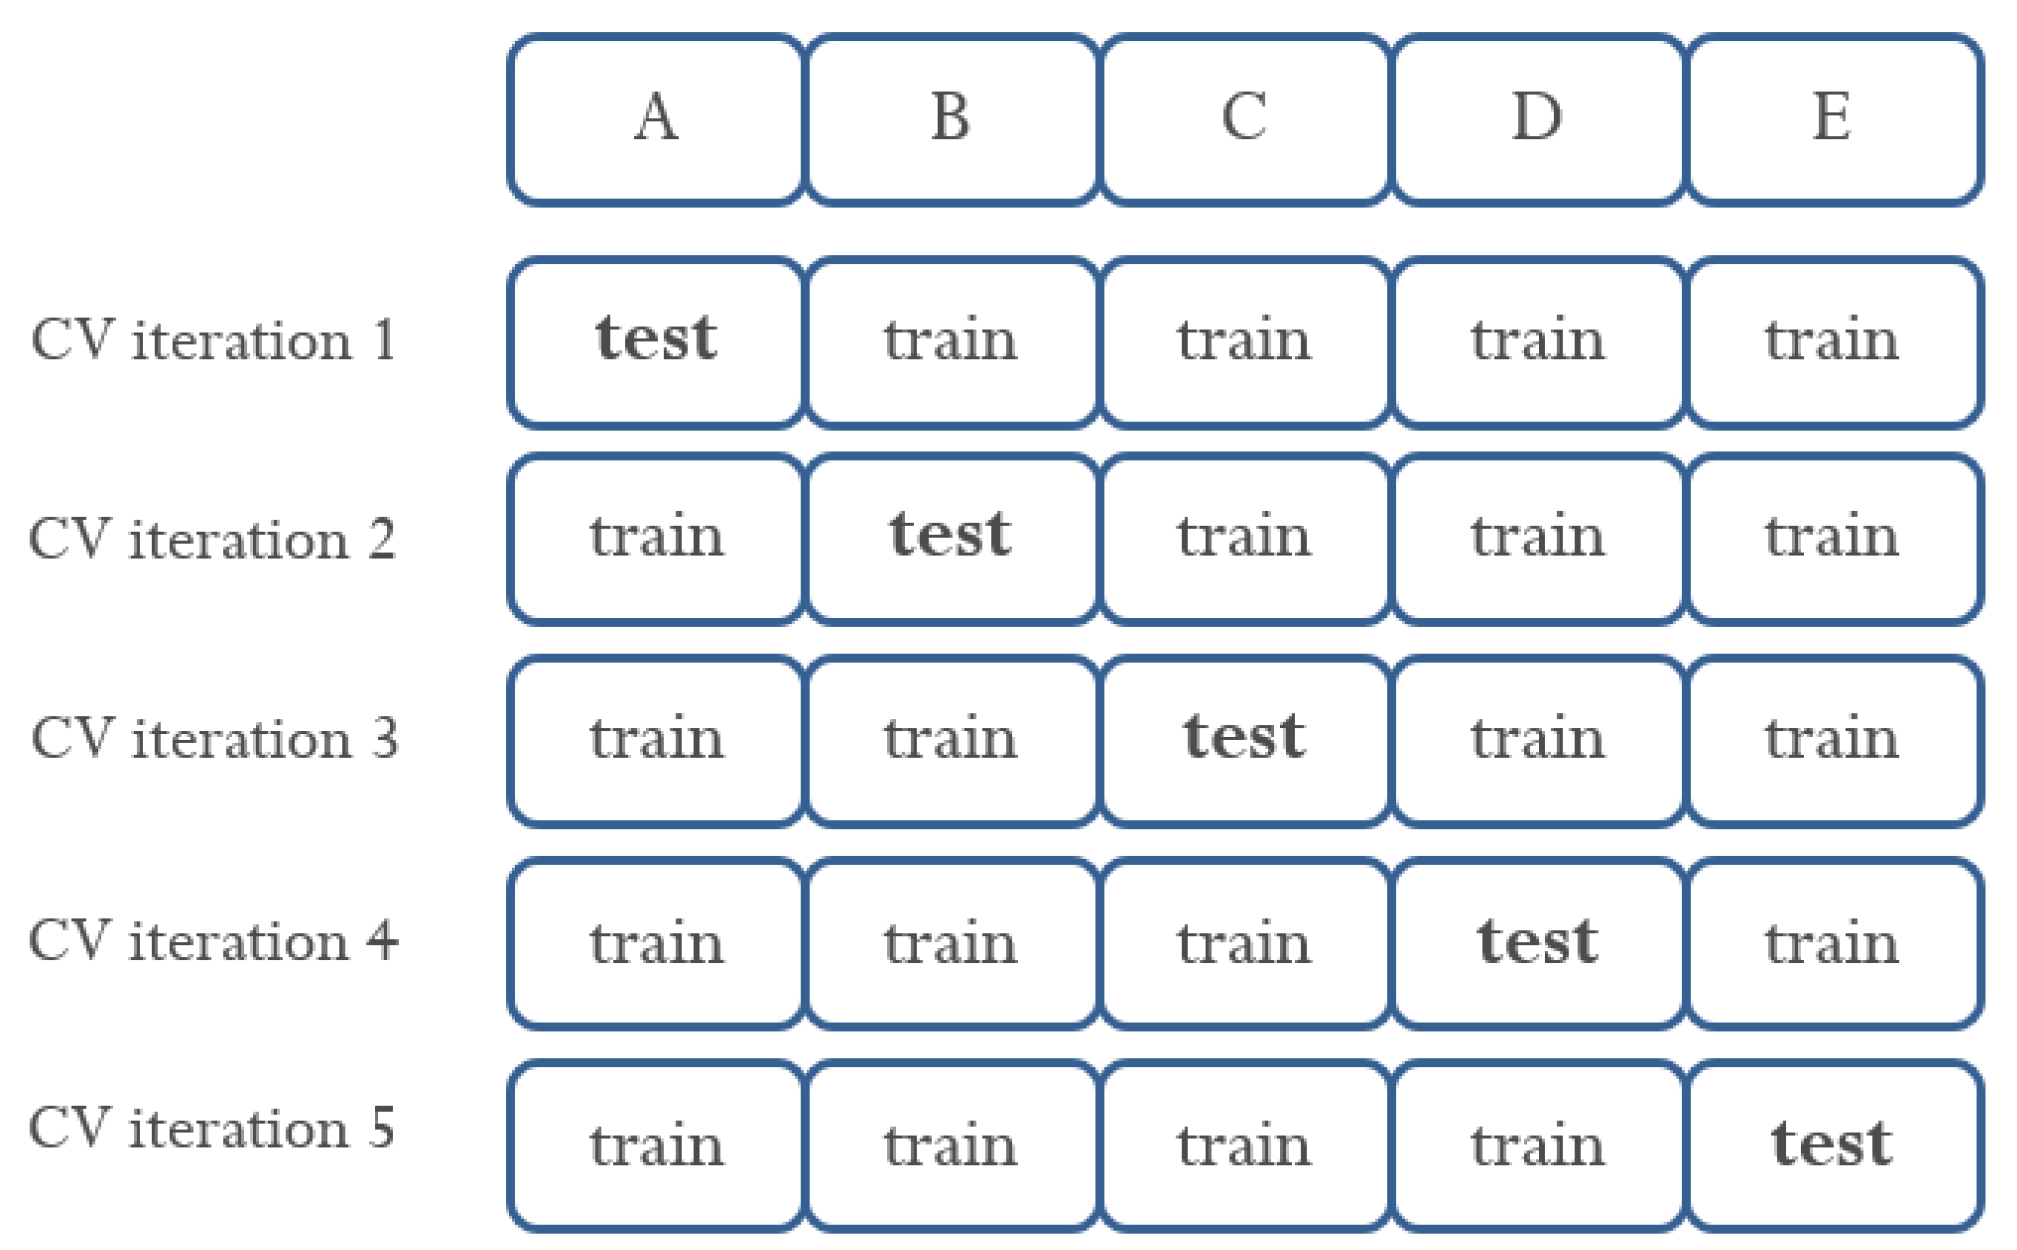
We used K-fold cross-validation as an experimental verification technique [29]. All data were used as a test set at least once to increase the reliability of data verification. Figure 5 shows the process of training and testing data divided using 5-fold cross validation. Furthermore, the combination of features selected for HS was verified through 5-fold cross-validation.
4. Results
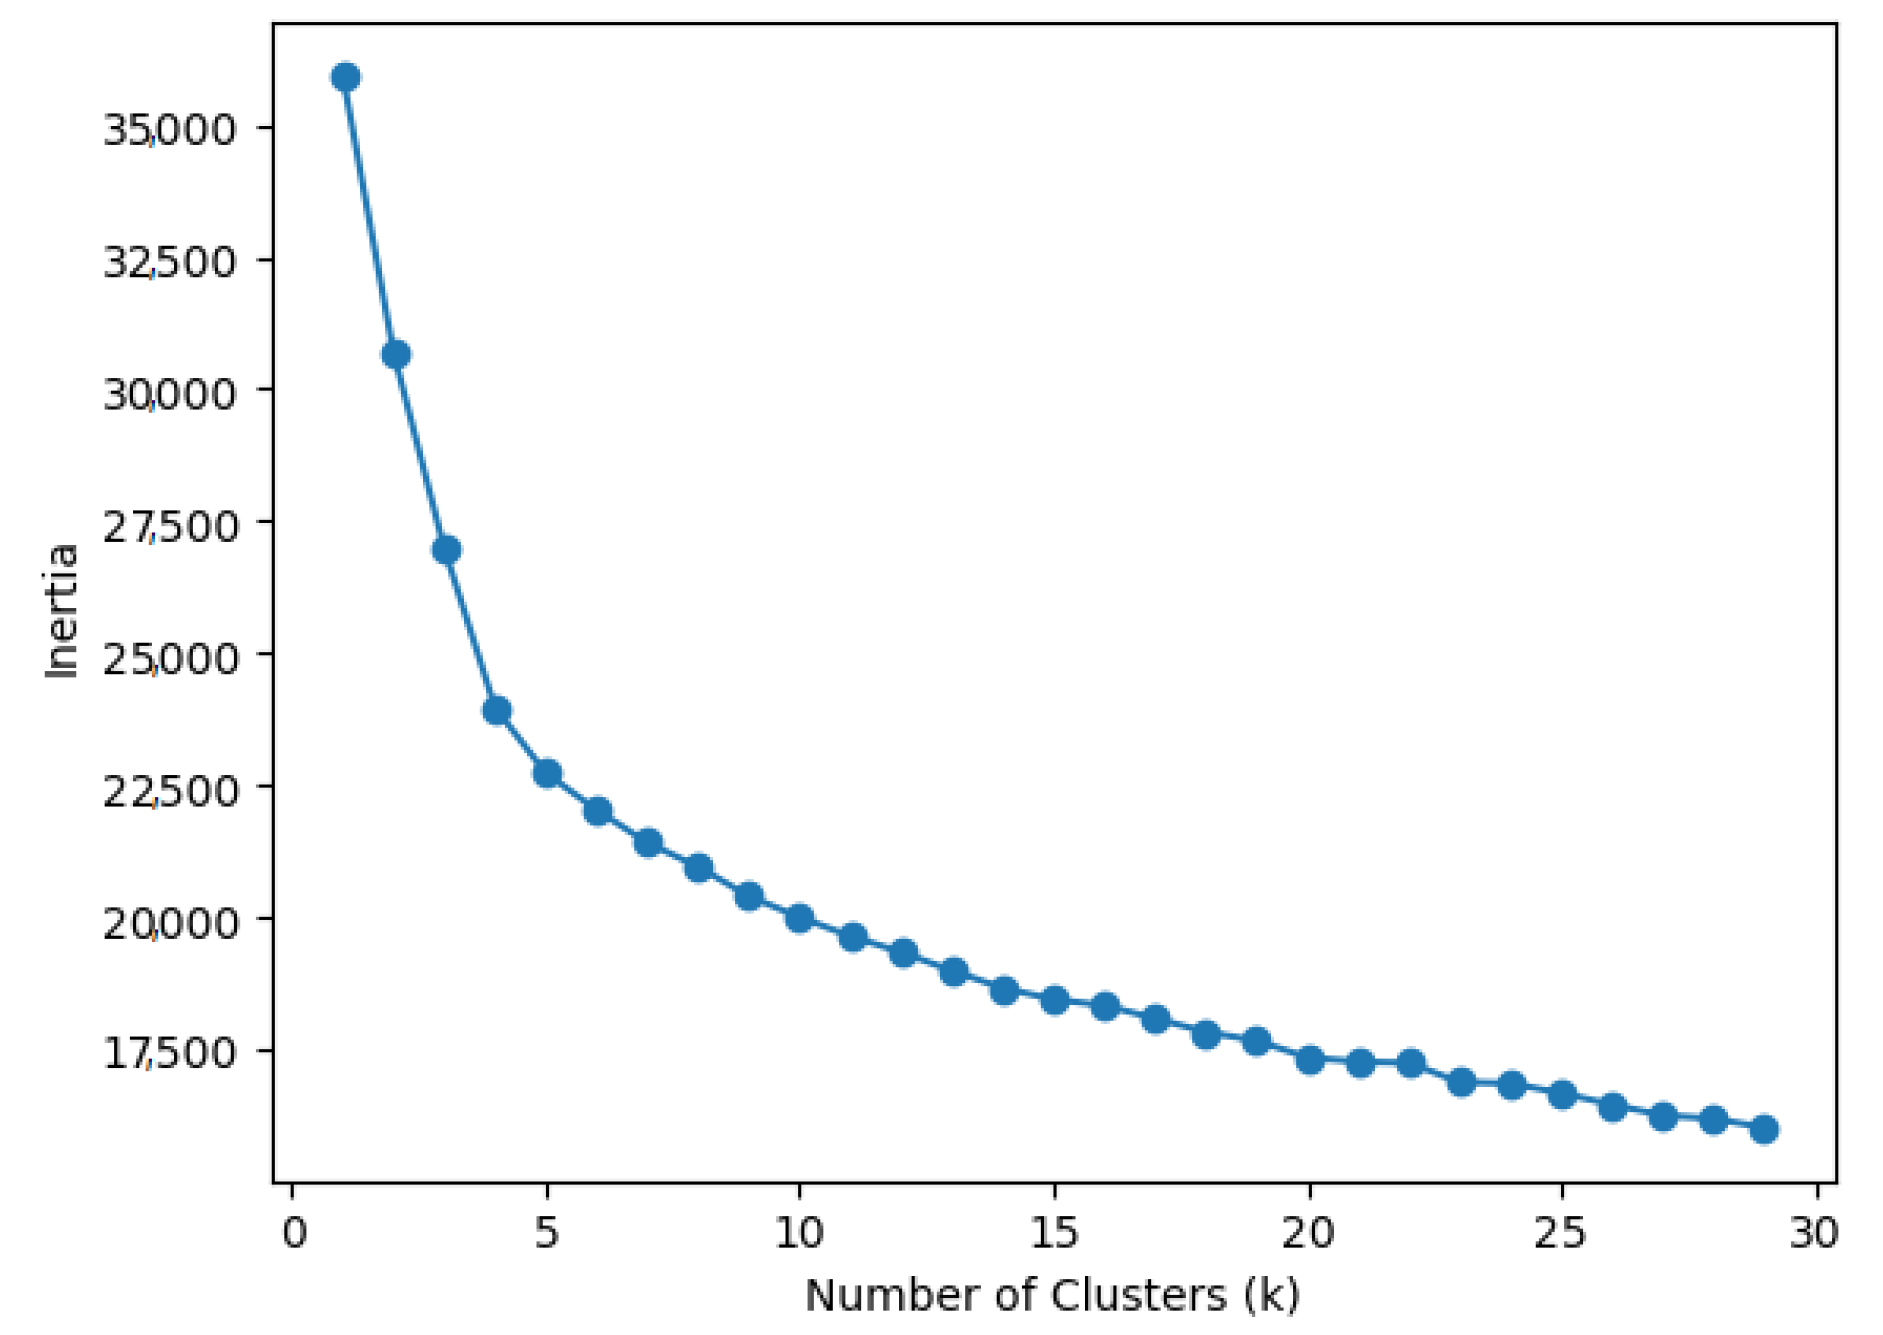
A total of 1000 candidate genes selected out of 2000 genes through the Fisher score were divided into 20 clusters by using K-means clustering. The optimal number of clusters was determined using the inertia value in the scikit. Figure 6 shows the inertia value according to the number of clusters. The lower the inertia value, the closer the distance between the values inside the cluster and the centroid. The smaller the inertia value, the higher the degree of aggregation of the data in the cluster can be evaluated. However, too many clusters can confuse the classification.
The representative genes selected through cosine distance from 20 clusters are as follows: attribute357, attribute457, attribute750, attribute722, attribute1635, attribute982, attribute936, attribute1897, attribute1515, attribute316, attribute1069, attribute1170, attribute158, attribute737, attribute640, attribute482, attribute109, attribute980, attribute43, and attribute1244. Table 2 summarizes the gene information of 62 gene values for 20 representative genes. All values in Table 2 are displayed only to four decimal places. Each row represents a gene value according to a patient’s attribute, and each column represents a patient’s gene information value for each attribute.
We selected eight genes from 20 representative genes using the HS feature selection method. The selected genes were attribute43 (ribosomal protein; Nicotiana tabacum), attribute737 (monoamine oxidase B), attribute936 (proteasome component), attribute1170 (GST1-Hs mRNA for GTP-binding protein), attribute1244 (mRNA for upstream binding factor), attribute1515 (grancalcin mRNA), attribute1635 (vasoactive intestinal peptide mRNA), attribute1897 (zinc finger protein mRNA), and the classification accuracy by using the ANN was 93.46%. Each attribute is closely related to CRC or cancer, and the evidence for this is supported by several studies [30,31,32,33,34,35,36].
5. Comparisons with Other Method Surveys
Many researchers have experimented with various classification algorithms using the colon cancer data provided by the Princeton University Gene Expression Project. Table 3 shows the number of genes selected in the present study in relation to other studies and the corresponding classification accuracies. As the range of accuracy can cause ambiguity in comparison, the representative accuracy of the research papers is shown. There are comparative papers that perform classification without using feature selection. Furthermore, there are studies that have used random forest (RF) algorithm [37], support vector machine (SVM) models [13], two-way clustering [38], and LogitBoot for 10-cross validation on the data provided by the Princeton University Gene Expression Project [39]. In addition, there are studies that derive classification accuracy through feature selection by using the Chameleon algorithm [40] and supervised group Lasso [41].
The proposed method achieved the highest accuracy when compared with other studies, regardless of features being selected and no features being selected. The Chameleon algorithm selected the fewest features among the comparative studies. However, our proposed method achieved better accuracy compared with the Chameleon algorithm (93.46% vs. 85.48%, respectively).
6. Conclusions and Future Works
In this study, in order to classify CRC using gene information, a hybrid method of normalizing gene information values using Z-normalization, reducing redundant genes using the Fisher score, selecting representative genes using K-means clustering, and feature selection using the HS algorithm was proposed. In K-means clustering, selecting representative genes using the cosine distance is straightforward and effective. The feature selection method modified from the original HS algorithm maintains high accuracy and improves classification performance by applying various combinations to the model. The experimental results showed a classification performance of 93.46% with only eight genes selected using the proposed method: attribute1635, attribute936, attribute1897, attribute1515, attribute1170, attribute737, attribute43, attribute1244. This can lead to cost-effectiveness due to fewer genetic tests. In addition, the results of the present study will greatly contribute in the prediction of not only the CRC gene but also various other genes causing diseases. For example, hereditary breast or ovarian cancer can also be predicted through genetic testing using the proposed method [42,43]. It is important to confirm the likelihood of a cancer gene through genetic testing for people with a family history of cancer-related diseases or for people who are likely to develop cancer. Therefore, research to predict cancer by finding a small number of genes according to gene mutations will be actively conducted in the future. There is a possibility of conducting experiments in different ways. For example, we can analyze genetic data used in our paper using other methods including single-particle tracking experiments. Additionally, our proposed methods can be applied to cancer-tracking time series data or non-genetic data (dietary, smoking or exercise) as well as genetic data to increase the objectivity and suitability of our model and data [44,45].
Author Contributions
Conceptualization, J.H.B.; methodology, J.H.B. and M.K.; software and experiments, J.H.B. and M.K.; writing—original draft preparation, J.H.B.; writing—review and editing, J.H.B. and Z.W.G.; supervision, J.S.L. and Z.W.G.; funding acquisition, Z.W.G. All authors have read and agreed to the published version of the manuscript.
Funding
This work was supported by a National Research Foundation of Korea (NRF) grant funded by the Korean government (MSIT) (2020R1A2C1A01011131). This research was also supported by the Energy Cloud R&D Program through the National Research Foundation of Korea (NRF) funded by the Ministry of Science, ICT (2019M3F2A1073164).
Institutional Review Board Statement
Not applicable.
Informed Consent Statement
Not applicable.
Data Availability Statement
Not applicable.
Conflicts of Interest
The authors declare no conflict of interest.
References
- Bray, F.; Ferlay, J.; Soerjomataram, I.; Siegel, R.L.; Torre, L.A.; Jemal, A. Global cancer statistics 2018: GLOBOCAN estimates of incidence and mortality worldwide for 36 cancers in 185 countries. CA A Cancer J. Clin. 2018, 68, 394–424. [Google Scholar] [CrossRef] [PubMed] [Green Version]
- Ferlay, J.; Ervik, M.; Lam, F.; Colombet, M.; Mery, L.; Piñeros, M.; Bray, F. Global Cancer Observatory: Cancer Today; International Agency for Research on Cancer: Lyon, France, 2018. [Google Scholar]
- Center, M.M.; Jemal, A.; Smith, R.A.; Ward, E. Worldwide Variations in Colorectal Cancer. CA A Cancer J. Clin. 2009, 59, 366–378. [Google Scholar] [CrossRef] [PubMed] [Green Version]
- Siegel, R.L.; Fedewa, S.A.; Anderson, W.F.; Miller, K.D.; Ma, J.; Rosenberg, P.S.; Jemal, A. Colorectal Cancer Incidence Patterns in the United States, 1974–2013. J. Natl. Cancer Inst. 2017, 109. [Google Scholar] [CrossRef] [Green Version]
- Rawla, P.; Sunkara, T.; Barsouk, A. Epidemiology of colorectal cancer: Incidence, mortality, survival, and risk factors. Gastroenterol. Rev. 2019, 14, 89–103. [Google Scholar] [CrossRef] [PubMed]
- Soravia, C.; Bapat, B.; Cohen, Z. Familial adenomatous polyposis (FAP) and hereditary nonpolyposis colorectal cancer (HNPCC): A review of clinical, genetic and therapeutic aspects. Schweiz. Med. Wochenschr. 1997, 127, 682. [Google Scholar] [PubMed]
- National Center for Biotechnology Information (US). Genes and Disease. Bethesda (MD): National Center for Biotechnology Information (US). Colon Cancer. 1998. Available online: https://0-www-ncbi-nlm-nih-gov.brum.beds.ac.uk/books/NBK22218/ (accessed on 15 January 2021).
- Burt, R.; Neklason, D.W. Genetic Testing for Inherited Colon Cancer. Gastroenterology 2005, 128, 1696–1716. [Google Scholar] [CrossRef] [PubMed]
- Gu, Q.; Li, Z.; Han, J. Generalized fisher score for feature selection. arXiv 2012, arXiv:1202.3725. [Google Scholar]
- Coates, A.; Ng, A.Y. Learning Feature Representations with K-Means. In Pattern Recognition. ICPR International Workshops and Challenges; Springer: New York, NY, USA, 2012; pp. 561–580. [Google Scholar]
- Lee, K.S.; Geem, Z.W. A new meta-heuristic algorithm for continuous engineering optimization: Harmony search theory and practice. Comput. Methods Appl. Mech. Eng. 2005, 194, 3902–3933. [Google Scholar] [CrossRef]
- Bertoni, A.; Folgieri, R.; Valentini, G. Bio-molecular cancer prediction with random subspace ensembles of support vector machines. Neurocomputing 2005, 63, 535–539. [Google Scholar] [CrossRef] [Green Version]
- Valentini, G.; Masulli, F. NEURObjects: An object-oriented library for neural network development. Neurocomputing 2002, 48, 623–646. [Google Scholar] [CrossRef] [Green Version]
- Marvi-Khorasani, H.; Usefi, H. Feature Clustering Towards Gene Selection. In Proceedings of the 2019 18th IEEE International Conference on Machine Learning And Applications (ICMLA), Boca Raton, FL, USA, 16–19 December 2019; pp. 1466–1469. [Google Scholar]
- Princeton University Gene Expression Project. Available online: http://microarray.princeton.edu/oncology/ (accessed on 15 January 2021).
- Misquitta, C.M.; Iyer, V.R.; Werstiuk, E.S.; Grover, A.K. The role of 3′-untranslated region (3′-UTR) mediated mRNA stability in cardiovascular pathophysiology. Mol. Cell. Biochem. 2001, 224, 53–67. [Google Scholar] [CrossRef] [PubMed]
- Cheadle, C.; Vawter, M.P.; Freed, W.J.; Becker, K.G. Analysis of Microarray Data Using Z Score Transformation. J. Mol. Diagn. 2003, 5, 73–81. [Google Scholar] [CrossRef] [Green Version]
- Bry, X.; Trottier, C.; Verron, T.; Mortier, F. Supervised component generalized linear regression using a PLS-extension of the Fisher scoring algorithm. J. Multivar. Anal. 2013, 119, 47–60. [Google Scholar] [CrossRef] [Green Version]
- Hickmann, K.S.; Fairchild, G.; Priedhorsky, R.; Generous, N.; Hyman, J.M.; Deshpande, A.; Del Valle, S.Y. Forecasting the 2013–2014 Influenza Season Using Wikipedia. Plos Comput. Biol. 2015, 11, e1004239. [Google Scholar] [CrossRef] [Green Version]
- Li, X.; Wang, B.; Lv, H.; Yin, Q.; Zhang, Q.; Wei, X. Constraining DNA Sequences with a Triplet-Bases Unpaired. IEEE Trans. Nanobioscience 2020, 19, 299–307. [Google Scholar] [CrossRef] [PubMed]
- Shin, S.-Y.; Lee, I.-H.; Kim, D.; Zhang, B.-T. Multiobjective Evolutionary Optimization of DNA Sequences for Reliable DNA Computing. IEEE Trans. Evol. Comput. 2005, 9, 143–158. [Google Scholar] [CrossRef] [Green Version]
- Chaves-González, J.M.; Vega-Rodríguez, M.A. DNA strand generation for DNA computing by using a multi-objective differential evolution algorithm. Biosystems 2014, 116, 49–64. [Google Scholar] [CrossRef]
- Chaves-González, J.M. Hybrid multiobjective metaheuristics for the design of reliable DNA libraries. J. Heuristics 2015, 21, 751–788. [Google Scholar] [CrossRef]
- Chaves-González, J.M.; Vega-Rodríguez, M.A.; Granado-Criado, J.M. A multiobjective swarm intelligence approach based on artificial bee colony for reliable DNA sequence design. Eng. Appl. Artif. Intell. 2013, 26, 2045–2057. [Google Scholar] [CrossRef]
- Elyasigomari, V.; Lee, D.; Screen, H.; Shaheed, M. Development of a two-stage gene selection method that incorporates a novel hybrid approach using the cuckoo optimization algorithm and harmony search for cancer classification. J. Biomed. Inform. 2017, 67, 11–20. [Google Scholar] [CrossRef]
- Mohsen, A.M.; Khader, A.T.; Ramachandram, D. HSRNAFold: A harmony search algorithm for RNA secondary structure prediction based on minimum free energy. In Proceedings of the 2008 International Conference on Innovations in Information Technology, Al Ain, United Arab Emirates, 16–18 December 2008; pp. 11–15. [Google Scholar]
- Faraji, B.; Esfahani, Z.; Rouhollahi, K.; Khezri, D. Optimal Canceling of the Physiological Tremor for Rehabilitation in Parkinson’s disease. J. Exerc. Sci. Med. 2020, 11. [Google Scholar]
- Jain, A.K.; Mao, J.; Mohiuddin, M. Neural networks: A tutorial. IEEE Comput. 1996, 29, 31–44. [Google Scholar] [CrossRef] [Green Version]
- Elad, A.; Kimmel, R. On bending invariant signatures for surfaces. IEEE Trans. Pattern Anal. Mach. Intell. 2003, 25, 1285–1295. [Google Scholar] [CrossRef]
- Grasso, S.; Tristante, E.; Saceda, M.; Carbonell, P.; Mayor-López, L.; Carballo-Santana, M.; Martínez-Lacaci, I. Resistance to Selumetinib (AZD6244) in colorectal cancer cell lines is mediated by p70S6K and RPS6 activation. Neoplasia 2014, 16, 845–860. [Google Scholar] [CrossRef] [Green Version]
- Yang, Y.C.; Chien, M.H.; Lai, T.C.; Su, C.Y.; Jan, Y.H.; Hsiao, M.; Chen, C.L. Monoamine Oxidase B Expression Correlates with a Poor Prognosis in Colorectal Cancer Patients and Is Significantly Associated with Epitheli-al-to-Mesenchymal Transition-Related Gene Signatures. Int. J. Mol. Sci. 2020, 21, 2813. [Google Scholar] [CrossRef] [PubMed]
- Yang, Q.; Roehrl, M.H.; Wang, J.Y. Proteomic profiling of antibody-inducing immunogens in tumor tissue identifies PSMA1, LAP3, ANXA3, and maspin as colon cancer markers. Oncotarget 2018, 9, 3996–4019. [Google Scholar] [CrossRef] [PubMed] [Green Version]
- Alves Martins, B.A.; De Bulhões, G.F.; Cavalcanti, I.N.; Martins, M.M.; de Oliveira, P.G.; Martins, A.M.A. Biomarkers in colorectal cancer: The role of translational proteomics research. Front. Oncol. 2019, 9, 1284. [Google Scholar] [CrossRef] [PubMed]
- Huang, R.; Wu, T.; Xu, L.; Liu, A.; Ji, Y.; Hu, G. Upstream binding factor up-regulated in hepatocellular carcinoma is related to the survival and cisplatin-sensitivity of cancer cells. FASEB J. 2002, 16, 293–301. [Google Scholar] [CrossRef] [PubMed]
- Korman, L.Y.; Sayadi, H.; Bass, B.; Moody, T.W.; Harmon, J.W. Distribution of vasoactive intestinal polypeptide and substance P receptors in human colon and small intestine. Dig. Dis. Sci. 1989, 34, 1100–1108. [Google Scholar] [CrossRef]
- Wong, T.-S.; Gao, W.; Chan, J.Y.-W. Transcription Regulation of E-Cadherin by Zinc Finger E-Box Binding Homeobox Proteins in Solid Tumors. BioMed Res. Int. 2014, 2014, 1–10. [Google Scholar] [CrossRef] [PubMed]
- Diaz-Uriarte, R.; De Andrés, S.A. Gene selection and classification of microarray data using random forest. BMC Bioinform. 2006, 7, 3. [Google Scholar] [CrossRef] [Green Version]
- Alon, U.; Barkai, N.; Notterman, D.A.; Gish, K.; Ybarra, S.; Mack, D.; Levine, A.J. Broad patterns of gene expression revealed by clustering analysis of tumor and normal colon tissues probed by oligonucleotide arrays. Proc. Natl. Acad. Sci. USA 1999, 96, 6745–6750. [Google Scholar] [CrossRef] [Green Version]
- Dettling, M.; Bühlmann, P. Boosting for tumor classification with gene expression data. Bioinformatics 2003, 19, 1061–1069. [Google Scholar] [CrossRef] [PubMed]
- Xie, J.; Wang, Y.; Wu, Z. Colon cancer data analysis by chameleon algorithm. Health Inf. Sci. Syst. 2019, 7, 1–8. [Google Scholar] [CrossRef] [PubMed]
- Ma, S.; Song, X.; Huang, J. Supervised group Lasso with applications to microarray data analysis. BMC Bioinform. 2007, 8, 60. [Google Scholar] [CrossRef] [Green Version]
- Hedenfalk, I.; Duggan, D.; Chen, Y.; Radmacher, M.; Bittner, M.; Simon, R.; Trent, J. Gene-expression profiles in he-reditary breast cancer. N. Eng. J. Med. 2001, 344, 539–548. [Google Scholar] [CrossRef]
- Prat, J.; Ribé, A.; Gallardo, A. Hereditary ovarian cancer. Hum. Pathol. 2005, 36, 861–870. [Google Scholar] [CrossRef] [PubMed]
- Thapa, S.; Lomholt, M.A.; Krog, J.; Cherstvy, A.G.; Metzler, R. Bayesian analysis of single-particle tracking data using the nested-sampling algorithm: Maximum-likelihood model selection applied to stochastic-diffusivity data. Phys. Chem. Chem. Phys. 2018, 20, 29018–29037. [Google Scholar] [CrossRef]
- Muñoz-Gil, G.; Garcia-March, M.A.; Manzo, C.; Martín-Guerrero, J.D.; Lewenstein, M. Single trajectory characterization via machine learning. New J. Phys. 2019, 22, 013010. [Google Scholar] [CrossRef]
Figure 1.
Scheme of proposed methods.

Figure 2.
Divided harmony memory.

Figure 3.
Elimination of two worst harmonies.

Figure 4.
Structure of ANN (artificial neural network).

Figure 5.
5-fold cross-validation data segmentation.

Figure 6.
Inertia value according to the number of clusters.


Table 1.
Z-normalized values of 12 patients corresponding to Attribute 1.
| Patient Number | Attribute 1 | After Z-Normalization |
|---|---|---|
| 1 | 8589.4163 | 0.508776126 |
| 2 | 9164.2537 | 0.694628976 |
| 3 | 3825.705 | −1.031397365 |
| 4 | 6246.4487 | −0.248737577 |
| 5 | 3230.3287 | −1.223890725 |
| 6 | 2510.325 | −1.45667784 |
| 57 | 4653.2375 | −0.763844707 |
| 58 | 4972.1662 | −0.660730665 |
| 59 | 9112.3725 | 0.67785507 |
| 60 | 6730.625 | −0.092196709 |
| 61 | 6234.6225 | −0.252561151 |
| 62 | 7472.01 | 0.147503275 |
Table 2.
20 representative genes used in modified harmony search expression levels.
| 357 | 457 | 750 | 722 | 1635 | 982 | 936 | 1897 | 1515 | 316 | 1069 | 1170 | 158 | 737 | 640 | 482 | 109 | 980 | 43 | 1244 | AA | |
|---|---|---|---|---|---|---|---|---|---|---|---|---|---|---|---|---|---|---|---|---|---|
| 1 | −0.1992 | 0.5071 | 0.1017 | −0.0684 | −0.6675 | −0.0300 | −0.5490 | −0.6626 | 0.1372 | −0.0531 | −0.3638 | −0.6533 | −0.5021 | −0.3102 | −0.2184 | −0.8842 | −0.8417 | 0.4786 | −0.2234 | −0.2627 | 0 |
| 2 | −0.7666 | 0.4399 | 0.5756 | 0.3717 | 0.9967 | 0.4240 | −0.2509 | 0.4489 | −0.0195 | −0.6426 | 1.8825 | −0.3336 | −0.1146 | 1.2792 | 0.3798 | −0.4430 | 0.1098 | 0.7575 | −0.7258 | 0.0056 | 1 |
| 3 | 3.0568 | −0.1159 | 1.2351 | −0.5044 | −0.8140 | −0.9917 | −0.7655 | −0.8108 | −1.2720 | −1.2896 | 0.7242 | −1.1906 | −0.5315 | −0.8249 | −0.8806 | −1.1246 | −1.1643 | 0.2576 | −1.3183 | −1.0884 | 0 |
| 4 | 1.2695 | −0.0903 | 0.8739 | −0.2384 | −0.5939 | −0.8132 | −0.7175 | −0.5897 | −0.5017 | −0.9306 | −0.3337 | −0.9889 | −0.6994 | 0.1333 | −0.4219 | −0.8763 | −1.1293 | 0.3639 | −1.0305 | −0.7914 | 1 |
| 5 | −0.0648 | −0.3319 | −0.6814 | −0.8450 | −0.6507 | −0.9795 | −0.5607 | −0.4224 | −1.1695 | −0.6220 | −0.3618 | −0.5248 | −0.3469 | −1.0208 | −0.3840 | −0.3813 | −0.3577 | 0.3520 | 0.1902 | −0.6380 | 0 |
| 6 | −0.2609 | −0.4963 | −1.1186 | −1.2516 | −0.2586 | −1.0143 | −0.7658 | 0.0749 | −1.2676 | −0.6466 | −0.7588 | −0.9889 | −0.5115 | −0.7993 | −0.9140 | −0.7159 | −1.1862 | −0.0364 | −0.9349 | −0.6244 | 1 |
| 7 | −0.6730 | 0.9887 | −0.1339 | −0.0290 | −0.7465 | −0.3074 | −0.3726 | −0.6688 | −0.8856 | −0.6814 | −0.8619 | −0.8984 | −0.3543 | −1.0381 | −0.2699 | −0.5531 | −0.5336 | −0.0188 | −0.5576 | −0.7322 | 0 |
| 8 | −0.6308 | −0.1363 | −0.8422 | −0.4778 | −0.3815 | −0.7124 | −0.3125 | −0.6811 | −1.2536 | −0.3774 | −0.3012 | −1.0148 | −0.1874 | −0.3649 | −0.6253 | −0.4677 | −1.0593 | 1.0362 | −1.0438 | −0.3638 | 1 |
| 9 | −1.0475 | 2.2475 | 1.6391 | 0.1700 | −0.8709 | 0.5576 | 0.8973 | −0.5581 | 1.4764 | 0.8136 | −0.5818 | −0.8986 | −0.2457 | −0.3360 | 0.9101 | 0.9838 | −1.0531 | 0.2195 | 1.7120 | −1.6739 | 0 |
| 10 | −0.2550 | 0.3901 | −0.1093 | −0.4833 | 0.5957 | −0.7036 | −0.5306 | 0.5286 | −1.0627 | −0.5627 | −0.3806 | 0.1106 | 0.9938 | −0.5130 | −0.1034 | −0.2700 | 0.5369 | 0.2222 | −0.5102 | 0.4171 | 1 |
| 11 | 0.4643 | 3.1825 | −0.3754 | 2.5536 | 0.3393 | 3.0958 | 0.8291 | −0.2470 | −0.7839 | 1.0607 | −0.1222 | 3.4112 | 3.1890 | −0.8244 | 5.5061 | 2.0606 | 3.0506 | 1.6047 | 1.6041 | −0.0807 | 0 |
| 12 | 1.0635 | 0.8152 | 0.8134 | 0.7939 | 0.4041 | 0.7287 | −0.3338 | 0.6967 | 0.2758 | 0.0028 | 1.3968 | −0.2761 | 0.2502 | 1.4674 | 0.5655 | −0.3176 | 0.1029 | 0.0466 | 0.0120 | −0.3680 | 1 |
| 13 | −0.3604 | −0.3781 | −0.5081 | −0.0171 | −0.2191 | −0.6880 | 0.0041 | −0.3768 | −0.9954 | −0.2205 | −0.5420 | −0.2176 | −0.5044 | −0.7372 | −0.5431 | −0.4008 | 0.2132 | 0.3524 | −0.0848 | −0.2478 | 0 |
| 14 | 0.6732 | −0.6340 | −0.5889 | −0.7660 | −0.0504 | −0.9001 | −0.5282 | −0.1615 | −0.7677 | −0.4724 | −0.5403 | −0.8730 | −0.8915 | −0.5668 | −0.7117 | −0.7386 | −0.4462 | 0.0252 | −0.4674 | −0.5418 | 1 |
| 15 | 0.1503 | −0.4892 | −0.0644 | −0.6390 | −0.4183 | −0.6987 | −0.1476 | −0.4740 | −0.3908 | 0.3067 | −0.1940 | −0.4529 | −0.2461 | −0.2099 | −0.6133 | −0.1809 | −0.3371 | 2.8237 | 0.4598 | 0.3234 | 0 |
| 16 | 0.1676 | −0.7636 | −0.6108 | −1.2205 | −0.5852 | −1.1287 | −0.2759 | −0.8298 | −0.8891 | 0.1060 | −0.8727 | −0.8725 | −0.8945 | −1.0600 | −0.9146 | −0.3240 | −0.0326 | 0.4168 | 0.0068 | −1.1281 | 1 |
| 17 | −0.5718 | −0.8460 | −1.2704 | −0.3834 | −0.8923 | −0.3836 | −0.5605 | −0.6439 | −1.2231 | −0.7155 | −0.8652 | −0.9879 | −1.1323 | −0.8553 | −0.4576 | −0.6124 | −0.9954 | −1.0213 | 0.5998 | −0.9727 | 0 |
| 18 | −0.9664 | −0.6742 | −1.2115 | −0.7833 | −0.0885 | −0.4719 | −0.8443 | −0.5524 | −1.2840 | −1.1437 | −0.9806 | −1.0695 | −1.2193 | −0.9612 | −0.4430 | −0.8493 | −1.1887 | −0.3629 | −1.0256 | −0.6510 | 1 |
| 19 | −1.0436 | −0.2089 | −0.6123 | −0.2747 | −0.9536 | −0.6383 | −0.2481 | −0.6895 | −0.7374 | −0.1340 | −0.7427 | −0.7266 | −0.9080 | −0.8854 | −0.0453 | −0.1587 | −1.2486 | −0.3400 | 0.2375 | −0.9134 | 0 |
| 20 | −0.2527 | 0.1530 | −1.2221 | −0.8715 | 0.4357 | −0.9488 | −0.5732 | 0.0302 | −1.3058 | −0.5522 | −0.7981 | −0.6371 | −0.1376 | −0.9913 | −0.6748 | −0.6001 | −0.9203 | −0.0483 | −0.3883 | −0.1806 | 1 |
| 21 | −0.9218 | 1.0238 | 0.1857 | 0.1325 | −0.5060 | 0.6150 | −0.0497 | −0.6540 | 0.1856 | −1.4646 | −0.7467 | 0.1420 | 0.1219 | −0.2450 | −0.0476 | −0.2655 | −0.1910 | 0.7110 | −0.2819 | 0.5922 | 0 |
| 22 | 1.1915 | 0.5421 | 0.6284 | 0.2280 | 1.4242 | 0.2572 | −0.6487 | 0.1901 | 0.1229 | −0.4806 | 0.2446 | 0.2541 | 0.4371 | 0.5256 | 0.0108 | −0.8016 | 0.4805 | 1.4955 | −0.7911 | 1.9297 | 1 |
| 23 | −0.9997 | −1.2956 | −1.3319 | −0.9966 | −0.7991 | −1.0448 | −0.1708 | −0.6968 | −1.1930 | 0.0079 | −0.9208 | −0.8099 | −0.7786 | −1.0369 | −0.5300 | 0.1939 | −0.1510 | 0.2602 | 0.2545 | −0.6840 | 0 |
| 24 | −1.1251 | −1.3200 | −1.5176 | −1.5869 | −0.5999 | −1.2172 | −1.0349 | −0.8018 | −1.3932 | −1.3848 | −1.0472 | −1.1924 | −1.2572 | −1.0503 | −0.9622 | −1.0551 | −1.2676 | −1.0237 | −1.4197 | −1.2531 | 1 |
| 25 | 2.1527 | −0.3799 | 0.4128 | 0.0581 | −0.6111 | −0.2685 | −0.0154 | −0.5231 | 0.5592 | 0.7240 | −0.7720 | −0.2615 | 0.0890 | −0.5596 | −0.3297 | 0.5333 | 0.3943 | −0.8399 | 1.5212 | −0.0460 | 0 |
| 26 | −0.8154 | −0.3332 | −0.5275 | −0.2076 | −0.7800 | −0.6859 | −0.7967 | −0.6935 | 0.0172 | −0.8118 | −0.7327 | 0.0515 | −0.1746 | −0.8941 | −0.5018 | −0.6701 | 0.5713 | −1.2620 | −0.8807 | −0.9011 | 0 |
| 27 | −0.7735 | −0.6015 | −0.6106 | −0.5381 | −0.4543 | −0.2415 | −0.7473 | −0.5819 | 0.0240 | −0.7150 | −0.6884 | −0.0911 | −0.1966 | −0.7717 | −0.5844 | −0.6931 | 0.1300 | −1.3225 | −0.7485 | −0.8737 | 0 |
| 28 | −0.9109 | 0.5173 | 1.0975 | 0.5547 | −0.6970 | 0.2649 | 0.2318 | −0.5522 | 2.1660 | 1.0763 | −0.0386 | 0.3183 | 0.7718 | 0.4314 | 0.4805 | 0.5893 | 1.3612 | −0.5206 | 0.9256 | −0.2098 | 0 |
| 29 | −0.5721 | 2.7545 | 3.1274 | 1.9689 | −0.0094 | 1.1863 | −0.0478 | −0.1891 | 2.9906 | 0.4199 | 0.3571 | 2.0584 | 3.0102 | −0.1471 | 1.0052 | −0.1387 | 2.7865 | −0.6162 | −0.1087 | 0.4574 | 0 |
| 30 | −0.9161 | 1.6600 | 1.1954 | 2.3194 | −0.4940 | 1.7943 | 0.4048 | −0.3110 | 1.4713 | 0.4678 | −0.3249 | 1.0437 | 1.8333 | 0.1317 | 0.9502 | 0.3860 | 2.1646 | −0.3548 | 0.6085 | −0.0898 | 0 |
| 31 | −1.1165 | 0.8826 | 1.8629 | 0.2982 | −0.3599 | 0.2675 | 0.3571 | 0.3901 | 2.5001 | 0.9578 | 4.1938 | 0.2754 | 1.2105 | 1.0568 | −0.0928 | 0.2485 | 0.4813 | −0.8199 | 0.3256 | 0.5439 | 0 |
| 32 | −0.9831 | −0.1959 | −1.3571 | −0.4143 | 0.4154 | 0.5795 | −0.5073 | 0.1110 | −0.9439 | −0.7458 | −0.4805 | 0.1408 | −0.2808 | −1.0085 | −0.2011 | −0.2811 | −0.3807 | −1.1552 | −0.5167 | −0.8709 | 0 |
| 33 | −0.4961 | −0.0128 | −1.1792 | −0.2391 | −0.5376 | −0.3355 | −0.3795 | −0.6084 | −0.9436 | −0.1182 | −1.0148 | −0.3036 | −0.0893 | −1.0762 | −0.4375 | 0.3608 | −0.3553 | −1.2858 | 0.4535 | −0.4651 | 0 |
| 34 | 0.9835 | 0.1354 | 0.8543 | 0.1376 | −0.4418 | 0.0355 | 0.7054 | −0.2009 | 0.8813 | 1.0063 | 0.3341 | −0.1728 | 0.4361 | 0.3466 | −0.1904 | 0.1423 | 0.3706 | −0.4896 | 0.3484 | −0.3974 | 0 |
| 35 | −0.4833 | −0.3394 | −0.6218 | −0.1287 | −0.6790 | 0.1834 | −0.3002 | −0.5671 | −0.1395 | −0.4042 | −0.2245 | −0.3249 | −0.6001 | −0.8524 | −0.2944 | −0.3355 | −1.0430 | −1.0594 | −0.8860 | −0.8007 | 0 |
| 36 | −0.7281 | −0.8700 | −1.0871 | −0.8550 | −0.8165 | 0.0969 | 0.5636 | −0.5480 | −0.1181 | 0.3411 | −0.6805 | −0.2281 | −0.8138 | −0.8964 | −0.6067 | 0.6057 | −0.4189 | −0.8495 | 0.5910 | −1.1440 | 0 |
| 37 | −0.3399 | 3.0909 | 2.7314 | 0.6380 | −0.2966 | −0.2066 | −0.4223 | −0.7412 | 0.7620 | −0.6222 | −0.1975 | 0.1739 | 3.1760 | −0.7350 | 0.3958 | −0.5145 | 0.1316 | −0.5937 | −0.5462 | −0.0562 | 0 |
| 38 | −1.1911 | −0.9283 | −1.0429 | −1.0896 | −0.8135 | −0.6132 | 0.2649 | −0.7337 | −0.1926 | 0.4481 | −0.8865 | 0.0863 | −0.7292 | −1.0073 | −0.6858 | 0.5026 | 0.2004 | −1.0883 | 1.3413 | −1.1143 | 0 |
| 39 | −0.3071 | −1.2474 | 0.0860 | −1.0948 | 1.0319 | −0.8550 | −0.5113 | 0.4325 | −0.1901 | −0.4962 | 0.3330 | −0.4471 | −0.5249 | 1.0173 | −0.7199 | −0.5768 | −0.2850 | −0.7477 | −0.7928 | 0.4443 | 1 |
| 40 | 0.2579 | −0.6935 | −0.3056 | 0.8062 | −0.5388 | 0.4405 | −0.2563 | −0.1171 | 0.4400 | 0.0777 | −0.3132 | 0.0615 | −0.4472 | −0.1293 | 0.3970 | −0.2903 | 0.0332 | −0.5678 | 0.7060 | −0.1725 | 0 |
| 41 | −0.6221 | −1.2147 | −0.2310 | −0.9927 | −0.8238 | −0.7229 | −0.5687 | −0.6551 | 0.2961 | −0.7430 | −0.0772 | −0.9459 | −1.1104 | −0.4439 | −0.3033 | −0.6929 | −1.0863 | −1.1514 | −0.7252 | −0.9379 | 0 |
| 42 | 0.3246 | 0.1301 | −0.0365 | 0.7536 | 1.1815 | −0.1630 | 0.2493 | 0.8735 | −0.3192 | 0.2676 | −0.1930 | −0.4060 | −0.2470 | 0.7416 | 0.3565 | −0.0454 | −0.7271 | −0.2528 | −0.6329 | 1.2129 | 1 |
| 43 | 1.9695 | 0.9077 | 0.8436 | 2.2059 | 2.5041 | 1.1565 | 1.2523 | 5.0353 | 0.3198 | 0.6450 | 2.0593 | 1.5501 | 0.7583 | 2.0433 | 0.0396 | 1.7493 | 0.7779 | 0.7293 | 0.2850 | 2.0997 | 1 |
| 44 | −0.6286 | 1.0261 | 0.3036 | 2.5481 | −0.0714 | 3.8247 | 2.3460 | 0.2476 | 0.7710 | 1.8683 | 0.1706 | 2.3022 | 0.3095 | −0.1948 | 2.7512 | 2.0757 | 1.7530 | 0.9490 | 1.9587 | 0.6909 | 0 |
| 45 | 1.0009 | 0.7865 | 2.4011 | 1.5617 | 3.0845 | 0.8111 | 0.5197 | 1.2789 | 1.8771 | 1.1289 | 0.6236 | 2.5353 | 1.8333 | 3.4374 | 1.2130 | 0.4487 | 2.2789 | −0.2895 | 0.0593 | 3.5573 | 0 |
| 46 | 2.1343 | 0.7579 | 0.0162 | 2.6774 | 0.1163 | 2.1145 | 3.2065 | 0.5759 | 1.0534 | 3.2313 | −0.4136 | 1.3026 | 0.8483 | 0.3653 | 1.9049 | 3.1342 | 0.7206 | −0.2964 | 2.7839 | 1.5164 | 0 |
| 47 | 0.7965 | 0.3297 | 0.7166 | 0.4364 | 0.0677 | 0.8326 | 4.9333 | −0.0258 | 1.9736 | 2.0418 | −0.3203 | 2.9719 | 1.5455 | 0.5613 | 1.3445 | 4.5603 | 1.3877 | 2.1283 | 2.2865 | 2.0161 | 0 |
| 48 | −0.2596 | −0.3361 | 0.4716 | −0.1349 | 4.0534 | −0.1928 | 0.0167 | 1.3918 | 0.4278 | −0.2243 | 1.5200 | 0.8905 | 1.2019 | 1.4025 | 0.0835 | 0.0383 | 0.5237 | −0.1815 | −1.0054 | 1.6031 | 1 |
| 49 | −0.0226 | −0.4900 | −0.4330 | −0.3172 | 1.4328 | 0.0199 | −0.6444 | 0.1271 | −0.5104 | −0.9655 | −0.0533 | 0.3951 | −0.3541 | 0.9183 | 0.1715 | −0.7495 | −0.5247 | −0.9193 | −1.0624 | 0.2604 | 0 |
| 50 | 0.2691 | −0.7205 | −0.2008 | 0.2954 | 1.0927 | −1.0150 | −0.3882 | 3.2096 | −0.1876 | 0.6101 | 0.8424 | 0.0779 | −0.4090 | 1.3963 | −0.1282 | −0.0492 | 1.0513 | 1.5847 | −0.0730 | 0.8097 | 1 |
| 51 | −1.0684 | −0.6466 | −0.6541 | −0.6908 | −0.1836 | 0.3447 | −0.5880 | −0.5316 | 0.4261 | −0.2238 | −0.7169 | −0.1310 | −0.0254 | −0.4201 | −0.5104 | −0.3398 | −0.0721 | 1.8853 | −0.1081 | 1.6590 | 1 |
| 52 | 0.3214 | −0.0499 | 0.1444 | 1.4566 | −0.3449 | 2.2177 | 2.1168 | 0.0888 | 1.0617 | 3.9229 | −0.6109 | 0.4205 | −0.0079 | 0.4511 | 0.6379 | 1.6055 | 1.0541 | 3.2448 | 3.2324 | 0.6117 | 0 |
| 53 | −0.6844 | −0.8219 | −0.0865 | −0.7453 | −0.5648 | −0.0203 | −0.0723 | −0.4516 | 0.3664 | 0.3297 | 0.2201 | −0.4875 | −0.5796 | −0.2607 | −0.4161 | −0.4218 | −0.4390 | −0.3909 | 0.5963 | −0.0209 | 0 |
| 54 | −0.2355 | −0.6462 | 0.6279 | −0.3769 | 0.6364 | −0.7139 | 0.0674 | 1.7679 | 0.6581 | 0.3100 | 1.5562 | −0.2193 | 0.1656 | 2.0470 | −0.4447 | 0.0956 | −0.7435 | 0.4457 | −0.1701 | 1.7074 | 1 |
| 55 | 2.1278 | −0.4153 | −0.3230 | −0.1529 | −0.5469 | −0.2273 | −0.4385 | −0.1479 | −0.3919 | −0.0556 | 0.1997 | 0.0787 | −0.3176 | −0.1840 | −0.2261 | −0.4615 | −0.2847 | −0.8512 | −0.6685 | −0.2232 | 1 |
| 56 | 0.2032 | −0.4662 | −0.6407 | −0.5504 | 0.8009 | −0.6042 | −0.0797 | 1.3601 | −0.4682 | −0.4208 | 0.5604 | −0.3195 | −0.4353 | 0.4957 | −0.7274 | −0.1458 | −0.4557 | −0.6586 | −0.5978 | −0.1099 | 0 |
| 57 | 2.0444 | −0.8584 | 0.8658 | −0.9170 | −0.7307 | −0.6747 | −0.7436 | −0.2323 | −0.0305 | −0.4500 | 3.1704 | −0.4119 | −0.6079 | 1.3337 | −0.8944 | −0.6458 | −0.6273 | 0.9960 | −0.7052 | −0.3002 | 0 |
| 58 | −0.6652 | −0.9762 | −0.4155 | −0.7555 | −0.9611 | −0.8140 | −0.7491 | −0.8122 | 0.0495 | −1.1010 | 0.0414 | −0.8919 | −1.0581 | −0.5954 | −0.5056 | −0.7965 | −0.8875 | −1.2378 | −0.6453 | −1.1103 | 0 |
| 59 | −0.3915 | −0.6791 | −0.6367 | −0.6560 | −0.3747 | 0.3404 | 0.4901 | −0.1944 | −0.5081 | 0.3228 | −0.3809 | 0.6629 | −0.5926 | 0.1046 | −0.5600 | 0.3525 | 1.1441 | −0.1059 | 0.7094 | 0.4779 | 0 |
| 60 | −0.0889 | −0.5860 | −0.1552 | −0.2093 | 1.5965 | 0.1178 | −0.6404 | 0.4750 | 0.2935 | −1.1046 | 0.8902 | 0.6335 | −0.0928 | 1.8118 | 0.3945 | −0.3636 | −0.1894 | −0.2347 | −1.0748 | 0.5274 | 1 |
| 61 | 0.2936 | −0.5280 | −0.8700 | −0.2632 | −0.6020 | 0.0362 | −0.0931 | −0.6343 | 0.1302 | −0.6866 | −0.5733 | −0.4376 | −0.7027 | −0.3033 | −0.1950 | −0.3600 | −0.6969 | −0.7171 | −0.5882 | −0.5232 | 0 |
| 62 | 1.5230 | −0.4513 | −0.1981 | −0.1999 | 0.6194 | −0.3169 | −0.2257 | 1.2388 | −0.3746 | −0.2321 | 0.6893 | −0.2619 | −0.3217 | 1.6116 | −0.1817 | −0.0748 | −0.4894 | 0.3250 | −0.4697 | 0.0995 | 1 |
Table 3.
Performance comparison of various algorithms.
| Method | Number of Genes | Accuracy (%) |
|---|---|---|
| LogitBoot | 2000 | 85.48 |
| Random Forest | 2000 | 84.10 |
| SVM | 2000 | 82.26 |
| Two-way clustering | 2000 | 87.10 |
| Chameleon algorithm | 5 | 85.48 |
| Supervised group Lasso | 22 | 85.48 |
| Z-FS-KM-MHS (our method) | 8 | 93.46 |
Publisher’s Note: MDPI stays neutral with regard to jurisdictional claims in published maps and institutional affiliations. |
© 2021 by the authors. Licensee MDPI, Basel, Switzerland. This article is an open access article distributed under the terms and conditions of the Creative Commons Attribution (CC BY) license (http://creativecommons.org/licenses/by/4.0/).
Share and Cite
MDPI and ACS Style
Bae, J.H.; Kim, M.; Lim, J.S.; Geem, Z.W. Feature Selection for Colon Cancer Detection Using K-Means Clustering and Modified Harmony Search Algorithm. Mathematics 2021, 9, 570. https://0-doi-org.brum.beds.ac.uk/10.3390/math9050570
AMA Style
Bae JH, Kim M, Lim JS, Geem ZW. Feature Selection for Colon Cancer Detection Using K-Means Clustering and Modified Harmony Search Algorithm. Mathematics. 2021; 9(5):570. https://0-doi-org.brum.beds.ac.uk/10.3390/math9050570
Chicago/Turabian StyleBae, Jin Hee, Minwoo Kim, J.S. Lim, and Zong Woo Geem. 2021. "Feature Selection for Colon Cancer Detection Using K-Means Clustering and Modified Harmony Search Algorithm" Mathematics 9, no. 5: 570. https://0-doi-org.brum.beds.ac.uk/10.3390/math9050570
Note that from the first issue of 2016, this journal uses article numbers instead of page numbers. See further details here.