
Variations of Trail Runner’s Fitness Measures across a Season and Relationships with Workload

 , , ,
, , ,  , and
, and 
Abstract
:1. Introduction
2. Materials and Methods
2.1. Participants
2.2. Experimental Approach to the Problem
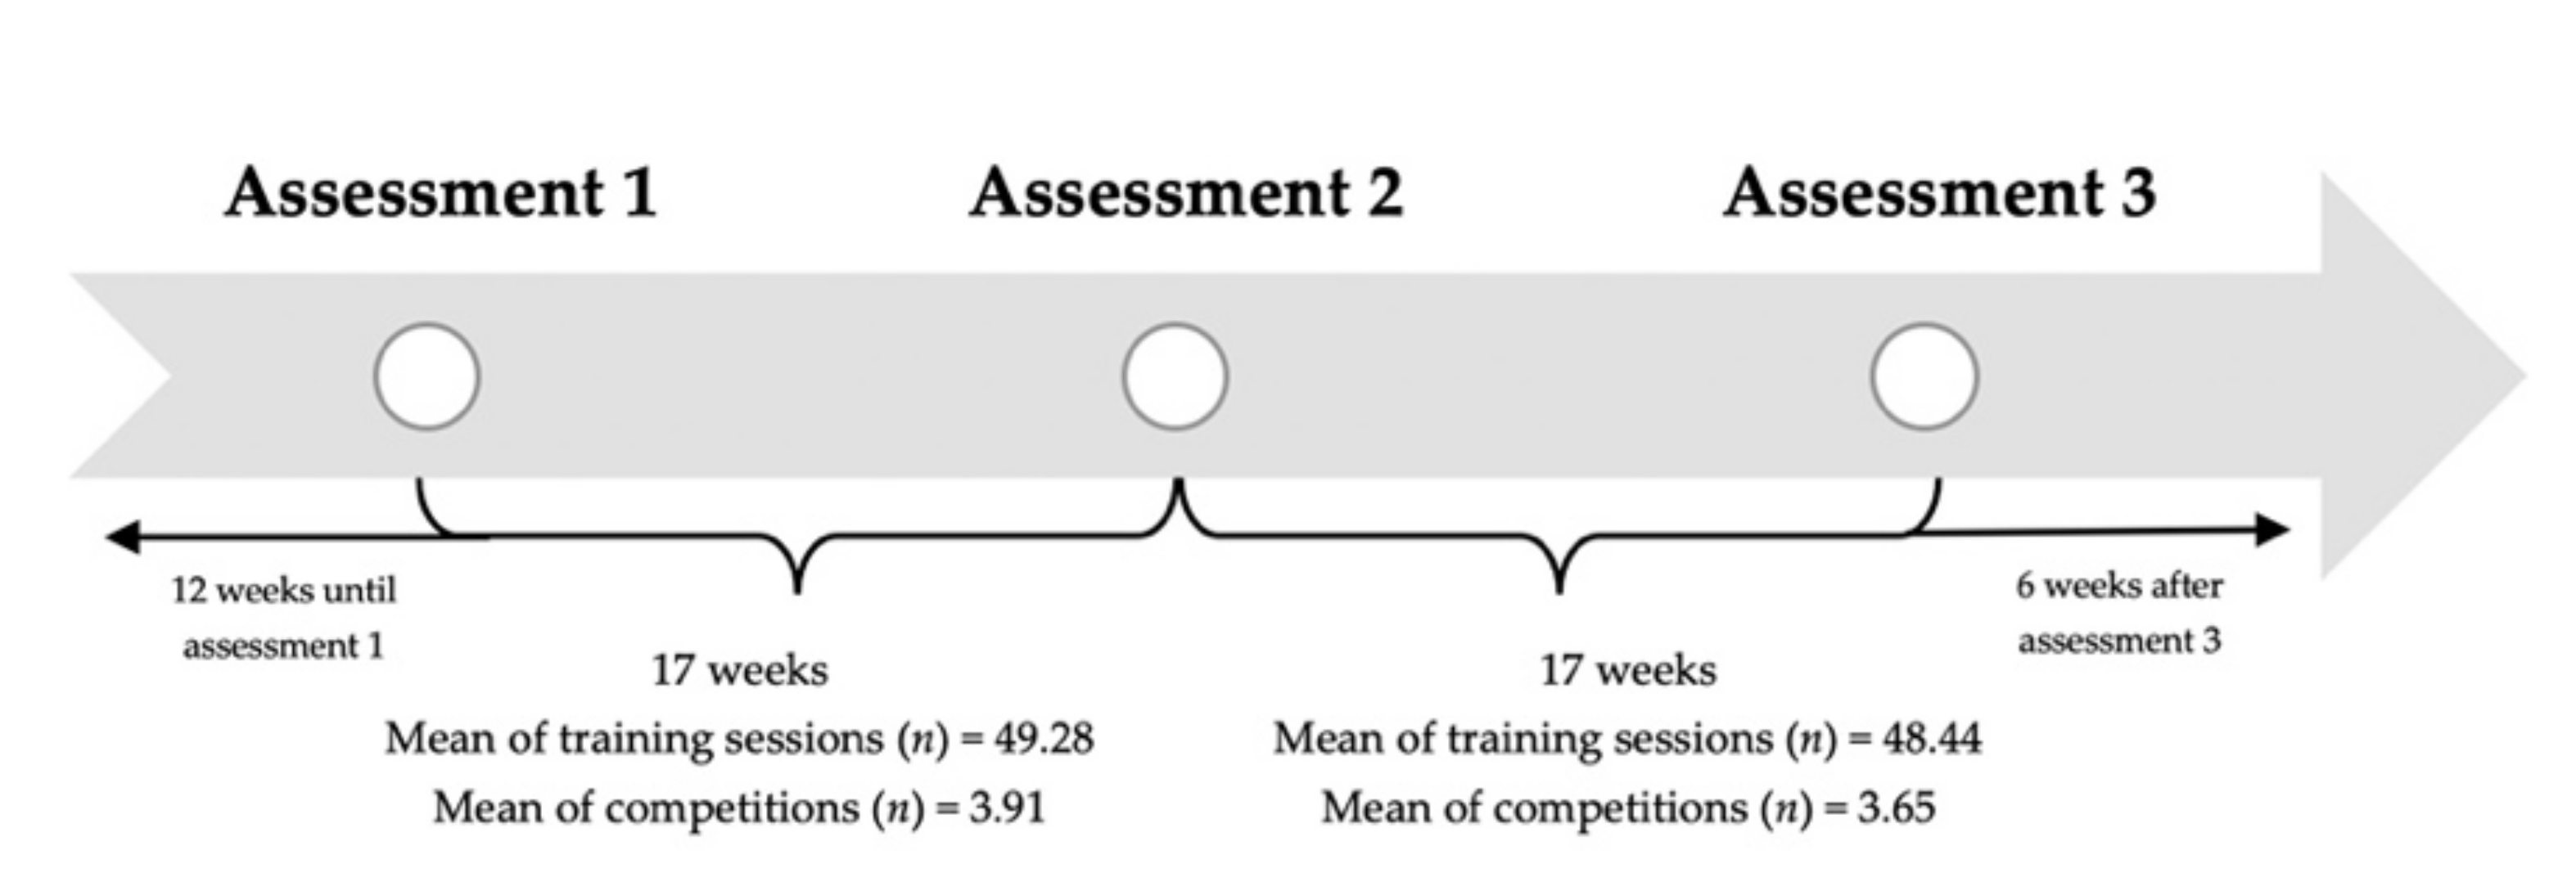
2.3. Periodic Assessment
2.3.1. Anthropometrics
2.3.2. Vertical Jump Assessment
2.4. Dynamic Balance
2.5. Aerobic Performance
2.6. Training Load Monitoring
2.6.1. Distance Covered
2.6.2. Rate of Perceived Exertion
2.7. Statistical Analysis
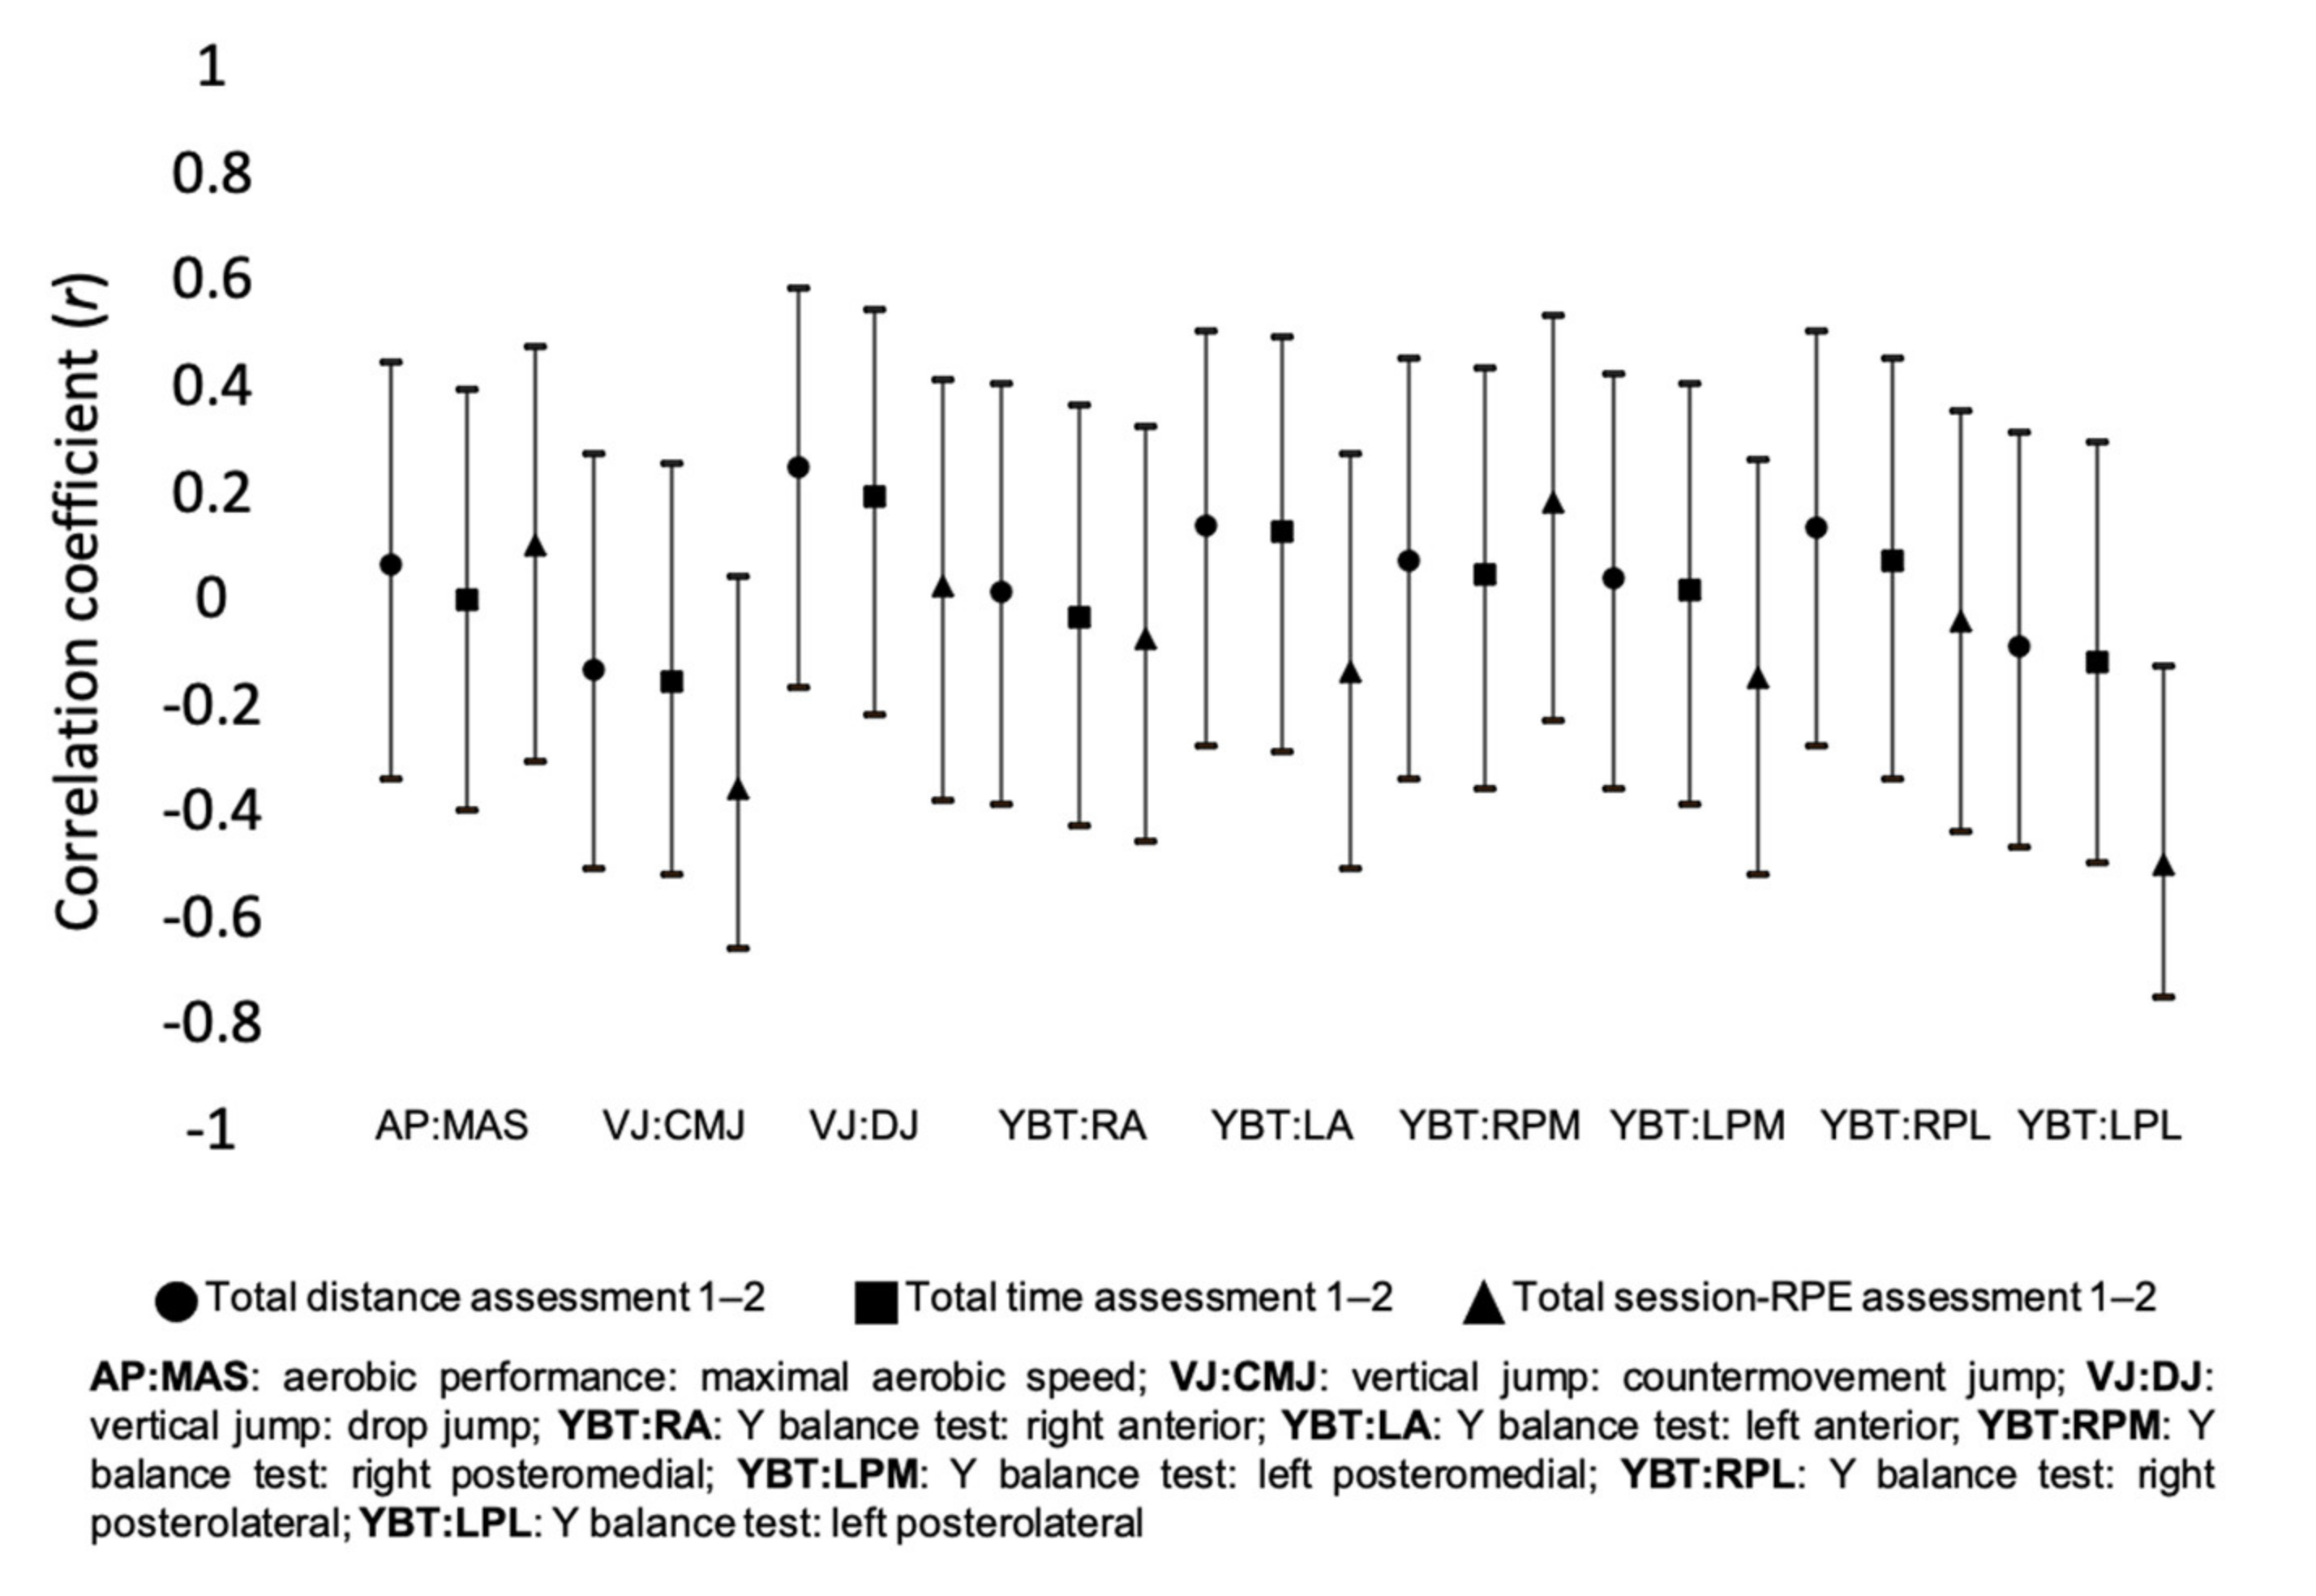
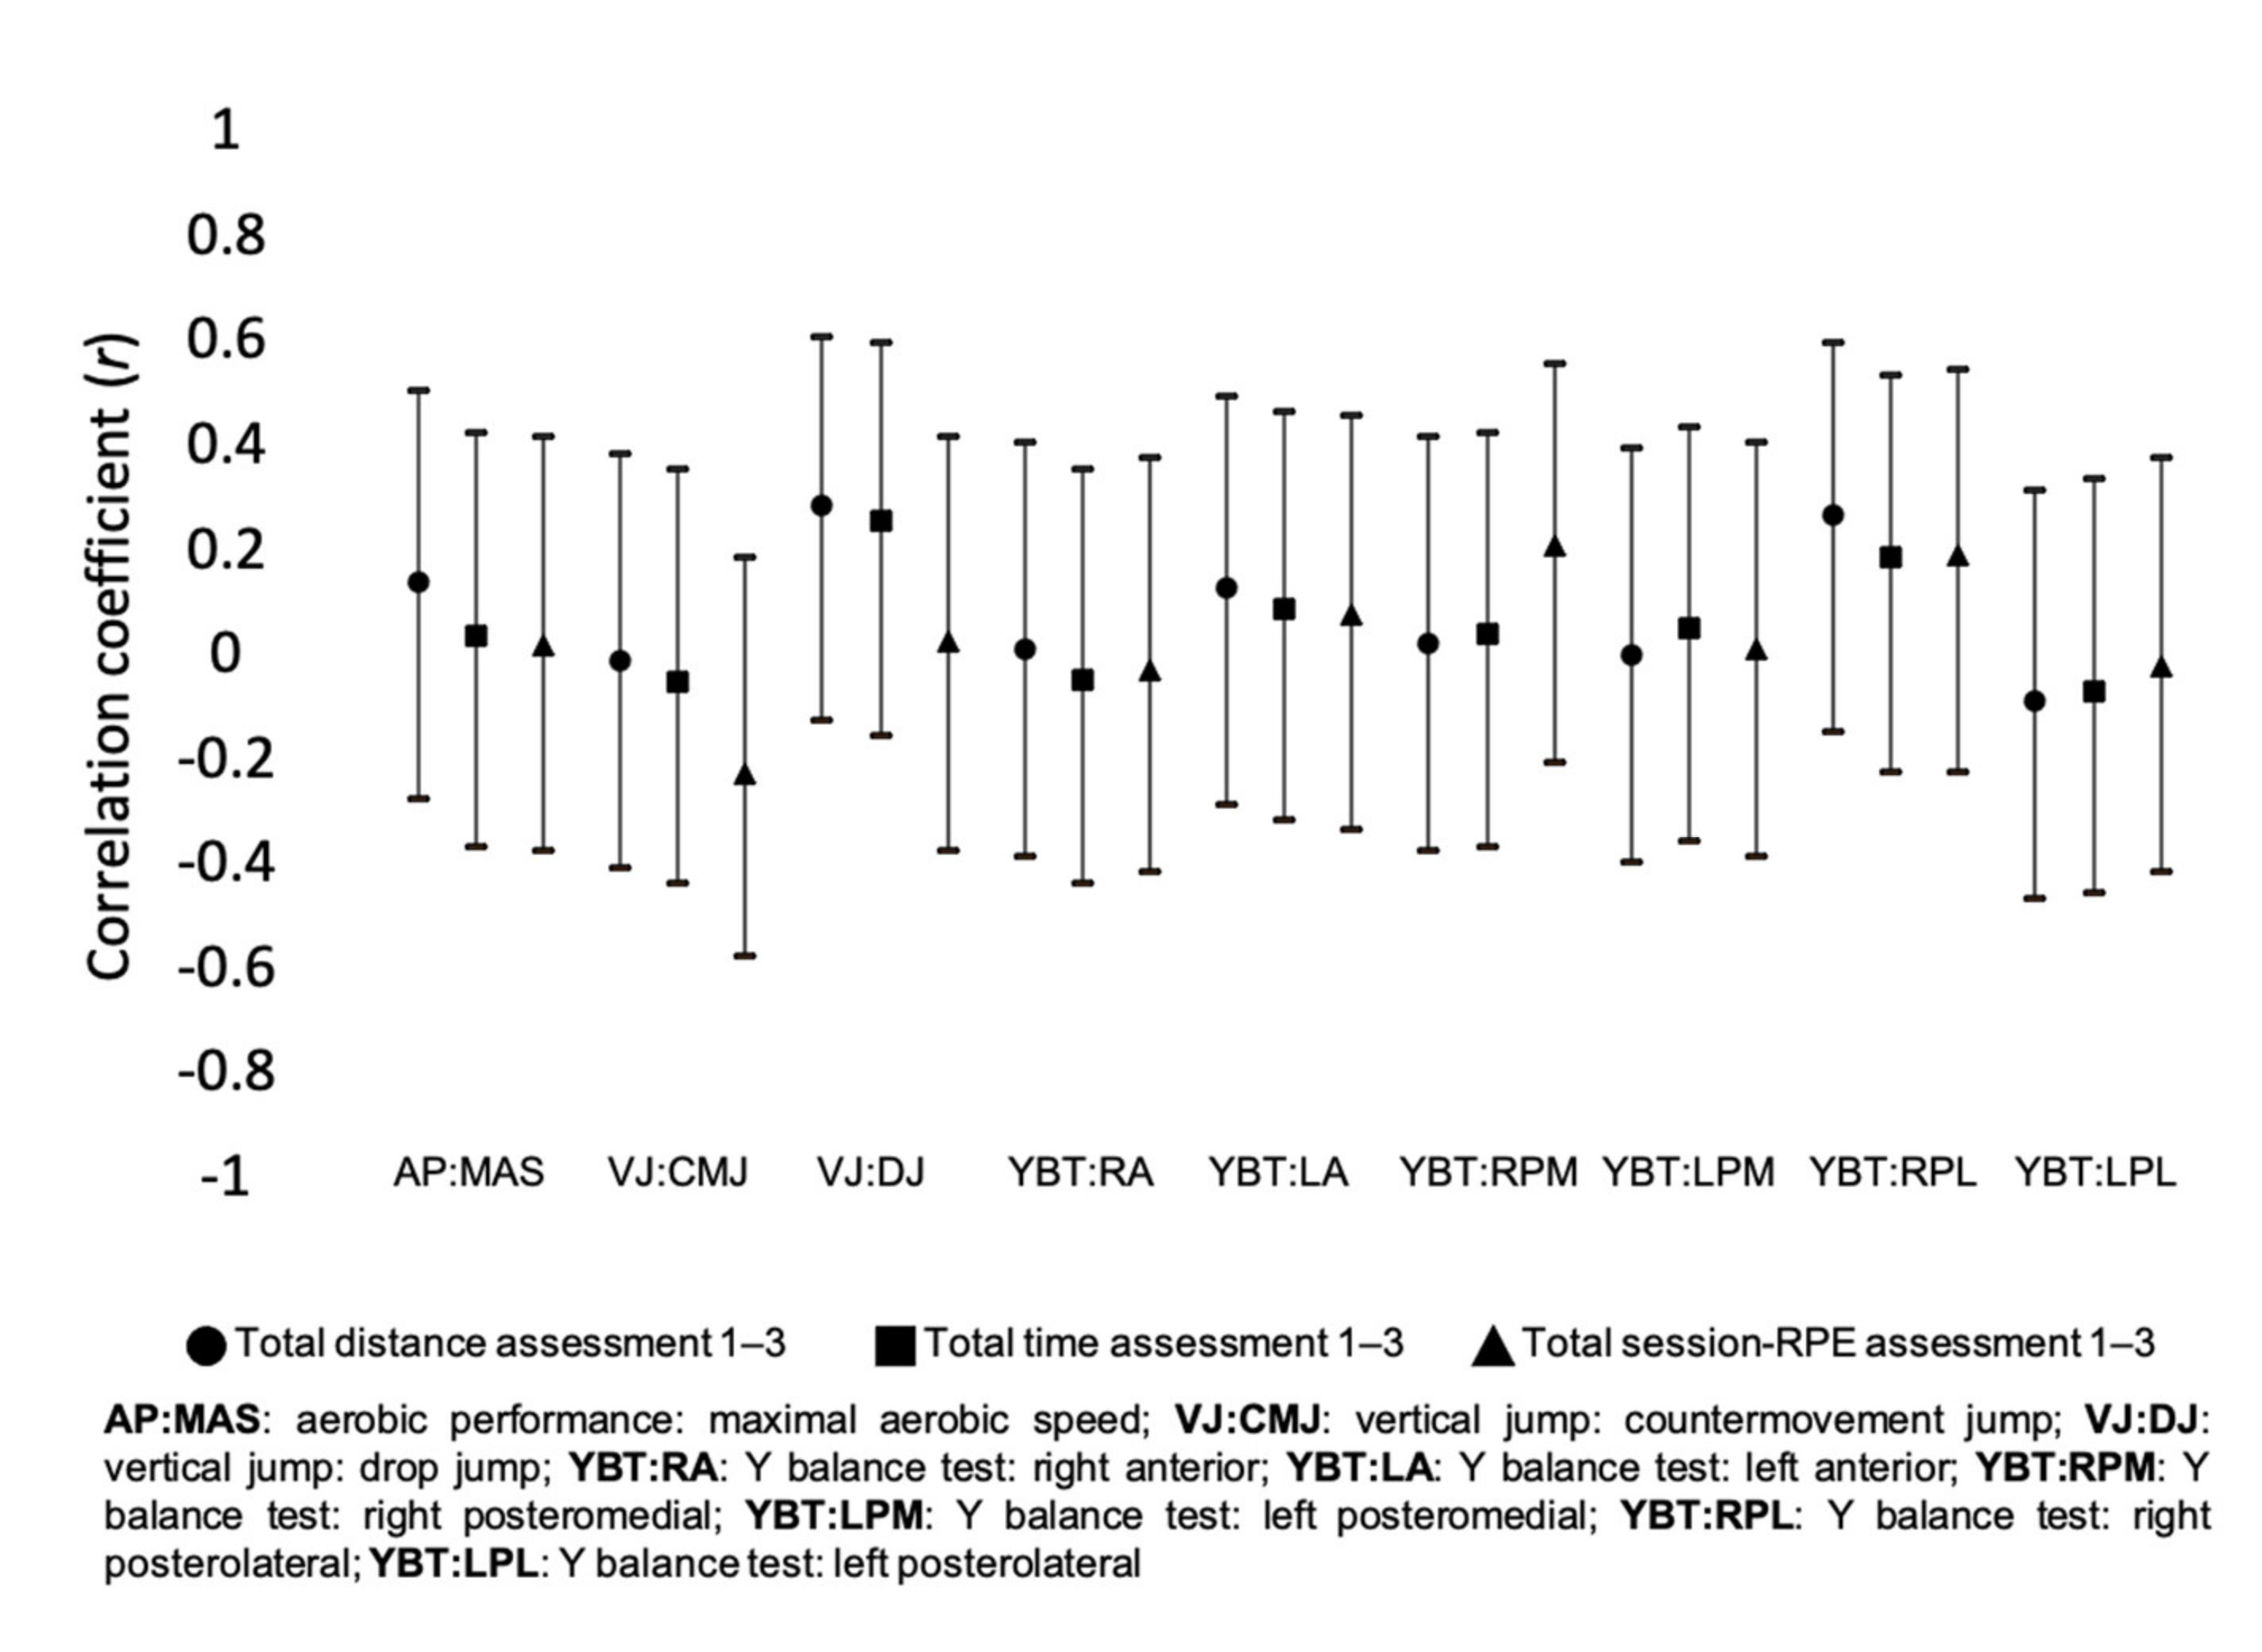
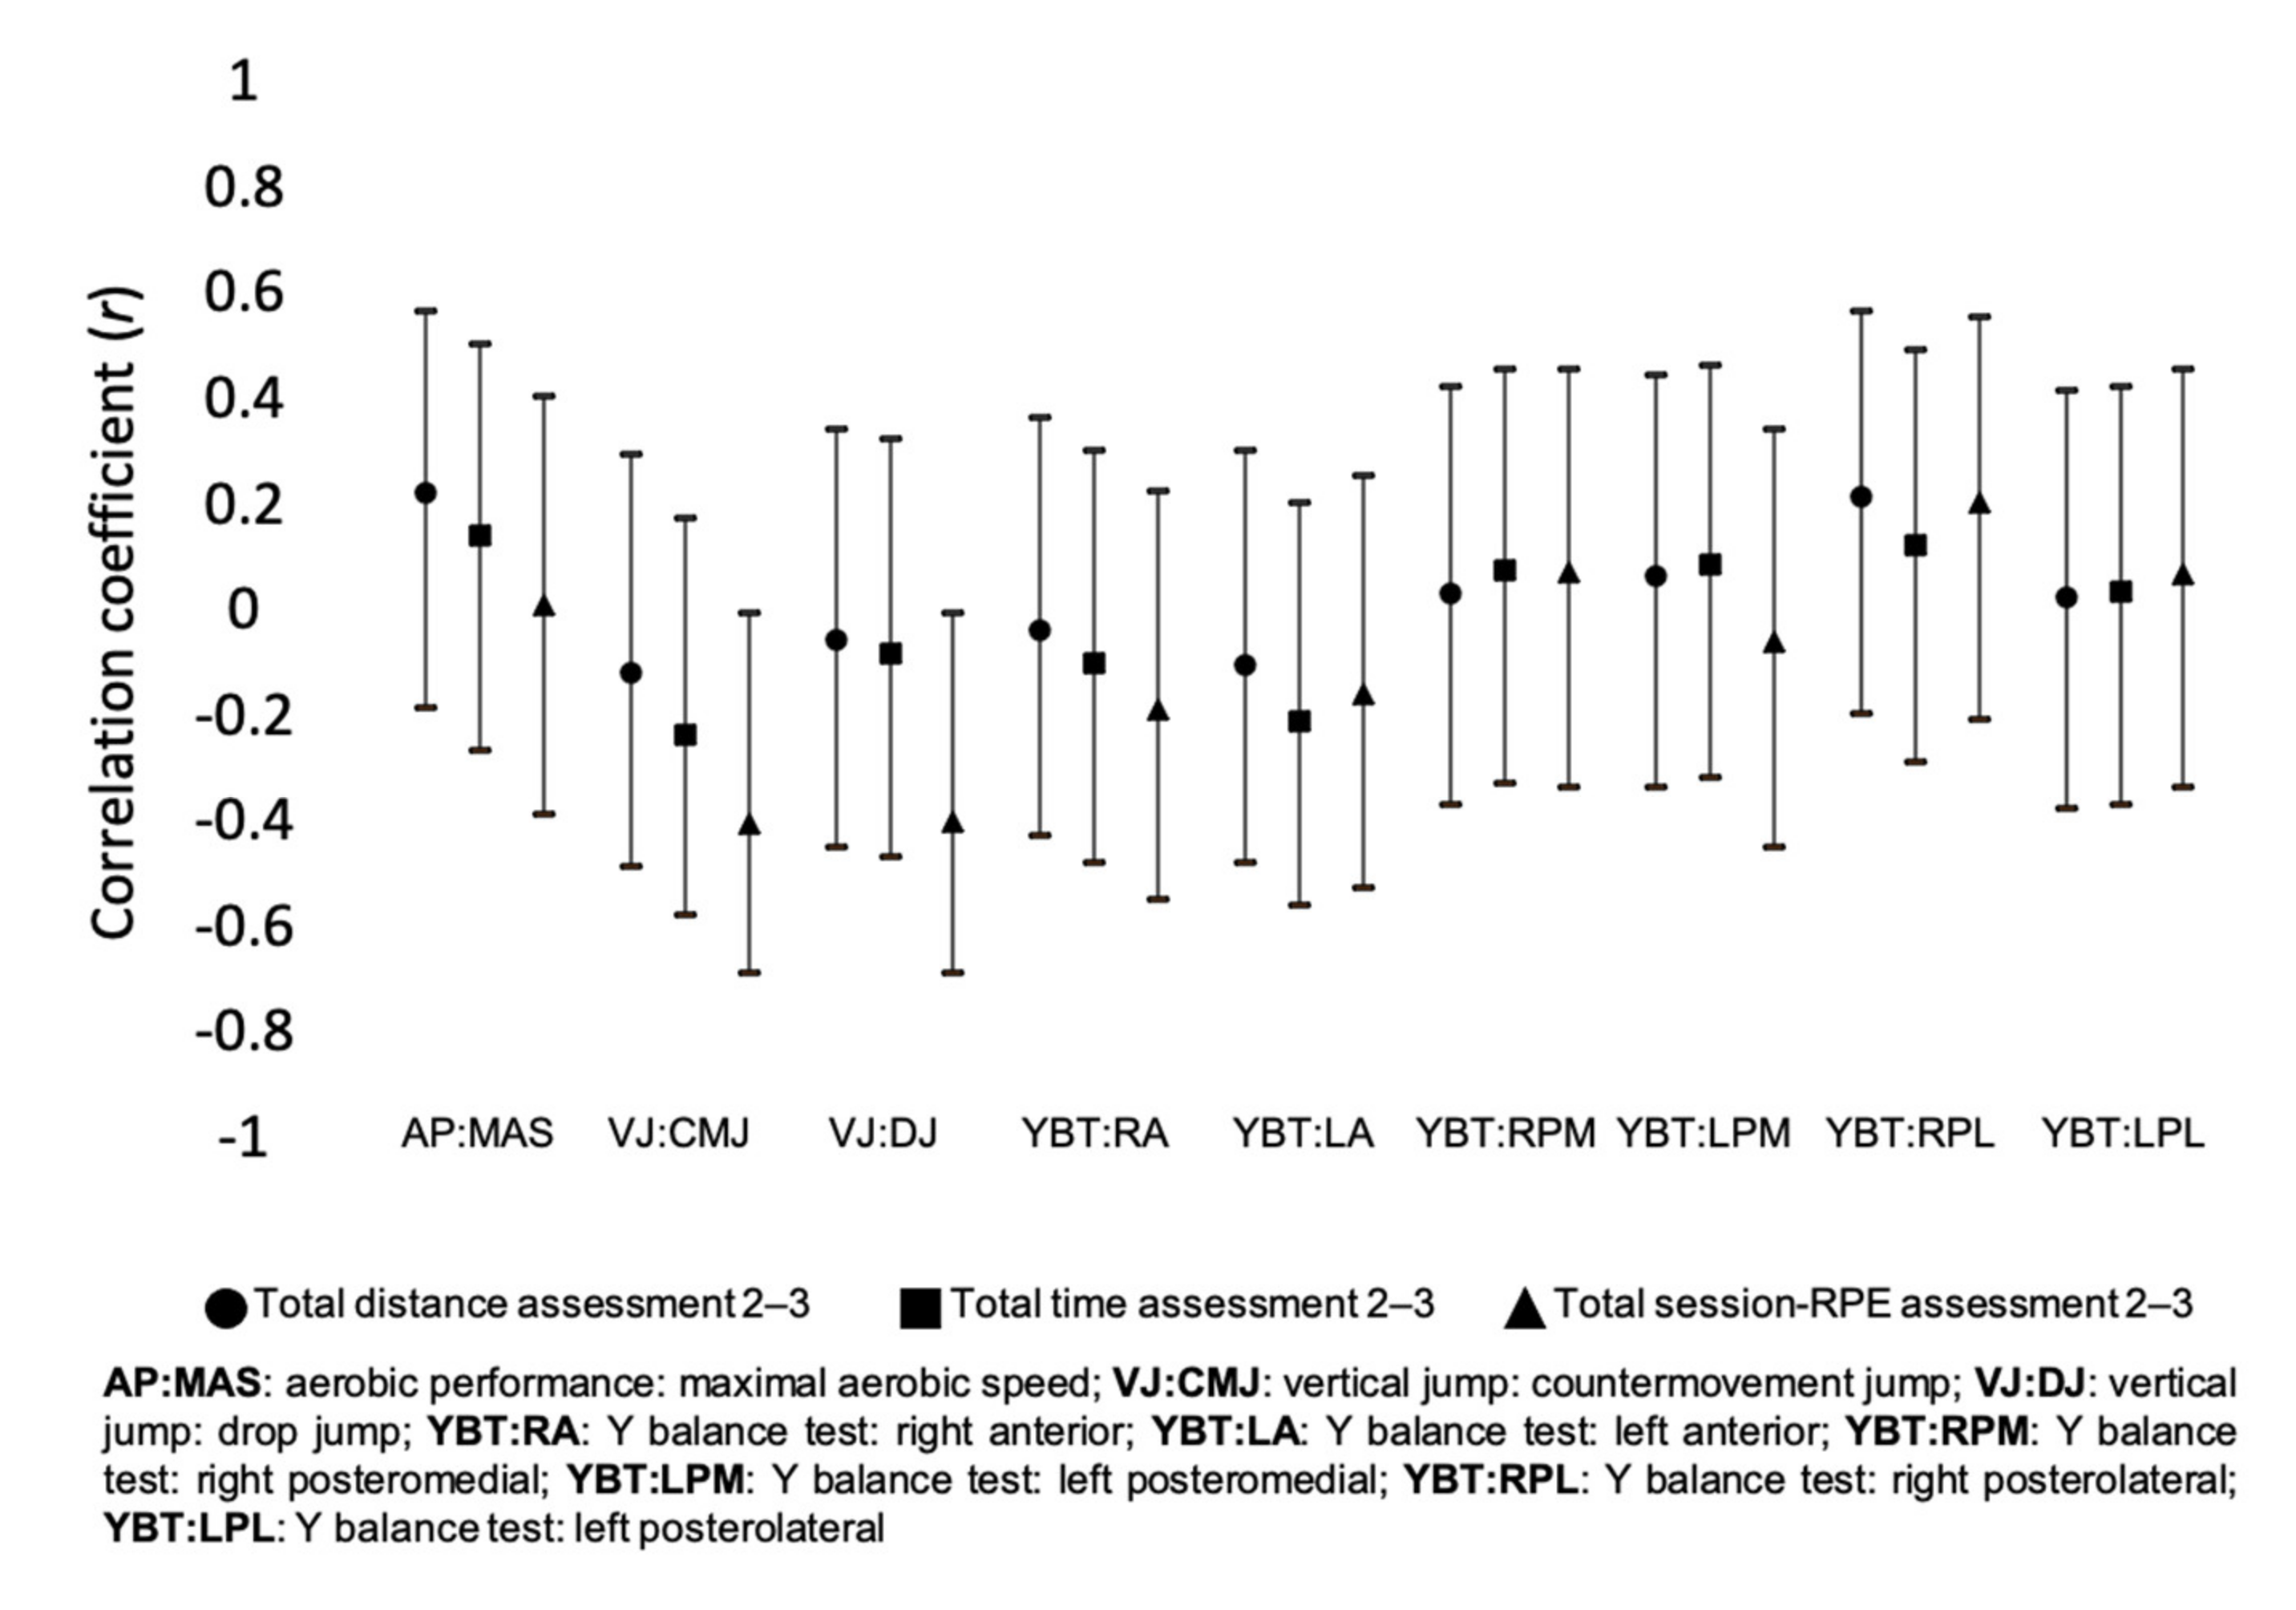
3. Results
4. Discussion
5. Conclusions
Author Contributions
Funding
Institutional Review Board Statement
Informed Consent Statement
Data Availability Statement
Acknowledgments
Conflicts of Interest
References
- Smith, D.J. A Framework for Understanding the Training Process Leading to Elite Performance. Sport. Med. 2003, 33, 1103–1126. [Google Scholar] [CrossRef] [PubMed]
- Busso, T. Variable dose-response relationship between exercise training and performance. Med. Sci. Sports Exerc. 2003, 35, 1188–1195. [Google Scholar] [CrossRef]
- Fitzpatrick, J.F.; Hicks, K.M.; Hayes, P.R. Dose–Response Relationship between Training Load and Changes in Aerobic Fitness in Professional Youth Soccer Players. Int. J. Sports Physiol. Perform. 2018, 13, 1365–1370. [Google Scholar] [CrossRef]
- Bourdon, P.C.; Cardinale, M.; Murray, A.; Gastin, P.; Kellmann, M.; Varley, M.C.; Gabbett, T.J.; Coutts, A.J.; Burgess, D.J.; Gregson, W.; et al. Monitoring Athlete Training Loads: Consensus Statement. Int. J. Sports Physiol. Perform. 2017, 12, S2-161–S2-170. [Google Scholar] [CrossRef]
- Maughan, R.J. Distance running in hot environments: A thermal challenge to the elite runner. Scand. J. Med. Sci. Sport. 2010, 20, 95–102. [Google Scholar] [CrossRef] [PubMed]
- Halson, S.L. Monitoring Training Load to Understand Fatigue in Athletes. Sport. Med. 2014, 44, 139–147. [Google Scholar] [CrossRef] [Green Version]
- Clemente, F.M.; Clark, C.; Castillo, D.; Sarmento, H.; Nikolaidis, P.T.; Rosemann, T.; Knechtle, B. Variations of training load, monotony, and strain and dose-response relationships with maximal aerobic speed, maximal oxygen uptake, and isokinetic strength in professional soccer players. PLoS ONE 2019, 14, e0225522. [Google Scholar] [CrossRef] [PubMed] [Green Version]
- Akubat, I.; Patel, E.; Barrett, S.; Abt, G. Methods of monitoring the training and match load and their relationship to changes in fitness in professional youth soccer players. J. Sports Sci. 2012, 30, 1473–1480. [Google Scholar] [CrossRef]
- Bartlett, J.D.; O’Connor, F.; Pitchford, N.; Torres-Ronda, L.; Robertson, S.J. Relationships between Internal and External Training Load in Team-Sport Athletes: Evidence for an Individualized Approach. Int. J. Sports Physiol. Perform. 2017, 12, 230–234. [Google Scholar] [CrossRef]
- Borg, G. Borg’s Perceived Exertion and Pain Scales; Human Kinetics: Champaign, IL, USA, 1998. [Google Scholar]
- Matos, S.; Clemente, F.M.; Brandão, A.; Pereira, J.; Rosemann, T.; Nikolaidis, P.T.; Knechtle, B. Training Load, Aerobic Capacity and Their Relationship With Wellness Status in Recreational Trail Runners. Front. Physiol. 2019, 10, 1–9. [Google Scholar] [CrossRef]
- Gomes, R.V.; Moreira, A.; Lodo, L.; Capitani, C.D.; Aoki, M.S.; Foster, C.; Jenkins, D. Ecological Validity of Session RPE Method for Quantifying Internal Training Load in Tennis. Int. J. Sports Sci. Coach. 2015, 10, 729–737. [Google Scholar] [CrossRef] [Green Version]
- Wallace, L.K.; Slattery, K.M.; Coutts, A.J. The ecological validity and application of the session-rpe method for quantifying training loads in swimming. J. Strength Cond. Res. 2009, 23, 33–38. [Google Scholar] [CrossRef] [Green Version]
- Clemente, F.M.; Silva, A.F.; Clark, C.C.T.; Conte, D.; Ribeiro, J.; Mendes, B.; Lima, R. Analyzing the seasonal changes and relationships in training load and wellness in elite volleyball players. Int. J. Sports Physiol. Perform. 2020, 15, 731–740. [Google Scholar] [CrossRef] [PubMed]
- Foster, C.; Florhaug, J.A.; Franklin, J.; Gottschall, L.; Hrovatin, L.A.; Parker, S.; Doleshal, P.; Dodge, C. A New Approach to Monitoring Exercise Training. J. Strength Cond. Res. 2001, 15, 109–115. [Google Scholar] [PubMed]
- Esteve-Lanao, J.; San Juan, A.F.; Earnest, C.P.; Foster, C.; Lucia, A. How do endurance runners actually train? Relationship with competition performance. Med. Sci. Sports Exerc. 2005, 37, 496–504. [Google Scholar] [CrossRef] [Green Version]
- Scheer, V.; Basset, P.; Giovanelli, N.; Vernillo, G.; Millet, G.P.; Costa, R.J.S. Defining Off-road Running: A Position Statement from the Ultra Sports Science Foundation. Int. J. Sports Med. 2020, 41, 275–284. [Google Scholar] [CrossRef] [PubMed]
- Matos, S.; Clemente, F.M.; Silva, R.; Pereira, J.; Cancela Carral, J.M. Performance and Training Load Profiles in Recreational Male Trail Runners: Analyzing Their Interactions during Competitions. Int. J. Environ. Res. Public Health 2020, 17, 8902. [Google Scholar] [CrossRef]
- Lepers, R.; Pousson, M.L.; Maffiuletti, N.A.; Martin, A.; Van Hoecke, J. The effects of a prolonged running exercise on strength characteristics. Int. J. Sports Med. 2000, 21, 275–280. [Google Scholar] [CrossRef]
- Beattie, K.; Kenny, I.C.; Lyons, M.; Carson, B.P. The effect of strength training on performance in endurance athletes. Sport. Med. 2014, 44, 845–865. [Google Scholar] [CrossRef] [Green Version]
- Boullosa, D.; Esteve-Lanao, J.; Casado, A.; Peyré-Tartaruga, L.A.; Gomes da Rosa, R.; Del Coso, J. Factors Affecting Training and Physical Performance in Recreational Endurance Runners. Sports 2020, 8, 35. [Google Scholar] [CrossRef] [Green Version]
- Chaabene, H.; Prieske, O.; Lesinski, M.; Sandau, I.; Granacher, U. Short-Term Seasonal Development of Anthropometry, Body Composition, Physical Fitness, and Sport-Specific Performance in Young Olympic Weightlifters. Sports 2019, 7, 242. [Google Scholar] [CrossRef] [Green Version]
- Vitale, J.A.; La Torre, A.; Banfi, G.; Bonato, M. Effects of an 8-week body-weight neuromuscular training on dynamic balance and vertical jump performances in elite junior skiing athletes: A randomized controlled trial. J. Strength Cond. Res. 2018, 32, 911–920. [Google Scholar] [CrossRef]
- Ramírez-Campillo, R.; Gallardo, F.; Henriquez-Olguín, C.; Meylan, C.M.P.; Martínez, C.; Álvarez, C.; Caniuqueo, A.; Cadore, E.L.; Izquierdo, M. Effect of Vertical, Horizontal, and Combined Plyometric Training on Explosive, Balance, and Endurance Performance of Young Soccer Players. J. Strength Cond. Res. 2015, 29, 1784–1795. [Google Scholar] [CrossRef] [PubMed] [Green Version]
- Markovic, G.; Dizdar, D.; Jukic, I.; Cardinale, M. Reliability and Factorial Validity of Squat and Countermovement Jump Tests. J. Strength Cond. Res. 2004, 18, 551–555. [Google Scholar] [PubMed]
- Sudhakar, S.; Veena Kirthika, S.; Padmanabhan, K.; Senthil Nathan, C.V.; Ramachandran, S.; Rajalaxmi, V.; Sowmiya, S.; Senthil Selvam, P. Which is efficient in improving postural control among the novice runners? Isolated ankle strengthening or functional balance training programme: A randomized controlled trial. Res. J. Pharm. Technol. 2018, 11, 1461–1466. [Google Scholar] [CrossRef]
- Paillard, T. Relationship Between Sport Expertise and Postural Skills. Front. Psychol. 2019, 10, 1428. [Google Scholar] [CrossRef] [PubMed]
- Eylen, M.A.; Daglioglu, O.; Gucenmez, E. The Effects of Different Strength Training on Static and Dynamic Balance Ability of Volleyball Players. J. Educ. Train. Stud. 2017, 5, 13. [Google Scholar] [CrossRef]
- Hrysomallis, C. Balance Ability and Athletic Performance. Sport. Med. 2011, 41, 221–232. [Google Scholar] [CrossRef] [PubMed] [Green Version]
- Riemann, B.L.; Guskiewicz, K.M.; Shields, E.W. Relationship between Clinical and Forceplate Measures of Postural Stability. J. Sport Rehabil. 1999, 8, 71–82. [Google Scholar] [CrossRef]
- Shaffer, S.W.; Teyhen, D.S.; Lorenson, C.L.; Warren, R.L.; Koreerat, C.M.; Straseske, C.A.; Childs, J.D. Y-Balance Test: A Reliability Study Involving Multiple Raters. Mil. Med. 2013, 178, 1264–1270. [Google Scholar] [CrossRef] [PubMed] [Green Version]
- Lazzer, S.; Salvadego, D.; Rejc, E.; Buglione, A.; Antonutto, G.; Di Prampero, P.E. The energetics of ultra-endurance running. Eur. J. Appl. Physiol. 2012, 112, 1709–1715. [Google Scholar] [CrossRef]
- Alvero-Cruz, J.R.; Parent Mathias, V.; Garcia Romero, J.; Carrillo de Albornoz-Gil, M.; Benítez-Porres, J.; Ordoñez, F.J.; Rosemann, T.; Nikolaidis, P.T.; Knechtle, B. Prediction of Performance in a Short Trail Running Race: The Role of Body Composition. Front. Physiol. 2019, 10, 1–7. [Google Scholar] [CrossRef] [PubMed]
- Balducci, P.; Clémençon, M.; Trama, R.; Blache, Y.; Hautier, C. Performance Factors in a Mountain Ultramarathon. Int. J. Sports Med. 2017, 38, 819–826. [Google Scholar] [CrossRef]
- Mujika, I. Quantification of Training and Competition Loads in Endurance Sports: Methods and Applications. Int. J. Sports Physiol. Perform. 2017, 12, S2-9–S2-17. [Google Scholar] [CrossRef]
- Gabbett, T.J. The training-injury prevention paradox: Should athletes be training smarter and harder? Br. J. Sports Med. 2016, 50, 273–280. [Google Scholar] [CrossRef] [PubMed] [Green Version]
- Matos, S.; Clemente, F.M.; Silva, R.; Cancela Carral, J.M. Variations of Workload Indices Prior to Injuries: A Study in Trail Runners. Int. J. Environ. Res. Public Health 2020, 17, 4037. [Google Scholar] [CrossRef]
- Plisky, P.J.; Gorman, P.P.; Butler, R.J.; Kiesel, K.B.; Underwood, F.B.; Elkins, B. The reliability of an instrumented device for measuring components of the star excursion balance test. N. Am. J. Sports Phys. Ther. 2009, 4, 92–99. [Google Scholar]
- Berthon, P.; Fellmann, N.; Bedu, M.; Beaune, B.; Dabonneville, M.; Coudert, J.; Chamoux, A. A 5-min running field test as a measurement of maximal aerobic velocity. Eur. J. Appl. Physiol. Occup. Physiol. 1997, 75, 233–238. [Google Scholar] [CrossRef] [PubMed]
- Caminal, P.; Sola, F.; Gomis, P.; Guasch, E.; Perera, A.; Soriano, N.; Mont, L. Validity of the Polar V800 monitor for measuring heart rate variability in mountain running route conditions. Eur. J. Appl. Physiol. 2018, 118, 669–677. [Google Scholar] [CrossRef] [PubMed] [Green Version]
- Impellizzeri, F.M.; Rampinini, E.; Coutts, A.J.; Sassi, A.; Marcora, S.M. Use of RPE-based training load in soccer. Med. Sci. Sports Exerc. 2004, 36, 1042–1047. [Google Scholar] [CrossRef]
- Hopkins, W.G.; Marshall, S.W.; Batterham, A.M.; Hanin, J. Progressive statistics for studies in sports medicine and exercise science. Med. Sci. Sports Exerc. 2009, 41, 3–12. [Google Scholar] [CrossRef] [PubMed] [Green Version]
- Balsalobre-Fernández, C.; Tejero, C.M.G.; del Campo-Vecino, J. Seasonal strength performance and its relationship with training load on elite runners. J. Sport. Sci. Med. 2014, 14, 9–15. [Google Scholar]
- Nicol, C.; Avela, J.; Komi, P.V. The stretch-shortening cycle: A model to study naturally occurring neuromuscular fatigue. Sport. Med. 2006, 36, 977–999. [Google Scholar] [CrossRef] [PubMed]
- Horita, T. Stretch shortening cycle fatigue: Interactions among joint stiness, reflex, and muscle mechanical performance in the drop jump. Eur. J. Appl. Physiol. Occup. Physiol. 1996, 73, 393–403. [Google Scholar] [CrossRef]
- Clemente, F.M.; Nikolaidis, P.T.; Rosemann, T.; Knechtle, B. Dose-response relationship between external load variables, body composition, and fitness variables in professional soccer players. Front. Physiol. 2019, 10, 1–9. [Google Scholar] [CrossRef] [PubMed]
- García-Pinillos, F.; Soto-Hermoso, V.M.; Latorre-Román, P.A. How does high-intensity intermittent training affect recreational endurance runners? Acute and chronic adaptations: A systematic review. J. Sport Heal. Sci. 2017, 6, 54–67. [Google Scholar] [CrossRef]
- Balsalobre-Fernández, C.; Santos-Concejero, J.; Grivas, G.V. Effects of Strength Training on Running Economy in Highly Trained Runners. J. Strength Cond. Res. 2016, 30, 2361–2368. [Google Scholar] [CrossRef] [Green Version]
- García-Pallarés, J.; García-Fernández, M.; Sánchez-Medina, L.; Izquierdo, M. Performance changes in world-class kayakers following two different training periodization models. Eur. J. Appl. Physiol. 2010, 110, 99–107. [Google Scholar] [CrossRef]
- Debenham, J.; Travers, M.; Gibson, W.; Campbell, A.; Allison, G. Eccentric Fatigue Modulates Stretch-shortening Cycle Effectiveness—A Possible Role in Lower Limb Overuse Injuries. Int. J. Sports Med. 2015, 37, 50–55. [Google Scholar] [CrossRef] [PubMed] [Green Version]
- Arcos, A.L.; Martínez-Santos, R.; Yanci, J.; Mendiguchia, J.; Méndez-Villanueva, A. Negative associations between perceived training load, volume and changes in physical fitness in professional soccer players. J. Sport. Sci. Med. 2015, 14, 394–401. [Google Scholar]
- Beato, M.; De Keijzer, K.L.; Carty, B.; Connor, M. Monitoring fatigue during intermittent exercise with accelerometer-derived metrics. Front. Physiol. 2019, 10, 780. [Google Scholar] [CrossRef] [PubMed] [Green Version]
- Leduc, C.; Lacome, M.; Buchheit, M. The use of standardised runs (and associated data analysis) to monitor neuromuscular status in team sports players: A call to action. Sport Perform. Sci. Rep. 2020, 1, 1–5. [Google Scholar]
- Taylor, R.J.; Sanders, D.; Myers, T.; Abt, G.; Taylor, C.A.; Akubat, I. The Dose-Response Relationship Between Training Load and Aerobic Fitness in Academy Rugby Union Players. Int. J. Sports Physiol. Perform. 2017, 13, 163–169. [Google Scholar] [CrossRef] [Green Version]
- Smith, C.A.; Chimera, N.J.; Warren, M. Association of Y balance test reach asymmetry and injury in Division I Athletes. Med. Sci. Sports Exerc. 2015, 47, 136–141. [Google Scholar] [CrossRef]


| A1 M ± SD | A2 M ± SD | A3 M ± SD | A2−A1 (%)|p|ES | A3−A1 (%)|p|ES | A3−A2 (%)|p|ES | |
|---|---|---|---|---|---|---|
| AP: MAS (m/s) | 4.8 ± 0.4 | 4.8 ± 0.4 | 4.9 ± 0.4 | 0.3|>0.999|0.000 | 1.3|0.531|0.250 | 1.2|0.554|0.250 |
| VJ: CMJ (cm) | 25.3 ± 5.5 | 25.9 ± 5.2 | 25.6 ± 4.9 | 3.5|0.671|0.112 | 2.2|>0.999|0.058 | −1.0|>0.999|−0.059 |
| VJ: DJ (cm) | 21.0 ± 3.9 | 20.5 ± 4.1 | 21.3 ± 3.7 | −0.2|>0.999|−0.125 | 4.5|>0.999|0.079 | 5.6|0.375|0.205 |
| YBT: RA (cm) | 59.6 ± 5.2 | 59.2 ± 4.8 | 59.6 ± 4.1 | −0.4|>0.999|−0.080 | 0.5|>0.999|0.000 | 1.0|>0.999|0.090 |
| YBT: LA (cm) | 59.9 ± 6.0 | 59.6 ± 6.4 | 59.0 ± 4.5 | −0.3|>0.999|−0.048 | −1.0|0.990|−0.170 | −0.5|>0.999|−0.109 |
| YBT: RPM (cm) | 102.4 ± 6.7 | 104.1 ± 4.9 | 105.3 ± 6.5 | 1.8|0.257|0.290 | 3.0|0.091|0.439 | 1.2|0.513|0.209 |
| YBT: LPM (cm) | 100.5 ± 8.6 | 102.9 ± 6.8 | 104.6 ± 7.3 | 2.8|0.107|0.310 | 4.4|<0.001|0.514 | 1.7|0.053|0.241 |
| YBT: RPL (cm) | 98.6 ± 7.8 | 100.7 ± 5.0 | 103.0 ± 6.5 | 2.5|0.237|0.321 | 4.8|0.005|0.613 | 2.3|0.058|0.397 |
| YBT: LPL (cm) | 98.9 ± 9.8 | 100.3 ± 7.6 | 104.9 ± 8.9 | 1.9|0.911|0.160 | 6.4|<0.001|0.641 | 4.7|0.002|0.556 |
| A1–A2 M ± SD | A2–A3 M ± SD | A1–A3 M ± SD | A2–A3 − A1–A2 (%)|p|ES | |
|---|---|---|---|---|
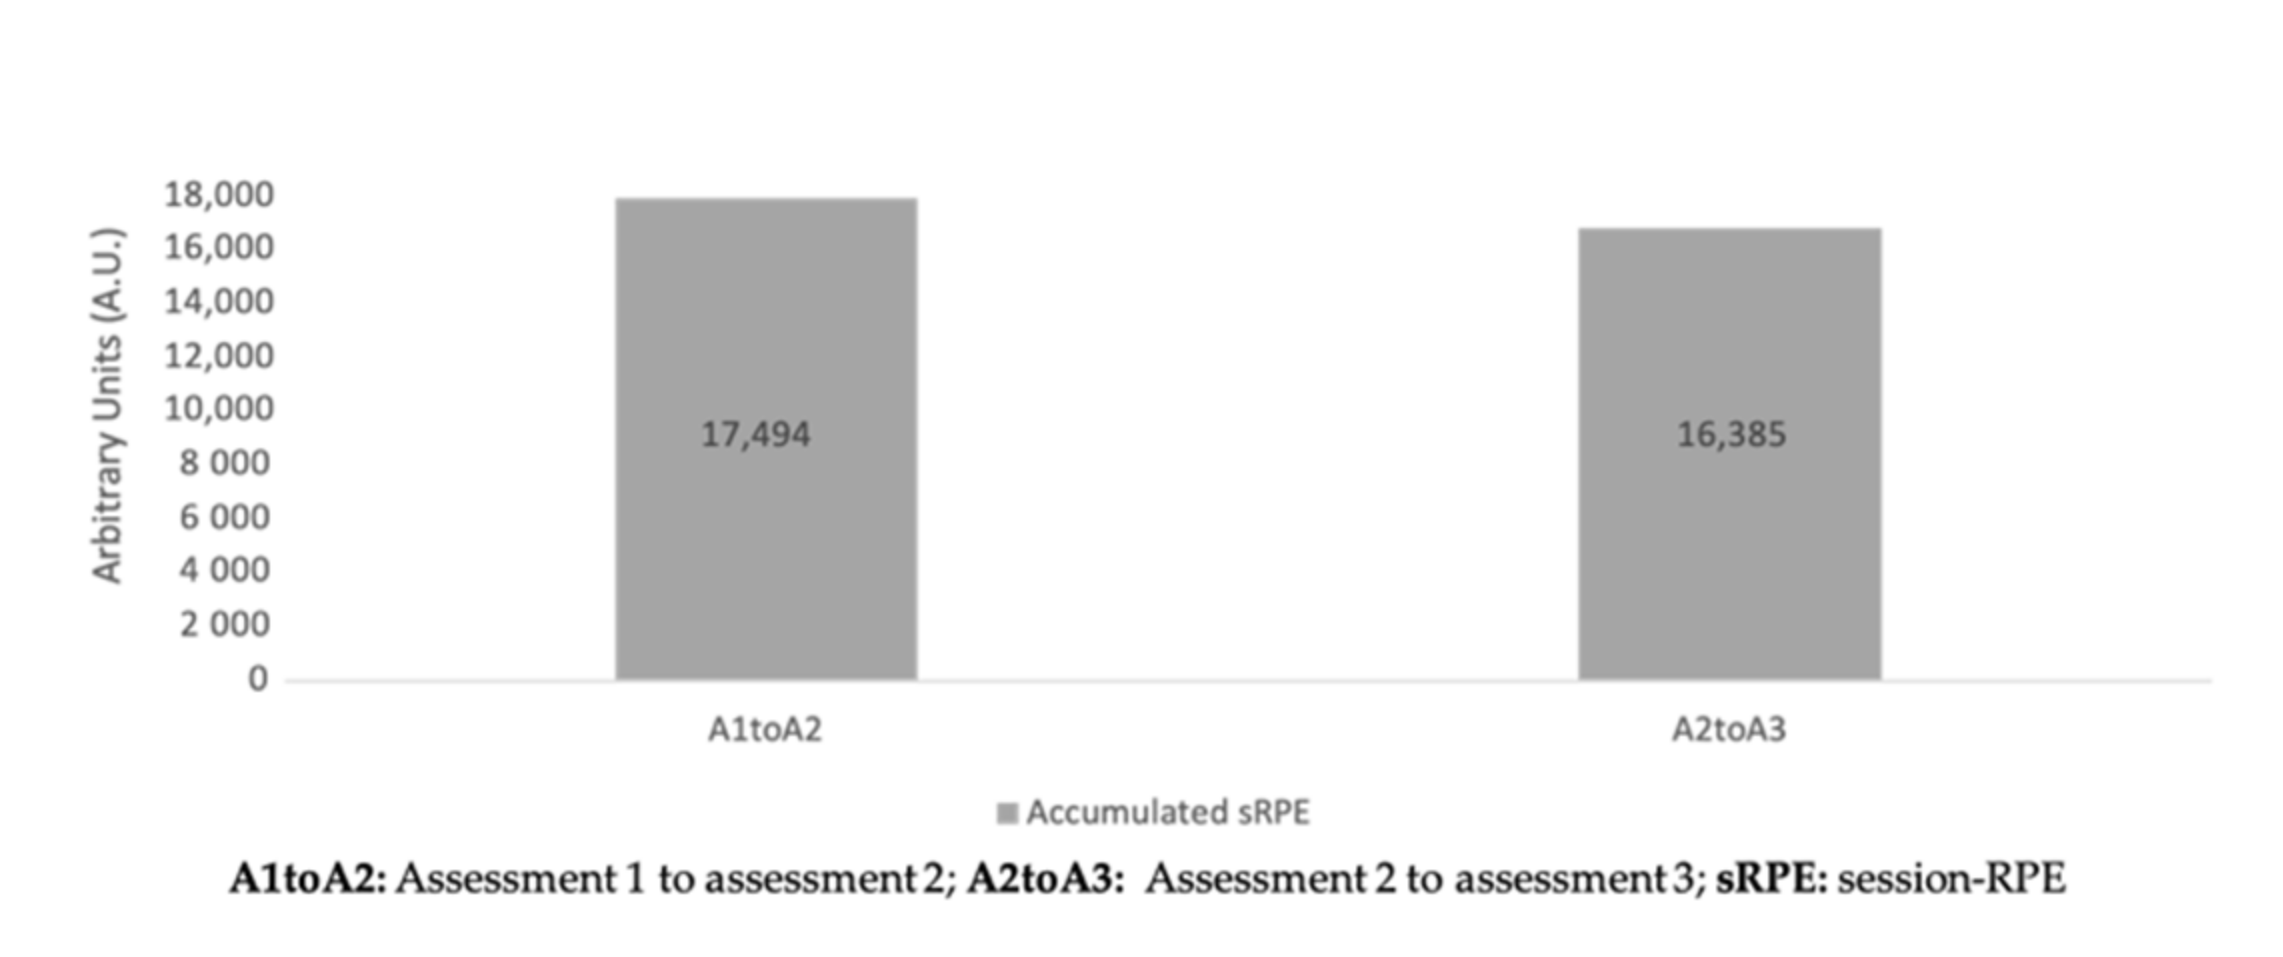
| Accumulated sRPE (A.U.) | 17,494.3 ± 14,947.8 | 16,385.4 ± 7856.3 | 33,879.7 ± 21,007.5 | −15.4|0.686|−0.093 |
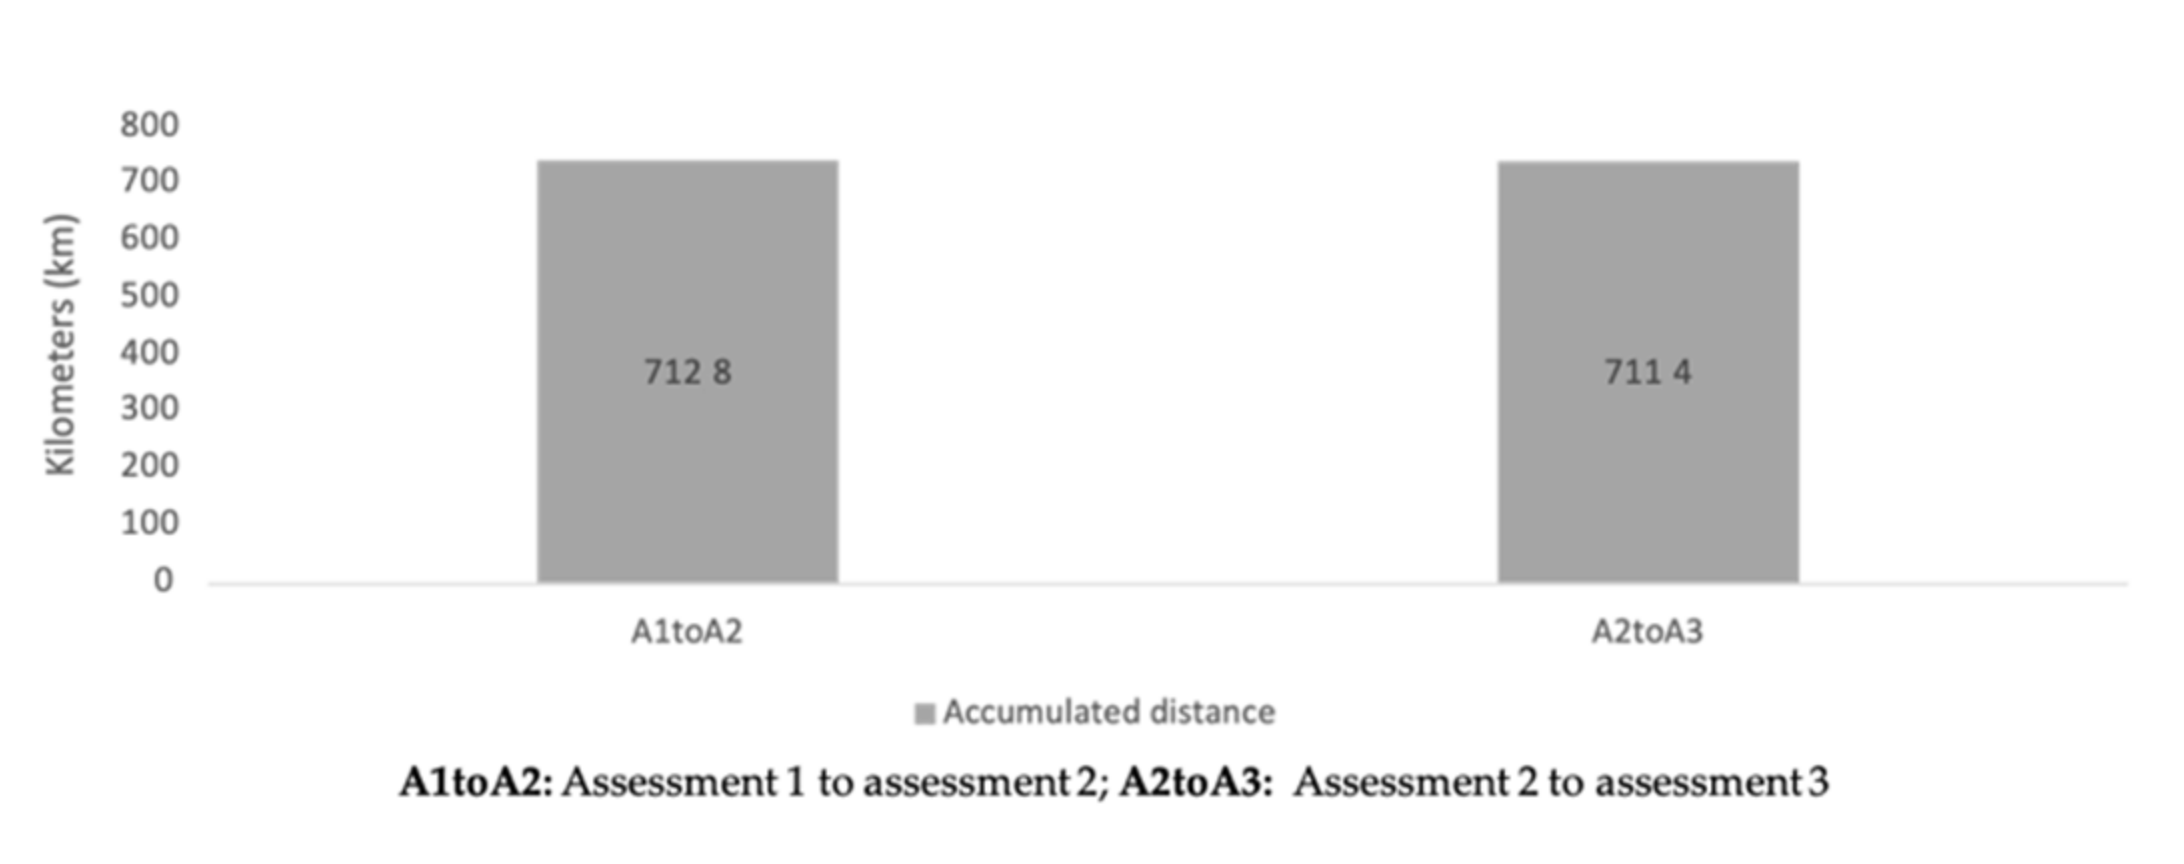
| Accumulated distance (km) | 712.8 ± 394.9 | 711.4 ± 281.8 | 1424.2 ± 625.7 | −15.7|>0.999|−0.004 |
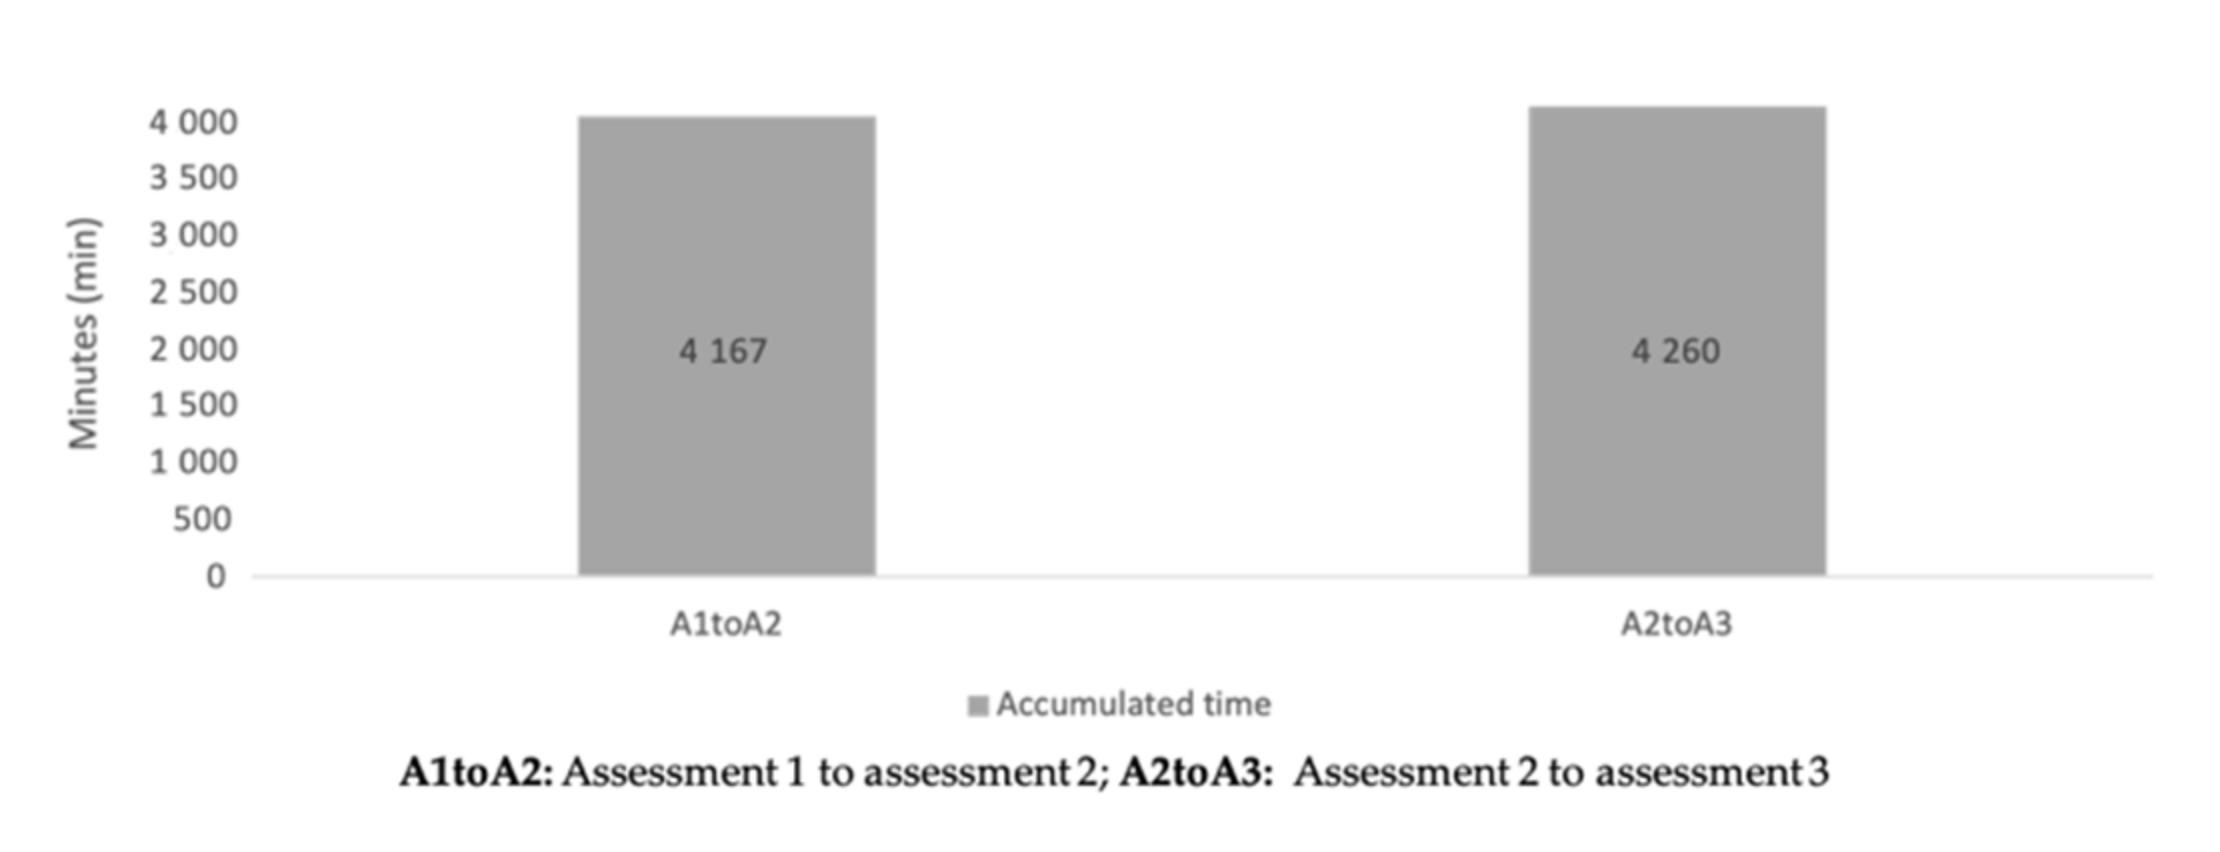
| Accumulated time (min) | 4166.9 ± 2233.6 | 4260.0 ± 1602.9 | 8426.9 ± 3487.1 | 21|>0.999|0.048 |
Publisher’s Note: MDPI stays neutral with regard to jurisdictional claims in published maps and institutional affiliations. |
© 2021 by the authors. Licensee MDPI, Basel, Switzerland. This article is an open access article distributed under the terms and conditions of the Creative Commons Attribution (CC BY) license (http://creativecommons.org/licenses/by/4.0/).
Share and Cite
Matos, S.; Clemente, F.M.; Silva, R.; Pereira, J.; Bezerra, P.; Carral, J.M.C. Variations of Trail Runner’s Fitness Measures across a Season and Relationships with Workload. Healthcare 2021, 9, 318. https://0-doi-org.brum.beds.ac.uk/10.3390/healthcare9030318
Matos S, Clemente FM, Silva R, Pereira J, Bezerra P, Carral JMC. Variations of Trail Runner’s Fitness Measures across a Season and Relationships with Workload. Healthcare. 2021; 9(3):318. https://0-doi-org.brum.beds.ac.uk/10.3390/healthcare9030318
Chicago/Turabian StyleMatos, Sérgio, Filipe Manuel Clemente, Rui Silva, Joel Pereira, Pedro Bezerra, and José María Cancela Carral. 2021. "Variations of Trail Runner’s Fitness Measures across a Season and Relationships with Workload" Healthcare 9, no. 3: 318. https://0-doi-org.brum.beds.ac.uk/10.3390/healthcare9030318